the Creative Commons Attribution 4.0 License.
the Creative Commons Attribution 4.0 License.
 | 27 Jun 2024
How does a warm and low-snow winter impact the snow cover dynamics in a humid and discontinuous boreal forest? Insights from observations and modeling in eastern Canada
Benjamin Bouchard
Daniel F. Nadeau
Florent Domine
François Anctil
Tobias Jonas
Étienne Tremblay
In the boreal forest of eastern Canada, winter temperatures are projected to increase substantially by 2100. This region is also expected to receive less solid precipitation, resulting in a reduction in snow cover thickness and duration. These changes are likely to affect hydrological processes such as snowmelt, the soil thermal regime, and snow metamorphism. The exact impact of future changes is difficult to pinpoint in the boreal forest, due to its complex structure and the fact that snow dynamics under the canopy are very different from those in the gaps. In this study, we assess the influence of a low-snow and warm winter on snowmelt dynamics, soil freezing, snowpack properties, and spring streamflow in a humid and discontinuous boreal catchment of eastern Canada (47.29° N, 71.17° W; ≈ 850 m a.m.s.l.) based on observations and SNOWPACK simulations. We monitored the soil and snow thermal regimes and sampled physical properties of the snowpack under the canopy and in two forest gaps during an exceptionally low-snow and warm winter, projected to occur more frequently in the future, and during a winter with conditions close to normal. We observe that snowmelt was earlier but slower, top soil layers were cooler, and gradient metamorphism was enhanced during the low-snow and warm winter. However, we observe that snowmelt duration increased in forest gaps, that soil freezing was enhanced only under the canopy, and that snow permeability increased more strongly under the canopy than in either gap. Our results highlight that snow accumulation and melt dynamics are controlled by meteorological conditions, soil freezing is controlled by forest structure, and snow properties are controlled by both weather forcing and canopy discontinuity. Overall, observations and simulations suggest that the exceptionally low spring streamflow in the winter of 2020–2120 was mainly driven by low snow accumulation, slow snowmelt, and low precipitation in April and May rather than enhanced percolation through the snowpack and soil freezing.
- Article
(9509 KB) - Full-text XML
-
Supplement
(5554 KB) - BibTeX
- EndNote


The boreal forest is one of the most extensive biomes on Earth. It is projected to warm by up to 5 °C by 2100, with the largest increases occurring in winter (Scheffer et al., 2012; Zheng et al., 2023; Price et al., 2013; IPCC, 2023). Warmer winters will result in less solid precipitation and in a thinner, shorter-lived snow cover (Laternser and Schneebeli, 2003; Hamlet et al., 2005). Spring melt will occur earlier in the season but at a slower rate because less radiative energy is available at that time (Loìpez-Moreno et al., 2013; Musselman et al., 2017). Together, these changes are expected to reduce peak spring streamflow and runoff volumes (Furey et al., 2012; Berghuijs et al., 2014; Luce and Holden, 2009; Barnhart et al., 2016). Projections for the boreal forest of eastern Canada, characterized by humid and cold conditions in winter (D'Orangeville et al., 2016; Isabelle et al., 2020), point towards an increase in winter streamflow and an earlier spring freshet with more snow accumulation in the north and less in the south (Guay et al., 2015). The interannual variability of precipitation and temperature is also projected to increase, making warm and dry winters more likely (Ouranos and MELCCFP, 2022).
It has been shown that the ground thermal regime is strongly influenced by the amount of snow accumulation (Zhang, 2005; Slater et al., 2017). In forests, the spatial pattern of soil temperatures is difficult to determine because snow depth is highly variable (Mellander et al., 2005). Observations from a subalpine forest plot in Switzerland show that frost penetrates the ground deeper under tree crowns due to less snow accumulation than in forest gaps which reduces the infiltration and increases surface runoff (Stadler et al., 1996). Infiltration is also limited during low-snow winters due to a thinner snowpack that favours soil freezing (Hardy et al., 2001; Shanley and Chalmers, 1999). It is clear that both canopy structure and snow conditions influence the ground thermal regime, soil freezing, and infiltration. However, it is not well understood which of these two factors predominates over the other because they have not been investigated simultaneously in a single study.
Forest structure affects not only the dynamics of soil freezing, but also the physical properties of the snowpack. As canopy interception limits snow accumulation under trees (Pomeroy et al., 1998; Mazzotti et al., 2019; Sun et al., 2018), stronger vertical temperature gradients ( favour kinetic snow grain growth under the canopy more than in gaps (Albert and Hardy, 1993; Molotch et al., 2016; Bouchard et al., 2022). Bouchard et al. (2022) showed that the phenomenon results in lower specific surface area (SSA) and greater snowpack permeability under the canopy. With warmer winters, one may expect snow surface temperature to increase but snow thickness to decrease. Domine et al. (2007) have suggested a decrease in permeability with climate warming due to a warmer snow surface, lower , and slower grain growth. The authors also noted that an increase in the frequency of melting events would result in more melt–freeze crusts and low-permeability ice layers (Albert and Perron, 2000). In the boreal forest, where snow surface temperature and snow accumulation are highly variable in space (Malle et al., 2019; Parajuli et al., 2020; Mazzotti et al., 2023b) and where the canopy structure influences crust formation in the snowpack (Brundl et al., 1999; Teich et al., 2019; Bouchard et al., 2022), the impacts of warmer winters on snow properties may be hard to predict. Therefore, dedicated studies on the influence of warmer winters on snowpack physical properties in discontinuous boreal forests are needed.
The main research gap that motivates our work is that winter weather conditions and canopy structure have not been studied together to see how they influence snowmelt dynamics, the ground thermal regime, and the physical properties of the snowpack. Thus, the objective of this study is to quantify the effect of a low-snow and warm winter on the aforementioned processes in a humid and discontinuous boreal forest. To assess this, we compared snow melt, snow physical properties, soil freezing, and spring runoff at a small catchment in the southern part of the humid boreal forest of eastern Canada for two consecutive winters. One winter was exceptionally warm and dry, while the other was slightly colder, with precipitation amounts similar to the standard climatology of the study region. These contrasted conditions represent an ideal comparison to investigate some expected effects of climate change. Extensive snow monitoring and pit measurements, supported by multilayer snowpack simulations under the canopy, were conducted to achieve the research objective.
Section 2 presents the study site, the instrumentation, the observed and estimated physical variables, and the modeling setup. In Sect. 3, we present the climatology of each winter and the differences in melt rate, snowpack, and ground thermal regime, as well as the evolution of snow cover physical properties within medium-size and small forest gaps and under the canopy. The simulated water content profile and runoff from the snowpack and the measured spring streamflow of the catchment are also presented for both winters in Sect. 3. Finally, we compare our results with existing literature; present the limitations of the study; and discuss the potential climatic, hydrological, and ecological implications of warmer winters in a discontinuous humid boreal forest in Sect. 4.
2.1 Study site
The study took place in Montmorency Forest (MF) during the winters of 2020–2021 (denoted W20–21) and 2021–2022 (denoted W21–22). Measurements began on 15 October and ended on 15 June of the following year. MF is located in the province of Quebec, in eastern Canada, at the southern edge of the boreal forest (47.29° N, 71.17° W; Fig. 1a).
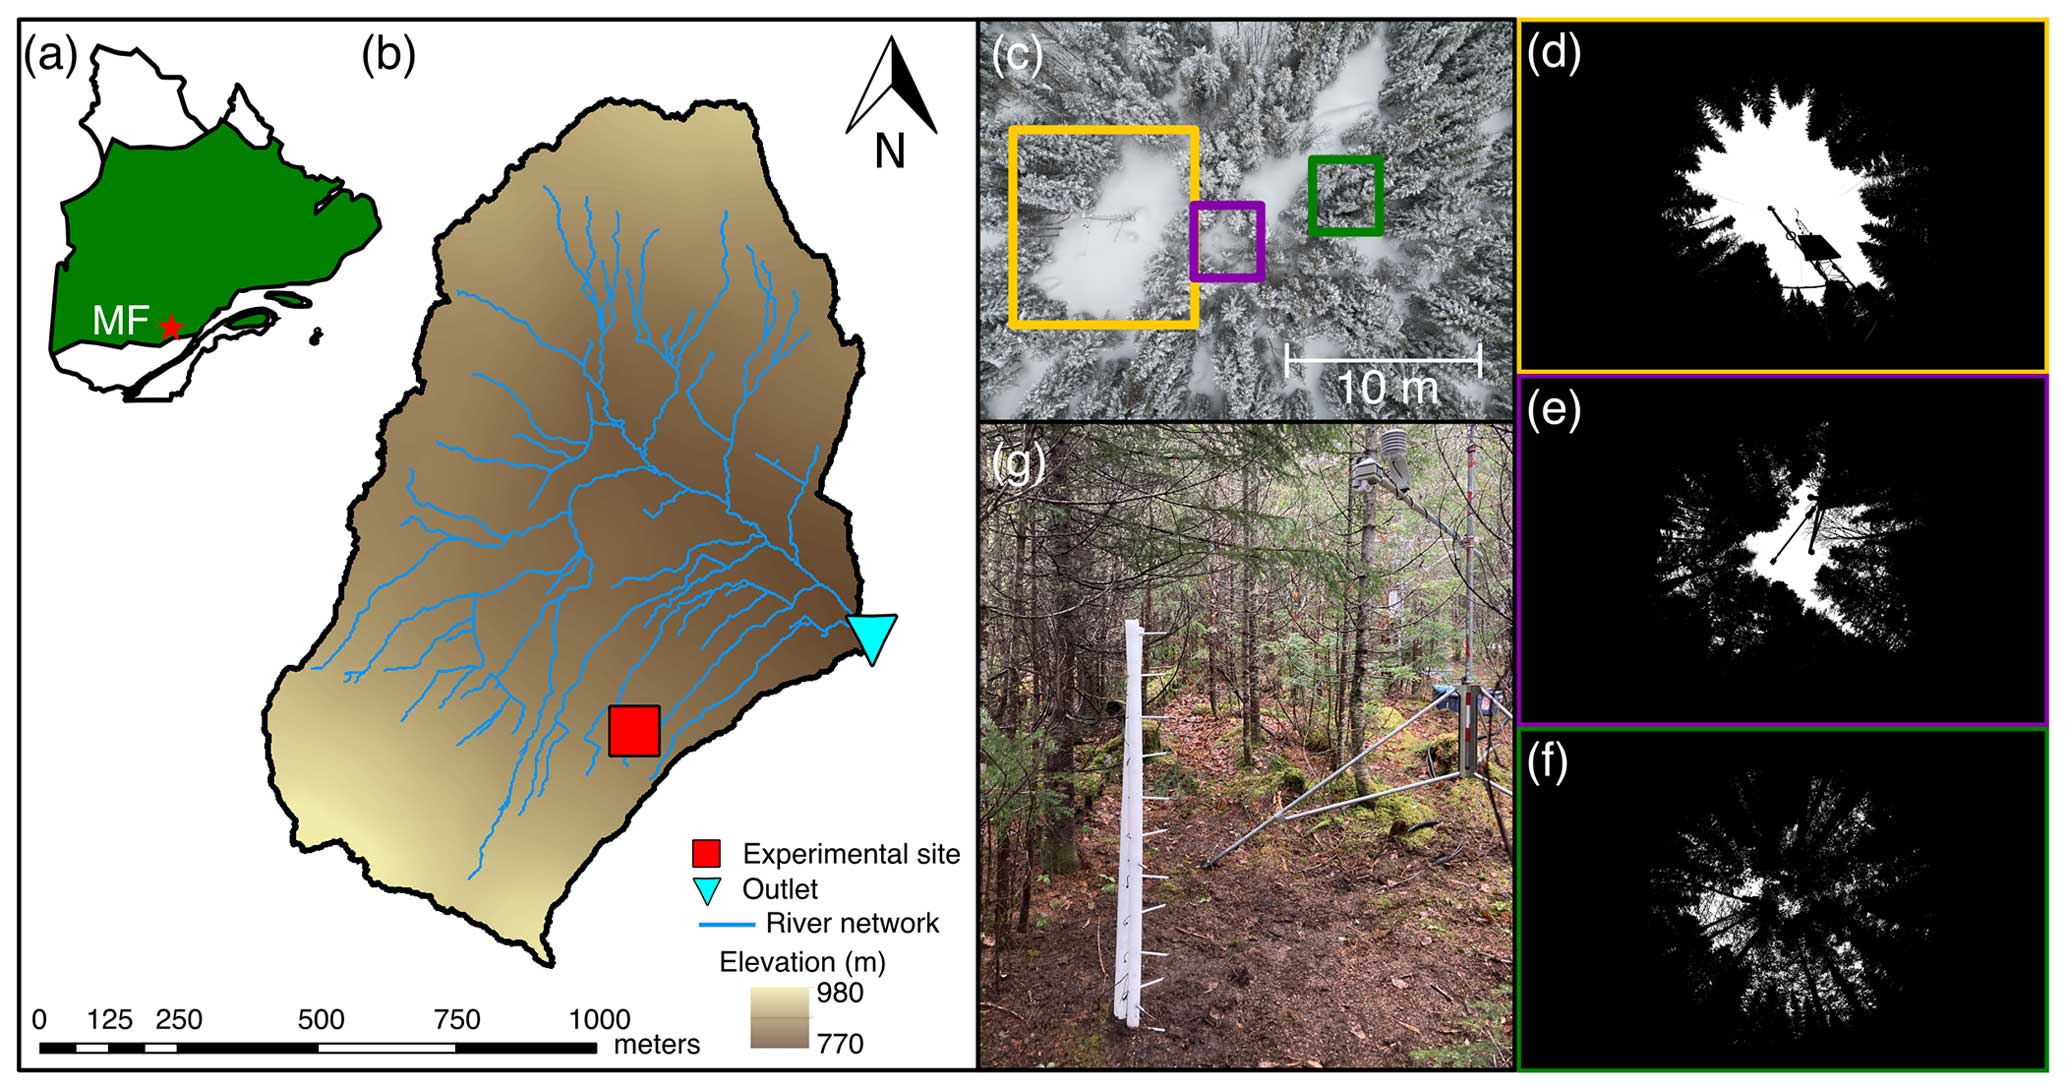
Figure 1Map of the province of Quebec, Canada, with the location of Montmorency Forest (MF) indicated by a red star and the boreal zone in green (a). Elevation map of the study catchment (BEREV-7A) with the location of the experimental site and the outlet of the catchment (b). Aerial view of the experimental site with the medium gap (yellow), the small gap (purple), and the canopy (green) stations (c) and black and white hemispherical photos of each station location (d, e, f). Photo of the monitoring station under the canopy (g).
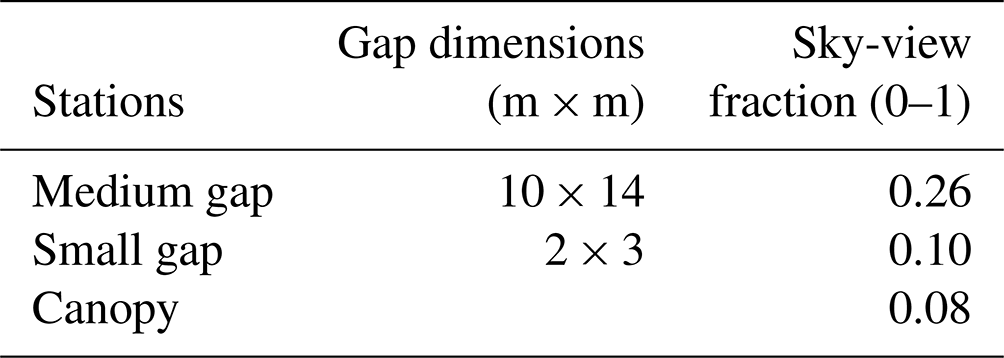
Three monitoring stations were installed in a 1.1 km2 forested subcatchment (7A) of the Bassin expérimental du Ruisseau des Eaux-Volées (BEREV) located at MF (Fig. 1b). The stations were installed in a medium gap, a small gap, and under the canopy (Fig. 1c). Table 1 presents the gap dimensions and the sky-view fraction (SVF) at each site. The SVF was evaluated using an adaptive thresholding algorithm (Jonas et al., 2020) on hemispherical photographs taken with a Sigma 8 mm f3.5 EX DG circular fisheye lens in the fall of 2022 (Fig. 1d, e, f). Stations were located on a 12°, northeast-facing slope at 846 m above mean sea level (a.m.s.l.), within a 10 m tall stand of balsam fir (Abies balsamea) mixed with white birch (Betula papyrifera) and white spruce (Picea glauca) trees. The catchment is a regeneration from a major logging operation that took place in 1993 (Guillemette et al., 2005). The soil is a sandy loam topped by ≈ 7 cm of litter. The stations were located within 30 m of a 20 m flux tower measuring shortwave (0.3–2.8 µm) and longwave (4.5–42 µm) upwelling and downwelling radiation (CNR4; Kipp & Zonen). Given the small size of the catchment and the location of the stations close to the average elevation of the catchment, we assume that the snow measured at the experimental site is representative of the entire catchment. A V-notch streamflow gauge and a bubble flowmeter, maintained by the provincial government and in operation since 1967, are located at the outlet of the catchment (DEH station 051004, https://www.cehq.gouv.qc.ca/hydrometrie/historique_donnees/, last access: 1 May 2023). Based on lidar imagery, we estimate that 75 % of the catchment is canopy-covered, with the remainder being gaps of small and medium size. Four kilometres northeast of BEREV-7A, there is a 0.01 km2 open area at 664 m a.m.s.l., the NEIGE site (Pierre et al., 2019), which hosts a federal weather station (ECCC station 7042395). We used data from the federal station to position the winters of 2020–2021 and 2021–2022 in relation to the MF climatology. The NEIGE site also hosts a CS725 instrument (Campbell Scientific) that monitors the snow water equivalent (SWE) at a 6 h time step, using differential gamma-ray absorption (Choquette et al., 2013) and an ultrasonic snow height sensor (Judd Communications) working on an hourly time step.
2.2 Measurements of physical variables
In this study, the monitoring stations tracked the thermal regime of the snowpack and of the top 20 cm of soil, the soil volumetric water content (VWC), and the effective thermal conductivity of the snow (ks) at two levels in the snowpack. Measurements from the stations were complemented with snow pit observations of snow density (ρs), temperature, SSA, and a visual identification of the snowpack stratigraphy conducted periodically during both winters.
2.2.1 Monitoring stations
Each station includes a snow height sensor, either the Judd model or the SR50a from Campbell Scientific, mounted 3 m above the ground, and is equipped with a vertical array of Pt-1000 thermistors (Schneider Electric). Temperature was measured at depths of 20, 10, and 5 cm in the soil; at the ground surface; and then every 15 cm in the snowpack until a maximum height of 180 cm. Thermistors were inserted into white-painted aluminum tubes held in place by a vertical ultra-high-molecular-weight polyethylene (UHMWPE) plastic rod. Snow surface temperature was measured at each station with an SI-111 infrared radiometer (Apogee Instruments) mounted at the same level as the snow height sensor. Each station was also equipped with an HMP60 (Campbell Scientific) sensor that measured air temperature and relative humidity at a height of 3 m above the ground. A CS655 reflectometer (Campbell Scientific) measured the VWC at a depth of 15 cm into the soil. Variations in 15 cm VWC were used as a proxy for infiltration. We also define the onset of snowmelt as the beginning of snowpack runoff, when the soil VWC reaches a maximum in spring. A CR10X data logger (Campbell Scientific) recorded point measurements every hour. Also, time-lapse cameras taking hourly photos were used to visually identify the precipitation phase and the burying of the thermistors. An example of a monitoring station, the one under the canopy in this case, is presented in Fig. 1g.
The stations were also equipped with two heated TP08 needle probes (NPs; Hukseflux) to measure ks following Morin et al. (2010) and Domine et al. (2015). The lower NP was installed 10 cm above the ground at each station, whereas the higher NP was installed 65 cm above the ground under the canopy and 80 cm in the forest gaps to account for the greater snow height in these environments. To prevent snow melting around the heated needle during measurements, these were taken only every other day between 05:00 and 06:00 EST (eastern standard time, UTC−5), only when the snow temperature was below −2.5 °C. During each measurement, the NP was heated for 150 s with a power of 0.45 W m−1. The heating curve was recorded on a CR1000 data logger (Campbell Scientific). The algorithm developed to automatically assess ks from the heating curves is derived from Domine et al. (2015) and is described in the Supplement (Fig. S1). The error associated with snow thermal conductivity measurements with these static needle probes is estimated to be 21 % (Domine et al., 2015).
We performed detailed soil profile measurements at the canopy and small gap sites on 13 and 20 July 2021, respectively. At the canopy site only, we measured soil thermal conductivity at different depths using a Hukseflux TP02 heating needle probe. Soil temperature was measured every 5 cm from the surface to 30 cm below and every 10 cm down to 80 cm below the surface with a Senseca Pt-1000 temperature probe (resolution: 0.1 °C). Soil cores (≈ 165 cm3) were taken from each layer, which were then weighted before and after oven drying for 48 h at 65 and 100 °C for organic and mineral soils, respectively. This allowed us to estimate the volumetric water content and the bulk density of the soil, assuming a density of water of 1000 kg m−3. Figure S2 presents the vertical profiles of soil characterization at both locations.
2.2.2 Data gap filling
Small data gaps (1 to 5 h) in the snow height and temperature time series were filled by linear interpolation. We used data from the other stations to fill the longer data gaps, as described in the Supplement (Figs. S3–S5). This approach was applied to snow height in the medium forest gap (37 d in 2020) and under the canopy (77 d in 2022), to snow surface temperature in the small forest gap (winter 2021–22), and to air and snow surface temperatures under the canopy (16 d in 2022).
2.2.3 Snow pit measurements
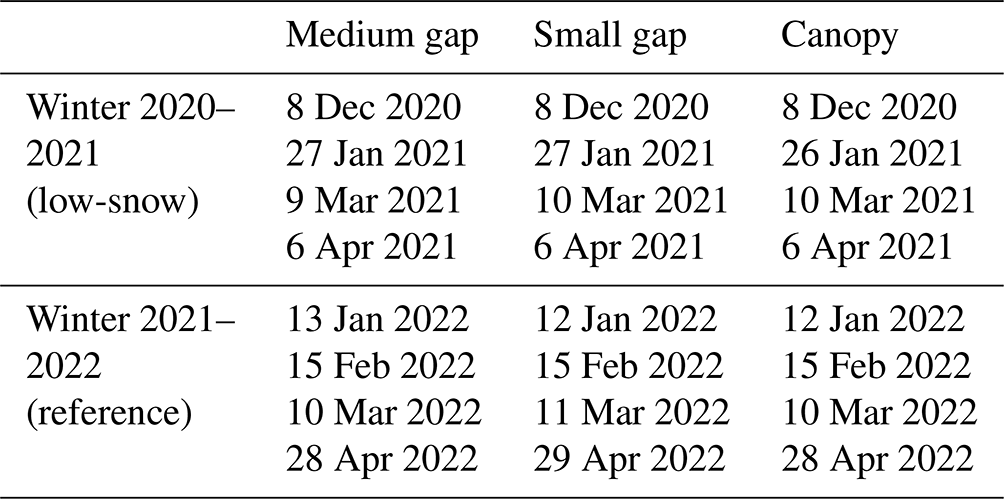
Four snow pits were dug in medium gaps, small gaps, and under the canopy each winter for a total of 24 snow pits over the two winters. Snow pits in gaps and under the canopy were all dug at sites with similar conditions (gap size, SVF) to the monitoring stations, all within 150 m of the stations. Table 2 lists the date of each snow pit measurement.
For each snow pit survey, we measured ρs with a Snow-Hydro 100 cm3 box with a ±10 % accuracy (Conger and McClung, 2009). Snow density was measured every 3 to 5 cm in the vertical direction. In the presence of ice columns, measurements were taken adjacently. We measured snow temperature using the Senseca Pt-1000 probe every 5 cm in the topmost 40 cm of snow and every 10 cm for the lower snow layers. The SSA, being a quantitative indicator of snow metamorphism (Taillandier et al., 2007), was measured using the DUFISSS instrument (Gallet et al., 2009). DUFISSS uses infrared reflectance of snow samples with an integrating sphere at 1310 nm to estimate the SSA with an accuracy of approximately 12 % (Gallet et al., 2009). Measurements were taken vertically every 1 to 5 cm depending on the stratigraphy.
2.3 Estimated variables
2.3.1 Snow water equivalent and snowpack cold content
We estimated the SWE (m) from snow density profiles using
where h and are respectively the height (m) and the average density (kg m−3) of the snowpack, and ρw is the density of liquid water (1000 kg m−3).
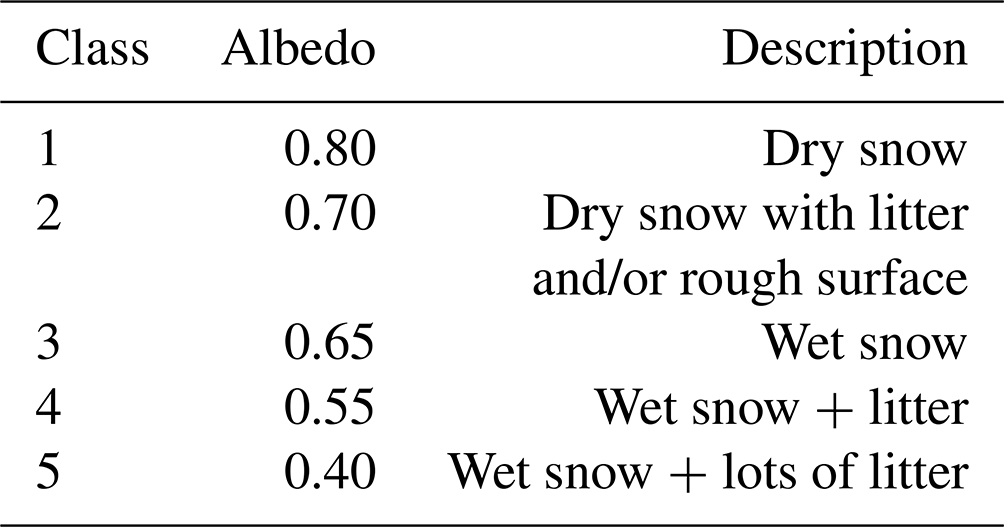
Table 3Albedo classes used for the estimation the reflected shortwave radiation by the snow surface.
The snowpack cold content (QCC, in J m−2) is the quantity of energy needed to bring the snowpack to its melting point. It is defined as
where cice is the heat capacity of ice (2108 J kg−1 K−1), and hi and are the same as above but for a given snow layer i. is the average temperature between the bottom and top boundaries of each i layer (K) as monitored at the stations, and Tm is the melting point of ice (273.15 K). hi corresponds to the vertical distance between each temperature measurement.
Since snow density profiles were point measurements, we interpolated linearly between each snow pit date at an hourly time step to match temperature monitoring. Snow density was assumed constant from the beginning of the snow season until the date of the first snow pit (23 d in W20–21 and 59 d in W21–22) and then from the last snow pit date until meltout (39 d in W20–21 and 31 d in W21–22). To validate this rough hypothesis, we measured four density profiles in W20–21 and five in W21–22 at the NEIGE site next to the SWE sensor and compared the resulting estimated SWE time series with direct observations, as shown in the Supplement (Fig. S6).
2.3.2 Snowpack net shortwave and longwave radiation
We used the HPEval model (Jonas et al., 2020) to estimate the downwelling shortwave radiation below the canopy ( from the hemispherical photographs taken at the monitoring stations and the incoming shortwave radiation measured above the canopy at the flux tower, some 10 m away. HPEval combines hemispherical imagery of the canopy and radiation transfer modeling to estimate subcanopy shortwave radiation at very high spatial and temporal resolution. Reflected shortwave radiation by the snowpack ( was estimated using five arbitrary albedo classes defined from the work from Hardy et al. (2000) and Melloh et al. (2001). The five classes are listed in Table 3.
We manually assigned a daily albedo class to the snow surface by visually inspecting time-lapse photographs from each station. A sample representative photo of each albedo class is presented in Fig. S7. The net shortwave radiation below canopy (SWRnet,bc) is the difference between and .
We estimated the downwelling longwave radiation below the canopy (; W m−2) by using
where is the downwelling longwave radiation measured above the canopy at the nearby flux tower (W m−2), σ is the Stefan–Boltzmann constant (5.67 × 10⁻⁸ W m−2 K−4), εcan is the canopy emissivity (set to 0.98; Pomeroy et al., 2009), and Tcan is the canopy temperature (K). We assume that the canopy temperature can be approximated by the air temperature measured at our monitoring stations.
The upwelling longwave radiation below the canopy (; W m−2) is determined with
where εs is the emissivity of the snow surface (set to 0.99; Sicart et al., 2006), and Tsurf is the snow surface temperature (K) measured at each station. The net longwave radiation below canopy (LWRnet,bc) is the difference between and . The net total radiation below canopy (Rnet,bc) is the sum of SWRnet,bc and LWRnet,bc.
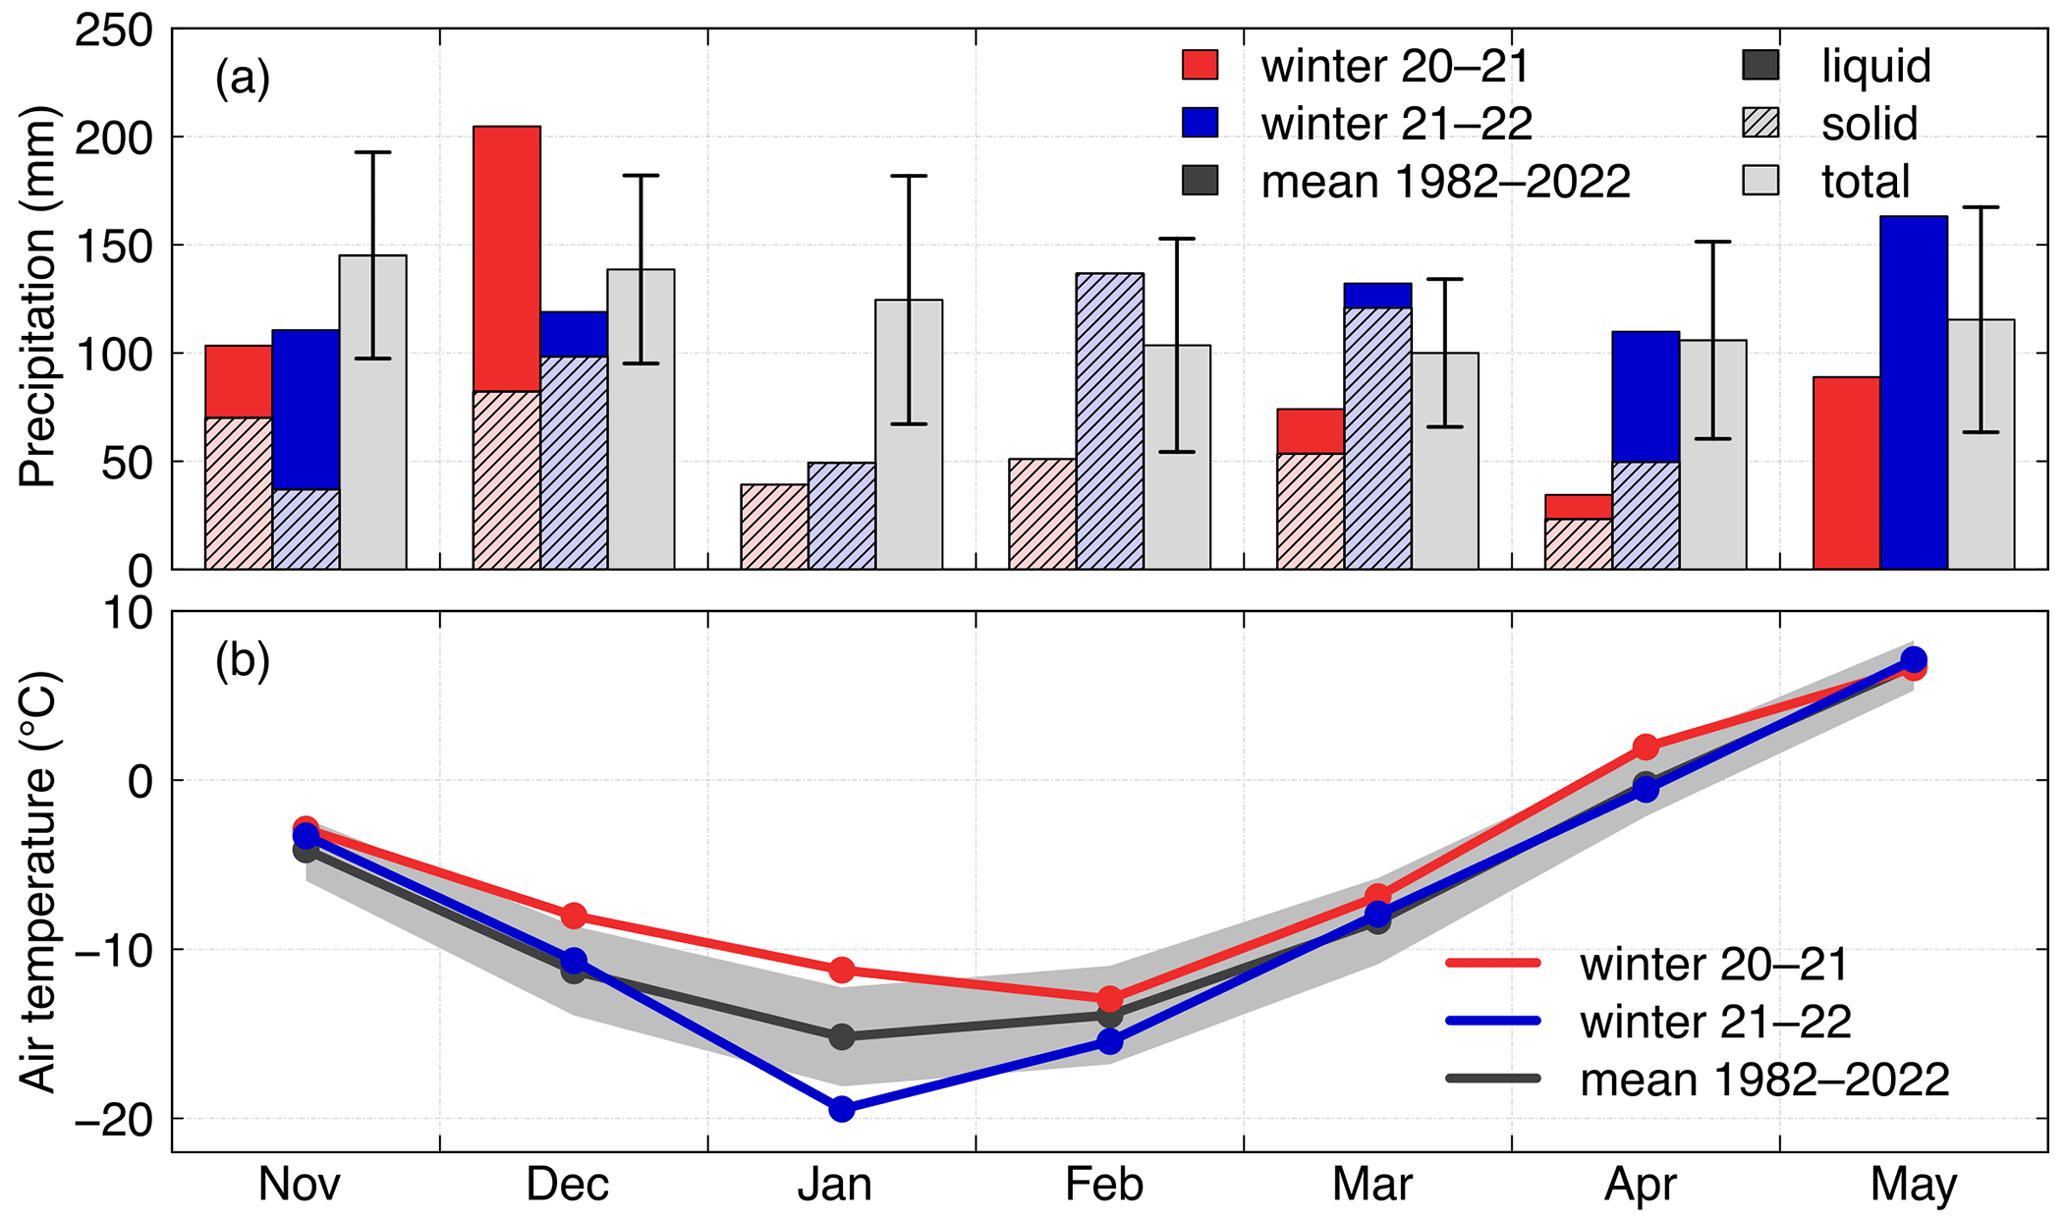
Figure 2Monthly sum of precipitation (a) and means of air temperature (b) from November to May in the winters of 2020–2021 and 2021–2022, measured at the NEIGE site and compared to the monthly sum of precipitation and means of hourly temperature over the 1982–2022 period. Dashed bars in (a) show snowfall, whereas solid bars indicate rainfall. The standard deviation of the 1982–2022 is shown by the black error bars for precipitation in (a) and by the grey area for the monthly temperature in (b).
Table 4Total precipitation from January to April (JFMA) and from November to May, solid precipitation from November to May, mean December–January–February (DJF) temperature, maximum recorded snow height (Hs,max), and meltout day at the NEIGE site for the 2020–2021 and 2021–2022 winters. The anomaly relative to the 1982–2022 period is also shown, along with the rank of both winters for each metric relative to the 40 winters of the climatology. We used a threshold at 1 °C to define the precipitation phase over the analysis period. Winters 1999 to 2003 were excluded of the analysis because of too many missing data.
∗ Temp. DJF is ranked in descending order, whereas all the other variables are ranked in ascending order. DOY is day of the year.
2.3.3 Ground heat flux
The ground heat flux was assumed equivalent to the snow heat flux within the lower 15 cm of the snowpack (Lackner et al., 2022) and calculated using Fourier's law (Eq. 5):
where F (W m−2) is the heat flux of the lower 15 cm of the snowpack, ks (W m−1 K−1) is the effective thermal conductivity of this basal snow layer (taken as the NP measurement at a 10 cm height), T15 and T0 are the temperatures measured 15 cm above the ground and at the ground surface (K), respectively, and dh is the thickness of the bottom layer (15 cm). To avoid melting of the ice matrix, NPs were not heated when the snow was warmer than −2.5 °C. Because of this constraint, ks at 10 cm from each station was only measured at the beginning of the winter on both years when the bottom of the snowpack was colder than −2.5 °C. This resulted in more than 80 % of ks measurements that were missing. In order to have a complete time series of ks, we used Eq. (18) from Fourteau et al. (2021) with our pit density measurements to estimate ks. We validated the use of this empirical equation by comparing it to our observations of pit density and monitoring of ks at 10 and 65 or 80 cm at all stations. We used ks that was measured the closest in time to the snow pit surveys. Before comparing our observations with the equation, correction factors between 1.1 and 1.3, depending on snow temperature, were applied to ks measurements to account for the systematic underestimation of the fixed NP approach (Fourteau et al., 2022). Doing this, we found a correlation coefficient of 0.70 and a bias of 10.2 % between our observations and the equation from Fourteau et al. (2021). Comparison between the corrected measurements and the equation is detailed in the Supplement (Fig. S8).
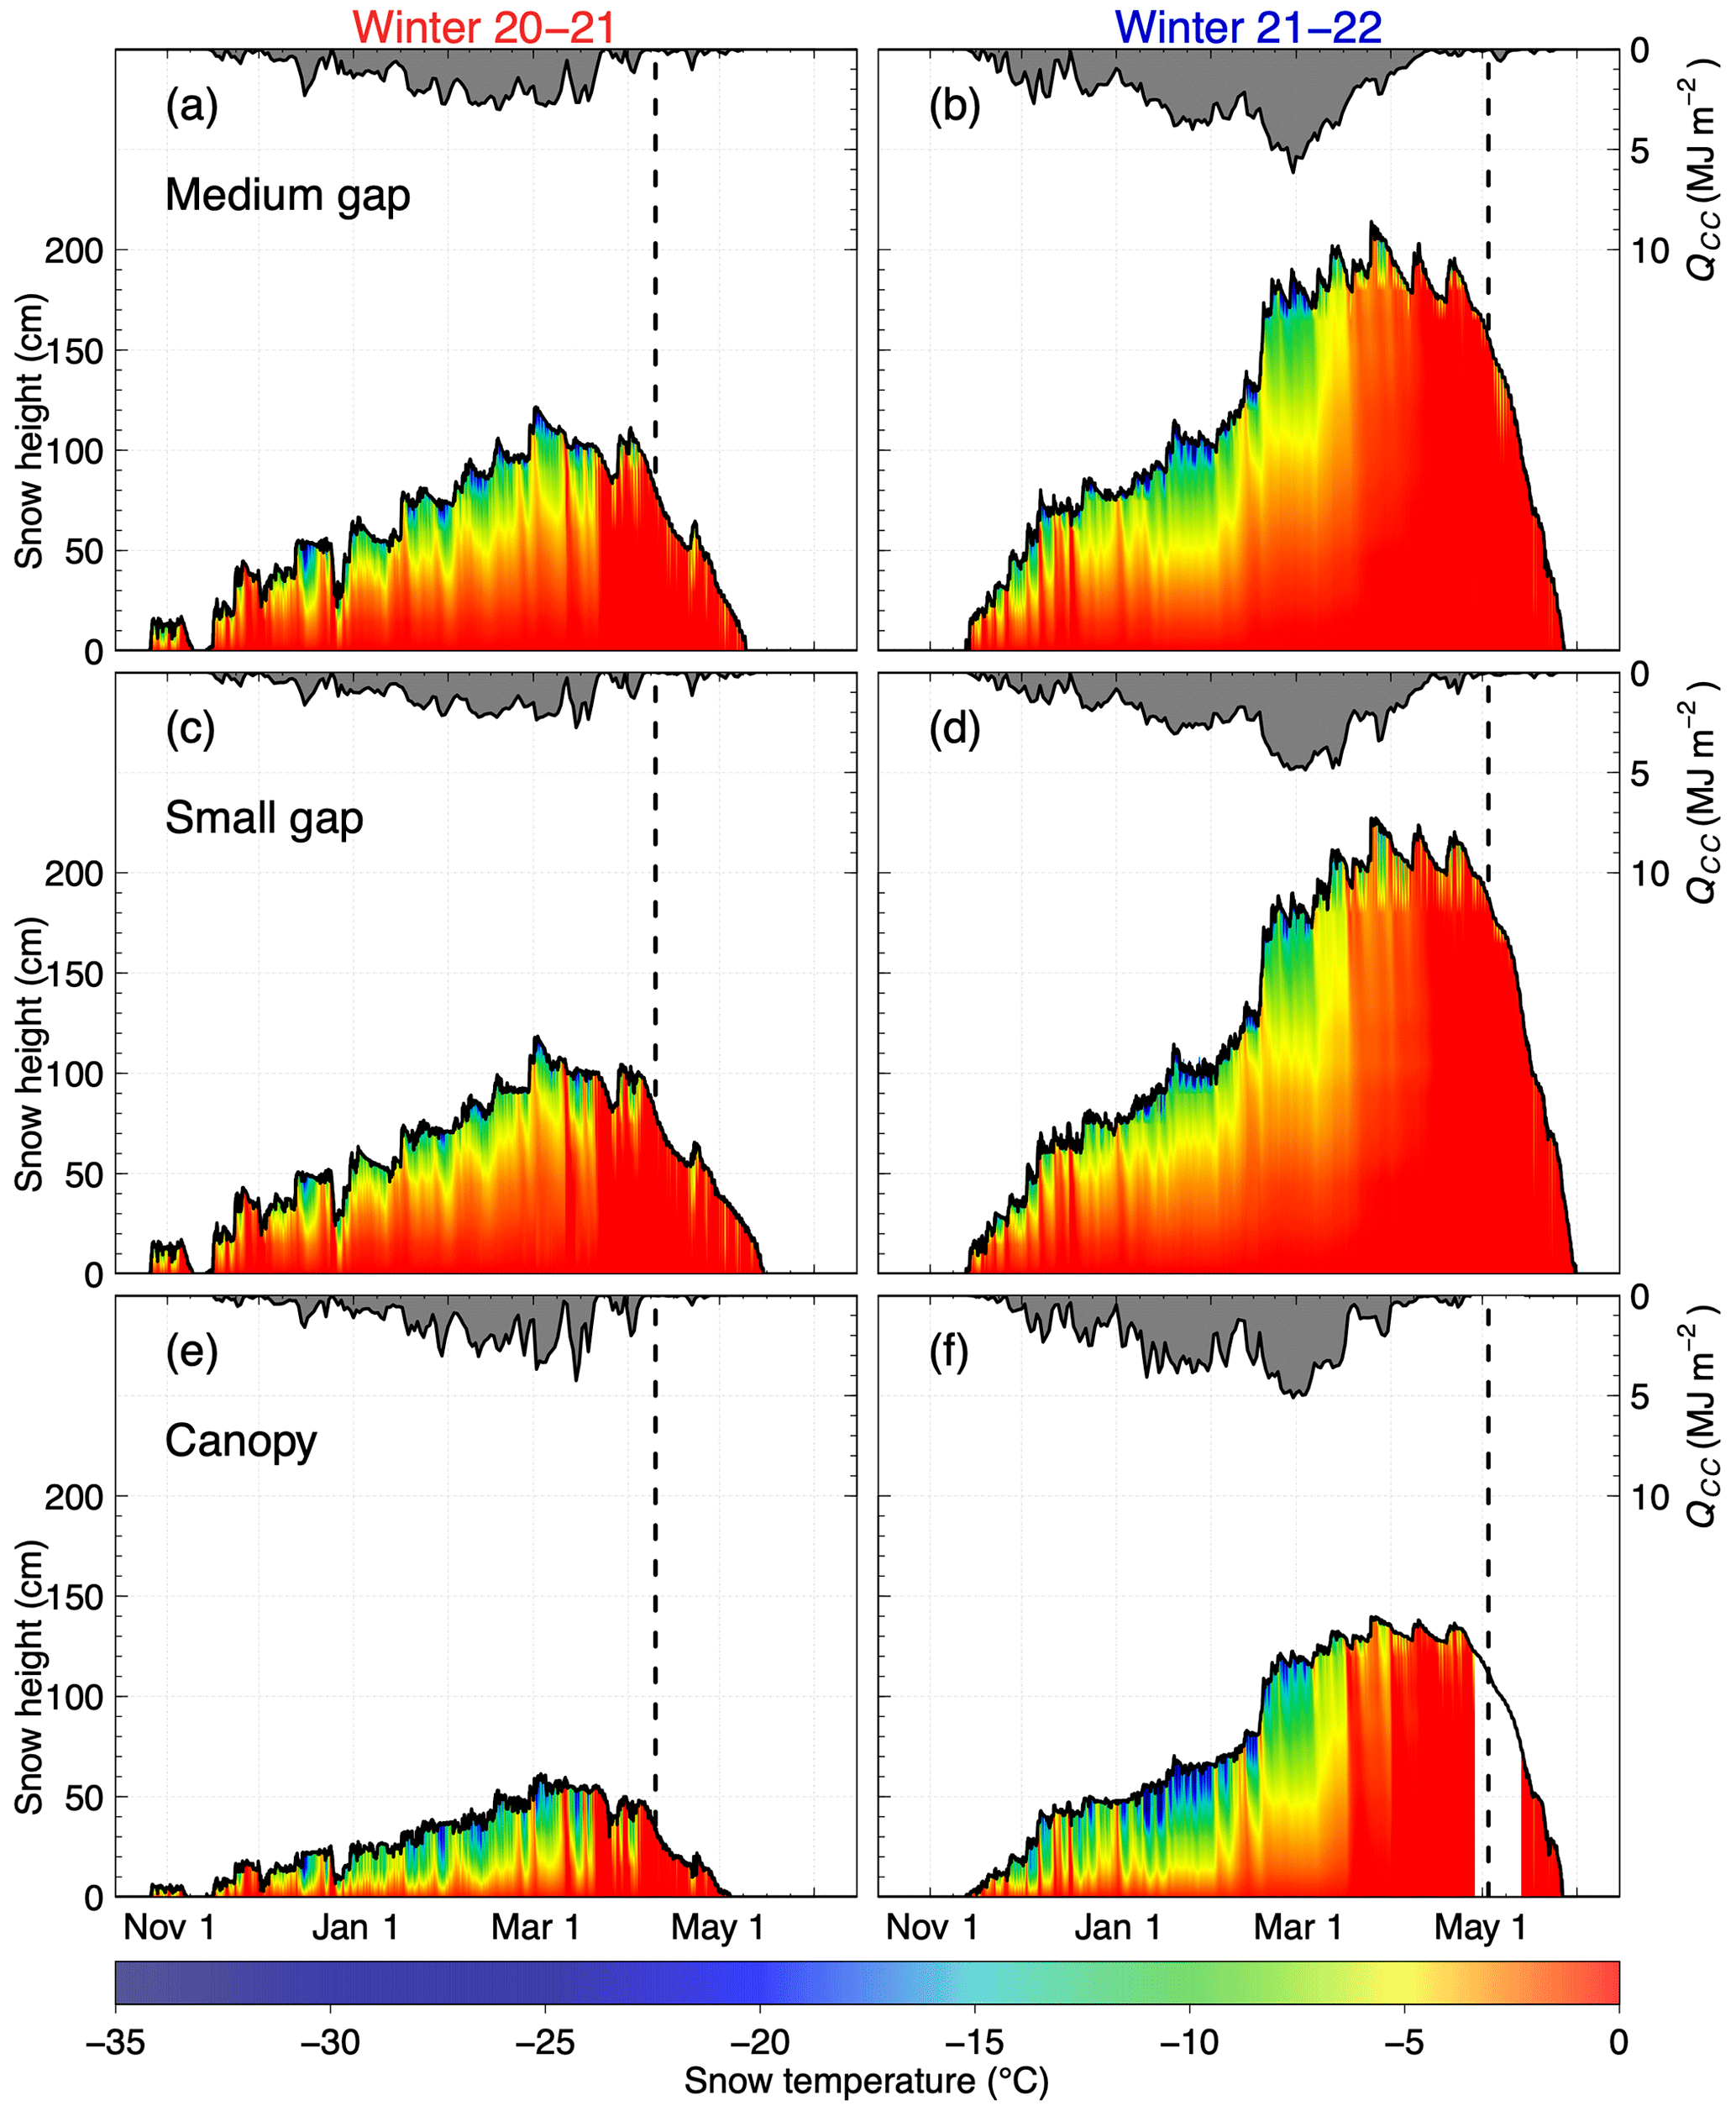
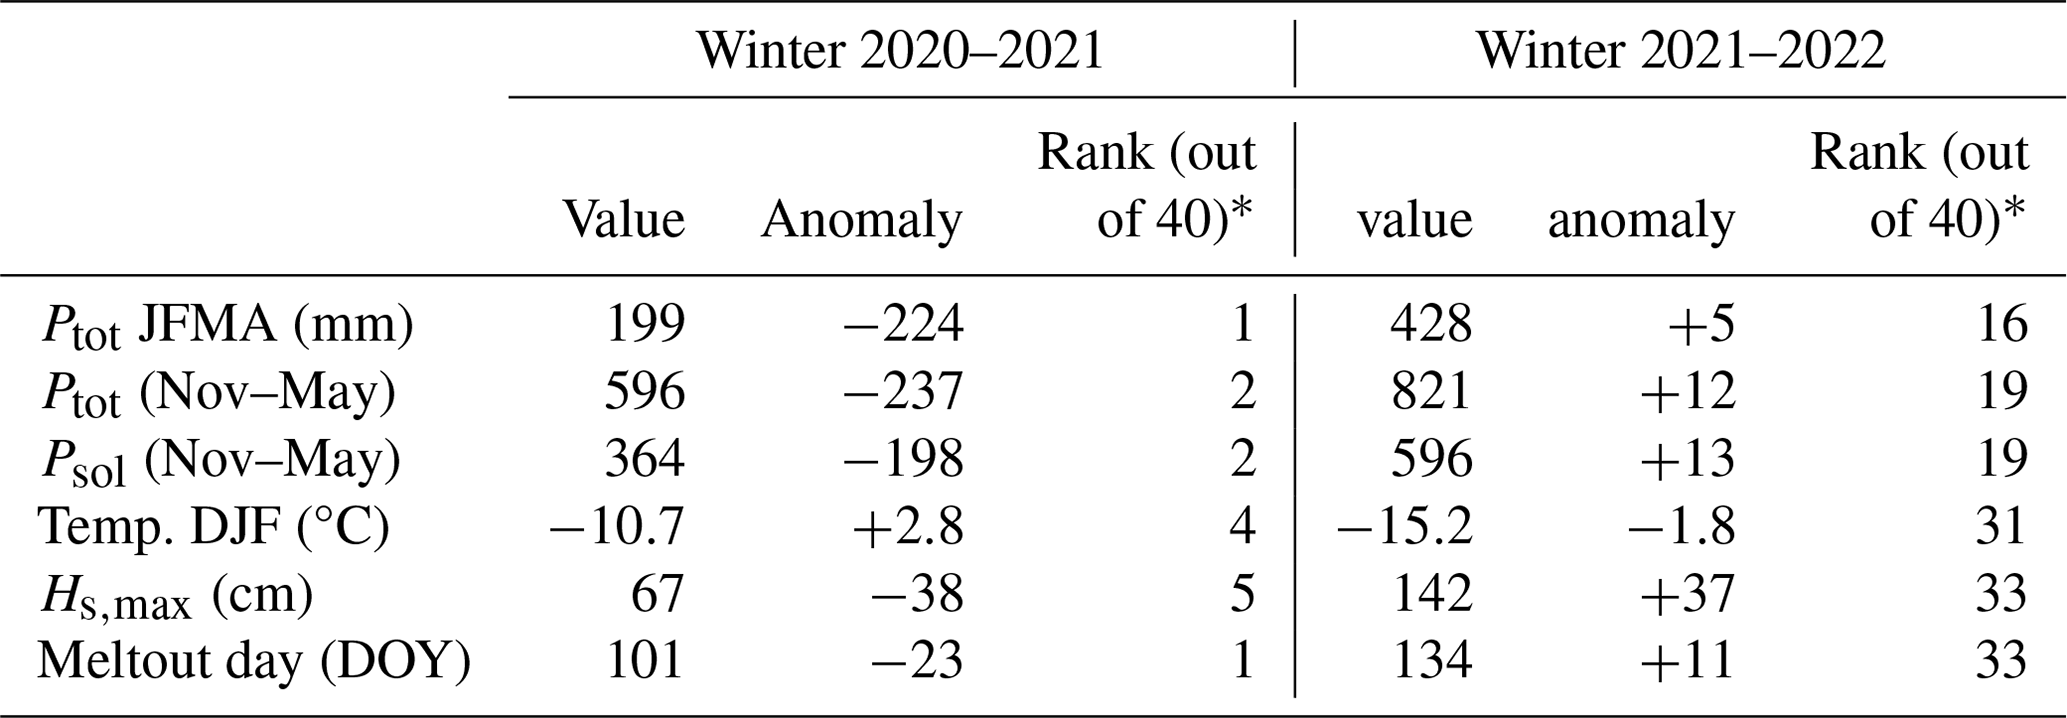
Figure 3Snowpack thermal regime and cold content in the medium gap (a–b), in the small gap (c–d), and under the canopy (e–f) for winters 2020–2021 (a, c, e) and 2021–2022 (b, d, f). Dashed lines show the onset of snowmelt.
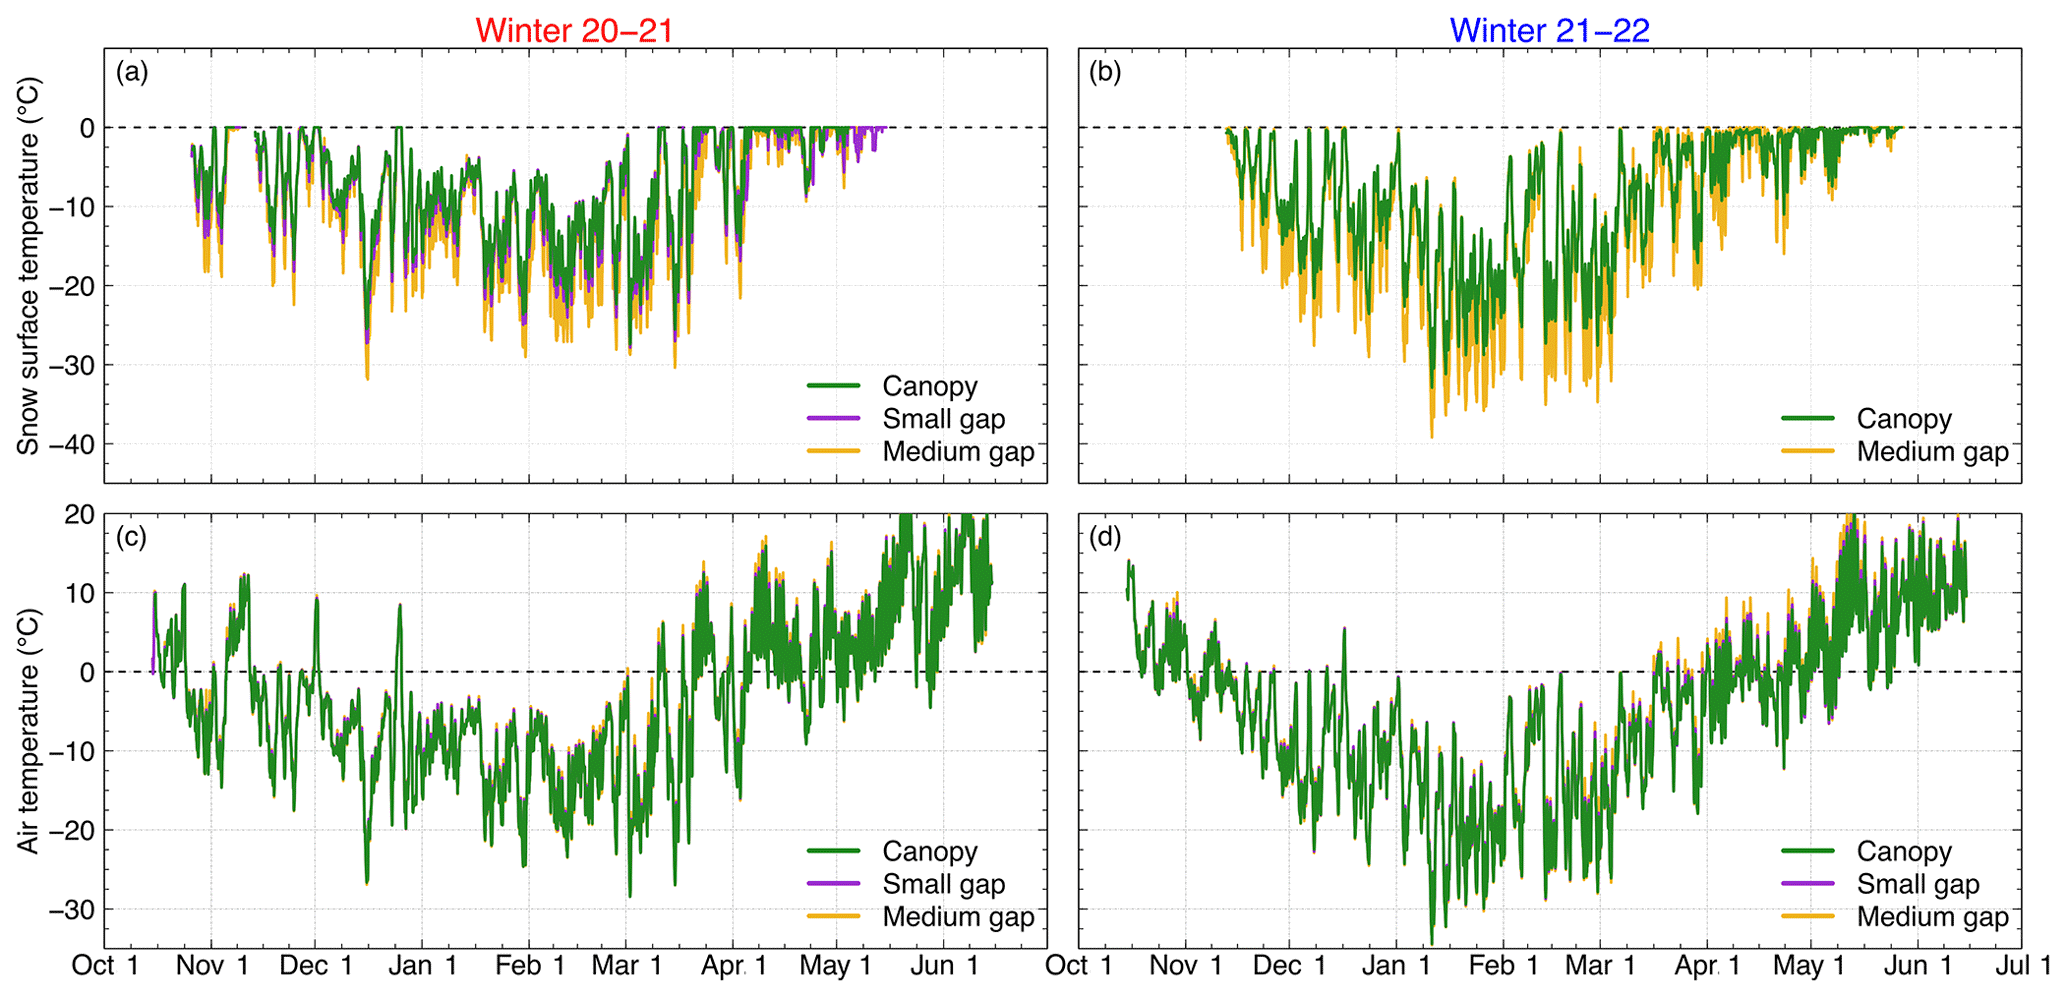
Figure 4Snow surface and air temperature measured in the medium gap (yellow), in the small gap (purple), and under the canopy (green) during winters 2020–2021 (a–c) and 2021–2022 (b–d). Since the snow surface temperature in the small gap was entirely gap-filled in the winter of 2021–2022, it is not presented in (b).
2.3.4 Vertical temperature gradient
The magnitude of the mean snowpack vertical temperature gradient (, in °C m−1) is expressed as follow:
where (Tsurf−T0) is the temperature difference between the snow surface and the soil–snow interface (in °C), and hs is the snow height (in m).
2.3.5 Snow permeability
Snow permeability (Ks, in m2) indicates the ease with which a fluid subjected to a pressure gradient flows through a porous medium. Ks can be estimated from ρs and the optical grain radius (rg, in metres) according to the following equation (Calonne et al., 2012):
We assume that each snow layer is a collection of independent ice spheres (ρice=917 kg m−3) with the same SSA as the snow of interest (Grenfell and Warren, 1999). Therefore, rg is estimated as follow:
2.4 Modeling setup
We simulate the snowpack using the SNOWPACK model, version 3.6.0 (Lehning et al., 2002), coupled with the two-layer canopy module implemented by Gouttevin et al. (2015) for winter 2020–2021 and winter 2021–2022. SNOWPACK is a multilayer snow model that solves Richards equations for liquid water transport in the snowpack (Wever et al., 2014). The two-layer canopy scheme has shown a reasonably good performance in simulating the thermal inertia of the canopy and the underlying snowpack (Gouttevin et al., 2015; Todt et al., 2018; Bouchard et al., 2024). The SNOWPACK canopy module does not simulate the heterogeneous structure of the canopy, so snow–forest processes within forest gaps are not parameterized in the model. Therefore, we used the simulations described in Bouchard et al. (2024), referred to by the authors as the “Initial Module”, for winters 2020–2021 and 2021–2022 at the MF site.
Briefly, simulations were performed at a 15 min time step using local meteorological forcing data measured above the canopy thanks to a 20 m flux tower and recorded at a 30 min time step (Isabelle et al., 2018). We also used measurements from a double-fence automatic reference for precipitation inputs (Pierre et al., 2019). Based on field measurements, the tree height and the leaf area index (LAI) were set to 9.2 m and 4.8 m2 m−2, respectively. The stand basal area was set to 0.005 m2 m−2 based on Hadiwijaya et al. (2020). The direct throughfall fraction was set to 0 to better represent the subcanopy snowpack. We used values from Gouttevin et al. (2015) for the canopy albedo and the two-layer LAI fraction. Finally, the initial soil parameterization was based on field measurements taken in the summer of 2021. Additional details on the forcing data, the initial canopy and soil parameterization, and the SNOWPACK initialization file are given in the Methods section of Bouchard et al. (2024). Note that the authors found a good agreement between the simulations and observations for snow cover height and duration, snow surface temperature, and snow density profiles using this modeling setup. This demonstrates that the model is suitable for simulating the canopy snowpack at the MF site.
3.1 Climatic conditions
W20–21 was the driest winter of the 1982–2022 period, with 199 mm recorded from January to April (JFMA), including 167 mm of solid precipitation (Fig. 2, Table 4). This corresponds to a precipitation anomaly of −224 mm (−53 %). In comparison, the JFMA anomaly of precipitation in W21–22 was only +5 mm (+1 %). December–January–February (DJF) temperature in W20–21 was also 2.8 °C warmer than the 1982–2022 average. As for DJF, W20–21 was the fourth warmest year of the last 40 years. In comparison, DJF temperature was 1.8 °C colder in W21–22 than the 1982–2022 average and ranks as the sixth coldest for that period. The exceptionally dry and warm winter of 2020–2021 resulted in the earliest meltout in the last 40 years at the NEIGE site (11 April 2021), with snow disappearing 23 d earlier than the 1982–2022 average (Table 4). In comparison, the projected DJF temperature and the total JFMA precipitation are expected to be −10.4 °C and 425 mm, respectively, by 2070 at Montmorency Forest, based on the SSP5-8.5 emission scenario from CMIP6 climate simulations (Climate Data for a Resilient Canada, 2023). Two heavy rain-on-snow (ROS) events were observed in December 2020; three smaller ones in November and December 2021; and several others in March, April, and May of both years. As the data show, winter 2020–2021 received a much lower than average solid precipitation and was significantly warmer, resulting in a thin snowpack. We will refer to it as our low-snow and warm winter. The precipitation and temperature anomaly in the winter of 2021–2022 is much weaker. Therefore, W21–22 will correspond to the reference winter for the rest of the analysis.
3.2 Snow accumulation and melt dynamics
Due to a lower snowfall, the maximum snow height (Hs,max) in W20–21 was on average 44 % lower than in the reference winter (Fig. 3). As the air was warmer in W20–21, the snow surface temperature (SST) was on average 1.35 °C warmer than in the reference winter (Fig. 4). In contrast, because there was less snow on the ground in W20–21, heat transfer through the snow was facilitated, resulting in the base of the snowpack being colder in W21–22. Due to canopy interception, less snow accumulated under the trees than in the gaps in both years, and Hs,max was on average 35 % lower under the canopy than inside both gaps. Interestingly, topmost snow layers seem to be colder under the canopy than inside gaps. This is in contradiction with Fig. 4, which shows that the SST was higher under the canopy than inside gaps in both years (+1.53 °C), despite similar air temperature at all three stations. This discrepancy is further discussed in Sect. 4.2.
Due to the thinner snowpack and warmer air temperature, the QCC was on average 36 % lower in W20–21 than in W21–22. Interestingly, the QCC peaked in late February in both winters. However, since less energy was required to warm the snowpack to 0 °C, snowmelt started on average 23 d earlier in the low-snow and warm winter than in the reference winter (10 April 2021 vs. 3 May 2022), which is a substantial difference. Since the snowpack was thicker in the gaps than under the canopy, the QCC was slightly less under the trees than in both gaps.
As snowmelt started more than 3 weeks earlier in W20–21 than in the reference winter, less radiative energy was available to contribute to snowmelt (Fig. 5). Net shortwave (SWRnet, bc) and longwave (LWRnet, bc) radiation below canopy were both lower in the low-snow and warm year. As expected, we observed a decrease in SWRnet, bc and an increase in LWRnet, bc as the sky-view fraction decreased regardless of the year.
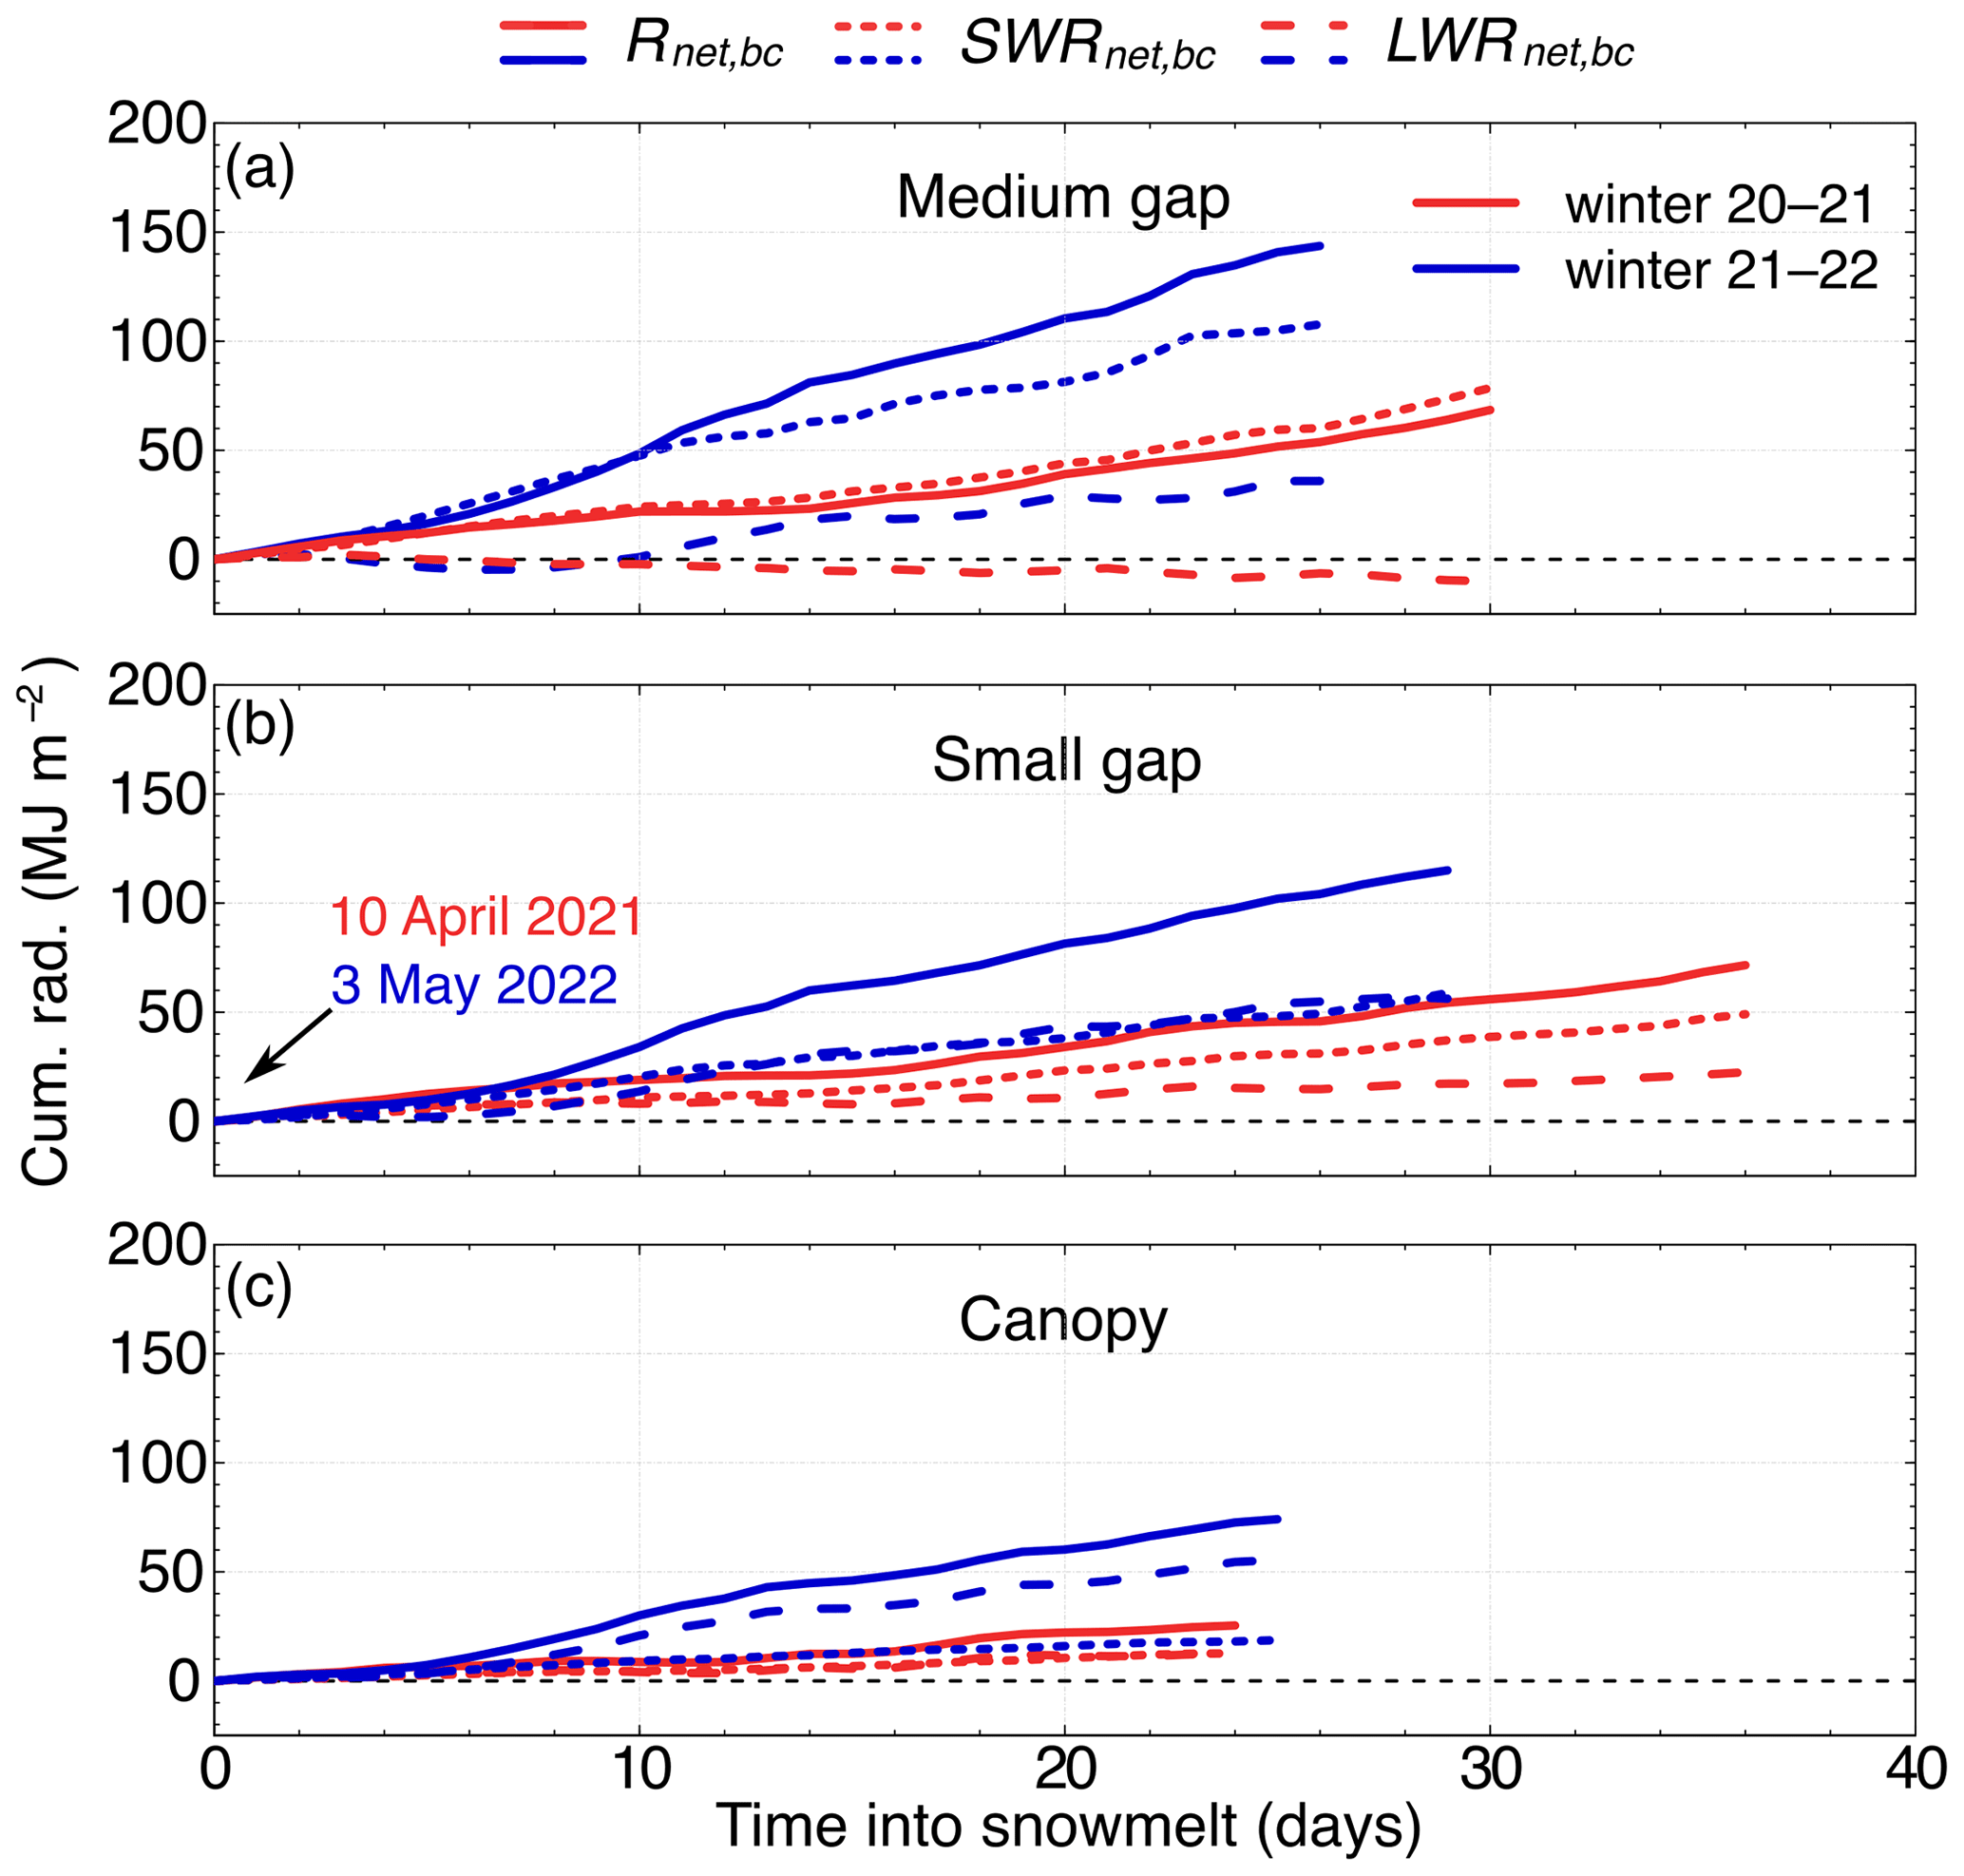
Figure 5Cumulative net total (Rnet, bc), shortwave (SWRnet, bc), and longwave (LWRnet, bc) radiation below the canopy during snowmelt of winter 2020–2021 (red) and 2021–2022 (blue) in the medium gap (a), in the small gap (b), and at the canopy station (c). Graphs start at the beginning of the snowmelt period on 10 April 2021 in the first year and on 3 May 2022 in the second year. Note that SWRnet, bc and LWRnet, bc overlap during the snowmelt of 2021.
In the medium gap, small gap, and under the canopy, the SWE at the beginning of snowmelt in the low-snow year was 56 %, 59 %, and 76 % lower, respectively, than in the reference year (Fig. 6). In addition to a thinner snowpack, the melt rate was also significantly smaller during the low-snow winter. From W20–21 to W21–22, the duration of the melt period slightly increased from 26 to 31 d and from 29 to 37 d in the medium and small gaps, respectively, whereas it did not change under the canopy (24 d). The meltout date was on average 19 d earlier in the warm year for all sites. In comparison, the difference in meltout date between the canopy and gap stations was much smaller, with snow melting on average 5 d earlier under the canopy in both years.
3.3 Ground thermal regime and water content
The ground heat flux (GHF) in DJF was on average 50 % higher in W20–21 than in the reference winter (Fig. 7). The largest difference was observed under the canopy, where the GHF was significantly larger than in gaps in W20–21 and in W21–22. At any given depth, the soil was cooler in W20–21 than in W21–22 in DJF (Fig. 7, Table 5), even though it was a warmer season. In both winters, the top few centimetres of soil below the canopy dropped below freezing, while all soil layers in the gaps remained above or at 0 °C. We also observed a frozen soil–snow interface during snow pit surveys under the canopy, but never in the gaps. In the low-snow and warm winter, the freezing depth reached 10 cm compared to only 5 cm in the reference winter, even though it was much colder. However, the soil–snow interface was below 0 °C for similar durations (103 vs. 102 d).
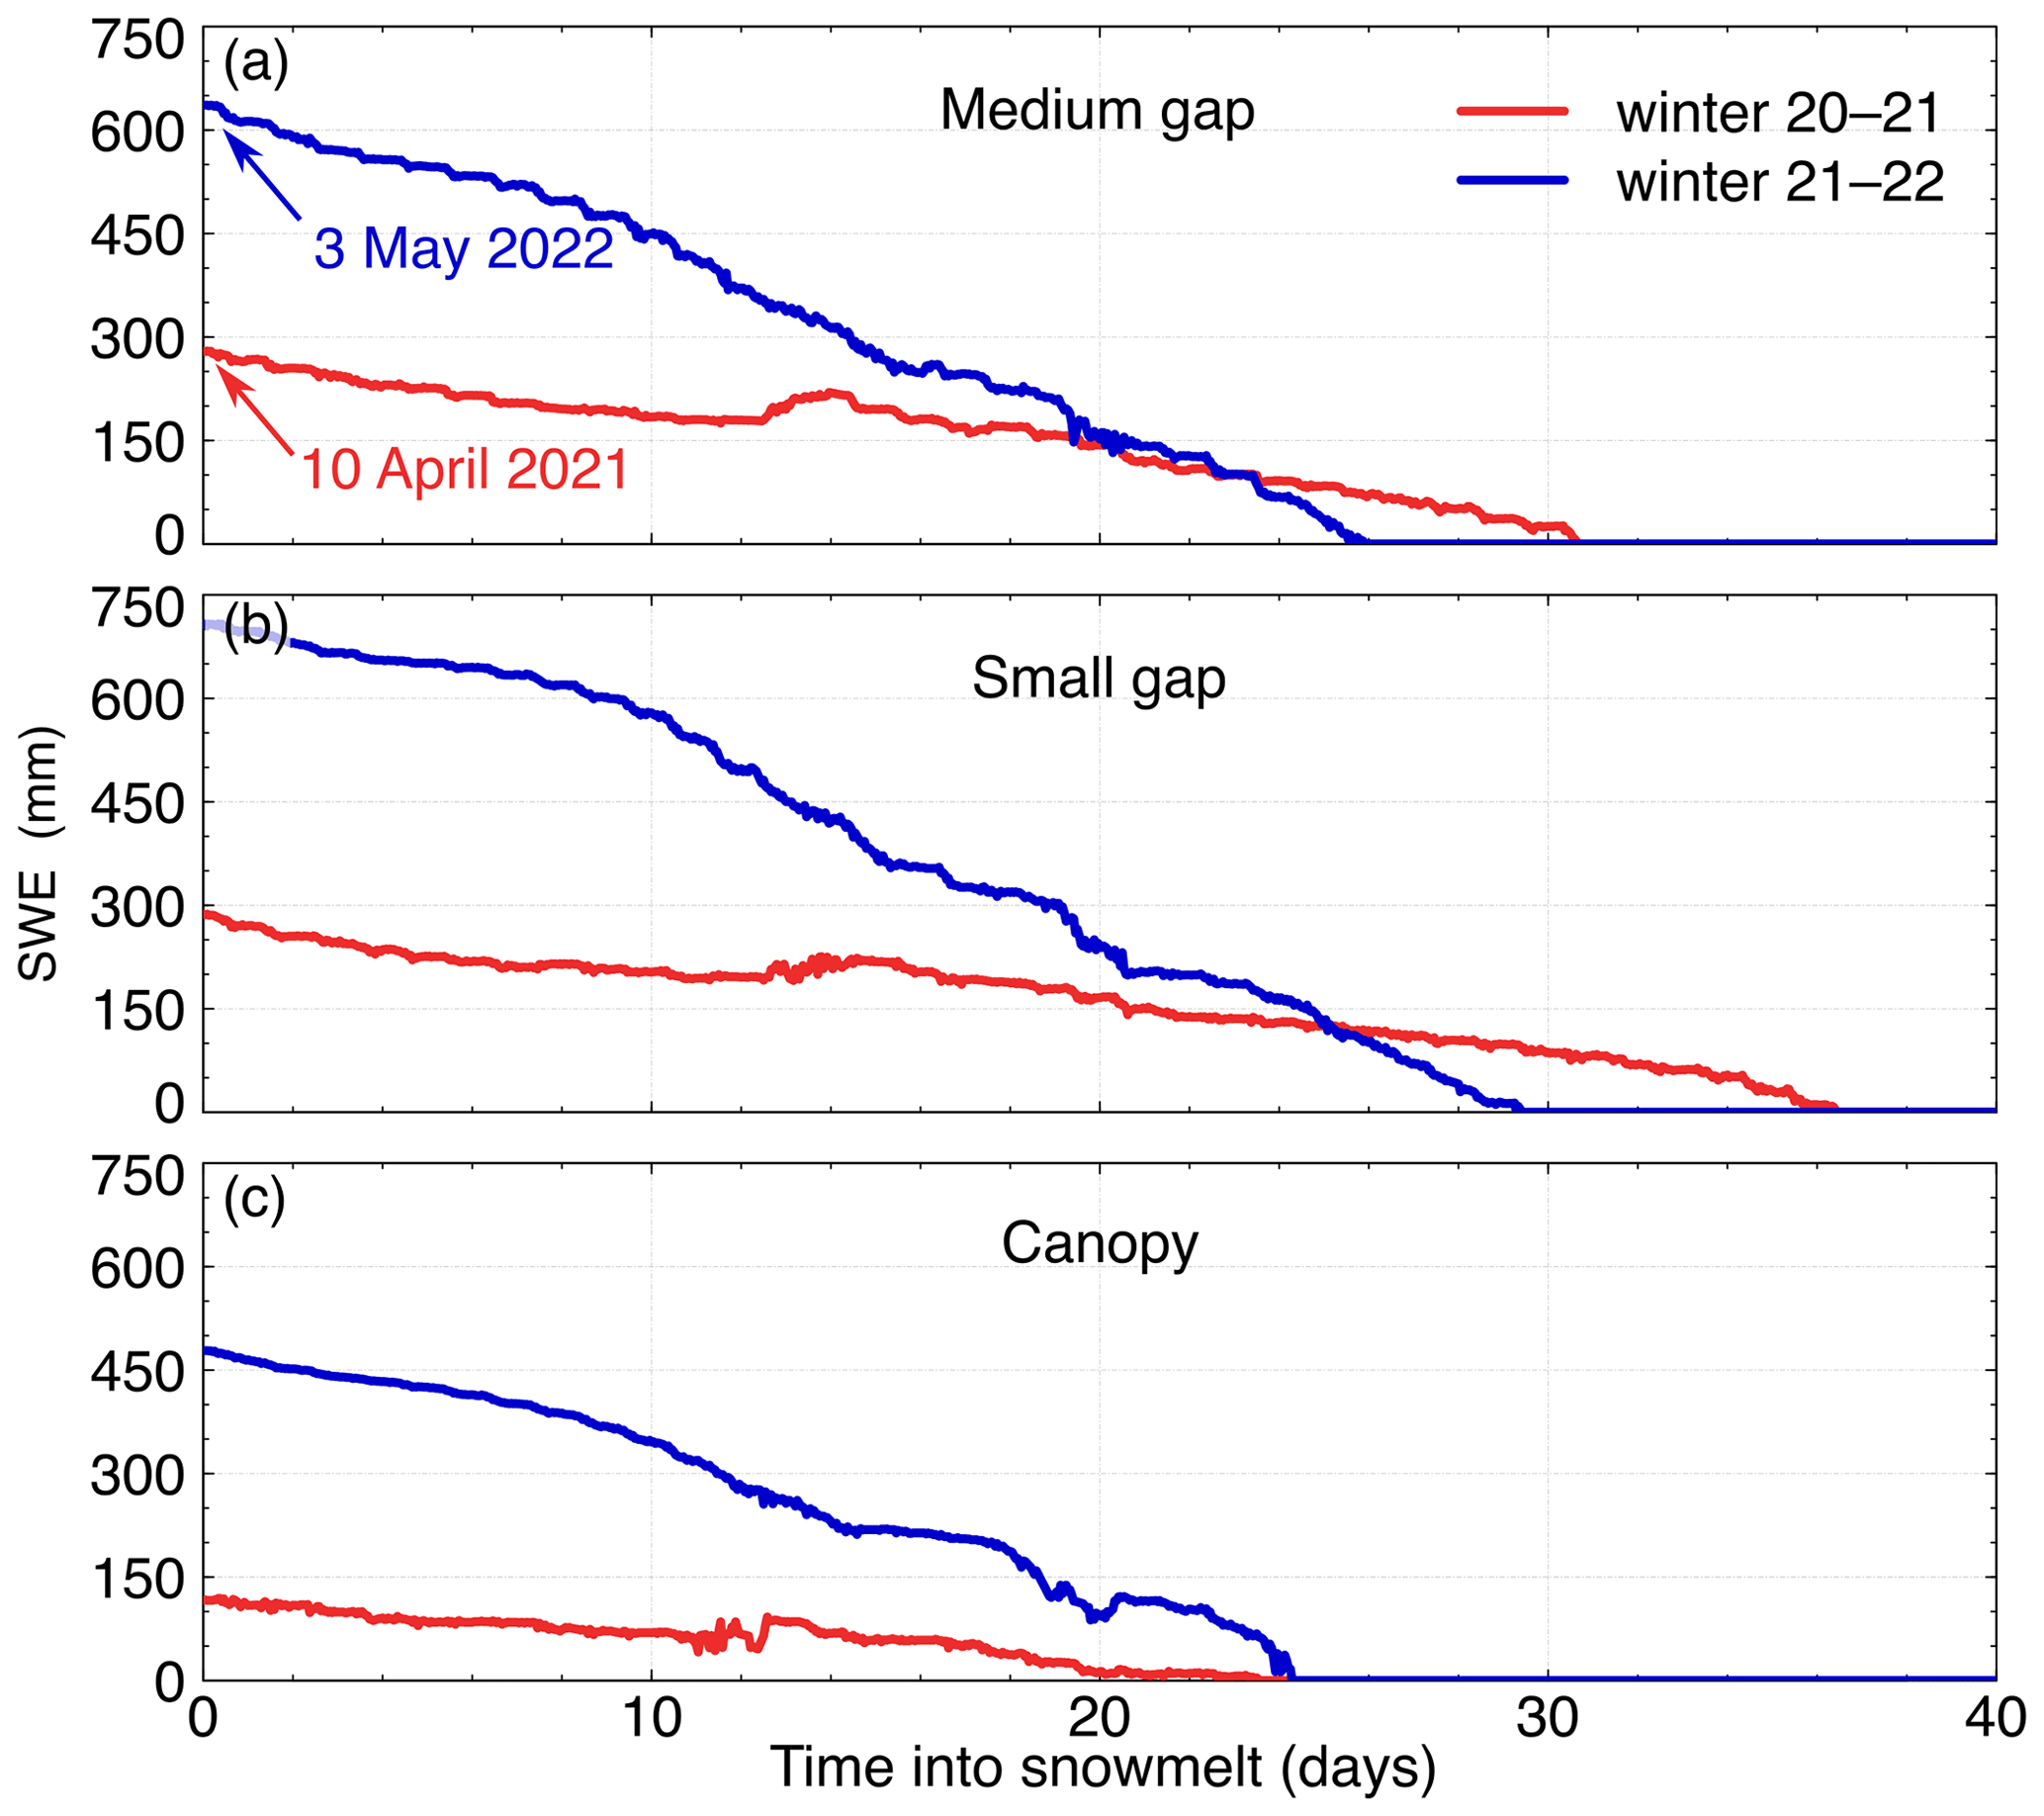
Figure 6SWE evolution during snowmelt of winters 2020–2021 (red) and 2021–2022 (blue) in the medium gap (a), in the small gap (b), and under the canopy (c). The plots start at the beginning of the snowmelt period on each year, which differs by an average of 23 d between seasons.
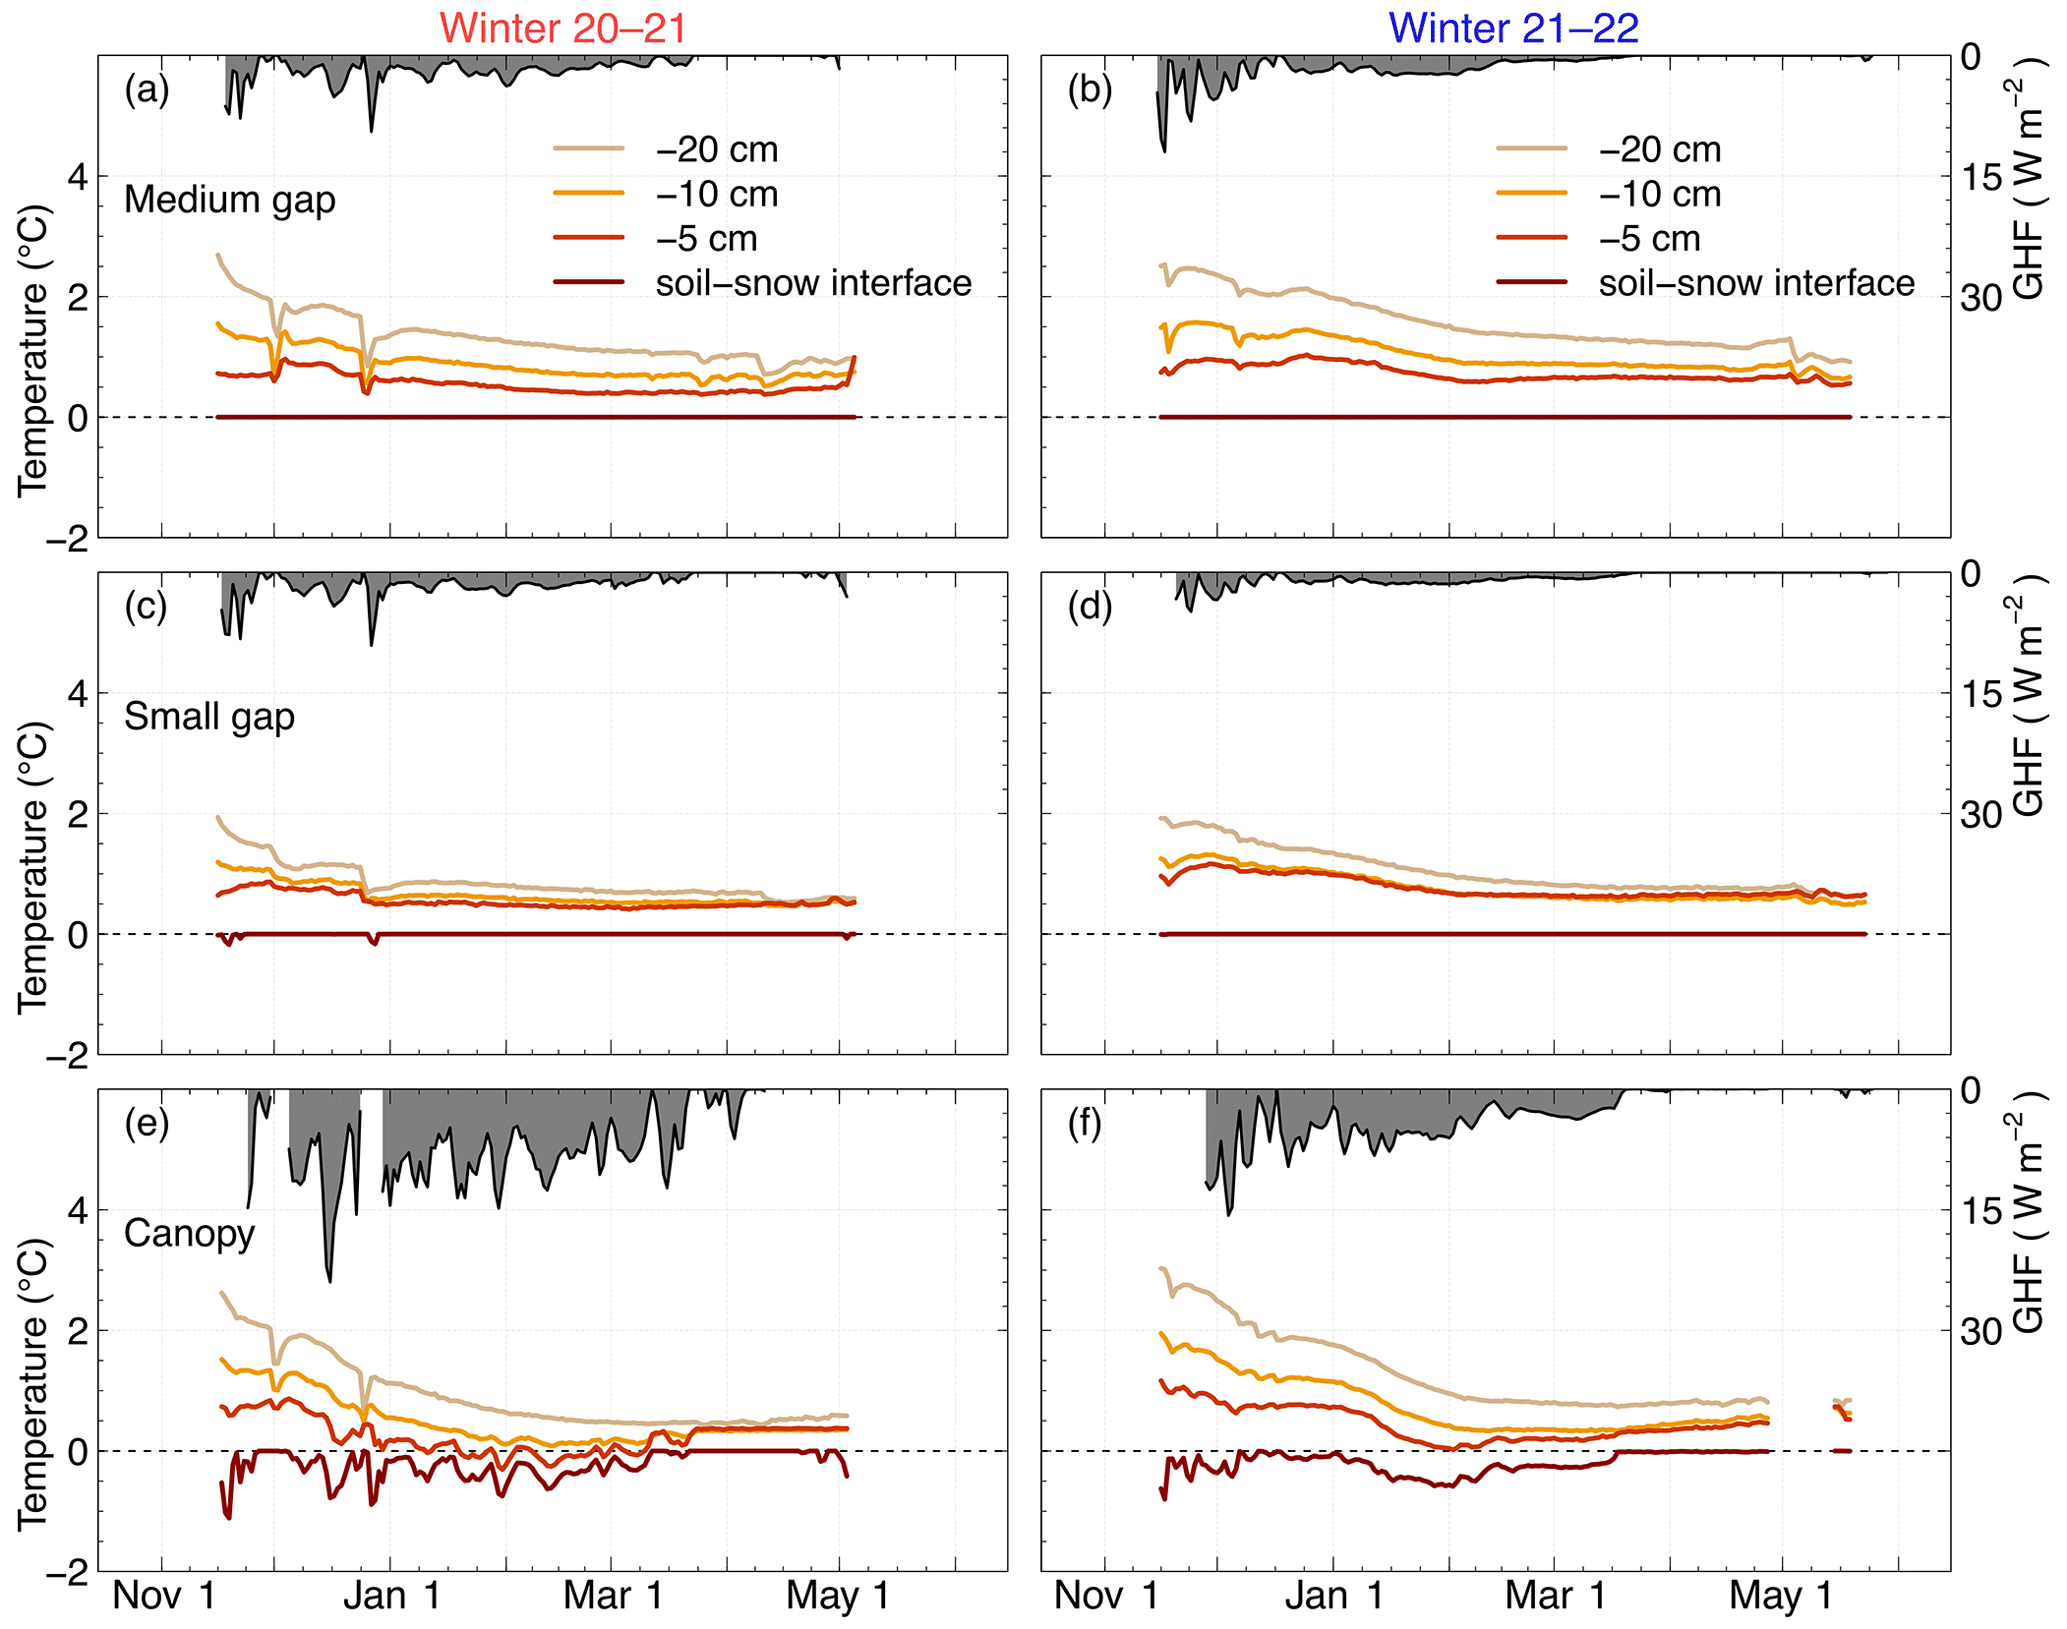
Figure 7Ground heat flux (GHF) and temperature at 20, 10, and 5 cm below ground level and at the soil–snow interface during the snow cover period of winters 2020–2021 (a, c, e) and 2021–2022 (b, d, f) in the medium gap (a–b), in the small gap (c–d), and under the canopy (e–f).
Figure 8 shows that soil volumetric liquid water content (VWC) at 15 cm depth was higher under the canopy than in gaps for both years, except in spring and after two heavy ROS events that occurred early in W20–21. Soil profile characterization that was performed in a small gap and under the canopy during the summer of 2020 showed different porosity values in the topmost 30 cm of soil (Fig. S2), which could explain the differences in VWC over a short distance at our study site. On 10 April 2021 (Fig. 8a), the increase in VWC was sharp and sudden in both gaps, while it was more gradual under the canopy. A data acquisition error occurred at the canopy station in April and May 2022 (Fig. 8b), so we cannot compare the increase in 15 cm VWC under the canopy at the onset of snowmelt in W20–21 and W21–22. In the medium and small gaps, we observed a similar behaviour of the 15 cm VWC at the beginning of snowmelt in 2022.
3.4 Vertical temperature gradient and snow properties
From November to January, the average was similar at each site and year, except under the canopy where the gradient was much larger during the warm year (Fig. 9). In February and March of the low-snow and warm winter, remained within or above the transition zone from equilibrium to kinetic crystal growth (Colbeck, 1983). In contrast, in February of the reference winter, the decrease of was more intense, and we observed a drop of below 10 °C m−1 in gaps. was also higher under the canopy than in gaps, in particular before 30 February, where the difference between canopy and gaps is much stronger.
Figure 10 presents the comparison of snow stratigraphy, density, SSA, and permeability between both years for gaps and under the canopy as obtained from snow pit observations between 9 and 11 March both years. These snow pit dates are convenient to present as they are similar in both years and correspond to a snowpack under dry snow conditions and well into the snow accumulation period. Observations from the other snow pits are presented in the Supplement (Figs. S9–S12).
At all sites, the top of the faceted crystals (FC) layer rises higher in the snowpack in the warm and low-snow year than during the reference year. In winter 2020–2021, this height includes FC and depth hoar (DH), as well as a thick layer of melt–freeze polycrystals (MFpc) resulting from the December 2020 ROS. In this basal layer, we also observed FC and DH, but these are secondary to clusters of polycrystals. As a result, we observed fewer rounded grains (RGs) in W20–21 than in W21–22. In both years, the combination of FC and DH layers was proportionally thicker under the canopy than in the gaps, and the thickness of the DH was noticeably higher under the canopy. Overall, the level of faceting is greatest in the snowpack under the canopy during the warm and low-snow year.
Snow density was lower in W20–21 than in the reference winter (257 versus 276 kg m−3 on average). In general, the density profiles showed values increasing with depth and were lower under the canopy than in gaps in both winters. Kruskal–Wallis tests performed on density measurements showed that the density difference between both winters at all sites was significant, as well as the canopy minus gaps density difference in both winters (p value < 0.05).
The vertical profile of SSA followed the expected general shape, with higher values near the surface (fresh snow) and lower values deeper (FC and DH). In the bottom 25 % of the snowpack, there was no significant difference in SSA between both winters (p value < 0.05). This may be due to the ice and melt–freeze layer SSA measurement technique that was improved from W20–21 to W21–22. Removing the ice and melt–freeze layers from the analysis leads to a significantly greater SSA in W21–22, coherent with a lower temperature gradient. At a height of 0.25 to 0.75 times the maximum height, where the transition from RG to FC occurred, the SSA was 19 % lower during the low-snow winter than in the reference winter, which was statistically significant (p value < 0.05). As a result of a lower density and SSA, the snow permeability was 57 % higher in the warm and low-snow winter within the same height range. This difference between both years was also statistically significant, as demonstrated by a Kruskal–Wallis test (p value < 0.05). Note that in both years the SSA and the snow permeability were lower and higher, respectively, under the canopy than in gaps for the middle half of the snowpack. This difference was also significant based on a Kruskal–Wallis test (p value < 0.05).
3.5 Spring streamflow
In 2021, air temperatures became positive in early April, allowing a decline in SWE. In 2022, this occurred 20 d later (Fig. 11a–b). The daily melt rate was much lower in the first winter than in the second, as already shown in Fig. 6. In April and May, rain-on-snow events accounted for 54 mm in 2021 compared to 202 mm the following year (Fig. 11c–d).
Consistent with our observations, the simulated subcanopy snowpack was much thinner at the onset of snowmelt in 2021 than in 2022 (Fig. 11e–f). The wetting front simulated by SNOWPACK in winter 2020–2021 took 57 h at an average rate of 30 cm d−1 to reach the ground in early April, while it took 149 h at 26 cm d−1 in early May in the following year. The model also simulated a thick basal ice layer in W20–21 and a thin ice layer deep in the snowpack in W21–22, which is also in line with snow pit observations (Fig. 10i).
Table 5Mean December–January–February temperature at the soil–snow interface and at 5, 10, and 20 cm below ground level and at the soil–snow interface in the medium gap, in the small gap, and under the canopy for winter 2020–2021 and the difference with winter 2021–2022.
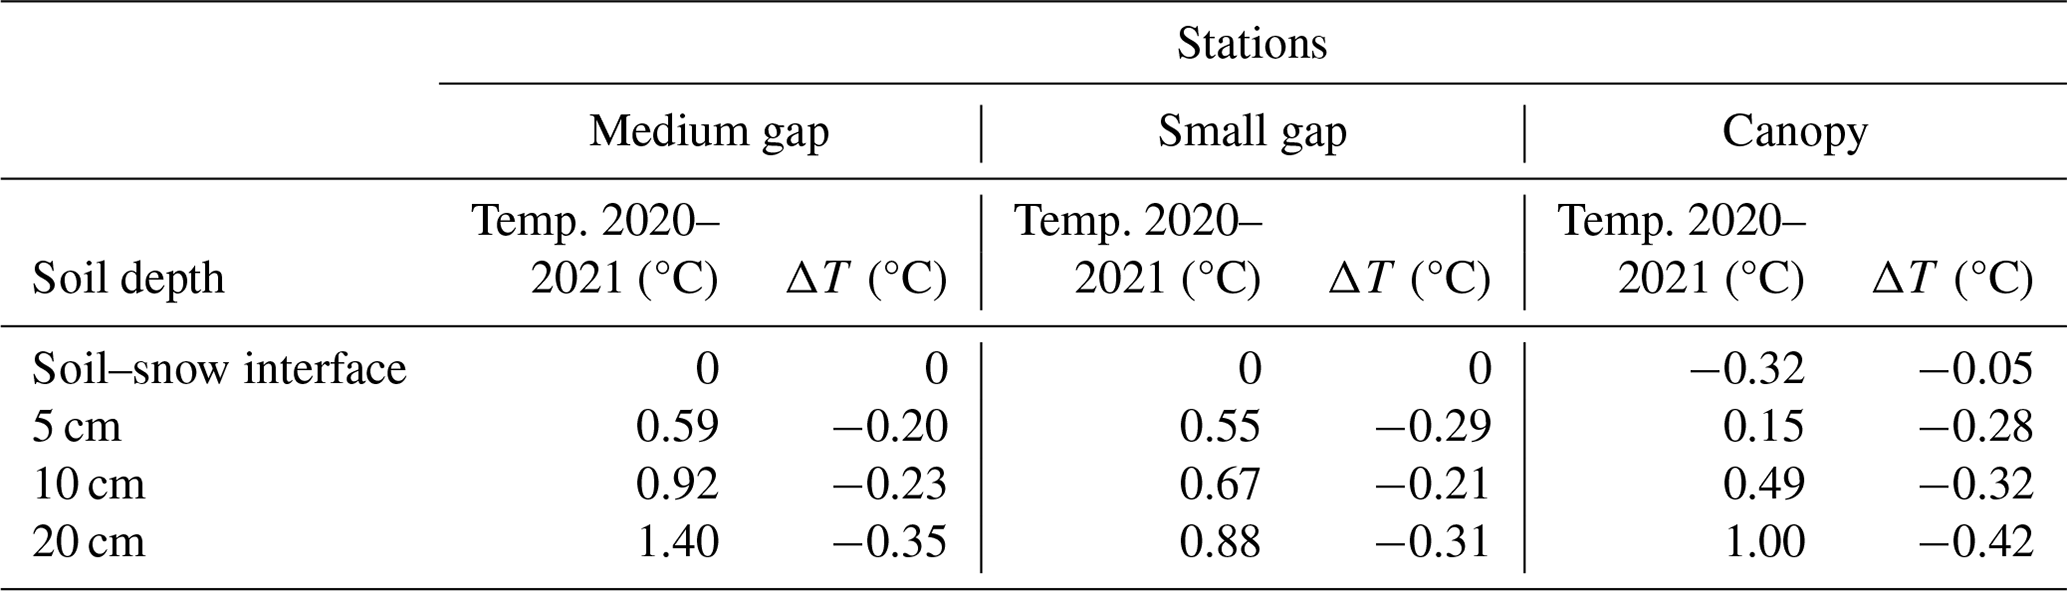
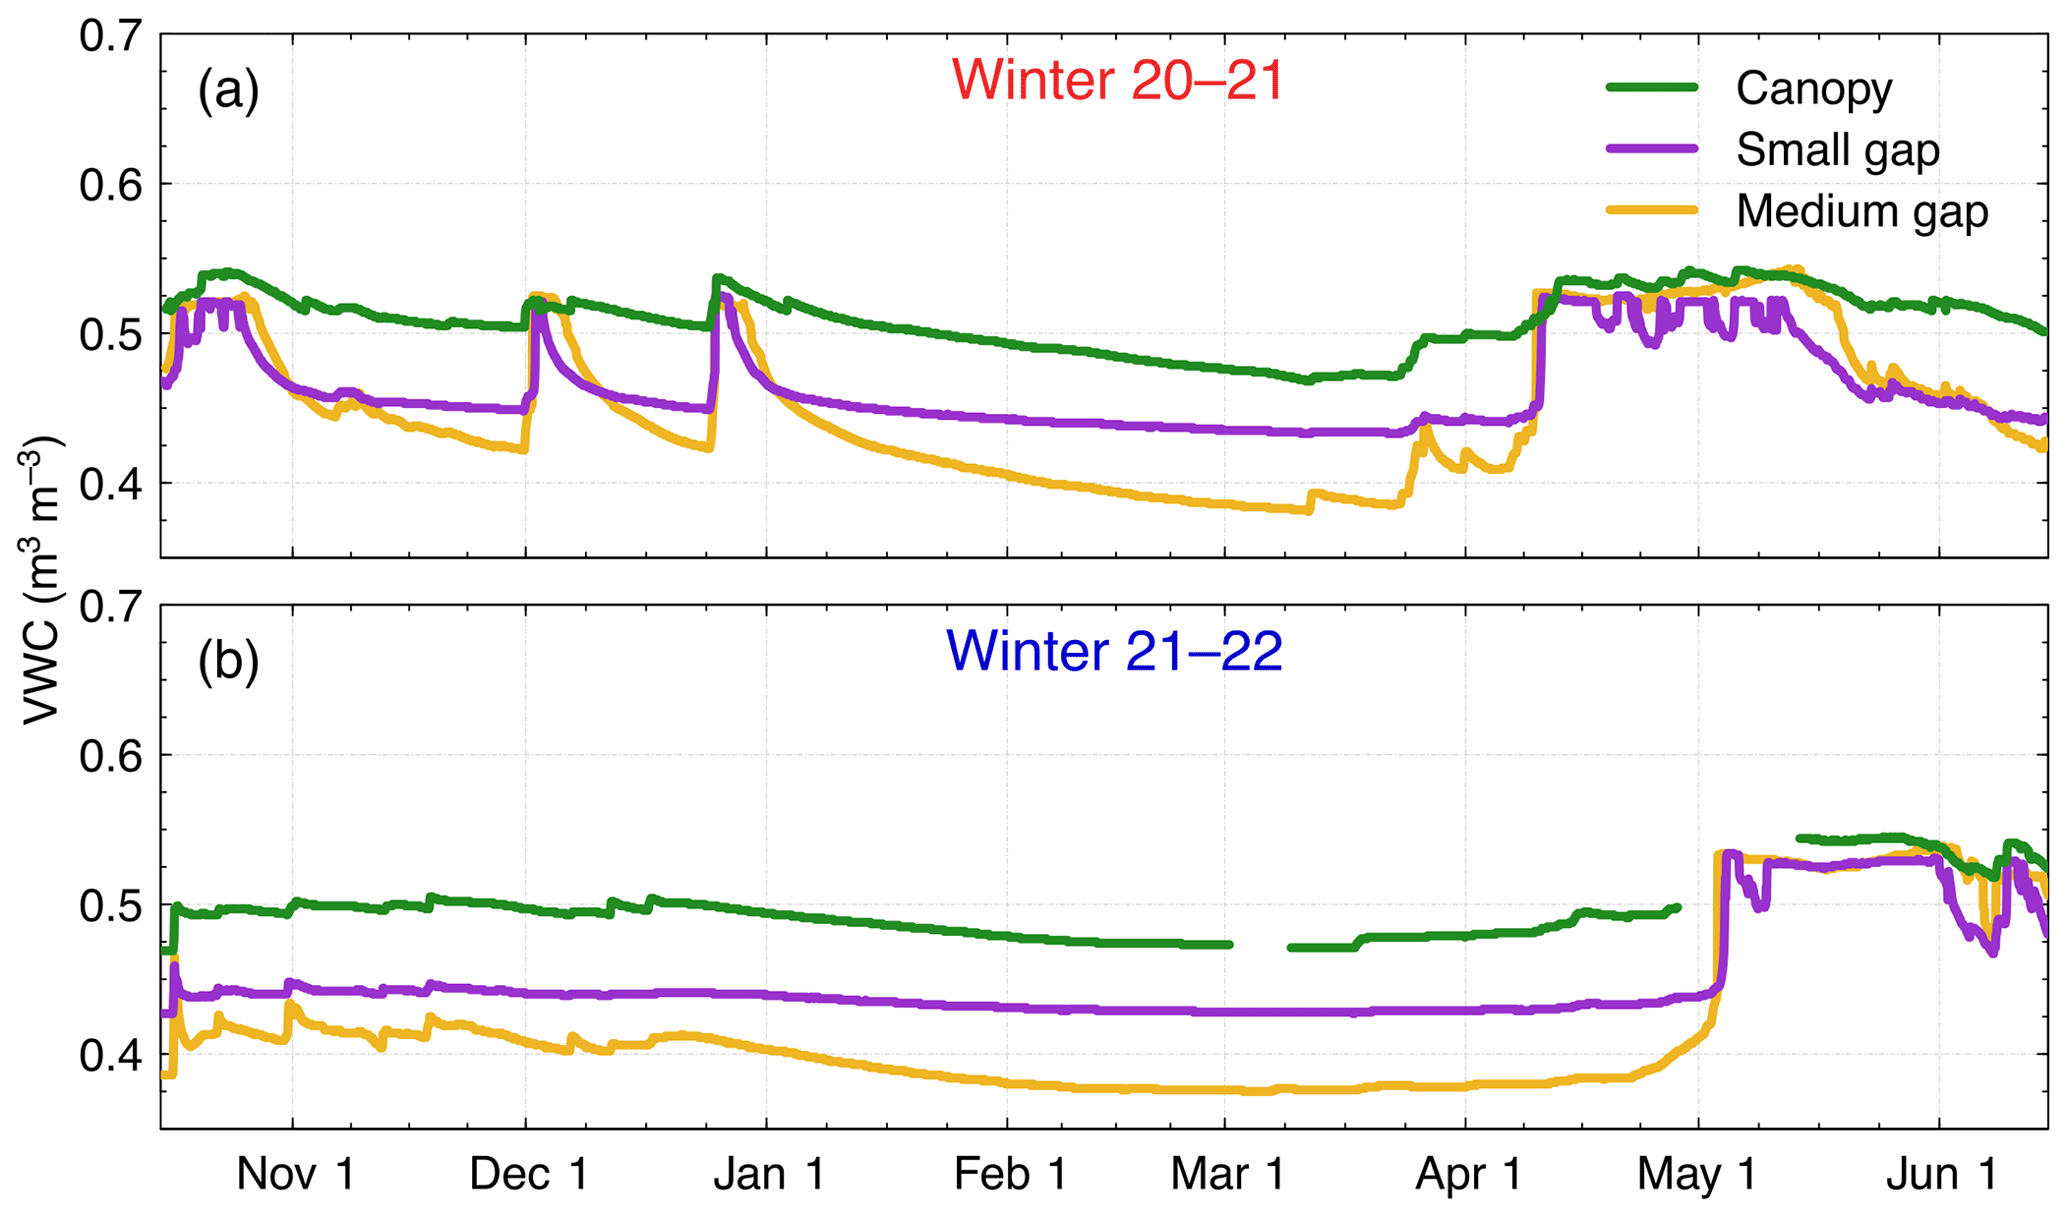
Figure 8Soil liquid water content (VWC) at 15 cm below the surface in the medium gap (yellow), in the small gap (purple), and under the canopy (green) in winters of 2020–2021 (a) and 2021–2022 (b).
Besides modeling a much earlier snowpack runoff, the model simulated spring runoff with quite different patterns in both years (Fig. 11g–h). In 2021, SNOWPACK generated intermittent runoff driven by several episodes of refreezing of the entire snow column, while in 2022 the simulations resulted in a continuous runoff throughout the snowmelt period, with peaks driven by liquid precipitation. The runoff simulations in both years are generally consistent with the observations of discharge at the outlet of BEREV-7A catchment. In 2021, the measured discharge was generally lower than the simulated runoff and slightly delayed. This was also the case in April 2022. However, during the snowmelt of 2022, the discharge measurements were similar to or greater than the simulated snowpack runoff in 2022, and the observed and simulated runoff peaks were synchronized.
Overall, low snowmelt and low liquid precipitation in the spring of the first year resulted in significantly lower spring streamflow runoff than in the second years. In April and May 2021, the average runoff was 3.1 mm d−1 compared to 8.5 mm d−1 in the following year. The spring runoff volume from the low-snow and warm winter was the lowest volume observed at the outlet of BEREV-7A for April and May since discharge monitoring began in 1968. In 2022, it was the sixth highest.
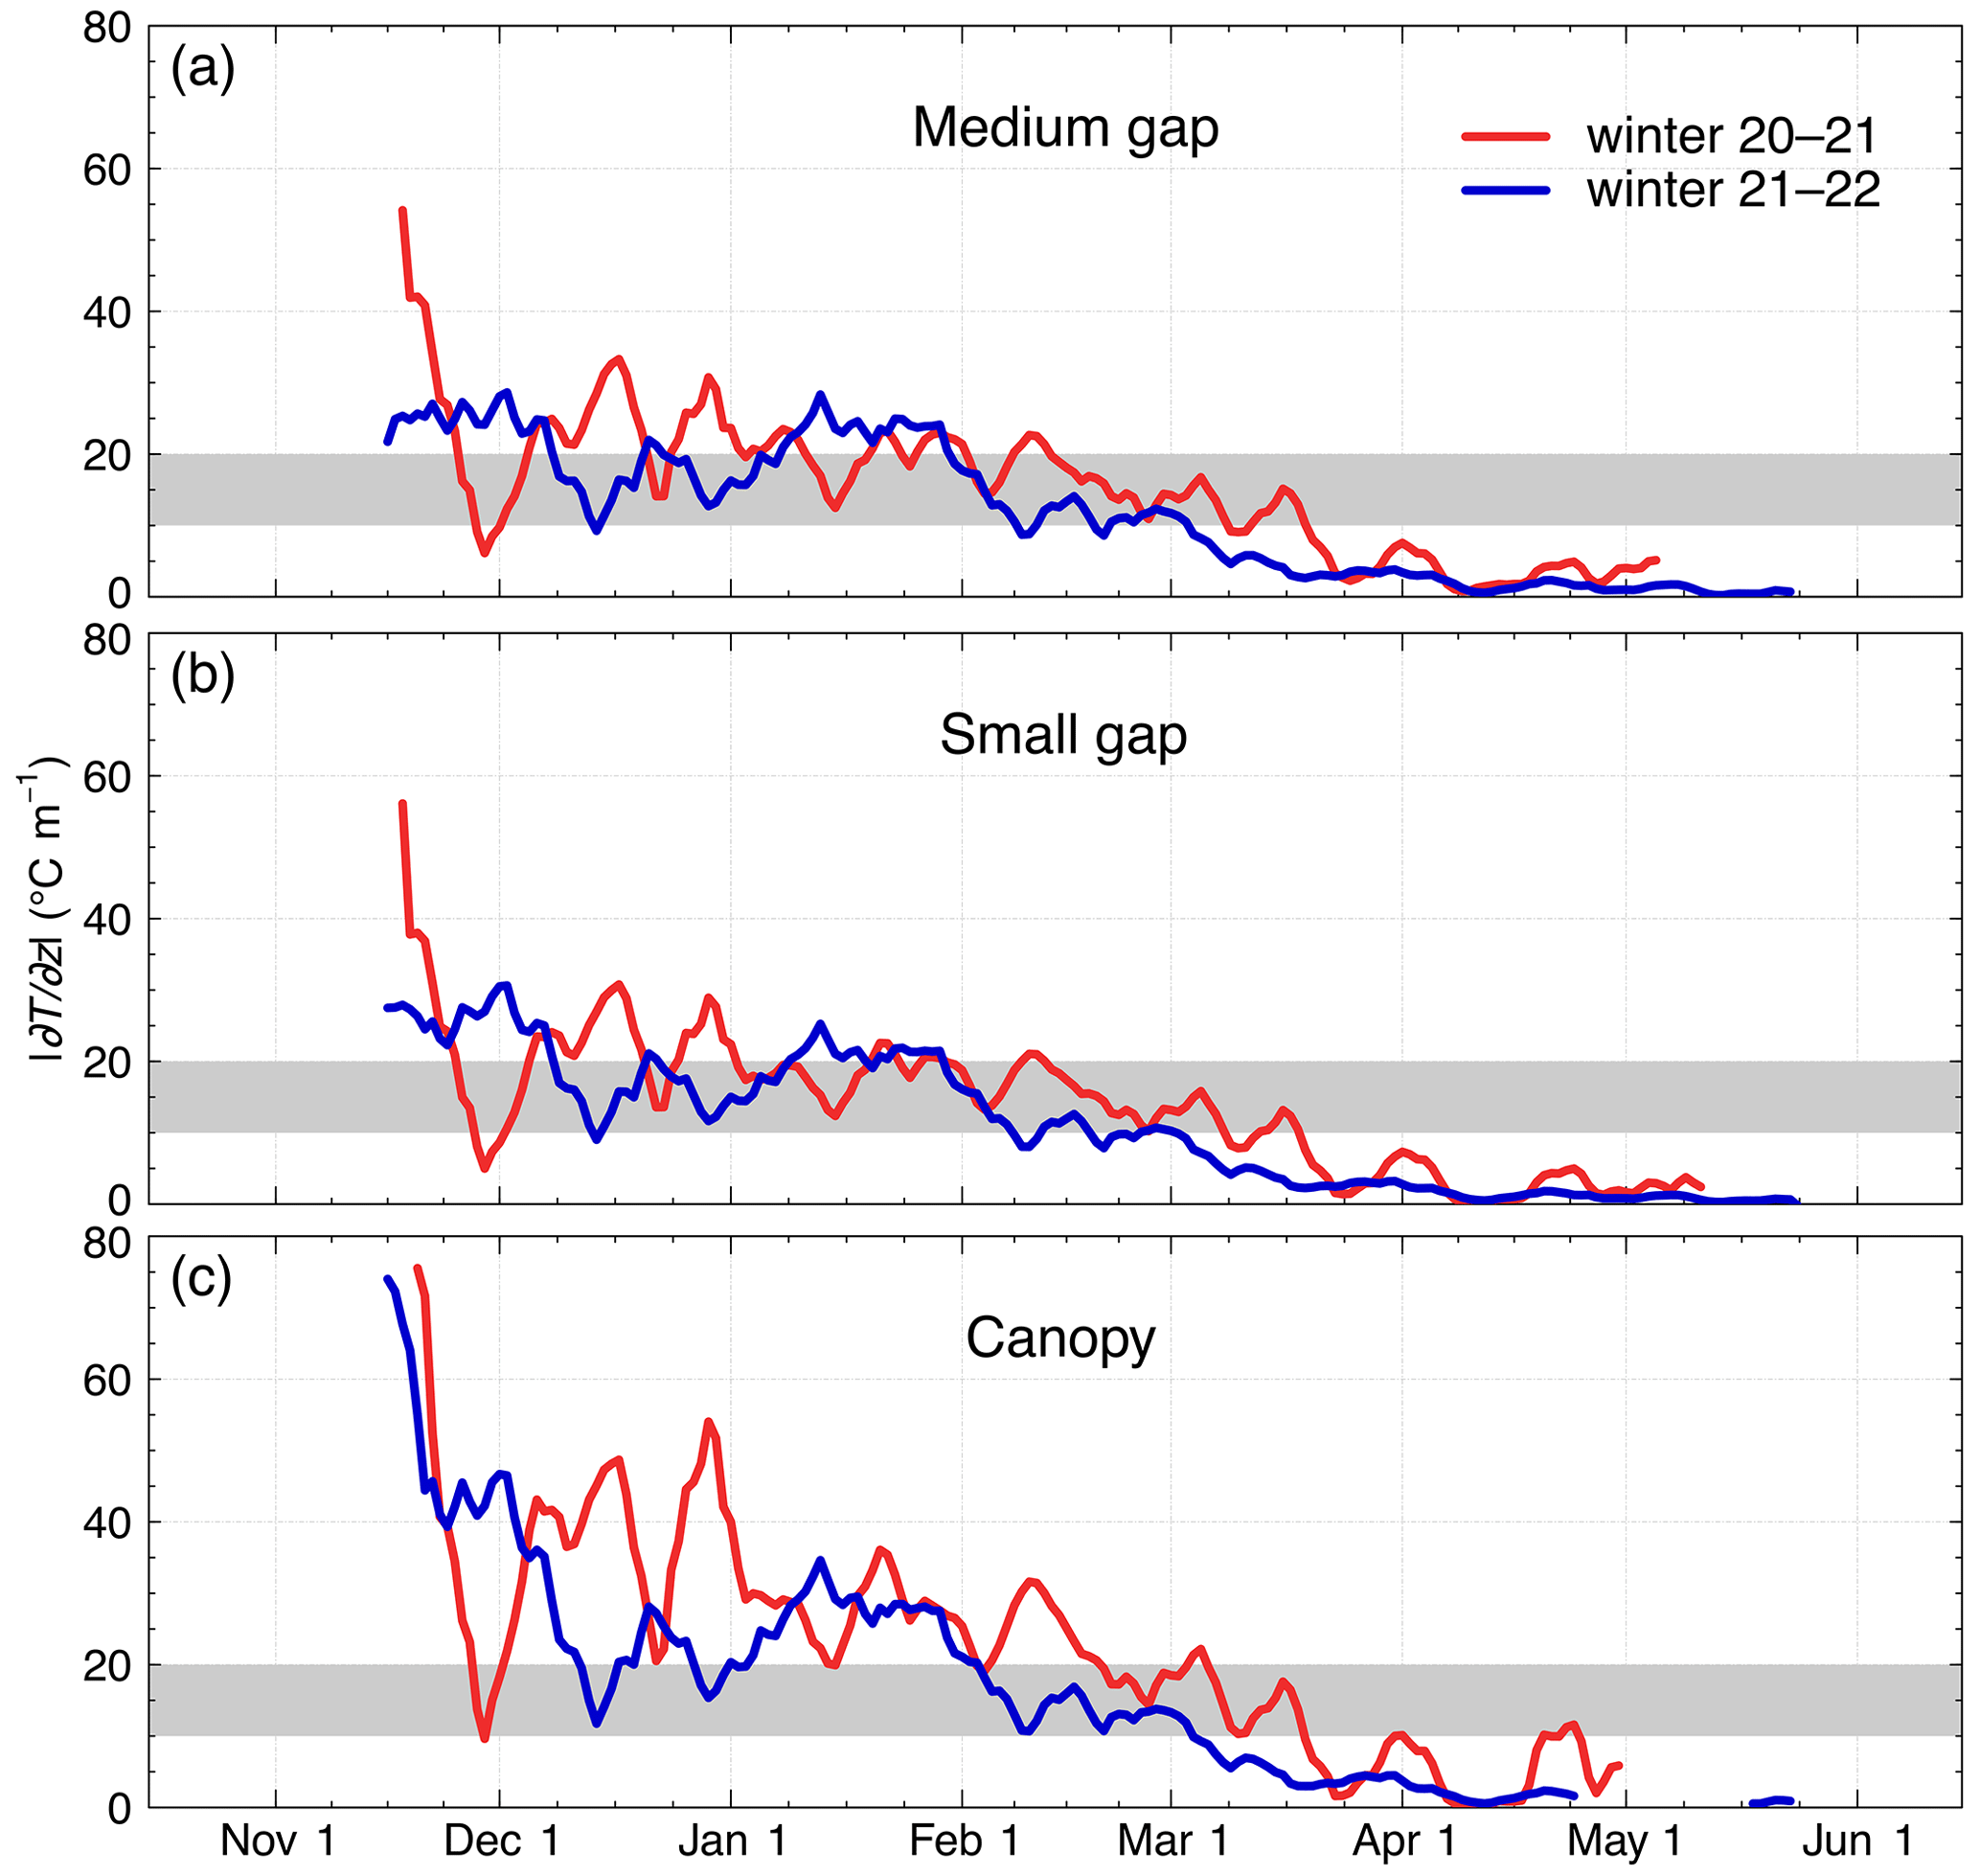
Figure 97 d rolling mean of the magnitude of the vertical temperature gradient () in winters 2020–2021 (red) and 2021–2022 (blue) in the medium gap (a), the small gap (b) and under the canopy (c). The grey band on each frame shows the transition zone from equilibrium to kinetic growth.
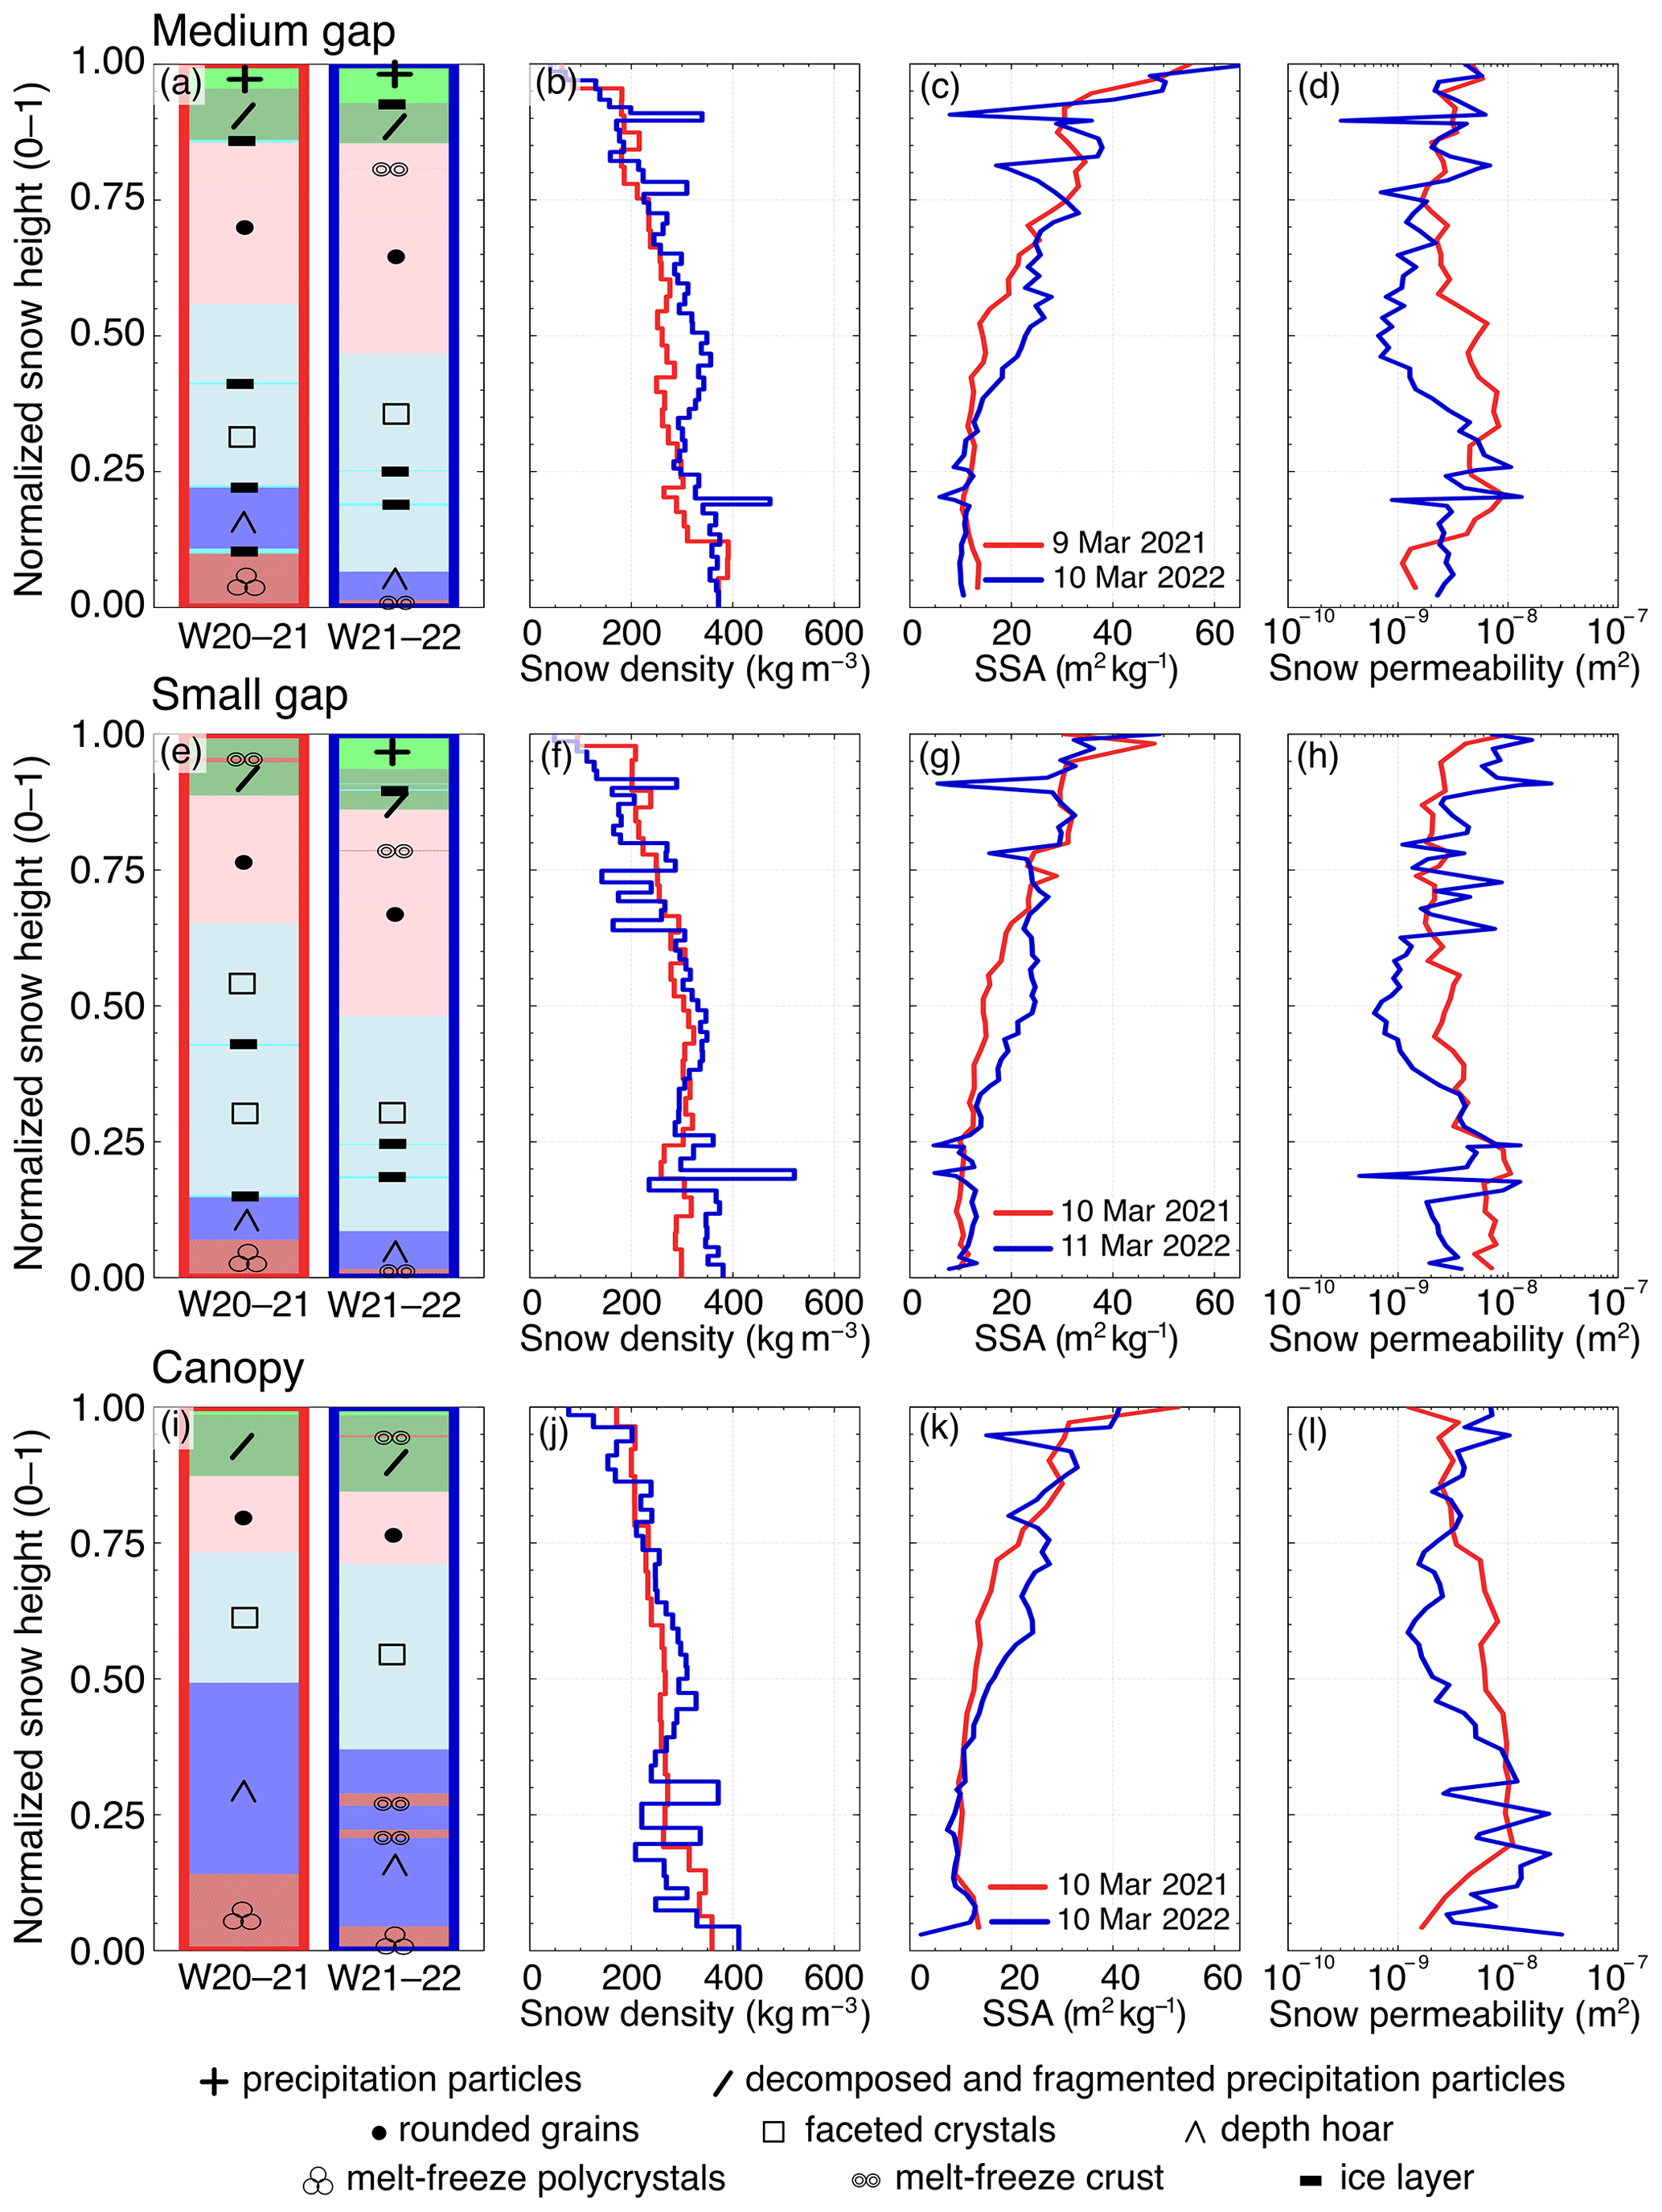
Figure 10Stratigraphy, snow density, SSA, and snow permeability profiles as measured in the medium gap (a–d), in the small gap (e–h), and under the canopy (i–l) on 9 and 10 March 2021 (red) and 10 and 11 March 2022 (blue).
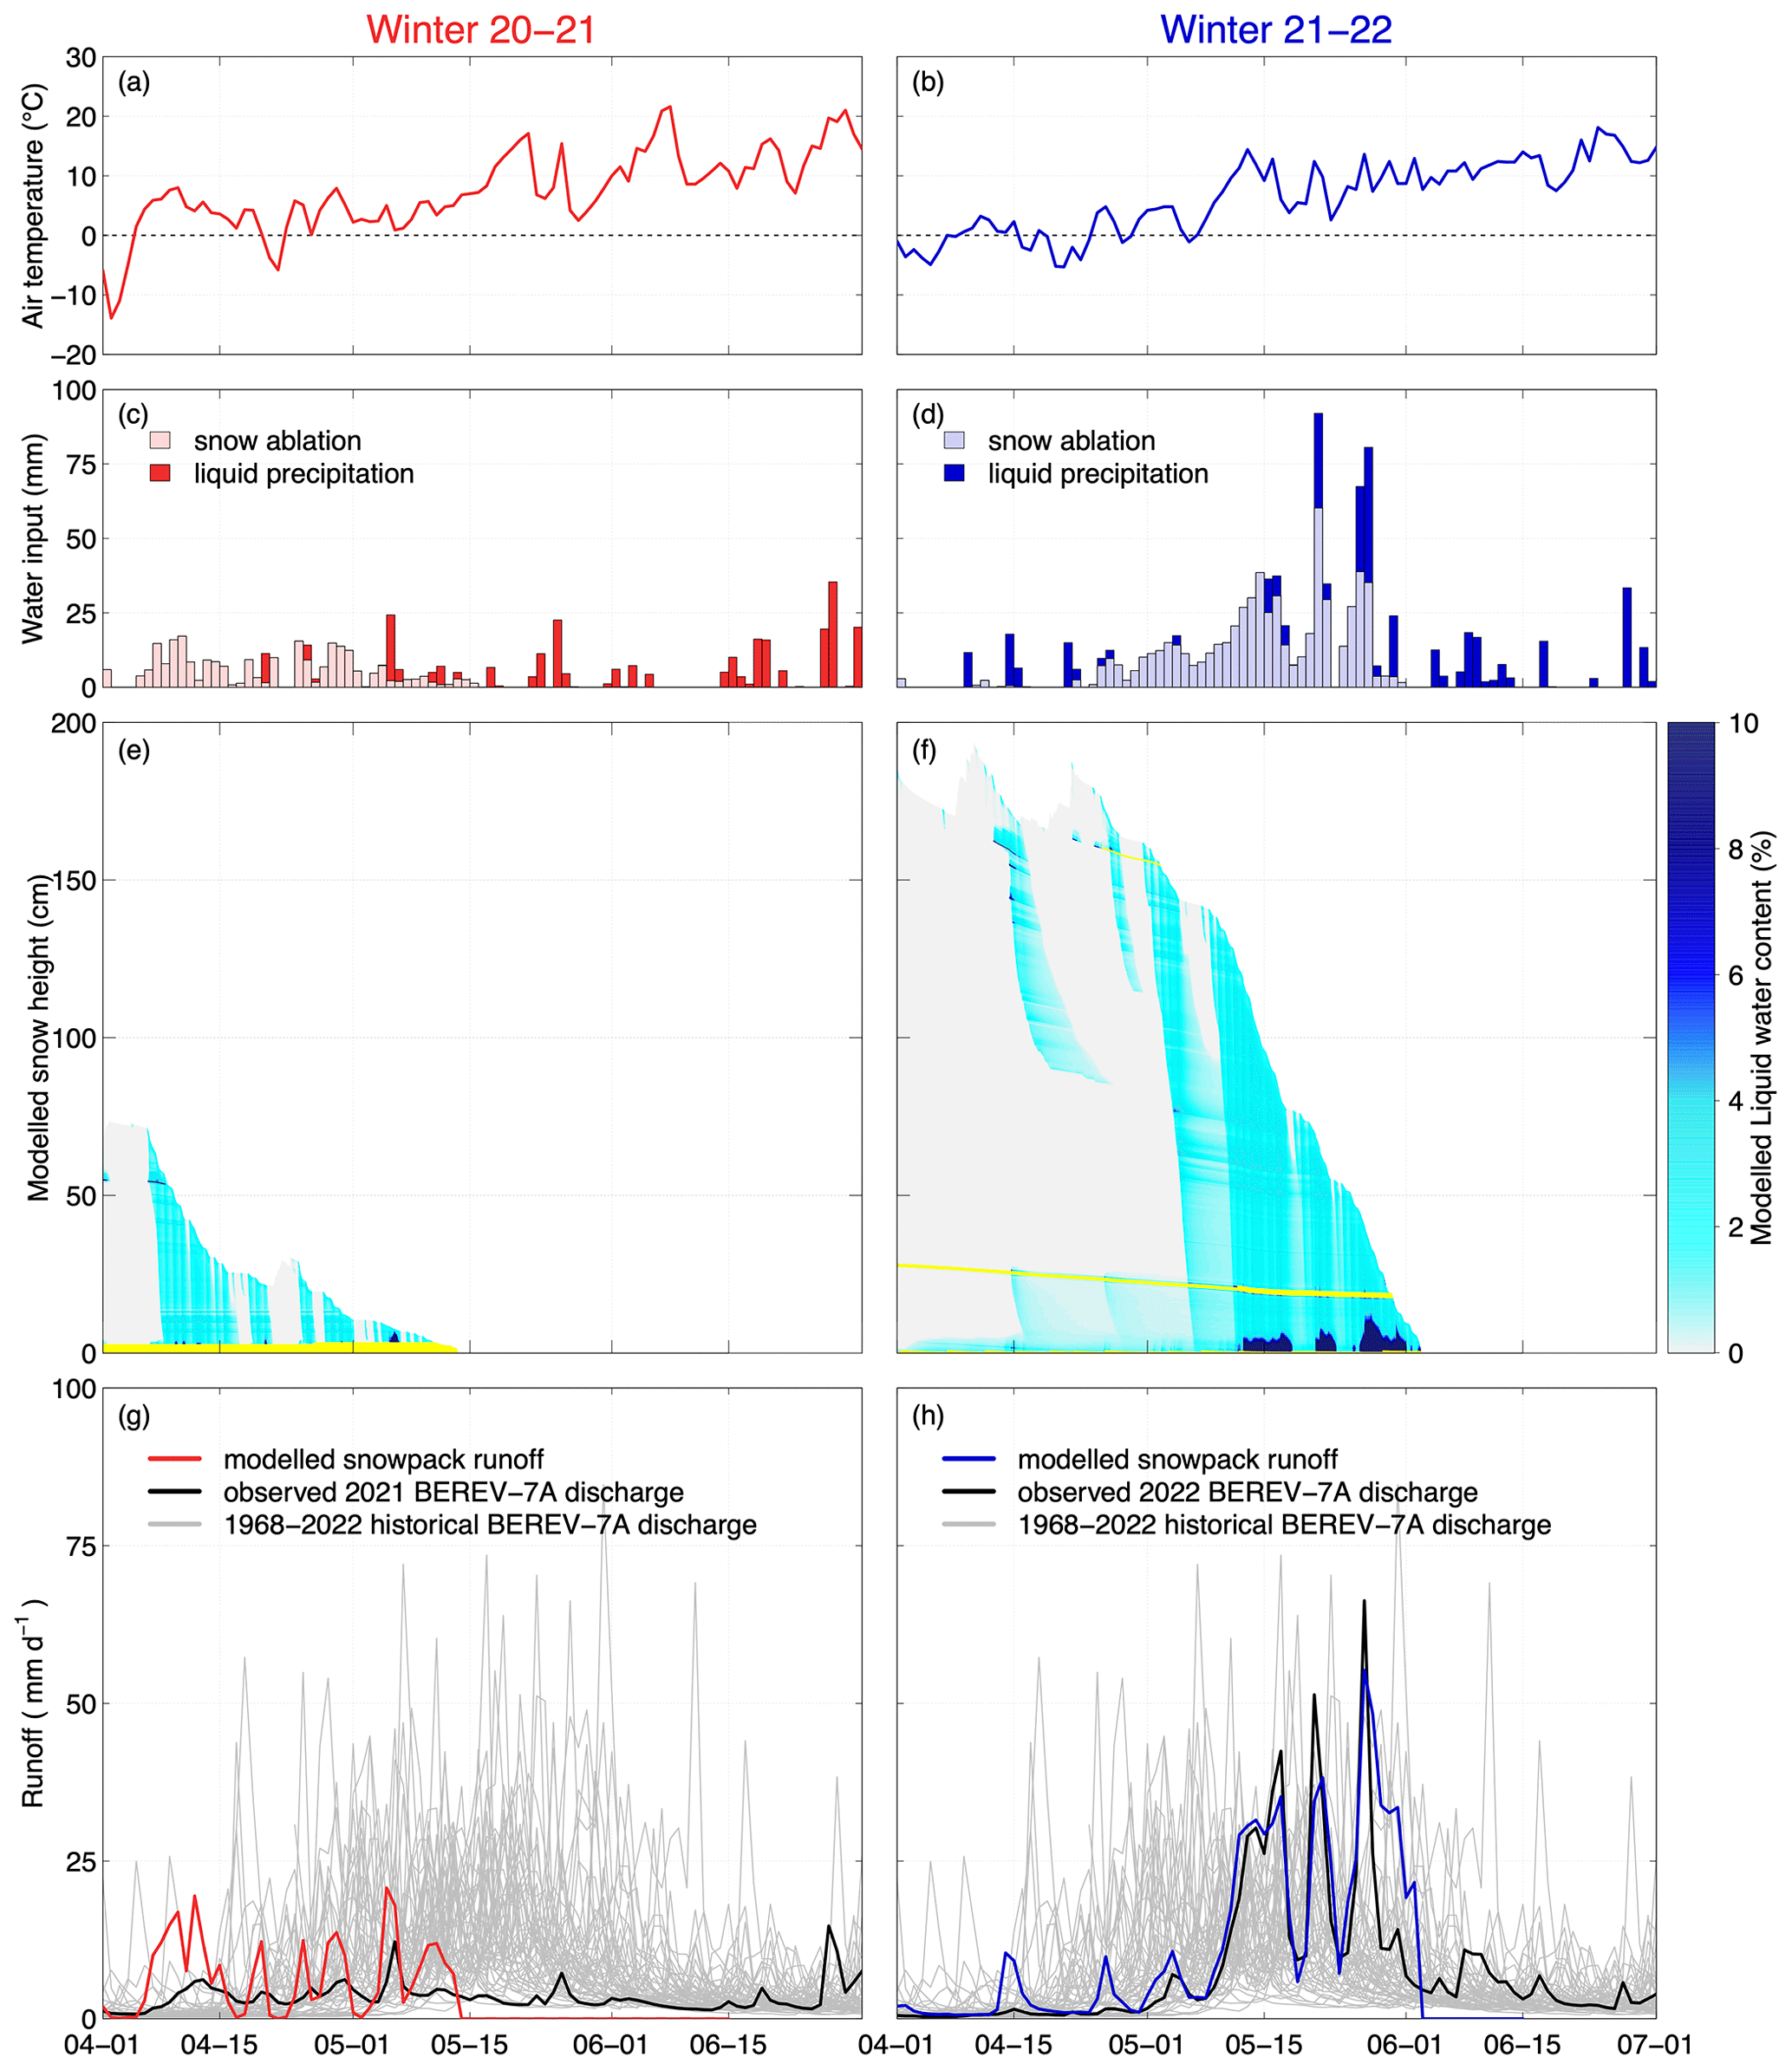
Figure 11Air temperature (a–b), daily difference in SWE, liquid precipitation (c–d), modeled snowpack liquid water content (e–f), simulated snowpack runoff, and observed streamflow discharge (g–h) for winter 20–21 (a, c, e, g) and 21–22 (b, d, f, h). Air temperature and liquid precipitation are measured at the NEIGE site, located some 4 km north of the main study site and about 200 m lower in elevation. SWE is averaged for the canopy (75 %), small gap (12.5 %), and medium gap (12.5 %) stations for representativeness of the study catchment. SNOWPACK simulations are representative of the subcanopy snowpack only. The streamflow discharge is monitored at the outlet of the BEREV-7A catchment. Ice layers are shown in yellow in (e) and (f), while the grey lines in (g) and (h) show historical measurements over the 1968–2022 period.
So far, our observations show that the low-snow and warm winter of 2020–2021 led to a slower melt, colder ground, enhanced gradient metamorphism, and ultimately to a reduced and less intense spring freshet than the reference winter of 2021–2022. We used the SNOWPACK model to support our observational results under the canopy regarding the formation of a basal ice layer, downward liquid water transport in the snowpack, and the resulting runoff in spring. Note that there are important nuances to consider with respect to forest gaps and subcanopy snowpacks. Figure 12 provides a conceptual summary of our results.
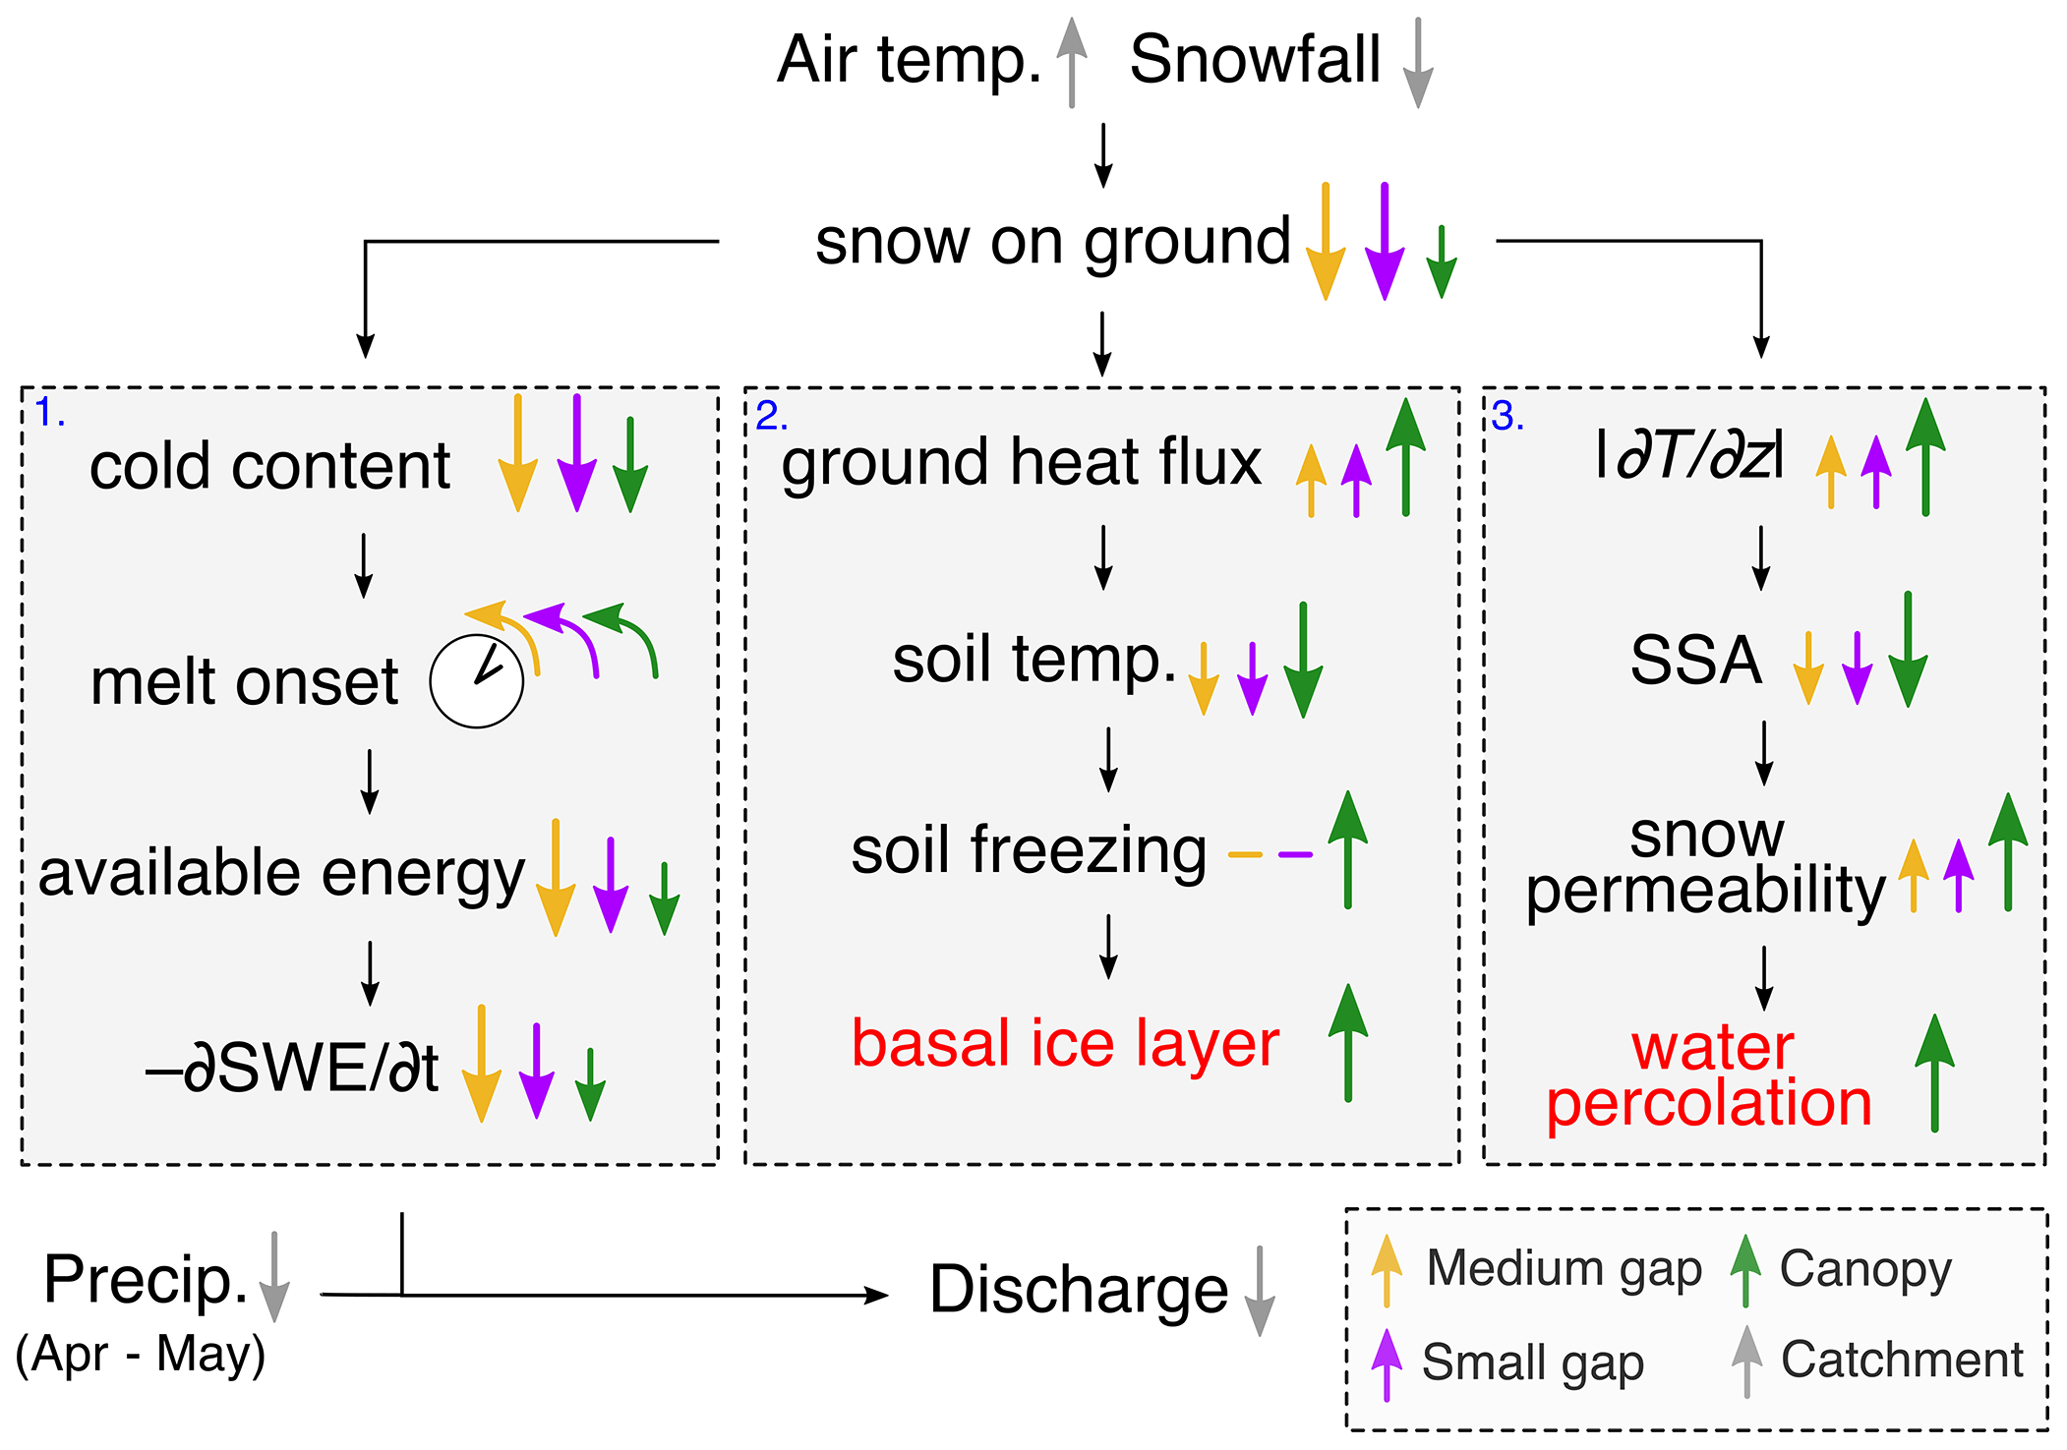
Figure 12Summary of the results. Upward arrows correspond to an increase and downward arrows to a decrease in the low-snow and warm winter with respect to the reference winter. The clock with counterclockwise arrows means that the process happens earlier. Results obtained from SNOWPACK simulations are in red. The yellow, purple, and green arrows indicate the effects in the medium gap, the small gap, and under the canopy, respectively. The size of the arrows indicates the magnitude of the process at one location relative to the others. Large grey arrows indicate an analysis made for the entire catchment. Small black arrows show the causal link between the observation processes. Grey boxes refer to processes treated in this study (1. snowmelt dynamics; 2. soil thermal regime; 3. snow metamorphism).
4.1 Low-snow and warm winter
In eastern Canada, as in other high-latitude and high-elevation regions, the snow cover extent is expected to decrease due to warmer winter temperatures (Guay et al., 2015; Pepin et al., 2015; Kunkel et al., 2016). This region is also expected to receive more winter precipitation in the future (Guay et al., 2015; Ouranos and MELCCFP, 2022). Therefore, the exceptionally warm and dry conditions observed at MF in W20–21 are not entirely consistent with the median climate projections for eastern Canada. However, these conditions did result in a snowpack that melted out 23 d earlier and in a maximum snow height that was 36 % lower than the 1982–2022 reference period (Table 4). Based on these low snow accumulation conditions, the winter of 2020–2021 is representative of what can be expected in eastern Canada with climate change even though the expected more abundant liquid precipitation may lead to snowpack modifications more significant than observed in W20–21.
Another feature of global warming in eastern Canada is the projected increase in the occurrence and intensity of ROS events (Il Jeong and Sushama, 2018), which has already been observed in other snow-dominated regions of the Northern Hemisphere (McCabe et al., 2007; Pall et al., 2019; Hotovy et al., 2023). The two ROS events observed at the beginning of 2020–2021 were intense, with 44 and 106 mm of liquid precipitation in less than 36 h each time. These two events reduced the snow cover thickness (Fig. 3a, c, e) and caused a large increase in streamflow discharge. However, overall, we observed fewer ROS events than in the following year (8 versus 13), due to earlier meltout in 2020–2021 and dryer conditions in spring 2021.
4.2 Earlier and slower melt
During the low-snow and warm winter, snowpack QCC was lower than in the reference winter. This is partly explained by a thinner snowpack with lower density (Figs. 3 and 10b, f, j). Warmer upper snow layers in W20–21 also contributed to the lower QCC. However, the lower snow layers were cooler in W20–21, which reduced the difference in QCC between the 2 years. Our observations are consistent with simulations by Jennings and Molotch (2020) for alpine and subalpine sites in the western USA, where QCC is expected to decrease with increasing winter temperatures. Interestingly, the subcanopy snowpack had a larger QCC than in the forest gaps, despite being thinner and lighter. This would imply an enhanced outgoing heat flux under the canopy that would considerably cool down the snowpack compared to both gaps. However, as noted in Sect. 3.2, this explanation would contradict the warmer snow surface under the canopy in both years (Fig. 4). This behaviour is expected as radiative cooling in forests is more likely to take place at locations of higher sky-view fraction, such as gaps. This suggests a cold bias in the monitored temperature profile time series under the canopy which leads to an overestimation of the cold content. Time-lapse images taken at the canopy station indicate that the snowpack seemed to grow thicker under the ultrasonic sensor than at the thermistor array in both years, which could explain the discrepancy between Figs. 3e–f and 4.
Since the snowpack had a lower QCC in W20–21 in both the gaps and below the canopy, less energy was required to bring it to the melting point, so snowmelt started earlier, which is consistent with what is expected in warmer winters (Barnett et al., 2005; Loìpez-Moreno et al., 2013; Guay et al., 2015; Jennings and Molotch, 2020). An earlier melt onset implied that net radiation was lower in W20–21, explaining a lower melt rate than in the reference winter (Fig. 5), which is consistent with a lower melt rate in that year (Fig. 6). Although it was not measured in this study, sensible heat flux may have contributed to snowmelt in gaps and under the canopy. This should be addressed in future modeling studies despite challenges in simulating turbulent fluxes in discontinuous forests (Conway et al., 2018). The higher rate of melting in the gaps coincides with greater incoming solar radiation than under the canopy. In fact, solar radiation is known to be the main driver of melting in these environments (Malle et al., 2019; Lawler and Link, 2011; Ellis et al., 2011). However, with less snow accumulating under the canopy due to interception, the snowpack melted out earlier than in both gaps, in both years. Our results support conclusions from previous studies as canopy interception exerts the main control on snow accumulation patterns, whereas distribution of shortwave radiation is the main driver of ablation patterns (Lundquist et al., 2013; Mazzotti et al., 2023b; Dharmadasa et al., 2023). Overall, our results show that snowmelt dynamics are highly variable at the local scale in forests due to the discontinuous canopy structure. It underscores the importance of using high-resolution canopy structure mapping in snow models to accurately predict snowmelt in forests.
4.3 Increased frozen soil under the canopy
A thinner snowpack in the low-snow winter allows more heat loss from the ground to the atmosphere and, as such, a larger ground heat flux, which led to a cooler soil than for the reference winter (Fig. 7, Table 5). Under the canopy, this phenomenon was intensified as indicated by subzero temperatures in the top 5 cm of soil in both years. These observations are supported by a modeled basal ice layer in both years, the formation of which is favoured by a frozen soil (Albert and Hardy, 1993; Westermann et al., 2011). The thicker simulated ice layer in W20–21 is consistent with the enhanced soil freezing observed in that year. Overall, our results suggest that the heat loss was sufficient to favour soil freezing under the canopy but not in the forest gaps. The topsoil thermal conductivity was measured at 0.8 W m−1 K−1 in the summer 2021 at the canopy station (Fig. S2). Given that the temperature difference between depths of 5 and 20 cm in the soil varies between 0.8 and 1.2 °C, we can readily estimate from Fourier's law applied to the top 5 cm of soil (Eq. 5) that the average ground heat flux is 5.3 W m−2. This is lower than the estimated snow heat flux under the canopy (Fig. 7e–f), which explains why the topmost subcanopy soil layers froze in both years. These findings are in partial agreement with Stadler et al. (1996), who observed a cooler ground under the canopy, where less snow accumulates. However, the authors also observed ground freezing in a nearby gap. This could be explained by the much lower snow accumulation at their study site compared to what was observed in the MF in both years. Slater et al. (2017) assessed the influence of snow depth on the season-average temperature difference between the air and the soil. Based on data from numerous northern, arctic, and alpine sites, they concluded that beyond a mean snow depth of about 20 cm, air and soil temperatures were decoupled. Although that study did not include sites from eastern Canada, we chose to compare our results with the observations presented in Fig. 3 from their paper. Our mean snow depth, for both years and below canopy and in gaps, were all above 20 cm, and we indeed found very small variations in air–soil temperature differences. This supports our previous findings that the exceptional low-snow and warm conditions met in winter 2020–2021 had almost no effect on the thermal insulation between the soil and the air due to thickness and properties of the snow (Fig. 7, Table 5). The increased snow faceting in W20–21 may also have contributed to a more efficient insulation of the ground despite a thinner snow cover.
Figure 8 suggests that the soil has a similar pore space under the canopy and inside gaps, as it saturates at a volumetric water content (VWC) between 0.50 and 0.55 at all monitored sites. However, the seasonal low of VWC is at 0.38, 0.42, and 0.48 in the medium gap, the small gap, and under the canopy, respectively, suggesting a higher water retention under the canopy and therefore smaller pores than in the gaps. This implies less potential for water content to increase in response to snowmelt or a ROS event. The slower increase in VWC under the canopy at the onset of the 2021 snowmelt (Fig. 8a) also suggests that infiltration was limited but not completely restricted compared to what was observed in the gaps. Based on previous experiments in Montmorency Forest, Proulx and Stein (1997) concluded that ROS greater than 20 mm followed by a cold spell would cause macropores in the boreal soil to become ice-filled, limiting subsequent infiltration. According to this criterion, the two ROS events of December 2020 (42 and 105 mm) should have favoured the blockage of soil pores in W20–21. Overall, our results are in accordance with Demand et al. (2019), who observed a reduced infiltration into frozen soil compared with unfrozen but highly saturated soil during sprinkling experiments over a sandy loam in southern Germany.
4.4 Larger temperature gradients and snow permeability
Our observations show that a thinner snowpack in W20–21 reduced load compaction and therefore limited snow densification compared to W21–22. A thinner snowpack also led to higher vertical temperature gradients () in the low-snow and warm winter (Fig. 9), resulting in more pronounced faceting, lower SSA, and a higher permeability (Ks) than in W21–22 (Fig. 10). SNOWPACK simulations suggest that the enhanced gradient metamorphism in W20–21 resulted in a slightly faster water percolation in the snow cover. In terms of SSA, no significant difference was observed between the 2 years for the lowermost part of the snowpack, where we observed DH. This is because in both years was sufficient to favour DH development, and the SSA of DH remained always around 10 ± 2 m2 kg−1, regardless of its stage of development (Bouchard et al., 2022; Domine et al., 2018). In February and March, the was larger in W20–21 than for the same period the next year. This resulted in a faster development of FC and DH and to a lower SSA in the middle part of the snowpack. Since snow permeability is closely related to snow metamorphism and (Domine et al., 2013; Taillandier et al., 2007; Calonne et al., 2012), Ks shows a similar pattern to SSA in the snow profiles. When comparing the snowpack under the canopy to the one in both gaps, we observe that temperature gradient metamorphism was enhanced under the canopy, in line with observations from Bouchard et al. (2022). Interestingly, our field measurements in forest gaps and under a boreal canopy contradict Domine et al. (2007), who, based on general considerations, suggested a decrease in snow permeability with global warming mainly due to increased snow surface temperature. Our results suggest that if warmer winters lead to a large decrease in snowpack thickness, this could override the increase in surface temperature and lead to higher and permeability.
4.5 Meteorological conditions versus forest structure
A larger difference in Hs,max between the 2 years than between the sites suggests that weather conditions had a greater effect on the snow accumulation than forest structure. Lower snow accumulation at the onset of snowmelt in the warm year compensated for the much slower melt than in the reference year, so the difference in snowmelt duration between both years was less pronounced than the difference between the sites. Since weather conditions also controlled the onset of the melt period, as indicated by snowmelt starting on the same day at all sites in each year, we observed a meltout date difference that was much greater between years than between sites. Overall, this suggests that the meteorological forcing was more important in influencing snow accumulation and melt than the canopy structure.
One might also expect that the difference in soil temperature between years would be more pronounced than between sites, as a consequence of a greater difference in snow height. However, our results show the opposite. In fact, the evolution of the soil temperature followed a similar pattern in both years, with a slightly lower temperature in the warm year for a given depth. In contrast, the differences in soil temperature between gap and canopy sites were much more pronounced, in particular near the ground surface, with freezing observed only under the trees. This suggests that the forest structure had a greater influence on the soil thermal regime than the weather conditions at this study site during these 2 years.
A larger difference in between gaps and canopy sites than between W20–21 and W21–22 from November to January indicates that the canopy structure had a strong influence on the . However, the difference in between both years became more pronounced in February and March, which also suggests that the relative influence of weather conditions on the temperature gradient increases during winter. Since the differences in snow density, SSA, and Ks between gaps and canopy and between seasons were all significant, we cannot distinguish which factor (meteorological conditions and forest structure) dominates regarding the evolution of snow properties.
4.6 Reduced spring streamflow
Figure 11 clearly shows that the spring freshet was earlier and reduced in the low-snow and warm winter compared to the reference winter. Both modeling and observational results support that an earlier and slower melt exerted a major influence on the streamflow regime, which is consistent with the work of Musselman et al. (2017) in the western United States. A thinner snowpack in the warm year mainly explains why the wetting front in the SNOWPACK simulations reached the ground much faster than in the reference year. The modeled percolation rate was slightly higher in W20–21 than in W21–22, but this difference remains small compared to the difference in snowmelt timing between the 2 years. Also, the observed and simulated thicker basal ice formation in W20–21 did not result in a faster hydrological response at the outlet of the catchment, as might be expected.
The large difference in spring runoff between the 2 years can further be attributed to lower precipitation as ROS in the spring of the warm year. Indeed, ROS accumulation was nearly four times lower in W20–21 than in W21–22. This can be attributed to dryer conditions in spring (Fig. 2a) and also to a short-lived snowpack, limiting the exposure of the snowpack to rainfall in spring (Cohen et al., 2015). The delayed and lower discharge response to modeled snowpack runoff in W20–21 suggests that some of the meltwater and liquid precipitation infiltrated into an unsaturated soil and recharged the aquifer (Schilling et al., 2021). It is likely that this also happened in April of 2022, before snowmelt (Fig. 11h). In contrast, the higher discharge, which was also synchronized with snowpack runoff simulations, suggests that the soil was saturated and subsurface flow contributed to a greater streamflow discharge during the 2022 snowmelt. These contrasting results are not surprising given that the spring daily water input was often much higher in 2022 than in 2021. Overall, in light of our observations and SNOWPACK simulations, it appears that the effects of both soil freezing, and snow structure on the timing and amplitude of runoff are of secondary importance compared to the influence of an earlier and slower snowmelt and spring liquid precipitation.
4.7 Limitations and shortcomings
In this study, we examined snow accumulation and melt dynamics from highly detailed in situ measurements. However, our experimental setup lacked lysimetric measurements to quantify the effect of soil freezing and snowpack permeability on runoff. Although there are multiple challenges related to lysimeters (Kattelmann, 2000; Floyd and Weiler, 2008), we recommend using those in future studies for quantitative assessment of infiltration. In the absence of lysimetric measurements, soil moisture monitoring can provide information on the occurrence of infiltration. Therefore, we recommend monitoring soil VWC at multiple forest gaps and canopy locations in future studies to better understand soil infiltration dynamics in discontinuous boreal forests under a warming climate. Furthermore, a complete interpretation of soil liquid water content data would benefit from the knowledge of soil granulometry and hydraulic conductivity.
Although this observational and modeling study combines snow accumulation and melt dynamics, soil freezing and snow microstructure in one unique dataset representative of the humid boreal forest, the analysis itself remains a case study. Other specific characteristics of the study site such as the slope, the aspect, and the surrounding topography influence the formation and the ablation of the snowpack in forested environments (Lundquist and Flint, 2006; Ellis et al., 2013; Mazzotti et al., 2023b). To assess the impact of low-snow and warm winter conditions on snowpack dynamics at broad scales, these factors should be considered.
Although the SNOWPACK model allowed for a more thorough interpretation of the hydrological influence of snow properties, the simulations were limited to subcanopy locations. Coupling a multilayer snow model, such as SNOWPACK or Crocus (Vionnet et al., 2012), with a detailed representation of canopy structure, such as that found in FSM2 (Mazzotti et al., 2020), would be required to properly simulate snowpack evolution in forest gaps. Recent work by Mazzotti et al. (2023a) is promising in this regard.
4.8 Climatic, hydrological, and ecological implications
In the low-snow and warm winter, snowmelt started much earlier but occurred over a longer period at all sites, resulting in an earlier meltout compared to the reference winter. A shorter-lived snowpack in the boreal forest has climatic impacts, as the net shortwave radiation increases due to a reduction in surface albedo (Manninen and Stenberg, 2009), and this contributes to a positive feedback loop that enhances global warming (Thackeray and Fletcher, 2015). Moreover, a decrease in snow cover extent in the boreal forest may increase the risk of summer hydrological drought due to a lower groundwater recharge (Van Loon et al., 2015). Based on the definition of Van Loon et al. (2015), the conditions in spring 2021 (Fig. 11) have the characteristics of a snowmelt drought.
With increasing warming-induced ROS events, the formation of melt–freeze layers, as we observed at the base of the W20–21 snowpack and within the snowpack, are likely to become more common. These could alter liquid water pathways, favouring water ponding and lateral flow over percolation (Eiriksson et al., 2013; Paquotte and Baraer, 2022; Webb et al., 2018). In addition to altering downward liquid water transport through the snowpack, melt–freeze formations can limit soil–atmosphere gas exchange, promoting hypoxic conditions in subnivean environments (Crawford and Braendle, 1996). Melt–freeze formations also limit access to food and movement of subnivean mammals (Johnsen et al., 2017; Poirier et al., 2019) and restrict foraging by large herbivores (Hansen et al., 2011; Schmelzer et al., 2020). As we observed in December 2020, intense ROS events also trigger winter snowmelt. This promotes low-snow conditions that can intensify soil freezing, as observed under the canopy snowpack in W20–21. Deeper soil freezing in forests decreases microbial activity and soil respiration in winter, thus reducing soil nitrogen recycling (Patel et al., 2018; Yang et al., 2019). In turn, this favours carbon accumulation which offsets increased soil respiration in summer (Patel et al., 2018). In summary, it seems clear that changes in snowpack thickness and structure with climate warming have both hydrological and ecological implications in the boreal forest.
Using dedicated field observations, along with SNOWPACK simulations, we investigated the effects of a low-snow and warm winter on snow accumulation and melt dynamics, on soil thermal regime and moisture, and on snowpack physical properties under the canopy and inside two forest gaps in a humid boreal site of eastern Canada. More precisely, we focused on winter 2020–2021 (W20–21), which was exceptionally warm and dry, comparing it with a reference winter (W21–22) closer to climate normals. The experimental setup included snowpack and the soil thermal regime monitoring, along with monthly snow pit observations. Our results show that the snowpack was generally half as thick and started to melt earlier in the low-snow and warm winter compared to the reference winter. This increased soil freezing under the canopy but not in forest gaps, where the soil remained unfrozen, as for the reference winter. Although the snow surface was warmer in W20–21, the thinner snowpack led to an increase in the vertical temperature gradient, so kinetic growth was enhanced. This resulted in a higher snow permeability during the warm, low-snow year, particularly under the canopy. Although enhanced soil freezing and larger snow permeability, supported by simulations of a thicker basal ice layer and faster percolation, point toward faster runoff and larger peak flow, our results suggest that these are of secondary importance as low snow accumulation in winter, early snowmelt, and low spring rainfall in led to a significantly lower spring freshet in the warm year.
The conditions experienced in the winter of 2020–2021 at Montmorency Forest, such as warmer air, less snowfall, and a thinner snowpack, were exceptional compared to the past climatology. However, these conditions are likely to become more frequent in eastern Canada with climate change. Although this work is limited to a 2-year comparison within a small catchment, it highlights the many potential effects, all together, of a changing climate on snow hydrology in a discontinuous boreal forest through a unique set of highly detailed process-level observations. These are highly valuable for the snow science community as they will help improve existing modeling tools and develop new ones to address future challenges in snow hydrology.
SNOWPACK is a software published under the GNU LGPLv3 license by the WSL Institute for Snow and Avalanche Research SLF, Davos, Switzerland, at https://gitlabext.wsl.ch/snow-models/snowpack (WSL, 2024). Data from snow pit measurements and from the monitoring stations in the medium and small gaps and under the canopy are freely available at https://doi.org/10.5281/zenodo.8213204 (Bouchard et al., 2023).
The supplement related to this article is available online at: https://doi.org/10.5194/hess-28-2745-2024-supplement.
BB, DFN, and FD designed the study. BB and ET collected and treated field data. BB ran the simulations and conducted the analysis of the results with inputs from DFN, FD, FA, and TJ. BB wrote the manuscript, with feedback from all authors.
The contact author has declared that none of the authors has any competing interests.
Publisher's note: Copernicus Publications remains neutral with regard to jurisdictional claims made in the text, published maps, institutional affiliations, or any other geographical representation in this paper. While Copernicus Publications makes every effort to include appropriate place names, the final responsibility lies with the authors.
The authors thank the staff of Montmorency Forest for helping us logistically with field visits. We also thank Charles Villeneuve and Kino Leroux for preparing snowmobile trails before our visits. The authors also thank Éric Boucher, Christian Juneau, and Antoine Thiboult for helping in the deployment and the maintenance of the monitoring stations. We thank Pierre-Erik Isabelle for providing the radiation dataset. We finally thank all the people that accompanied Benjamin Bouchard and Étienne Tremblay in the field, especially the members of PÉGEAUX and the graduate students, post-doc, and research associates from the Hydrometeorology Lab at Laval University. We would finally like to thank two anonymous reviewers for their valuable comments and suggestions which helped improve the quality of the paper. The work of Benjamin Bouchard was funded by the Natural Sciences and Engineering Research Council (NSERC) and the Sentinel North program.
This research has been supported by the Environment and Climate Change Canada (grant nos. GCXE20M016 and GCXE22M013) and the Canadian Network for Research and Innovation in Machining Technology, Natural Sciences and Engineering Research Council of Canada (grant no. ALLRP549108-19).
This paper was edited by Markus Hrachowitz and reviewed by two anonymous referees.
Albert, M. and Hardy, J.: Snowpack stratigraphy evolution at forested and open sites, in: Proceedings of the 50th Annual Eastern Snow Conference, Quebec City, Canada, 1993, 205–212, 8–10 June, 1993.
Albert, M. R. and Perron, F. E.: Ice layer and surface crust permeability in a seasonal snow pack, Hydrol. Process., 14, 3207–3214, https://doi.org/10.1002/1099-1085(20001230)14:18<3207::AID-HYP196>3.0.CO;2-C, 2000.
Barnett, T. P., Adam, J. C., and Lettenmaier, D. P.: Potential impacts of a warming climate on water availability in snow-dominated regions, Nature, 438, 303–309, https://doi.org/10.1038/nature04141, 2005.
Barnhart, T. B., Molotch, N. P., Livneh, B., Harpold, A. A., Knowles, J. F., and Schneider, D.: Snowmelt rate dictates streamflow, Geophys. Res. Lett., 43, 8006–8016, https://doi.org/10.1002/2016GL069690, 2016.
Berghuijs, W., Woods, R., and Hrachowitz, M.: A precipitation shift from snow towards rain leads to a decrease in streamflow, Nat. Clim. Change, 4, 583–586, https://doi.org/10.1038/nclimate2246, 2014.
Bouchard, B., Nadeau, D. F., and Domine, F.: Comparison of snowpack structure in gaps and under the canopy in a humid boreal forest, Hydrol. Process., 36, 1–14, https://doi.org/10.1002/hyp.14681, 2022.
Bouchard, B., Nadeau, D. F., Domine, F., Anctil, F., and Jonas, T.: Dataset from “How does a warm and low-snow winter impact the snow cover dynamics in a humid and discontinuous boreal forest? Insights from observations and modeling in eastern Canada”, Zenodo [data set], https://doi.org/10.5281/zenodo.8213204, 2023.
Bouchard, B., Nadeau, D. F., Domine, F., Wever, N., Michel, A., Lehning, M., and Isabelle, P.-E.: Impact of intercepted and sub-canopy snow microstructure on snowpack response to rain-on-snow events under a boreal canopy, The Cryosphere, 18, 2783–2807, https://doi.org/10.5194/tc-18-2783-2024, 2024.
Brundl, M., Schneebeli, M., and Fluhler, H.: Routing of canopy drip in the snowpack below a spruce crown, Hydrol. Process., 13, 49–58, https://doi.org/10.1002/(SICI)1099-1085(199901)13:1<49::AID-HYP700>3.0.CO;2-L, 1999.
Calonne, N., Geindreau, C., Flin, F., Morin, S., Lesaffre, B., Rolland du Roscoat, S., and Charrier, P.: 3-D image-based numerical computations of snow permeability: links to specific surface area, density, and microstructural anisotropy, The Cryosphere, 6, 939–951, https://doi.org/10.5194/tc-6-939-2012, 2012.
Choquette, Y., Ducharme, P., and Rogoza, J.: CS725, an accurate sensor for the snow water equivalent and soil moisture measurements, in: Proceedings of the International Snow Science Workshop, Grenoble, France, 2013, 931–936, 7–11 Octobre 2013.
Climate Data for a Resilient Canada: https://climatedata.ca/ (last access: 19 November 2023), 2023.
Cohen, J., Ye, H., and Jones, J.: Trends and variability in rain-on-snow events, Geophys. Res. Lett., 42, 7115–7122, https://doi.org/10.1002/2015GL065320, 2015.
Colbeck, S. C.: Theory of metamorphism of dry snow, J. Geophys. Res.-Oceans, 88, 5475–5482, https://doi.org/10.1029/jc088ic09p05475, 1983.
Conger, S. M. and McClung, D. M.: Comparison of density cutters for snow profile observations, J. Glaciol., 55, 163–169, https://doi.org/10.3189/002214309788609038, 2009.
Conway, J. P., Pomeroy, J. W., Helgason, W. D., and Kinar, N. J.: Challenges in Modeling Turbulent Heat Fluxes to Snowpacks in Forest Clearings, J. Hydrometeorol., 19, 1599–1616, https://doi.org/10.1175/JHM-D-18-0050.1, 2018.
Crawford, R. M. M. and Braendle, R.: Oxygen deprivation stress in a changing environment, J. Exp. Bot, 47, 145–159, https://doi.org/10.1093/jxb/47.2.145, 1996.
D'Orangeville, L., Duchesne, L., Houle, D., Kneeshaw, D., Coteí, B., and Pederson, N.: Northeastern North America as a potential refugium for boreal forests in a warming climate, Science, 352, 1452–1455, https://doi.org/10.1126/science.aaf4951, 2016.
Demand, D., Selker, J. S., and Weiler, M.: Influences of macropores on infiltration into seasonally frozen soil, Vadose Zone J., 18, 1–14, https://doi.org/10.2136/vzj2018.08.0147, 2019.
Dharmadasa, V., Kinnard, C., and Baraër, M.: Topographic and vegetation controls of the spatial distribution of snow depth in agro-forested environments by UAV lidar, The Cryosphere, 17, 1225–1246, https://doi.org/10.5194/tc-17-1225-2023, 2023.
Domine, F., Taillandier, A., Houdier, S., Parrenin, F., Simpson, W. R., and Douglas, T. A.: Interactions between snow metamorphism and climate: Physical and chemical aspects, in: Physics and Chemistry of Ice, edited by: Kuhs, W. F., Royal Society of Chemistry, Cambridge, UK, 27–46, https://doi.org/10.1039/9781847557773, 2007.
Domine, F., Morin, S., Brun, E., Lafaysse, M., and Carmagnola, C. M.: Seasonal evolution of snow permeability under equi-temperature and temperature-gradient conditions, The Cryosphere, 7, 1915–1929, https://doi.org/10.5194/tc-7-1915-2013, 2013.
Domine, F., Barrere, M., Sarrazin, D., Morin, S., and Arnaud, L.: Automatic monitoring of the effective thermal conductivity of snow in a low-Arctic shrub tundra, The Cryosphere, 9, 1265–1276, https://doi.org/10.5194/tc-9-1265-2015, 2015.
Domine, F., Belke-Brea, M., Barrere, M., Sarrazin, D., Poirier, M., and Arnaud, L.: Soil moisture, wind speed and depth hoar formation in the Arctic snowpack, J. Glaciol., 64, 990–1002, https://doi.org/10.1017/jog.2018.89, 2018.
Eiriksson, D., Whitson, M., Luce, C. H., Marshall, H. P., Bradford, J., Benner, S. G., Black, T., Hetrick, H., and McNamara, J. P.: An evaluation of the hydrologic relevance of lateral flow in snow at hillslope and catchment scales, Hydrol. Process., 27, 640–654, https://doi.org/10.1002/hyp.9666, 2013.
Ellis, C. R., Pomeroy, J. W., Essery, R. L. H., and Link, T. E.: Effects of needleleaf forest cover on radiation and snowmelt dynamics in the Canadian Rocky Mountains, Can. J. Forest Res., 41, 608–620, https://doi.org/10.1139/X10-227, 2011.
Ellis, C. R., Pomeroy, J. W., and Link, T. E.: Modeling increases in snowmelt yield and desynchronization resulting from forest gap-thinning treatments in a northern mountain headwater basin, Water Resour. Res., 49, 936–949, https://doi.org/10.1002/wrcr.20089, 2013.
Floyd, W. and Weiler, M.: Measuring snow accumulation and ablation dynamics during rain-on-snow events: innovative measurement techniques, Hydrol. Process., 22, 4805–4812, https://doi.org/10.1002/hyp.7142, 2008.
Fourteau, K., Domine, F., and Hagenmuller, P.: Impact of water vapor diffusion and latent heat on the effective thermal conductivity of snow, The Cryosphere, 15, 2739–2755, https://doi.org/10.5194/tc-15-2739-2021, 2021.
Fourteau, K., Hagenmuller, P., Roulle, J., and Domine, F.: On the use of heated needle probes for measuring snow thermal conductivity, J. Glaciol., 68, 705–719, https://doi.org/10.1017/jog.2021.127, 2022.
Furey, P. R., Kampf, S. K., Lanini, J. S., and Dozier, A. Q.: A stochastic conceptual modeling approach for examining the effects of climate change on streamflows in mountain basins, J. Hydrometeorol., 13, 837–855, https://doi.org/10.1175/JHM-D-11-037.1, 2012.
Gallet, J.-C., Domine, F., Zender, C. S., and Picard, G.: Measurement of the specific surface area of snow using infrared reflectance in an integrating sphere at 1310 and 1550 nm, The Cryosphere, 3, 167–182, https://doi.org/10.5194/tc-3-167-2009, 2009.
Gouttevin, I., Lehning, M., Jonas, T., Gustafsson, D., and Mölder, M.: A two-layer canopy model with thermal inertia for an improved snowpack energy balance below needleleaf forest (model SNOWPACK, version 3.2.1, revision 741), Geosci. Model Dev., 8, 2379–2398, https://doi.org/10.5194/gmd-8-2379-2015, 2015.
Grenfell, T. C. and Warren, S. G.: Representation of a nonspherical ice particle by a collection of independent spheres for scattering and absorption of radiation, J. Geophys. Res., 104, 31697–31709, https://doi.org/10.1029/1999JD900496, 1999.
Guay, C., Minville, M., and Braun, M.: A global portrait of hydrological changes at the 2050 horizon for the province of Québec, Can. Water Resour. J., 40, 285–302, https://doi.org/10.1080/07011784.2015.1043583, 2015.
Guillemette, F., Plamondon, A. P., Preìvost, M., and Leìvesque, D.: Rainfall generated stormflow response to clearcutting a boreal forest: peak flow comparison with 50 world-wide basin studies, J. Hydrol., 302, 137–153, https://doi.org/10.1016/j.jhydrol.2004.06.043, 2005.
Hadiwijaya, B., Pepin, S., Isabelle, P.-E., and Nadeau, D. F.: The Dynamics of Transpiration to Evapotranspiration Ratio under Wet and Dry Canopy Conditions in a Humid Boreal Forest, Forests-Sui., 11, 1–25, https://doi.org/10.3390/f11020237, 2020.
Hamlet, A. F., Mote, P. W., Clark, M. P., and Lettenmaier, D. P.: Effects of temperature and precipitation variability on snowpack trends in the Western United States, J. Climate, 18, 4545–4561, https://doi.org/10.1175/JCLI3538.1, 2005.
Hansen, B. B., Aanes, R., Herfindal, I., Kohler, J., and Sæther, B.-E.: Climate, icing, and wild arctic reindeer: past relationships and future prospects, Ecology, 92, 1917–1923, https://doi.org/10.1890/11-0095.1, 2011.
Hardy, J. P., Melloh, R., Robinson, P., and Jordan, R.: Incorporating effects of forest litter in a snow process model, Hydrol. Process., 14, 3227–3237, https://doi.org/10.1002/1099-1085(20001230)14:18<3227::AID-HYP198>3.0.CO;2-4, 2000.
Hardy, J. P., Groffman, P. M., Fitzhugh, R. D., Henry, K. S., Welman, A. T., Demers, J. D., Fahey, T. J., Driscoll, C. T., Tierney, G. L., and Nolan, S.: Snow depth manipulation and its influence on soil frost and water dynamics in a northern hardwood forest, Biogeochemistry, 56, 151–174, https://doi.org/10.1023/A:1013036803050, 2001.
Hotovy, O., Nedelcev, O., and Jenicek, M.: Changes in rain-on-snow events in mountain catchments in the rain–snow transition zone, Hydrolog. Sci. J., 68, 572–584, https://doi.org/10.1080/02626667.2023.2177544, 2023.
Il Jeong, D. and Sushama, L.: Rain-on-snow events over North America based on two Canadian regional climate models, Clim. Dynam., 50, 303–316, https://doi.org/10.1007/s00382-017-3609-x, 2018.
IPCC: Climate Change 2022: Impacts, Adaptation, and Vulnerability. Contribution of Working Group II to the 6th Assessment Report of the Intergovernmental Panel on Climate Change, Cambridge, UK, UK and New York, NY, USA, edited by: Pörtner, H.-O., Roberts, D. C., Tignor, M., Poloczanska, E. S., Mintenbeck, K., Alegría, A., Craig, M., Langsdorf, S., Löschke, S., Möller, V., Okem, A., and Rama, B., https://doi.org/10.1017/9781009325844, 2023.
Isabelle, P.-E., Nadeau, D. F., Asselin, M.-H., Harvey, R., Musselman, K. N., Rousseau, A. N., and Anctil, F.: Solar radiation transmittance of a boreal balsam fir canopy: Spatiotemporal variability and impacts on growing season hydrology, Agr. For. Meteorol., 263, 1–14, https://doi.org/10.1016/j.agrformet.2018.07.022, 2018.
Isabelle, P.-E., Nadeau, D. F., Anctil, F., Rousseau, A. N., Jutras, S., and Music, B.: Impacts of high precipitation on the energy and water budgets of a humid boreal forest, Agr. For. Meteorol., 280, https://doi.org/10.1016/j.agrformet.2019.107813, 2020.
Jennings, K. S., and Molotch, N. P.: Snowfall fraction, cold content, and energy balance changes drive differential response to simulated warming in an alpine and subalpine snowpack, Front. Earth Sci., 8, 1–16, https://doi.org/10.3389/feart.2020.00186, 2020.
Johnsen, K., Boonstra, R., Boutin, S., Devineau, O., Krebs, C. J., and Andreassen, H. P.: Surviving winter: Food, but not habitat structure, prevents crashes in cyclic vole populations, Ecol. Evol., 7, 115–124, https://doi.org/10.1002/ece3.2635, 2017.
Jonas, T., Webster, C., Mazzotti, G., and Malle, J.: HPEval: A canopy shortwave radiation transmission model using high-resolution hemispherical images, Agr. For. Meteorol., 284, 107903, https://doi.org/10.1016/j.agrformet.2020.107903, 2020.
Kattelmann, R.: Snowmelt lysimeters in the evaluation of snowmelt models, Ann. Glaciol., 31, 406–410, https://doi.org/10.3189/172756400781820048, 2000.
Kunkel, K. E., Robinson, D. A., Champion, S., Yin, X., Estilow, T., and Frankson, R. M.: Trends and extremes in Northern Hemisphere snow characteristics, Curr. Clim. Change Rep., 2, 65–73, https://doi.org/10.1007/s40641-016-0036-8, 2016.
Lackner, G., Domine, F., Nadeau, D. F., Parent, A.-C., Anctil, F., Lafaysse, M., and Dumont, M.: On the energy budget of a low-Arctic snowpack, The Cryosphere, 16, 127–142, https://doi.org/10.5194/tc-16-127-2022, 2022.
Laternser, M. and Schneebeli, M.: Long-term snow climate trends of the Swiss Alps (1931–99), Int. J. Climatol., 23, 733–750, https://doi.org/10.1002/joc.912, 2003.
Lawler, R. R. and Link, T. E.: Quantification of incoming all-wave radiation in discontinuous forest canopies with application to snowmelt prediction, Hydrol. Process., 25, 3322–3331, https://doi.org/10.1002/hyp.8150, 2011.
Lehning, M., Bartelt, P., Brown, B., Fierz, C., and Satyawali, P.: A physical SNOWPACK model for the Swiss avalanche warning: Part II. Snow microstructure, Cold Reg. Sci. Technol., 35, 147–167, https://doi.org/10.1016/S0165-232X(02)00073-3, 2002.
Loìpez-Moreno, J. I., Pomeroy, J. W., Revuelto, J., and Vicente-Serrano, S. M.: Response of snow processes to climate change: spatial variability in a small basin in the Spanish Pyrenees, Hydrol. Process., 27, 2637–2650, https://doi.org/10.1002/hyp.9408, 2013.
Luce, C. H. and Holden, Z. A.: Declining annual streamflow distributions in the Pacific Northwest United States, 1948–2006, Geophys. Res. Lett., 36, L16401, https://doi.org/10.1029/2009GL039407, 2009.
Lundquist, J. D. and Flint, A. L.: Onset of snowmelt and streamflow in 2004 in the Western United States: How shading may affect spring streamflow timing in a warmer world, J. Hydrometeorol., 7, 1199–1217, https://doi.org/10.1175/JHM539.1, 2006.
Lundquist, J. D., Dickerson-Lange, S. E., Lutz, J. A., and Cristea, N. C.: Lower forest density enhances snow retention in regions with warmer winters: A global framework developed from plot-scale observations and modeling, Water Resour. Res., 49, 6356–6370, https://doi.org/10.1002/wrcr.20504, 2013.
Malle, J., Rutter, N., Mazzotti, G., and Jonas, T.: Shading by trees and fractional snow cover control the subcanopy radiation budget, J. Geophys. Res.-Atmos., 124, 3195–3207, https://doi.org/10.1029/2018JD029908, 2019.
Manninen, T. and Stenberg, P.: Simulation of the effect of snow covered forest floor on the total forest albedo, Agr. For. Meteorol., 149, 303–319, https://doi.org/10.1016/j.agrformet.2008.08.016, 2009.
Mazzotti, G., Currier, W. R., Deems, J. S., Pflug, J. M., Lundquist, J. D., and Jonas, T.: Revisiting snow cover variability and canopy structure within forest stands: Insights from airborne LiDAR data, Water Resour. Res., 55, 6198–6216, https://doi.org/10.1029/2019WR024898, 2019.
Mazzotti, G., Essery, R., Webster, C., Malle, J., and Jonas, T.: Process-level evaluation of a hyper-resolution forest snow model using distributed multisensor observations, Water Resour. Res., 56, 1–25, https://doi.org/10.1029/2020WR027572, 2020.
Mazzotti, G., Nousu, J.-P., Vionnet, V., Jonas, T., Nheili, R., and Lafaysse, M.: Exploring the potential of forest snow modelling at the tree and snowpack layer scale, EGUsphere [preprint], https://doi.org/10.5194/egusphere-2023-2781, 2023a.
Mazzotti, G., Webster, C., Quéno, L., Cluzet, B., and Jonas, T.: Canopy structure, topography, and weather are equally important drivers of small-scale snow cover dynamics in sub-alpine forests, Hydrol. Earth Syst. Sci., 27, 2099–2121, https://doi.org/10.5194/hess-27-2099-2023, 2023b.
McCabe, G. J., Clark, M. P., and Hay, L. E.: Rain-on-snow events in the western United States, B. Am. Meteorol. Soc., 88, 319–328, https://doi.org/10.1175/BAMS-88-3-319, 2007.
Mellander, P.-E., Laudon, H., and Bishop, K.: Modelling variability of snow depths and soil temperatures in Scots pine stands, Agr. For. Meteorol., 133, 109–118, https://doi.org/10.1016/j.agrformet.2005.08.008, 2005.
Melloh, R. A., Hardy, J. P., Davis, R. E., and Robinson, P. B.: Spectral albedo/reflectance of littered forest snow during the melt season, Hydrol. Process., 15, 3409–3422, https://doi.org/10.1002/hyp.1043, 2001.
Molotch, N. P., Barnard, D. M., Burns, S. P., and Painter, T. H.: Measuring spatiotemporal variation in snow optical grain size under a subalpine forest canopy using contact spectroscopy, Water Resour. Res., 52, 7513–7522, https://doi.org/10.1002/2016WR018954, 2016.
Morin, S., Domine, F., Arnaud, L., and Picard, G.: In-situ monitoring of the time evolution of the effective thermal conductivity of snow, Cold Reg. Sci. Technol., 64, 73–80, https://doi.org/10.1016/j.coldregions.2010.02.008, 2010.
Musselman, K. N., Clark, M. P., Liu, C., Ikeda, K., and Rasmussen, R.: Slower snowmelt in a warmer world, Nat. Clim. Change, 7, 214–219, https://doi.org/10.1038/nclimate3225, 2017.
Ouranos and MELCCFP: Guide de l'atlas hydroclimatique du Québec méridional, Quebec City, Can, https://cehq.gouv.qc.ca/atlas-hydroclimatique/guide-atlas-hydroclimatique-2022.pdf (last access: 1 May 2023), 2022.
Pall, P., Tallaksen, L. M., and Stordal, F.: A Climatology of Rain-on-Snow Events for Norway, J. Climate, 32, 6995–7016, https://doi.org/10.1175/JCLI-D-18-0529.1, 2019.
Paquotte, A. and Baraer, M.: Hydrological behaviour of an ice-layered snowpack in a non-mountainous environment, Hydrol. Process., 36, 1–15, https://doi.org/10.1002/hyp.14433, 2022.
Parajuli, A., Nadeau, D. F., Anctil, F., Parent, A.-C., Bouchard, B., Girard, M., and Jutras, S.: Exploring the spatiotemporal variability of the snow water equivalent in a small boreal forest catchment through observation and modelling, Hydrol. Process., 34, 2628–2644, https://doi.org/10.1002/hyp.13756, 2020.
Patel, K. F., Tarariw, C., MacRae, J. D., Ohno, T., Nelson, S. J., and Fernandez, I. J.: Soil carbon and nitrogen responses to snow removal and concrete frost in a northern coniferous forest, Can. J. Soil Sci., 98, 436–447, https://doi.org/10.1139/cjss-2017-0132, 2018.
Pepin, N., Bradley, R. S., Diaz, H., Baraër, M., Caceres, E., Forsythe, N., Fowler, H., Greenwood, G., Hashmi, M., and Liu, X.: Elevation-dependent warming in mountain regions of the world, Nat. Clim. Change, 5, 424–430, https://doi.org/10.1038/nclimate2563, 2015.
Pierre, A., Jutras, S., Smith, C., Kochendorfer, J., Fortin, V., and Anctil, F.: Evaluation of catch efficiency transfer functions for unshielded and single-alter-shielded solid precipitation measurements, J. Atmos. Ocean Tech., 36, 865–881, https://doi.org/10.1175/JTECH-D-18-0112.1, 2019.
Poirier, M., Gauthier, G., and Domine, F.: What guides lemmings movements through the snowpack?, J. Mammal., 100, 1416–1426, https://doi.org/10.1093/jmammal/gyz129, 2019.
Pomeroy, J. W., Parviainen, J., Hedstrom, N., and Gray, D. M.: Coupled modelling of forest snow interception and sublimation, Hydrol. Process., 12, 2317–2337, https://doi.org/10.1002/(SICI)1099-1085(199812)12:15<2317::AID-HYP799>3.0.CO;2-X, 1998.
Pomeroy, J. W., Marks, D., Link, T., Ellis, C., Hardy, J., Rowlands, A., and Granger, R.: The impact of coniferous forest temperature on incoming longwave radiation to melting snow, Hydrol. Process., 23, 2513–2525, https://doi.org/10.1002/hyp.7325, 2009.
Price, D. T., R.I., A., Brown, K. J., Flannigan, M. D., Fleming, R. A., Hogg, E. H., Girardin, M. P., Lakusta, T., Johnston, M., McKenney, D. W., Pedlar, J. H., Stratton, T., Sturrock, R. N., Thompson, I. D., Trofymow, J. A., and Venier, L. A.: Anticipating the consequences of climate change for Canada's boreal forest ecosystems, Environ. Rev., 21, 322–365, https://doi.org/10.1139/er-2013-0042, 2013.
Proulx, S. and Stein, J.: Classification of meteorological conditions to assess the potential for concrete frost formation in boreal forest floors, Can. J. Forest Res., 27, 953–958, https://doi.org/10.1139/x96-217, 1997.
Scheffer, M., Hirota, M., Holmgren, M., Van Nes, E. H., and Chapin, F. S.: Thresholds for boreal biome transitions, P. Natl. Acad. Sci. USA, 109, 21384–21389, https://doi.org/10.1073/pnas.1219844110, 2012.
Schilling, O. S., Parajuli, A., Müller, T. U., Tremblay, Y., Brennwald, M. S., Nadeau, D. F., Jutras, S., Kipfer, R., and Therrien, R.: Quantifying groundwater recharge dynamics and unsaturated zone processes in snow-dominated catchments via on-site dissolved gas analysis, Water Resour. Res., 57, 1–24, https://doi.org/10.1029/2020WR028479, 2021.
Schmelzer, I., Lewis, K. P., Jacobs, J. D., and McCarthy, S. C.: Boreal caribou survival in a warming climate, Labrador, Canada 1996–2014, Glob. Ecol. Conser., 23, e010308, https://doi.org/10.1016/j.gecco.2020.e01038, 2020.
Shanley, J. B. and Chalmers, A.: The effect of frozen soil on snowmelt runoff at Sleepers River, Vermont, Hydrol. Process., 13, 1843–1857, https://doi.org/10.1002/(SICI)1099-1085(199909)13:12/13<1843::AID-HYP879>3.0.CO;2-G, 1999.
Sicart, J. E., Pomeroy, J. W., Essery, R. L. H., and Bewley, D.: Incoming longwave radiation to melting snow: observations, sensitivity and estimation in Northern environments, Hydrol. Process., 20, 3697–3708, https://doi.org/10.1002/hyp.6383, 2006.
Slater, A. G., Lawrence, D. M., and Koven, C. D.: Process-level model evaluation: a snow and heat transfer metric, The Cryosphere, 11, 989–996, https://doi.org/10.5194/tc-11-989-2017, 2017.
Stadler, D., Wunderli, H., Auckenthaler, A., Fluhler, H., and Brundl, M.: Measurement of frost-induced snowmelt runoff in a forest soil, Hydrol. Process., 10, 1293–1304, https://doi.org/10.1002/(SICI)1099-1085(199610)10:10<1293::AID-HYP461>3.0.CO;2-I, 1996.
Sun, N., Wigmosta, M., Zhou, T., Lundquist, J., Dickerson-Lange, S., and Cristea, N.: Evaluating the functionality and streamflow impacts of explicitly modelling forest-snow interactions and canopy gaps in a distributed hydrologic model, Hydrol. Process., 32, 2128–2140, https://doi.org/10.1002/hyp.13150, 2018.
Taillandier, A.-S., Domine, F., Simpson, W. R., Sturm, M., and Douglas, T. A.: Rate of decrease of the specific surface area of dry snow: Isothermal and temperature gradient conditions, J. Geophys. Res. Earth Surf., 112, 1–13, https://doi.org/10.1029/2006JF000514, 2007.
Teich, M., Giunta, A. D., Hagenmuller, P., Bebi, P., Schneebeli, M., and Jenkins, M. J.: Effects of bark beetle attacks on forest snowpack and avalanche formation – Implications for protection forest management, Forest Ecol. Manag., 438, 186–203, https://doi.org/10.1016/j.foreco.2019.01.052, 2019.
Thackeray, C. W. and Fletcher, C. G.: Snow albedo feedback: Current knowledge, importance, outstanding issues and future directions, Prog. Phys. Geog., 40, 392–408, https://doi.org/10.1177/0309133315620999, 2015.
Todt, M., Rutter, N., Fletcher, C. G., Wake, L. M., Bartlett, P. A., Jonas, T., Kropp, H., Loranty, M. M., and Webster, C.: Simulation of Longwave Enhancement in Boreal and Montane Forests, J. Geophys. Res.-Atmos., 123, 731–713, https://doi.org/10.1029/2018JD028719, 2018.
Van Loon, A. F., Ploum, S. W., Parajka, J., Fleig, A. K., Garnier, E., Laaha, G., and Van Lanen, H. A. J.: Hydrological drought types in cold climates: quantitative analysis of causing factors and qualitative survey of impacts, Hydrol. Earth Syst. Sci., 19, 1993–2016, https://doi.org/10.5194/hess-19-1993-2015, 2015.
Vionnet, V., Brun, E., Morin, S., Boone, A., Faroux, S., Le Moigne, P., Martin, E., and Willemet, J.-M.: The detailed snowpack scheme Crocus and its implementation in SURFEX v7.2, Geosci. Model Dev., 5, 773–791, https://doi.org/10.5194/gmd-5-773-2012, 2012.
Webb, R. W., Fassnacht, S. R., Gooseff, M. N., and Webb, S. W.: The Presence of Hydraulic Barriers in Layered Snowpacks: TOUGH2 Simulations and Estimated Diversion Lengths, Transport Porous Med., 123, 457–476, https://doi.org/10.1007/s11242-018-1079-1, 2018.
Westermann, S., Boike, J., Langer, M., Schuler, T. V., and Etzelmüller, B.: Modeling the impact of wintertime rain events on the thermal regime of permafrost, The Cryosphere, 5, 945–959, https://doi.org/10.5194/tc-5-945-2011, 2011.
Wever, N., Fierz, C., Mitterer, C., Hirashima, H., and Lehning, M.: Solving Richards Equation for snow improves snowpack meltwater runoff estimations in detailed multi-layer snowpack model, The Cryosphere, 8, 257–274, https://doi.org/10.5194/tc-8-257-2014, 2014.
WSL: SNOWPACK, License: GNU LHPLv3, Institute for Snow and Avalanche Research SLF, Davos, Switzerland, WSL [code], https://gitlabext.wsl.ch/snow-models/snowpack (last access: 9 March 2024), 2024.
Yang, K., Peng, C., Peñuelas, J., Kardol, P., Li, Z., Zhang, L., Ni, X., Yue, K., Tan, B., Yin, R., and Xu, Z.: Immediate and carry-over effects of increased soil frost on soil respiration and microbial activity in a spruce forest, Soil Biol. Biochem., 135, 51–59, https://doi.org/10.1016/j.soilbio.2019.04.012, 2019.
Zhang, T.: Influence of the seasonal snow cover on the ground thermal regime: An overview, Rev. Geophys., 43, 1–23, https://doi.org/10.1029/2004RG000157, 2005.
Zheng, B., Ciais, P., Chevallier, F., Yang, H., Canadell, J. G., Chen, Y., van der Velde, I. R., Aben, I., Chuvieco, E., Davis, S. J., Deeter, M., Hong, C., Kong, Y., Li, H., Li, H., Lin, X., He, K., and Zhang, Q.: Record-high CO2 emissions from boreal fires in 2021, Science, 379, 912–917, https://doi.org/10.1126/science.ade0805, 2023.