the Creative Commons Attribution 4.0 License.
the Creative Commons Attribution 4.0 License.
 | 18 Jun 2024
Spatial variability in the seasonal precipitation lapse rates in complex topographical regions – application in France
Guillaume Evin
Anne-Catherine Favre
David Penot
Seasonal precipitation estimation in ungauged mountainous areas is essential for understanding and modeling a physical variable of interest in many environmental applications (hydrology, ecology, and cryospheric studies). Precipitation lapse rates (PLRs), defined as the increasing or decreasing rate of precipitation amounts with the elevation, play a decisive role in high-altitude precipitation estimation. However, the documentation of PLR in mountainous regions remains weak even though their utilization in environmental applications is frequent. This article intends to assess the spatial variability and the spatial-scale dependence of seasonal PLRs in a varied and complex topographical region. At the regional scale (10 000 km2), seven different precipitation products are compared in their ability to reproduce the altitude dependence of the annual/seasonal precipitation of 1836 stations located in France. The convection-permitting regional climate model (CP-RCM) AROME is the best in this regard, despite severe precipitation overestimation in high altitudes. The fine resolution of AROME allows for a precise assessment of the influence of altitude on winter and summer precipitation on 23 massifs at the sub-regional scale (∼ 1000 km2) and 2748 small catchments (∼ 100 km2) through linear regressions. With AROME, PLRs are often higher in winter at the catchment scale. The variability in the PLR is higher in high-altitude regions such as the French Alps, with higher PLRs at the border than inside the massifs. This study emphasizes the interest of conducting a PLR investigation at a fine scale to reduce spatial heterogeneity in the seasonal precipitation–altitude relationships.
- Article
(6608 KB) - Full-text XML
-
Supplement
(5336 KB) - BibTeX
- EndNote


Precipitation lapse rates (PLRs) refer to the increasing or decreasing rate of precipitation amounts with elevation. The rise in the moist air above an orographic barrier such as hills or mountains generates precipitation that affects the ice cover and the precipitation amount contained in snowpacks (Bales et al., 2006; Viviroli et al., 2007; Mott et al., 2014; Dozier et al., 2016; Wrzesien et al., 2019). Therefore, the PLR is the main factor that controls the water budget of high-altitude catchments (Jiang, 2003) and partly explains the freshwater supply in the summer season. On shorter timescales like hourly or daily scales, PLRs help us understand the physical mechanisms of orographic precipitation responsible for natural hazards such as avalanches, landslides, and floods (Caracena et al., 1979; Caine, 1980; Conway and Raymond, 1993; Buzzi et al., 1998; Panziera et al., 2015). PLRs can also be of importance for hydrological modeling for which precipitation inputs are often spatialized with geostatistics models (Daly et al., 1994; Gottardi, 2009; Frei and Isotta, 2019), or they can be distributed by altitudinal bands using assumed PLR values (Bergström, 1992; Ragettli and Pellicciotti, 2012; Markstrom et al., 2015; Garavaglia et al., 2017; Ruelland, 2020; Kumar et al., 2022) to complete the hydrological balance (Oudin et al., 2006) in high-altitude catchments. The investigation of PLR is a topical and crucial issue in multiple domains such as energy production, agriculture, tourism, the condition of ecosystems, and risk management (Pimentel et al., 1997; Gössling et al., 2012).
The relationship between altitude and precipitation accumulation is not straightforward on small timescales and depends on the precipitation type (stratiform vs. convective), wind, and flow directions (Sevruk and Mieglitz, 2002; Schäppi, 2013). PLR at the hourly scale may even exhibit a negative trend during extreme events (Formetta et al., 2022) due to the drying of the air mass. When aggregated over extended periods, the relationship between precipitation and elevation becomes simpler to model, generally with a precipitation increase as elevation increases (Barrows, 1933; Spreen, 1947; Schermerhorn, 1967; Smith, 1979). However, PLR values can differ among seasons and regions due to different weather processes (Napoli et al., 2019; Ménégoz et al., 2020). In the Alps, large-scale processes mainly generate winter precipitation. Convective processes are more frequent in summer.
In a hydrology framework, PLRs refer to the slope of the linear regression between precipitation and elevation on spatial areas (e.g., Sevruk, 1997; Gottardi, 2009; Ogrin and Kozamernik, 2020; Avanzi et al., 2021; Bell et al., 2022) rather than on vertical atmospheric columns. In some cases, the relationship in high-altitude regions appears to be non-linear with a threshold impact (Schäppi, 2013; Napoli et al., 2019) due to the drying of the air masses, and the use of quadratic regression is then recommended (Mahmood et al., 2021).
PLRs are often estimated from ground measurements from rain gauges, observations of snow water equivalent (SWE) (Avanzi et al., 2021) derived from manual coring or radiation, and snow/rain gauge totalizer (Gottardi, 2009) measures. Using only ground stations to estimate PLRs requires a sufficient coverage of high-elevation areas, which is rarely met in practice (Hofstra et al., 2010). High-elevation stations are prone to precipitation undercatch (Groisman and Legates, 1994; Pollock et al., 2018) and snow redistribution. Strong winds coupled with a significant amount of solid precipitation might even induce an annual underestimation of up to 25 % (Sevruk, 1997). Moreover, the robustness of the regressions and the local influences of altitude on precipitation must be balanced because of the irregular spatial sampling of punctual observations (Gottardi, 2009). In practice, in sparse rain gauge regions, the PLR can only be computed on vast areas and fails to reflect the local relationship between altitude and precipitation.
As an alternative, gridded precipitation products can help analyze the spatial variability in the PLR at a fine spatial scale. Radar products that indirectly measure precipitation from reflectivity have been extensively used in hydrology (e.g., Ochoa-Rodriguez et al., 2019). However, radar data are inherently biased in mountainous regions due to ground echoes and beam blockage (e.g., Berne and Krajewski, 2013), which results in an underestimation of PLR (Faure et al., 2019). Satellite precipitation products, despite certain limitations, are another easily accessible source of data. The biases in mountain regions and the relatively low resolution of the data present challenges in calculating PLR from satellite data (Li et al., 2017). Composite products merging radar or satellite to rain gauge data (Champeaux et al., 2009; Nie et al., 2015; Nguyen et al., 2020) can also be an option for the assessment of PLRs. However, the latter products are sensible on the density of the rain gauge network and suffer where no rain gauges are available (Silverman et al., 2013; Shen et al., 2018; Frei and Isotta, 2019). Regional climate models (RCMs) have been used in numerous studies to evaluate the variability in the PLR at regional scales (e.g., Kotlarski et al., 2012; Cuo and Zhang, 2017; Ménégoz et al., 2020). All results show that PLRs obtained with RCM data are larger and more spatially varying than those using rain gauges. Convection-permitting regional climate models (CP-RCMs) have recently emerged as an appealing tool for producing fine-resolution (1–4 km2) climate simulations (Rockel et al., 2008; Brousseau et al., 2016; Keuler et al., 2016; Belušić et al., 2020). CP-RCMs are a refined extension of RCM where deep-convection parameterization, a dominant source of precipitation error (Hohenegger et al., 2008; Foley, 2010; Kendon et al., 2012), is turned off. To produce a long series of CP-RCM simulations, including precipitation, a numerical weather prediction (NWP) model is often driven by a RCM or a satellite-based reanalysis. CP-RCMs produce better precipitation intensities and frequencies than RCMs during heavy events (Ban et al., 2021; Caillaud et al., 2021). CP-RCMs represent orographic precipitation more accurately than RCMs because they explicitly resolve deep convective processes and include a finer representation of the topography (Lucas-Picher et al., 2021). These improvements occur especially in summer when convective events play a major role (Ban et al., 2021). Today, CP-RCMs are considered more reliable than reanalysis (Lundquist et al., 2019) in ungauged mountainous areas, despite the current precipitation overestimation (Gerber et al., 2018; Dallan et al., 2023).
This paper explores the spatial variability in the winter and summer PLR across a complex topographical region with a dense network of 1836 stations used as ground truth. The first objective is to compare seven products from different categories (interpolator, reanalysis, satellite, radar, and CP-RCM) with respect to their ability to capture the relationship between observed annual/seasonal precipitation and altitude. The second goal is the investigation of the spatial variability in the winter and summer PLR values at the sub-regional (≈ 1000 km2) and catchment (≈ 100 km2) scales using a gridded precipitation product without ground station assimilation. Nesting catchments in the sub-regions allows the study of the spatial-scale dependence of PLR to provide guidelines for future precipitation interpolation studies. To our knowledge, only Jiang et al. (2022) explore these questions in the Third Pole. In a sparse rain gauge region, the authors found an accurate PLR reproduction with a downscaled ERA5 precipitation product (Jiang et al., 2021). They highlighted the spatial variability in the PLR at the catchment scale and emphasized the importance of conducting PLR studies at the finest possible spatial scale.
This paper is organized as follows. Section 2 describes the study domain and the available precipitation products. Section 3 presents the method used to derive PLR. Section 4 shows the results of the reproduction and spatial variability in the PLR by the different products considered. Section 5 compares the findings to the literature and discusses some perspectives. Section 6 gives the conclusions.
2.1 A complex mountainous region
Figure 1a shows the study domain which corresponds to the intersection of the spatial extents of the seven gridded precipitation products. The topography of the region is complex and varied, including three major mountain chains: the Alps, the Pyrenees, and the Massif Central. The Massif Central is a mid-mountain range reaching 1885 m in the center of the southern half of France and covers 85 000 km2, which makes it the largest mountainous region of the country (15 % of the total surface area of France). The Massif Central is bordered by the Rhône Valley to the west and the Mediterranean coastal plain to the south. This region is mainly composed of large plateaus ranging in altitude from 600 to 900 m and enclosed by mountains with circular summits corresponding to extinct volcanoes. The altitude presents an asymmetrical profile with summits in the south and the east (Cévennes) and less elevated areas in the northwest. The landscapes are varied and contain limestone plateaus cut by deep canyons, mountain peaks, and deep river valleys. The Massif Central is exposed to the west wind and captures the precipitation coming from the Atlantic Ocean.
The Alps are the highest mountain range in Europe, reaching 4808 m at Mont Blanc. The chain has a 40 000 km2 surface area and is 1200 km long, crossing seven countries, namely France, Switzerland, Italy, Germany, Liechtenstein, Austria, and Slovenia. The French Alps are separated from the Massif Central by hills and are divided into the northern and the southern parts. The Northern Alps are higher and have large valleys. In the Southern Alps, valleys are narrower. The climate of the French Alps has three main influences. The moist air can come from the west Atlantic. The warm air comes from the Mediterranean and blows northward. In winter, easterly weather fronts coming from the Italian Alps can bring large amounts of precipitation to the east of the French Alps (Garavaglia et al., 2010). Generally, these meteorological events do not reach the foothills of the French Alps. The Northern Alps are more rainy than the Southern Alps, which have almost 300 d yr−1 of sunshine. The French Alps is a territory of high-altitude and complex topography. The significant variations in mountain elevation and exposure result in the coexistence of multiple climates at small spatial scales. Mountains create micro-climatic conditions and influence daily weather. The Jura Mountains are a sub-alpine mountain range located in the north of the French Alps. They cover a surface area of 5000 km2 and reach 1700 m. The Jura Mountains are a mid-mountain range composed of plateaus with a mean altitude of 600 m.
The Pyrenees form a natural border between France and Spain by joining the Atlantic Ocean to the Mediterranean Sea over 430 km. It covers 19 000 km2 and reaches 3200 m on the French side, making it the second-highest mountain range in France. Most valleys are running north–south. The Spanish part is more arid and rocky than the French part, which catches the precipitation from the Atlantic. The French Pyrenees splits into the Atlantic, central, and eastern parts. The relief rises steeply from sea level to hills in the Atlantic and eastern parts. The central Pyrenees hosts sharp peaks but is more rounded than the Alps because of erosion. The Atlantic part gets more precipitation because of rainy northwest winds. The wind from the southwest brings warmer air in summer. The topography is diverse, with snow-capped mountains, deep green valleys, and coastal hills. The remainder of France consists of plains and is not included in this study.
In this study, we consider three spatial scales: the regional scale (10 000 km2), the sub-regional scale (1000 km2), and the catchment scale (100 km2). The sub-regional scale consists of areas named “massif”, which form a set of continuous reliefs often separated by rivers and valleys. An ensemble of massifs constitutes a mountain range (Alps and Pyrenees). In the French Alps, 23 massifs have been identified through climatological homogeneity of precipitation in Pahaut (1991). PLR computation will be conducted at the massif (climatological homogeneity) and catchment (hydrologic interpretation) scales. The surface areas of the massifs range from 450 to 1600 km2, with a median value of 870 km2. The 2748 catchments collected from Sandre (2020) have a mean surface area ranging from 0.009 to 1000 km2, with a median value of 100 km2. Figure 1c illustrates the massifs and the catchments analyzed in this study. The altitude is represented with a digital terrain model of 1 km resolution. The study domain is divided into squares of 1 km2 that are referred to as “pixels”.
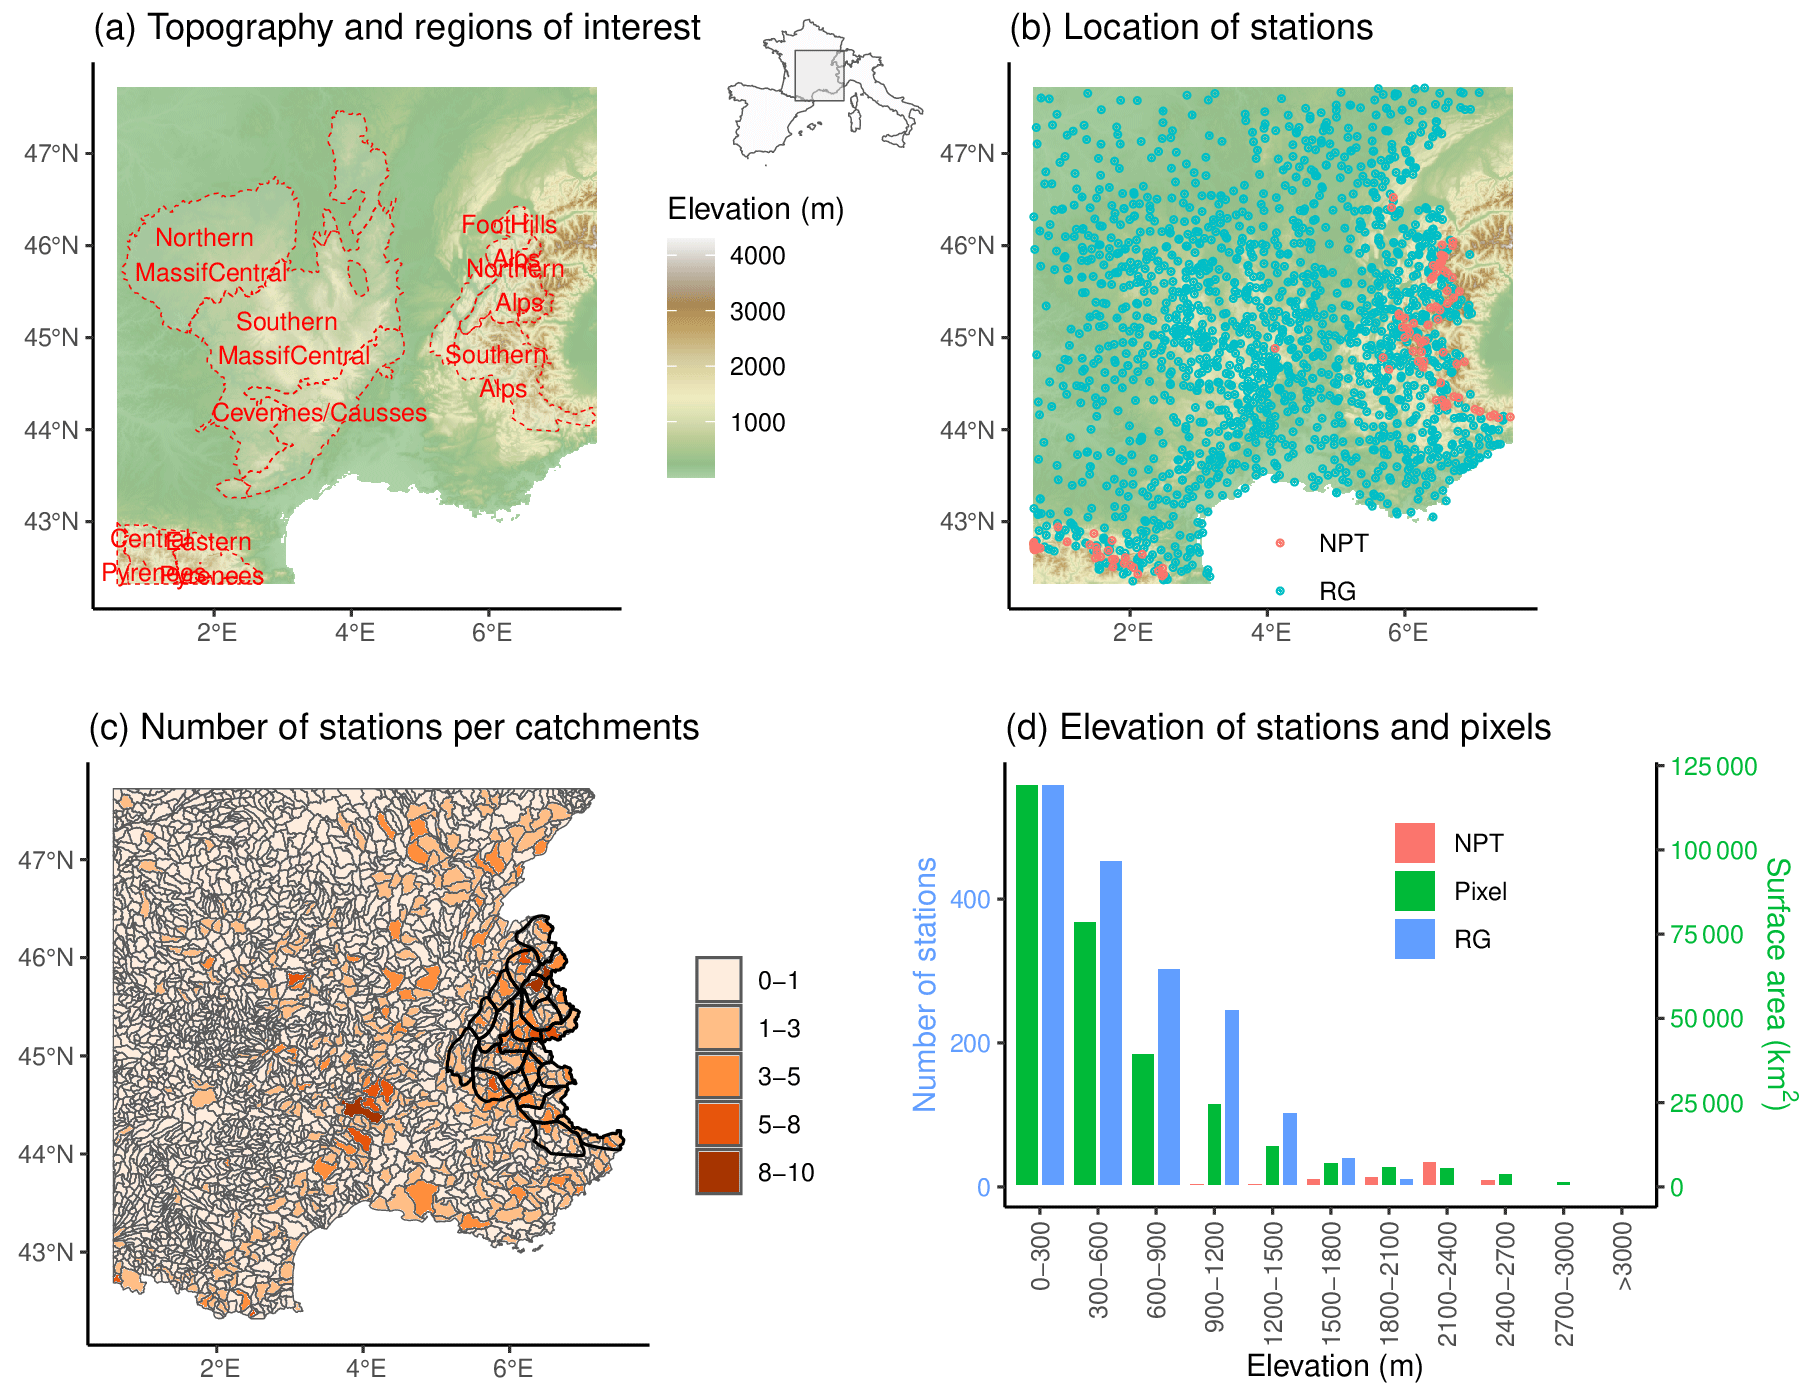
Figure 1(a) Topography of France and boundaries of eight sub-regions of interest. The extent of the study domain is located in France and is bordered by Spain, Italy, and Switzerland. (b) Location of stations; blue points refer to rain gauges (RGs) and red points to NPTs (see Sect. 2.2). (c) Catchments and the corresponding number of stations. Boundaries of massifs located in the Alps are also indicated in black. (d) Histogram of the altitude of stations (rain gauges (RGs), and NPTs) and of the covered surface area (in green).
2.2 A dense network of stations
Figure 1b presents the dense rain gauge network of 1836 stations used in this study, with an average density of one rain gauge per 160 km2. Electricité de France (EDF, the main electricity provider in France) and Météo-France provide 673 and 1163 stations, respectively. We aggregate available daily precipitation data to obtain seasonal and annual precipitation. Figure 1d shows the number of rain gauges per altitudinal band. A small number of rain gauges is available above 2000 m, causing an underrepresentation of high-altitude regions. To overcome this limitation, EDF has implemented a snow rain gauge totalizer (Nivo Pluviomètre Totalisateur, NPT, in French) device (Gottardi, 2009). NPTs collect annual precipitation in a small orifice protected from the wind by a large collar. Snow falling in the orifice feeds a reservoir containing a saline solution able to melt solid precipitation. The operating period ranges from 1945 to 1977 and differs among NPTs. We restricted the period to 1957–1973, during which the spatial density of NPT is at its maximum. An exploratory analysis of the annual precipitation from NPTs removes outliers and missing values. Following this analysis, we keep 130 NPTs among 216 for the study. NPTs are primarily found in the Mont Blanc region and are more uncommon, for instance, in the center of the Pyrenees. Figure 1c illustrates the irregular number of weather stations per catchment. Mountainous regions like the Alps and the Cévennes are more covered than plains, where weather processes are less subject to spatial variability. Nevertheless, the Southern Alps, the Massif Central, and the Pyrenees have a complex topography and few stations. The sparse stations in some mountainous regions and their location in valleys largely constrain the ability to compute PLR using only precipitation aggregated from rain gauges.
In France, precipitation patterns differ among seasons. Thus, in this study, four seasons are considered: winter (December, January, February – DJF), spring (March, April, May – MAM), summer (June, July, August – JJA), and autumn (September, October, November – SON).
2.3 Gridded precipitation products
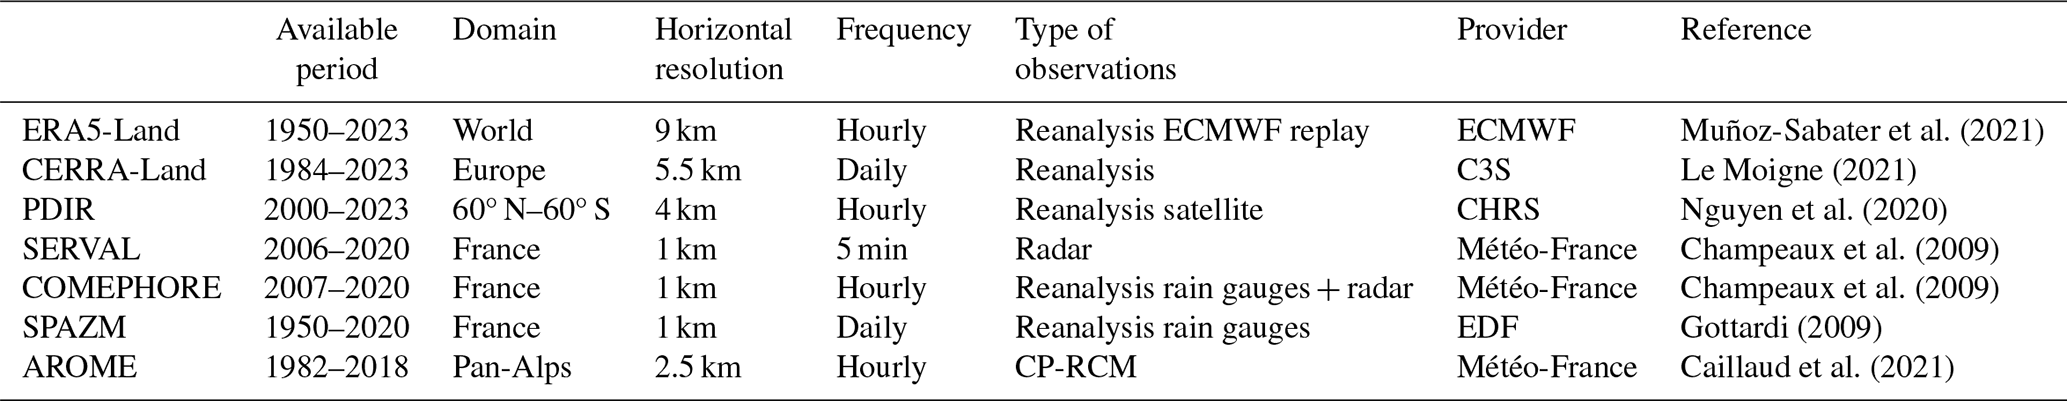
This study explores the ability of multiple gridded precipitation products to assess the relationship between annual precipitation and altitude. Precipitation from gridded products are available at daily, hourly, or sub-hourly timescales and aggregated to obtain seasonal precipitation. These products are briefly described hereafter and are summarized in Table 1.
Muñoz-Sabater et al. (2021)Le Moigne (2021)Nguyen et al. (2020)Champeaux et al. (2009)Champeaux et al. (2009)Gottardi (2009)Caillaud et al. (2021)Table 1Summary of the characteristics of the gridded precipitation products used in this study, namely the available period, domain, horizontal resolution, frequency, type of observations, provider, and reference.
2.3.1 ERA5-Land
ERA5-Land (Muñoz-Sabater et al., 2021) is a global reanalysis that operates by simulating atmospheric and surface variables, including hourly precipitation. It uses the ERA5 atmospherical fields downscaled with linear interpolation at the resolution of 9 km. ERA5-Land assimilates satellite data and does not rely on rain gauges. The quality of ERA5-Land precipitation is dependent on the density of satellite and radar networks used in the assimilation process (Hassler and Lauer, 2021). As a result, the quality is better in Central Europe and the USA than in tropical oceans. The improved horizontal resolution of 9 km compared to 31 km (ERA5) or 80 km (ERA-Interim) is a benefit of ERA5-Land (Muñoz-Sabater et al., 2021). This results in a better representation of spatial precipitation patterns (Gomis-Cebolla et al., 2023).
2.3.2 CERRA-Land
Copernicus European Regional ReAnalysis Land (CERRA-Land) (Le Moigne, 2021) is the most up-to-date reanalysis available in Europe since September 1984 at a horizontal resolution of 5.5 km. It uses ERA5 as lateral boundary conditions to run the atmospherical model HIRLAM ALADIN Regional/Mesoscale Operational NWP in Euromed (HARMONIE) every 3 h at a native resolution of 5.5 km. The analysis is given to the MESCAN system (Soci et al., 2016) to produce daily precipitation fields by merging it with nearly 8000 daily rain gauge measurements through optimal interpolation. Le Moigne (2021) found that CERRA-Land leads to a better representation of the seasonality of snow depth in the Alps compared to ERA5-Land.
2.3.3 PDIR-NOW
PERSIANN Dynamic Infrared–Rain Rate (PDIR-NOW; Nguyen et al., 2020) is a satellite-based product using high-frequency (15 min) sampled infrared imagery at a 4 km spatial resolution. PDIR-NOW estimates precipitation based on empirical cloud-top temperature–precipitation rate relationships. Errors resulting from this method are corrected by calibrating the empirical relationships regionally based on monthly precipitation climatology. PDIR-NOW has better diurnal cycle representation, rain/no rain day estimation, and regional precipitation patterns compared to the other PERSIANN family products (Nguyen et al., 2020). The inter-annual, annual, and seasonal precipitation is less biased with PDIR-NOW (Huang et al., 2021; Uysal, 2022). In the following, PDIR-NOW will be referred to as PDIR.
2.3.4 SERVAL
The Système d'élaboration des produits radar et de visualisation centralisée (SERVAL, previously PANTHERE; Champeaux et al., 2009) product provides precipitation amounts at a frequency of 5 min and a spatial resolution of 1 km by merging individual radar fields. Before any radars are combined, each one is individually calibrated using data from hourly rain gauges with a mean hourly correction ratio applied uniformly across the whole radar coverage. If a pixel falls under the coverage of multiple individual radars, then the selected precipitation corresponds to the maximum of precipitation seen by the considered radars. As already mentioned, radars are affected by many sources of potential errors, such as beam blocking and ground echoes. Ground echoes are removed using pixel precipitation probabilities, which are derived from a cloud classification filter. Bright band and signal attenuation phenomena are also corrected.
2.3.5 COMEPHORE
The COmbinaison en vue de la Meilleure Estimation de la Precipitation HOraiRE (COMEPHORE; Champeaux et al., 2009) product is a precipitation reanalysis based on the combination of the previous SERVAL product with a dense rain gauge data set of more than 4000 observations. Kriging of the rain gauge values is applied to obtain the stratiform part, while the convective part involves the radar precipitation re-calibration with the rain gauge amounts. The main idea underlying this product is to combine the coherent spatial structure of the radars with the accuracy of rain gauge measurements to provide an hourly precipitation field at 1 km resolution. COMEPHORE underestimates mountain annual precipitation (Rouzeau, 2013; Roger, 2017) since the altitude is not considered at any modeling stage.
2.3.6 SPAZM
The SPAtialisation en Zones de Montagne (SPAZM; Gottardi, 2009) product is a precipitation interpolator that integrates rain gauge values with a meteorological guess conditioned by topography and the weather type of the day. Eight weather situations are identified based on geopotential fields (Garavaglia et al., 2010), and eight corresponding mean daily precipitation fields are created through local linear regression between the mean daily observed precipitation at stations and the altitude at the daily timescale and 1 km resolution. For a given day, the corresponding mean daily precipitation field is modified using the precipitation of the current day. SPAZM incorporates 2201 various stations from EDF (rain gauges and NPTs), Météo-France, MeteoSwiss, Arpa Piemonte, and Instituto Nacional de Meteorología (INM) networks. SPAZM used fewer but higher stations than COMEPHORE. Its ability to provide accurate estimates of yearly precipitation makes it a valuable tool for hydrological applications (Gottardi, 2009; Ménégoz et al., 2020; Ruelland, 2020).
2.3.7 CNRM-AROME
The CNRM-AROME model is a CP-RCM based on the nonhydrostatic, convective-scale, limited-area model called Applications de la Recherche à l’Opérationnel à Méso-Echelle (AROME) and has been used for the national weather prediction by Météo-France since 2008 (Seity et al., 2011; Brousseau et al., 2016). There are 37 years of CNRM-AROME simulations available at a horizontal resolution of 2.5 km and at the hourly timescale (Caillaud et al., 2021) for an Alpine domain defined in the flagship pilot study of the Coordinated Regional Climate Downscaling Experiment (CORDEX-FPS; Coppola et al., 2020). The Atlantic Pyrenees are not contained in the domain. The version of AROME applied to obtain this long simulation is related to cycle 41t1 (Termonia et al., 2018) and corresponds to the version in operational use at Météo-France between December 2015 and December 2017. In the remainder of the paper, the CNRM-AROME CP-RCM will be referred to as AROME. The initial atmospheric conditions of AROME are provided every hour by a CNRM-ALADIN RCM simulation, itself driven by the ERA-Interim reanalysis. The fine resolution of the model enables a good representation of the deep convection scheme despite the absence of data assimilation. Precipitation from this version has been evaluated recently in multiple studies (Ban et al., 2021; Caillaud et al., 2021; Monteiro et al., 2022). Heavy precipitation is better represented than in the RCM CNRM-ALADIN but suspicious snow accumulation is pointed out in high altitudes. A first pre-processing stage is required to address large errors in precipitation seasonal amounts at the pixel scale. An iterative technique is applied to deal with the problematic pixels, whereby the abnormal values are replaced with the weighted (according to the altitude) average of the precipitation amount of the nearby pixels. A pixel is qualified as problematic if a difference of more than 500 mm in seasonal precipitation is noticed compared to a neighboring pixel.
Some gridded precipitation products present non-homogeneous data because of their large temporal depths. Most radars have been integrated since 2006, and others have been gradually incorporated since 2015 in mountainous regions (Beck and Bousquet, 2013). The use of SERVAL and COMEPHORE is therefore tainted with temporal non-homogeneity. Station density also affects the temporal homogeneity of COMEPHORE, CERRA-Land, and SPAZM. Changes in instrumentation have been corrected in COMEPHORE and SPAZM with the homogenization of rain gauge precipitation (Gottardi, 2009; Mestre et al., 2013).
Figure 2 displays the mean annual precipitation for all gridded precipitation products. Figure S1 in the Supplement provides the same information on a seasonal basis. We first notice the effect of the resolution. Annual precipitation from ERA5-Land and PDIR is very smooth on the considered domain compared to the other gridded products available at a finer resolution. The precipitation difference between plains and mountains is not very prominent in the radar products SERVAL and COMEPHORE. Comparatively, the Pyrenees, the Massif Central, and the Alps receive more annual precipitation with AROME, CERRA-Land, and SPAZM. SPAZM leads to marked patterns in the alpine valleys and produces a higher correlation to altitude. AROME gives a large amount of precipitation in mountains, especially in the Massif Central. The seven gridded precipitation products show different precipitation amounts, especially in mountainous regions, due to more or less fine horizontal resolutions, different types of assimilated data, and differences in the treatment of the altitude effect.
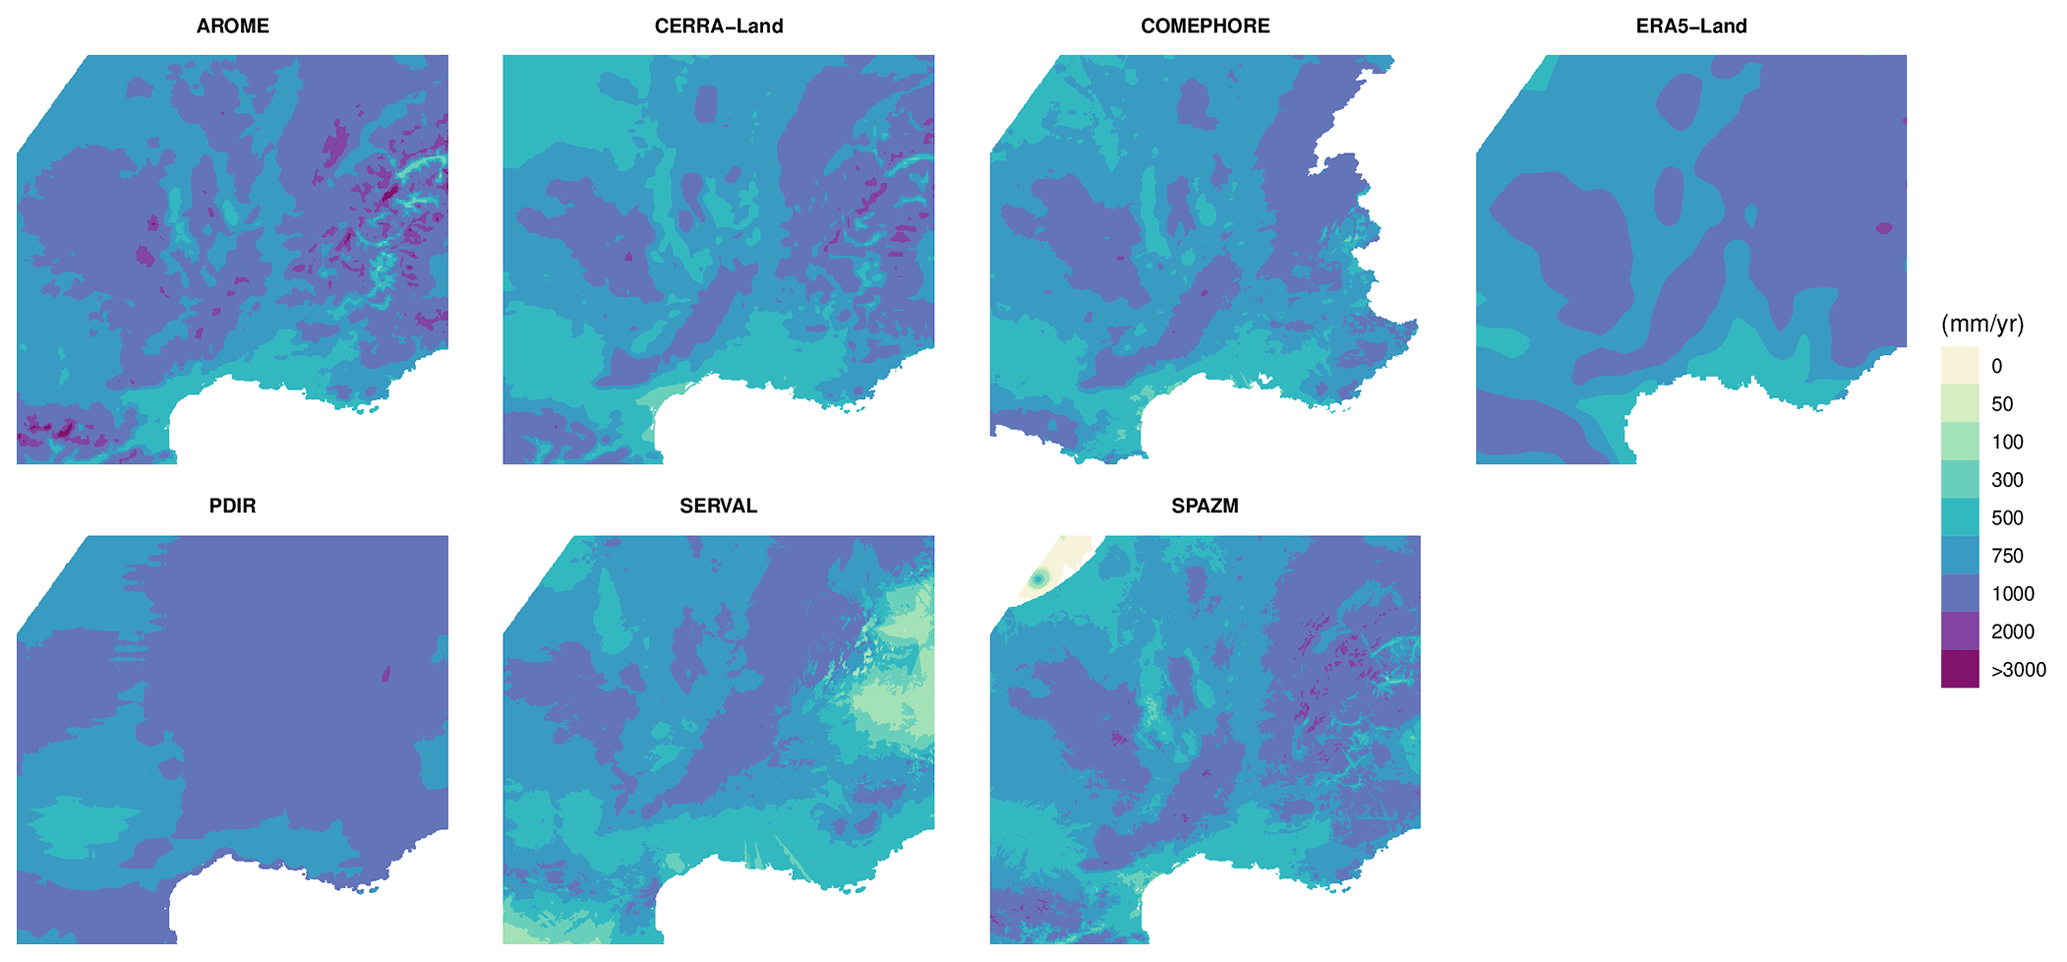
Figure 2Mean annual precipitation for the gridded precipitation products (AROME, CERRA-Land, COMEPHORE, ERA5-Land, PDIR, SERVAL, and SPAZM) during the period 2007–2017.
Let Pobs and Pgrid denote, respectively, the observed (by rain gauges and NPT) and gridded precipitation (annual or seasonal) expressed in millimeters. Let Z indicate the altitude in meters. The indices i and j refer to stations, while the index p indicates the pixels.
3.1 Description of the relationship between precipitation and altitude
Annual and seasonal precipitation from the gridded products is extracted at station locations to evaluate the reproduction of the altitudinal variability in the precipitation. The precipitation from the NPT is only available at the annual scale. The stations are grouped by regions defined in Fig. 1a and by 300 m elevation bands balt ranging from 0–300 to 3000–3300 m. For each elevation band and region, the median of the observed () and gridded () precipitation (annual and seasonal) is computed using all the locations of the stations belonging to this region and elevation band:
The median values should represent the considered region and elevation band and be unaffected by anomalous values resulting from a specific station location. A compromise between a high number of rain gauges per band and a sufficient number of bands led to a 300 m bandwidth selection. The bands with fewer than five rain gauges are not displayed in Fig. 3a to prevent any misunderstandings or misrepresentations. To study the behavior of gridded precipitation products in high altitudes where no rain gauges are available, we compare the median of seasonal precipitation , p∈balt extracted from pixels within the altitudinal bands.
To test a gridded precipitation product reproducing the spatial variability in the relationship between seasonal precipitation and altitude at a finer scale, we also compute the precipitation relative difference (PRD) for several pairs of close neighboring stations with sufficient elevation difference. The two stations should have a separation distance lower than 20 km and have an elevation difference greater than 100 m. PRD should not be assimilated to precipitation lapse rates (PLRs) calculated at the catchment scale (see Sect. 3.2). For the neighboring stations i and j, we compute PRD at the station locations for observed () and gridded () precipitation:
The gradient of seasonal precipitation relative to the altitude is divided by the mean precipitation of the two stations and multiplied one time by 100 to get the result in percent relative to the mean precipitation. This result is again multiplied by 100 to express PRD as percentages per hundred meters (% (100 m)−1).
3.2 Regression at nested spatial scales
The primary focus of this study is the investigation of the spatial variability in the seasonal PLRs at the sub-regional and catchment scales. It is possible to use stations at the regional scale, but the PLRs would be too dependent on their spatial sampling at the sub-regional and catchment scales. Indeed, some catchments contain zero or only one station (Fig. 1c). As an alternative, we propose using AROME to study the spatial variability in the PLR at the sub-regional and catchment scales. The choice of AROME will be motivated in Sect. 4.1. We assume linear relationships between seasonal precipitation and altitude. This strong hypothesis will be discussed later in Sect. 4.3. The PLRs are calculated with linear regression between seasonal precipitation and altitude and expressed as follows:
Paromep is the seasonal precipitation (in mm) for the pixel p, α is the y intercept (in mm), β is the slope expressed (in mm m−1), and Zp is the altitude (in m) of the pixel p. The regression fit is performed using the maximum likelihood method implemented in the ![]() function
function lm. PLRs are derived from β using the following formula:
where is the average seasonal precipitation from AROME over the area where the linear regression is performed. The slope of the regression β is multiplied by 100 twice, first to obtain the result as a percentage and once more to express PLR as a percentage per hundred meters (% (100 m)−1), relative to the average seasonal precipitation from AROME. The expression of PLR (in % (100 m)−1) overcomes the biased nature of gridded precipitation products and allows a spatial comparison despite significant spatial and seasonal variation in precipitation amounts across France (Fig. 2). To investigate the dependence of PLR on a given spatial scale, regressions will be conducted on 23 massifs of the Alps and catchments. On the catchments, a regression will only be performed if there is sufficient variability in elevation, i.e., if the standard deviation of altitude is higher than 50 m.
3.3 Linearity of the regressions
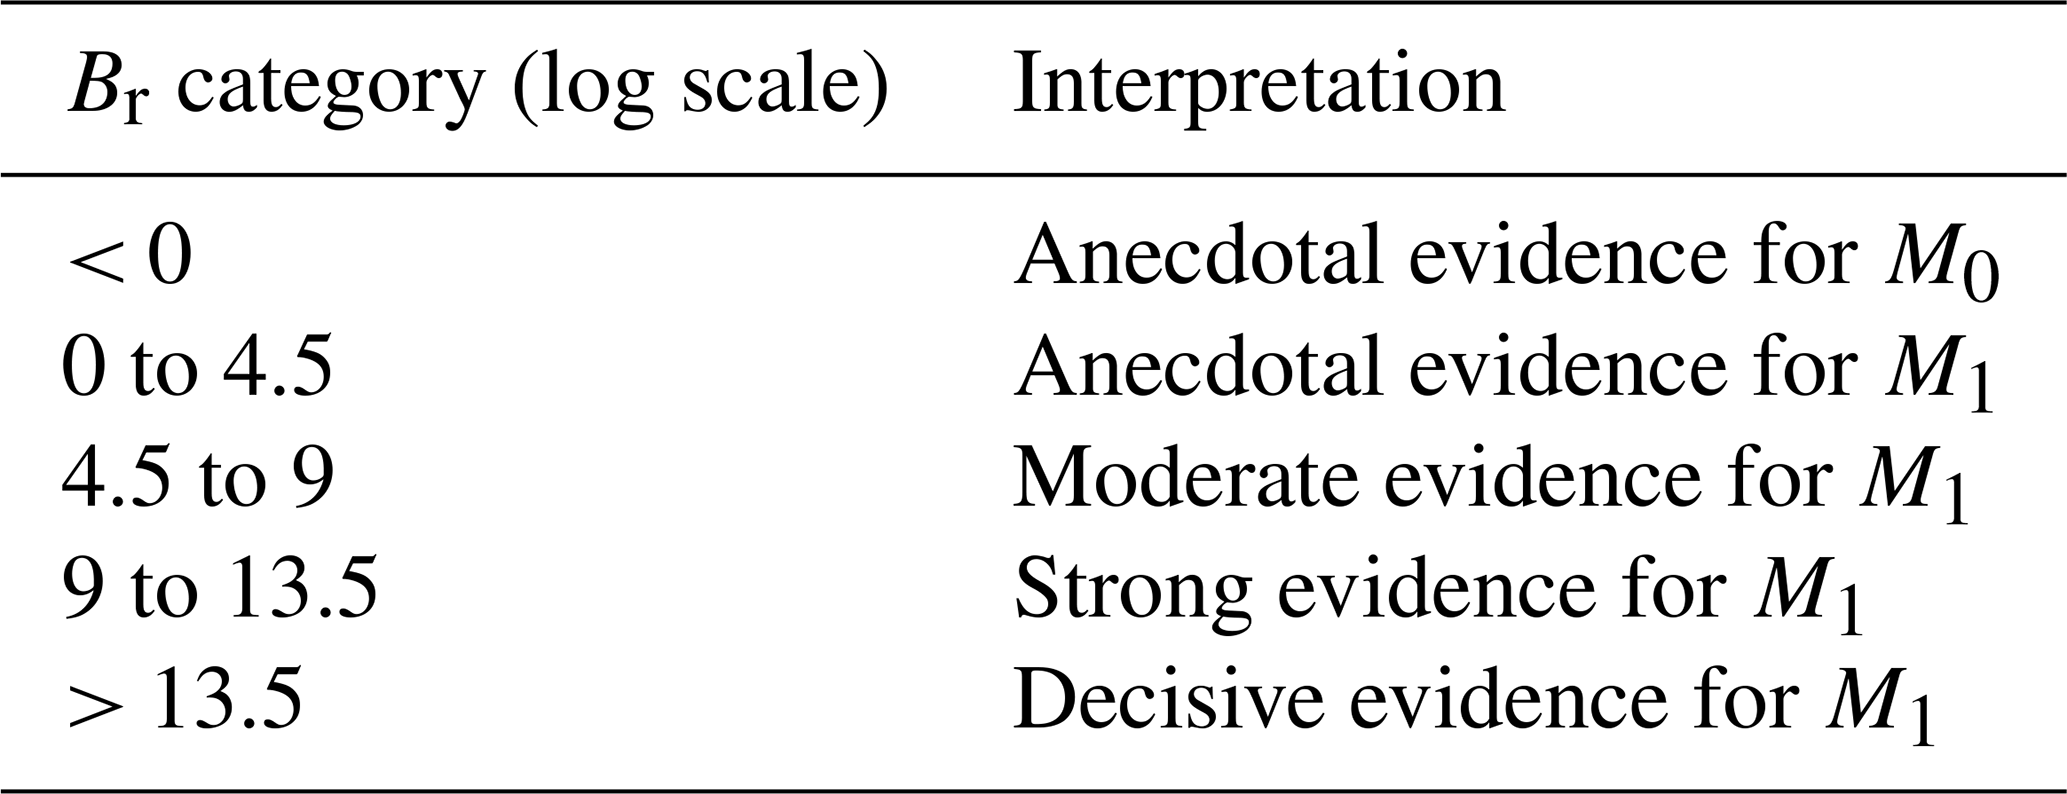
In our formulation (Eq. 6), PLRs are defined as the slopes of the linear regressions. The linearity of the relationship between annual precipitation and altitude at the catchment scale is a questionable hypothesis. For example, Avanzi et al. (2021) found non-linearity in two catchments located in the Italian Alps. Smoothing splines provide more flexibility than linear regressions to model annual precipitation through altitude. However, smoothing splines are not interpretable in terms of PLRs. For this reason, we use piecewise linear regressions implemented in the ![]() package called segmented (Muggeo, 2008). We perform piecewise linear regressions (unknown break point between the first and third quartile of altitude) between annual precipitation and altitude on all catchments with sufficient variability (standard deviation of the altitude higher than 50 m) in altitude. To compare the linear (M0 model) and the piecewise (M1 model) linear models, taking inspiration from the Bayes factor defined in the Bayesian paradigm (Kass and Raftery, 1995), we compute the logarithm of the Bayesian information criterion (BIC) ratio (Br) as
package called segmented (Muggeo, 2008). We perform piecewise linear regressions (unknown break point between the first and third quartile of altitude) between annual precipitation and altitude on all catchments with sufficient variability (standard deviation of the altitude higher than 50 m) in altitude. To compare the linear (M0 model) and the piecewise (M1 model) linear models, taking inspiration from the Bayes factor defined in the Bayesian paradigm (Kass and Raftery, 1995), we compute the logarithm of the Bayesian information criterion (BIC) ratio (Br) as
If the logarithm of Br equals zero, then the two models fit the data with the same quality. Negative values indicate better fits, and positive values refer to worse fits than the linear regression.
Table 2Interpretation of the chosen categories of Br. M0 refers to the linear model and M1 to the piecewise linear model.
4.1 Ability of gridded precipitation products to reproduce the variability in the relationship between annual/seasonal precipitation and elevation
The altitude dependencies of the gridded precipitation products are compared to those from rain gauge data in the regions presented in Fig. 1a. Figure 3a displays the median annual precipitation by 300 m altitudinal bands for the seven gridded precipitation products extracted at the location of the stations. In all regions of interest, annual precipitation observed at stations (i.e., the black curves showing the annual precipitation obtained with the rain gauges and NPTs) increases as a function of the altitude. In the mid-range mountains such as the northern Massif Central, the southern Massif Central, and the foothills of the Alps, the annual precipitation always increases from one altitudinal band to another. The maximum increase in observed annual precipitation occurs in the foothills of the Alps, with a gain of 500 mm in 1500 m altitude. In more complex topographical regions such as the Northern Alps, the Southern Alps, and the Pyrenees, the enhancement of annual precipitation with the altitude is unclear, and only visible at a reduced range of altitude. For instance, the observed annual precipitation does not seem to increase in the Pyrenees below 1800 m. In mountain regions, even the mid-range ones like the foothills of the Alps, ERA5-Land, PDIR, and SERVAL often lead to more moderate increases in annual precipitation with altitude compared to the stations. In the Cévennes/Causses region, annual precipitation from ERA5-Land slowly changes with altitude. In the northern Massif Central, all gridded precipitation products, except for PDIR, are in agreement with the observed enhancement of precipitation with altitude. In the foothills of the Alps, the underestimation of SERVAL increases through the altitudinal bands, reaching 1000 mm at 1500 m altitude. AROME overestimates annual precipitation in all regions of interest, and the bias generally increases at high altitudes. For example, at 2400–2700 m in the Southern Alps, AROME captures more than 1500 mm of the median annual precipitation, while the stations record only 1000 mm. Nevertheless, median annual precipitation from AROME and observations are strongly correlated. Without data assimilation, AROME reproduces abrupt rises in precipitation at high altitudes. In the Northern Alps, AROME and the observed precipitation increase by the same amount of 500 mm from 1800–2100 to 2100–2400 m. In some regions of interest such as the Pyrenees and the northern Massif Central, the bias of AROME is constant through the altitudinal bands. It reflects that, in those regions, the altitude impacts AROME and the station precipitation in the same way. The reanalysis CERRA-Land, based on rain gauges, is biased in some regions (Cévennes/Causses, Northern Alps, Pyrenees, and southern Massif Central). The bias is not constant and can be positive at low altitudes and negative at high altitudes, such as in the Pyrenees region. The bias of CERRA-Land is relatively small in comparison to the bias of ERA5-Land, PDIR, SERVAL, and AROME as it reaches a maximum of 375 mm in the Northern Alps at 1800–2100 m. The reanalysis COMEPHORE and the interpolator SPAZM accurately reproduce precipitation data from stations in all regions of interest as both products assimilate rain gauge values. However, COMEPHORE underestimates precipitation above 2100 m, which is only visible in high-altitude regions, such as the Northern Alps and the Southern Alps. In the Northern Alps, the median annual precipitation from COMEPHORE is smaller than 1000 mm at 2400–2700 m, compared to more than 1300 mm measured with stations for the same altitudinal band. Figure 3a shows that COMEPHORE, CERRA-Land, and SPAZM reproduce the relationship between altitude and observed annual precipitation in the regions of interest well. AROME, without rain gauge assimilation, exhibits the same precipitation/altitude trends as the stations, although it usually overestimates annual precipitation, especially at high altitudes. It can be added that the relationship between annual precipitation and altitude derived from the location of stations is dependent on the spatial sampling, which explains the variability in the curves in Fig. 3a. Nevertheless, the poor relationships between the annual precipitation obtained with ERA5-Land, PDIR, and SERVAL and the altitude disqualify them from a further analysis of the PLRs.
Figure 3b shows the median precipitation by altitudinal bands on a seasonal basis at station locations (solid curves) and by considering all the pixels belonging to a region (dotted curves). The study of seasonal precipitation is extended above the altitude of the stations. The results are only displayed for the four highest-altitude regions (foothills of the Alps, Northern Alps, Pyrenees, and Southern Alps). Only precipitation from AROME, CERRA-Land, COMEPHORE, and SPAZM is investigated seasonally because of the highly biased nature of annual precipitation from ERA5-Land, PDIR, and SERVAL. Figure S2 in the Supplement presents the results for all seasons, products, and regions. At station locations (solid curves), the seasonal precipitation from AROME, CERRA-Land, COMEPHORE, and SPAZM is close to the observed precipitation. Only AROME overestimates seasonal precipitation, but the bias is not altitude-related. The relationship between seasonal precipitation and altitude is different at station locations (solid curves) and with all pixels (dotted curves) in the Northern and Southern Alps. The dotted curves are more regular and above the solid ones, illustrating that the stations are not representative of the altitudinal bands of the regions. When all pixels belonging to a region (dotted curves) are taken into account, differences grow among seasonal precipitation from AROME, CERRA-Land, COMEPHORE, and SPAZM. COMEPHORE experiences both lower winter and summer precipitation than AROME, CERRA-Land, and SPAZM. COMEPHORE precipitation remains unchanged or even decreases with altitude. As a result, the differences in precipitation amounts between COMEPHORE and the other products become larger in high altitudes. For example, in the Northern Alps, the winter precipitation from AROME, CERRA-Land, and SPAZM increases by 250 mm between 3000–3300 m and 3300–3600 m, whereas COMEPHORE declines between these two altitudinal bands, leading to a 350 mm gap. CERRA-Land and SPAZM show common seasonal precipitation patterns with altitude in the Northern Alps and the Pyrenees. In the Northern Alps, CERRA-Land and SPAZM agree on the slow changes in seasonal precipitation below 3000 m and more rapid increases above this threshold. In the Southern Alps, the increase in the seasonal precipitation with altitude is larger with SPAZM than CERRA-Land. AROME produces a larger amount of seasonal precipitation in comparison to COMEPHORE, CERRA-Land, and SPAZM, especially in winter. In summer, AROME shows a suspicious precipitation amount of 1500 mm at high altitudes in the Northern Alps. In winter, the difference between AROME and the other gridded products is larger at high altitudes. For instance, in the foothills of the Alps, AROME matches SPAZM, producing 250 mm at 0–300 m, but is 300 mm higher at 2400–2700 m.
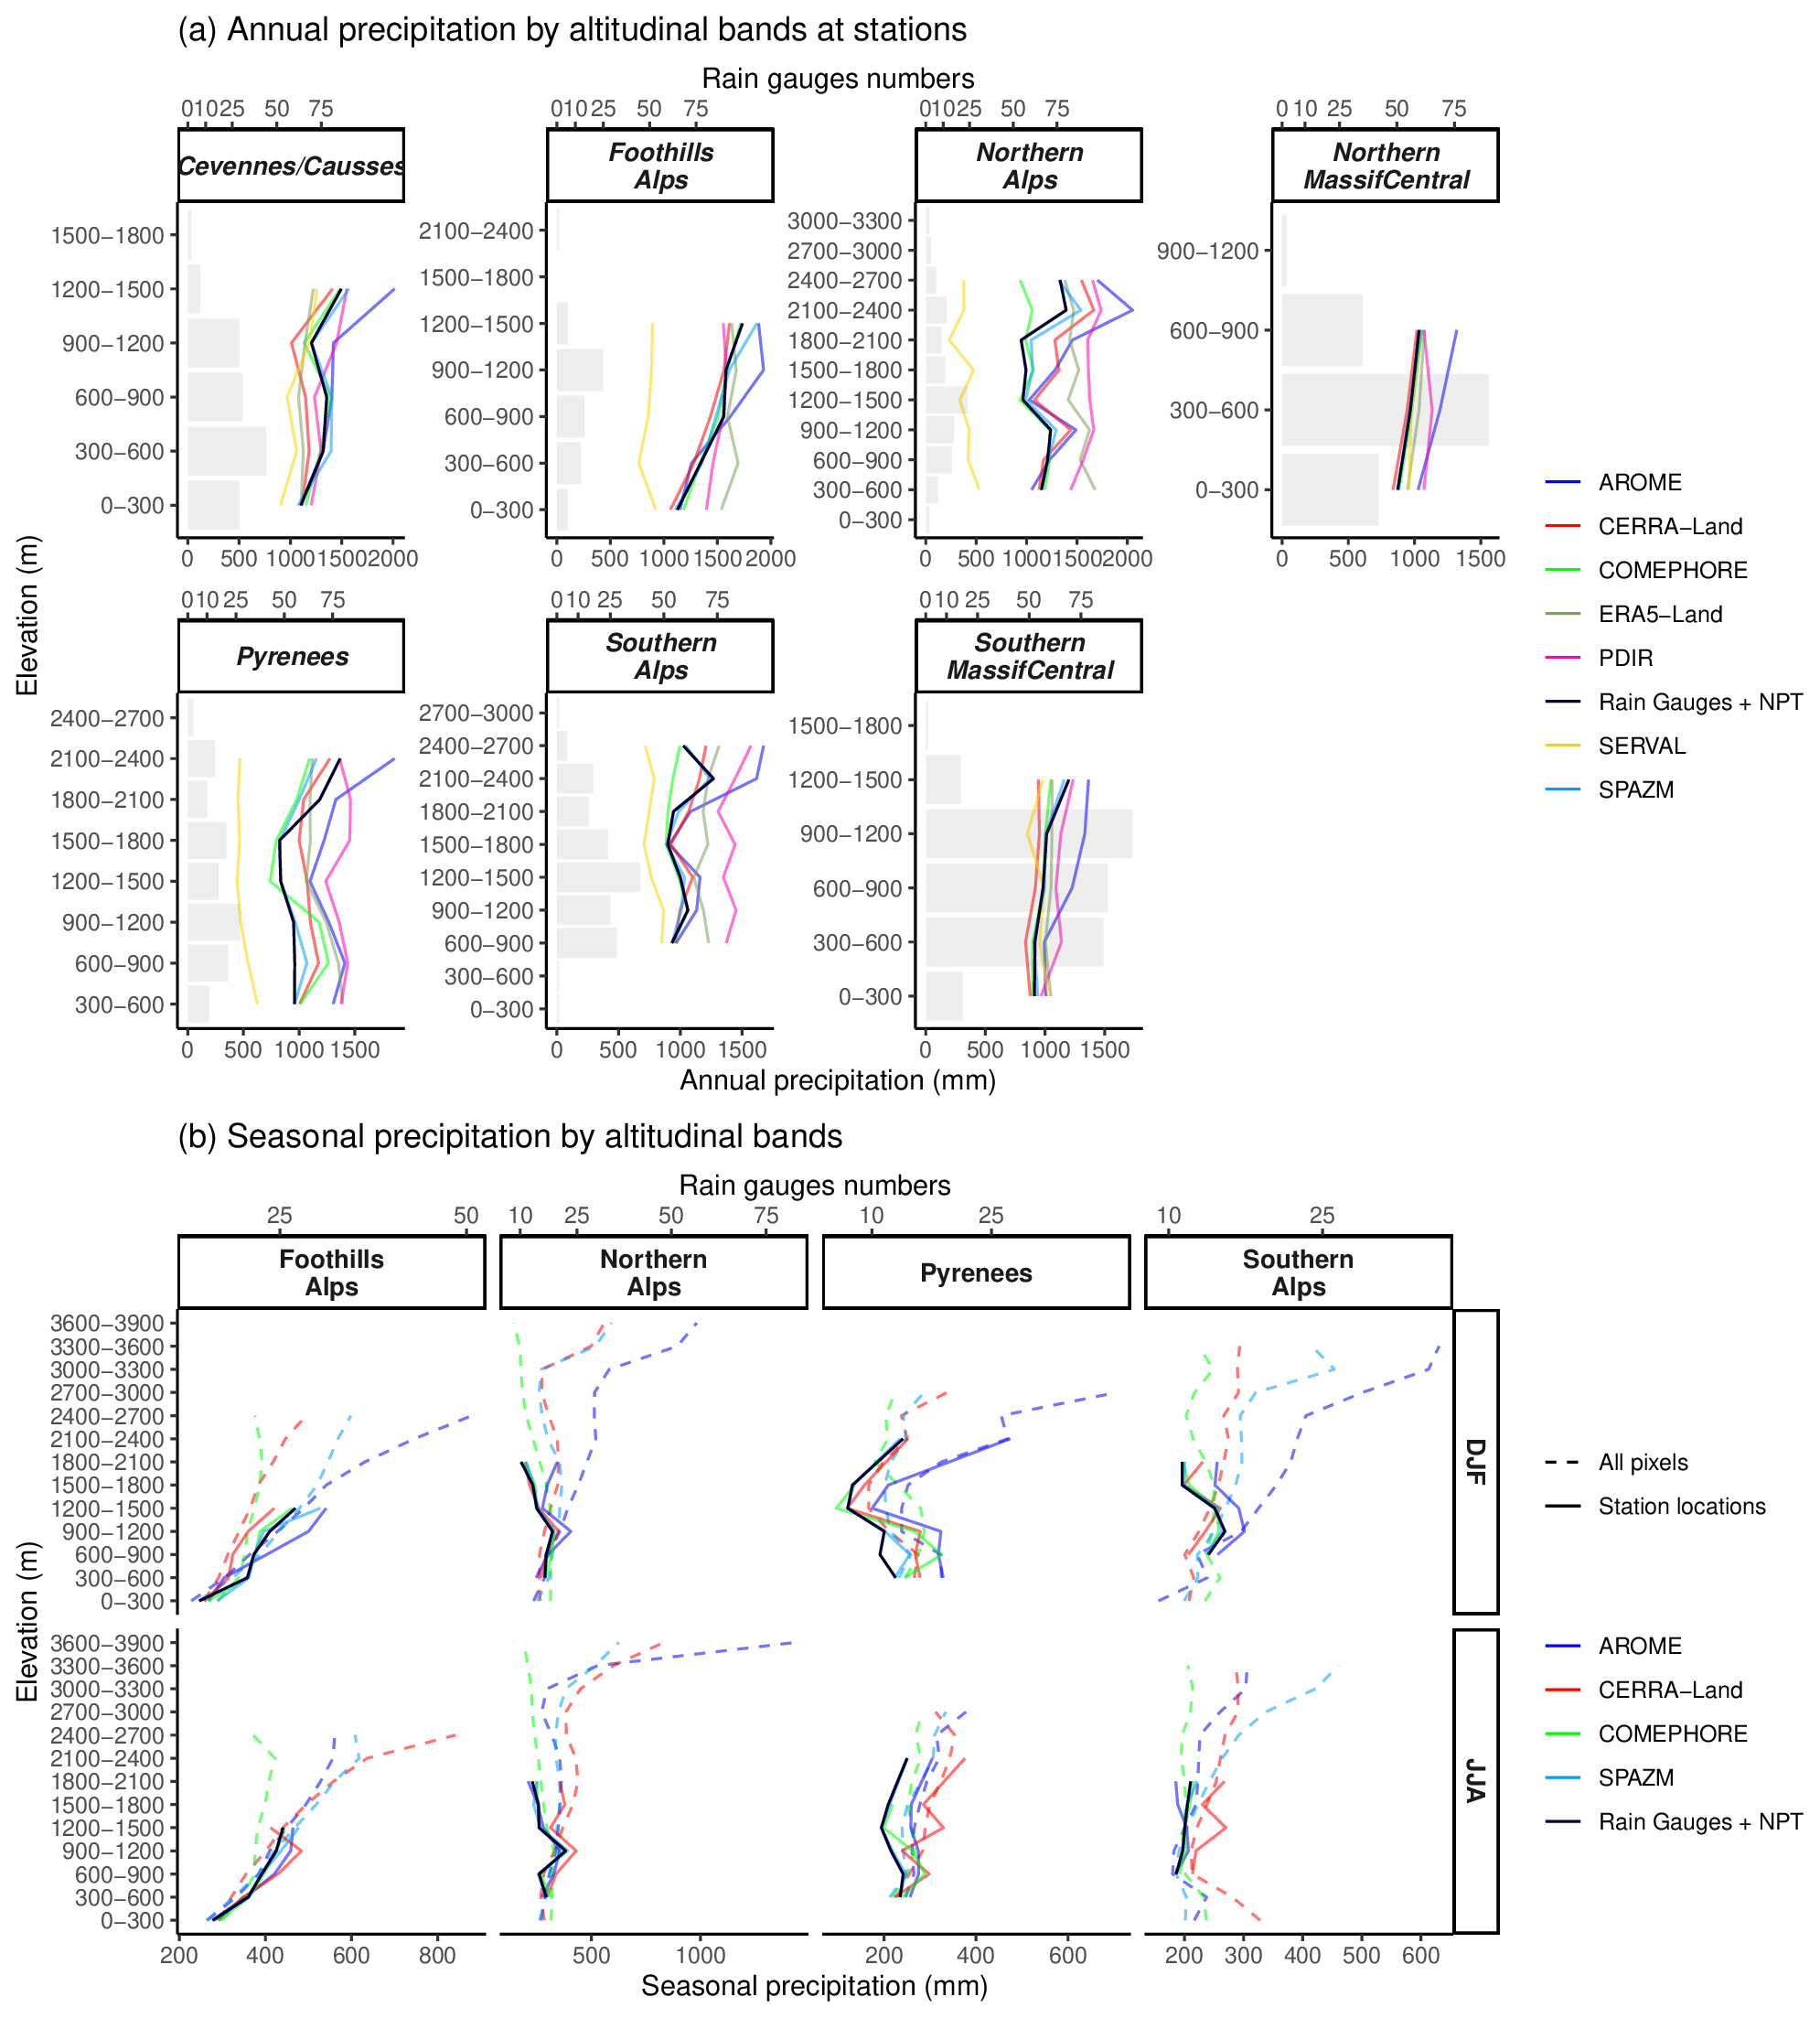
Figure 3Comparison between the altitude dependence of precipitation from AROME, CERRA-Land, COMEPHORE, ERA5-Land, PDIR, SERVAL, SPAZM, and stations (rain gauges and NPTs) in seven regions. The lines show the median precipitation amount in each altitude zone, and the bars denote the number of rain gauges in each area. Comparisons are done at (a) the station locations at the annual scale and (b) both station locations and on all pixels from the gridded products at the seasonal scale. At the seasonal scale, only AROME, CERRA-Land, COMEPHORE, and SPAZM are analyzed for the sake of visualization. The season DJF refers to the winter (December, January, February), and the season JJA corresponds to the summer (June, July, August).
To investigate the ability of AROME, CERRA-Land, COMEPHORE, and SPAZM to reproduce the observed precipitation change with altitude at a fine spatial scale, Fig. 4 shows scatter plots of observed versus gridded precipitation relative difference (PRD). PRDs are defined for two neighboring (closest) stations as the difference in precipitation relative to the difference in altitude (see Sect. 3.2). PRDs are computed on all pairs of the closest stations within the region of interest. Figure S3 presents the PRDs scatter plots for all seasons. The same results observed in Fig. 3b appear. PRDs from COMEPHORE and SPAZM are unbiased as the points are close to the 1:1 lines. The variance in the PRD errors is higher with AROME and CERRA-Land. PRDs from CERRA-Land seem unbiased on average, and those from AROME are a little too high in winter. Figure 4 also reveals more difficulties for AROME, CERRA-Land, COMEPHORE, and SPAZM to reproduce observed summer than winter PRDs. PRDs with AROME are unbiased on average. It is thus possible to use AROME to model the altitude effect on seasonal precipitation at a fine spatial scale.
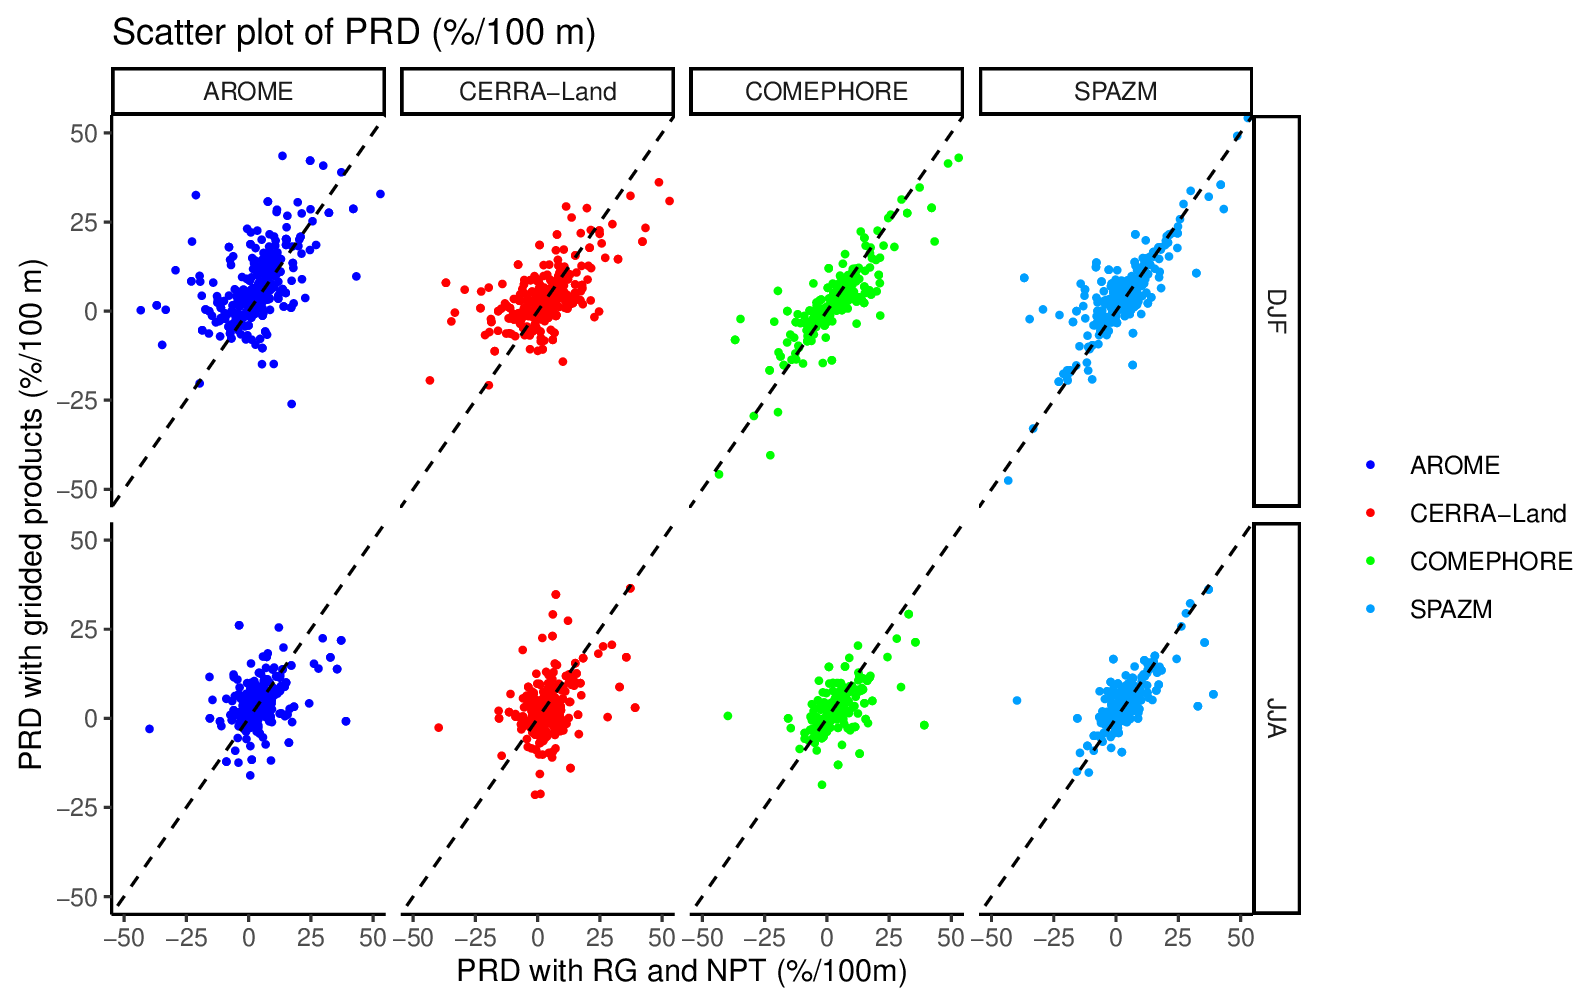
Figure 4Comparison of precipitation relative difference (% (100 m)−1) computed with stations and gridded rainfall products. PRDs are derived for all pairs of neighboring stations. Scatter plot between observed and gridded PRD at station locations. The dotted lines indicate the 1:1 line.
Figure 5 illustrates the relationship between seasonal precipitation and elevation through two transects in the Cévennes and the Northern Alps. A transect indicates a virtual line crossing the topography. Figure S4 shows the transects for all seasons. Seasonal precipitation from SPAZM is, by construction, fully correlated to the altitude, reacting to slight variations in the terrain. COMEPHORE and CERRA-Land are both less correlated to the altitude than SPAZM. CERRA-Land gives the same winter precipitation as SPAZM but different summer precipitation patterns. COMEPHORE produces similar amounts of precipitation to SPAZM in the Cévennes transect but lower ones in the Northern Alps transect. AROME has a strong relationship with the altitude. It is the gridded product with usually the highest seasonal amounts in high altitudes. For example, winter precipitation reaches 600 mm in the Cévennes with AROME, almost 500 mm with SPAZM, and 400 mm with COMEPHORE and CERRA-Land.
COMEPHORE and CERRA-Land sometimes exhibit a negative correlation to the altitude. The behavior of COMEPHORE is surprising in the Northern Alps between 8 and 15 km after the beginning of the transect. The COMEPHORE summer precipitation amount is the lowest for the highest pixel on the transect. CERRA-Land is different from the other gridded products in summer for Cévennes, with a negative association with the altitude for the first 80 km of the transect. SPAZM exhibits a higher correlation than AROME to the local topography. As a result, SPAZM precipitation maximums coincide with the summits, while those of AROME are reached before the summits in the Northern Alps, for example. Another major difference between AROME and SPAZM is the seasonality of precipitation. In the first 20 km of the Northern Alps transect, while SPAZM shows similar seasonal precipitation patterns, AROME seasonality is more marked, with two peaks in precipitation in winter at 5 and 15 km and only one in summer. Moreover, in the Northern Alps transect, SPAZM produces higher summer precipitation than winter precipitation (400 mm against 300 mm), unlike AROME.
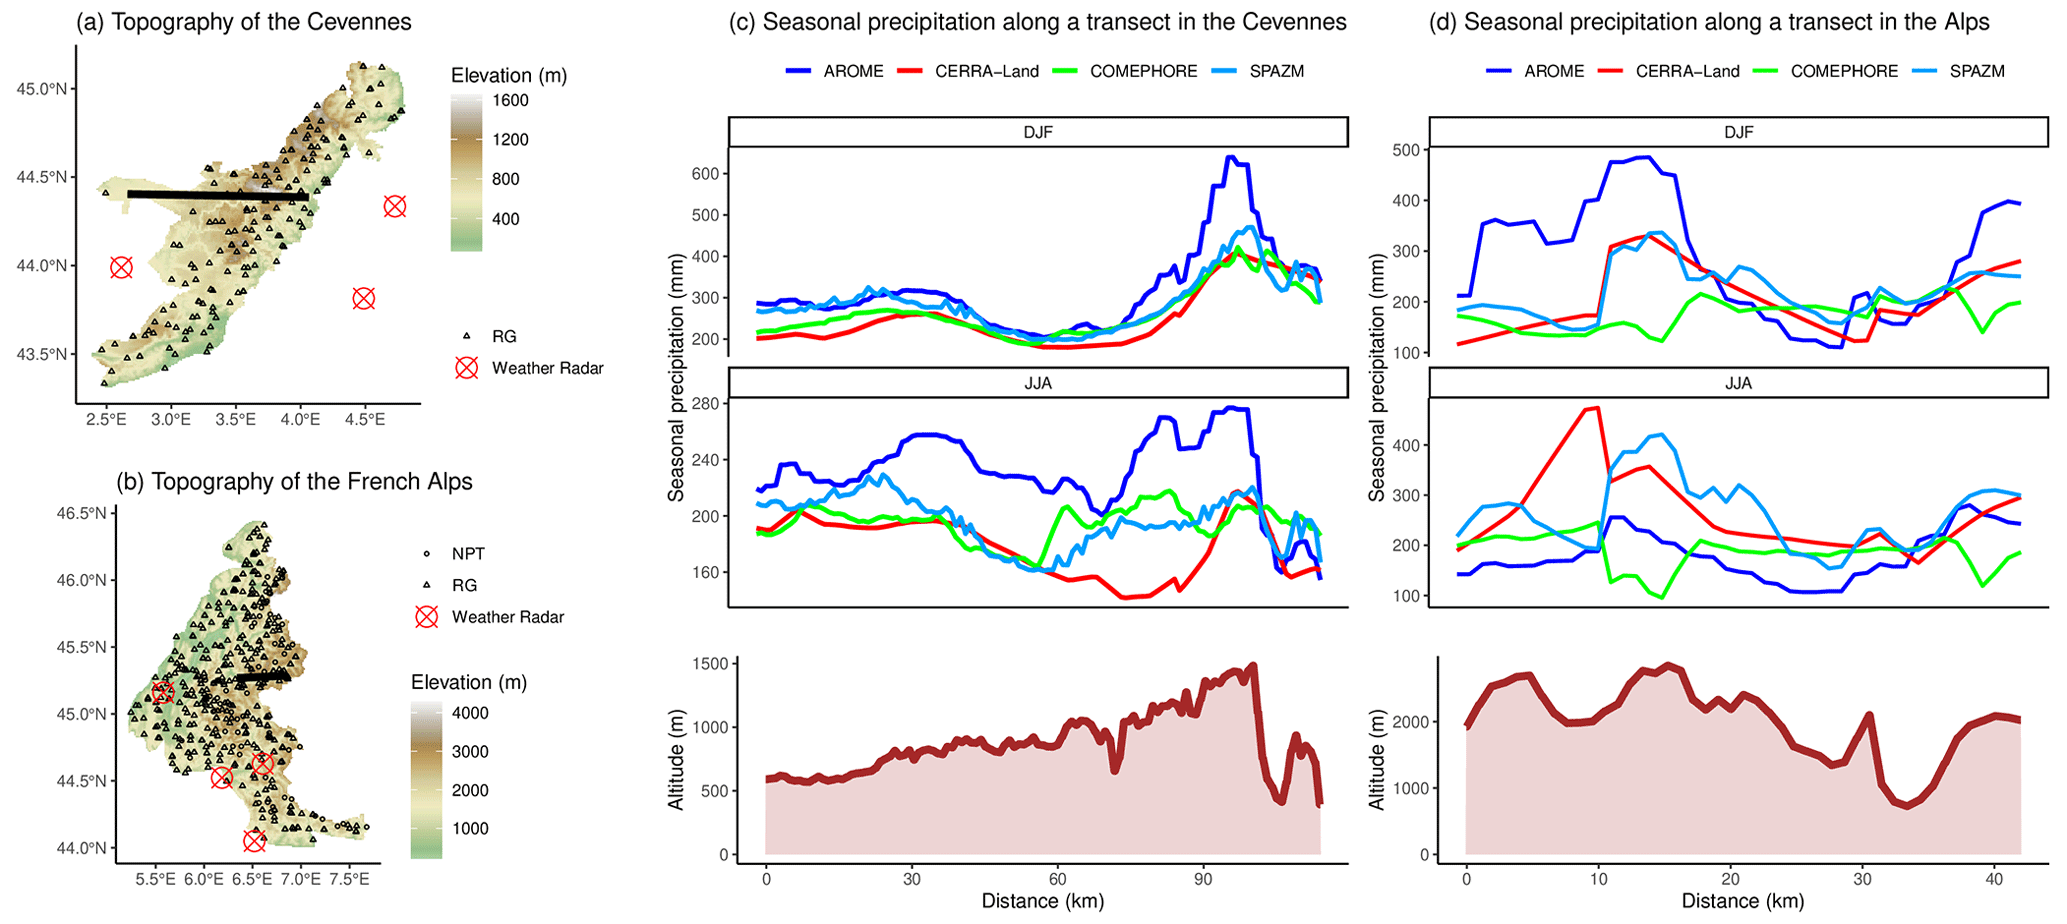
Figure 5Transects in the Cévennes (a) and the Northern Alps (b). Winter DJF and summer JJA precipitation extracted across the transects are colored according to gridded products (c, d). Elevation is represented in brown as an altitude profile.
Overall, AROME and SPAZM demonstrate the ability to replicate the altitude-dependent variations in the annual and seasonal precipitation in the regions of interest. In comparison to commonly used gridded precipitation products such as satellite and radar data, AROME and SPAZM exhibit stronger correlations with observed precipitation. The evolution of AROME seasonal precipitation with altitude is consistent with that of stations, despite suspicious summer precipitation in very high altitudes in the Northern Alps and a too rapid rise in winter precipitation. In regions with sparse networks of stations, products based on stations such as SPAZM may be unable to capture the impact of local topography on precipitation. Since our objective is to investigate the spatial variability in the PLR at the catchment scale, SPAZM will be inadequate for this purpose. AROME should be preferred to SPAZM in ungauged areas. PLRs are therefore computed with AROME simulations from 1982 to 2018. The long temporal period of more than 30 years allows the investigation of PLR at the climatological scale.
4.2 Spatial and seasonal variability in the precipitation lapse rates
Initially, seasonal PLRs are computed at the sub-regional scale on the 23 massifs in the French Alps. Second, seasonal PLRs are computed on catchments that form a subdivision of the massifs. Figure 6a displays the R2 at the sub-regional (massif) scale of the regressions between AROME seasonal precipitation and the altitude. Values of PLRs and R2 at the sub-regional scale are provided in Table 4. In winter, values of R2 are close to 0.5 in the foothills of the Alps (Chartreuse, Bauges, Aravis, and Chablais), in the Northern Alps (Beaufortain, Belledonne, and Mont Blanc), and in the Southern Alps (Queyras, Thabor, Oisans, Devoluy, Champsaur, Pelvoux, Ubaye, and Haut Var–Haut Verdon). Regression quality in the Central Alps (Grandes Rousses, Maurienne, Vanoise, and Haute Tarentaise) is not high enough to conclude on PLR values. Winter precipitation from AROME is, for instance, not correlated to the altitude in the Haute Tarentaise massif (R2 equals 0.12). In summer, the same spatial pattern is observed with lower values of R2, indicating that the altitude is better correlated with winter precipitation than summer precipitation in the French Alps.
The fine resolution of AROME provides the possibility for the investigation of the spatial variability in the relationship between seasonal precipitation and altitude at the catchment scale. Figure 6c shows the R2 values at the catchment scale. R2 values obtained from regressions are higher at the catchment scale than at the sub-regional scale for both winter and summer seasons. Similar to the sub-regional scale, R2 values are generally higher in winter than in summer. In winter, the regression quality does not show a clear spatial pattern, except for lower R2 in the eastern Alps (Haute Tarentaise, Haute Maurienne, Thabor, and Queyras). The R2 values show a large spatial variability. In the foothills of the Alps (Vercors, Chartreuse, Bauges, and Aravis), strong R2 (0.75–1) can be found at the borders of the massifs next to small R2 (0–0.5) inside the massifs. In summer, the regressions are of poor quality in the Northern and Central Alps. The massifs in the Southern Alps and some in the foothills of the Alps (Chartreuse, Bauges, and Chablais) do not show a clear deterioration of R2 compared to the winter. In some massifs like the Maurienne in winter, the R2 values are more than 0.5 at the catchment scale and close to 0 at the sub-regional scale. In the same way, the massifs, where the regression fits are correct at the sub-regional scale (Thabor and Haute-Maurienne), do not necessarily contain the best fit at the catchment scale. It indicates that the previous regressions (Fig. 6a) are likely conducted over excessively broad areas.
Figure 6b and d, respectively, display the PLRs of AROME seasonal precipitation at the sub-regional and catchment scales. We remark higher PLRs at the catchment scale (a mean of 5.43 % (100 m)−1 in winter and 3.31 % (100 m)−1 in summer) than at the sub-regional scale (a mean of 4.73 % (100 m)−1 in winter and 2.79 % (100 m)−1 in summer). We consider that a R2 value smaller than 0.5 is too small to interpret the slope of the regressions. The spatial variability in the seasonal PLRs can therefore not be investigated at the sub-regional scale. We will only describe PLR values at the catchment scale because of better regressions. Figure 6d reveals higher PLRs in winter, with very high values (8 % (100 m)−1–15 % (100 m)−1) and high values (5 % (100 m)−1–8 % (100 m)−1) mainly located at the border of the Alps (Devoluy, Thabor, and Chablais). Moderate (3 % (100 m)−1–5 % (100 m)−1) PLRs are present in almost all massifs and do not show a clear spatial pattern, such as a north–south separation. Small (0 % (100 m)−1–3 % (100 m)−1) PLRs are mainly found inside the massifs of the foothills of the Alps (Vercors, Chartreuse, and Aravis) and in the far Southern Alps (Mercantour and Haut Var–Haut Verdon). In summer, the majority of PLRs are small (0 % (100 m)−1–3 % (100 m)−1), but some catchments at the border of the Alps (Bauges, Devoluy, and Haut Var–Haut Verdon) have moderate (3 % (100 m)−1–5 % (100 m)−1) or high PLRs (5 % (100 m)−1–8 % (100 m)−1). Figure 6 shows that the quality and slope of the regression can vary widely across the French Alps, with higher values at the borders. A sub-region like the Vercors massif covers around 1350 km2 and presents a considerable geographic heterogeneity in PLR values. Figures S5, S6, S7, and S8 illustrate the results of the regressions for all seasons.
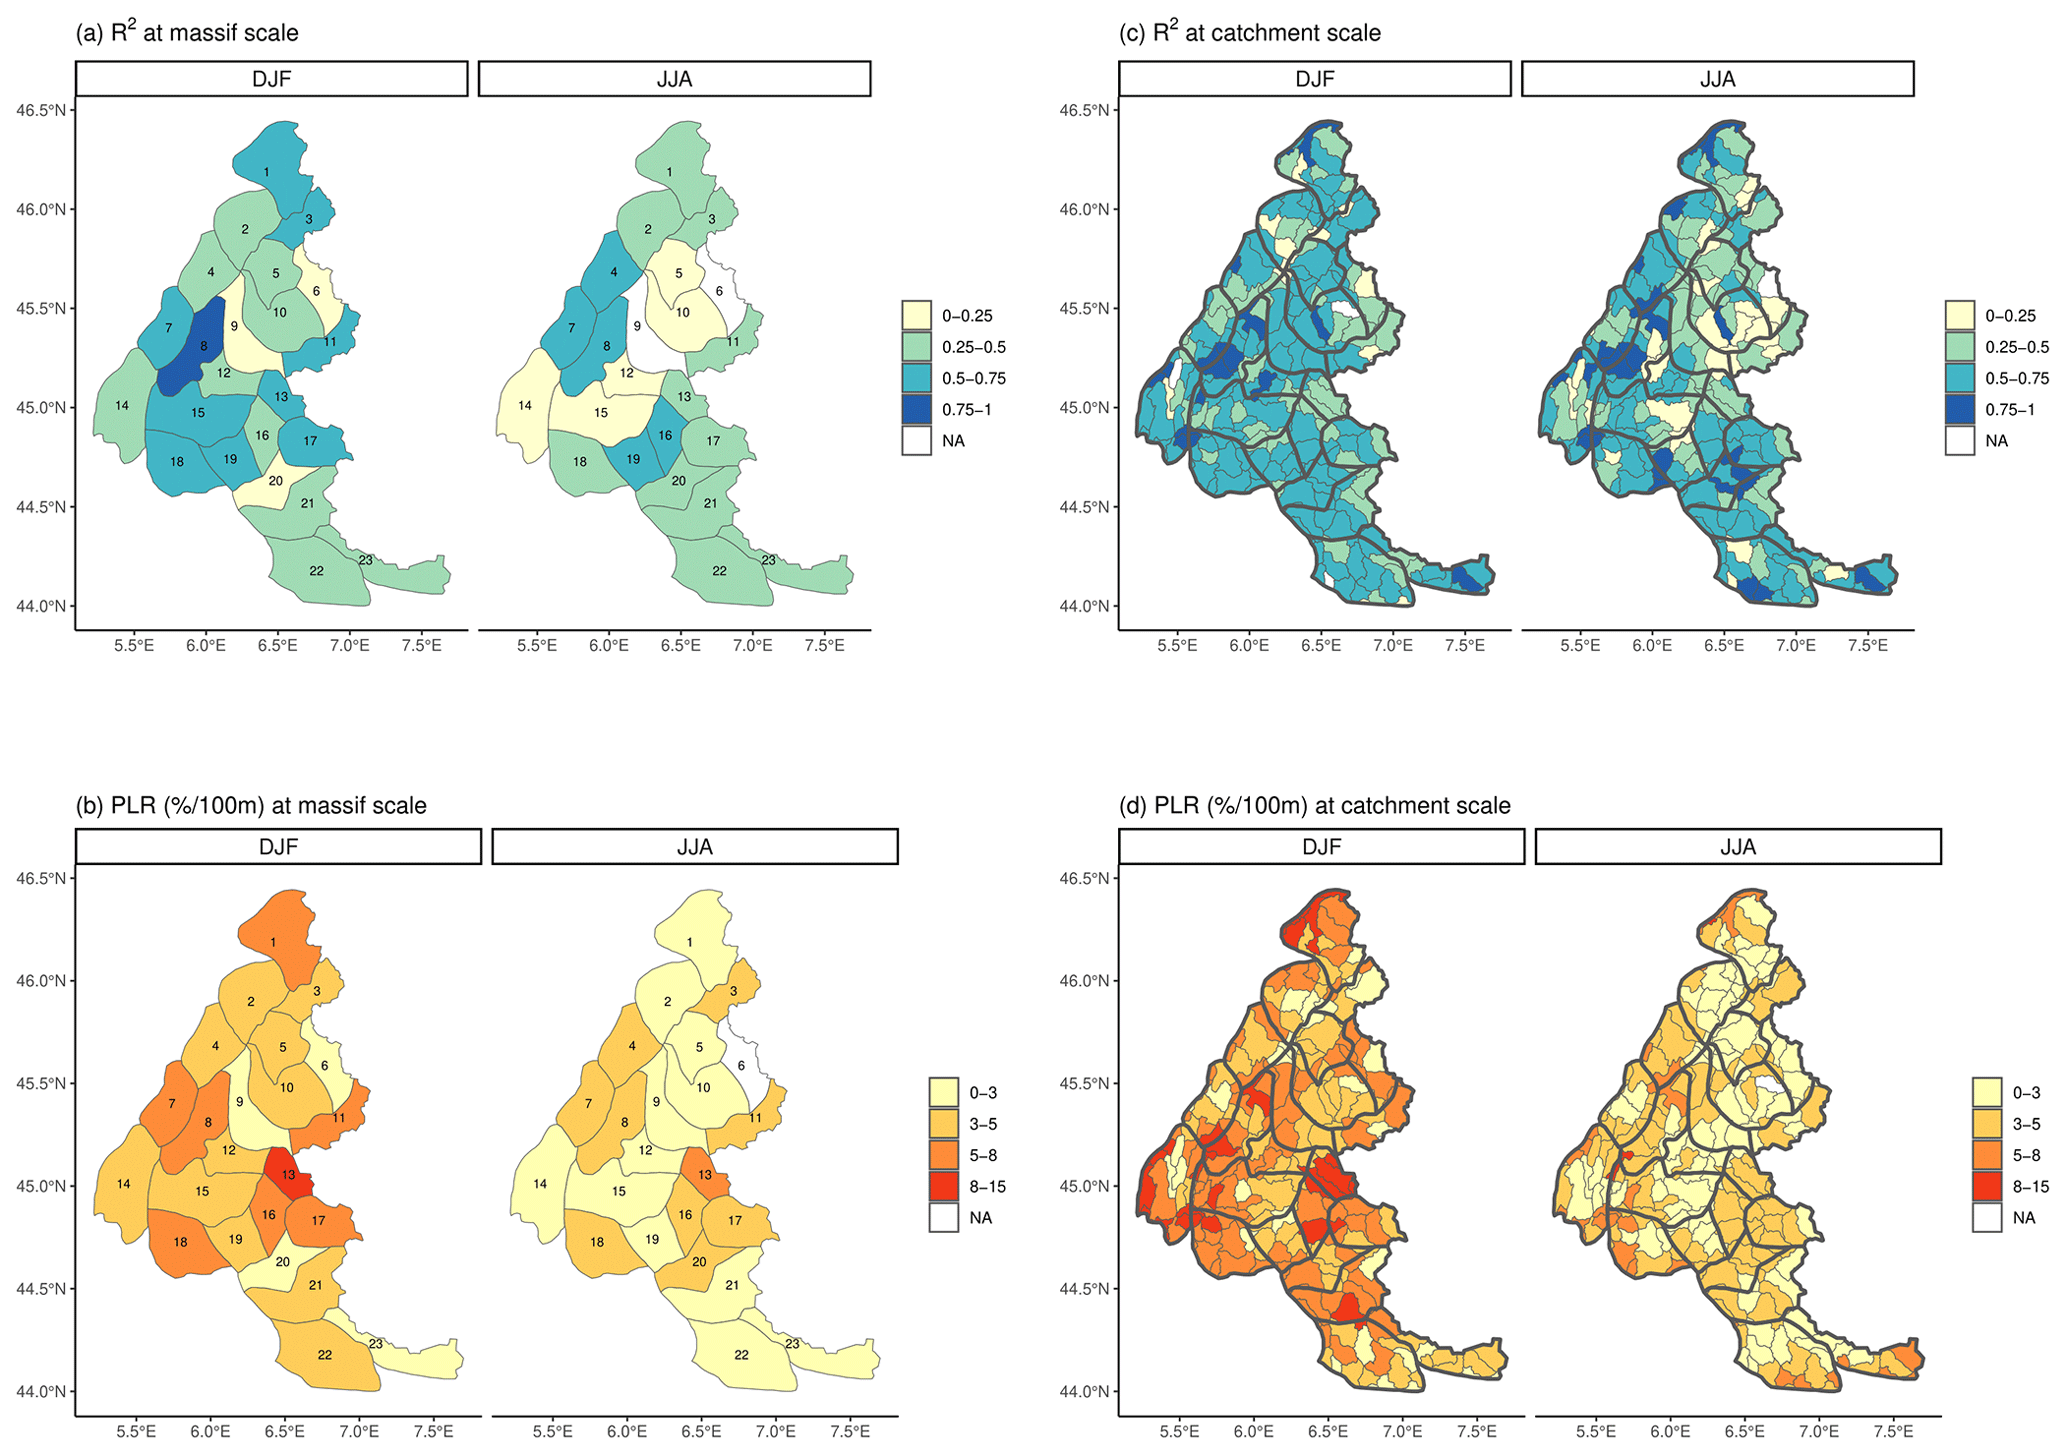
Figure 6Spatial distribution of R2 (a, c) and precipitation lapse rates (precipitation change per 100 m altitude difference divided by area-averaged precipitation) (b, d) extracted from the precipitation–altitude regressions for all grids within each area. Categorical results are displayed in the French Alps at regional and catchment scales for both winter DJF and summer JJA precipitation. The area indicated as “NA” and filled in white represents regions with insufficient altitudinal variability to compute precipitation gradient. The indexes of the massifs are also printed and refer to Table 3.
Table 3Values of precipitation lapse rates (precipitation change per 100 m altitude difference divided by area-averaged precipitation) and R2 at the sub-regional scale for the 23 French massifs for both winter DJF and summer JJA. The Massif number is indicated in Fig. 6.
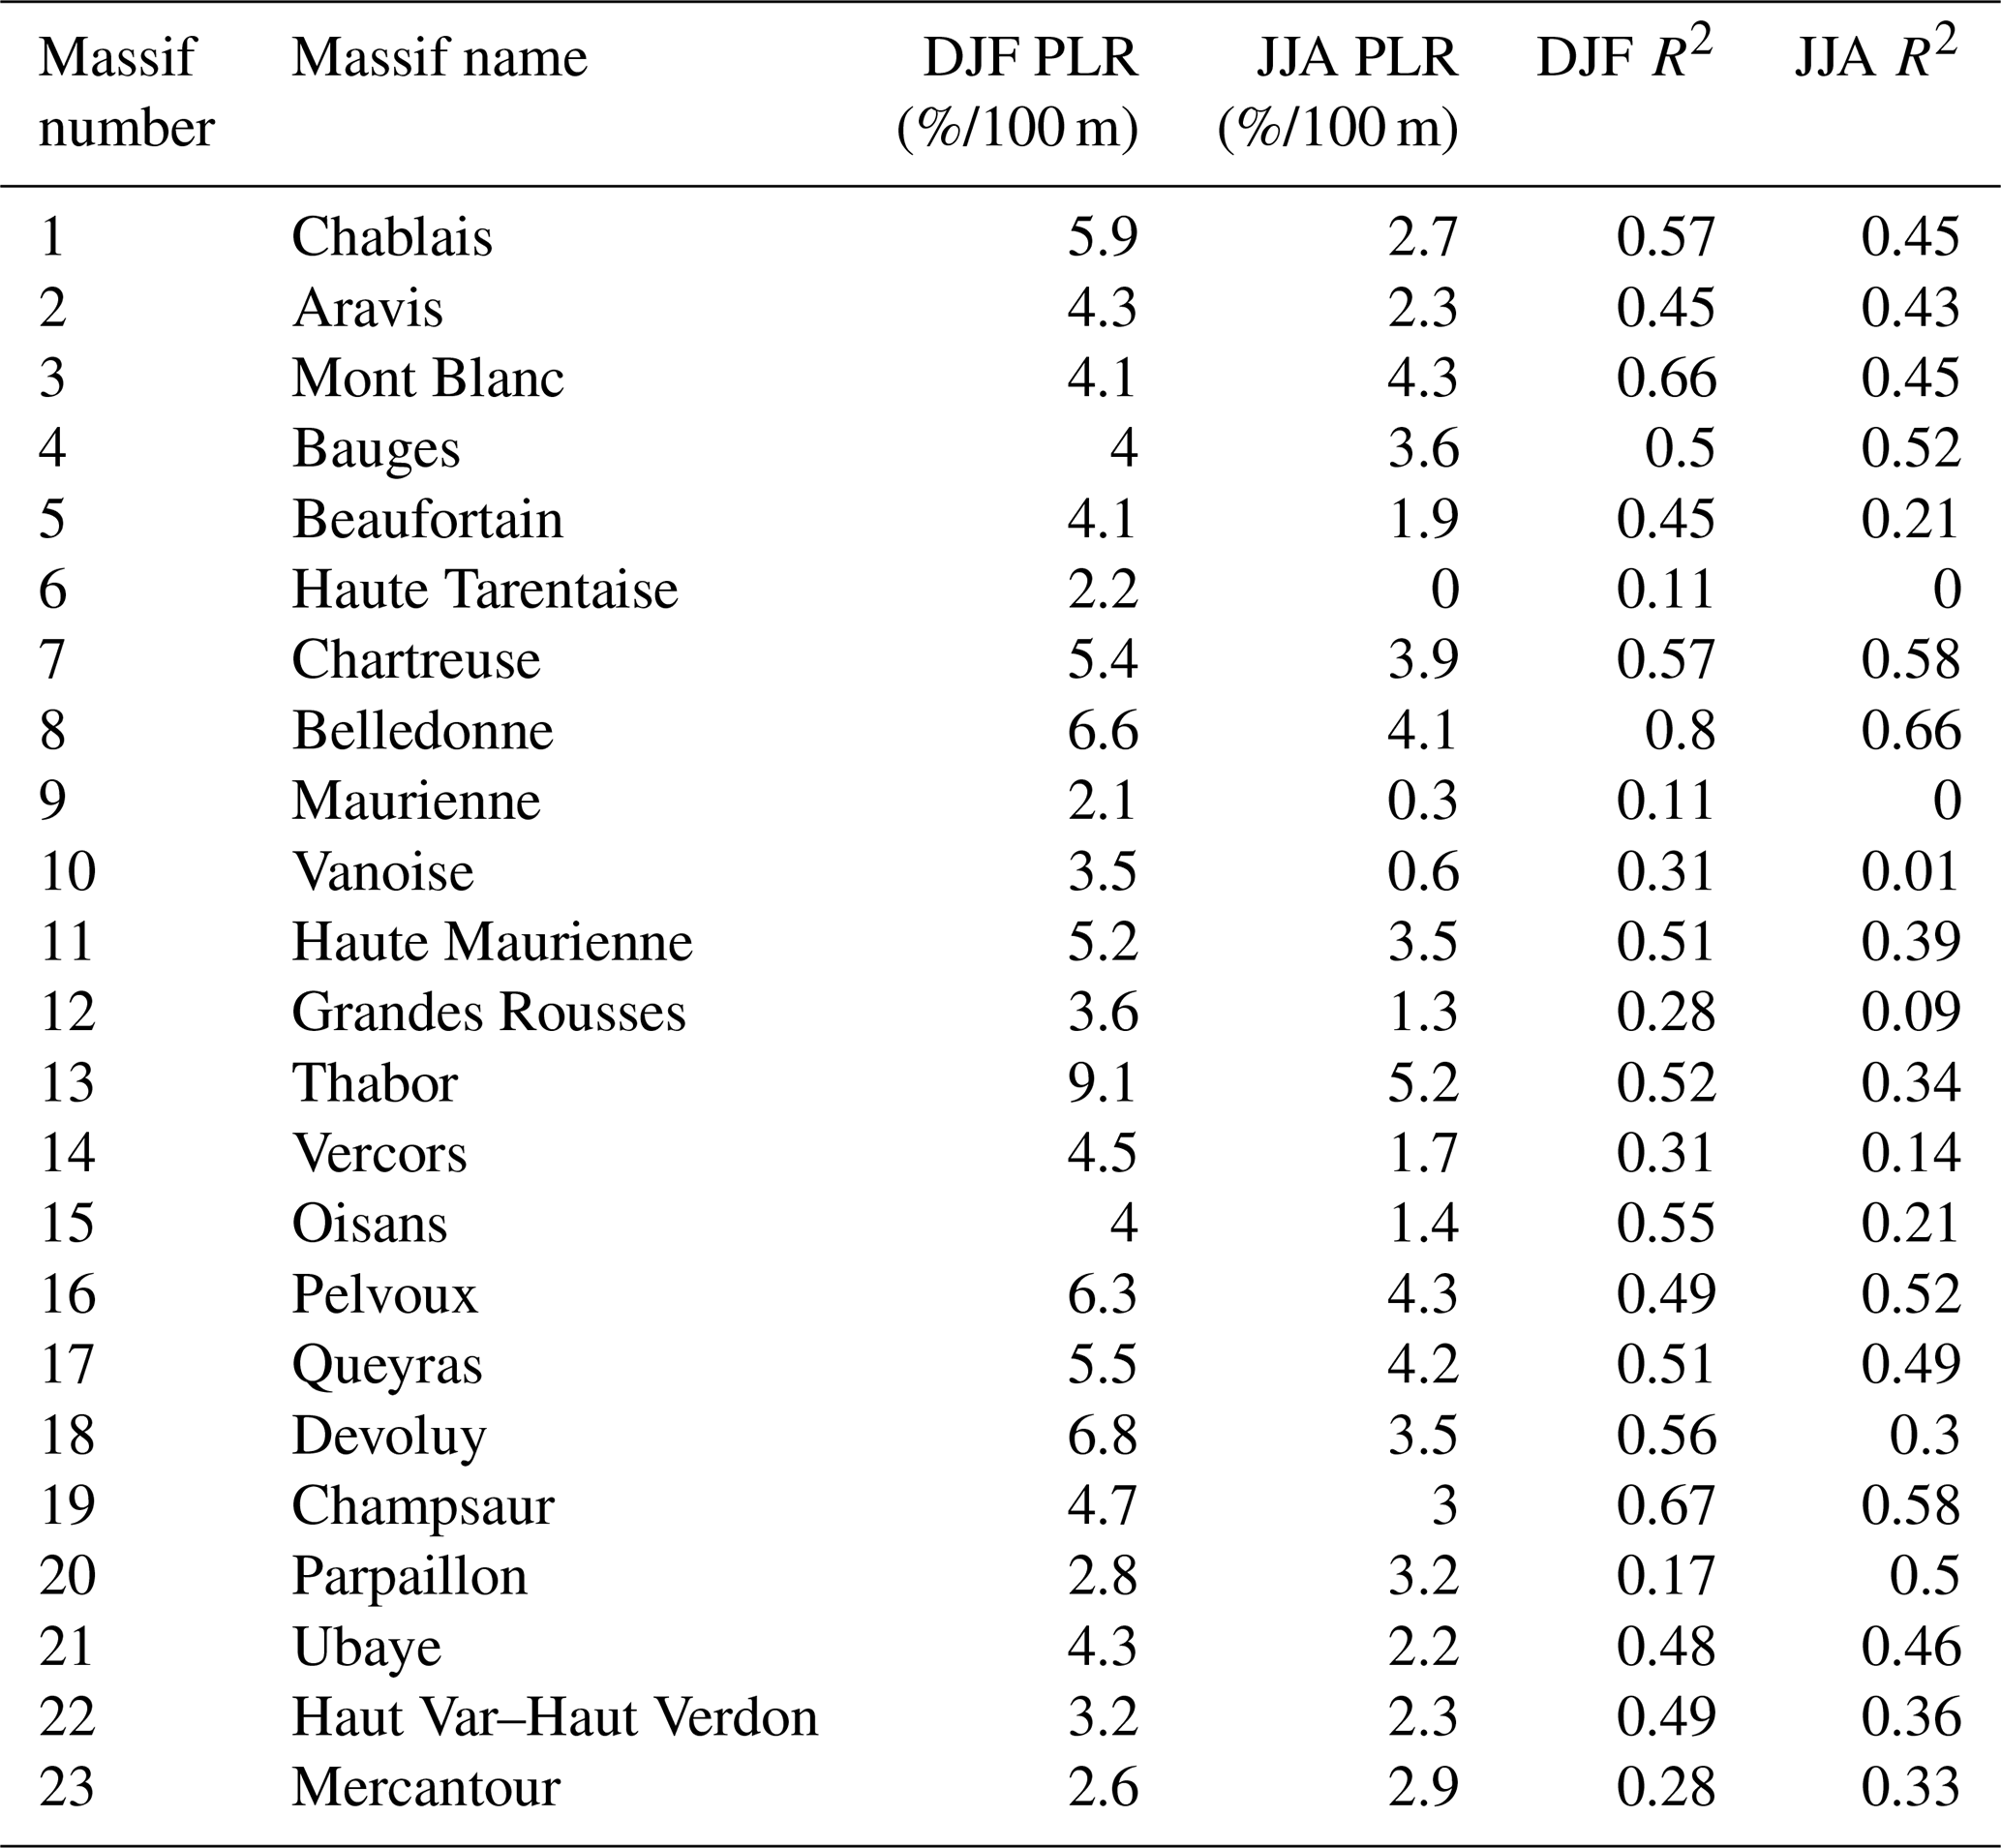
Figure 7 shows the winter and summer PLRs at the catchment scale in the study domain. Results for the other seasons are available in Figs. S9 and S10. The catchments located in the Morvan, the Massif Central, the Jura Mountains, the eastern Pyrenees, and the catchments close to the Mediterranean with enough altitude variation (standard deviation of the altitude higher than 50 m) have the strongest PLRs. These values are higher than those of the Alps, as they can reach 32 % (100 m)−1. Values between 8 % (100 m)−1 and 15 % (100 m)−1 are also considerably more frequent than in the Alps. In the study domain, 40 % of the catchments with R2 > 0.5 have winter PLR greater than 8 % (100 m)−1. This percentage drops to 15 % if we only consider the Alps. The slopes of the regression have higher variability in the Alps and the Pyrenees. PLRs are seasonally varying, with generally the highest values in winter. In winter, the Massif Central hosts the strongest PLRs. In summer, the Mediterranean area, ranging from the eastern Pyrenees to the Mediterranean Alps, has the highest PLRs.
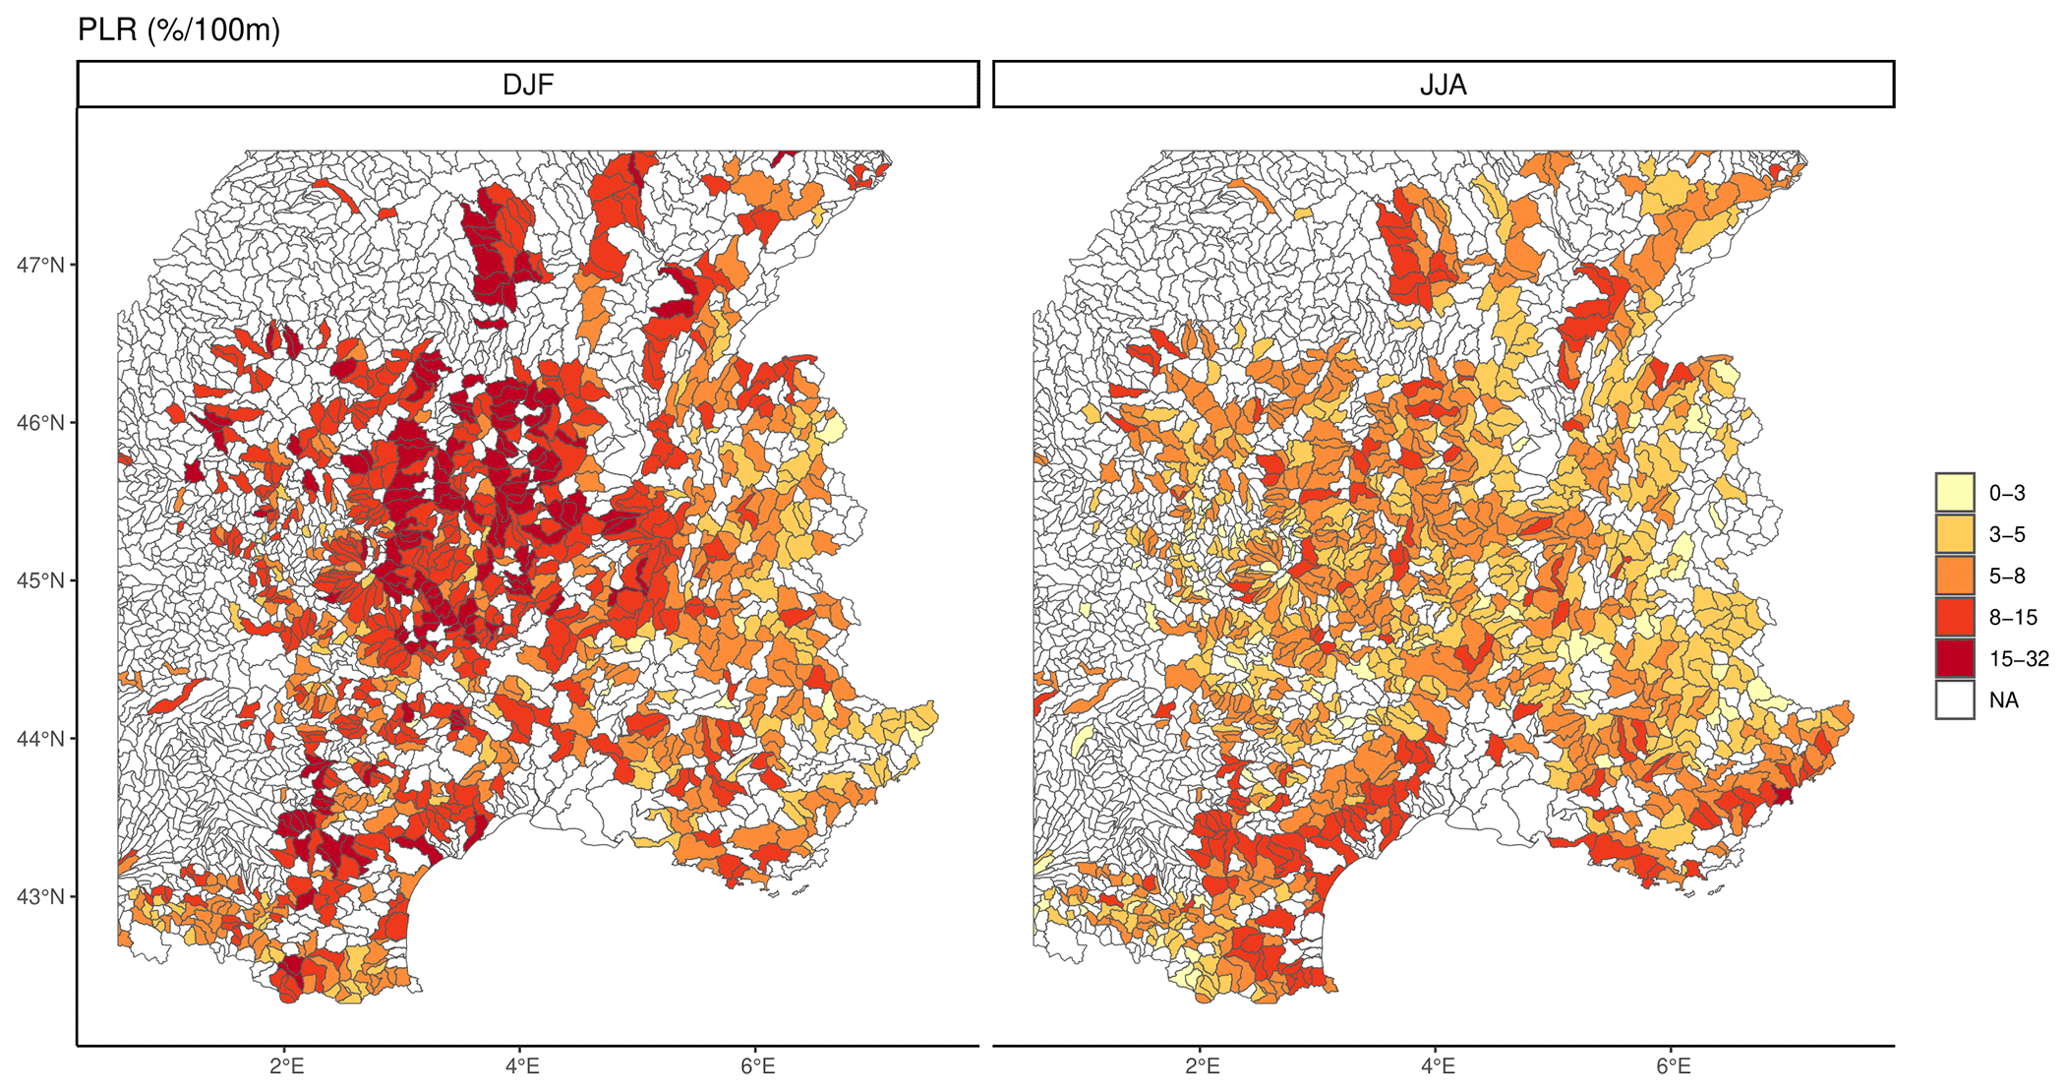
Figure 7Spatial distribution of winter DJF and summer JJA precipitation lapse rates (precipitation change per 100 m altitude difference divided by area-averaged precipitation) extracted from the precipitation–altitude regressions for all grids within each area. Categorical results are displayed in the study domain at the catchment scale. The area indicated as “NA” and filled in white represents catchments with insufficient altitudinal variability (standard deviation of the altitude lower than 50 m) or R2 smaller than 0.5.
To summarize, PLRs are generally higher in winter than in summer. PLRs are sensitive to the spatial scale, with higher values at the catchment scale than the sub-regional (massif) scale. Spatial patterns of significant PLRs vary according to the season in France. In winter, the higher PLRs reach 32 % (100 m)−1 and are mainly located in the Massif Central. In summer, PLRs are lower and reach larger values on the Mediterranean coast. PLRs vary notably in space, even within a single mountain range such as the French Alps.
4.3 Linearity of the relationship between annual precipitation and altitude
To assess the linearity of the regressions performed in Fig. 7, piecewise linear regressions were compared to linear regressions through the BIC ratio (see Sect. 3.3). Figure 8a illustrates the BIC ratio categories (Table 2) with some examples of scatter plots and corresponding regressions. Colors refer to categories of the logarithm of Br. Based on the scatter plots, we consider the relationship between annual precipitation and altitude not linear when there is strong or decisive evidence for M1 (red color). Figure 8b shows the spatial distribution of the logarithm of the Br values. In total, 10 % of the catchments show decisive evidence for M1. It appears mainly in the Massif Central, the Jura Mountains, and the Southern Alps. In the other regions (Northern Alps and Pyrenees), it is sufficient to use a linear regression to derive PLR. Figure 8c shows the distribution in surface areas of the catchments among the five categories of Br. Strong Br are mainly found for large catchments, revealing the spatial-scale dependence of PLR discussed in Sect. 5.3. Too much spatial heterogeneity is still present in some catchments (last scatter plot in Fig. 8a), suggesting an even finer spatial division and taking into account the aspect and the slope of the terrain faces. Large catchments can have slopes with different orientations, for instance. Figure S12 provides the same diagnostic of the linearity for AROME seasonal precipitation.
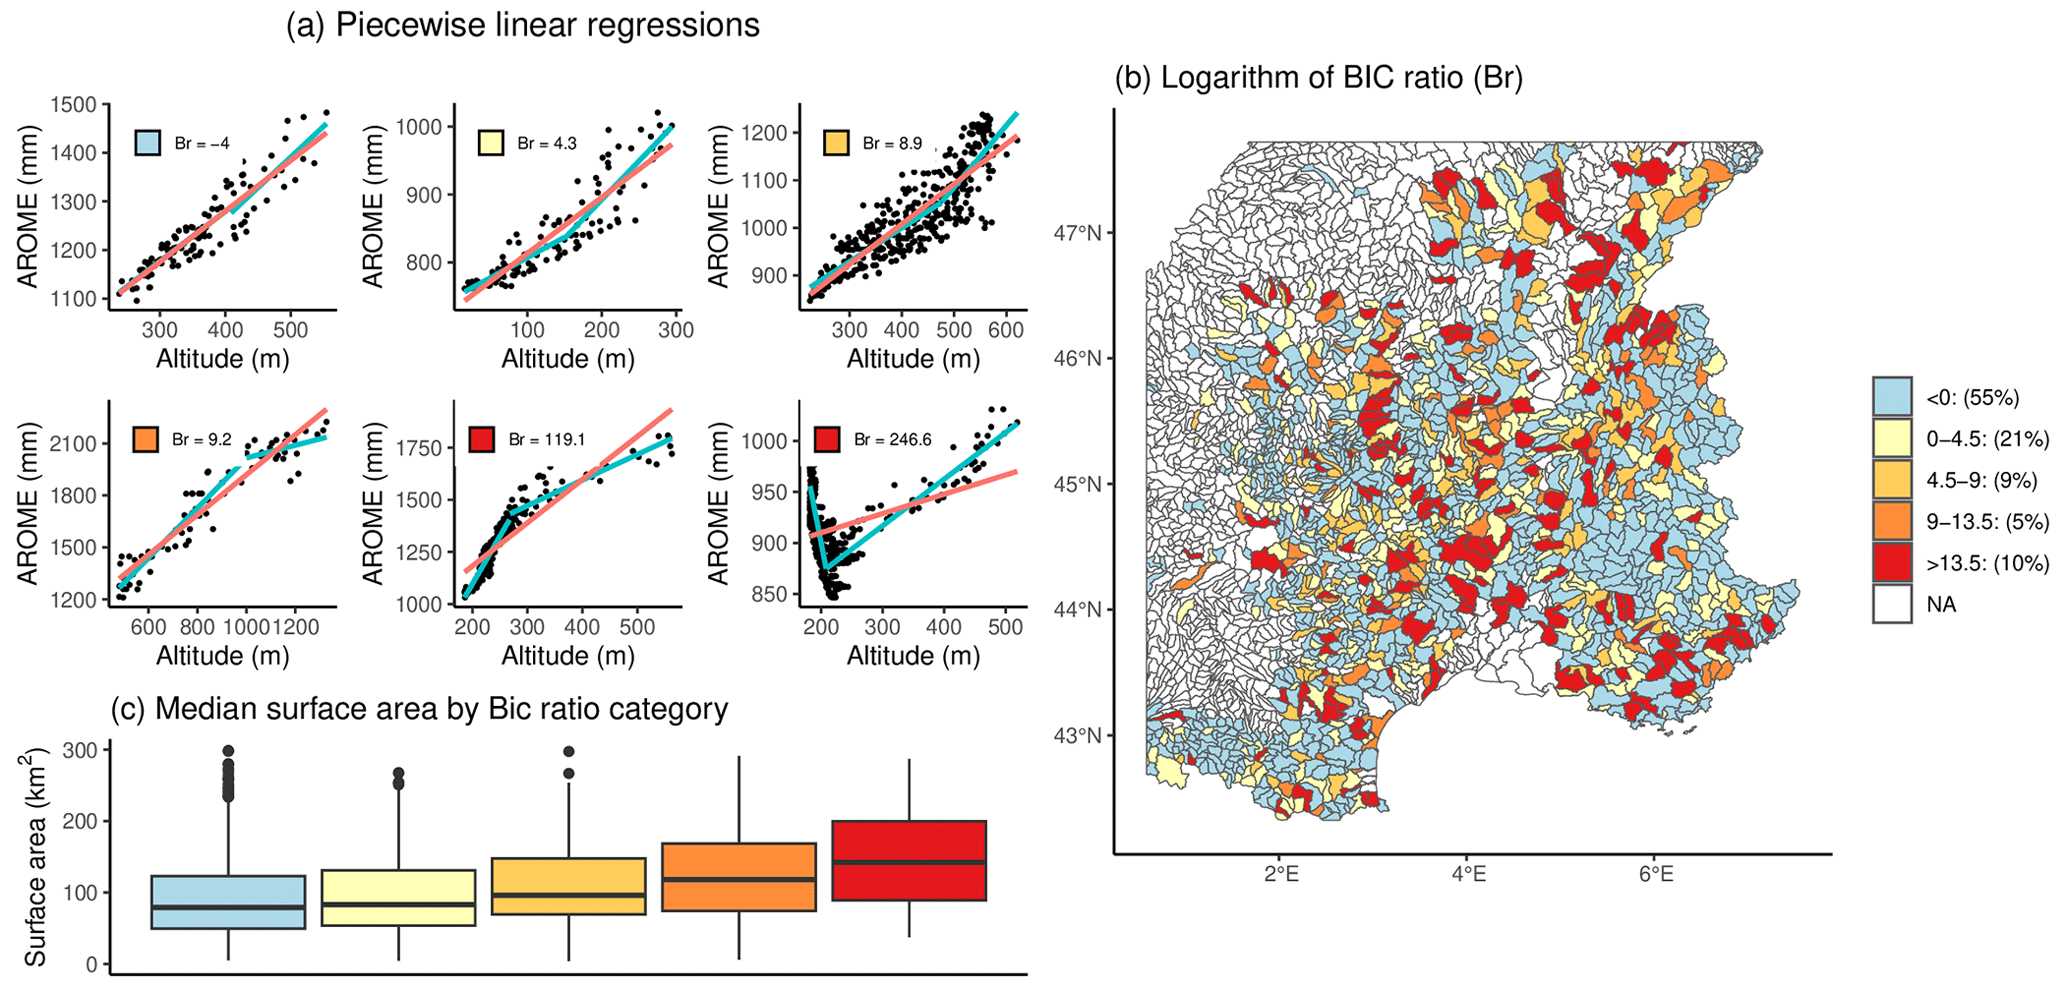
Figure 8(a) Scatter plots of AROME annual precipitation (mm) as a function of the altitude for some catchments taken as illustrative examples of the different categories of BIC ratio. Linear (red lines) and piecewise linear (blue curves) regressions are superimposed. (b) Spatial representation of the logarithm of the BIC ratios between linear and piecewise linear regression (annual precipitation ∼ altitude) models. The numbers expressed in percent correspond to the percentage of catchments within the classes of the BIC ratio. (c) Distribution of the surface area of the catchments according to the categories of BIC ratio.
In 90 % of the catchments, the regression between seasonal precipitation and altitude can be considered linear. The remaining 10 % often corresponds to larger catchments which could motivate the estimation of the PLRs on smaller areas in these cases.
5.1 Ability of gridded precipitation products to capture the relationship between annual/seasonal precipitation and altitude
This article reviews the potential of seven gridded precipitation products for precipitation gradient estimation in a complex topographic region. ERA5-Land, PDIR, and SERVAL underestimate annual precipitation gradients even for mid-range mountains. The limitations of these three gridded precipitation products are even more apparent in high-altitude regions such as the Northern Alps and the Southern Alps. The assimilation of satellite data and the non-use of rain gauge values in ERA5-Land and PDIR are an obstacle to their utilization in a complex topographic region such as France. These findings converge with those of Jiang et al. (2022), where they found that the satellite product Information Measures for the EU Cohesion policy (IMREG) cannot reproduce the precipitation gradient in Tibet. SERVAL does not use altitude as a co-variable to determine precipitation from individual radars. The uniform ratio applied for this product in the hourly correction only represents the station elevation range and not the entire radar coverage. The translation of reflectivity to precipitation amount using the vertical profile of reflectivity is another potential source of error that results in inaccurate negative precipitation gradients in Fig. 3. In their study of the French Alps at the sub-regional level, Faure et al. (2019) found a significant underestimation of precipitation gradient using PANTHERE, SERVAL's predecessor.
CERRA-Land, COMEPHORE, and SPAZM assimilate ground precipitation measurements from weather stations and are thus correlated with the annual precipitation observed at the stations. COMEPHORE leads to an adequate relationship between annual/seasonal precipitation and altitude in mid-mountain ranges highly instrumented as the southern Massif Central. However, in more complex topographical regions with sparse stations such as the Northern Alps, COMEPHORE relies heavily on radar data from high altitudes and is unable to accurately reproduce the increase in the precipitation with altitude. COMEPHORE processes fewer high-altitude stations than SPAZM, making it unable to represent precipitation in high-altitude areas correctly. The sharp decrease in the summer precipitation with altitude from COMEPHORE in the Northern Alps illustrated in Fig. 5d is likely due to the shielding of the radar beams by mountain ranges (Germann et al., 2006). CERRA-Land can replicate the observed seasonal precipitation enhancement with the altitude. However, at the annual scale, CERRA-Land is slightly biased in some regions, and the bias may change the sign according to altitudinal bands such as in the Pyrenees (Fig. 3a). SPAZM can reproduce the relationship between annual precipitation at station locations and altitude at the regional scale. This result is not surprising, as SPAZM interpolates precipitation observations from the stations, incorporating the effect of the altitude through local linear regressions. However, SPAZM is affected by the density of stations. In regions where the stations are more sparse, as in the Pyrenees, the annual precipitation from SPAZM does not match the annual precipitation from the stations. This suggests a possible limitation of SPAZM in ungauged mountainous regions. AROME, without rain gauge assimilation, can reproduce the relationship between seasonal precipitation and altitude despite a positive bias in winter in mountainous regions. We find that AROME produces higher annual/seasonal precipitation than the other gridded products. The difference in seasonal precipitation is limited at low altitudes and rises sharply at high altitudes. Higher precipitation accumulations with RCMs have been documented. In western Montana, in high-altitude areas where observations are sparse, Silverman et al. (2013) noted a higher annual precipitation with the Weather Research and Forecasting (WRF) model than with the Parameter-elevation Regressions on Independent Slopes Model (PRISM) (Daly et al., 1994). In India, Li et al. (2017) found that annual precipitation obtained with WRF is double or triple the amount of the satellite precipitation product Tropical Rainfall Measuring Mission (TRMM). The correlation between AROME and COMEPHORE on the Cévennes transect in summer (Fig. 5c) is comforting, as the radars operate well in summer in the Cévennes region (Delrieu et al., 2013). Moreover, the seasonality of the precipitation is taken into account with AROME (see Fig. 5c). AROME simulates precipitation without using rain gauge data and poorly matches the high-elevation gauges, which could be the combined effect of precipitation undercatch (Groisman and Legates, 1994; Sevruk, 1997; Pollock et al., 2018) and some deficiencies in AROME (Monteiro et al., 2022). In Fig. 3b, AROME shows a strong agreement with the rain gauges in summer (even the high-altitude ones). The differences are larger in winter, where precipitation mostly fall as snow. Precipitation undercatch is limited in summer and more important in winter with solid precipitation. This suggests that the precipitation undercatch could partly explain the differences between AROME and rain gauges.
To summarize, this study shows that the simulations of the CP-RCM AROME, despite winter precipitation overestimation, offer the opportunity to derive PLRs at a fine spatial scale. The other grid precipitation products obtained from radar, satellite, or rain gauge data show important limitations in a complex topography region. Radar is among the other products subjected to beam blocking. The satellite resolution is too coarse to represent the altitude effect on precipitation. Rain gauge networks are too sparse, and even high-density ones do not account for the spatial and altitudinal variability in the seasonal precipitation.
5.2 Values and spatial variability in the precipitation lapse rates
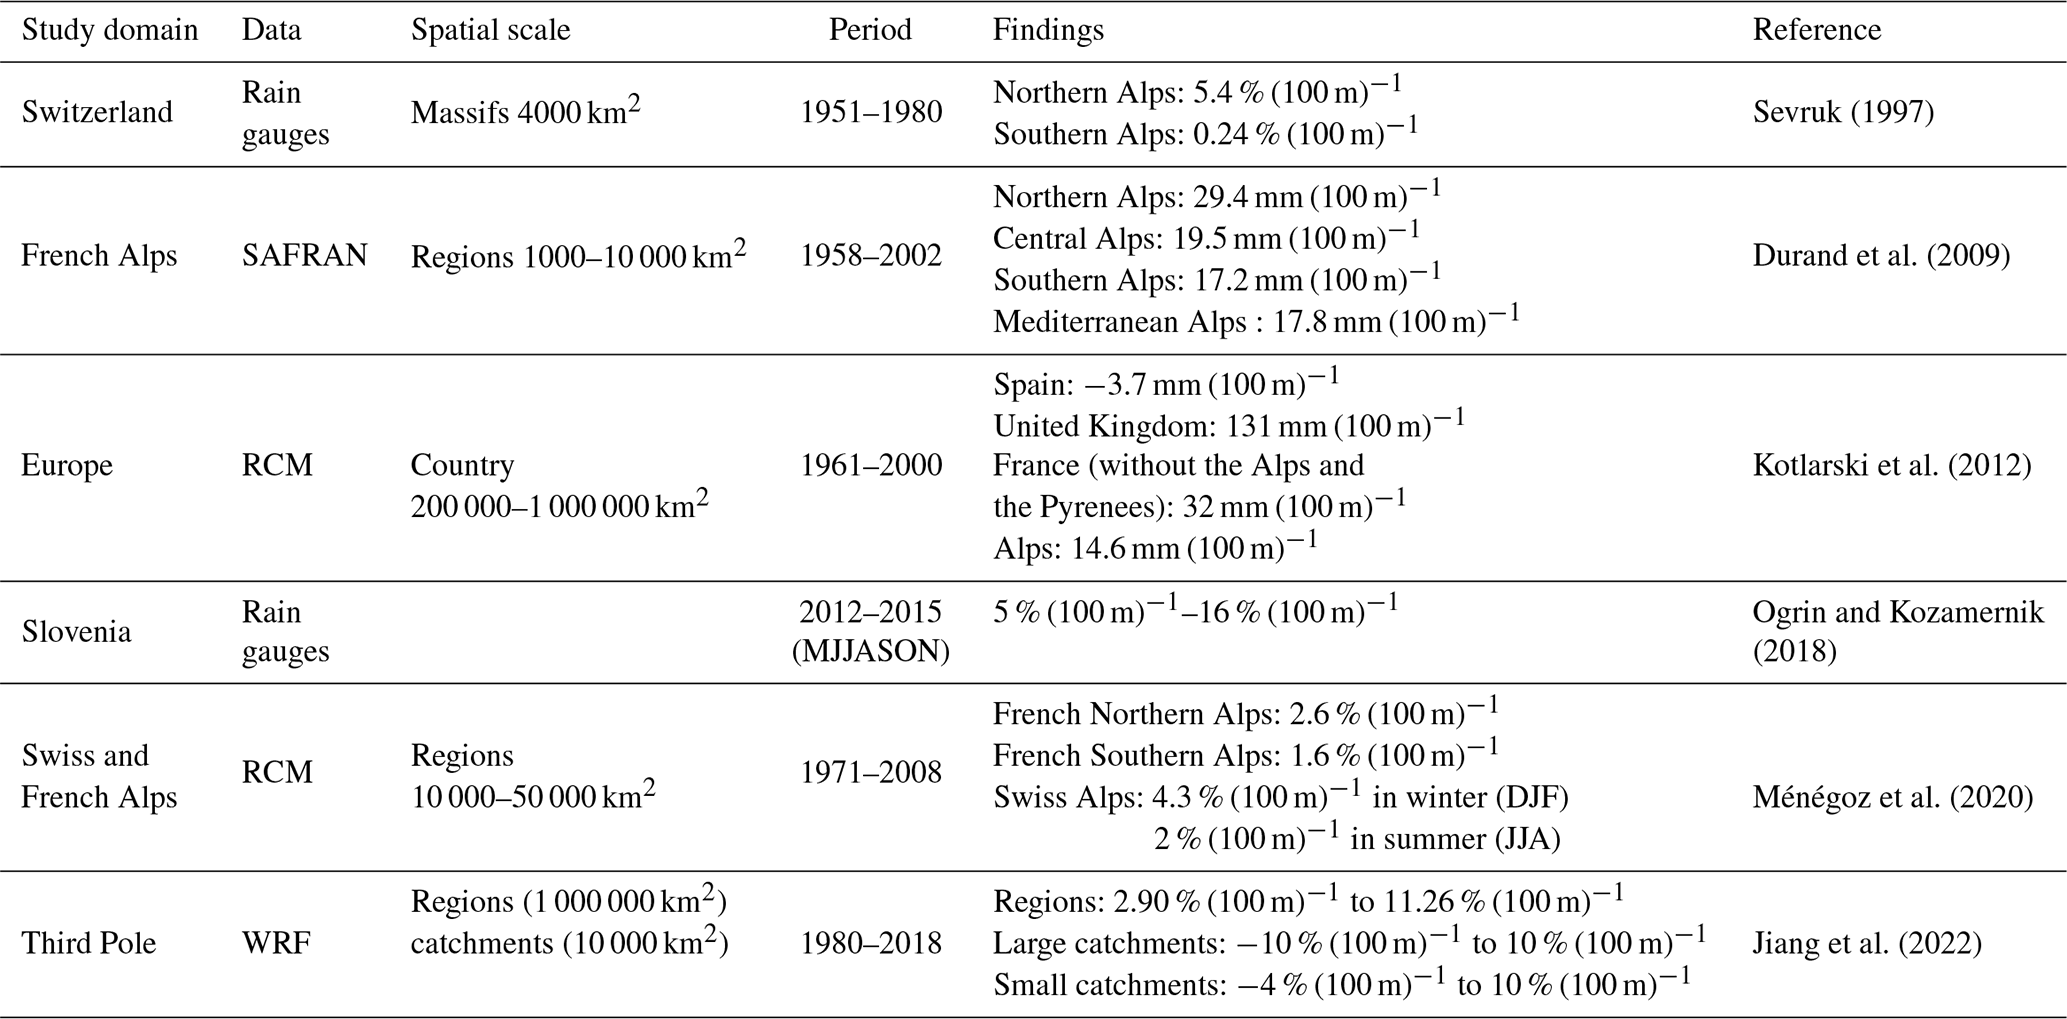
Table 4 synthesizes the main research on PLRs. Like Ménégoz et al. (2020) in Switzerland, we find higher PLRs in winter, likely due to the large-scale circulation of air masses. In winter, the westerly wind coming from the Atlantic loaded with moisture is dominant and hits the primary mountainous regions on its way. The affected catchments correspond to the first orographical barrier and are located in the Massif Central, extending from the Languedoc to the Morvan regions. For those catchments, 50 % of the PLRs are in the range of 5 % (100 m)−1–13 % (100 m)−1. For the same reason, the PLRs are in the range of 5 % (100 m)−1–15 % (100 m)−1 for the first western catchments of the Alps. Interestingly, a distinct pattern emerges in the Thabor, where some PLRs are in the range of 8 % (100 m)−1–15 % (100 m)−1 due to frequent easterly weather fronts brought by Mediterranean circulation from Italy. In summer, the Mediterranean area is subjected to the dominant southern flows and hosts the highest PLRs. The southern air masses absorb the humidity from the Mediterranean Sea. For this reason, we found higher PLRs in the eastern Pyrenees (8 % (100 m)−1–15 % (100 m)−1) compared to the Central Pyrenees (3 % (100 m)−1–8 % (100 m)−1). Convective processes are more frequent in summer than in winter. Daily precipitation amounts from convective processes are often negatively correlated to the altitude (Schäppi, 2013). That is likely to explain the lower PLRs in summer than in winter. To summarize, we notice high PLRs in areas subjected to the prevailing winds in France, which are west, south, and east winds, depending on the season. Like Kotlarski et al. (2012), we find lower PLRs in the Alps than in the rest of France.
In the French Alps, a complex topographical region, we do not find a significant difference in PLR values between the Northern and the Southern Alps for the winter and summer seasons, contrary to Sevruk (1997), Durand et al. (2009), and Ménégoz et al. (2020). That is probably due to the finer spatial scale used in the study. At a larger spatial scale, large-scale circulation, rather than the local topography, drives seasonal precipitation amounts (Jiang et al., 2022). We find a large spatial variability in the PLRs, which can vary inside the same massif from one catchment to another. For instance, winter PLRs range from 3 % (100 m)−1–5 % (100 m)−1 to 8 % (100 m)−1–15 % (100 m)−1 in Belledonne. Using rain gauges, Ogrin and Kozamernik (2018) highlighted the extreme spatial variability in the PLRs in the range of 5 % (100 m)−1–16 % (100 m)−1 for the summer season in three nearby alpine valleys of Slovenia. We find the same magnitude in PLR values and variability. PLRs are highly spatially varying in high-altitude and complex topographical regions such as the French Alps and Pyrenees. In the Massif Central, PLRs exhibit less spatial variability.
Sevruk (1997)Durand et al. (2009)Kotlarski et al. (2012)Ogrin and Kozamernik2018Ménégoz et al. (2020)Jiang et al. (2022)Table 4Summary of the studies on precipitation lapse rates (PLRs), namely study domain, data, spatial scale, period, findings, and reference.
In summary, PLRs are probably higher in winter because of the omnipresence of stratiform events that cause structured orographic precipitation in catchments exposed to oceanic weather patterns. In summer, the air masses are coming from the Mediterranean Sea, causing high PLRs in the coastal and hilly Mediterranean areas. In this season, precipitation is mainly caused by the combination of multiple convective events, resulting in unclear PLR spatial patterns.
5.3 Dependence of the precipitation lapse rates to the spatial scale
The low R2 found in Fig. 6a is a reminder of the high intra-massif variability in the relationship between seasonal precipitation and altitude in large sub-regions. The sub-region dissection into more homogeneous areas, such as small catchments with a surface area close to 100 km2, allows a better description of the PLRs. Regressions at the catchment scale have larger PLR and R2 values than at the sub-regional scale. In winter in Maurienne, all catchments have R2 greater than 0.5, with PLRs in the range 3 % (100 m)−1–8 % (100 m)−1. The R2 is close to 0, and the slope is close to 2 % (100 m)−1, with a single regression covering all the Maurienne massif. Figure 9 shows the scatter plot between AROME annual precipitation and altitude for the pixels within three groups of catchments in the Vercors, a massif covering 1350 km2. The colors of the pixels relate to distinct geographical locations. Figure S11 provides the scatter plots for seasonal precipitation. Figure 9 suggests that Vercors encompasses several sub-regions with different relationships between annual precipitation and altitude. This relationship is linear for the southern and western Vercors catchments. However, the western and southern Vercors are not subject to the same meteorological influences. The PLRs are higher in the western Vercors because of the dominant rainy westerly flow. The relationship is not linear for the catchments located in the Vercors plateaus. The attenuation of orographic precipitation after crossing the first hills of the west of the massif is a possible explanation. Figure 9 reveals the coexistence of PLR spatial patterns within a single massif.
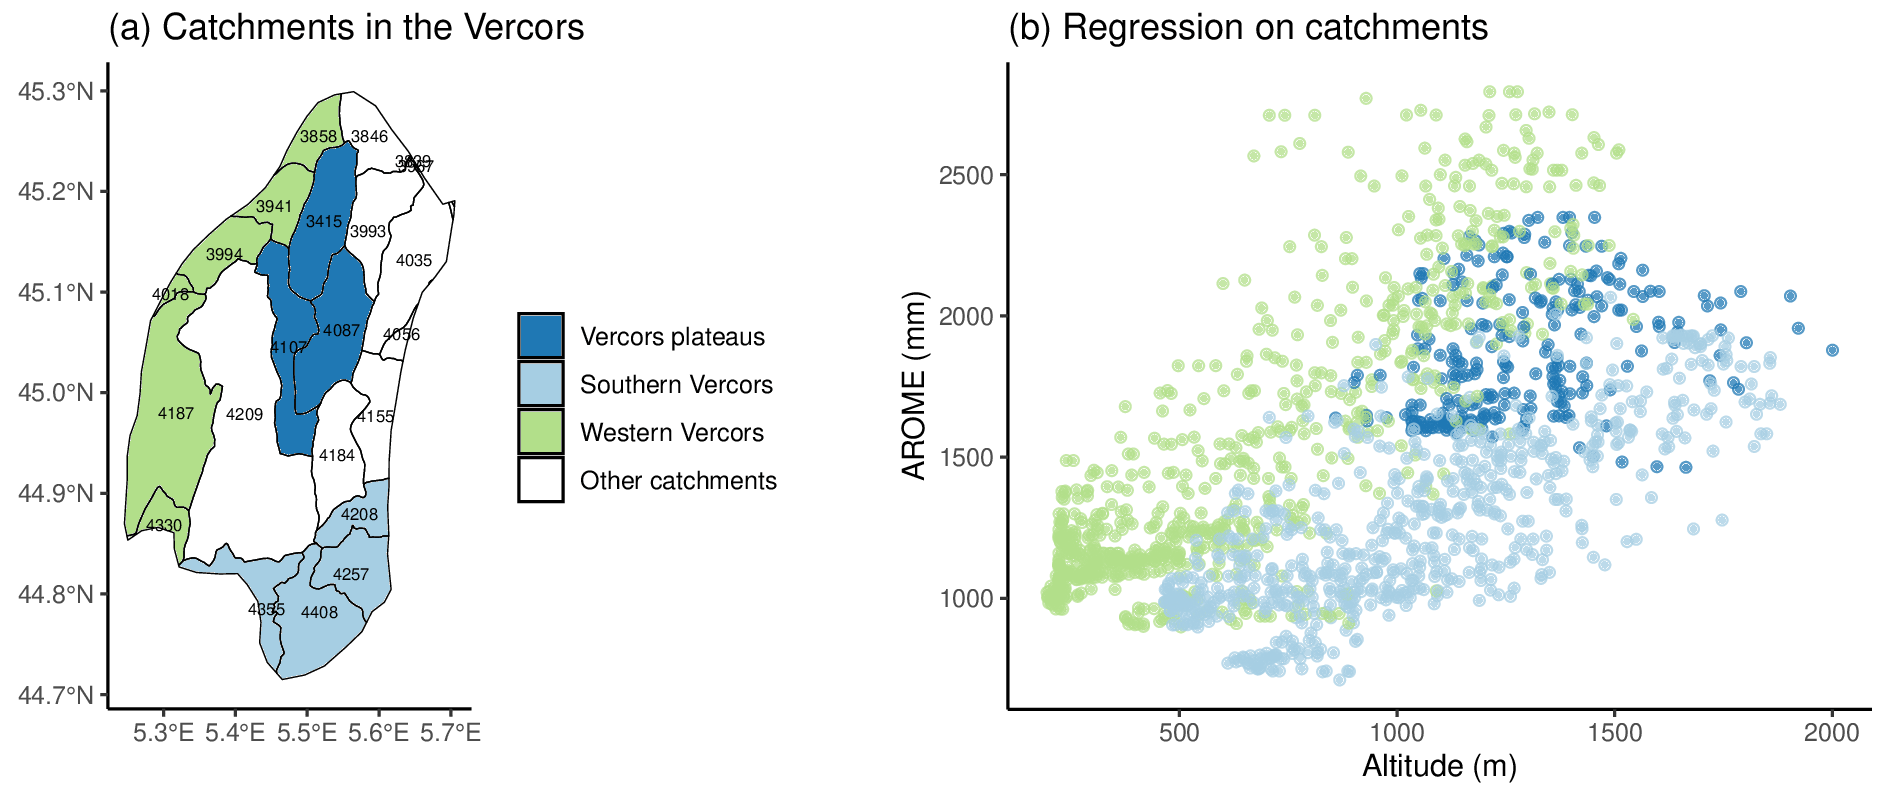
Figure 9(a) Catchments located in the Vercors massif and colored according to their geographic locations. Three groups of catchments are distinguished: the Vercors plateaus, the western Vercors, and the southern Vercors. ID numbers are printed for each catchment. (b) Scatter plot of AROME annual precipitation and altitude for the pixels in the Vercors (gray dots). The colors of dots correspond to the colors used in panel (a).
In the French Alps, a complex topographical region, it is not appropriate to calculate PLRs on sub-regions that are too vast with surface areas of more than 1000 km2. In vast sub-regions, there is a risk of mixing areas with too much spatial heterogeneity and losing information about the PLR spatial variability. An investigation of the PLR with stations or station-based precipitation products such as SPAZM should be conducted carefully in sparse station networks. For example, in the Aravis massif covering 1070 km2, linear regressions between precipitation and altitude in SPAZM are performed using all stations within the massif to ensure robustness. However, Fig. 6d indicates that the Aravis has high intra-massif variability in the winter PLR with lower values in its western part. SPAZM cannot capture this variability.
PLRs are thus scale-dependent. The linear regressions give better R2 and larger PLRs at the catchment scale (100 km2) than at the sub-regional scale (1000 km2). Sub-regions that are too broad often hide distinct altitude effects on precipitation.
5.4 Uncertainty in the study and outlook
A limitation of our study is the potential undercatch of precipitation by the high-altitude stations. The underestimation can be as high as 50 % in winter during meteorological events with strong winds and a large proportion of snowfall. A 25 % underestimation of mountain annual precipitation is possible (Sevruk, 1997). In low altitudes, the underestimation is less severe. As a result, the comparison of PLRs in Fig. 3a can lead to wrong conclusions based on the bias of the gridded precipitation products. Despite the measuring uncertainty, we decided to include NPTs in our study to account for high ungauged altitude regions. The available period from NPTs differs from those of rain gauges and precipitation products. Additional data sources can enhance the spatial and altitudinal representation of PLR. High-altitude measurements of snow water equivalent (SWE) levels can constrain the regressions between winter precipitation and altitude and make PLRs more robust. However, the transition from daily SWE to seasonal precipitation is highly temperature- and snowmelt-dependent. For high-altitude measurements, it is possible to make the strong assumption that only solid precipitation has occurred and that snowmelt has been minimal, as stated in Avanzi et al. (2021). Due to the high level of uncertainty in the measure, we opt not to include those data.
At high altitudes, winter precipitation from AROME is significantly higher than that of the other precipitation products, including SPAZM. At 2700–3000 m in the Pyrenees, AROME simulates an extra 400 mm of precipitation compared to COMEPHORE, CERRA-Land, and SPAZM. SPAZM may underestimate the high-altitude precipitation due to the precipitation undercatch. It is also likely that AROME overestimates seasonal precipitation. Indeed, Monteiro et al. (2022) found excessive snow accumulation with AROME in the French Alps above 1800 m. The authors advanced assumptions about spurious snow accumulation, such as the AROME cold temperature bias and the weakness of the AROME snowpack schemes. The winter PLR values given in Fig. 7b for high-altitude catchments should be considered with caution. In addition to AROME, various CP-RCMs listed in Ban et al. (2021, Table 1) have been used to simulate precipitation at a fine resolution in France. PLRs derived as the slope of linear regressions are necessarily uncertain because of the regression uncertainty. A perspective of the study could be to include prediction intervals, i.e., a range of values containing the “true” value with a probability of 0.95, for example.
We address the question of the spatial variability in the seasonal precipitation lapse rates in France, a country with varied and complex topography. A dense rain gauge network enriched with snow rain gauge totalizers characterizes the relationship between annual/seasonal precipitation and altitude in large regions. The ability to reproduce this link obtained from ground measurements is analyzed using seven different kinds of gridded precipitation products, namely ERA5-Land, the PDIR satellite product, the raw radar product SERVAL, a 37-year simulation from the CP-RCM AROME, two reanalysis products named CERRA-Land and COMEPHORE, and the precipitation interpolator SPAZM. Precipitation products commonly used in hydrology are limited in high-altitude regions with complex topography, such as the French Alps. Radar products perform well in hilly terrain but underestimate annual precipitation in high altitudes, resulting in a negative association between annual precipitation and altitude. Satellite products are not subject to the same estimation errors as radar products. However, the coarse resolutions do not accurately represent the annual precipitation altitude dependence in regions with topography heterogeneity. The performance of station-based products is dependent on the density of the weather station network. In ungauged mountainous areas, precipitation estimation from those kinds of products requires some degree of interpolation, whereas AROME uses physical laws. AROME does not incorporate rain gauge data and is therefore not subjected to bias caused by the undersampling of particular high-altitude spatial areas. The simulations from the CP-RCM AROME, despite an overall overestimation of high-altitude precipitation, offer an opportunity to assess the altitude dependence of seasonal precipitation at the catchment scale. We employ the CP-RCM AROME to derive seasonal PLRs on 23 French Alps massifs and 2748 catchments. The spatial-scale dependence of PLRs is investigated in the French Alps by comparing seasonal PLR values at the sub-regional (1000 km2) and the catchment (100 km2) scales. PLRs are derived using linear regression between seasonal precipitation and altitude. PLRs are spatial-scale-dependent as they tend to be higher and better represented when computed at the catchment scale. The local topography influence on seasonal precipitation is major at a small spatial scale but dominated by the large-scale atmospheric circulation influence at the larger sub-regional spatial scale. PLRs are higher in winter. The majority of winter PLRs are positive. In total, 95 % of them are in the range 0.55 % (100 m)−1–13.10 % (100 m)−1. The higher values are found in the westerly and Mediterranean-dominant flow-exposed regions, reaching up to 32 % (100 m)−1. In high-altitude regions such as the French Alps and the Pyrenees, we notice sheltering effects with PLRs close to 0 % (100 m)−1 for some catchments enclosed by mountains. It is generally the first reliefs encountered by air masses that host the stronger PLRs. This article emphasizes the importance of considering the topography on a fine spatial scale to estimate PLRs in ungauged mountainous regions. CP-RCM models offer an opportunity to compute the enhancement of seasonal precipitation with the altitude.
SERVAL and COMEPHORE are available from the Aeris portal (https://radarsmf.aeris-data.fr/, AERIS portal, 2023). PDIR is available from the CHRS Data Portal (https://chrsdata.eng.uci.edu/, CHRS Data Portal, 2023). ERA5-Land and CERRA-Land are available from Copernicus (https://cds.climate.copernicus.eu, Copernicus, 2023). AROME is available from the Med-CORDEX portal (https://www.medcordex.eu/search/index.php, Med-CORDEX, 2023). The spatial data set containing the catchments is available from https://www.sandre.eaufrance.fr/atlas/atlas/fre/catalog.search#/metadata/6571f89a-0608-49a2-9ab5-f005d842e81f (Sandre, 2020). SPAZM and the stations are not publicly available. The ![]() codes used to perform the analysis are available upon reasonable request to the corresponding author.
codes used to perform the analysis are available upon reasonable request to the corresponding author.
The supplement related to this article is available online at: https://doi.org/10.5194/hess-28-2579-2024-supplement.
GE and VD conceived the idea. VD carried out the analysis and wrote the article. GE, DP, and ACF participated in the discussion and design of this study and contributed to writing and editing the paper.
The contact author has declared that none of the authors has any competing interests.
Publisher’s note: Copernicus Publications remains neutral with regard to jurisdictional claims made in the text, published maps, institutional affiliations, or any other geographical representation in this paper. While Copernicus Publications makes every effort to include appropriate place names, the final responsibility lies with the authors.
We are grateful for the provision of AROME simulations by Cécile Caillaud and Diego Monteiro. This work has benefitted from the exchanges between the researchers of the CNRM (Centre National de Recherches Météorologiques) team of Météo-France, the researchers of IGE, and the engineers of EDF. The authors extend their special thanks to Martin Ménégoz and Samuel Morin for pertinent comments on this work. The authors also thank the three anonymous reviewers for their constructive feedback that improved the clarity of the article.
This research has been supported by the Electricité de France (EDF).
This paper was edited by Nadav Peleg and reviewed by three anonymous referees.
AERIS portal: SERVAL and COMEPHORE, https://radarsmf.aeris-data.fr/, last access: 21 December 2023. a
Avanzi, F., Ercolani, G., Gabellani, S., Cremonese, E., Pogliotti, P., Filippa, G., Morra di Cella, U., Ratto, S., Stevenin, H., Cauduro, M., and Juglair, S.: Learning about precipitation lapse rates from snow course data improves water balance modeling, Hydrol. Earth Syst. Sci., 25, 2109–2131, https://doi.org/10.5194/hess-25-2109-2021, 2021. a, b, c, d
Bales, R. C., Molotch, N. P., Painter, T. H., Dettinger, M. D., Rice, R., and Dozier, J.: Mountain hydrology of the western United States, Water Resour. Res., 42, W08432, https://doi.org/10.1029/2005WR004387, 2006. a
Ban, N., Caillaud, C., Coppola, E., Pichelli, E., Sobolowski, S., Adinolfi, M., Ahrens, B., Alias, A., Anders, I., Bastin, S., Belušić, D., Berthou, S., Brisson, E., Cardoso, R. M., Chan, S. C., Christensen, O. B., Fernández, J., Fita, L., Frisius, T., Gašparac, G., Giorgi, F., Goergen, K., Haugen, J. E., Hodnebrog, O., Kartsios, S., Katragkou, E., Kendon, E. J., Keuler, K., Lavin-Gullon, A., Lenderink, G., Leutwyler, D., Lorenz, T., Maraun, D., Mercogliano, P., Milovac, J., Panitz, H.-J., Raffa, M., Remedio, A. R., Schär, C., Soares, P. M. M., Srnec, L., Steensen, B. M., Stocchi, P., Tölle, M. H., Truhetz, H., Vergara-Temprado, J., de Vries, H., Warrach-Sagi, K., Wulfmeyer, V., and Zander, M. J.: The first multi-model ensemble of regional climate simulations at kilometer-scale resolution, part I: evaluation of precipitation, Clim. Dynam., 57, 275–302, https://doi.org/10.1007/s00382-021-05708-w, 2021. a, b, c, d
Barrows, H. K.: Precipitation and runoff and altitude relations for connecticut River, Eos T. Am. Geophys. Un., 14, 396–406, https://doi.org/10.1029/TR014i001p00396, 933. a
Beck, J. and Bousquet, O.: Using Gap-Filling Radars in Mountainous Regions to Complement a National Radar Network: Improvements in Multiple-Doppler Wind Syntheses, J. Appl. Meteorol. Clim., 52, 1836–1850, https://doi.org/10.1175/JAMC-D-12-0187.1, 2013. a
Bell, B. A., Hughes, P. D., Fletcher, W. J., Cornelissen, H. L., Rhoujjati, A., Hanich, L., and Braithwaite, R. J.: Climate of the Marrakech High Atlas, Morocco: Temperature lapse rates and precipitation gradient from piedmont to summits, Arct. Antarct. Alp. Res., 54, 78–95, https://doi.org/10.1080/15230430.2022.2046897, 2022. a
Belušić, D., de Vries, H., Dobler, A., Landgren, O., Lind, P., Lindstedt, D., Pedersen, R. A., Sánchez-Perrino, J. C., Toivonen, E., van Ulft, B., Wang, F., Andrae, U., Batrak, Y., Kjellström, E., Lenderink, G., Nikulin, G., Pietikäinen, J.-P., Rodríguez-Camino, E., Samuelsson, P., van Meijgaard, E., and Wu, M.: HCLIM38: a flexible regional climate model applicable for different climate zones from coarse to convection-permitting scales, Geosci. Model Dev., 13, 1311–1333, https://doi.org/10.5194/gmd-13-1311-2020, 2020. a
Bergström, S.: The HBV model – its structure and applications, SMHI, RH No. 4, 32 pp., 1992. a
Berne, A. and Krajewski, W. F.: Radar for hydrology: Unfulfilled promise or unrecognized potential?, Adv. Water Resour., 51, 357–366, https://doi.org/10.1016/j.advwatres.2012.05.005, 2013. a
Brousseau, P., Seity, Y., Ricard, D., and Léger, J.: Improvement of the forecast of convective activity from the AROME‐France system, Q. J. Roy. Meteor. Soc., 142, 2231–2243, https://doi.org/10.1002/qj.2822, 2016. a, b
Buzzi, A., Tartaglione, N., and Malguzzi, P.: Numerical Simulations of the 1994 Piedmont Flood: Role of Orography and Moist Processes, Mon. Weather Rev., 126, 2369–2383, https://doi.org/10.1175/1520-0493(1998)126<2369:NSOTPF>2.0.CO;2, 1998. a
Caillaud, C., Somot, S., Alias, A., Bernard-Bouissières, I., Fumière, Q., Laurantin, O., Seity, Y., and Ducrocq, V.: Modelling Mediterranean heavy precipitation events at climate scale: an object-oriented evaluation of the CNRM-AROME convection-permitting regional climate model, Clim. Dynam., 56, 1717–1752, https://doi.org/10.1007/s00382-020-05558-y, 2021. a, b, c, d
Caine, N.: The rainfall intensity-duration control of shallow landslides and debris flows, Geogr. Ann. A, 62, 23–27, 1980. a
Caracena, F., Maddox, R. A., Hoxit, L. R., and Chappell, C. F.: Mesoanalysis of the Big Thompson storm, Mon. Weather Rev., 107, 1–17, 1979. a
Champeaux, J.-L., Dupuy, P., Laurantin, O., Soulan, I., Tabary, P., and Soubeyroux, J.-M.: Les mesures de précipitations et l'estimation des lames d'eau à Météo-France: état de l'art et perspectives, La Houille Blanche, 95, 28–34, https://doi.org/10.1051/lhb/2009052, 2009 (in French). a, b, c, d, e
CHRS Data Portal: PDIR, https://chrsdata.eng.uci.edu/, last access: 21 December 2023. a
Conway, H. and Raymond, C.: Snow stability during rain, J. Glaciol., 39, 635–642, 1993. a
Copernicus: ERA5-Land and CERRA-Land, https://cds.climate.copernicus.eu, last access: 21 December 2023. a
Coppola, E., Sobolowski, S., Pichelli, E., Raffaele, F., Ahrens, B., Anders, I., Ban, N., Bastin, S., Belda, M., Belusic, D., Caldas-Alvarez, A., Cardoso, R. M., Davolio, S., Dobler, A., Fernandez, J., Fita, L., Fumiere, Q., Giorgi, F., Goergen, K., Güttler, I., Halenka, T., Heinzeller, D., Hodnebrog, O., Jacob, D., Kartsios, S., Katragkou, E., Kendon, E., Khodayar, S., Kunstmann, H., Knist, S., Lavín-Gullón, A., Lind, P., Lorenz, T., Maraun, D., Marelle, L., van Meijgaard, E., Milovac, J., Myhre, G., Panitz, H.-J., Piazza, M., Raffa, M., Raub, T., Rockel, B., Schär, C., Sieck, K., Soares, P. M. M., Somot, S., Srnec, L., Stocchi, P., Tölle, M. H., Truhetz, H., Vautard, R., de Vries, H., and Warrach-Sagi, K.: A first-of-its-kind multi-model convection permitting ensemble for investigating convective phenomena over Europe and the Mediterranean, Clim. Dynam., 55, 3–34, https://doi.org/10.1007/s00382-018-4521-8, 2020. a
Cuo, L. and Zhang, Y.: Spatial patterns of wet season precipitation vertical gradients on the Tibetan Plateau and the surroundings, Scientific Reports, 7, 5057, https://doi.org/10.1038/s41598-017-05345-6, 2017. a
Dallan, E., Marra, F., Fosser, G., Marani, M., Formetta, G., Schär, C., and Borga, M.: How well does a convection-permitting regional climate model represent the reverse orographic effect of extreme hourly precipitation?, Hydrol. Earth Syst. Sci., 27, 1133–1149, https://doi.org/10.5194/hess-27-1133-2023, 2023. a
Daly, C., Neilson, R. P., and Phillips, D. L.: A Statistical-Topographic Model for Mapping Climatological Precipitation over Mountainous Terrain, J. Appl. Meteorol. Clim., 33, 140–158, https://doi.org/10.1175/1520-0450(1994)033<0140:ASTMFM>2.0.CO;2, 1994. a, b
Delrieu, G., Boudevillain, B., Wijbrans, A., Faure, D., Bonnifait, L., Kirstetter, P.-E., and Confoland, A.: Prototype de ré-analyses pluviométriques pour la région Cévennes-Vivarais, La Météorologie, 83, 35–41, https://doi.org/10.4267/2042/52052, 2013 (in French). a
Dozier, J., Bair, E. H., and Davis, R. E.: Estimating the spatial distribution of snow water equivalent in the world's mountains, WIREs Water, 3, 461–474, https://doi.org/10.1002/wat2.1140, 2016. a
Durand, Y., Laternser, M., Giraud, G., Etchevers, P., Lesaffre, B., and Mérindol, L.: Reanalysis of 44 Yr of Climate in the French Alps (1958–2002): Methodology, Model Validation, Climatology, and Trends for Air Temperature and Precipitation, J. Appl. Meteorol. Clim., 48, 429–449, https://doi.org/10.1175/2008JAMC1808.1, 2009. a, b
Faure, D., Delrieu, G., and Gaussiat, N.: Impact of the Altitudinal Gradients of Precipitation on the Radar QPE Bias in the French Alps, Atmosphere, 10, 306, https://doi.org/10.3390/atmos10060306, 2019. a, b
Foley, A.: Uncertainty in regional climate modelling: A review, Progress in Physical Geography: Earth and Environment, 34, 647–670, https://doi.org/10.1177/0309133310375654, 2010. a
Formetta, G., Marra, F., Dallan, E., Zaramella, M., and Borga, M: Differential orographic impact on sub-hourly, hourly, and daily extreme precipitation, Adv. Water Resour., 159, January 2022, 104085 https://doi.org/10.1016/j.advwatres.2021.104085, 2022. a
Frei, C. and Isotta, F. A.: Ensemble Spatial Precipitation Analysis From Rain Gauge Data: Methodology and Application in the European Alps, J. Geophys. Res.-Atmos., 124, 5757–5778, https://doi.org/10.1029/2018JD030004, 2019. a, b
Garavaglia, F., Gailhard, J., Paquet, E., Lang, M., Garçon, R., and Bernardara, P.: Introducing a rainfall compound distribution model based on weather patterns sub-sampling, Hydrol. Earth Syst. Sci., 14, 951–964, https://doi.org/10.5194/hess-14-951-2010, 2010. a, b
Garavaglia, F., Le Lay, M., Gottardi, F., Garçon, R., Gailhard, J., Paquet, E., and Mathevet, T.: Impact of model structure on flow simulation and hydrological realism: from a lumped to a semi-distributed approach, Hydrol. Earth Syst. Sci., 21, 3937–3952, https://doi.org/10.5194/hess-21-3937-2017, 2017. a
Gerber, F., Besic, N., Sharma, V., Mott, R., Daniels, M., Gabella, M., Berne, A., Germann, U., and Lehning, M.: Spatial variability in snow precipitation and accumulation in COSMO–WRF simulations and radar estimations over complex terrain, The Cryosphere, 12, 3137–3160, https://doi.org/10.5194/tc-12-3137-2018 2018. a
Germann, U., Galli, G., Boscacci, M., and Bolliger, M.: Radar precipitation measurement in a mountainous region, Q. J. Roy. Meteor. Soc., 132, 1669–1692, https://doi.org/10.1256/qj.05.190, 2006. a
Gomis-Cebolla, J., Rattayova, V., Salazar-Galán, S., and Francés, F.: Evaluation of ERA5 and ERA5-Land reanalysis precipitation datasets over Spain (1951–2020), Atmos. Res., 284, 106606, https://doi.org/10.1016/j.atmosres.2023.106606, 2023. a
Gottardi, F.: Estimation statistique et réanalyse des précipitations en montagne/Utilisation d'ébauches par types de temps et assimilation de données d'enneigement/Application aux grands massifs montagneux français, PhD thesis, Institut National Polytechnique de Grenoble – INPG, https://tel.archives-ouvertes.fr/tel-00419170 (last access: 3 June 2024), 2009. a, b, c, d, e, f, g, h, i
Groisman, P. Y. and Legates, D. R.: The Accuracy of United States Precipitation Data, B. Am. Meteorol. Soc., 75, 215–228, https://doi.org/10.1175/1520-0477(1994)075<0215:TAOUSP>2.0.CO;2, 1994. a, b
Gössling, S., Peeters, P., Hall, C. M., Ceron, J.-P., Dubois, G., Lehmann, L. V., and Scott, D.: Tourism and water use: Supply, demand, and security. An international review, Tourism Manage., 33, 1–15, https://doi.org/10.1016/j.tourman.2011.03.015, 2012. a
Hassler, B. and Lauer, A.: Comparison of Reanalysis and Observational Precipitation Datasets Including ERA5 and WFDE5, Atmosphere, 12, 1462, https://doi.org/10.3390/atmos12111462, 2021. a
Hofstra, N., New, M., and McSweeney, C.: The influence of interpolation and station network density on the distributions and trends of climate variables in gridded daily data, Clim. Dynam., 35, 841–858, https://doi.org/10.1007/s00382-009-0698-1, 2010. a
Hohenegger, C., Brockhaus, P., and Schär, C.: Towards climate simulations at cloud-resolving scales, Meteorol. Z., 17, 383–394, https://doi.org/10.1127/0941-2948/2008/0303, 2008. a
Huang, W.-R., Liu, P.-Y., and Hsu, J.: Multiple timescale assessment of wet season precipitation estimation over Taiwan using the PERSIANN family products, Int. J. Appl. Earth Obs., 103, 102521, https://doi.org/10.1016/j.jag.2021.102521, 2021. a
Jiang, Q.: Moist dynamics and orographic precipitation, Tellus A, 55, 301, https://doi.org/10.3402/tellusa.v55i4.14577, 2003. a
Jiang, Y., Yang, K., Shao, C., Zhou, X., Zhao, L., Chen, Y., and Wu, H.: A downscaling approach for constructing high-resolution precipitation dataset over the Tibetan Plateau from ERA5 reanalysis, Atmos. Res., 256, 105574, https://doi.org/10.1016/j.atmosres.2021.105574, 2021. a
Jiang, Y., Yang, K., Yang, H., Lu, H., Chen, Y., Zhou, X., Sun, J., Yang, Y., and Wang, Y.: Characterizing basin-scale precipitation gradients in the Third Pole region using a high-resolution atmospheric simulation-based dataset, Hydrol. Earth Syst. Sci., 26, 4587–4601, https://doi.org/10.5194/hess-26-4587-2022 2022. a, b, c, d
Kass, R. E. and Raftery, A. E.: Bayes Factors, J. Am. Stat. Assoc., 90, 773–795, https://doi.org/10.1080/01621459.1995.10476572, 1995. a
Kendon, E. J., Roberts, N. M., Senior, C. A., and Roberts, M. J.: Realism of Rainfall in a Very High-Resolution Regional Climate Model, J. Climate, 25, 5791–5806, https://doi.org/10.1175/JCLI-D-11-00562.1, 2012. a
Keuler, K., Radtke, K., Kotlarski, S., and Lüthi, D.: Regional climate change over Europe in COSMO-CLM: Influence of emission scenario and driving global model, Meteorol. Z., 25, 121–136, https://doi.org/10.1127/metz/2016/0662, 2016. a
Kotlarski, S., Bosshard, T., Lüthi, D., Pall, P., and Schär, C.: Elevation gradients of European climate change in the regional climate model COSMO-CLM, Clim. Change, 112, 189–215, https://doi.org/10.1007/s10584-011-0195-5, 2012. a, b, c
Kumar, B., Roy, D., and Lakshmi, V.: Impact of temperature and precipitation lapse rate on hydrological modelling over Himalayan Gandak River Basin, J. Mt. Sci., 19, 3487–3502, https://doi.org/10.1007/s11629-020-6602-5, 2022. a
Le Moigne, P.: Documentation of the CERRA-Land system, Tech. rep., Météo-France, 2021. a, b, c
Li, L., Gochis, D. J., Sobolowski, S., and Mesquita, M. D. S.: Evaluating the present annual water budget of a Himalayan headwater river basin using a high-resolution atmosphere-hydrology model, J. Geophys. Res.-Atmos., 122, 4786–4807, https://doi.org/10.1002/2016JD026279, 2017. a, b
Lucas-Picher, P., Argüeso, D., Brisson, E., Tramblay, Y., Berg, P., Lemonsu, A., Kotlarski, S., and Caillaud, C.: Convection-permitting modeling with regional climate models: Latest developments and next steps, WIREs Climate Change, 12, e731, https://doi.org/10.1002/wcc.731, 2021. a
Lundquist, J., Hughes, M., Gutmann, E., and Kapnick, S.: Our skill in modeling mountain rain and snow is bypassing the skill of our observational networks, B. Am. Meteorol. Soc., 2473–2490, https://doi.org/10.1175/BAMS-D-19-0001.1, 2019. a
Mahmood, T. H., Putkonen, J., and Sobbe, A.: Spatially Variable Precipitation and Its Influence on Water Balance in a Headwater Alpine Basin, Nepal, Water, 13, 254, https://doi.org/10.3390/w13030254, 2021. a
Markstrom, S. L., Regan, R. S., Hay, L. E., Viger, R. J., Webb, R. M., Payn, R. A., and LaFontaine, J. H.: PRMS-IV, the precipitation-runoff modeling system, version 4, Tech. rep., US Geological Survey, https://doi.org/10.3133/tm6B7, 2015. a
Med-CORDEX: AROME, https://www.medcordex.eu/search/index.php, last access: 21 December 2023. a
Ménégoz, M., Valla, E., Jourdain, N. C., Blanchet, J., Beaumet, J., Wilhelm, B., Gallée, H., Fettweis, X., Morin, S., and Anquetin, S.: Contrasting seasonal changes in total and intense precipitation in the European Alps from 1903 to 2010, Hydrol. Earth Syst. Sci., 24, 5355–5377, https://doi.org/10.5194/hess-24-5355-2020 2020. a, b, c, d, e, f
Mestre, O., Domonkos, P., Picard, F., Auer, I., Robin, S., Lebarbier, E., Böhm, R., Aguilar, E., Guijarro Pastor, J. A., Vertacnik, G., Klancar, M., Dubuisson, B., and Stepanek, P.: HOMER: a homogenization software – methods and applications, Időjárás, 117, 1–158, http://hdl.handle.net/20.500.11765/1494 (last access: 3 June 2024), 2013. a
Monteiro, D., Caillaud, C., Samacoïts, R., Lafaysse, M., and Morin, S.: Potential and limitations of convection-permitting CNRM-AROME climate modelling in the French Alps, Int. J. Climatol., 42, 7162–7185, https://doi.org/10.1002/joc.7637, 2022. a, b, c
Mott, R., Scipión, D., Schneebeli, M., Dawes, N., Berne, A., and Lehning, M.: Orographic effects on snow deposition patterns in mountainous terrain, J. Geophys. Res.-Atmos., 119, 1419–1439, https://doi.org/10.1002/2013JD019880, 2014. a
Muggeo, V. M.: segmented: an R Package to Fit Regression Models with Broken-Line Relationships, R News, 8, 20–25, https://cran.r-project.org/doc/Rnews/ (last access: 3 June 2024), 2008. a
Muñoz-Sabater, J., Dutra, E., Agustí-Panareda, A., Albergel, C., Arduini, G., Balsamo, G., Boussetta, S., Choulga, M., Harrigan, S., Hersbach, H., Martens, B., Miralles, D. G., Piles, M., Rodríguez-Fernández, N. J., Zsoter, E., Buontempo, C., and Thépaut, J.-N.: ERA5-Land: a state-of-the-art global reanalysis dataset for land applications, Earth Syst. Sci. Data, 13, 4349–4383, https://doi.org/10.5194/essd-13-4349-2021, 2021. a, b, c
Napoli, A., Crespi, A., Ragone, F., Maugeri, M., and Pasquero, C.: Variability of orographic enhancement of precipitation in the Alpine region, Scientific Reports, 9, 13352, https://doi.org/10.1038/s41598-019-49974-5, 2019. a, b
Nguyen, P., Ombadi, M., Gorooh, V. A., Shearer, E. J., Sadeghi, M., Sorooshian, S., Hsu, K., Bolvin, D., and Ralph, M. F.: PERSIANN Dynamic Infrared–Rain Rate (PDIR-Now): A Near-Real-Time, Quasi-Global Satellite Precipitation Dataset, J. Hydrometeorol., 21, 2893–2906, https://doi.org/10.1175/JHM-D-20-0177.1, 2020. a, b, c, d
Nie, S., Luo, Y., Wu, T., Shi, X., and Wang, Z.: A merging scheme for constructing daily precipitation analyses based on objective bias-correction and error estimation techniques, J. Geophys. Res.-Atmos., 120, 8671–8692, https://doi.org/10.1002/2015JD023347, 2015. a
Ochoa-Rodriguez, S., Wang, L.-P., Willems, P., and Onof, C.: A Review of Radar-Rain Gauge Data Merging Methods and Their Potential for Urban Hydrological Applications, Water Resour. Res., 55, 6356–6391, https://doi.org/10.1029/2018WR023332, 2019. a
Ogrin, M. and Kozamernik, E.: Horizontal Precipitation Gradients in Alpine Valleys of Northwestern Slovenia, Dela, 49, 5–36, https://doi.org/10.4312/dela.49.5-36, 2018. a, b, c
Ogrin, M. and Kozamernik, E.: Vertical precipitation gradients: a case study of Alpine valleys of northwestern Slovenia, Theor. Appl. Climatol., 140, 401–409, https://doi.org/10.1007/s00704-019-03051-z, 2020. a
Oudin, L., Perrin, C., Mathevet, T., Andréassian, V., and Michel, C.: Impact of biased and randomly corrupted inputs on the efficiency and the parameters of watershed models, J. Hydrol., 320, 62–83, https://doi.org/10.1016/j.jhydrol.2005.07.016, 2006. a
Pahaut, E.: L’organisation de la prevision du risque d’avalanches en France, Tech. rep., Météo-France, Toulouse, 77 pp., 1991 (in French). a
Panziera, L., James, C. N., and Germann, U.: Mesoscale organization and structure of orographic precipitation producing flash floods in the Lago Maggiore region, Q. J. Roy. Meteor. Soc., 141, 224–248, https://doi.org/10.1002/qj.2351, 2015. a
Pimentel, D., Houser, J., Preiss, E., White, O., Fang, H., Mesnick, L., Barsky, T., Tariche, S., Schreck, J., and Alpert, S.: Water Resources: Agriculture, the Environment, and Society, BioScience, 47, 97–106, https://doi.org/10.2307/1313020, 1997. a
Pollock, M. D., O'Donnell, G., Quinn, P., Dutton, M., Black, A., Wilkinson, M. E., Colli, M., Stagnaro, M., Lanza, L. G., Lewis, E., Kilsby, C. G., and O'Connell, P. E.: Quantifying and Mitigating Wind-Induced Undercatch in Rainfall Measurements, Water Resour. Res., 54, 3863–3875, https://doi.org/10.1029/2017WR022421, 2018. a, b
Ragettli, S. and Pellicciotti, F.: Calibration of a physically based, spatially distributed hydrological model in a glacierized basin: On the use of knowledge from glaciometeorological processes to constrain model parameters, Water Resour. Res., 48, W03509, https://doi.org/10.1029/2011WR010559, 2012. a
Rockel, B., Will, A., and Hense, A.: The Regional Climate Model COSMO-CLM (CCLM), Meteorol. Z., 17, 347–348, https://doi.org/10.1127/0941-2948/2008/0309, 2008. a
Roger, L.: Validation et utilisation climatologiques de la ré-analyse de lame d’eau radar Comephore étendue, Stage de fin d'étude, Météo-France, Toulouse, 77 pp., 2017 (in French). a
Rouzeau, S.: Validation climatologique de la réanalyse lame d'eau Comephore 1997–2006, Stage de fin d'étude, Météo-France, Toulouse, 2013 (in French). a
Ruelland, D.: Should altitudinal gradients of temperature and precipitation inputs be inferred from key parameters in snow-hydrological models?, Hydrol. Earth Syst. Sci., 24, 2609–2632, https://doi.org/10.5194/hess-24-2609-2020, 2020. a, b
Sandre: Bassins versant topographiques – Métropole 2019 – BD Topage®, https://www.sandre.eaufrance.fr/ atlas/atlas/fre/catalog.search#/metadata/6571f89a-0608-49a2-9ab5-f005d842e81f (last access: 5 June 2024), 2020 (in French). a, b
Schermerhorn, V. P.: Relations between topography and annual precipitation in western Oregon and Washington, Water Resour. Res., 3, 707–711, https://doi.org/10.1029/WR003i003p00707, 1967. a
Schäppi, B.: Measurement and analysis of rainfall gradients along a hillslope transect in the Swiss Alps, PhD thesis, ETH Zurich, 188 pp., https://doi.org/10.3929/ETHZ-A-009913260, 2013. a, b, c
Seity, Y., Brousseau, P., Malardel, S., Hello, G., Bénard, P., Bouttier, F., Lac, C., and Masson, V.: The AROME-France Convective-Scale Operational Model, Mon. Weather Rev., 139, 976–991, https://doi.org/10.1175/2010MWR3425.1, 2011. a
Sevruk, B.: Regional dependency of precipitation-altitude relationship in the Swiss Alps, Clim. Change, 36, 355–369, https://doi.org/10.1023/A:1005302626066, 1997. a, b, c, d, e, f
Sevruk, B. and Mieglitz, K.: The effect of topography, season and weather situation on daily precipitation gradients in 60 Swiss valleys, Water Sci. Technol., 45, 41–48, https://doi.org/10.2166/wst.2002.0025, 2002. a
Shen, Y., Hong, Z., Pan, Y., Yu, J., and Maguire, L.: China's 1 km Merged Gauge, Radar and Satellite Experimental Precipitation Dataset, Remote Sens.-Basel, 10, 264, https://doi.org/10.3390/rs10020264, 2018. a
Silverman, N. L., Maneta, M. P., Chen, S.-H., and Harper, J. T.: Dynamically downscaled winter precipitation over complex terrain of the Central Rockies of Western Montana, USA, Water Resour. Res., 49, 458–470, https://doi.org/10.1029/2012WR012874, 2013. a, b
Smith, R. B.: The Influence of Mountains on the Atmosphere, Adv. Geophys., 21, 87–230, https://doi.org/10.1016/S0065-2687(08)60262-9, 1979. a
Soci, C., Bazile, E., Besson, F., and Landelius, T.: High-resolution precipitation re-analysis system for climatological purposes, Tellus A, 68, 29879, https://doi.org/10.3402/tellusa.v68.29879, 2016. a
Spreen, W. C.: A determination of the effect of topography upon precipitation, Eos T. Am. Geophys. Un., 28, 285–290, https://doi.org/10.1029/TR028i002p00285, 1947. a
Termonia, P., Fischer, C., Bazile, E., Bouyssel, F., Brožková, R., Bénard, P., Bochenek, B., Degrauwe, D., Derková, M., El Khatib, R., Hamdi, R., Mašek, J., Pottier, P., Pristov, N., Seity, Y., Smolíková, P., Španiel, O., Tudor, M., Wang, Y., Wittmann, C., and Joly, A.: The ALADIN System and its canonical model configurations AROME CY41T1 and ALARO CY40T1, Geosci. Model Dev., 11, 257–281, https://doi.org/10.5194/gmd-11-257-2018, 2018. a
Uysal, G.: Product- and Hydro-Validation of Satellite-Based Precipitation Data Sets for a Poorly Gauged Snow-Fed Basin in Turkey, Water, 14, 2758, https://doi.org/10.3390/w14172758, 2022. a
Viviroli, D., Dürr, H. H., Messerli, B., Meybeck, M., and Weingartner, R.: Mountains of the world, water towers for humanity: Typology, mapping, and global significance, Water Resour. Res., 43, W07447, https://doi.org/10.1029/2006WR005653, 2007. a
Wrzesien, M. L., Pavelsky, T. M., Durand, M. T., Dozier, J., and Lundquist, J. D.: Characterizing Biases in Mountain Snow Accumulation From Global Data Sets, Water Resour. Res., 55, 9873–9891, https://doi.org/10.1029/2019WR025350, 2019. a