the Creative Commons Attribution 4.0 License.
the Creative Commons Attribution 4.0 License.
 | 05 Jun 2024
Evaluation of root zone soil moisture products over the Huai River basin
En Liu
Yonghua Zhu
Jean-Christophe Calvet
Haishen Lü
Bertrand Bonan
Jingyao Zheng
Qiqi Gou
Xiaoyi Wang
Zhenzhou Ding
Haiting Xu
Ying Pan
Tingxing Chen
Root zone soil moisture (RZSM) is critical for water resource management, drought monitoring and sub-seasonal flood climate prediction. While RZSM is not directly observable from space, several RZSM products are available and widely used at global and continental scales. This study conducts a comprehensive and quantitative evaluation of eight RZSM products using observations from 58 in situ soil moisture stations over the Huai River basin (HRB) in China. Attention is drawn to the potential factors that contribute to the uncertainties of model-based RZSM, including the errors in atmospheric forcing, vegetation parameterizations, soil properties and spatial scale mismatch. The results show that the Global Land Data Assimilation System Catchment Land Surface Model (GLDAS_CLSM) outperforms the other RZSM products with the highest correlation coefficient (R= 0.69) and the lowest unbiased root mean square error (ubRMSE = 0.018 m3 m−3), while SMOS Level 4 (L4) RZSM shows the worst performance among eight RZSM products. The RZSM products based on land surface models generally perform better in the wet season than in the dry season due to the enhanced ability to capture of the temporal dynamics of in situ observations in the wet season and the inertia of remaining high soil moisture values even in the dry season, while the SMOS L4 RZSM product, derived from SMOS L3 surface moisture (SSM) combined with an exponential filter method, performs better in the dry season due to the attenuated ground microwave radiation signal caused by the increased water vapour absorption and scattering in the wet season. The underestimated SMOS L3 SSM triggers the underestimation of RZSM in SMOS L4. The overestimated RZSM products based on land surface models could be associated with the overestimated precipitation amounts and frequency, the underestimated air temperature, and the underestimated ratio of transpiration to the total terrestrial evapotranspiration. In addition, the biased soil properties and flawed vegetation parameterizations affect the hydrothermal transport processes represented in different land surface models (LSMs) and lead to inaccurate soil moisture simulation. The scale mismatch between point and footprint also introduces representative errors. The comparison of frequency of normalized soil moisture between RZSM products and in situ observations indicates that the LSMs should focus on reducing the frequency of wet soil moisture, increasing the frequency of dry soil moisture and the ability to capture the frequency peak of soil moisture. The study provides some insights into how to improve the ability of land surface models to simulate the land surface states and fluxes by taking into account the issues mentioned above. Finally, these results can be extrapolated to other regions located in similar climate zones, as they share similar precipitation patterns that dominate the terrestrial water cycle.
- Article
(8844 KB) - Full-text XML
-
Supplement
(1690 KB) - BibTeX
- EndNote


Soil moisture plays a key role in the hydrological cycle and land–atmosphere interactions. It controls water and energy balances (Calvet, 2000; Brocca et al., 2010; Xing et al., 2021) and has been recognized by the World Meteorological Organization (WMO) as one of the 50 essential climate variables (Cho et al., 2015). In particular, root zone soil moisture (RZSM) has important applications in agricultural drought monitoring, water resource management, flood forecasting and seasonal climate prediction (Reichle et al., 2017a; Zhou et al., 2020; Beck et al., 2021; Xing et al., 2021; Xu et al., 2021; Fan et al., 2022). RZSM is the amount of water held in the top 1 m of the soil column that is available for plant transpiration and biomass production, which is crucial for agricultural drought monitoring. Different ecosystems in different climate and topography conditions have different rooting depth, and root zone water storage capacity (Gao et al., 2014; Kleidon, 2014; Fan et al., 2017; Gao et al., 2019a). The depth of root tissue can vary from a few centimetres to about 2 m. However, in large-scale modelling studies, the term “root zone” commonly refers to the 0–100 cm soil layer. This assumption is based on the fact that the vegetation root tissue is mostly densely distributed in this area (Baldwin et al., 2017). In the context of climate change, extreme events such as floods, droughts and heat waves are becoming more frequent around the world, with significant impacts on RZSM (Lorenz et al., 2010; Hauser et al., 2016; Al Bitar et al., 2021). For example, flash droughts are severely affecting RZSM and agricultural production in the Huaibei Plain, China (Gou et al., 2022).
Recently, microwave-based satellite missions have provided global soil moisture retrievals with approximately 3 d temporal resolution, but these are limited to the top few centimetres (0–5 cm for L-band) due to the limitations of microwave penetration depth (Kerr et al., 2001; Reichle et al., 2017b). Therefore, various approaches have been developed to estimate the RZSM and are roughly divided into three categories (Liu et al., 2023), including (1) statistics-based methods, such as linear regression (Zhang et al., 2017) and the cumulative distribution function (Gao et al., 2019b); (2) data-driven machine learning methods, such as random forest (Carranza et al., 2021) and artificial neural network (Kornelsen and Coulibaly, 2014); and (3) physically based methods, such as data assimilation of satellite-derived observations into land surface models (LSMs; Albergel et al., 2017; Bonan et al., 2020). Among them, the assimilation of satellite-derived observations into LSMs is considered the most accurate method to estimate RZM due to the explicit physical mechanism, while it requires large amounts of input data (precipitation, air temperature, radiation, etc.). To date, several RZSM products have been developed for broader global-scale applications, such as from the Global Land Data Assimilation System (GLDAS_NOAH and GLDAS_CLSM) (Rodell et al., 2004), the China Land Data Assimilation System (CLDAS) (Shi et al., 2014), the Soil Moisture Active Passive (SMAP) Level 4 (L4) (Reichle et al., 2012, 2017a), the European Centre for Medium-Range Weather Forecasts (ECMWF) fifth-generation reanalysis (ERA5) (Hersbach et al., 2020), the Modern-Era Retrospective Analysis for Research and Applications version 2 (MERRA-2) (Gelaro et al., 2017) and the National Centers for Environmental Prediction Climate Forecast System version 2 (NCEP CFSv2) (Saha et al., 2014). These RZSM products are generated by combining LSMs driven by meteorological forcing fields from atmospheric general circulation model (AGCM) and satellite-derived data using different data assimilation techniques (Calvet and Noilhan, 2000; Rodell et al., 2004). In addition, the Soil Moisture and Ocean Salinity (SMOS) Centre Aval de Traitement des Données (CATDS) provides SMOS L4 RZSM products, which are derived from SMOS Level 3 (L3) 3 d SSM retrievals using a statistical exponential filter model (Albergel et al., 2008; Al Bitar and Mahmoodi, 2020).
The accuracy of RZSM products is strongly influenced by the quality of meteorological forcing data, especially precipitation and air temperature (Zeng et al., 2021). Numerous studies have shown large uncertainties in global climate atmospheric forcing data, particularly for precipitation frequency, intensity and heavy-precipitation events (Sun et al., 2005; Piani et al., 2010; Velasquez et al., 2020; Jiao et al., 2021). Accurate representation of soil properties is also critical. Many global LSMs rely on the FAO/UNESCO (Food and Agriculture Organization, United Nations Educational, Scientific and Cultural Organization) World Soil Map (Reynolds et al., 2000), including GLDAS products (Bi et al., 2016; Yang et al., 2020), NCEP CFSv2 (Yang et al., 2020), ERA5 (Qin et al., 2017; Yang et al., 2020), SMOS L4 (Al Bitar et al., 2021) and MERRA-2 (McCarty et al., 2016; Gelaro et al., 2017). However, this soil map contains limited soil information in many regions, including China (Shangguan et al., 2013), leading to increased uncertainty in soil moisture simulations. In addition, the lack of representation of soil stratification can significantly affect the simulation of RZSM by LSMs. In the Huaibei Plain, the stratification of the plough layer, the black soil layer and the lime concretion layer can hinder the vertical movement of water from the surface layer to the root zone layer (Li et al., 2011; Zha et al., 2015; Gu et al., 2021). Finally, the accuracy of soil moisture simulations is also affected by inadequate model structures and imperfect parameterization schemes, especially for representation of vegetation in LSMs, such as the land cover and vegetation canopy and root tissue parameterizations (Nogueira et al., 2020; Stevens et al., 2020; van Oorschot et al., 2021) and soil evaporation and transpiration model representation (Lian et al., 2018; Dong et al., 2022; Feng et al., 2023). Vegetation is usually represented by land cover maps (that are usually prescribed similar to soil maps) and can be very different for the different models. Large uncertainties are shown in simulating the water and energy exchange between the land surface and the atmosphere. For example, Nogueira et al. (2020) found that the misrepresentation of the vegetation coverage results in a cold bias in land surface temperature during summer; they proposed an improved representation of vegetation with an update of the leaf area index (LAI) and high- and low-vegetation fractions, types and density, which effectively reduces the cold bias. Van Oorschot et al. (2021) proposed a climate-controlled root zone storage capacity by calculating a time-varying total soil depth based on a moisture depth model instead of using a constant of 2.89 m in the original HTESSEL LSM, which improved the water flux simulations. Dong et al. (2022) demonstrated that the inaccurate partitioning of evapotranspiration into soil evaporation and vegetation canopy transpiration results in warm bias in air temperature due to the inadequate utilization of RZSM for transpiration, which results in the underestimated ratio of transpiration to evapotranspiration. Different LSMs are used in LDAS or reanalysis products, such as the Noah LSM in GLDAS_NOAH and NCEP CFSv2 (Rodell et al., 2004; Saha et al., 2014); HTESSEL in ERA5 (Hersbach et al., 2020); CLSM in GLDAS_CLSM, MERRA-2 and SMAP L4 (Koster et al., 2000; Reichle et al., 2017d, 2021); and the Common Land Model (CoLM) and the Community Noah LSM with multi-parameterization options (Noah-MP) in CLDAS products (Wang et al., 2021a). The exponential filter technique is used in SMOS L4 (Al Bitar et al., 2021).
Numerous studies have been conducted to validate and assess the utility of SSM using in situ observations in the topsoil layer (Collow et al., 2012; Cui et al., 2017; Beck et al., 2021; Zheng et al., 2022). On the other hand, validation studies for RZSM are relatively rare, especially over China (Xing et al., 2021; Xu et al., 2021; Fan et al., 2022). Given the importance of the Huai River basin (HRB) as an agricultural grain production area in China, it is crucial to evaluate the performance of different RZSM products in this region. RZSM products can be validated against in situ observations, which serve as a reference dataset. Differences between in situ RZSM observations and RZSM products can be attributed to errors in meteorological forcing data, soil properties, parameterization and scale mismatch.
The objectives of this study are to (1) compare eight global RZSM products (ERA5, MERRA-2, NCEP CFSv2, GLDAS_CLSM v2.2, GLDAS_NOAH v2.1, CLDAS v2. 0, SMAP L4 and SMOS L4) with in situ soil moisture observations over the HRB from 1 April 2015 to 31 March 2020; (2) compare the RZSM products with each other over the HRB; and (3) investigate the potential sources of errors on the performance of the RZSM products, including meteorological forcing data, soil properties, soil stratification, vegetation parameterization and scale mismatch. The paper is organized as follows. The gridded RZSM products and in situ validation datasets (precipitation, air temperature, soil texture) are presented in Sect. 2. Section 3 describes the RZSM pre-processing methods and the statistical metrics used to evaluate the different datasets. The validation and the intercomparison of the RZSM products are presented in Sect. 4. Section 5 discusses the potential sources of error in various RZSM products. Section 6 provides the main conclusions.
2.1 The Huai River basin study area
The HRB is the transitional zone between the northern subtropical and warm temperate climates, and it is one of the most important commodity grain production areas in China. It is located in eastern China (30°55′–36°36′ N, 111°55′–121°25′ E) and covers an area of 270 000 km2 (Fig. 1). The HRB has a typical humid and sub-humid monsoon climate. The average annual precipitation is 888 mm and increases from north to south. More than 60 % of the annual precipitation falls between June and September (Zhang et al., 2009). The HRB suffers from frequent floods and droughts due to the spatial and temporal variability of precipitation and evaporation. The main land cover types in the HRB are rainfed croplands, followed by irrigated croplands, forests and grasslands. Overall, the terrain of the HRB is relatively flat, with a large plain covering 90 % of the area. The cultivated area in the HRB is approximately 127 200 km2, of which 76 % is irrigated according to the Manual of the Huai River Basin Irrigation Area (Chap. 2.1) and Summary of Flood Control Planning for the Huai River Basin (http://www.hrc.gov.cn, last access: 17 May 2024). The water resource infrastructure includes reservoirs, electromechanical wells, diversion locks and pumping stations built along lakes and rivers. Most cropland fields are irrigated by irrigation canals or a combination of wells and canals (Wang et al., 2021a). Annual evaporation can exceed precipitation. It ranges from 900 to 1500 mm and decreases from north to south (Wang et al., 2021a). Heavy irrigation in the HRB can explain the extra water available for evaporation.
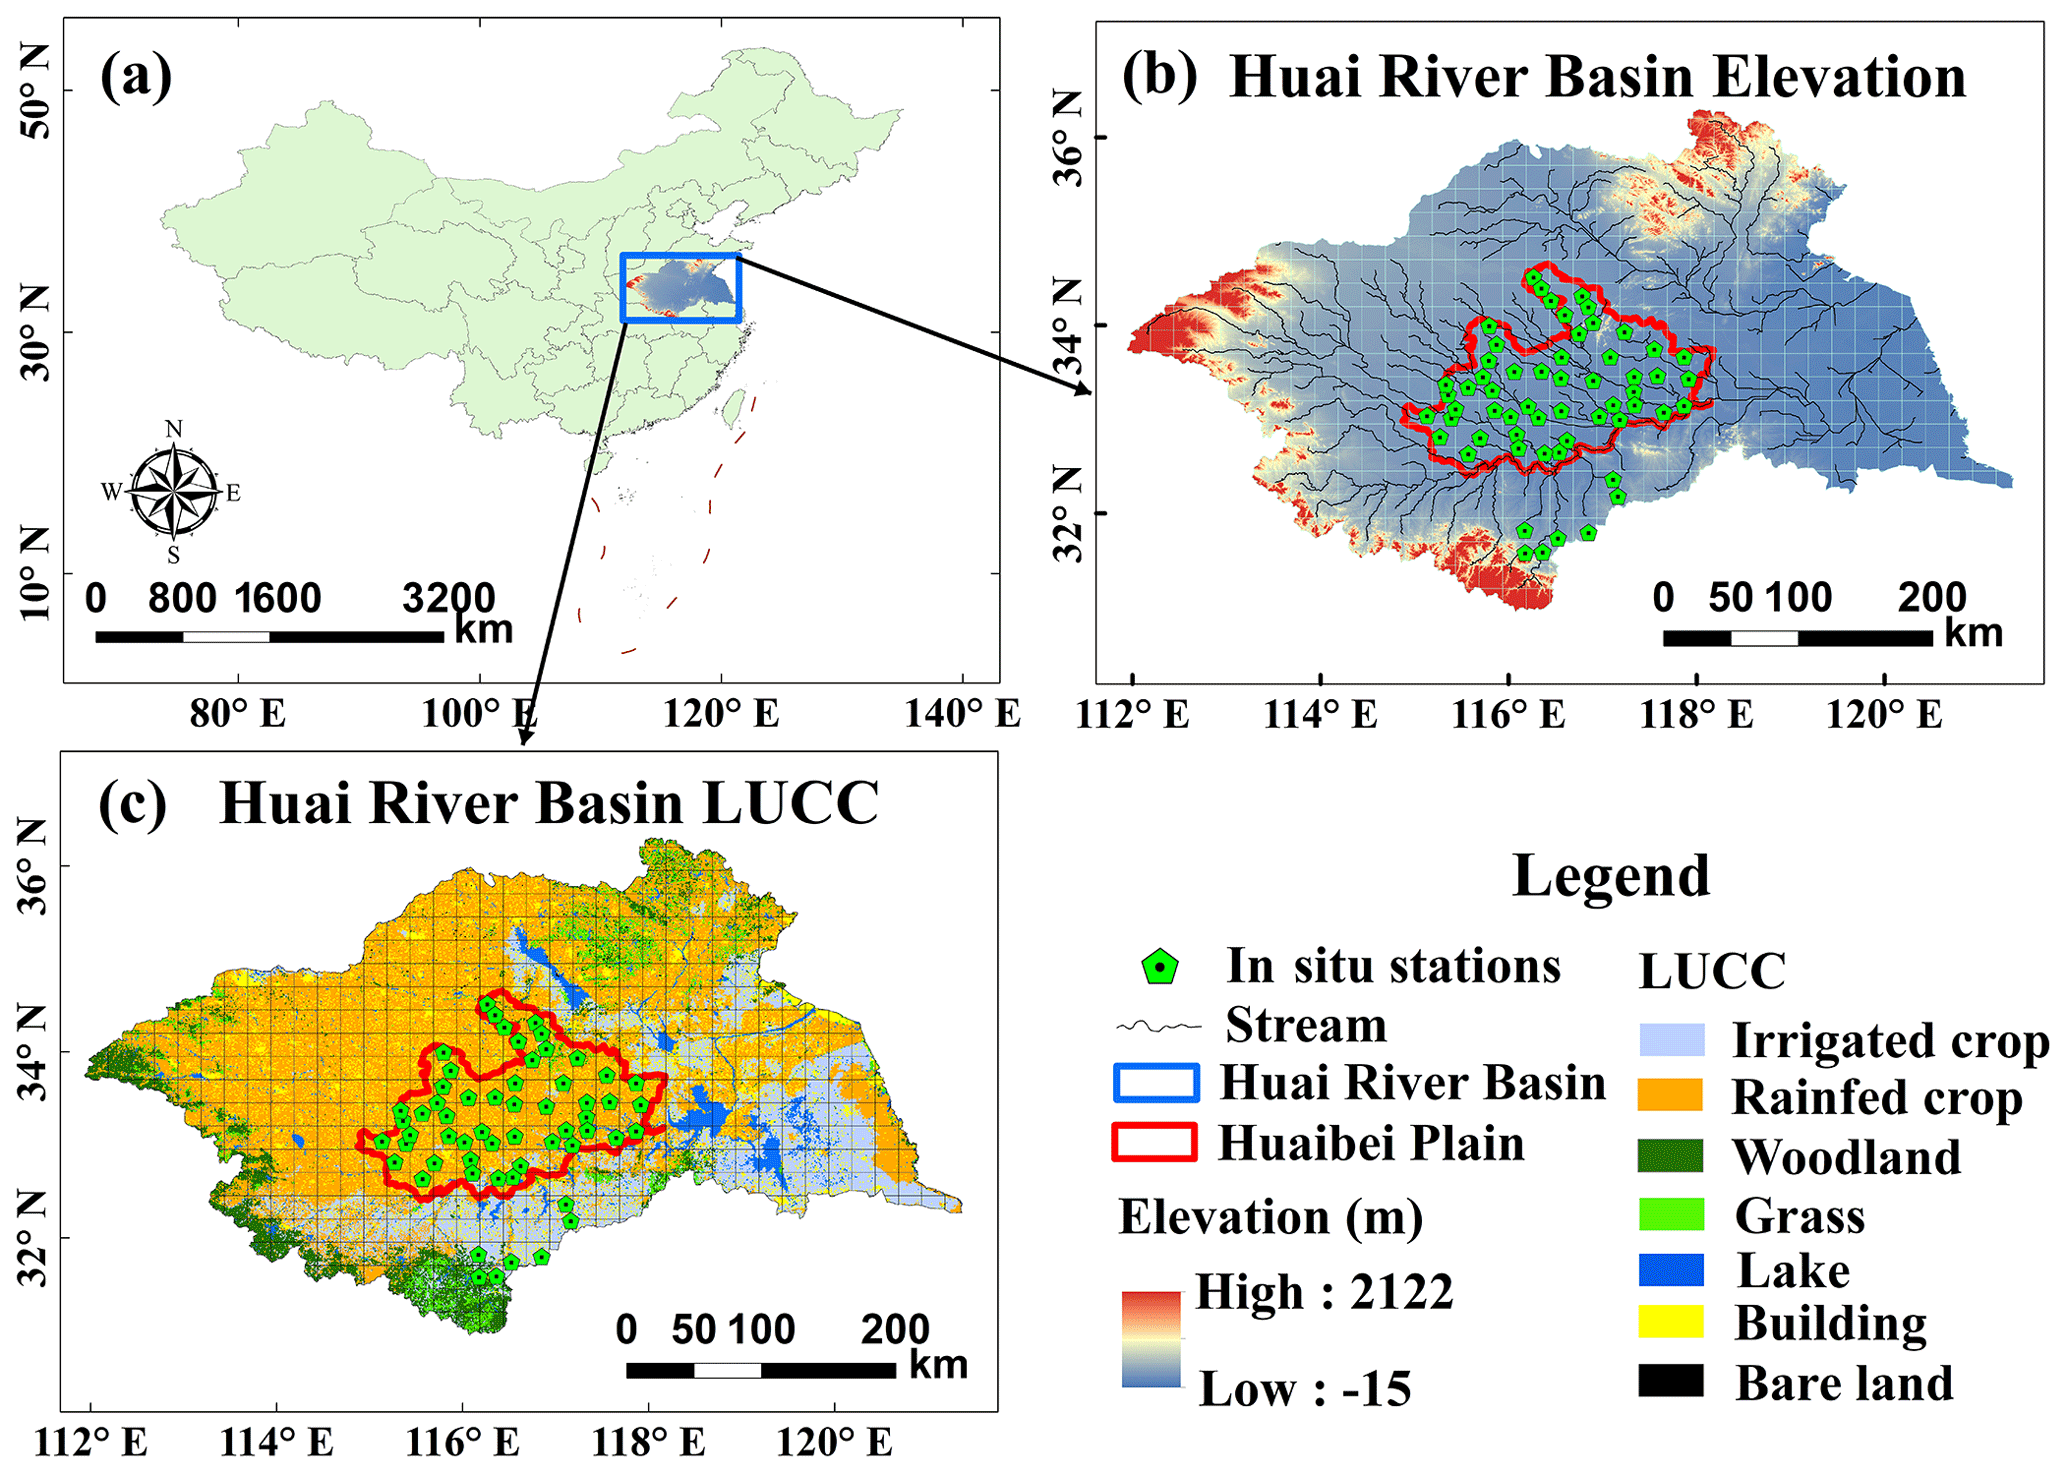
Figure 1Overview of the study area (including elevation, stream and land cover) and distribution of in situ soil moisture stations (green star). The squares in Fig. 1b and c represent a 0.25° grid. Publisher’s remark: please note that the above figure contains a disputed territory.
2.2 HRB in situ measurements
The HRB soil moisture network was established by the Ministry of Water Resources of the People's Republic of China. It consists of 58 in situ stations (see Fig. 1) and provides soil moisture measurements at four depths of 10, 20, 40 and 100 cm (Liu et al., 2023). At each station, volumetric soil moisture measurements in units of m3 m−3 are collected at 08:00 local solar time. These probes are calibrated using gravimetric measurements taken at each soil depth. The deployment of the soil moisture stations and the collection of soil moisture measurements follow the specifications for soil moisture monitoring (MWR, 2015). Since the study aims to evaluate the accuracy of eight RZSM products (0–100 cm) which are summarized in Table 1, the depth-weighted average of the in situ soil moisture measurements at the four depths is calculated to obtain the 0–100 cm soil moisture data.
The China Daily Gridded Ground Precipitation and Air Temperature dataset V2.0, provided by the China Meteorological Administration (CMA) (http://data.cma.cn, last access: 17 May 2024) with a spatial resolution of 0.5° × 0.5° (approximately 55.6 km), serves as a reference dataset for validating the meteorological forcing fields used in reanalyses and LDAS. The CMA dataset is derived by spatial interpolation using the partial thin-plate smoothing spline method from 2474 ground-based meteorological station observations across China, following stringent quality controls and necessary corrections. At the national level, the average coverage of gauging stations in a grid cell is 38 %. However, in the eastern part of China, where the HRB is located, the coverage reaches up to 77 %. The dataset has been extensively validated against ground observations and is of high quality. For example, the precipitation data have a root mean square error (RMSE) of 0.49 mm per month and a correlation coefficient (R) of 0.93 with a significance level p smaller than 0.01 (CMA, 2012b). The annual air temperature data have a mean bias and RMSE ranging from −0.2 to 0.2 °C and from 0.2 to 0.3 °C, respectively (CMA, 2012a).
2.3 Soil map
Soil databases used in many global LSMs have traditionally relied on the FAO/UNESCO 1:5 million scale World Soil Map with a spatial resolution of 5 arcmin (approximately 10 km). However, this FAO/UNESCO soil map contained limited soil information in different regions, including China. Consequently, the uncertainties in soil properties contributed to larger errors in the land surface variables simulated by the LSMs (e.g. RZSM), especially over China (Nachtergaele et al., 2009; Shangguan et al., 2013). To address these uncertainties, the Harmonized World Soil Database (HWSD) was developed by FAO and the International Institute for Applied Systems Analysis (IIASA) with a resolution of 30 arcsec (approximately 1 km). The HWSD combines recently collected regional and national updates of soil information with the FAO/UNESCO 1:5 million scale World Soil Map (FAO et al., 2012). HWSD also incorporates the 1:1 million scale soil map of China provided by the Institute of Soil Science, Chinese Academy of Sciences (ISSCAS).
A dataset of soil properties in China was developed by Shangguan et al. (2013) that integrates the physical and chemical properties of 8979 soil profiles along with the soil map of China, and it is employed in the CLDAS product (Qin et al., 2017). The dataset provides information on soil properties for eight layers (0–2.3 m) at a spatial resolution of 30 × 30 arcsec (approximately 1 km). The FAO/UNESCO and HWSD V1.2 soil datasets are employed in different LSMs, respectively. The China dataset of soil properties developed by Shangguan et al. (2013) is used as a reference to evaluate the soil properties (i.e. sand and clay content, bulk density and soil organic matter) of FAO/UNESCO and HWSD V1.2 datasets in Sect. 5.2.
2.4 Gridded RZSM products
The eight products considered in this study (Table 1) are presented below.
Table 1Description of global and regional RZSM gridded products used in this study.
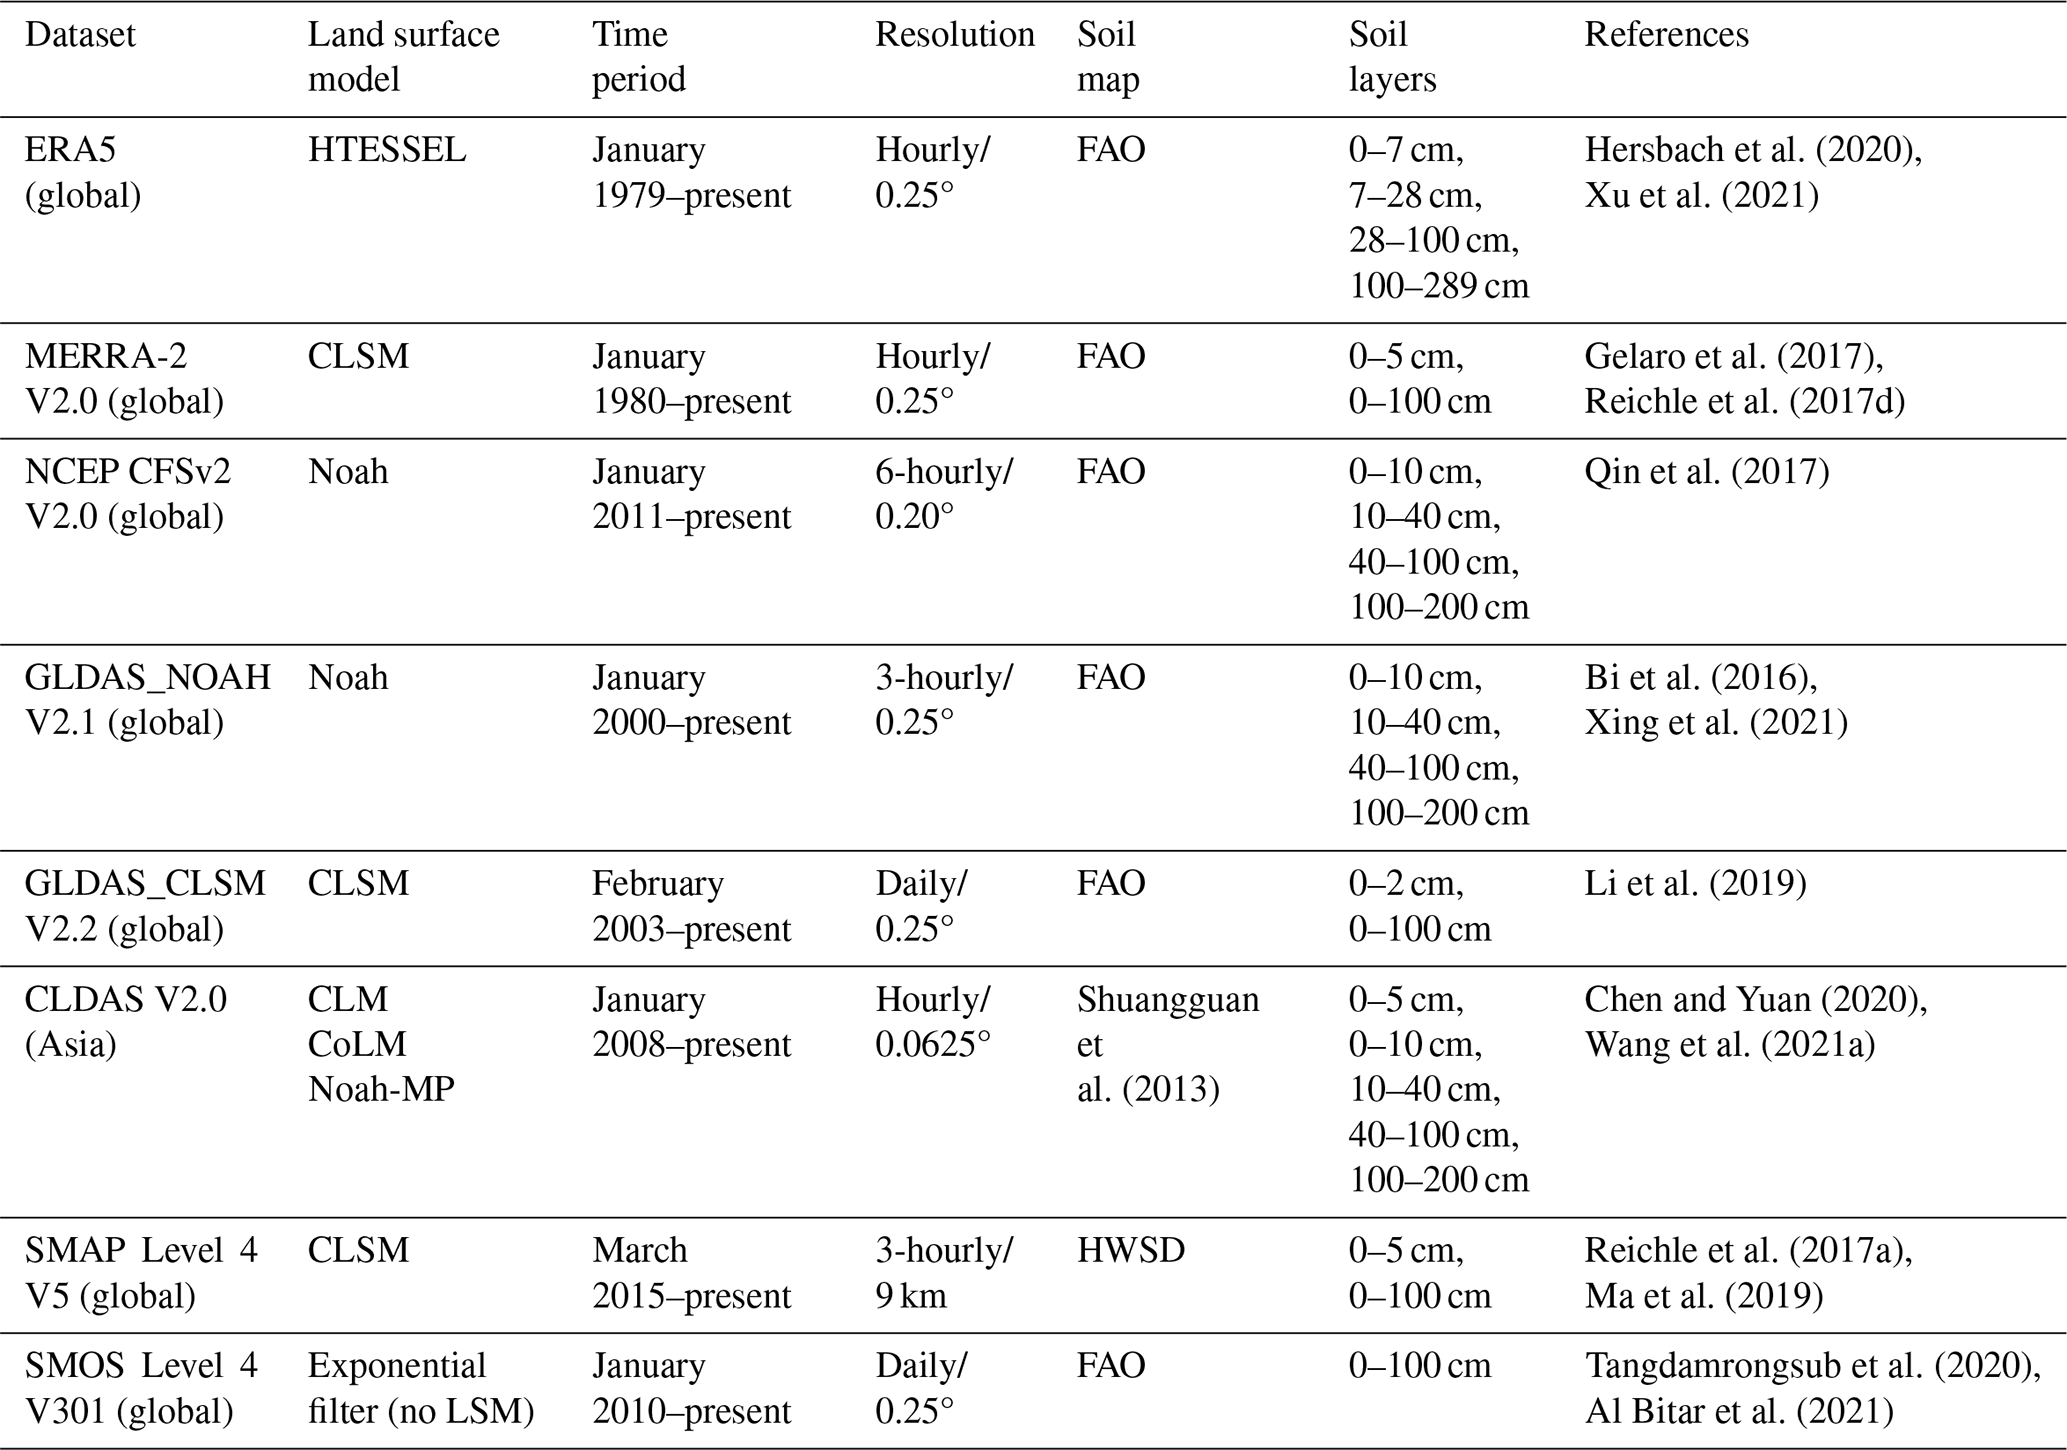
Note that precipitation, air temperature and soil texture have the same resolution as soil moisture.
2.4.1 ERA5
ERA5 is the fifth-generation global atmospheric reanalysis produced by ECMWF (Hersbach et al., 2023). ERA5 is developed using the 4-Dimensional Variational (4D-Var) data assimilation method that incorporates a 10-member ensemble and model forecasts from the ECMWF Integrated Forecast System (IFS) into CY41R2 with 137 hybrid sigma/pressure model levels in the vertical and the top level at 0.01 hPa (Hersbach et al., 2020). ECMWF IFS mainly assimilates satellite-derived precipitation data, such as from the Advanced Microwave Scanning Radiometer 2 (AMSR-2), the Global Precipitation Measurement (GPM), FengYun-3-C (FY-3-C), and the Tropical Rainfall Measuring Mission (TRMM), and ground-based radar precipitation composites, provided by the World Meteorological Organization Information System, to obtain the best precipitation estimates. The near-surface atmospheric forcing field at the lowest level of the atmospheric model (about 10 m a.g.l.) is used to force the HTESSEL LSM, which serves as the land surface component of the ECMWF IFS to model the land surface variables. HTESSEL uses the FAO/UNESCO World Soil Map and the Global Land Cover Characteristics (GLCC) database (Nogueira et al., 2020). The diffusivity form of the Richards equation is used to describe the vertical water flow within the soil column that is discretized into four layers in the HTESSEL. Besides, HTESSEL ignores the exchange of lateral water fluxes between adjacent grid cells. The screen-level parameter analysis (2 m temperature and relative humidity) is carried out first, and then its increments are incorporated into the soil moisture analysis.
2.4.2 MERRA-2
MERRA-2 is the latest version of the global atmospheric reanalysis product produced by NASA Global Modelling and Assimilation Office (GMAO, 2015). It uses the Goddard Earth Observing System Model (GEOS-5.12.4) atmospheric data assimilation system, which consists of (1) the GEOS atmospheric model and (2) the Gridpoint Statistical Interpolation assimilation system. The precipitation forcing is the weighted average of model background precipitation generated by GEOS-5 FP-IT (Forward Processing system for Instrument Teams) after 31 December 2014 and precipitation generated by AGCM, with weights dependent on latitude. The National Oceanic and Atmospheric Administration (NOAA) Climate Prediction Center (CPC) Unified Gauge-Based Analysis of Global Daily Precipitation (CPCU) product is used to correct the model background precipitation. The CPC Merged Analysis of Precipitation (CMAP) product is rescaled to match the climatology of the Global Precipitation Climatology Project product, version 2.1 (GPCPv2.1), and is fully used in Africa, which allows the observed precipitation to impact, via evapotranspiration, the near-surface air temperature and humidity, thereby yielding a more self-consistent near-surface meteorological dataset (Reichle et al., 2017d). CLSM uses the FAO/UNESCO World Soil Map and the Global Land Cover Characteristics (GLCC), version 2.0 (Reichle et al., 2017c), and is used as the land surface component of MERRA-2 to perform the land surface analysis. The CLSM used in MERRA-2 simulates the average soil moisture in the surface layer (0–5 cm), the root zone (0–100 cm) and the varying profile (from the land surface to the bedrock) and does not take into account lateral water fluxes (groundwater or river flow) between catchments, which is used as the basic computational unit (Reichle and Koster, 2003).
2.4.3 NCEP CFSv2
NCEP CFSv2 is the third-generation global atmospheric reanalysis product developed by the Environmental Modelling Center at NCEP. It is a global, high-resolution, coupled atmosphere–ocean–land surface–sea ice system designed to provide the best estimate of the state of these coupled domains (Saha et al., 2011). The global atmospheric data assimilation system (GDAS) employed in the climate forecast system simulates 64 sigma-pressure hybrid layers vertically. The Noah LSM is forced by the atmospheric forcing variables at the lowest level from the Climate Forecast System Reanalysis (CFSR) GDAS and the blended precipitation forcing. The global precipitation analysis from CMAP and CPCU and the model background precipitation from GDAS are integrated based on a latitude-dependent weighting method to provide the optimal global precipitation forcing for a reliable land surface simulation (Meng et al., 2012). The Noah LSM is first used in the coupled land–atmosphere–ocean model to provide the initial conditions of the land surface states and fluxes and then in the semi-coupled CFSR Global Land Data Assimilation System (GLDAS) to perform the land surface analysis and provide the evolving land surface states and fluxes (Saha et al., 2010, 2014). The Noah LSM employed in NCEP CFSv2 uses the FAO/UNESCO World Soil Map and the land cover classification based on the Advanced Very High Resolution Radiometer (AVHRR) 1 km dataset.
2.4.4 GLDAS_NOAH
GLDAS_NOAH version 2.1 is the mainstream land surface analysis product developed by NASA Goddard Earth Sciences Data and Information Services Center (GES DISC) that aims to provide the optimal fields of land surface states and fluxes by incorporating large amounts of satellite- and ground-based observations (Rodell et al., 2004; Beaudoing et al., 2020). No data assimilation procedure was implemented in the GLDAS_NOAH version 2.1 product. The offline (not coupled to the atmosphere) Noah LSM is forced with a combination of model- (NOAA/Global Data Assimilation System (GDAS) atmospheric analysis fields) and observation-based precipitation (the disaggregated Global Precipitation Climatology Project (GPCP) V1.3 Daily Analysis precipitation fields) and radiation data (the Air Force Weather Agency's AGRicultural METeorological modeling system (AGRMET) radiation fields) to provide optimal fields of land surface analysis. The soil column is discretized into four layers for describing the movement of soil moisture based on the diffusive form of the Richards equation in NOAH LSM, which is the same as NCEP CFSv2. GLDAS_NOAH uses the hybrid STATSGO/FAO World Soil Map and the modified IGBP MODIS (Moderate Resolution Imaging Spectroradiometer) 20-category vegetation classification (Rui et al., 2021).
2.4.5 GLDAS_CLSM
GLDAS_CLSM version 2.2 is one of the most popular analysis dataset of land surface states and fluxes developed by NASA Goddard Earth Sciences Data and Information Services Center (GES DISC). The CLSM embedded in the GLDAS is forced by the meteorological analysis fields from the operational ECMWF IFS. These meteorological forcing fields are obtained by assimilating large amounts of atmospheric observations to update the model background predictions (e.g. precipitation) derived in the forecast step and are available at a 0.25°, 3-hourly interval (Li et al., 2019, 2020). The CLSM used in GLDAS does not have explicit vertical levels for soil moisture and only simulates the soil moisture represented by the surface layer (0–2 cm), root zone (0–100 cm) and varying profile. The lateral water fluxes between catchments are also not taken into account in the current CLSM (Reichle and Koster, 2003). The FAO/UNESCO World Soil Map and the University of Maryland (UMD) land cover classification based on the AVHRR land cover map are used in the GLDAS_CLSM (Rui et al., 2021). Unlike the open-loop GLDAS version 2.1 product, the GLDAS version 2.2 product assimilates observations of the total terrestrial water (TWS) anomaly from the Gravity Recovery and Climate Experiment (GRACE). Temporal changes of TWS are influenced by changes in soil moisture, snow and ice, surface water and biomass, and groundwater storage.
2.4.6 CLDAS
The CLDAS-2.0 is the Asian atmospheric and land surface analysis product with high temporal and spatial resolution developed and released by CMA. It is produced based on a multi-LSM operational system consisting of CLM, CoLM, and Noah-MP, with a spatial coverage of 0–60° N and 70–150° E and temporal coverage from January 2008 to present (CMA, 2015). The production of CLDAS-V2.0 involves the following three processes. Firstly, nearly 40 000 automated meteorological station measurements, ECMWF and NCEP numerical analysis/forecast products, satellite-derived precipitation (FY2), and a digital elevation model (DEM) are used to produce 0.0625°, hourly estimates of meteorological forcing data by operating the Space-Time Multi-Scale Analysis System (STMAS) (Shi et al., 2014; Wang et al., 2021a). Meanwhile, the meteorological forcing is validated using national automatic station observations (more than 2400 stations). Second, the meteorological forcing is used to drive the multi-LSM system to obtain a multi-layer ensemble of soil moisture estimates. Finally, the ensemble mean is applied to each soil layer to produce a soil moisture ensemble analysis product. CLDAS utilizes the soil property dataset developed by Shangguan et al. (2013) and simulates five soil layers for the diffusion for water flux and the transmission for heat flux vertically.
2.4.7 SMAP L4
The SMAP Level-4 soil moisture (L4-SM) is produced by assimilating SMAP radiometer Level 1C brightness temperature observations into CLSM and provides global, 3-hourly, 9 km resolution estimates of SSM (0–5 cm) and RZSM (0–100 cm) from March 2015 to present (Reichle et al., 2020; Reichle et al., 2021). The Goddard Earth Observation System, version 5, LDAS (GEOS-5 LDAS) uses a spatially distributed ensemble Kalman filter (EnKF) to assimilate the observations into CLSM (Rienecker et al., 2008). The EnKF has a 3-hourly update time step and is used to interpolate and extrapolate the brightness temperature and model estimates in time and space (Reichle et al., 2017a). The GEOS-5 CLSM is driven by surface meteorological data (precipitation, radiation, etc.) from the GEOS-5 Forward Processing (FP) system, where large amounts of observations are assimilated into a global atmospheric model. The CPCU, 0.5°, daily precipitation observations are used to correct the GEOS-5 FP model background precipitation. Prior to the GEOS-5 FP precipitation correction, both the CPCU precipitation data and the hourly background precipitation are scaled to the climatology of the GPCPv2.2 pentad precipitation product. The SMAP L4 product uses the updated HWSD V1.2 soil property dataset and the MODIS land cover product based on the UMD classification (Reichle et al., 2012).
2.4.8 SMOS L4
The SMOS L4 soil moisture product is disseminated by SMOS CATDS and provides global, daily estimates of RZSM (0–100 cm) over a 25 km EASE-2 grid from January 2010 to present (Al Bitar and Mahmoodi, 2020; CATDS, 2021). The SMOS L4 RZSM is derived from the SMOS L3 3 d SSM product using a modified exponential filter linking the characteristic time length T (the transfer time of water from the surface layer to the root zone layer) to the soil properties (Pablos et al., 2018). The soil parameters (i.e. saturated water content, the soil moisture at wilting point and the soil moisture at field capacity) are calculated based on the soil texture from the FAO soil texture map (Al Bitar et al., 2021). The product is based on SMOS descending orbit (18:00) observations and other ancillary datasets such as MODIS observations, NCEP climate data and an updated FAO/UNESCO soil properties' map. The soil column is divided into three layers (layer 1, 0–5 cm; layer 2, 5–40 cm; and layer 3, 40–100 cm) in a water bucket model. The scaled 0–5 cm soil moisture is modified using a logarithmic function and filtered to obtain the layer 2 soil moisture. The scaled layer 2 soil moisture is then filtered using a different value of T to give the layer 3 soil moisture. Finally, the RZSM (0–100 cm) is calculated as a depth-weighted average of the soil moisture of the three layers (Al Bitar et al., 2021).
3.1 Statistical metrics
Four widely used statistical metrics were used to quantitatively assess the performance of RZSM products against in situ measurements. The Pearson correlation coefficient (R) measures the linear correlation between the in situ measurements and the RZSM products. Mean bias error (MBE) reflects the mean systematic deviation of the model simulations relative to the measurements. Accuracy is assessed using the root mean square error (RMSE). The unbiased RMSE (ubRMSE) measures the standard deviation of the differences. In addition, the probability of detection (POD), false alarm ratio (FAR) and critical success index (CSI) are used to assess the ability of the global gridded rainfall to reproduce the measured rainfall (Su et al., 2019). POD is the proportion of real precipitation events simulated by AGCM relative to the actual precipitation events, reflecting the ability of AGCM to detect precipitation. FAR is the fraction of unreal precipitation events of the total precipitation events simulated by AGCM. CSI is a more balanced score that combines the characteristics of false alarms and missed events, representing the probability of successful simulation of AGCM precipitation. In this study, these metrics are calculated at daily time steps after aggregating all sub-daily products to daily time steps. Note that the number of observations at each in situ station used to calculate the scores is 1827. Detailed statistical metrics are summarized in Table 2.
3.2 Calculation and validation of RZSM
As the in situ measurements are available at several specific depths (10, 20, 40 and 100 cm), the RZSM is calculated using a depth-weighted average of the four soil moisture layers (Xing et al., 2021). The equation is as follows:
where θRZSM refers to the 0–100 cm RZSM (m3 m−3), θn is the volumetric soil moisture at the nth observation depth (m3 m−3), and Ln is the soil layer thickness between adjacent observation depths (m).
For the RZSM products, in addition to the GLDAS_CLSM, MERRA-2, SMAP L4 and SMOS L4, which directly provide the 0–100 cm RZSM, other RZSM products are provided in different soil layers; i.e. NCEP CFSv2, CLDAS and GLDAS_NOAH provide θ0–10 cm, θ10–40 cm and θ40–100 cm, and ERA5 provides θ0–7 cm, θ7–28 cm and θ28–100 cm. For example, the GLDAS_NOAH RZSM can be calculated as
where θRZSM denotes 0–100 cm RZSM (m3 m−3), and θ0–10 cm, θ10–40 cm and θ40–100 cm denote the soil moisture estimates at 0–10, 10–40 and 40–100 cm, respectively.
3.3 RZSM products aggregation and validation strategies
In terms of the temporal resolution, GLDAS_CLSM and SMOS L4 products provide RZSM data at daily time intervals. NCEP CFSv2 and GLDAS_NOAH products provide RZSM data at a 3-hourly and 6-hourly time interval, respectively, which do not have consistent hours of soil moisture data with in situ observations only available at 08:00. To maintain consistency, the other sub-daily RZSM datasets (hourly, 3-hourly and 6-hourly time steps, shown in Table 1) are aggregated to daily average values to match the daily sampling frequency of the in situ observations. In terms of spatial resolution, we did not change the spatial resolution of any RZSM products and used the RZSM time series for each grid where the in situ stations are located. Two validation strategies were used in the study. The first is to compare the RZSM time series averaged over all in situ stations with the RZSM time series averaged over all model grids where the in situ stations are located (Figs. 2 and 3 shown in this study). The second one is the point-grid validation, whereby the RZSM measurements at each in situ station are compared directly with the RZSM values for the grid where the in situ station is located, and if there is more than one in situ station within a grid, the RZSM measurements at each station are compared to the grid values separately. The point-grid validation is provided in Figs. 4 and S1.
The global precipitation and air temperature forcing data are used in the production of model-based RZSM products except for SMOS L4, which are validated against the China daily gridded ground precipitation and air temperature dataset V2.0 described in Sect. 2.2. The soil properties' data used in the eight RZSM products were all derived from the FAO/UNESCO World Soil Map except for CLDAS, which used the soil data developed by Shangguan et al. (2013), and SMAP L4, which used the HWSD V1.2 soil properties over China. The China soil dataset developed by Shangguan et al. (2013) is used as a reference to evaluate the accuracy of FAO/UNESCO and HWSD V1.2 soil properties (clay and sand content, organic carbon content and bulk density).
3.4 Calculation of seasonal anomaly
Soil moisture products can show large differences at different timescales (e.g. subseasonal, mean seasonal and interannual) (Draper and Reichle, 2015; Gruber et al., 2020). To avoid seasonal effects, the soil moisture products are typically decomposed into different frequency components (e.g. the raw soil moisture and monthly soil moisture anomaly). In this study, the monthly anomaly time series of the RZSM are calculated based on the moving average decomposition method. The difference from the mean is divided by the standard deviation for a moving average window of 5 weeks (Rüdiger et al., 2009; Albergel et al., 2012). The moving window F is defined as follows for each RZSM estimate or observation on day (t), . If at least five measurements are available in this period, the moving average and the standard deviation of the root zone soil moisture are calculated. The anomaly is given by the following equation:
where RZSM(t), RZSManomaly(t) and SD denote the raw RZSM, the seasonal anomaly of RZSM at day t and standard deviation, respectively. Equation (3) is applied to gridded and in situ RZSM for comparison.
Table 2List of the statistical metrics for evaluation of RZSM products and corresponding precipitation forcing data using in situ measurements.
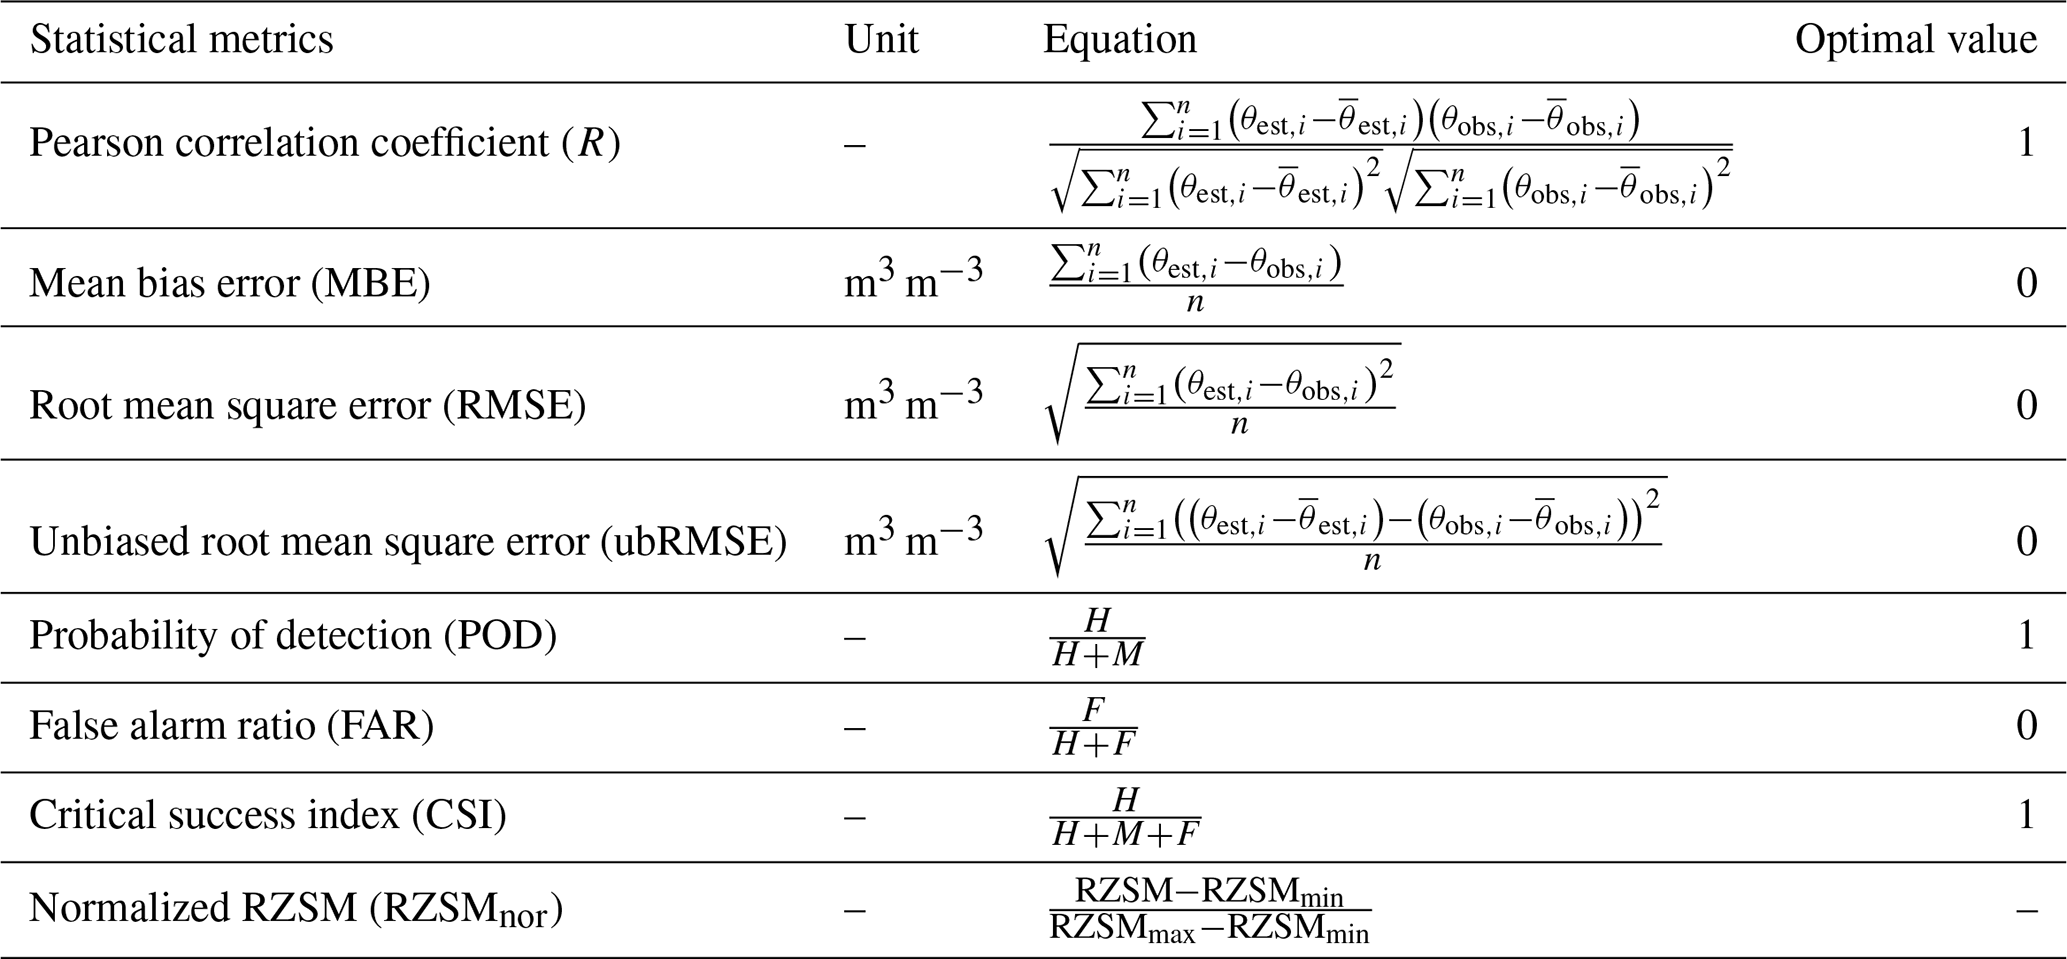
Note that n is the number of gap-filled daily observations (1827) used at each of the 58 in situ stations (see Table S1). θest,i and θobs,i are RZSM products and in situ measurements (m3 m−3), respectively; and are the means of θest,i and θobs,i over the entire research period; H is the number of precipitation events detected by model and in situ measurements; M is the number of measured precipitation events not recognized by the model product; and F is the number of model-based precipitation events not detected by in situ measurements. RZSMnor represents the normalized RZSM, and RZSMmin and RZSMmax represent the maximum and minimum of RZSM, respectively.
4.1 Comparison between gridded and in situ RZSM
Figure 2 shows scatterplots of RZSM products against the in situ measurements averaged across all in situ stations over the HRB, from 1 April 2015 to 31 March 2020. The statistical metrics are shown in Table 3. Regarding the bias, except for the underestimation by SMOS L4 (−0.047 m3 m−3), all the other products overestimate the RZSM observations by 0.030 to 0.117 m3 m−3 (SMAP L4 and ERA5, respectively). ERA5 and CLDAS have the largest RMSE values among all the RZSM products due to the large bias. Regarding correlation and ubRMSE, GLDAS_CLSM (R= 0.69, ubRMSE = 0.018 m3 m−3) outperforms the other RZSM products, followed by MERRA-2, ERA5, CLDAS, SMAP L4 and GLDAS_NOAH, NCEP CFSv2 and SMOS L4. Overall, GLDAS_CLSM performs best among the eight RZSM products in terms of R, ubRMSE and bias values, while SMAP L4 presents the lowest RMSE and the lowest bias. SMOS L4 presents the worst performance with the lowest R value. The detailed statistics are shown in Table 3.
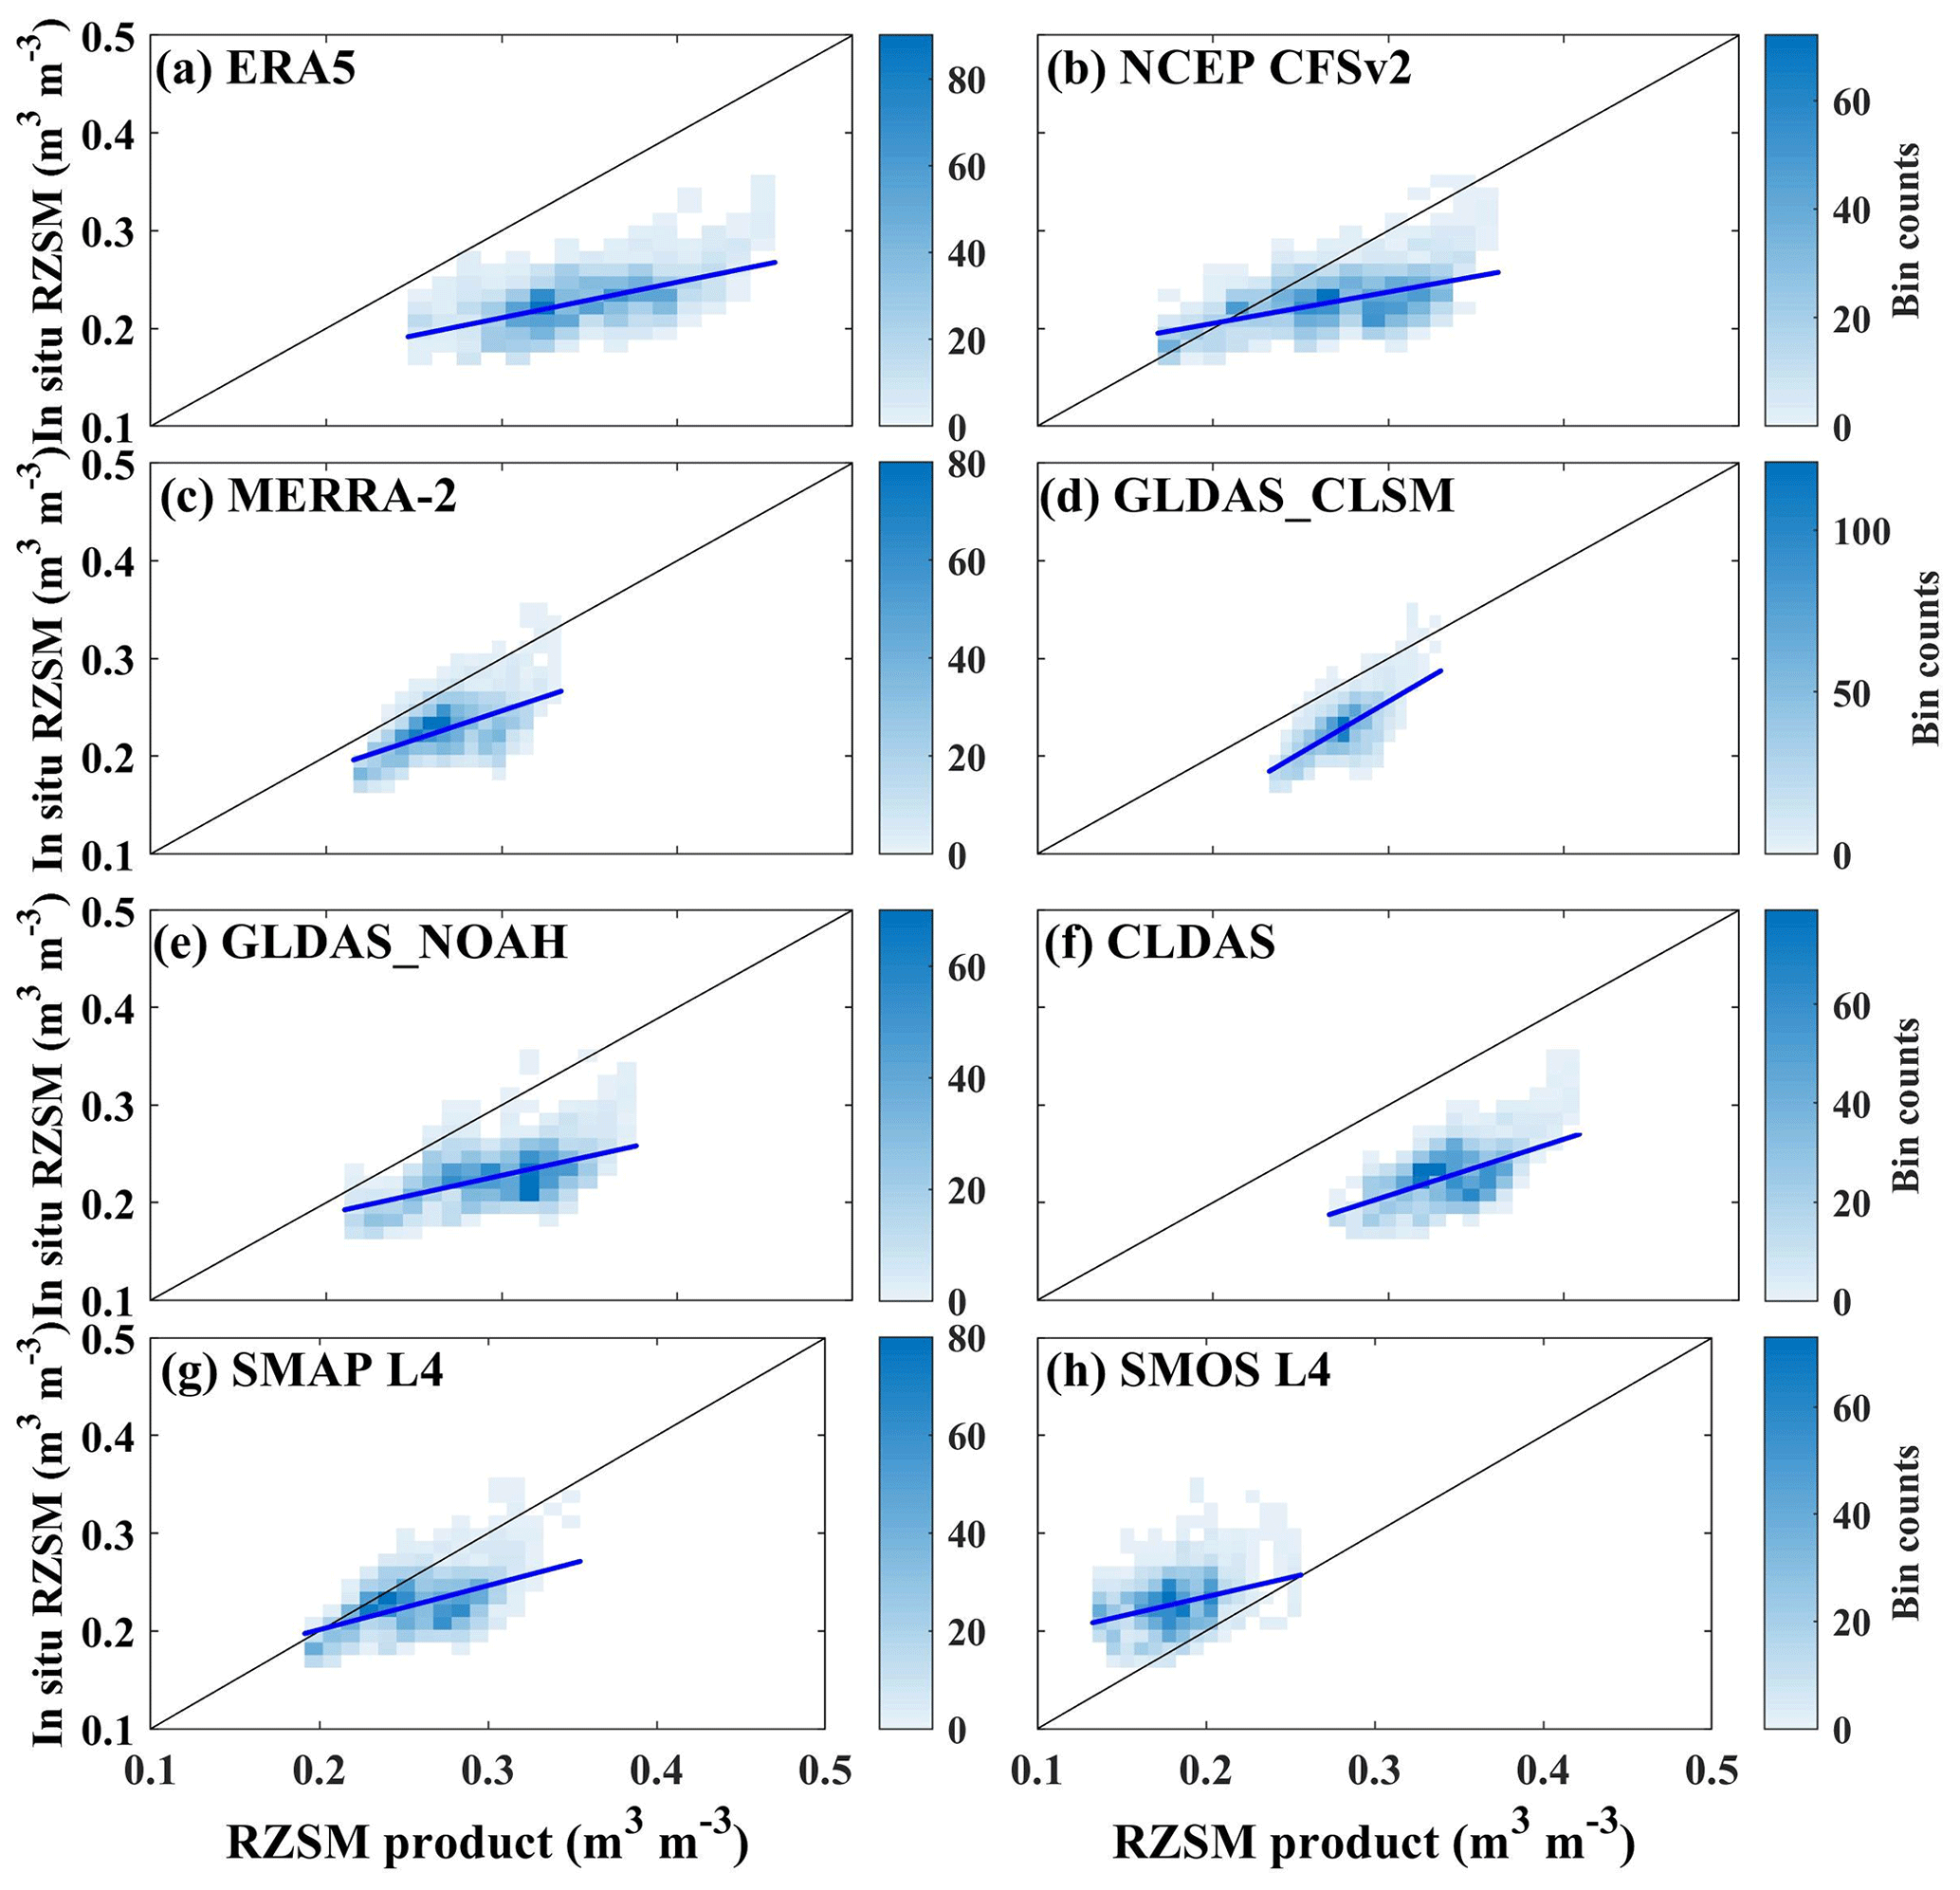
Figure 2Scatterplots of RZSM products vs. in situ RZSM observations averaged across all in situ stations from 1 April 2015 to 31 March 2020. Scores are given in Table 3. Darker regions show a higher density of data points, and the blue line in each panel represents the fitted trend for the data points.
Figure 3 shows the time series of observation- and model-based RZSM averaged over all in situ stations and the grids where the in situ stations are located. ERA5, SMOS L4 and GLDAS_CLSM show the highest overestimation, the lowest underestimation and the best overall agreement with in situ observations, respectively. In general, all RZSM products capture the rapid temporal variations of the in situ soil moisture observations and respond well to precipitation events, except for SMOS L4, which shows less rapid changes and smoother time series. The model-based RZSM products generally perform better in the wet season than in the dry season, while SMOS L4 performs better in the dry season than in the wet season (Figs. 4 and S1). The in situ RZSM observations show a variation in the range of 0.1 to 0.4 m3 m−3. The range of NCEP CFSv2 and SMAP L4 RZSM is similar to the observed RZSM range. ERA5 and CLDAS present larger RZSM values, ranging from 0.2 to 0.5 m3 m−3. MERRA-2, GLDAS_CLSM and GLDAS_NOAH RZSM values range from 0.2 to 0.4 m3 m−3, which is a narrower interval compared to the other products. SMOS L4 displays the smallest RZSM values, ranging from 0.1 to 0.3 m3 m−3.
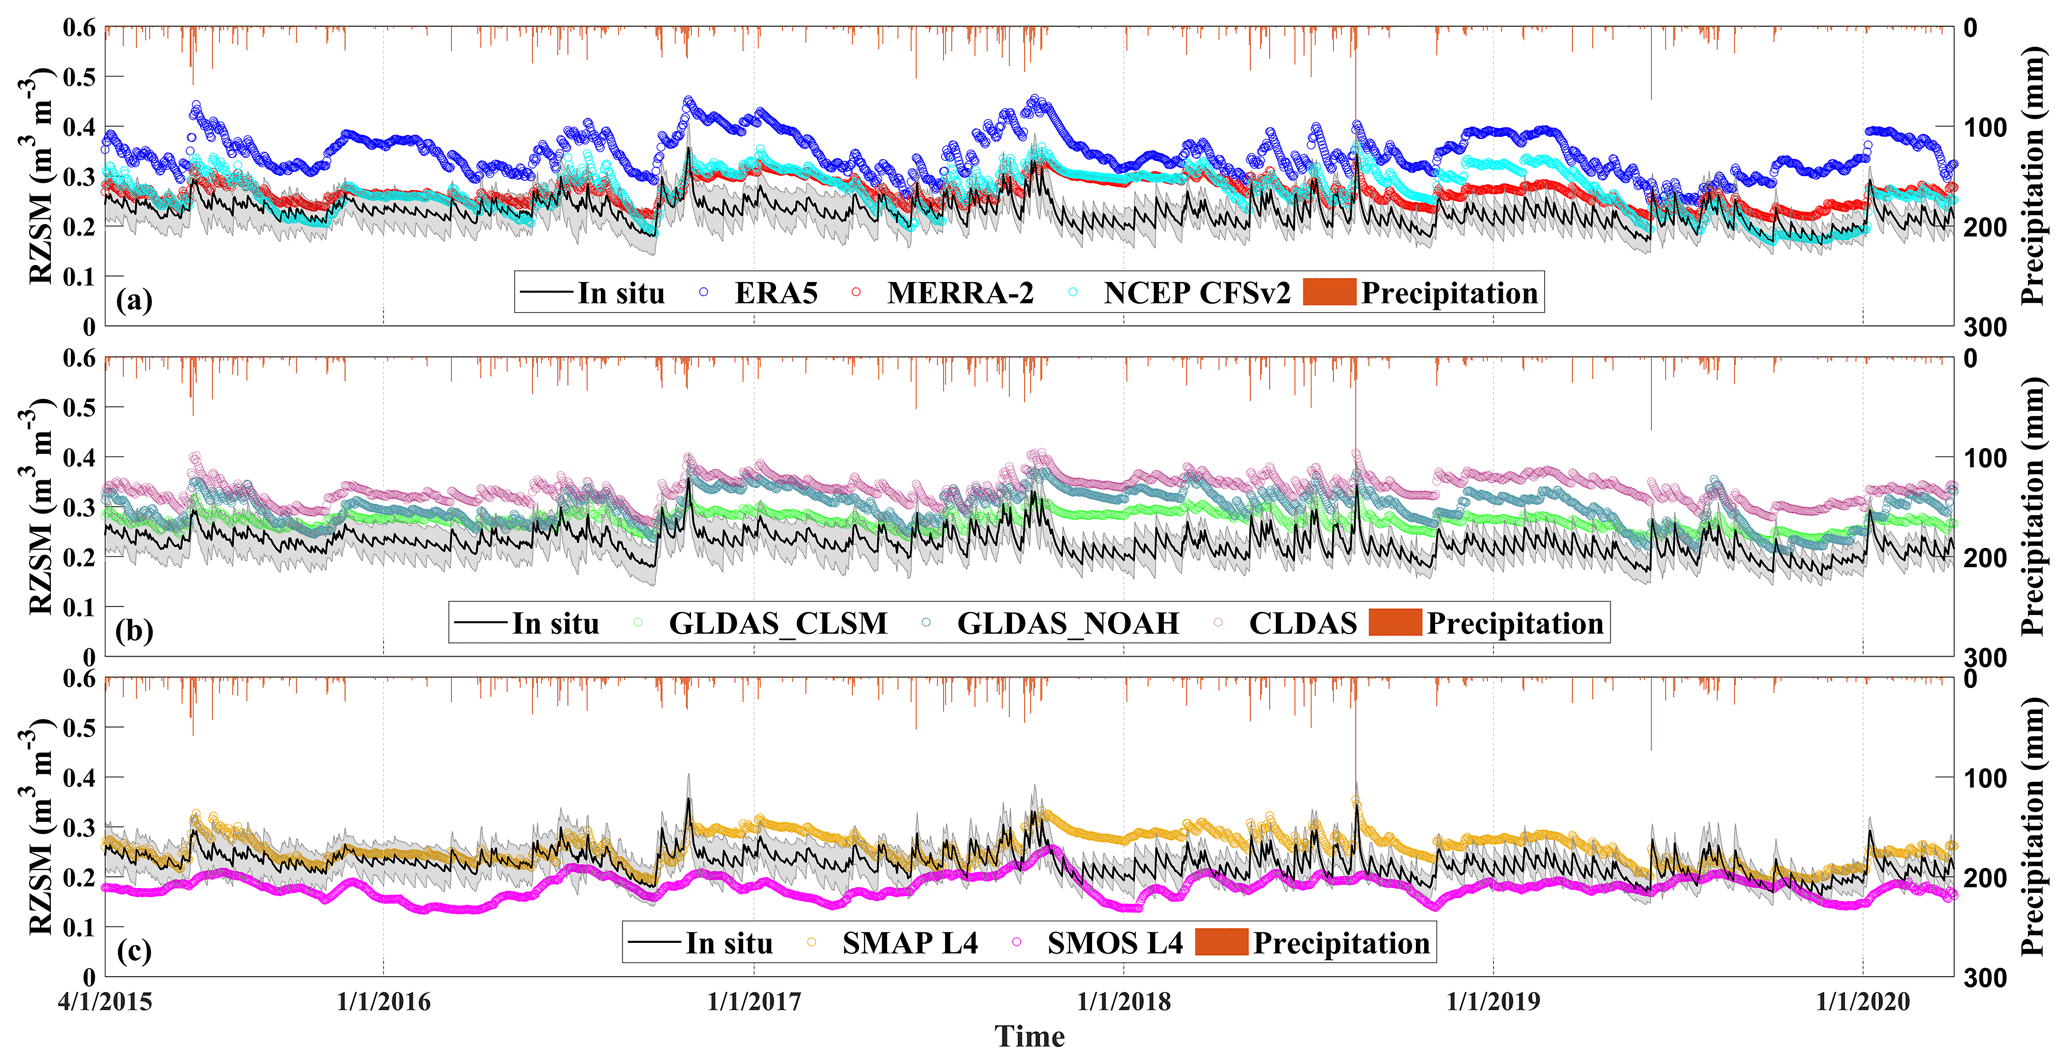
Figure 3Time series of RZSM (0–100 cm) products and in situ soil moisture observations averaged across all in situ stations from 1 April 2015 to 31 March 2020. The dark line and the grey-shaded areas represent the mean and standard deviation of in situ stations observations. Coloured lines represent different RZSM products. Daily precipitation is represented by the orange vertical bars.
Table 3Statistical metrics of eight RZSM products validated by in situ measurements (0–100 cm) averaged over all stations from 1 April 2015 to 31 March 2020 (Fig. 2). Mean score values are given. Best score values are in bold. The number of observations used to calculate the scores is 1827 for each product.
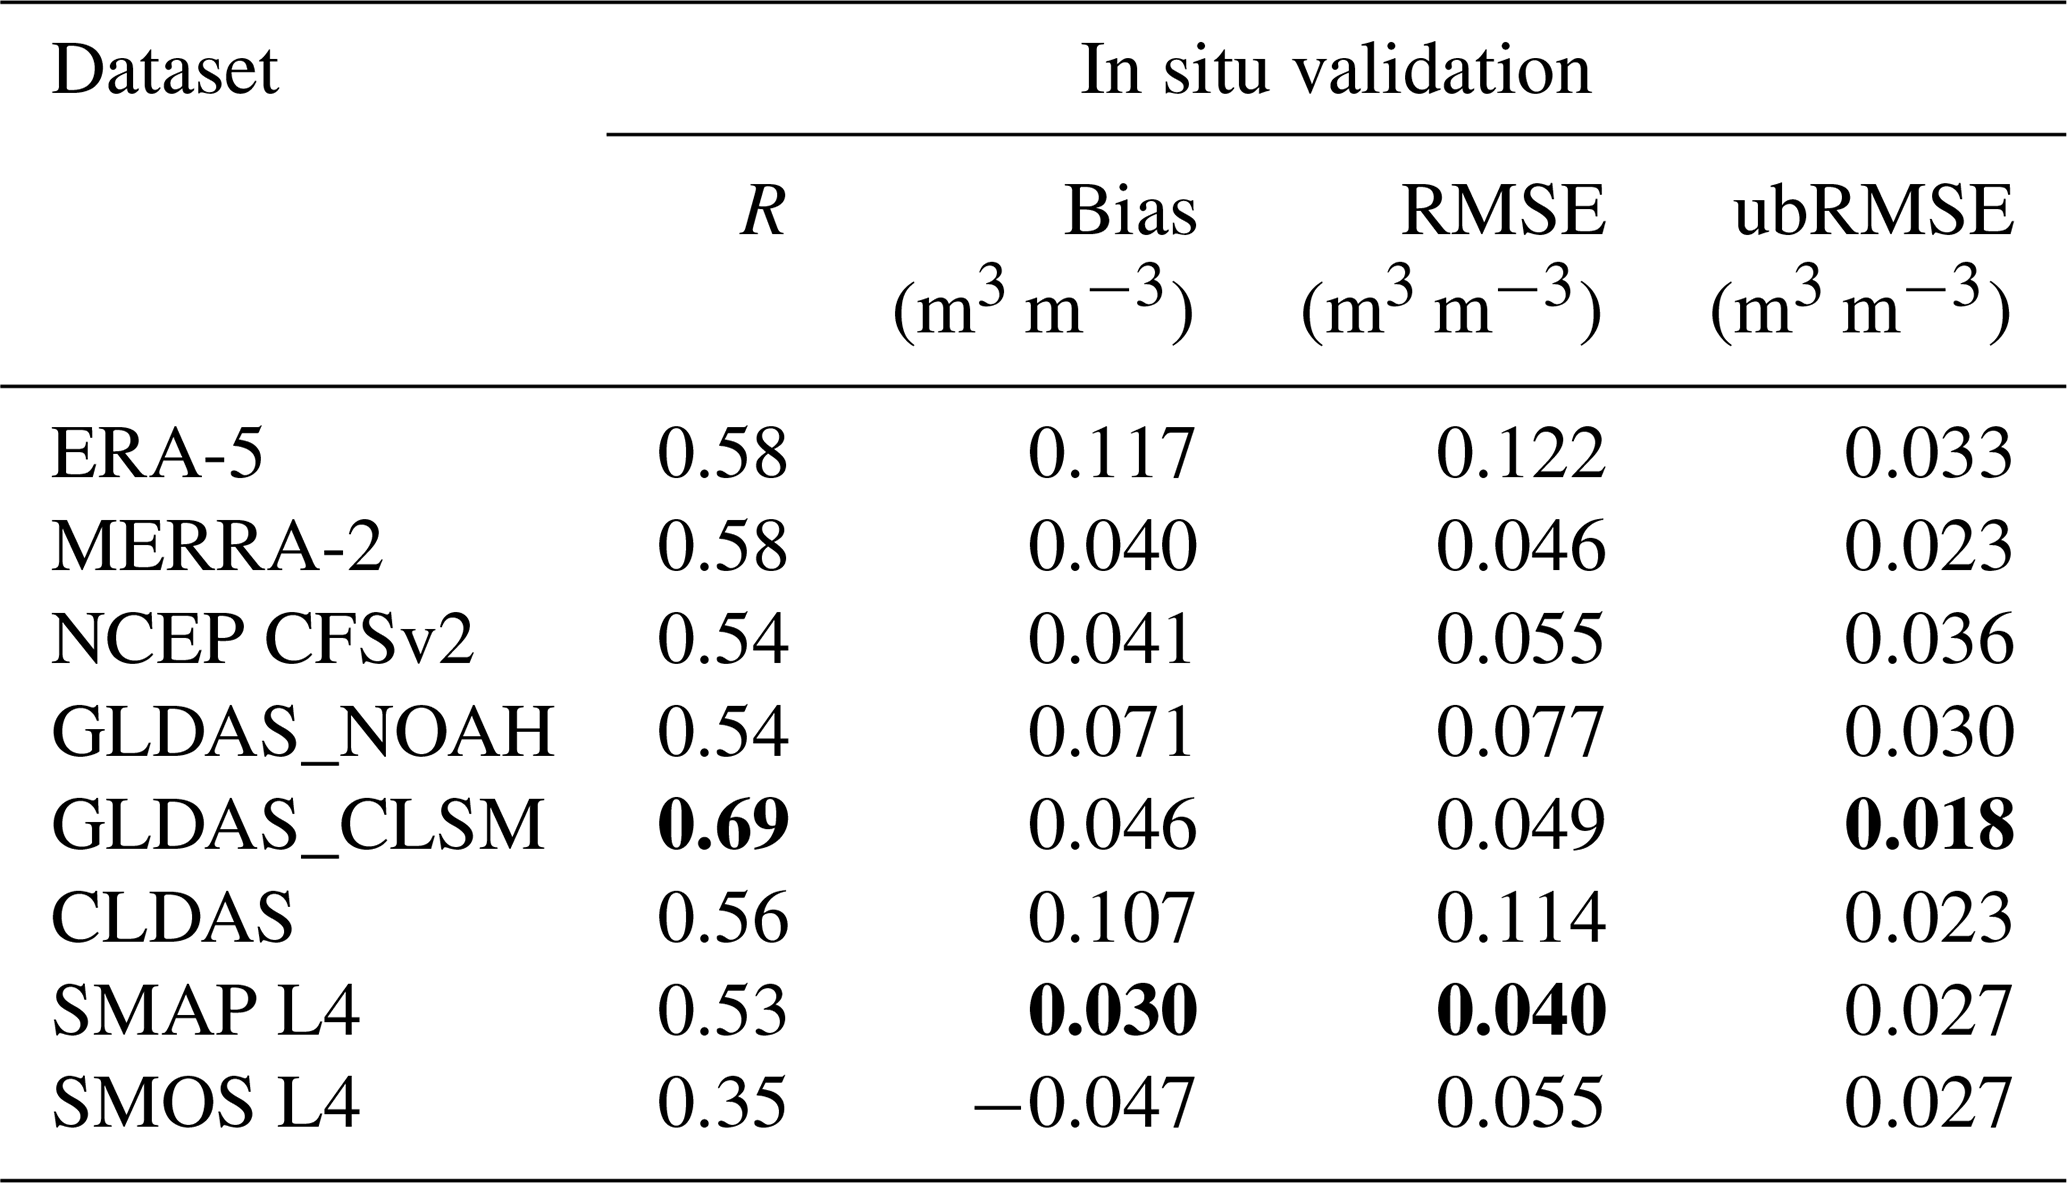
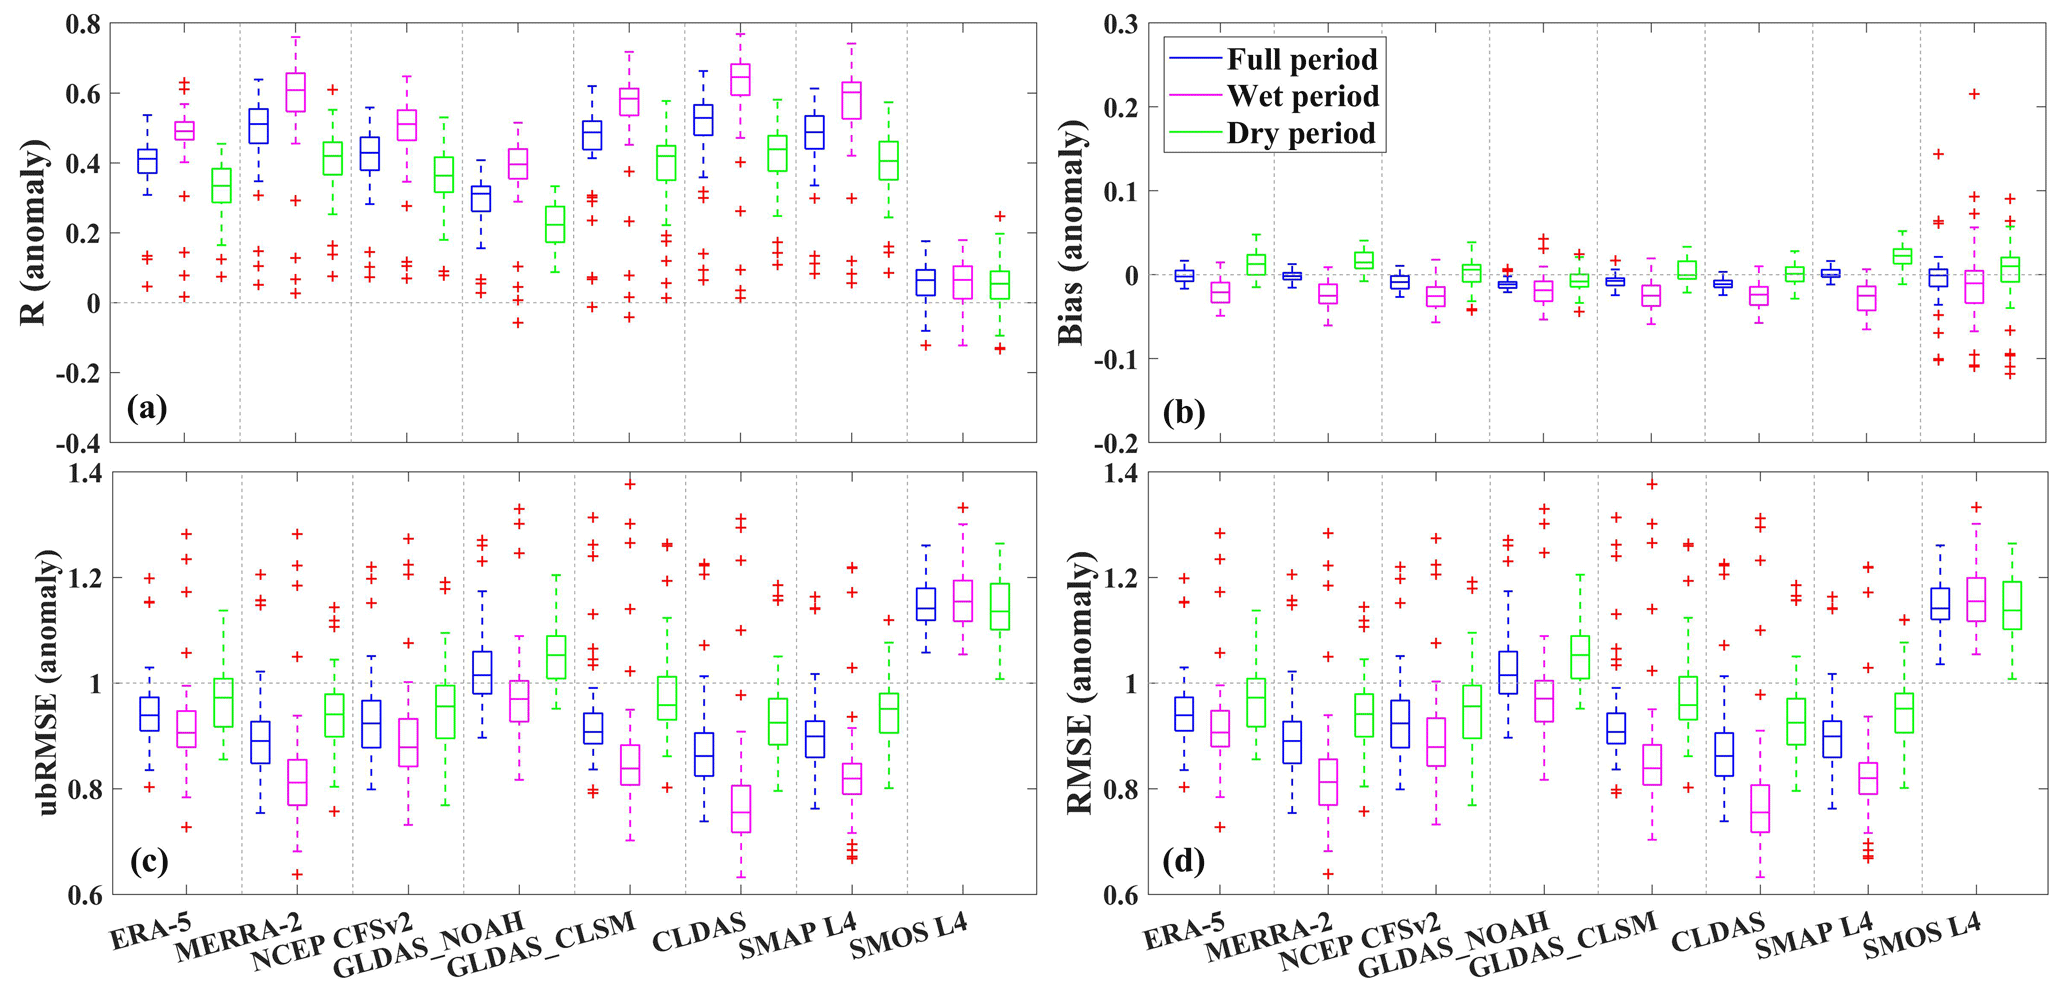
Figure 4Single-station RZSM anomalies' comparison between model-derived RZSM and in situ soil moisture observations for different periods, including the full period (from 1 April 2015 to 31 March 2020), wet period (from June to September) and dry period (from October to May). Each outlier (“+”) represents an in situ station. The five horizontal lines of the box plot represent the minimum, 25th percentile, 50th percentile, 75th percentile and maximum from bottom to top, respectively.
4.2 Intercomparison of gridded RZSM products
Figure 5 displays the pairwise comparison of the eight RZSM products for grid cells located above the in situ stations. Overall, there is good agreement between all RZSM products, except for SMOS L4. The correlation coefficient R between each of the other seven RZSM products varies from 0.30 (MERRA-2 versus SMOS L4) to 0.95 (SMAP L4 versus MERRA-2), with an average value of 0.71. The mean bias varies from −0.067 m3 m−3 (MERRA-2 minus CLDAS) to 0.165 m3 m−3 (ERA5 minus SMOS L4), with an average value of 0.037 m3 m−3. The ubRMSE varies from 0.010 m3 m−3 (MERRA-2 versus SMAP L4) to 0.040 m3 m−3 (NCEP CFSv2 versus SMOS L4), with an average value of 0.024 m3 m−3. SMOS L4 differs most from the other products. The correlation coefficient R between SMOS L4 and the other seven RZSM products varies from 0.30 (MERRA-2 vs. SMOS L4) to 0.41 (GLDAS_NOAH versus SMOS L4), with an average value of 0.35, and the mean bias varies from 0.077 m3 m−3 (SMAP L4 minus SMOS L4) to 0.165 m3 m−3 (ERA5 minus SMOS L4), with an average value of 0.112 m3 m−3. The ubRMSE varies from 0.023 m3 m−3 (GLDAS_CLSM versus SMOS L4) to 0.400 m3 m−3 (NCEP CFSv2 versus SMOS L4), with an average value of 0.031 m3 m−3.
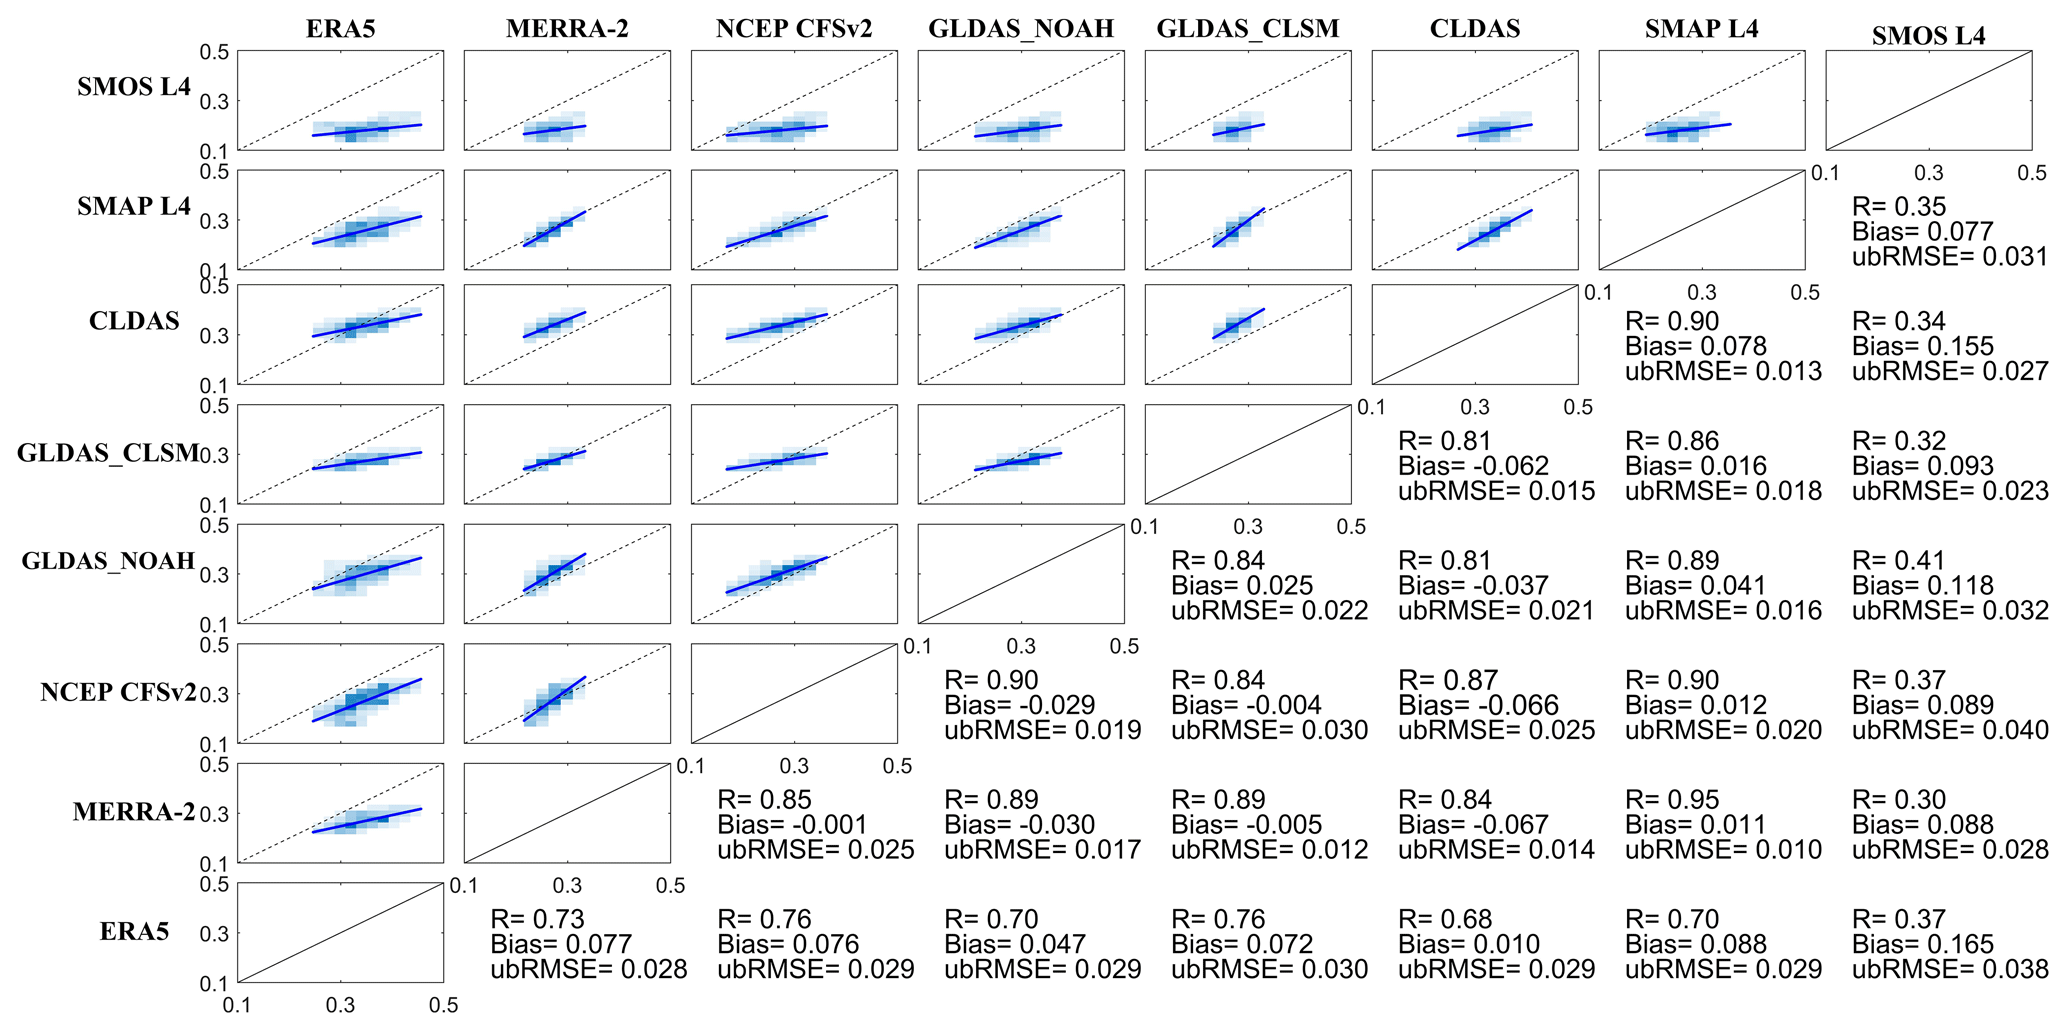
Figure 5Comparison of different RZSM products (volumetric water content, m3 m−3) with each other. The scatterplots and their corresponding statistics are located on opposite sides of each other; that is, the scatterplot of the data pair SMOS L4-ERA5 is in the top left-hand corner, while the respective statistical values are found in the bottom right-hand corner. Darker regions show a higher density of data points, and the blue line in each panel represents the fitted trend for the data points.
Figure 6 shows the histograms of the normalized RZSM of the eight products and the in situ observations. The relative frequency distribution corresponding to the normalized soil moisture interval varies considerably between the different RZSM datasets. All soil moisture datasets are almost normally distributed with a clear peak. The observed RZSM distribution is skewed towards low values and has a peak frequency around 0.3. The MERRA-2, GLDAS_CLSM and SMAP L4 products exhibit the similar distribution patterns with a peak frequency around 0.4. In contrast, the frequency distribution of the other RZSM products show an obvious offset towards wet soil moisture compared to the in situ observations, with a peak frequency in the range of 0.4 to 0.5. In particular, GLDAS_NOAH shows a peak frequency in the range of 0.6 to 0.7 that is clearly skewed towards the wetter end of the distribution. It is obvious that the histograms of MERRA-2, GLDAS_CLSM and SMAP L4 show better agreement with the in situ observations than the other RZSM products, although they slightly overestimate the frequency of wet soil moisture. However, they all do not capture the peak frequency and underestimate the peak frequency of normalized soil moisture ranging from 0.2 to 0.4. The other RZSM products show significant overestimation of frequency of wet soil moisture and underestimation of dry soil moisture and of peak frequency. Therefore, the Richards equation used to simulate the water content in different soil layers in LSMs should focus on producing less wet soil moisture and more dry soil moisture to obtain a more accurate frequency distribution of modelled soil moisture by modifying the soil water retention curve or changing the initial and boundary conditions.
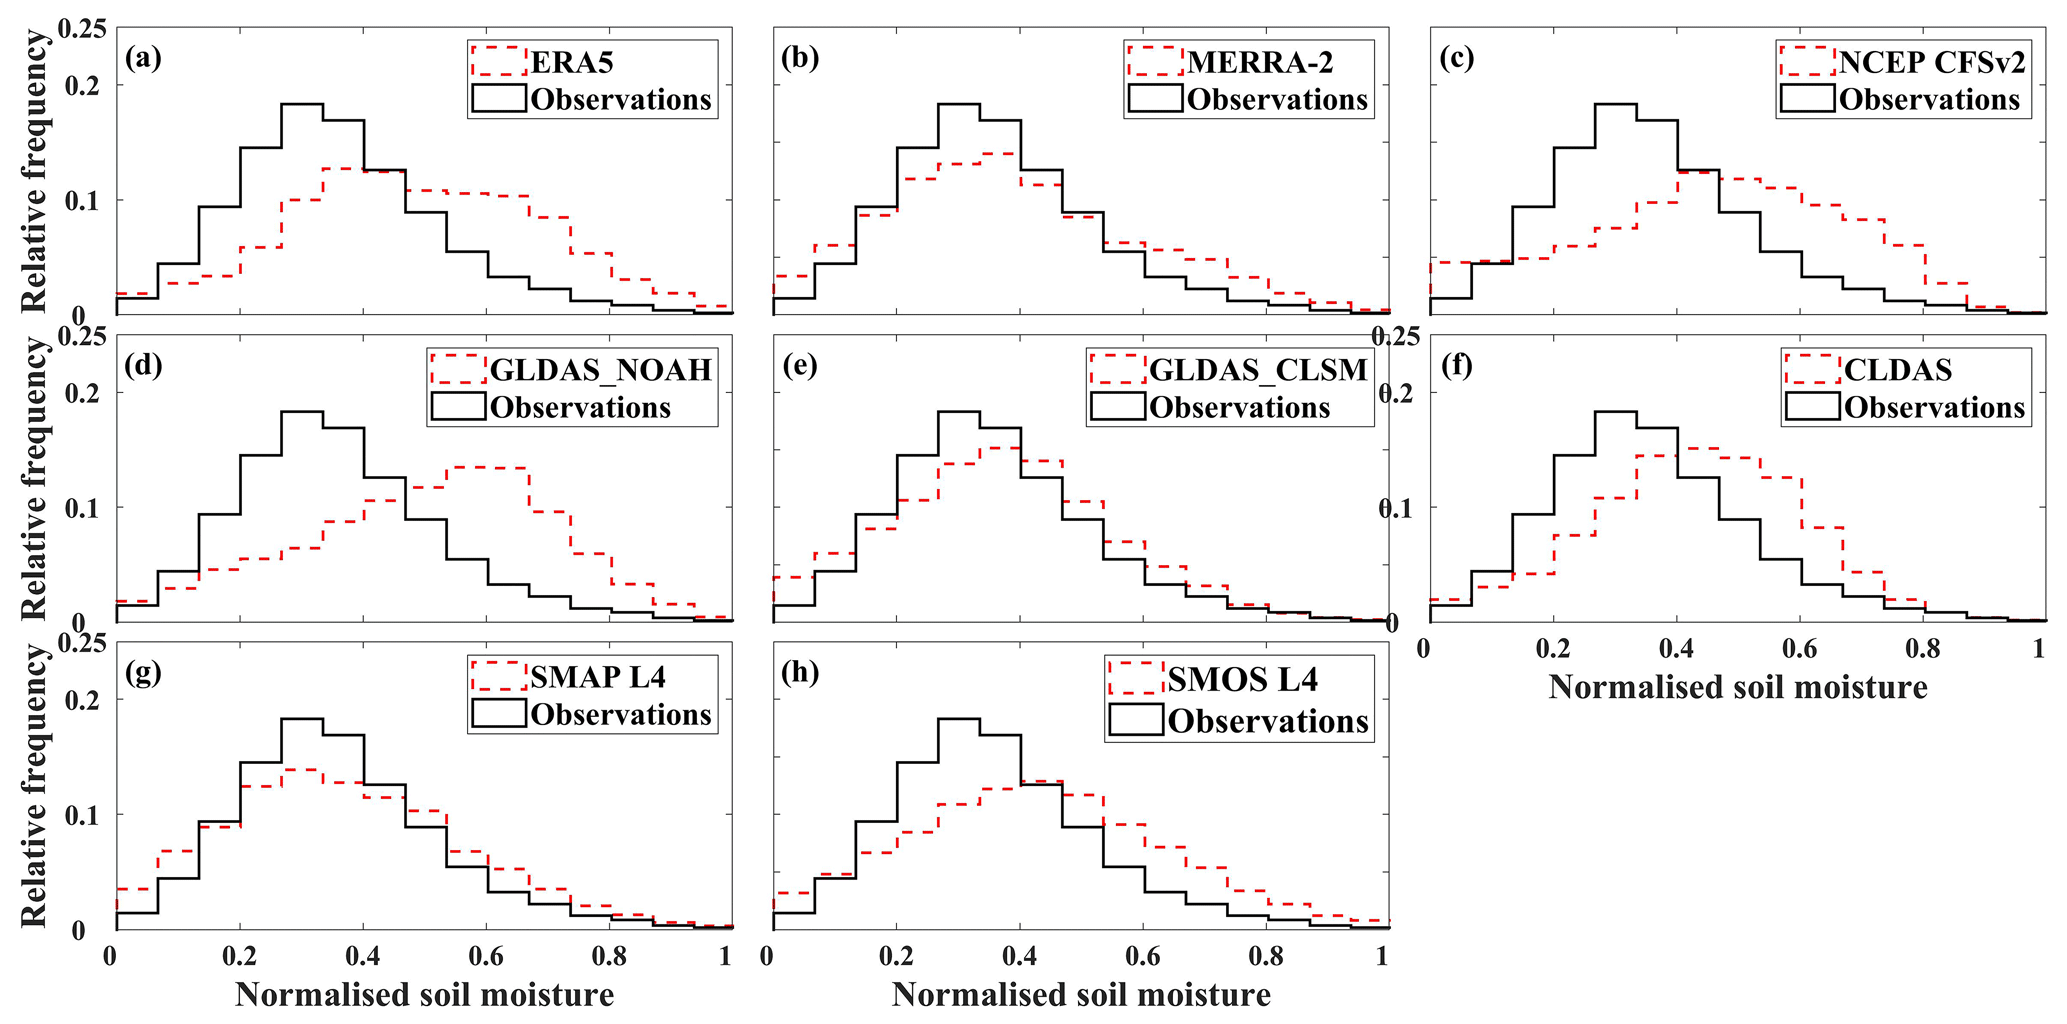
Figure 6Histograms of the relative frequency (vertical axis) of the various normalized RZSM datasets and in situ observations.
4.3 Validation of atmospheric forcing and soil properties
4.3.1 Precipitation and air temperature
Figure 7 shows the differences between the model and ground-based precipitation. A daily precipitation amount of less than 1 mm is considered a no-rain criterion. During the period from 1 April 2015 to 31 March 2020, the annual mean precipitation amount from global products (SMAP: 1024 mm yr−1, GLDAS_NOAH: 988 mm yr−1, MERRA-2: 974 mm yr−1, NCEP CFSv2: 951 mm yr−1, GLDAS_CLSM: 912 mm yr−1, ERA5: 880 mm yr−1) overestimates the ground-based observations (840 mm yr−1) by 22 %, 17 %, 16 %, 13 %, 9 % and 5 %, respectively. In addition, the mean frequency of rainy days (131, 114, 105, 113, 114 and 126 d yr−1) is larger than observed (97 d yr−1) due to the drizzle effect often produced by AGCM (Piani et al., 2010; Velasquez et al., 2020). In contrast to the global products mentioned above, CLDAS (806 mm yr−1) slightly underestimates the mean annual precipitation amount by 4 %, and the precipitation frequency (99 d yr−1) is close to the ground-based observation. Furthermore, the global precipitation products tend to underestimate the in situ precipitation observations for precipitation events above 50 mm d−1 (Fig. 7). Overall, the R values between precipitation products and the observed precipitation are higher than 0.4 (Fig. 8a, c, e). MERRA-2, ERA5, GLDAS_CLSM and SMAP L4 show a strong ability to detect precipitation, with a POD value above 0.6 (Fig. 8b, d, f). The R value between modelled and ground-based precipitation is directly related to the CSI value except for GLDAS_NOAH.
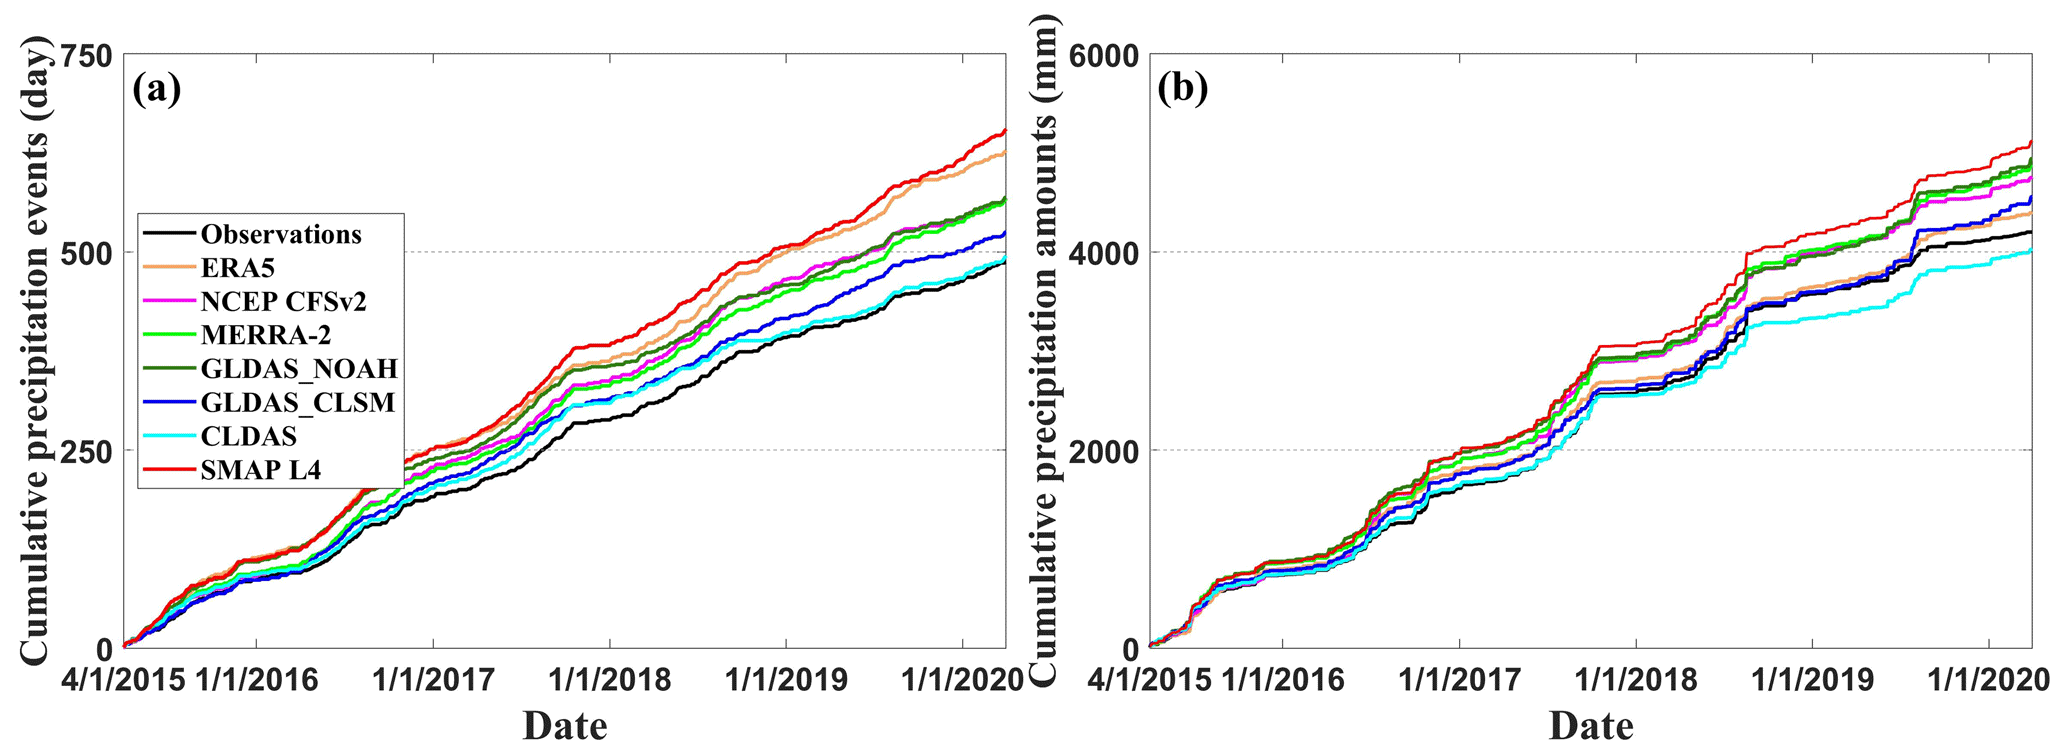
Figure 7Comparison of cumulative precipitation events and cumulative precipitation amounts between model-derived precipitation and in situ precipitation observations averaged over all in situ stations from 1 April 2015 to 31 March 2020.
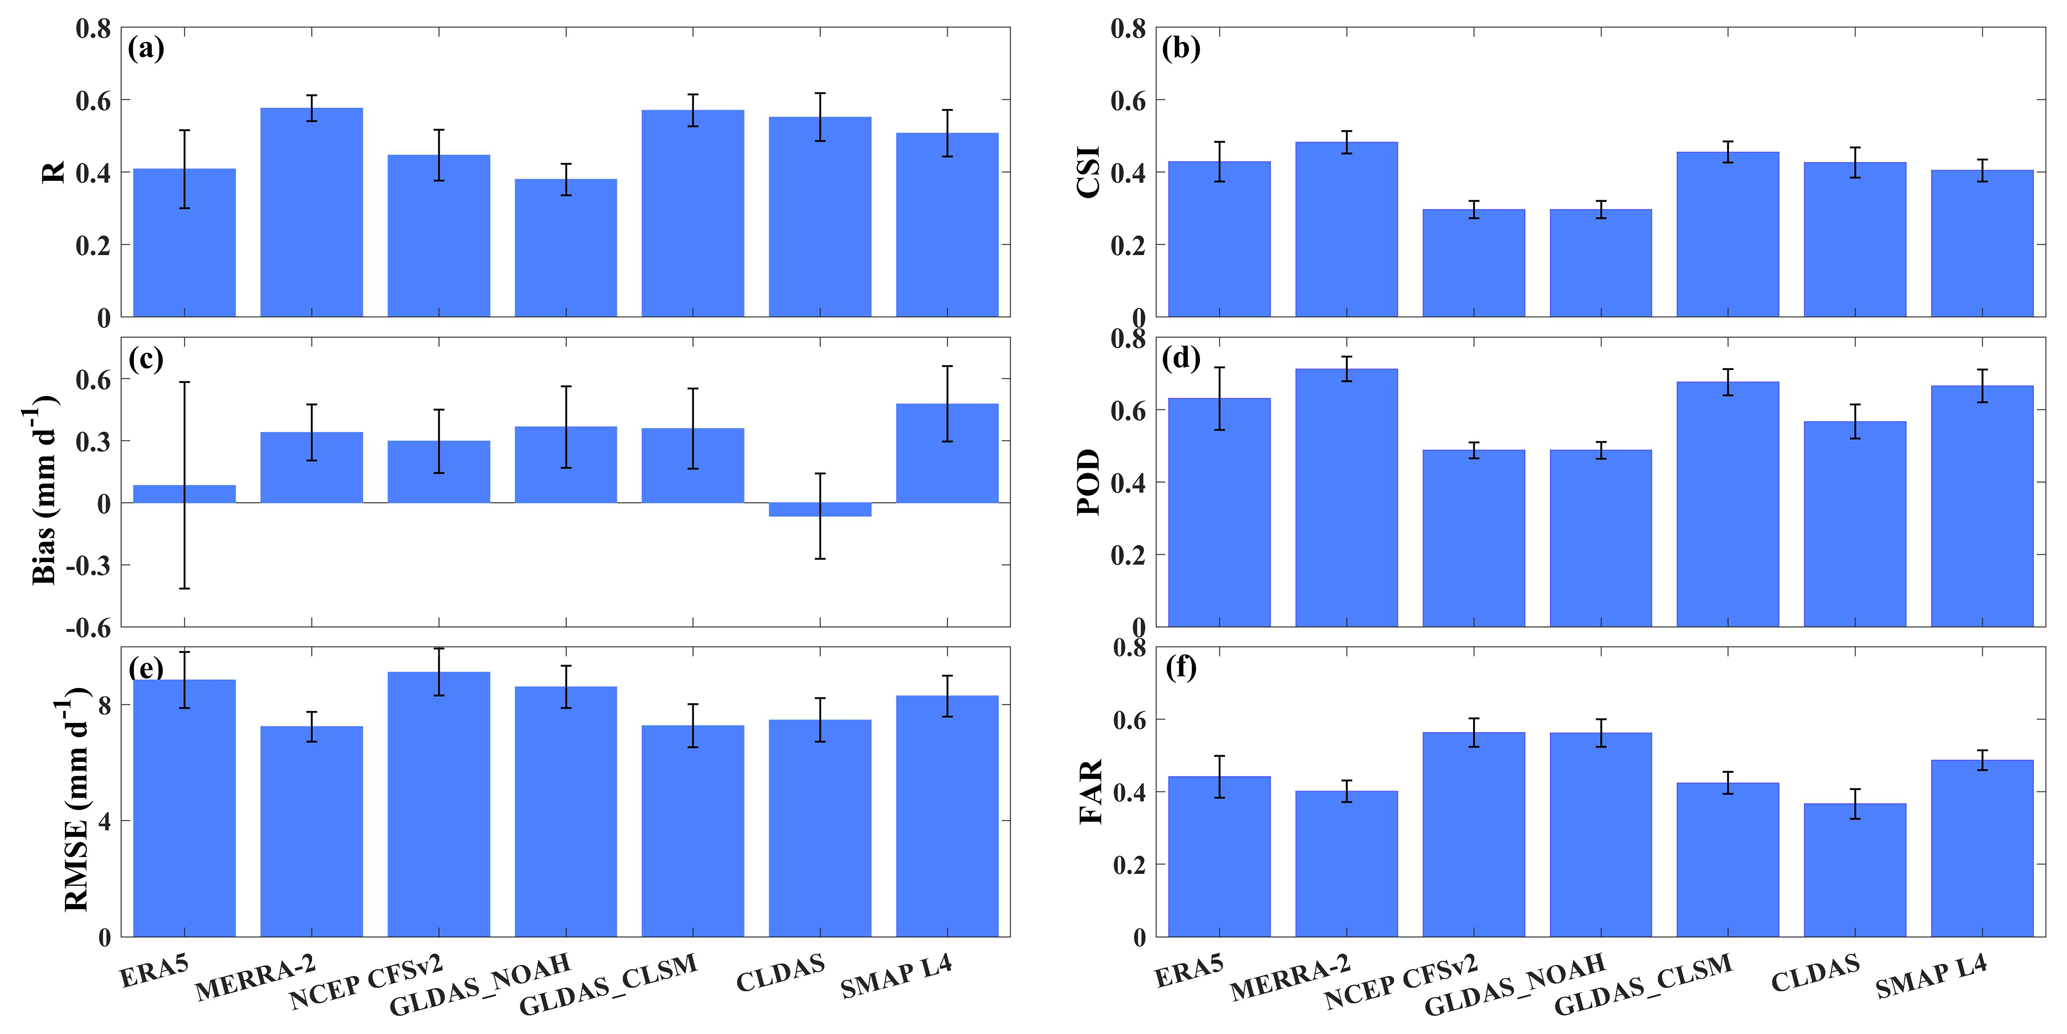
Figure 8Summary of error metrics of gridded precipitation data against in situ precipitation observations (a, c, e). Panels (b), (d) and (f) show the detection ability of gridded precipitation to reproduce the observed precipitation. The blue histogram represents the median and black error bar represents the standard deviation.
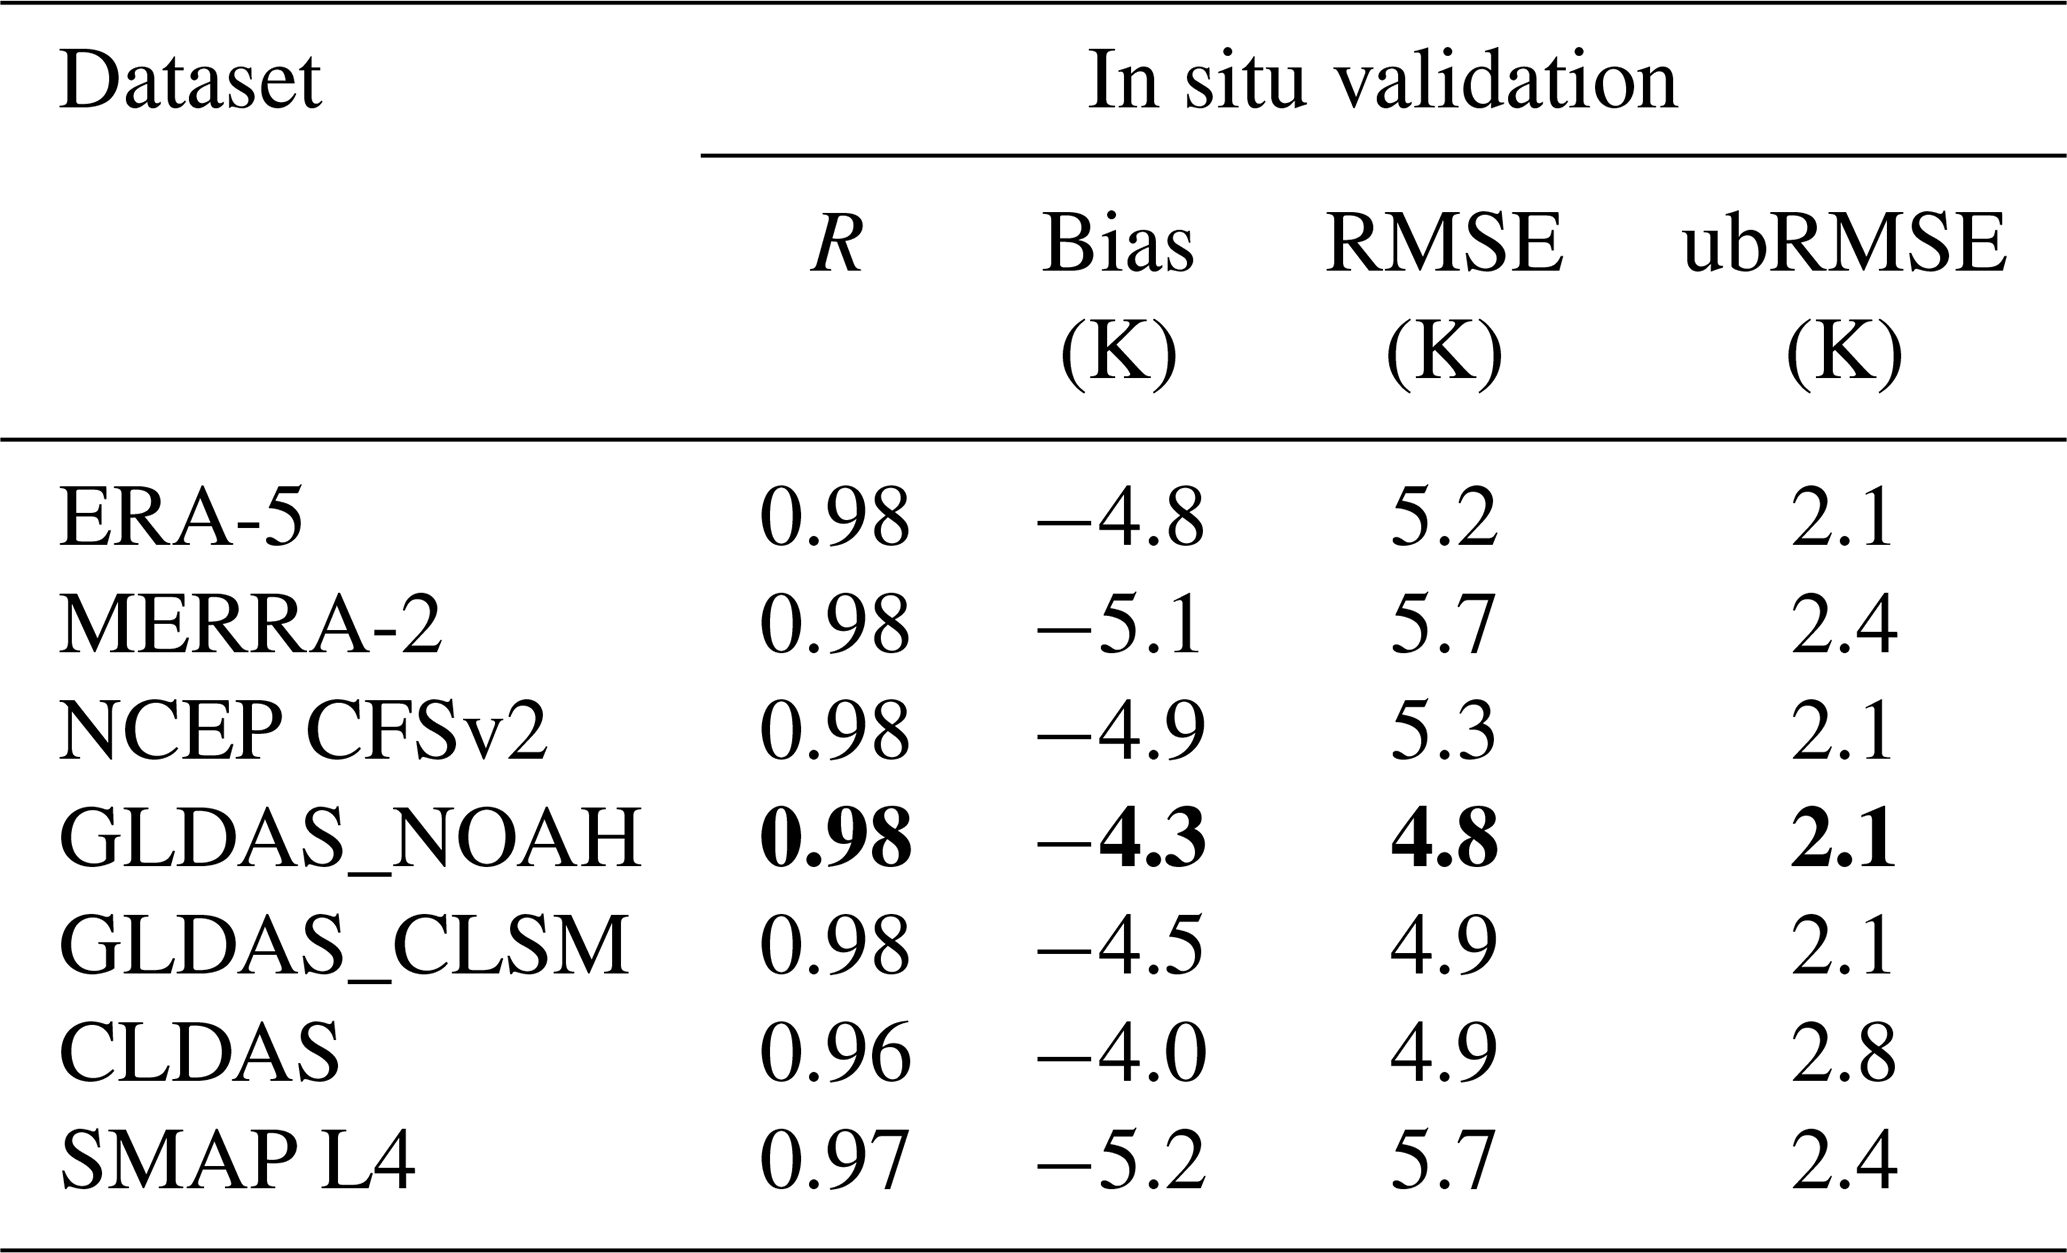
The daily air temperature data derived from ERA5, MERRA-2, NCEP CFSv2, GLDAS_CLSM, CLDAS, GLDAS_NOAH and SMAP L4 are validated against in situ observations of daily air temperature after aggregating all sub-daily products to daily time steps. Figures 9 and S2 show that the modelled air temperature captures the observed temporal variation well, with R values above 0.96. However, all of them show underestimation, indicated by negative bias values ranging from −4.0 to −5.2 K. In terms of the comprehensive scores of the four statistical metrics, GLDAS_NOAH air temperature outperforms the other datasets and SMAP L4 shows the worst scores. Detailed statistics are shown in Table 4.
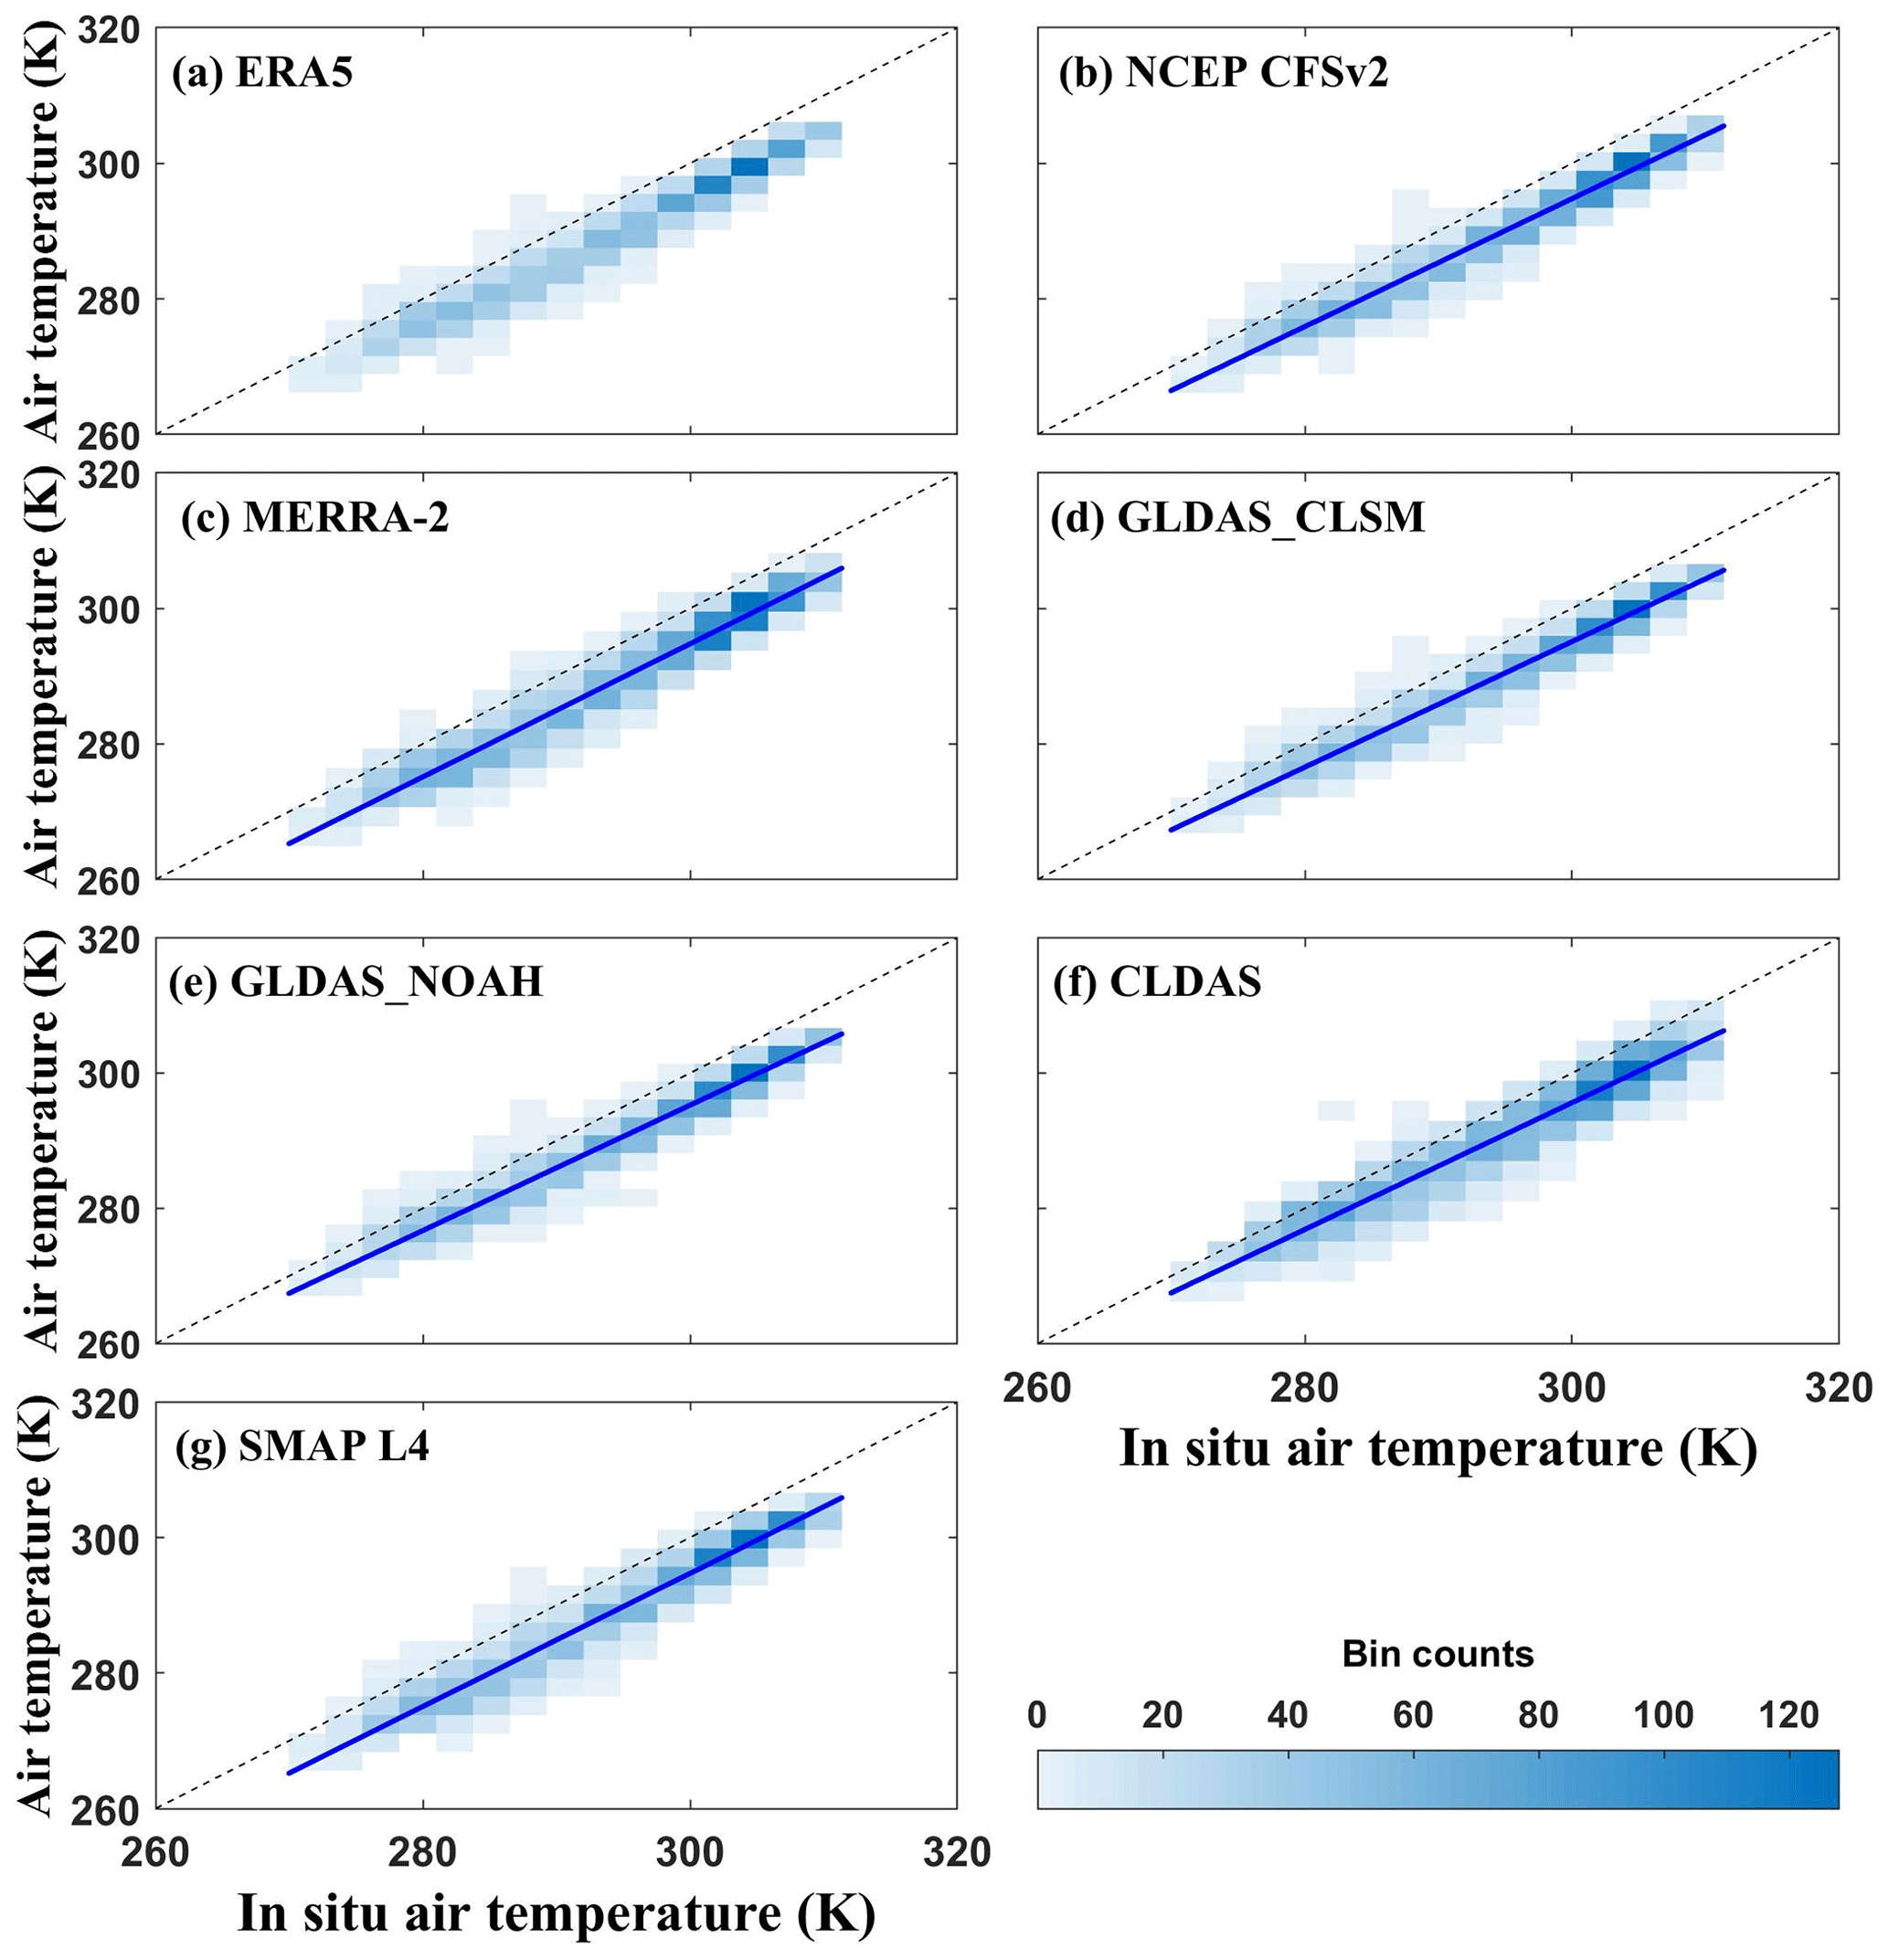
Figure 9Scatterplots of model- and observation-based air temperature averaged over all stations, from 1 April 2015 to 31 March 2020. ERA5, MERRA-2, NCEP CFSv2, GLDAS_CLSM, GLDAS_NOAH, CLDAS and CMA products provide the air temperature datasets at the 2 m screen level. The SMAP L4 product provides the air temperature at the centre height of the lowest atmospheric model layer. Darker regions show a higher density of data points, and the blue line in each panel represents the fitted trend for the data points.
Table 4Statistical metrics of air temperature products validated by in situ measurements averaged over all stations from 1 April 2015 to 31 March 2020. Mean score values are given. Best score values are in bold. The number of observations used to calculate the scores is 1827 for each product.
4.3.2 Soil properties
In this study, four soil properties' indicators, including clay and sand content, organic carbon content, and bulk density, were selected to investigate the differences among the FAO/UNESCO World Soil Map, HWSD and the reference soil dataset developed by Shangguan et al. (2013). Figure 10 shows the reference dataset and HWSD generally exhibit similar properties, although the reference dataset has slightly higher organic carbon content and lower sand content. Both of them clearly differ from the FAO/UNESCO soil properties' data. FAO/UNESCO overestimates the clay content for the upper (0–30 cm) and subsurface (30–100 cm) soil layers. Sand content is also overestimated for the subsurface layer, but it is underestimated for the surface layer. In addition, FAO/UNESCO overestimates the organic carbon content for both layers significantly, resulting in the underestimated bulk density.
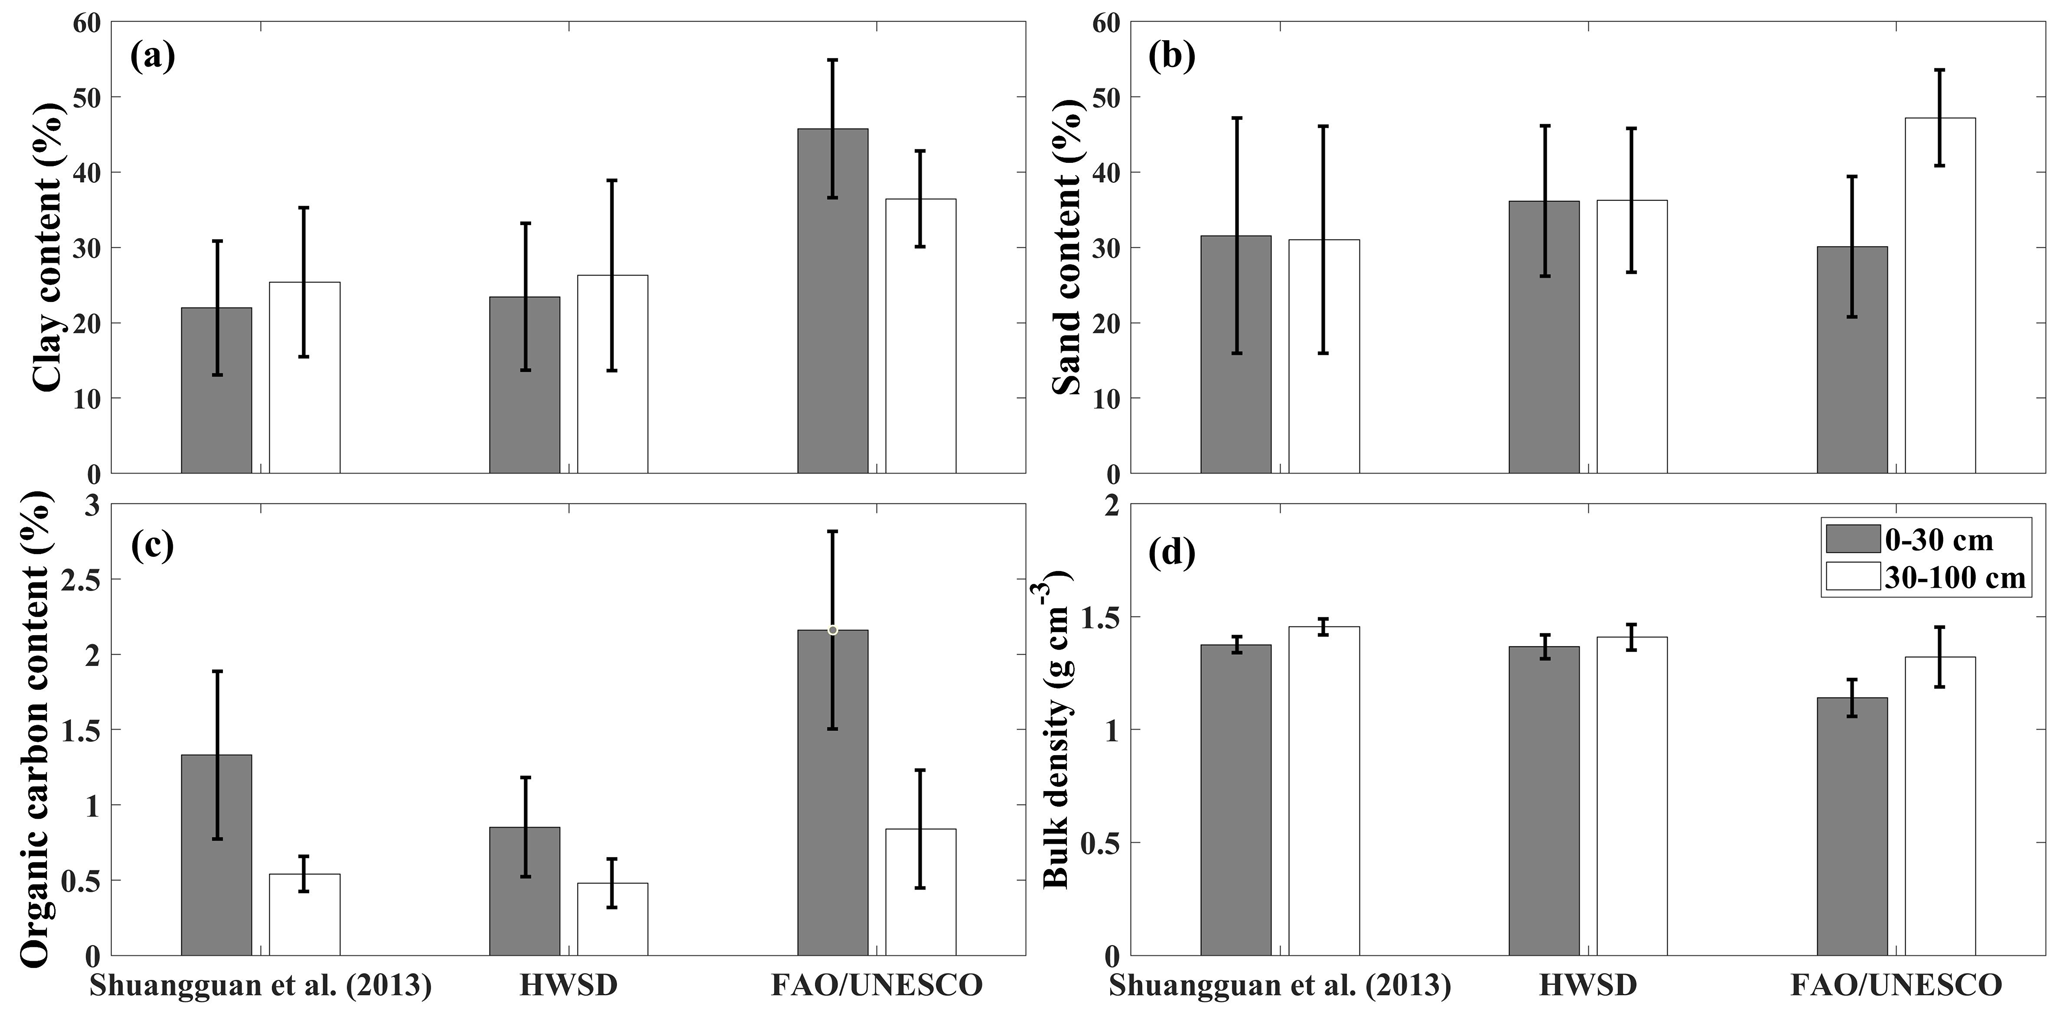
Figure 10Comparison of three sets of soil properties data: FAO used in ERA5, MERRA2, NCEP CFSv2, GLDAS_NOAH, GLDAS_CLSM and SMOS; HWSD used in SMAP L4; and reference soil properties' data (Shangguan et al., 2013) used in CLDAS. The histogram (grey bar – 0–30 cm and white bar – 30–100 cm) represents the median, and the black error bar represents the standard deviation.
4.3.3 The mismatch of spatial and temporal scales
In addition to the model- and observation-based soil moisture errors, the mismatch of spatial scales between grid-scale soil moisture simulations and point-scale observations also introduces additional errors. The eight RZSM products are evaluated against in situ observations using two validation strategies described in Sect. 3.3. The statistical scores for spatial-average validation are generally better than that for point-grid validation; they are shown in Tables 3 and S1, respectively. For the point-grid validation, the spatial representativeness of in situ soil moisture observations at the grid scale is insufficient due to the heterogeneity of the underlying surface and precipitation forcing. This leads to an error in representativeness (Xia et al., 2014). In contrast, the spatial-average validation improves the representativeness of the grid-based RZSM and reduces the spatial noise (Wang and Zeng, 2012; Xia et al., 2014; Bi et al., 2016; Zheng et al., 2022). In addition, upscaling the sparse ground-based observations to the footprint-scale satellite soil moisture retrieval or model grid scale through the temporal stability concept, block kriging, field campaign data or LSM reduces the uncertainty of spatial resampling and further improves the reliability of soil moisture validation (Crow et al., 2012). Finally, the temporal mismatch between model-based RZSM values which are aggregated to daily average values and in situ observations available at 08:00 could also induce partial bias, but this type of bias is generally small due to the low variability of soil moisture during the day.
5.1 What is the impact of uncertainties of meteorological forcing data?
The accuracy of LSM simulations is influenced by the quality of the meteorological forcing, which is considered to be one of the most important and direct factors, especially precipitation and air temperature (Reichle et al., 2012; Yang et al., 2020; Zeng et al., 2021). In different LSMs, the diffusive form of the Richards equation is used to describe the vertical movement of water in the soil column. Precipitation serves as the upper boundary condition to regulate the temporal dynamics of soil moisture. Therefore, the overestimation of precipitation amounts and the frequency of precipitation events (the wet bias excluding CLDAS) could be a reason for the overestimation of soil water simulated by the model-based RZSM products. We also investigate the effect of precipitation accuracy on the performance of RZSM products (Fig. 8). In terms of R, RMSE, CSI, POD and FAR, MERRA-2 and GLDAS_CLSM precipitation are the best-performing products. This may explain the relatively better agreement of MERRA-2 and GLDAS_CLSM RZSM with in situ data in terms of correlation (Table 3), as precipitation dominates the dynamics change of soil moisture. The low CSI and high FAR and the overestimated precipitation frequency indicate that the precipitation for each grid derived from AGCM has more rainy days and less dry days and struggles to reproduce the temporal pattern of the precipitation observed at each rain gauge, resulting in the relatively large RMSE values in precipitation generally above 7 mm d−1. This could also explain the low correlation R ranging from 0.4 to 0.6, although the daily average bias in model-based precipitation is less than 0.5 mm d−1. For most reanalysis products, the precipitation used to drive the different LSMs was generated by the AGCM through the assimilation of atmospheric temperature, humidity and wind observations (Reichle et al., 2017d). Before driving the land surface water budget, the MERRA-2 model background precipitation was corrected using CPCU gauge-based precipitation analysis in the coupled land–atmosphere reanalysis system. The correction leads to more accurate precipitation fields for MERRA-2 and then to more realistic RZSM simulations. Being driven by in situ precipitation observations, the CLDAS multi-LSMs should have produced RZSM values close to the observations. However, the CLDAS RZSM product overestimates the in situ observations by 0.107 m3 m−3 (Table 3). Therefore, precipitation may not be the dominant factor contributing to the overestimation of RZSM for the CLDAS RZSM (Bi et al., 2016; Qin et al., 2017).
Air temperature is another key factor in determining the accuracy of RZSM simulations, as it controls soil evaporation and plant transpiration. The agreement between model- and observation-based air temperature is much better than for precipitation due to the high spatial heterogeneity in precipitation. The underestimation of air temperature by reanalyses has been illustrated in previous studies (Wang and Zeng, 2012; Yang et al., 2020). In general, the lower air temperature results in less evapotranspiration and more soil water storage. Compared to precipitation, air temperature has an overall better correlation with in situ observations. Note that ERA5 includes an analysis of soil moisture and screen-level (2 m) air temperature and air humidity. Studies have indicated that the assimilation of screen-level variables improves root zone soil moisture estimates relative to in situ observations, providing more realistic lower boundary conditions for numerical prediction models (Douville et al., 2000; Seuffert et al., 2003; de Rosnay et al., 2012).
5.2 Are soil properties correctly represented?
Time-invariant soil property data (e.g. porosity) are key model parameters for LSMs because they determine the physical structure of the soil in the vadose zone, which controls the partitioning of precipitation into surface runoff and infiltration. In general, soil texture is closely related to the ability of the soil to retain water, as water molecules adhere more tightly to fine-textured clay particles than coarse-textured sand particles. Consequently, clay exhibits stronger water retention capacity and higher water content stored in the soil compared to sand at the same matric potential. Meanwhile, the sandy soil shows better drainage capacity and higher hydraulic conductivity than clay soil. In addition, the overestimated FAO/UNESCO soil organic carbon content (Fig. 10) leads to higher soil porosity and lower bulk density. As a result, water can infiltrate more quickly, and more water can flow through the soil and can be retained in the soil (Bot and Benites, 2005; Reichle et al., 2017b). Therefore, the use of inaccurate FAO/UNESCO soil property data used in LSMs may explain the overestimation of soil moisture by the various RZSM products compared to the ground-based observations. It is promising to improve the accuracy of LSM-based RZSM using HWSD instead of FAO/UNESCO soil property data. The soil hydraulic parameters (SHPs), such as the hydraulic conductivity and matric potential, are crucial parameters to describe the vertical transport of water in the soil column through the Richards equation employed in the LSMs. Generally speaking, the SHPs are derived from a combination of soil properties (clay, sand, silt fractions and organic content, etc.) with pedotransfer functions (PTFs), which can be constructed by multivariate regression models, nonlinear regression models or artificial neural networks (Harrison et al., 2012). Therefore, different input variables and functional forms of the continuous PTFs are used to derive SHPs in the LSMs. The Richards equation relying on the SHPs shows great uncertainty in the simulated soil moisture. For example, the HWSD soil properties used in SMAP L4 are more consistent with the reference dataset than FAO soil properties used in MERRA-2 by revising the underestimated sand content and the overestimated clay content in FAO. In addition, SMAP L4 adopts PTFs from Wösten et al. (2001) which take into account the organic carbon affecting soil hydraulic and thermal properties. MERRA-2 adopts PTFs adapted from Cosby et al. (1984) without considering organic carbon (De Lannoy et al., 2014). The revised soil parameters and new PTFs employed in SMAP L4 yield a smaller shape parameter of the water retention curve and result in less water retention than in MERRA-2 and increase the hydraulic conductivity. Thus, SMAP L4 has the smaller soil moisture estimates and less RZSM bias against in situ measurements than MERRA-2, which is consistent with the result of this study. Therefore, the soil properties and PTFs could also explain part of the uncertainty.
Soil stratification can affect the accuracy of LSM-based RZSM by impeding the water transfer from the surface layer to the root zone layer. In the Huaibei Plain, the soil column can basically be divided into three layers, including the plough layer (0–16.6 cm), the black soil layer (16.6–49.3 cm) and the lime concretion layer (49.3–138.3 cm) due to the long-term human activities (e.g. fertilization and ploughing), which significantly increases the soil organic carbon content and porosity in the plough layer compared to the deeper soil layer (Zhang et al., 2001; Li et al., 2011; Zha et al., 2015; Gu et al., 2021). There is a noticeable difference in soil properties between the plough layer and the black soil layer, while the difference between the black soil layer and the lime concretion layer is relatively small (see Fig. 11). High porosity results in high hydraulic conductivity and infiltration capacity (Zha et al., 2015). Therefore, interflow can occur due to the difference of infiltration rate between adjacent soil layers. The interflow may either flow horizontally due to good lateral drainage conditions or accumulate vertically and evaporate. These processes may not be well represented by LSMs.
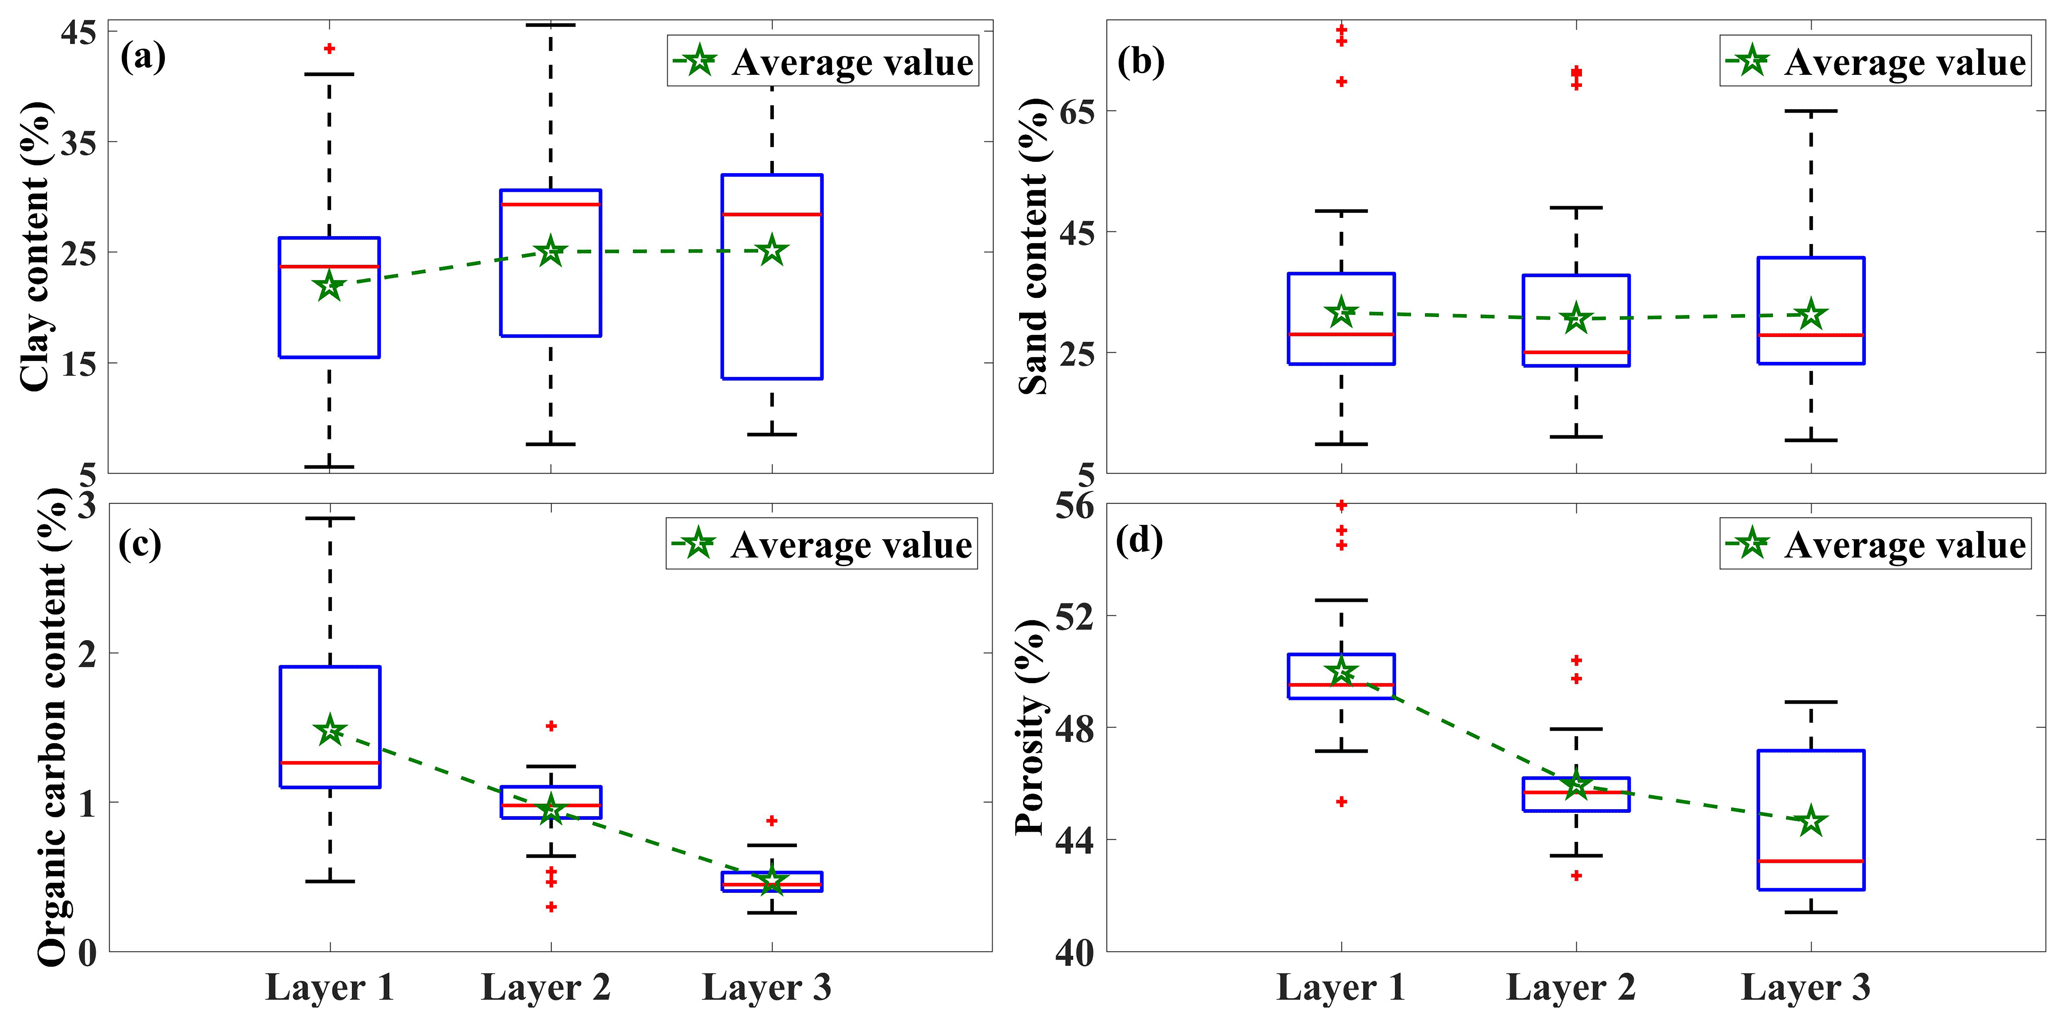
Figure 11Box plot of soil properties for three soil layers at all in situ stations (Layer 1 (0–16.6 cm) – plough layer, Layer 2 (16.6–49.3 cm) – black soil layer and Layer 3 (49.3–138.3 cm) – lime concretion layer).
In the study by Fan et al. (2022), RZSM products (SMAP-L4 V6, ERA5-land V2, GLDAS-Noah V2.1) were evaluated over croplands in Jiangsu Province, which is close to the Huaibei Plain. A fourth RZSM dataset was derived from the ESA CCI SSM using an exponential filter. In this study, SMAP L4, ERA5 and GLDAS_NOAH overestimate the in situ RZSM. Overall, both studies show similar R values of RZSM products against the in situ observations but with opposite biases. The changes in the sign of the bias could be attributed to differences in soil properties (see Fig. 11). In the Huaibei Plain, the main soil type is lime concretion black soil, whose main characteristics are (1) soil stratification, (2) poor soil permeability and water retention capacity due to high clay content, and (3) clay swelling during wet periods and shrinking during dry periods. For a given soil profile, porosity decreases with depth, and clay content increases with depth, resulting in a decrease in hydraulic conductivity. Expansive montmorillonite clay minerals are the main constituents of the lower black soil layer, giving the soil strong expansion and contraction and a high dry bulk density. During drought, cracks in the soil column widen and deepen, resulting in capillary breakage. This makes it difficult for groundwater and RZSM to recharge crops, even though the groundwater is shallow. In addition, the increased cracks in the soil column exacerbate the evaporation of soil moisture in the root zone, ultimately leading to frequent droughts. During wet periods, when precipitation or irrigation occurs, the soil absorbs water and swells, closing the cracks and preventing water infiltration. Water is then lost mainly through surface runoff. The crops are prone to waterlogging disasters. This could explain the lower RZSM values ranging from 0.2 to 0.3 m3 m−3 observed in the Huaibei Plain and the higher RZSM values ranging from 0.3 to 0.4 m3 m−3 observed in Jiangsu. The larger amount of precipitation in Jiangsu could be another possible reason.
5.3 What is the impact of vegetation representation in LSMs?
Vegetation also plays a crucial role in the exchange of water, energy and carbon between the land surface and the atmosphere, which has a significant effect on the simulation of soil moisture by LSMs. First, the land cover map describes the distribution and fractions of different land use types, which have different impact on the partitioning of net solar radiation into ground heat and sensible and latent heat fluxes and the partitioning of precipitation into canopy interception, runoff and infiltration. The land cover maps employed in the LSMs are different. For example, GLDAS_NOAH uses the modified IGBP MODIS (Moderate Resolution Imaging Spectroradiometer) 20-category vegetation classification, and GLDAS_CLSM uses the University of Maryland (UMD) land cover classification based on the AVHRR (Advanced Very High Resolution Radiometer) land cover map. MERRA-2 and HTESSEL both use the global land cover characteristics database, version 2.0 (Reichle et al., 2017c; Rui et al., 2021). Second, the parameterization for vegetation canopy (e.g. leaf area index, bare soil fraction, high- and low-vegetation fraction, type and density, Nogueira et al., 2020) and root tissue (root distribution, rooting depth, root density and root zone water storage, Gao et al., 2014; Stevens et al., 2020; van Oorschot et al., 2021) varies considerably across different LSMs. The discrepancy in land cover types, vegetation canopy and root parameterizations between different land cover maps not only affects the exchange of water, carbon and energy between the land surface and the atmosphere at the local scale but also affects the water and carbon cycle and energy balance at the terrestrial and global scales. Moreover, the inaccurate partitioning of the total terrestrial evapotranspiration into soil evaporation, canopy interception and vegetation transpiration also affects the exchange of water and energy between the land surface and the atmosphere. Generally speaking, the ratio of transpiration to the total terrestrial evapotranspiration is underestimated compared to the observations in most earth system models (ESMs) (Feng et al., 2023). This phenomenon could be related to the excessive reliance on the surface soil moisture and canopy-intercepted water storage rather than the adequate utilization of RZSM for transpiration, which leads to the overestimated RZSM (Dong et al., 2022), or the unreliable representation of canopy light use, interception loss and root water uptake processes in the ESMs (Lian et al., 2018). In different LSMs, the process representing the partitioning of the total terrestrial evapotranspiration into different components differs from each other. For example, GLDAS_CLSM shows the higher fraction of soil evaporation, while GLDAS_NOAH shows the higher fraction of transpiration over the Huai River basin (Feng et al., 2023). In general, soil evaporation is mainly controlled by surface soil moisture, while the transpiration is controlled by the available water in the root zone. Therefore, the soil evaporation fraction is inversely proportional to leaf area index, while the transpiration fraction is proportional to leaf area index. The difference in the fractions of evapotranspiration components between GLDAS_CLSM and GLDAS_NOAH could be related to the model parameterization associated with sol evaporation and transpiration. Furthermore, the transpiration of crops is highly dependent on the growing season, which might be not well represented in the LSMs.
5.4 What are the difference between the three CLSM-based RZSM products?
Regarding the in situ validation in Sect. 4.1, the superior skill metrics of GLDAS_CLSM among the three CLSM-based RZSM products (GLDAS_CLSM, SMAP L4 and MERRA-2) can be attributed to its more accurate representation of precipitation. While GRACE TWS observations have been assimilated into GLDAS_CLSM, previous studies have indicated that the assimilation of GRACE TWS has no or negligible effect on RZSM. This could be attributed to the faster response of soil moisture to atmospheric forcing than groundwater (Zaitchik et al., 2008; Houborg et al., 2012; Girotto et al., 2016), the short in situ data record or insufficient spatial sampling (Li et al., 2012). Tian et al. (2017) and Tangdamrongsub et al. (2020) jointly assimilated terrestrial water storage (GRACE TWS) and SSM products. The soil moisture-only assimilation improved the performance of soil moisture estimates relative to in situ measurements but degraded the performance of groundwater estimates. The GRACE-only assimilation only enhanced the skill metrics of groundwater estimates.
Regarding the intercomparison in Sect. 4.2, the very good correlation and low ubRMSE between MERRA-2 and SMAP L4 shown in Fig. 5 can be partly attributed to the fact that both products are based on the CLSM, and both use atmospheric forcing data generated from GEOS-5. However, it should be noted that SMAP L4 uses a more recent version of CLSM with a different representation of soil hydraulic and thermal properties. In addition, MERRA-2 and SMAP L4 use different model background precipitation (i.e. GEOS-5 FP system for SMAP L4 and GEOS-5 FP-IT system for MERRA-2) (Reichle et al., 2017d). In MERRA-2, the CPCU precipitation is used in its native climatology to correct the GEOS FP-IT model background precipitation, while in SMAP L4 the CPCU precipitation is rescaled to the climatology of the GPCPv2.2 pentad precipitation product climatology before being corrected by the GEOS-5 FP system.
5.5 Why does SMOS L4 underestimate RZSM?
The SMOS L4 RZSM product is derived from the SMOS L3 3 d SSM by applying a modified exponential filter (Pablos et al., 2018). Figure 12 shows the comparison of the SMOS L3 SSM and L4 RZSM with the in situ soil moisture observations. It is evident that both SMOS L3 SSM and L4 RZSM underestimate the in situ observations with average bias values of −0.069 and −0.047 m3 m−3, respectively. By partitioning the total error composed of the exponential filter model and the inherent SMOS in situ differences, Ford et al. (2014) have shown that the mismatch between in situ observations and the estimates is much larger than the error caused by the exponential filter method. The underestimation of in situ observations by SMOS L3 SSM has been reported in previous studies (Djamai et al., 2015; Cui et al., 2017; Pablos et al., 2018; Ma et al., 2019; Wang et al., 2021b). Therefore, it can be inferred that the underestimation of in situ observations by the SMOS L3 SSM propagates to the SMOS L4 RZSM. The L-band microwave signal is sensitive to soil moisture, soil temperature and vegetation optical depth (VOD) (Kerr et al., 2012). Using the L-band Microwave Emission of the Biosphere (L-MEB) model (Wigneron et al., 2021), SMOS L3 soil moisture and vegetation optical depth (VOD) can be retrieved simultaneously from multiple orbits using multi-angular (∼ 0–60°) and dual-polarization TB measurements (Al Bitar et al., 2017; Li et al., 2021). Numerous studies have shown that the SMOS L3 physical surface temperature used in the forward radiative transfer model was underestimated (Cui et al., 2017; Ma et al., 2019; Wang et al., 2021b; Zheng et al., 2022). In the SMOS L3 retrieval algorithm, underestimation of soil temperature leads to overestimation of soil emissivity, which ultimately results in the underestimation of soil moisture retrieval. In general, the SMOS L3 VOD retrievals are relatively noisy, which may be related to retrieval instabilities and radio frequency interference (RFI) effects (Cui et al., 2017; Wang et al., 2021b; Wigneron et al., 2021; Zheng et al., 2022). Therefore, it is difficult to quantify its relationship with soil moisture. In addition, the ECMWF ERA-Interim soil moisture is also used in the operational SMOS L3 SSM retrieval algorithm. For a given pixel, the total TB is simulated as the sum of several fractional contributions (FNO – nominal (bare soil, low vegetation); FFO – forest; and others – urban, water, etc.); i.e. TBtotal= TBFNO+ TBFFO+ TBothers (Fernandez-Moran et al., 2017). SMOS L3 retrievals are computed only over a fraction of the pixel (the “dominant” fraction where SM retrieval is meaningful over certain surface types) (Fernandez-Moran et al., 2017; Wigneron et al., 2021). For the remaining fraction of pixels, only their contributions to the total signal need to be estimated using the ECMWF ERA-Interim SM (0–7 cm) as an auxiliary input, but no SM retrievals are performed. Previous studies have shown that the ERA-Interim soil moisture over China is overestimated (Yang et al., 2020; Ling et al., 2021). Therefore, the overestimated ECMWF ERA-Interim SM (0–7 cm) leads to an underestimation of the forest TBFFO contribution, which in turn leads to an overestimation of TBFNO and to a dry bias in the retrieved SMOS L3 SM (as there is a negative correlation between brightness temperature and soil moisture; Rao et al., 2007).
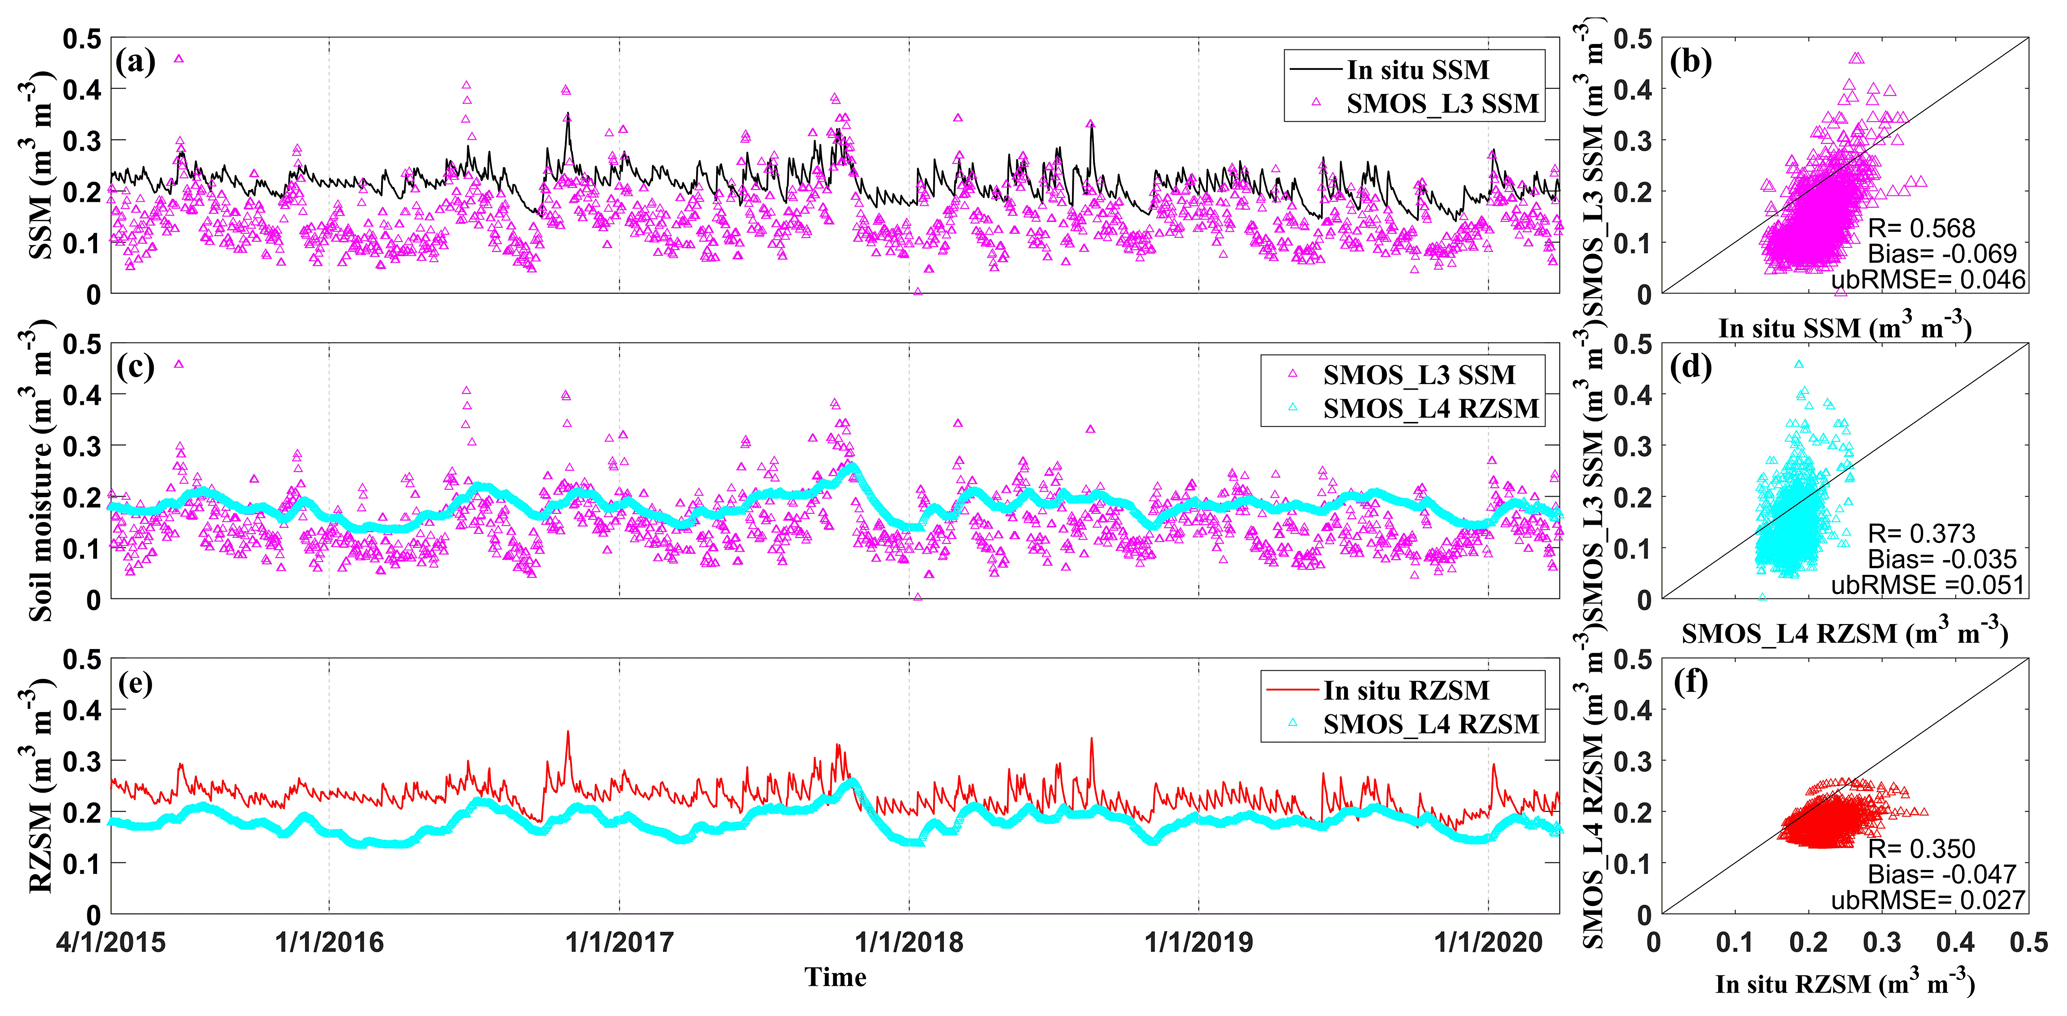
Figure 12Comparison of time series (a, c, e) and scatterplots (b, d, f) of SMOS L3 SSM vs. in situ SSM (Fig. 12a and b), SMOS L3 SSM vs. SMOS L4 RZSM (Fig. 12c and d) and SMOS L4 RZSM vs. in situ RZSM (Fig. 12e and f).
In this study, eight RZSM products were quantitatively evaluated against observations from 58 in situ soil moisture stations over the HRB in China. The impact of several potential confounding factors on the uncertainty of RZSM products was investigated, including meteorological forcing variables, soil properties, soil stratification, vegetation parameterization and spatial scale mismatch. Nevertheless, there are still some shortcomings to be overcome in this study. The land cover type affects the dynamics of soil moisture, so future study should focus on the effect of different land cover types on soil moisture simulation. The main conclusions of this study are as follows:
-
GLDAS_CLSM outperformed the other RZSM products over the HRB, followed by MERRA-2, CLDAS, SMAP, ERA5, NCEP CFSv2 and GLDAS_NOAH. The SMOS L4 product presented the worst performance due to the fact that SMOS L4 does not contain precipitation information and has a weaker response to precipitation. Seven RZSM products based on land surface models overestimated the in situ observations, with median bias values ranging from 0.033 m3 m−3 (SMAP L4) to 0.116 m3 m−3 (CLDAS), while SMOS L4 underestimated the RZSM with a median bias value of −0.050 m3 m−3.
-
The intercomparison of RZSM products shows that the correlation coefficient R between any two of the seven model-based RZSM products varied from 0.68 (ERA5 vs. CLDAS) to 0.95 (SMAP L4 vs. MERRA-2). In contrast, SMOS L4 presented a lower correlation with the other seven RZSM products, with R ranging from 0.30 (MERRA-2) to 0.41 (GLDAS_NOAH). The comparison of the frequency distribution between eight RZSM products and in situ observations indicates that all RZSM products overestimate the frequency of wet soil moisture and underestimate the frequency of dry soil moisture. Besides, the frequency peaks of eight RZSM products are underestimated and show an obvious offset towards wet soil moisture compared to the in situ observations. Therefore, the Richards equation in LSMs should focus on producing less wet soil moisture and more dry soil moisture.
-
Except for CLDAS, the overestimated RZSM products based on land surface models could be associated with the overestimated precipitation amounts and frequency; underestimated air temperature; and underestimated ratio of transpiration to the total terrestrial evapotranspiration existing in most earth system models, which consumes less water in the root zone for transpiration. The underestimation of the SMOS L4 RZSM is related to the underestimation of the SMOS L3 SSM.
-
The model-based RZSM products generally perform better in the wet season than in the dry season due to the enhanced ability to capture of the temporal dynamics of in situ observations in the wet season and the inertia of remaining high soil moisture values even in the dry season, while SMOS L4 performs better in the dry season than in the wet season, as the ground microwave radiation signal is more attenuated in the wet season due to a substantial increase in water vapour absorption and scattering, which is propagated to SMOS L4 RZSM.
-
Spatial-average validation could reduce the spatial noise of in situ soil moisture measured at different locations and improve the representativeness of soil moisture observations to model-based grid values.
-
The study could provide some insights into how to improve the ability of land surface models to perform the land surface analysis by addressing the above issues. Furthermore, these results can be extended to other regions to improve the numerical simulation capability of land surface models at global scale.
The soil moisture observations in Huai River basin are not publicly available but can be requested from the Huaihe River Commission of the Ministry of Water Resources, PR China (http://www.hrc.gov.cn, last access: 17 May 2024). We provide a sample dataset of these measurements for a subset of 10 stations (https://doi.org/10.6084/m9.figshare.23497502, Liu, 2023). All modelled root zone soil moisture data are freely available. The ERA5 dataset is openly available from ECMWF at https://doi.org/10.24381/cds.adbb2d47 (Hersbach et al., 2023). The MERRA-2 dataset is available from https://doi.org/10.5067/VJAFPLI1CSIV (GMAO, 2015). The NCEP CFSv2 dataset is available from https://doi.org/10.5065/D61C1TXF (Saha et al., 2011). The GLDAS_NOAH dataset is available from https://doi.org/10.5067/E7TYRXPJKWOQ (Beaudoing et al., 2020). The GLDAS_CLSM dataset is available from https://doi.org/10.5067/TXBMLX370XX8 (Li et al., 2020). The CLDAS dataset, 1.2.156.416.CMA.D3.F001.CLDAS.AN.WB.CHN.MUL.HOR.0P0625.1, is available from https://data.cma.cn/data/cdcdetail/dataCode/NAFP_CLDAS2.0_NRT.html (CMA, 2015). The SMAP L4 dataset is available from https://doi.org/10.5067/9LNYIYOBNBR5 (Reichle et al., 2020). The SMOS L4 dataset is available from https://doi.org/10.12770/316e77af-cb72-4312-96a3-3011cc5068d4 (CATDS, 2021).
The supplement related to this article is available online at: https://doi.org/10.5194/hess-28-2375-2024-supplement.
EL, YZ, JCC and HL conceptualized the project. EL led the investigation, determined the methodology and wrote the original draft of the paper. All the co-authors contributed to the review and editing of the paper.
The contact author has declared that none of the authors has any competing interests.
Publisher’s note: Copernicus Publications remains neutral with regard to jurisdictional claims made in the text, published maps, institutional affiliations, or any other geographical representation in this paper. While Copernicus Publications makes every effort to include appropriate place names, the final responsibility lies with the authors.
We acknowledge the European Centre for Medium-Range Weather Forecasts (ECMWF), Goddard Earth Sciences Data and Information Services Center (GES DISC), National Center for Atmospheric Research (NCAR), China Meteorological Administration (CMA), National Snow & Ice Data Center (NSIDC) and Centre Aval de Traitement des Données (CATDS) for providing data free of charge.
This research was funded by the National Natural Science Foundation of China (grant nos. 41830752 and 42071033).
This paper was edited by Hongkai Gao and reviewed by three anonymous referees.
Al Bitar, A. and Mahmoodi, A.: Algorithm Theo- retical Basis Document (ATBD) for the SMOS Level 4 Root Zone Soil Moisture (Version v30_01), https://doi.org/10.5281/zenodo.4298572, 2020.
Al Bitar, A., Mialon, A., Kerr, Y. H., Cabot, F., Richaume, P., Jacquette, E., Quesney, A., Mahmoodi, A., Tarot, S., Parrens, M., Al-Yaari, A., Pellarin, T., Rodriguez-Fernandez, N., and Wigneron, J.-P.: The global SMOS Level 3 daily soil moisture and brightness temperature maps, Earth Syst. Sci. Data, 9, 293–315, https://doi.org/10.5194/essd-9-293-2017, 2017.
Al Bitar, A., Mahmoodi, A., Kerr, Y., Rodriguez-Fernandez, N., Parrens, M., and Tarot, S.: Global Assessment of Droughts in the Last Decade from SMOS Root Zone Soil Moisture, 2021 Int. Geosci. Remote Se., 8628–8631, https://doi.org/10.1109/igarss47720.2021.9554773, 2021.
Albergel, C., Rüdiger, C., Pellarin, T., Calvet, J.-C., Fritz, N., Froissard, F., Suquia, D., Petitpa, A., Piguet, B., and Martin, E.: From near-surface to root-zone soil moisture using an exponential filter: an assessment of the method based on in-situ observations and model simulations, Hydrol. Earth Syst. Sci., 12, 1323–1337, https://doi.org/10.5194/hess-12-1323-2008, 2008.
Albergel, C., de Rosnay, P., Gruhier, C., Muñoz-Sabater, J., Hasenauer, S., Isaksen, L., Kerr, Y., and Wagner, W.: Evaluation of remotely sensed and modelled soil moisture products using global ground-based in situ observations, Remote Sens. Environ., 118, 215–226, https://doi.org/10.1016/j.rse.2011.11.017, 2012.
Albergel, C., Munier, S., Leroux, D. J., Dewaele, H., Fairbairn, D., Barbu, A. L., Gelati, E., Dorigo, W., Faroux, S., Meurey, C., Le Moigne, P., Decharme, B., Mahfouf, J.-F., and Calvet, J.-C.: Sequential assimilation of satellite-derived vegetation and soil moisture products using SURFEX_v8.0: LDAS-Monde assessment over the Euro-Mediterranean area, Geosci. Model Dev., 10, 3889–3912, https://doi.org/10.5194/gmd-10-3889-2017, 2017.
Baldwin, D., Manfreda, S., Keller, K., and Smithwick, E. A. H.: Predicting root zone soil moisture with soil properties and satellite near-surface moisture data across the conterminous United States, J. Hydrol., 546, 393–404, https://doi.org/10.1016/j.jhydrol.2017.01.020, 2017.
Beaudoing, H., Rodell, M. and NASA/GSFC/HSL: GLDAS Noah Land Surface Model L4 3 hourly 0.25 × 0.25 degree V2.1, Greenbelt, Maryland, USA, Goddard Earth Sciences Data and Information Services Center (GES DISC) [data set], https://doi.org/10.5067/E7TYRXPJKWOQ, 2020.
Beck, H. E., Pan, M., Miralles, D. G., Reichle, R. H., Dorigo, W. A., Hahn, S., Sheffield, J., Karthikeyan, L., Balsamo, G., Parinussa, R. M., van Dijk, A. I. J. M., Du, J., Kimball, J. S., Vergopolan, N., and Wood, E. F.: Evaluation of 18 satellite- and model-based soil moisture products using in situ measurements from 826 sensors, Hydrol. Earth Syst. Sci., 25, 17–40, https://doi.org/10.5194/hess-25-17-2021, 2021.
Bi, H., Ma, J., Zheng, W., and Zeng, J.: Comparison of soil moisture in GLDAS model simulations and in situ observations over the Tibetan Plateau, J. Geophys Res.-Atmos., 121, 2658–2678, https://doi.org/10.1002/2015jd024131, 2016.
Bonan, B., Albergel, C., Zheng, Y., Barbu, A. L., Fairbairn, D., Munier, S., and Calvet, J.-C.: An ensemble square root filter for the joint assimilation of surface soil moisture and leaf area index within the Land Data Assimilation System LDAS-Monde: application over the Euro-Mediterranean region, Hydrol. Earth Syst. Sci., 24, 325–347, https://doi.org/10.5194/hess-24-325-2020, 2020.
Bot, A. and Benites, J.: The importance of soil organic matter-key to drought-resistant soil and sustained food and production, FAO Soils Bulletin, https://www.fao.org/3/a0100e/a0100e.pdf (last access: 17 May 2024), 2005.
Brocca, L., Melone, F., Moramarco, T., Wagner, W., and Hasenauer, S.: ASCAT soil wetness index validation through in situ and modeled soil moisture data in central Italy, Remote Sens. Environ., 114, 2745–2755, https://doi.org/10.1016/j.rse.2010.06.009, 2010.
Calvet, J.-C.: Investigating soil and atmospheric plant water stress using physiological and micrometeorological data, Agr. Forest Meteorol., 103, 229–247, https://doi.org/10.1016/S0168-1923(00)00130-1, 2000.
Calvet, J.-C. and Noilhan, J.: From Near-Surface to Root-Zone Soil Moisture Using Year-Round Data, J. Hydrometeorol., 1, 393–400, https://doi.org/10.1175/1525-7541(2000)001<0393:FNSTRZ>2.0.CO;2, 2000.
Carranza, C., Nolet, C., Pezij, M., and van der Ploeg, M.: Root zone soil moisture estimation with Random Forest, J. Hydrol., 593, 125840, https://doi.org/10.1016/j.jhydrol.2020.125840, 2021.
CATDS: CATDS-PDC L4SM RZSM – 1 day global map of root zone soil moisture values from SMOS satellite, CATDS (CNES, IFREMER, CESBIO) [data set], https://doi.org/10.12770/316e77af-cb72-4312-96a3-3011cc5068d4, 2021.
Chen, Y. and Yuan, H.: Evaluation of nine sub-daily soil moisture model products over China using high-resolution in situ observations, J. Hydrol., 588, 125054, https://doi.org/10.1016/j.jhydrol.2020.125054, 2020.
Cho, E., Choi, M., and Wagner, W.: An assessment of remotely sensed surface and root zone soil moisture through active and passive sensors in northeast Asia, Remote Sens. Environ., 160, 166–179, https://doi.org/10.1016/j.rse.2015.01.013, 2015.
CMA: Evaluation report of Chinese ground-based air temperature grid dataset (V 2.0), China Meteorological Administration, https://data.cma.cn/site/showSubject/id/101.html (last access: 6 April 2023), 2012a (in Chinese).
CMA: Evaluation report of Chinese ground-based precipitation grid dataset (V 2.0), China Meteorological Administration, https://data.cma.cn/site/showSubject/id/101.html (last access: 18 May 2024), 2012b (in Chinese).
CMA: The Near-Real-Time Product Dataset Of The China Meteorological Administration Land Data Assimilation System (CLDAS-V2.0), China Meteorological Administration [data set], https://data.cma.cn/data/cdcdetail/dataCode/NAFP_CLDAS2.0_NRT.html (last access: 17 May 2024), 2015.
Collow, T. W., Robock, A., Basara, J. B., and Illston, B. G.: Evaluation of SMOS retrievals of soil moisture over the central United States with currently available in situ observations, J. Geophys Res.-Atmos., 117, D09113, https://doi.org/10.1029/2011jd017095, 2012.
Cosby, B., Hornberger, G., Clapp, R., and Ginn, T.: A statisticsl exploration of the relationships of soil moisture characteristics to the physical propertie of soil, Water Resour. Res., 20, 682–690, https://doi.org/10.1029/WR020i006p00682, 1984.
Crow, W. T., Berg, A. A., Cosh, M. H., Loew, A., Mohanty, B. P., Panciera, R., de Rosnay, P., Ryu, D., and Walker, J. P.: Upscaling sparse ground-based soil moisture observations for the validation of coarse-resolution satellite soil moisture products, Rev. Geophys., 50, RG2002, https://doi.org/10.1029/2011rg000372, 2012.
Cui, H., Jiang, L., Du, J., Zhao, S., Wang, G., Lu, Z., and Wang, J.: Evaluation and analysis of AMSR-2, SMOS, and SMAP soil moisture products in the Genhe area of China, J. Geophys Res.-Atmos., 122, 8650–8666, https://doi.org/10.1002/2017jd026800, 2017.
De Lannoy, G. J. M., Koster, R. D., Reichle, R. H., Mahanama, S. P. P., and Liu, Q.: An updated treatment of soil texture and associated hydraulic properties in a global land modeling system, J. Adv. Model Earth Sy., 6, 957–979, https://doi.org/10.1002/2014ms000330, 2014.
de Rosnay, P., Balsamo, G., Albergel, C., Muñoz-Sabater, J., and Isaksen, L.: Initialisation of Land Surface Variables for Numerical Weather Prediction, Surv. Geophys., 35, 607–621, https://doi.org/10.1007/s10712-012-9207-x, 2012.
Djamai, N., Magagi, R., Goïta, K., Hosseini, M., Cosh, M. H., Berg, A., and Toth, B.: Evaluation of SMOS soil moisture products over the CanEx-SM10 area, J. Hydrol., 520, 254–267, https://doi.org/10.1016/j.jhydrol.2014.11.026, 2015.
Dong, J., Lei, F., and Crow, W. T.: Land transpiration-evaporation partitioning errors responsible for modeled summertime warm bias in the central United States, Nat. Commun., 13, 336, https://doi.org/10.1038/s41467-021-27938-6, 2022.
Douville, H., Viterbo, P., Mahfouf, J.-F., and Beljaars, A.: Evaluation of the optimum interpolation and nudging techniques for soil moisture analysis using FIFE data, Mon. Weather Rev., 128, 1733–1756, https://doi.org/10.1175/1520-0493(2000)128<1733:EOTOIA>2.0.CO;2, 2000.
Draper, C. and Reichle, R.: The impact of near-surface soil moisture assimilation at subseasonal, seasonal, and inter-annual timescales, Hydrol. Earth Syst. Sci., 19, 4831–4844, https://doi.org/10.5194/hess-19-4831-2015, 2015.
Fan, L., Xing, Z., Lannoy, G. D., Frappart, F., Peng, J., Zeng, J., Li, X., Yang, K., Zhao, T., Shi, J., Ma, H., Wang, M., Liu, X., Yi, C., Ma, M., Tang, X., Wen, J., Chen, X., Wang, C., Wang, L., Wang, G., and Wigneron, J.-P.: Evaluation of satellite and reanalysis estimates of surface and root-zone soil moisture in croplands of Jiangsu Province, China, Remote Sens. Environ., 282, 113283, https://doi.org/10.1016/j.rse.2022.113283, 2022.
Fan, Y., Miguez-Macho, G., Jobbagy, E. G., Jackson, R. B., and Otero-Casal, C.: Hydrologic regulation of plant rooting depth, P. Natl. Acad. Sci. USA, 114, 10572–10577, https://doi.org/10.1073/pnas.1712381114, 2017.
FAO, IIASA, ISRIC, ISSCAS, and JRC: Harmonized World Soil Database (version 1.2), February 2012, http://webarchive.iiasa.ac.at/Research/LUC/External-World-soil-database/HWSD_Documentation.pdf (last access: 17 May 2024), 2012.
Feng, H., Wu, Z., Dong, J., Zhou, J., Brocca, L., and He, H.: Transpiration – Soil evaporation partitioning determines inter-model differences in soil moisture and evapotranspiration coupling, Remote Sens. Environ., 298, 113841, https://doi.org/10.1016/j.rse.2023.113841, 2023.
Fernandez-Moran, R., Wigneron, J. P., De Lannoy, G., Lopez-Baeza, E., Parrens, M., Mialon, A., Mahmoodi, A., Al-Yaari, A., Bircher, S., Al Bitar, A., Richaume, P., and Kerr, Y.: A new calibration of the effective scattering albedo and soil roughness parameters in the SMOS SM retrieval algorithm, Int. J. Appl. Earth Obs., 62, 27–38, https://doi.org/10.1016/j.jag.2017.05.013, 2017.
Ford, T. W., Harris, E., and Quiring, S. M.: Estimating root zone soil moisture using near-surface observations from SMOS, Hydrol. Earth Syst. Sci., 18, 139–154, https://doi.org/10.5194/hess-18-139-2014, 2014.
Gao, H., Hrachowitz, M., Schymanski, S. J., Fenicia, F., Sriwongsitanon, N., and Savenije, H. H. G.: Climate controls how ecosystems size the root zone storage capacity at catchment scale, Geophys. Res. Lett., 41, 7916–7923, https://doi.org/10.1002/2014gl061668, 2014.
Gao, H., Birkel, C., Hrachowitz, M., Tetzlaff, D., Soulsby, C., and Savenije, H. H. G.: A simple topography-driven and calibration-free runoff generation module, Hydrol. Earth Syst. Sci., 23, 787–809, https://doi.org/10.5194/hess-23-787-2019, 2019a.
Gao, X., Zhao, X., Brocca, L., Pan, D., and Wu, P.: Testing of observation operators designed to estimate profile soil moisture from surface measurements, Hydrol. Process., 33, 575–584, https://doi.org/10.1002/hyp.13344, 2019b.
Gelaro, R., McCarty, W., Suarez, M. J., Todling, R., Molod, A., Takacs, L., Randles, C., Darmenov, A., Bosilovich, M. G., Reichle, R., Wargan, K., Coy, L., Cullather, R., Draper, C., Akella, S., Buchard, V., Conaty, A., da Silva, A., Gu, W., Kim, G. K., Koster, R., Lucchesi, R., Merkova, D., Nielsen, J. E., Partyka, G., Pawson, S., Putman, W., Rienecker, M., Schubert, S. D., Sienkiewicz, M., and Zhao, B.: The Modern-Era Retrospective Analysis for Research and Applications, Version 2 (MERRA-2), J. Climate, 30, 5419–5454, https://doi.org/10.1175/JCLI-D-16-0758.1, 2017.
Girotto, M., De Lannoy, G. J. M., Reichle, R. H., and Rodell, M.: Assimilation of gridded terrestrial water storage observations from GRACE into a land surface model, Water Resour. Res., 52, 4164–4183, https://doi.org/10.1002/2015wr018417, 2016.
GMAO: inst3_3d_asm_Cp: MERRA-2 3D IAU State, Meteorology Instantaneous 3-hourly (p-coord, 0.625x0.5L42), version 5.12.4, Goddard Space Flight Center Distributed Active Archive Center (GSFC DAAC) [data set], Greenbelt, MD, USA, https://doi.org/10.5067/VJAFPLI1CSIV, 2015.
Gou, Q., Zhu, Y., Lü, H., Horton, R., Yu, X., Zhang, H., Wang, X., Su, J., Liu, E., Ding, Z., Wang, Z., and Yuan, F.: Application of an improved spatio-temporal identification method of flash droughts, J. Hydrol., 604, 127224, https://doi.org/10.1016/j.jhydrol.2021.127224, 2022.
Gruber, A., De Lannoy, G., Albergel, C., Al-Yaari, A., Brocca, L., Calvet, J. C., Colliander, A., Cosh, M., Crow, W., Dorigo, W., Draper, C., Hirschi, M., Kerr, Y., Konings, A., Lahoz, W., McColl, K., Montzka, C., Muñoz-Sabater, J., Peng, J., Reichle, R., Richaume, P., Rüdiger, C., Scanlon, T., van der Schalie, R., Wigneron, J. P., and Wagner, W.: Validation practices for satellite soil moisture retrievals: What are (the) errors?, Remote Sens. Environ., 244, 111806, https://doi.org/10.1016/j.rse.2020.111806, 2020.
Gu, F., Chen, X., Wei, C., Zhou, M., and Li, B.: Distribution of calcareous concretion in soil profile and their effects on soil water retention in calcic vertisol, Transactions of the Chinese Society of Agricultural Engineering, 37, 73–80, https://doi.org/10.11975/j.issn.1002-6819.2021.06.010, 2021 (in Chinese with English abstract).
Harrison, K. W., Kumar, S. V., Peters-Lidard, C. D., and Santanello, J. A.: Quantifying the change in soil moisture modeling uncertainty from remote sensing observations using Bayesian inference techniques, Water Resour. Res., 48, W11514, https://doi.org/10.1029/2012wr012337, 2012.
Hauser, M., Orth, R., and Seneviratne, S. I.: Role of soil moisture versus recent climate change for the 2010 heat wave in western Russia, Geophys. Res. Lett., 43, 2819–2826, https://doi.org/10.1002/2016gl068036, 2016.
Hersbach, H., Bell, B., Berrisford, P., Hirahara, S., Horányi, A., Muñoz-Sabater, J., Nicolas, J., Peubey, C., Radu, R., Schepers, D., Simmons, A., Soci, C., Abdalla, S., Abellan, X., Balsamo, G., Bechtold, P., Biavati, G., Bidlot, J., Bonavita, M., Chiara, G., Dahlgren, P., Dee, D., Diamantakis, M., Dragani, R., Flemming, J., Forbes, R., Fuentes, M., Geer, A., Haimberger, L., Healy, S., Hogan, R. J., Hólm, E., Janisková, M., Keeley, S., Laloyaux, P., Lopez, P., Lupu, C., Radnoti, G., Rosnay, P., Rozum, I., Vamborg, F., Villaume, S., and Thépaut, J. N.: The ERA5 global reanalysis, Q. J. R. Meteorol. Soc., 146, 1999–2049, https://doi.org/10.1002/qj.3803, 2020.
Hersbach, H., Bell, B., Berrisford, P., Biavati, G., Horányi, A., Muñoz Sabater, J., Nicolas, J., Peubey, C., Radu, R., Rozum, I., Schepers, D., Simmons, A., Soci, C., Dee, D., and Thépaut, J.-N.: ERA5 hourly data on single levels from 1940 to present, Copernicus Climate Change Service (C3S) Climate Data Store (CDS) [data set], https://doi.org/10.24381/cds.adbb2d47, 2023.
Houborg, R., Rodell, M., Li, B., Reichle, R., and Zaitchik, B. F.: Drought indicators based on model-assimilated Gravity Recovery and Climate Experiment (GRACE) terrestrial water storage observations, Water Resour. Res., 48, W07525, https://doi.org/10.1029/2011wr011291, 2012.
Jiao, D., Xu, N., Yang, F., and Xu, K.: Evaluation of spatial-temporal variation performance of ERA5 precipitation data in China, Sci. Rep., 11, 17956, https://doi,org/10.1038/s41598-021-97432-y, 2021.
Kerr, Y. H., Waldteufel, P., Wigneron, J. P., Martinuzzi, J. M., Font, J., and Berger, M.: Soil Moisture Retrieval from Space: The Soil Moisture and Ocean Salinity (SMOS) Mission, IEEE T. Geosci. Remote, 39, 1729–1735, https://doi.org/10.1109/36.942551, 2001.
Kerr, Y. H., Waldteufel, P., Richaume, P., Wigneron, J. P., Ferrazzoli, P., Mahmoodi, A., Al Bitar, A., Cabot, F., Gruhier, C., Juglea, S. E., Leroux, D., Mialon, A., and Delwart, S.: The SMOS Soil Moisture Retrieval Algorithm, IEEE T. Geosci. Remote, 50, 1384–1403, https://doi.org/10.1109/tgrs.2012.2184548, 2012.
Kleidon, A.: Beyond Gaia: Thermodynamics of Life and Earth System Functioning, Climate Change, 66, 271–319, https://doi.org/10.1023/B:CLIM.0000044616.34867.ec, 2014.
Kornelsen, K. C. and Coulibaly, P.: Root-zone soil moisture estimation using data-driven methods, Water Resour. Res., 50, 2946–2962, https://doi.org/10.1002/2013wr014127, 2014.
Koster, R. D., Suarez, M. J., Ducharne, A., Stieglitz, M., and Kumar, P.: A catchment-based approach to modeling land surface processes in a general circulation model: 1. Model structure, J. Geophys Res.-Atmos., 105, 24809–24822, https://doi.org/10.1029/2000jd900327, 2000.
Li, B., Rodell, M., Zaitchik, B. F., Reichle, R. H., Koster, R. D., and van Dam, T. M.: Assimilation of GRACE terrestrial water storage into a land surface model: Evaluation and potential value for drought monitoring in western and central Europe, J. Hydrol., 446–447, 103–115, https://doi.org/10.1016/j.jhydrol.2012.04.035, 2012.
Li, B., Rodell, M., Kumar, S., Beaudoing, H. K., Getirana, A., Zaitchik, B. F., Goncalves, L. G., Cossetin, C., Bhanja, S., Mukherjee, A., Tian, S., Tangdamrongsub, N., Long, D., Nanteza, J., Lee, J., Policelli, F., Goni, I. B., Daira, D., Bila, M., Lannoy, G., Mocko, D., Steele-Dunne, S. C., Save, H., and Bettadpur, S.: Global GRACE Data Assimilation for Groundwater and Drought Monitoring: Advances and Challenges, Water Resour. Res., 55, 7564–7586, https://doi.org/10.1029/2018wr024618, 2019.
Li, B., Beaudoing, H., Rodell, M., and NASA/GSFC/HSL: GLDAS Catchment Land Surface Model L4 daily 0.25 × 0.25 degree GRACE-DA1 V2.2, Greenbelt, Maryland, USA, Goddard Earth Sciences Data and Information Services Center (GES DISC) [data set], https://doi.org/10.5067/TXBMLX370XX8, 2020.
Li, D., Zhang, G., and Gong, Z.: On Taxonomy of Shajiang Black Soils in China, Soils, 43, 623–629, https://doi.org/10.13758/j.cnki.tr.2011.04.015, 2011 (in Chinese with English abstract).
Li, X., Wigneron, J.-P., Frappart, F., Fan, L., Ciais, P., Fensholt, R., Entekhabi, D., Brandt, M., Konings, A. G., Liu, X., Wang, M., Al-Yaari, A., and Moisy, C.: Global-scale assessment and inter-comparison of recently developed/reprocessed microwave satellite vegetation optical depth products, Remote Sens. Environ., 253, 112208, https://doi.org/10.1016/j.rse.2020.112208, 2021.
Lian, X., Piao, S., Huntingford, C., Li, Y., Zeng, Z., Wang, X., Ciais, P., McVicar, T. R., Peng, S., Ottlé, C., Yang, H., Yang, Y., Zhang, Y., and Wang, T.: Partitioning global land evapotranspiration using CMIP5 models constrained by observations, Nat. Clim. Change, 8, 640–646, https://doi.org/10.1038/s41558-018-0207-9, 2018.
Ling, X., Huang, Y., Guo, W., Wang, Y., Chen, C., Qiu, B., Ge, J., Qin, K., Xue, Y., and Peng, J.: Comprehensive evaluation of satellite-based and reanalysis soil moisture products using in situ observations over China, Hydrol. Earth Syst. Sci., 25, 4209–4229, https://doi.org/10.5194/hess-25-4209-2021, 2021.
Liu, E.: In situ root zone soil moisture measurements.xls, figshare [data set], https://doi.org/10.6084/m9.figshare.23497502.v2, 2023.
Liu, E., Zhu, Y., Lü, H., Horton, R., Gou, Q., Wang, X., Ding, Z., Xu, H., and Pan, Y.: Estimation and Assessment of the Root Zone Soil Moisture from Near-Surface Measurements over Huai River Basin, Atmosphere, 14, 124–145, https://doi.org/10.3390/atmos14010124, 2023.
Lorenz, R., Jaeger, E. B., and Seneviratne, S. I.: Persistence of heat waves and its link to soil moisture memory, Geophys. Res. Lett., 37, L09703, https://doi.org/10.1029/2010gl042764, 2010.
Ma, H., Zeng, J., Chen, N., Zhang, X., Cosh, M. H., and Wang, W.: Satellite surface soil moisture from SMAP, SMOS, AMSR2 and ESA CCI: A comprehensive assessment using global ground-based observations, Remote Sens. Environ., 231, 111215, https://doi.org/10.1016/j.rse.2019.111215, 2019.
McCarty, W., Coy, L., Gelaro, R., Huang, A., Merkova, D., Smith, E. B., Sienkiewicz, M., and Wargan, K.: MERRA-2 Input Observations: Summary and Assessment NASA Tech. Rep. Series on Global Modeling and Data Assimilation 46, 64 pp., https://gmao.gsfc.nasa.gov/pubs/docs/McCarty885.pdf (last access: 17 May 2024), 2016.
Meng, J., Yang, R., Wei, H., Ek, M., Gayno, G., Xie, P., and Mitchell, K.: The Land Surface Analysis in the NCEP Climate Forecast System Reanalysis, J. Hydrometeorol., 13, 1621–1630, https://doi.org/10.1175/JHM-D-11-090.1, 2012.
MWR: Specifications for soil moisture monitoring, http://www.jsgg.com.cn/Index/Display.asp?NewsID=21094 (last access: 17 May 2024), 2015 (in Chinese).
Nachtergaele, F., Velthuizen, H. V., LucVerelst, Batjes, N., Dijkshoorn, K., Engelen, V. V., Fischer, G., Jones, A., Montanarella, L., Petri, M., Prieler, S., Shi, X., Teixeira, E., and Wiberg, D.: The harmonized world soil database, 2010 19th World Congress of Soil Science, Soil Solutions for a Changing World, https://www.researchgate.net/profile/Niels-Batjes/publication/259975239_The_harmonized_world_soil_database/links/0deec52ed08ea33a81000000/The-harmonizedworld-soil-database.pdf (last access: 17 May 2024), 2009.
Nogueira, M., Albergel, C., Boussetta, S., Johannsen, F., Trigo, I. F., Ermida, S. L., Martins, J. P. A., and Dutra, E.: Role of vegetation in representing land surface temperature in the CHTESSEL (CY45R1) and SURFEX-ISBA (v8.1) land surface models: a case study over Iberia, Geosci. Model Dev., 13, 3975–3993, https://doi.org/10.5194/gmd-13-3975-2020, 2020.
Pablos, M., González-Zamora, Á., Sánchez, N., and Martínez-Fernández, J.: Assessment of Root Zone Soil Moisture Estimations from SMAP, SMOS and MODIS Observations, Remote Sens., 10, 981, https://doi.org/10.3390/rs10070981, 2018.
Piani, C., Weedon, G. P., Best, M., Gomes, S. M., Viterbo, P., Hagemann, S., and Haerter, J. O.: Statistical bias correction of global simulated daily precipitation and temperature for the application of hydrological models, J. Hydrol., 395, 199–215, https://doi,org/10.1016/j.jhydrol.2010.10.024, 2010.
Qin, Y., Wu, T., Wu, X., Li, R., Xie, C., Qiao, Y., Hu, G., Zhu, X., Wang, W., and Shang, W.: Assessment of reanalysis soil moisture products in the permafrost regions of the central of the Qinghai-Tibet Plateau, Hydrol. Process., 31, 4647–4659, https://doi.org/10.1002/hyp.11383, 2017.
Rao, K. S., Chandra, G., and Rao, P. V. N.: The relationship between brightness temperature and soil moisture Selection of frequency range for microwave remote sensing, Int. J. Remote Sens., 8, 1531–1545, https://doi.org/10.1080/01431168708954795, 2007.
Reichle, R. H. and Koster, R. D.: Assessing the Impact of Horizontal Error Correlations in Background Fields on Soil Moisture Estimation, J. Hydrometeorol., 4, 1229–1242, https://doi.org/10.1175/1525-7541(2003)004<1229:ATIOHE>2.0.CO;2, 2003.
Reichle, R., Crow, W., Koster, R., Kimball, J., and Lannoy, G. D.: Algorithm Theoretical Basis Document (ATBD) SMAP Level 4 Surface and Root Zone Soil Moisture (L4_SM) Data Product, Soil Moisture Active Passive (SMAP) Project, https://smap.jpl.nasa.gov/files/smap2/L4_SM_InitRel_v1.pdf (last access: 17 May 2024), 2012.
Reichle, R., De Lannoy, G., Koster, R. D., Crow, W. T., Kimball, J. S., and Liu, Q.: SMAP L4 Global 3-hourly 9 km EASE-Grid Surface and Root Zone Soil Moisture Geophysical Data, Version 5, NASA National Snow and Ice Data Center Distributed Active Archive Center [data set], https://doi.org/10.5067/9LNYIYOBNBR5, 2020.
Reichle, R. H., De Lannoy, M., G. J., and Liu, Q.: Assessment of the SMAP Level-4 Surface and Root-Zone Soil Moisture Product Using In Situ Measurements, J. Hydrometeorol., 18, 2621–2645, https://doi.org/10.1175/jhm-d-17-0063.1, 2017a.
Reichle, R. H., De Lannoy, G. J. M., Liu, Q., Koster, R. D., Kimball, J. S., Crow, W. T., Ardizzone, J. V., Chakraborty, P., Collins, D. W., Conaty, A. L., Girotto, M., Jones, L. A., Kolassa, J., Lievens, H., Lucchesi, R. A., and Smith, E. B.: Global Assessment of the SMAP Level-4 Surface and Root-Zone Soil Moisture Product Using Assimilation Diagnostics, J. Hydrometeorol., 18, 3217–3237, https://doi.org/10.1175/JHM-D-17-0130.1, 2017b.
Reichle, R. H., Draper, C. S., Liu, Q., Girotto, M., Mahanama, S. P. P., Koster, R. D., and De Lannoy, G. J. M.: Assessment of MERRA-2 Land Surface Hydrology Estimates, J. Climate, 30, 2937–2960, https://doi.org/10.1175/jcli-d-16-0720.1, 2017c.
Reichle, R. H., Liu, Q., Koster, R. D., Draper, C. S., Mahanama, S. P. P., and Partyka, G. S.: Land Surface Precipitation in MERRA-2, J. Climate, 30, 1643–1664, https://doi.org/10.1175/jcli-d-16-0570.1, 2017d.
Reichle, R. H., Liu, Q., Koster, R. D., Ardizzone, J. V., Colliander, A., Crow, W. T., De Lannoy, G. J. M., and Kimball, J. S.: Soil Moisture Active Passive (SMAP) Project Assessment Report for Version 5 of the L4_SM Data Product, Technical Report Series on Global Modeling and Data Assimilation, Vol. 58, https://ntrs.nasa.gov/api/citations/20210018731/downloads/TM-2021-104606 Vol. 58 SMAP_L4_SM_Version_5_Release_Assessment_Report_final-v.3.pdf (last access: 17 May 2024), 2021.
Reynolds, C. A., Jackson, T. J., and Rawls, W. J.: Estimating soil water-holding capacities by linking the Food and Agriculture Organization Soil map of the world with global pedon databases and continuous pedotransfer functions, Water Resour. Res., 36, 3653–3662, https://doi.org/10.1029/2000wr900130, 2000.
Rienecker, M. M., Suarez, M. J., Todling, R., Bacmeister, J., Takacs, L., Liu, H.-C., Gu, W., Sienkiewicz, M., Koster, R. D., Gelaro, R., Stajner, I., and Nielsen, J. E.: The GEOS-5 Data Assimilation System – Documentation of Versions 5.0.1, 5.1.0, and 5.2.0 NASA Tech. Rep. Series on Global Modeling and Data Assimilation, https://ntrs.nasa.gov/api/citations/20120011955/downloads/20120011955.pdf (last access: 17 May 2024), 2008.
Rodell, M., Houser, P. R., Jambor, U., Gottschalck, J., Mitchell, K., Meng, C. J., Arsenault, K., Cosgrove, B., Radakovich, J., Bosilovich, M., Entin, J. K., Walker, J. P., Lohmann, D., and Toll, D.: The Global Land Data Assimilation System, B. Am. Meteorol. Soc., 85, 381–394, https://doi.org/10.1175/bams-85-3-381, 2004.
Rüdiger, C., Calvet, J.-C., Gruhier, C., Holmes, T. R. H., de Jeu, R. A. M., and Wagner, W.: An Intercomparison of ERS-Scat and AMSR-E Soil Moisture Observations with Model Simulations over France, J. Hydrometeorol., 10, 431–447, https://doi.org/10.1175/2008jhm997.1, 2009.
Rui, H., Beaudoing, H., and Loeser, C.: README Document for NASA GLDAS Version 2 Data Products, https://hydro1.gesdisc.eosdis.nasa.gov/data/GLDAS/GLDAS_NOAH025_3H.2.1/doc/README_GLDAS2.pdf (last access: 17 May 2024), 2021.
Saha, S., Moorthi, S., Pan, H.-L., Wu, X., Wang, J., Nadiga, S., Tripp, P., Kistler, R., Woollen, J., Behringer, D., Liu, H., Stokes, D., Grumbine, R., Gayno, G., Wang, J., Hou, Y.-T., Chuang, H.-y., Juang, H.-M. H., Sela, J., Iredell, M., Treadon, R., Kleist, D., Van Delst, P., Keyser, D., Derber, J., Ek, M., Meng, J., Wei, H., Yang, R., Lord, S., van den Dool, H., Kumar, A., Wang, W., Long, C., Chelliah, M., Xue, Y., Huang, B., Schemm, J.-K., Ebisuzaki, W., Lin, R., Xie, P., Chen, M., Zhou, S., Higgins, W., Zou, C.-Z., Liu, Q., Chen, Y., Han, Y., Cucurull, L., Reynolds, R. W., Rutledge, G., and Goldberg, M.: The NCEP Climate Forecast System Reanalysis, B. Am. Meteorol. Soc., 91, 1015–1058, https://doi.org/10.1175/2010bams3001.1, 2010.
Saha, S., Moorthi, S., Wu, X., Wang, J., Nadiga, S., Tripp, P., Behringer, D., Hou, Y. T., Chuang, H. Y., Iredell, M., and and Ek, M.: NCEP Climate Forecast System Version 2 (CFSv2) 6-hourly Products, updated daily, Research Data Archive at the National Center for Atmospheric Research, Computational and Information Systems Laboratory [data set], https://doi.org/10.5065/D61C1TXF, 2011.
Saha, S., Moorthi, S., Wu, X., Wang, J., Nadiga, S., Tripp, P., D., B., Hou, Y., Chuang, H., and Iredell, M.: The NCEP Climate Forecast System Version 2, J. Climate, 27, 2185–2208, https://doi.org/10.1175/JCLI-D-12-00823.1, 2014.
Seuffert, G., Wilker, H., Viterbo, P., Mahfouf, J. F., Drusch, M., and Calvet, J. C.: Soil moisture analysis combining screen-level parameters and microwave brightness temperature: A test with field data, Geophys. Res. Lett., 30, 1498, https://doi.org/10.1029/2003gl017128, 2003.
Shangguan, W., Dai, Y., Liu, B., Zhu, A., Duan, Q., Wu, L., Ji, D., Ye, A., Yuan, H., Zhang, Q., Chen, D., Chen, M., Chu, J., Dou, Y., Guo, J., Li, H., Li, J., Liang, L., Liang, X., Liu, H., Liu, S., Miao, C., and Zhang, Y.: A China data set of soil properties for land surface modeling, J. Adv. Model. Earth Sy., 5, 212–224, https://doi.org/10.1002/jame.20026, 2013.
Shi, C., Jiang, L., Zhang, T., Xu, B., and Han, S.: Status and Plans of CMA Land Data Assimilation System (CLDAS) Project, Geophys. Res. Lett., 16, EGU2014-5671, https://meetingorganizer.copernicus.org/EGU2014/EGU2014-5671.pdf (last access: 17 May 2024), 2014.
Stevens, D., Miranda, P. M. A., Orth, R., Boussetta, S., Balsamo, G., and Dutra, E.: Sensitivity of Surface Fluxes in the ECMWF Land Surface Model to the Remotely Sensed Leaf Area Index and Root Distribution: Evaluation with Tower Flux Data, Atmosphere, 11, 1362, https://doi.org/10.3390/atmos11121362, 2020.
Su, J., Lü, H., Zhu, Y., Cui, Y., and Wang, X.: Evaluating the hydrological utility of latest IMERG products over the Upper Huaihe River Basin, China, Atmos. Res., 225, 17–29, https://doi.org/10.1016/j.atmosres.2019.03.025, 2019.
Sun, Y., Solomon, S., Dai, A., and Portmann, R. W.: How Often Does It Rain?, J. Climate, 19, 916–934, https://doi.org/10.1175/JCLI3672.1, 2005.
Tangdamrongsub, N., Han, S.-C., Yeo, I.-Y., Dong, J., Steele-Dunne, S. C., Willgoose, G., and Walker, J. P.: Multivariate data assimilation of GRACE, SMOS, SMAP measurements for improved regional soil moisture and groundwater storage estimates, Adv. Water Resour., 135, 103477, https://doi.org/10.1016/j.advwatres.2019.103477, 2020.
Tian, S., Tregoning, P., Renzullo, L. J., van Dijk, A. I. J. M., Walker, J. P., Pauwels, V. R. N., and Allgeyer, S.: Improved water balance component estimates through joint assimilation of GRACE water storage and SMOS soil moisture retrievals, Water Resour. Res., 53, 1820–1840, https://doi.org/10.1002/2016wr019641, 2017.
van Oorschot, F., van der Ent, R. J., Hrachowitz, M., and Alessandri, A.: Climate-controlled root zone parameters show potential to improve water flux simulations by land surface models, Earth Syst. Dynam., 12, 725–743, https://doi.org/10.5194/esd-12-725-2021, 2021.
Velasquez, P., Messmer, M., and Raible, C. C.: A new bias-correction method for precipitation over complex terrain suitable for different climate states: a case study using WRF (version 3.8.1), Geosci. Model Dev., 13, 5007–5027, https://doi.org/10.5194/gmd-13-5007-2020, 2020.
Wang, A. and Zeng, X.: Evaluation of multireanalysis products with in situ observations over the Tibetan Plateau, J. Geophys Res., 117, D05102, https://doi.org/10.1029/2011JD016553, 2012.
Wang, X., Lü, H., Crow, W. T., Zhu, Y., Wang, Q., Su, J., Zheng, J., and Gou, Q.: Assessment of SMOS and SMAP soil moisture products against new estimates combining physical model, a statistical model, and in-situ observations: A case study over the Huai River Basin, China, J. Hydrol., 598, 126468, https://doi.org/10.1016/j.jhydrol.2021.126468, 2021a.
Wang, Z., Che, T., Zhao, T., Dai, L., Li, X., and Wigneron, J.-P.: Evaluation of SMAP, SMOS, and AMSR2 Soil Moisture Products Based on Distributed Ground Observation Network in Cold and Arid Regions of China, IEEE J.-STARS, 14, 8955–8970, https://doi.org/10.1109/jstars.2021.3108432, 2021b.
Wigneron, J.-P., Li, X., Frappart, F., Fan, L., Al-Yaari, A., De Lannoy, G., Liu, X., Wang, M., Le Masson, E., and Moisy, C.: SMOS-IC data record of soil moisture and L-VOD: Historical development, applications and perspectives, Remote Sens. Environ., 254, 112238, https://doi.org/10.1016/j.rse.2020.112238, 2021.
Wösten, J. H. M., Pachepsky, Y. A., and Rawls, W. J.: Pedotransfer functions: Bridging the gap between available basic soil data and missing soil hydraulic characteristics, J. Hydrol., 251, 123–150, https://doi.org/10.1016/S0022-1694(01)00464-4, 2001.
Xia, Y., Sheffield, J., Ek, M. B., Dong, J., Chaney, N., Wei, H., Meng, J., and Wood, E. F.: Evaluation of multi-model simulated soil moisture in NLDAS-2, J. Hydrol., 512, 107–125, https://doi.org/10.1016/j.jhydrol.2014.02.027, 2014.
Xing, Z., Fan, L., Zhao, L., De Lannoy, G., Frappart, F., Peng, J., Li, X., Zeng, J., Al-Yaari, A., Yang, K., Zhao, T., Shi, J., Wang, M., Liu, X., Hu, G., Xiao, Y., Du, E., Li, R., Qiao, Y., Shi, J., Wen, J., Ma, M., and Wigneron, J.-P.: A first assessment of satellite and reanalysis estimates of surface and root-zone soil moisture over the permafrost region of Qinghai-Tibet Plateau, Remote Sens. Environ., 265, 112666, https://doi.org/10.1016/j.rse.2021.112666, 2021.
Xu, L., Chen, N., Zhang, X., Moradkhani, H., Zhang, C., and Hu, C.: In-situ and triple-collocation based evaluations of eight global root zone soil moisture products, Remote Sens. Environ., 254, 112248, https://doi.org/10.1016/j.rse.2020.112248, 2021.
Yang, S., Li, R., Wu, T., Hu, G., Xiao, Y., Du, Y., Zhu, X., Ni, J., Ma, J., Zhang, Y., Shi, J., and Qiao, Y.: Evaluation of reanalysis soil temperature and soil moisture products in permafrost regions on the Qinghai-Tibetan Plateau, Geoderma, 377, 114583, https://doi.org/10.1016/j.geoderma.2020.114583, 2020.
Zaitchik, B. F., Rodell, M., and Reichle, R. H.: Assimilation of GRACE Terrestrial Water Storage Data into a Land Surface Model: Results for the Mississippi River Basin, J. Hydrometeorol., 9, 535–548, https://doi.org/10.1175/2007jhm951.1, 2008.
Zeng, J., Yuan, X., Ji, P., and Shi, C.: Effects of meteorological forcings and land surface model on soil moisture simulation over China, J. Hydrol., 603, 126978, https://doi.org/10.1016/j.jhydrol.2021.126978, 2021.
Zha, L., Wu, K., Li, L., Chen, J., and Ju, B.: The Cultivation Obstacle Factors of Lime Concretion Black Soil Genuses in Henan, Chinese Journal of Soil Science, 46, 280–286, https://doi.org/10.19336/j.cnki.trtb.2015.02.004, 2015 (in Chinese with English abstract).
Zhang, N., Quiring, S., Ochsner, T., and Ford, T.: Comparison of Three Methods for Vertical Extrapolation of Soil Moisture in Oklahoma, Vadose Zone J., 16, 1–19, https://doi.org/10.2136/vzj2017.04.0085, 2017.
Zhang, Y., Wang, Y., and Liu, L.: Function Mechanism Between the Drought and Waterlogging Disaster and the Soil - structure of the Shajiang Soil in Huaibei Plain, Prog. Gengr., 20, 169–176, https://doi.org/10.11820/dlkxjz.2001.02.010, 2001.
Zhang, Y., Xia, J., Liang, T., and Shao, Q.: Impact of Water Projects on River Flow Regimes and Water Quality in Huai River Basin, Water Resour. Manag., 24, 889–908, https://doi.org/10.1007/s11269-009-9477-3, 2009.
Zheng, J., Zhao, T., Lü, H., Shi, J., Cosh, M. H., Ji, D., Jiang, L., Cui, Q., Lu, H., Yang, K., Wigneron, J.-P., Li, X., Zhu, Y., Hu, L., Peng, Z., Zeng, Y., Wang, X., and Kang, C. S.: Assessment of 24 soil moisture datasets using a new in situ network in the Shandian River Basin of China, Remote Sens. Environ., 271, 112891, https://doi.org/10.1016/j.rse.2022.112891, 2022.
Zhou, J., Wu, Z., Crow, W. T., Dong, J., and He, H.: Improving Spatial Patterns Prior to Land Surface Data Assimilation via Model Calibration Using SMAP Surface Soil Moisture Data, Water Resour. Res., 56, e2020WR027770, https://doi.org/10.1029/2020wr027770, 2020.