the Creative Commons Attribution 4.0 License.
the Creative Commons Attribution 4.0 License.
 | 12 Jan 2024
Seasonal dynamics and spatial patterns of soil moisture in a loess catchment
Shaozhen Liu
Ilja van Meerveld
Yali Zhao
Yunqiang Wang
James W. Kirchner
The spatial and seasonal patterns in soil moisture and the processes controlling them in semi-arid landscapes are not well understood. Loess landscapes minimize any confounding effects of variation in soil characteristics and are thus ideal for studying topographic influences on soil moisture in drylands. In this study, volumetric soil moisture was monitored monthly for 5.5 years at 20 cm intervals between the surface and 5 m depth at 89 sites across a small (0.43 km2) catchment on the Chinese Loess Plateau. The median soil moisture was computed for each month and depth for each monitoring site as a measure of the typical soil moisture conditions. Seasonal changes in soil moisture were mainly concentrated in the shallow (0–100 cm) soil, with a clear seasonal separation between wet conditions in October–March and dry conditions in May–July, even though precipitation is highest in July–August. Soil moisture was higher on the northwest-facing slopes due to increased drying from solar radiation on the southeast-facing slopes. This effect of slope aspect was greater between October and March, when the zenith angle of the sun was lower and the aspect-dependent difference in solar radiation reaching the surface was larger. The wetter, northwest-facing slopes were also characterized by larger annual soil moisture storage changes. Soil texture was nearly uniform across both slopes, and soil moisture was not correlated with the topographic wetness index, suggesting that variations in evapotranspiration dominated the spatial pattern of soil moisture in shallow soils under both wet and dry conditions. Water balance calculations indicate that over 90 % of the annual precipitation was seasonally cycled in the soil between 0 and 300 cm, suggesting that only a minor fraction infiltrates to groundwater and becomes streamflow. Our findings may be broadly applicable to loess regions with monsoonal climates and may have practical implications for catchment-scale hydrologic modeling and the design of soil moisture monitoring networks.
- Article
(6623 KB) - Full-text XML
- BibTeX
- EndNote


Understanding the spatial variability of soil moisture is critical to the study of transpiration, groundwater recharge, streamflow generation, land–atmosphere interactions, and soil ecology and biogeochemistry (Dymond et al., 2021; Ridolfi et al., 2003) as well as to hydrological applications such as streamflow forecasting and irrigation management (Brocca et al., 2010; Chen et al., 2011; Koster et al., 2010; Peterson et al., 2019). The spatial heterogeneity of soil moisture usually varies with the average field-, hillslope-, transect-, or catchment-scale wetness (Hu et al., 2011; Western et al., 2003). Usually the spatial variability of soil moisture is highest at intermediate average wetness and lowest under extreme dry or wet conditions (Choi and Jacobs, 2007; Famiglietti et al., 2008; Kaiser and McGlynn, 2018; Owe et al., 1982; Rosenbaum et al., 2012; Teuling and Troch, 2005; Western et al., 2003). Spatial patterns of soil moisture are also shaped by topography, soil properties (e.g., texture and organic carbon content), and vegetation (Han et al., 2021; Tromp-van Meerveld and McDonnell, 2006). The influence of these factors varies with soil wetness or seasonality due to shifts in the dominant hydrological processes regulating soil moisture (Jarecke et al., 2021; Liang et al., 2017; Western et al., 2004). Grayson et al. (1997) and Western et al. (2003) demonstrated that topography has a greater influence on spatial patterns of soil moisture under wet conditions due to the redistribution of soil water by lateral flow, resulting in wetter soils along hillslope drainage lines in convergent topography (i.e., nonlocal control of soil moisture; Grayson and Western, 2001). Under dry conditions, in contrast, soil properties and vegetation become more important factors because soil moisture is mainly affected by point-scale vertical water fluxes (i.e., local control of soil moisture; Grayson and Western, 2001). Any topographic influence under dry conditions is more likely to be due to aspect rather than topographic convergence (Grayson and Western, 2001).
Many studies have attempted to understand spatial patterns in soil moisture and their local and nonlocal controls (Dymond et al., 2021; Hoylman et al., 2019; Jarecke et al., 2021; Kaiser and McGlynn, 2018; McNamara et al., 2005; Penna et al., 2009; Tromp-van Meerveld and McDonnell, 2006; Williams et al., 2009), sometimes reaching different conclusions than Grayson et al. (1997) and Western et al. (2003). For example, in the Mediterranean climate of the Caspar Creek Experimental Watershed, in California, USA (annual precipitation 1168 mm, volumetric soil moisture ∼10 %–∼40 %), Dymond et al. (2021) found that the average soil moisture in the wet season did not follow typical topographic drivers, i.e., the topographic wetness index (TWI) and upslope accumulated area (UAA). Similarly, at the H. J. Andrews Experimental Forest in Oregon, USA (15-month precipitation 2450 mm, volumetric soil moisture ∼16 %–∼32 %), Jarecke et al. (2021) found that hillslope soil moisture was largely independent of hillslope topography and instead primarily controlled by soil properties under both wet and dry conditions. At the Hemuqiao Hydrological Experimental Station in southeastern China (annual precipitation 1580 mm, volumetric soil moisture ∼20 %–∼40 %), Han et al. (2021) found that the relation between volumetric soil moisture and topography fluctuated as a function of catchment storages and precipitation inputs. Relatively few studies have been conducted in arid or semi-arid areas. In semi-arid montane catchments at the Lubrecht Experimental Forest and Tenderfoot Creek Experimental Forest in Montana, USA (Hoylman et al., 2019; Kaiser and McGlynn, 2018), the spatial organization of soil moisture across catchments was persistent over time and strongly influenced by topographic convergence and divergence, even at the end of the growing season when the catchment was in its driest state. In contrast, in a semi-arid catchment on the Loess Plateau, China (annual precipitation 437 mm, volumetric soil moisture < 20 %), Hu and Si (2014) reported that the convergence index had a negligible impact on soil moisture patterns under both wet and dry conditions. These contrasting observations have been ascribed to site-to-site differences in catchment topography, climate, soil characteristics, and perennial source areas and thus to differences in the dominant hydrological processes under both dry and wet conditions (Kaiser and McGlynn, 2018; Takagi and Lin, 2011; Western et al., 2004).
Loess catchments are ideal locations to study the effects of topography on soil moisture because their relatively uniform subsurface largely eliminates the effects of different soil characteristics on soil moisture patterns. Differences in soil texture have a particularly large effect on soil moisture patterns at low soil moisture contents (Grayson et al., 2006). The Loess Plateau, situated in the middle and upper reaches of China's Yellow River basin, has the largest and deepest loess deposits in the world (Jia et al., 2015; Zhu et al., 2019). Most of the area is characterized by a semi-arid to semi-humid climate, with an average annual precipitation of less than 600 mm, of which most falls during the summer monsoon season (Wang et al., 2011). Due to the uneven distribution of rainfall between seasons, the high erodibility of loess soils, and sparse vegetation cover, the region is subject to severe soil erosion, resulting in a dissected landscape (Huang and Shao, 2019; Wang et al., 2019) that may result in distinct soil moisture patterns. Several studies have examined the spatial variability of soil moisture and its complex links with potential controlling factors on the Loess Plateau (Gao et al., 2011, 2016; Qiu et al., 2001; Yu et al., 2018). However, the relatively low number of observation sites and short monitoring periods, combined with the highly seasonal local climate, make the spatial and seasonal patterns difficult to detect. Furthermore, the selection of the controlling factors can sometimes be subjective (Hu et al., 2017), with the result that we lack a systematic assessment of topographic controls on soil moisture patterns in this region.
Understanding the effects of hillslope aspect and topographic convergence on soil moisture patterns can shed light on the dominant hydrological mechanisms controlling near-surface soil moisture. This study, therefore, aims to examine hillslope- and catchment-scale soil moisture spatial patterns and their controls in a Loess Plateau catchment, focusing on the following questions.
-
At which soil depths do seasonal changes in volumetric soil moisture mainly occur?
-
Are there spatial patterns in soil moisture, and do these patterns change seasonally?
-
How do local and nonlocal attributes affect soil moisture patterns?
-
How does the variability in soil moisture change as a function of average wetness?
The study was conducted in the 0.43 km2 Gutun catchment, located near the center of the Loess Plateau (Fig. 1). The climate of the study region is continental monsoon, with hot, wet summers and cool, dry winters. The 60-year average annual precipitation (1956–2015) is 541 mm yr−1 (and was 560 mm yr−1 for the 2016–2021 study period), more than half of which falls in summer (accounting for 56 % of annual rainfall in 2016–2021), often accompanied by intense thunderstorms. The average annual temperature (1956–2015) is 9.8∘C. The elevation in the study areas varies from 974 to 1188 m, and the slope gradient ranges from 0 to 52∘. Since the beginning of the “Gully land consolidation” project in 2011, the gully in the Gutun catchment has been filled and leveled using soil from the slopes, resulting in slopes near 0∘ along the gully axis. Apart from the gully, the catchment includes two slopes predominantly facing southeast (SE) and northwest (NW), respectively. The catchment is underlain by thick loess deposits. Soils are predominantly composed of silty loam texture, ranging in depth from approximately 3 m (in the gully) to more than 30 m (on the slopes). Vegetation on the slopes is dominated by black locust (Robinia pseudoacacia L.), sea buckthorn (Hippophae rhamnoides L.), and silver grass (Stipa bungeana Trin.); the gully is mainly used for rainfed agriculture and is covered by croplands.
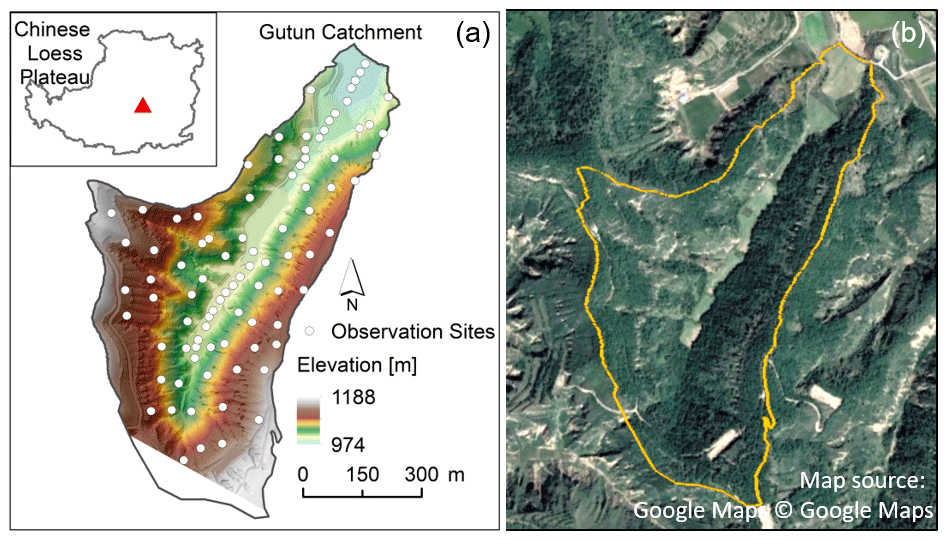
Figure 1(a) Map of the Gutun catchment showing the distribution of the 89 monitoring sites for volumetric soil moisture; (b) a satellite image from © Google Maps (taken in 2020) showing the relatively lush vegetation on the northwest-facing slope. The inset in panel (a) shows the location of the catchment on the Loess Plateau.
3.1 Data collection
Soil moisture was monitored at 89 locations: 64 on the slopes and 25 in the gully (Fig. 1). At each monitoring site, soil samples were collected at 20 cm intervals down to a depth of 500 cm using a 5 cm diameter soil auger, except for some gully sites where saturation limited the depth of augering. Each soil sample was air-dried, crushed, and sieved through a 1 mm mesh. The processed soil samples were analyzed using the laser diffraction technique (Mastersizer3000, Malvern Instruments, England) to determine the sand, silt, and clay contents.
A 500 cm long aluminum neutron probe access tube (CNC100, Probe Technology (Beijing) Co., Ltd, China) was installed vertically into the soil at each of the 89 auger sites. Volumetric soil moisture content (θ, hereafter referred to as soil moisture) was measured monthly at 20 cm intervals from slow-neutron count rates using the revised calibration curve (Wang et al., 2015) based on measurements of the gravimetric soil moisture content and bulk density:
where C is the slow-neutron count rate. Measurement campaigns were carried out monthly between April 2016 and October 2021, except during instrument repairs or severe weather that made measurements impossible. In total, there were 57 measurements per location and depth.
A meteorological station has been taking hourly measurements of precipitation, temperature, relative humidity, solar radiation, and wind speed at 2 m above ground at the Gutun catchment since 2016. The meteorological data from April 2016 to October 2021 (the same period as the soil moisture measurements) were aggregated into monthly values. Monthly potential evapotranspiration (PET) was determined using the FAO Penman–Monteith equation (https://www.fao.org/land-water/databases-and-software/eto-calculator/en/, last access: 5 January 2024) based on these monthly data.
3.2 Data analysis
In our study, we denote each soil moisture measurement as , meaning the soil moisture content θ at monitoring site i, month j, soil depth k, and year n. To represent typical soil moisture conditions and eliminate outliers, we computed the medians for each site i, month j, and soil depth k over all the sampling years and represent these as .
Because of the much higher soil moisture in the gully than on the slopes, we also determined the average soil moisture for each month j and soil depth k, for all gully () and slope sites (), and for the sites on the NW- () and SE-facing slopes (:
where N is the number of gully (N=25), hillslope (N=64), NW-facing slope (N=30), or SE-facing slope (N=34) sites.
We also determined the average soil moisture over 0–100 cm depth (five soil layers) for the gully (), NW-facing slope (), and SE-facing slope () in each month j:
We specifically focused on soil moisture in the top 100 cm, as our analysis of the seasonal variability in soil moisture (see Sect. 4.1) indicated that soil moisture within this depth range exhibited more pronounced seasonal dynamics.
3.2.1 Seasonal variability in soil moisture
To determine the seasonal changes in soil moisture for each site and depth, we calculated the deviation in the soil moisture for a given month from the annual average (i.e., the average over 12 months) for that site and depth. Thus, the seasonal deviation in soil moisture for site i, month j, and soil depth k, , was computed as
Then we similarly determined the average seasonal deviation in soil moisture over 0–100 cm for the gully (), NW-facing slope (), and SE-facing slope () separately for each month j:
where N is the number of gully (N=25), NW-facing slope (N=30), and SE-facing slope (N=34) sites.
We quantified the seasonal changes in soil moisture at each site and depth using the standard deviation (SD) of (σi,k). We identified the depth of the maximum σi,k to determine the depth at which the seasonal changes in soil moisture were the largest. We also identified the depth where σi,k converges to a small value to determine the depth below which seasonal soil moisture changes collapse (i.e., become very small). We defined a collapse threshold based on the minimum σi,k plus 10 % of the difference between the maximum and minimum σi,k for each site. The shallowest depth at which σi,k was less than this threshold was defined as the depth at which the seasonal changes collapse.
3.2.2 Spatial variability in soil moisture at the hillslope scale
We quantified the spatial variability in soil moisture on the hillslopes in two different ways. We calculated how soil moisture at each hillslope site differed from the hillslope average for the same month and depth. Thus, the spatial deviation in soil moisture for slope site i, month j, and soil depth k () was computed as
where is the average soil moisture for all slope sites in month j and soil depth k as described above. The average of this spatial deviation in soil moisture over 0–100 cm depth (five soil layers) was calculated for each hillslope site i in month j as
The overall spatial variability in soil moisture across the hillslopes, for each month and depth, was also quantified using the standard deviation. The spatial variability of soil moisture in month j and soil layer k across the hillslopes was described by the SD of (σj,k). We used σj,k and to explore the relationship between the spatial variability in soil moisture and the average soil moisture across the hillslopes.
3.2.3 Annual soil moisture storage change
The annual soil moisture storage change (ΔS) reflects the balance between incoming precipitation (P), evapotranspiration (ET), deeper percolation, and lateral flow. The annual change in soil moisture storage at site i and depth k, ΔSi,k, was computed as
where Δθi,k is the difference in soil moisture at site i and depth k between the wettest and driest months, d=20 is the soil thickness for each layer k, and the factor of 10 converts this sampling interval from centimeters to millimeters. We defined the wettest and driest months (October and June, respectively) as those with the highest frequency of the maximum and minimum soil moisture (averaged from 0 to 500 cm) across all the sites. Thus, the same “wettest” and “driest” months were used for all the monitoring sites despite some site-to-site differences in the seasonal patterns of soil moisture. Lastly, the total soil moisture storage changes from depth k1 to depth k2 at sampling site i, ΔSi, can be defined as
3.2.4 Relation to topography
We selected aspect and TWI as the possible topographic controls on the monthly soil moisture patterns across the hillslope. We calculated aspect and TWI from a digital elevation model (DEM) of the Gutun catchment, produced from an uncrewed aerial vehicle lidar scan with a 0.5 m resolution. The DEM was smoothed to a 10 m resolution to eliminate the effects of microtopography, and TWI and aspect were determined in the SAGA GIS platform. We used Spearman rank correlation to determine the correlation between TWI and soil moisture at a location, month, and depth ().
To determine the effect of slope aspect on soil moisture, we calculated the incoming solar radiation for each monitoring site using the Points Solar Radiation tool in ArcGIS. We calculated the statistical significance of the difference in both the incoming solar radiation and the soil moisture deviation (0–100 cm average, ) between NW- and SE-facing slopes using one-way ANOVA.
4.1 Seasonal changes in soil moisture
The seasonal changes in the average soil moisture for each depth for the hillslope () and gully () are shown in Fig. 2. In general, the soils in the gully were much wetter than those on the slopes (see also Fig. 3) due to gravity-driven lateral convergence of near-surface flow (Fan et al., 2019). On the slope and in the gully, soil moisture varied seasonally in the shallow soils but remained roughly constant in the deeper soils (Figs. 2 and 3). On the slopes, the shallow soils were, on average, wetter than the deep soils from November to January and drier than the deep soils from May to July (Fig. 2a). However, for 53 out of the 64 slope sites, the shallow soils remained wetter than the deeper soils, even though they tended to dry down from May to July. In the gully, in contrast, the deep soils remained wetter than the shallow soils throughout the year (Fig. 2b). This is also seen in the vertical patterns of the average moisture content on the slopes () and in the gully () (Fig. 3). Soil moisture on the slopes varied more with depth in the wettest month than in the driest month (Fig. 3a). In the wettest month, the average soil moisture on the slopes was ∼12 % at the surface (20 cm) and increased to ∼15 % at a depth of 60 cm, followed by a gradual decrease to ∼11 % at a depth of 240 cm and a slight increase to ∼13 % from 240 to 500 cm depth. In contrast, in the driest month, the average soil moisture on the slopes steadily increased with depth, from ∼7 % at the soil surface to ∼12 % at 500 cm. The vertical pattern of soil moisture in the gully was similar in the wettest and driest months, showing a sharp increase (20–40 cm), a slight decrease during some months (40–140 cm), and a slight increase (140–500 cm) with depth. The moisture content at the surface was ∼20 %, increasing to ∼40 % in deep soils (Fig. 3b).
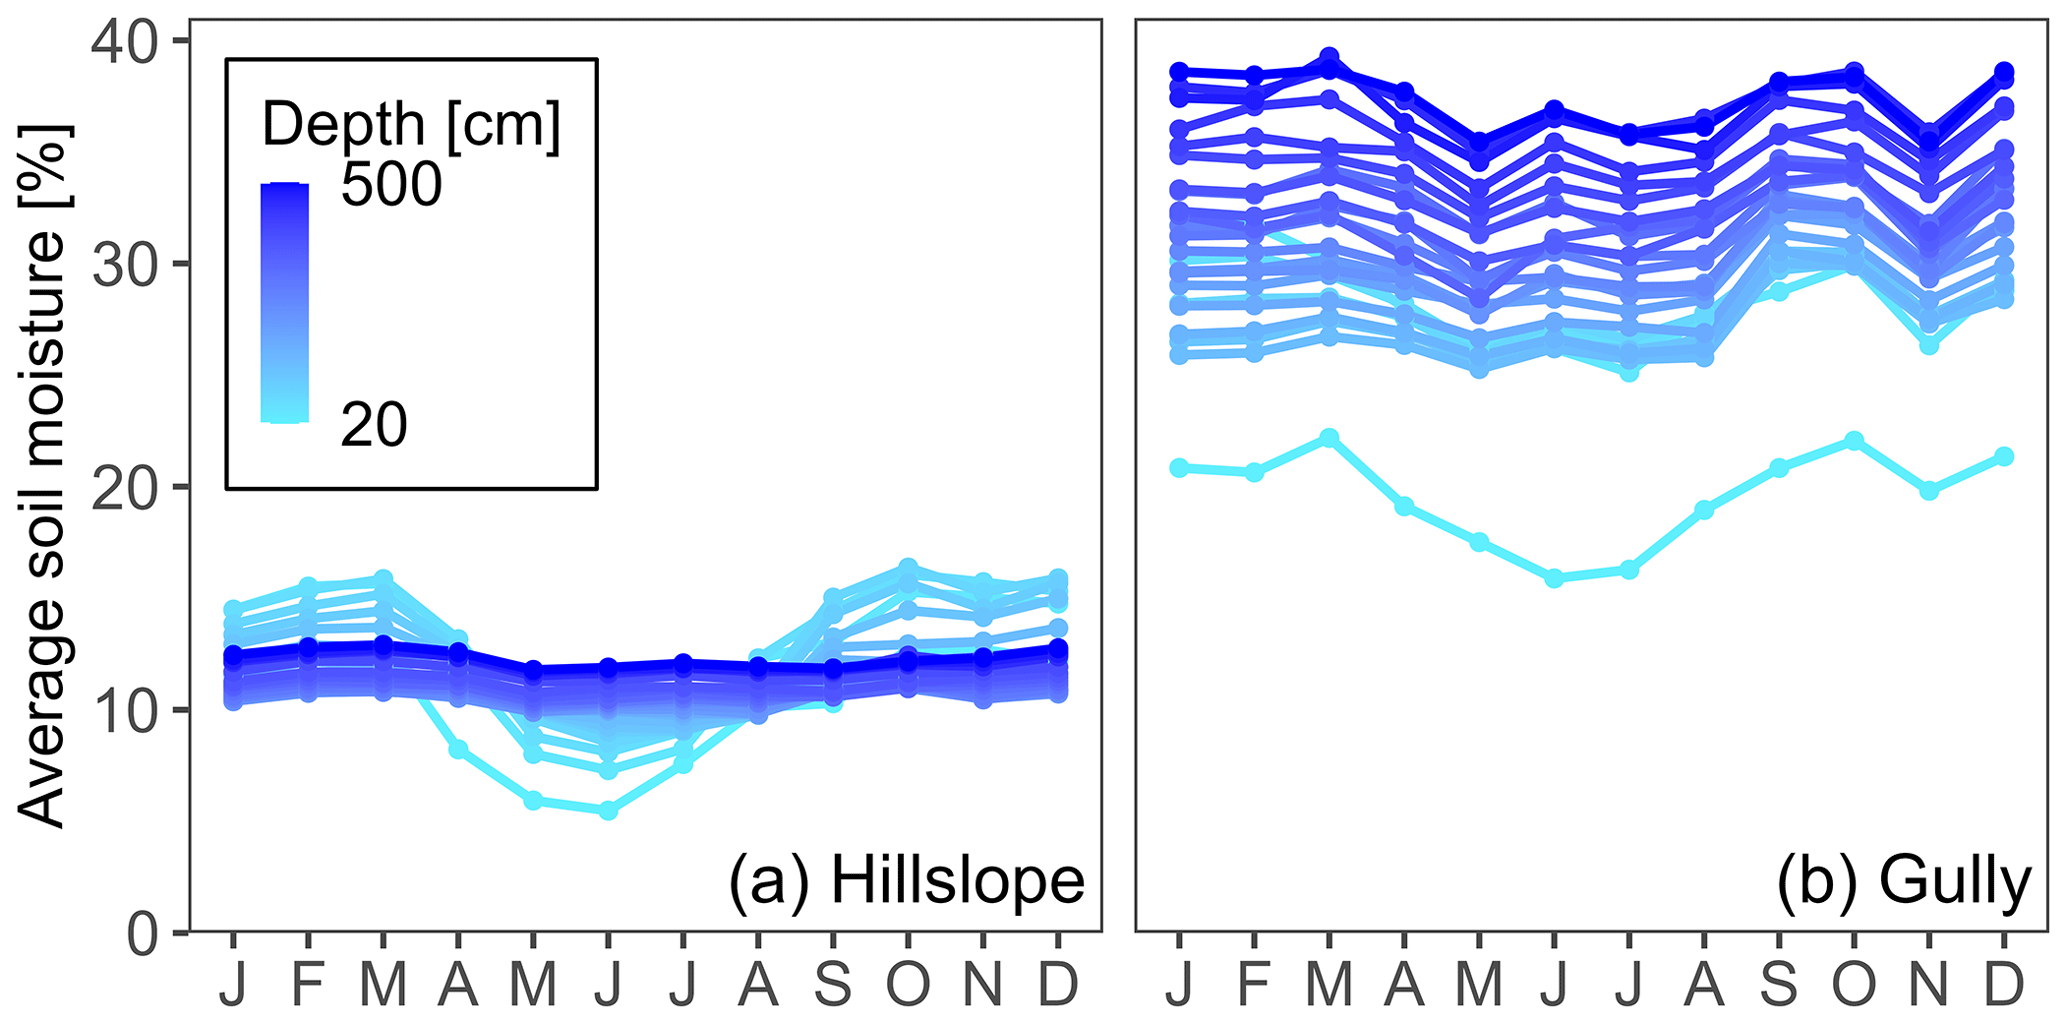
Figure 2Seasonal changes in the average soil moisture for (a) hillslope () and (b) gully () sites. The capital letters on the x axis indicate the months from January (J) to December (D). The light blue and dark blue colors indicate the average soil moisture in the shallow and deep soils, respectively. The soils in the gully were much wetter than those on the hillslopes. The rank order of soil moisture with depth reversed between winter and summer on the hillslopes but exhibited little seasonal variation for the gully.
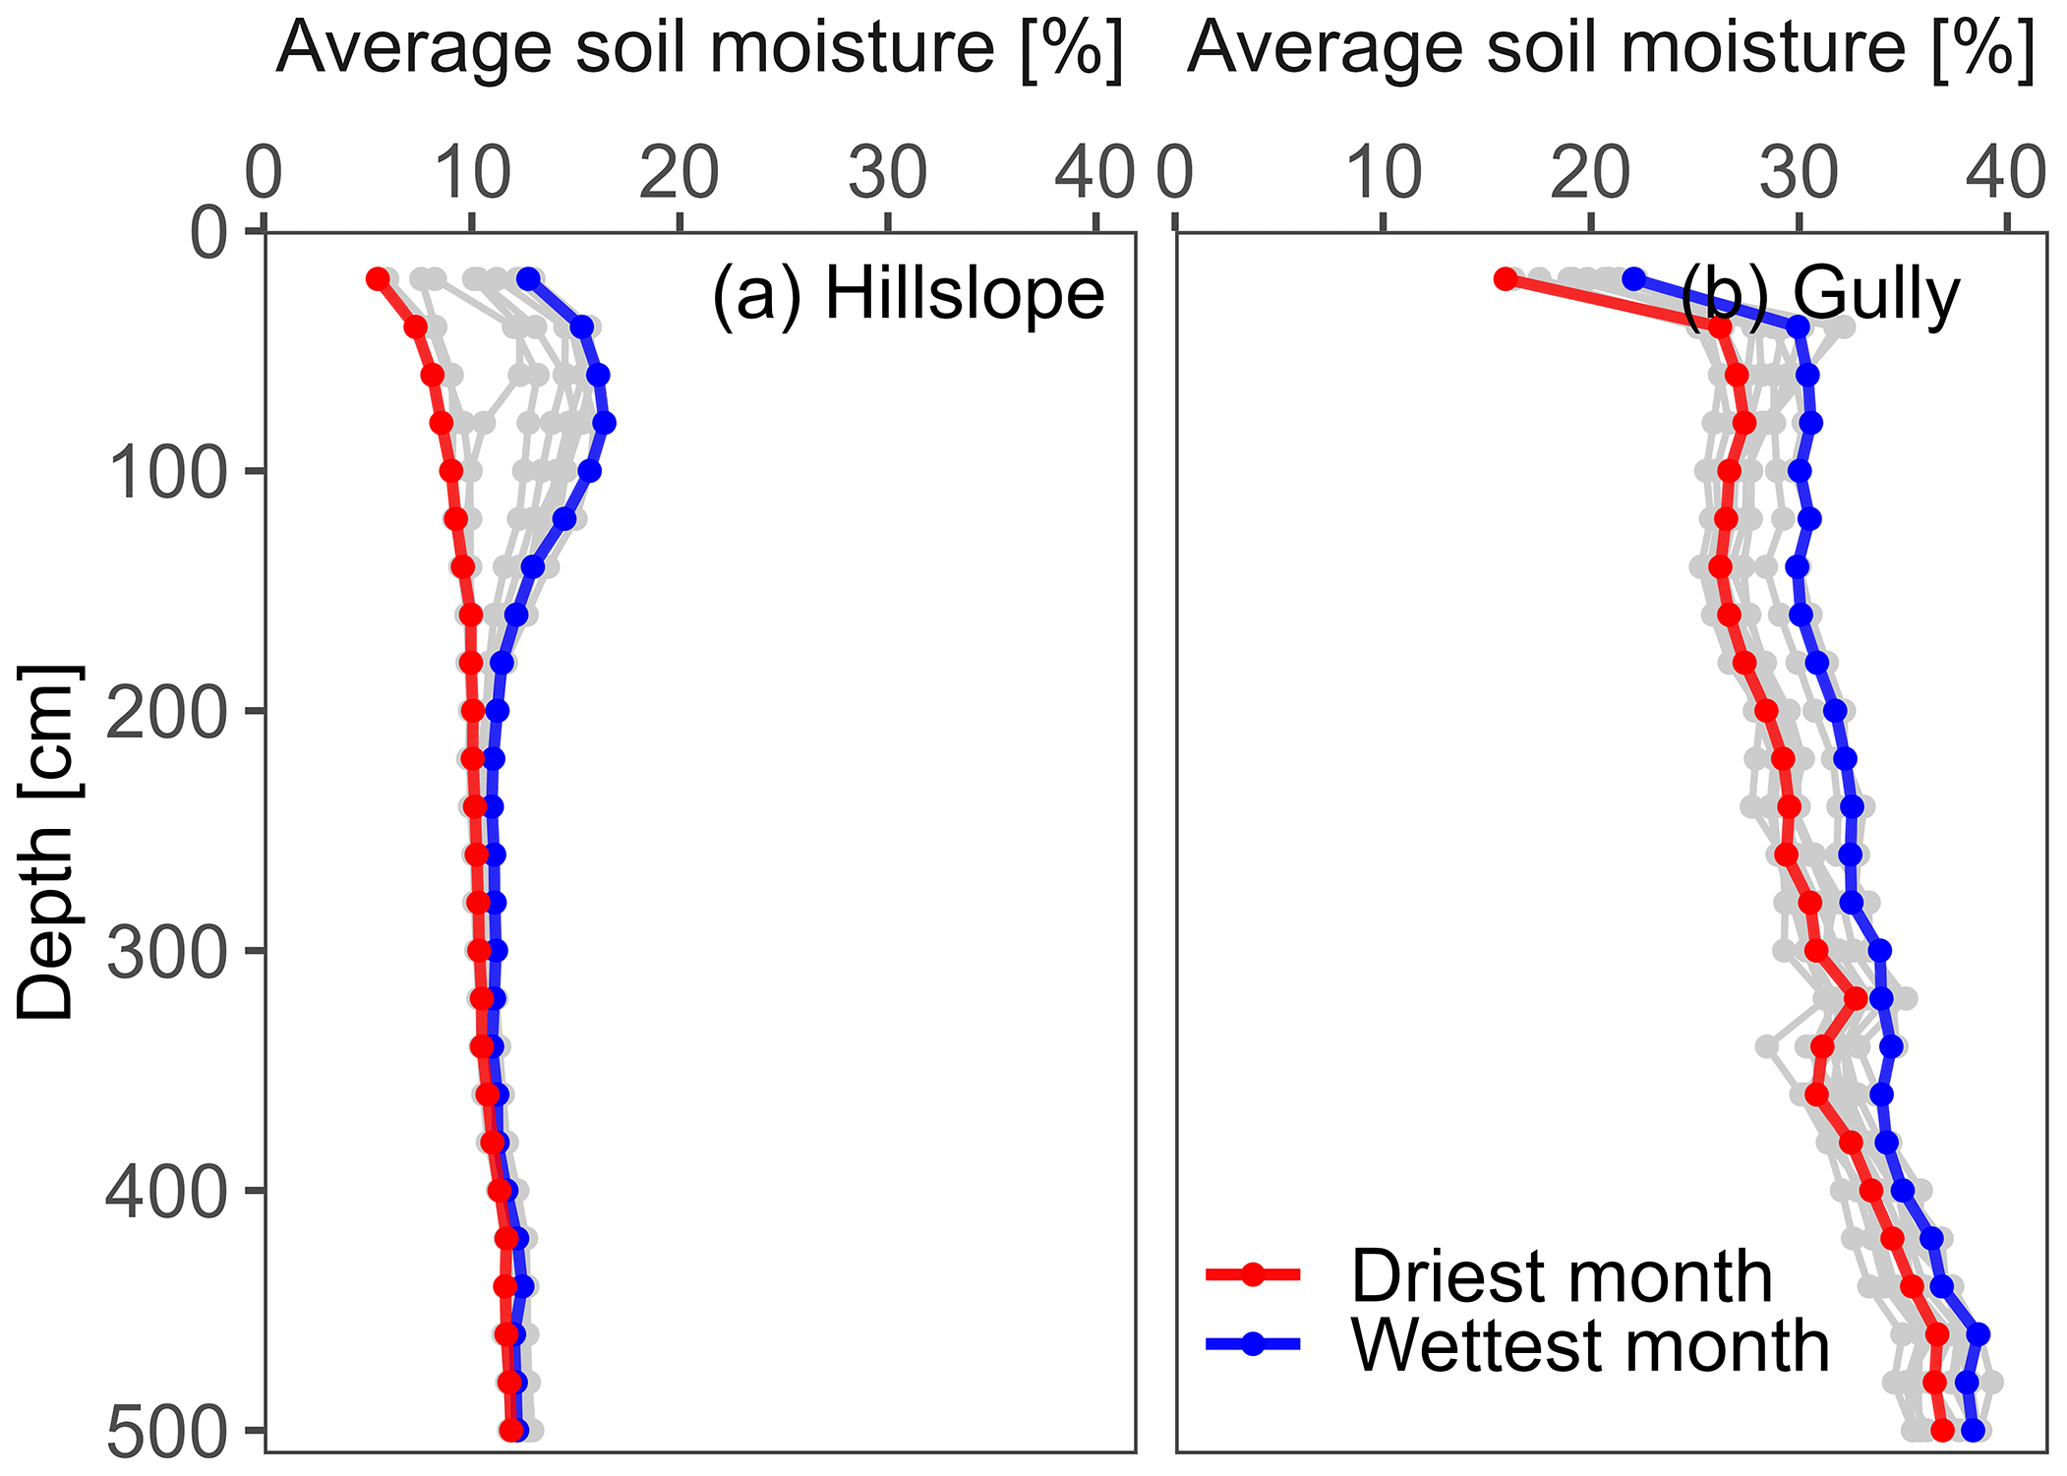
Figure 3The vertical patterns of average soil moisture (a) on the hillslope () and (b) in the gully (). The blue line shows the soil moisture profile for the wettest month (October) and the red line that for the driest month (June). The light grey lines show the profiles for the other 10 months. The soil moisture on the hillslopes varied more as a function of depth in the wettest month than in the driest month, while the profiles in the gully were almost equally steep in the wettest and driest months. Seasonal variations in the average monthly soil moisture content were almost exclusively confined to the upper 260 cm on the hillslopes but persisted over the full range of depths in the gully.
For 94 % of the sites across the catchment, the depth of the maximum seasonal change in soil moisture (i.e., the maximum SD, σi,k) was located between 20 and 100 cm (Fig. 4a). The depth at which it collapsed (as defined in Sect. 3.2.1) was located between 160 and 260 cm for 75 % of the sites (Fig. 4b). This suggests that the seasonal variation in soil moisture in the Gutun catchment is largest for 0–100 cm soils and that there is little seasonal variation below 260 cm. These results are consistent with the findings of several previous studies on the Loess Plateau (Fu et al., 2018; Wang et al., 2010, 2019; Zhao et al., 2020).
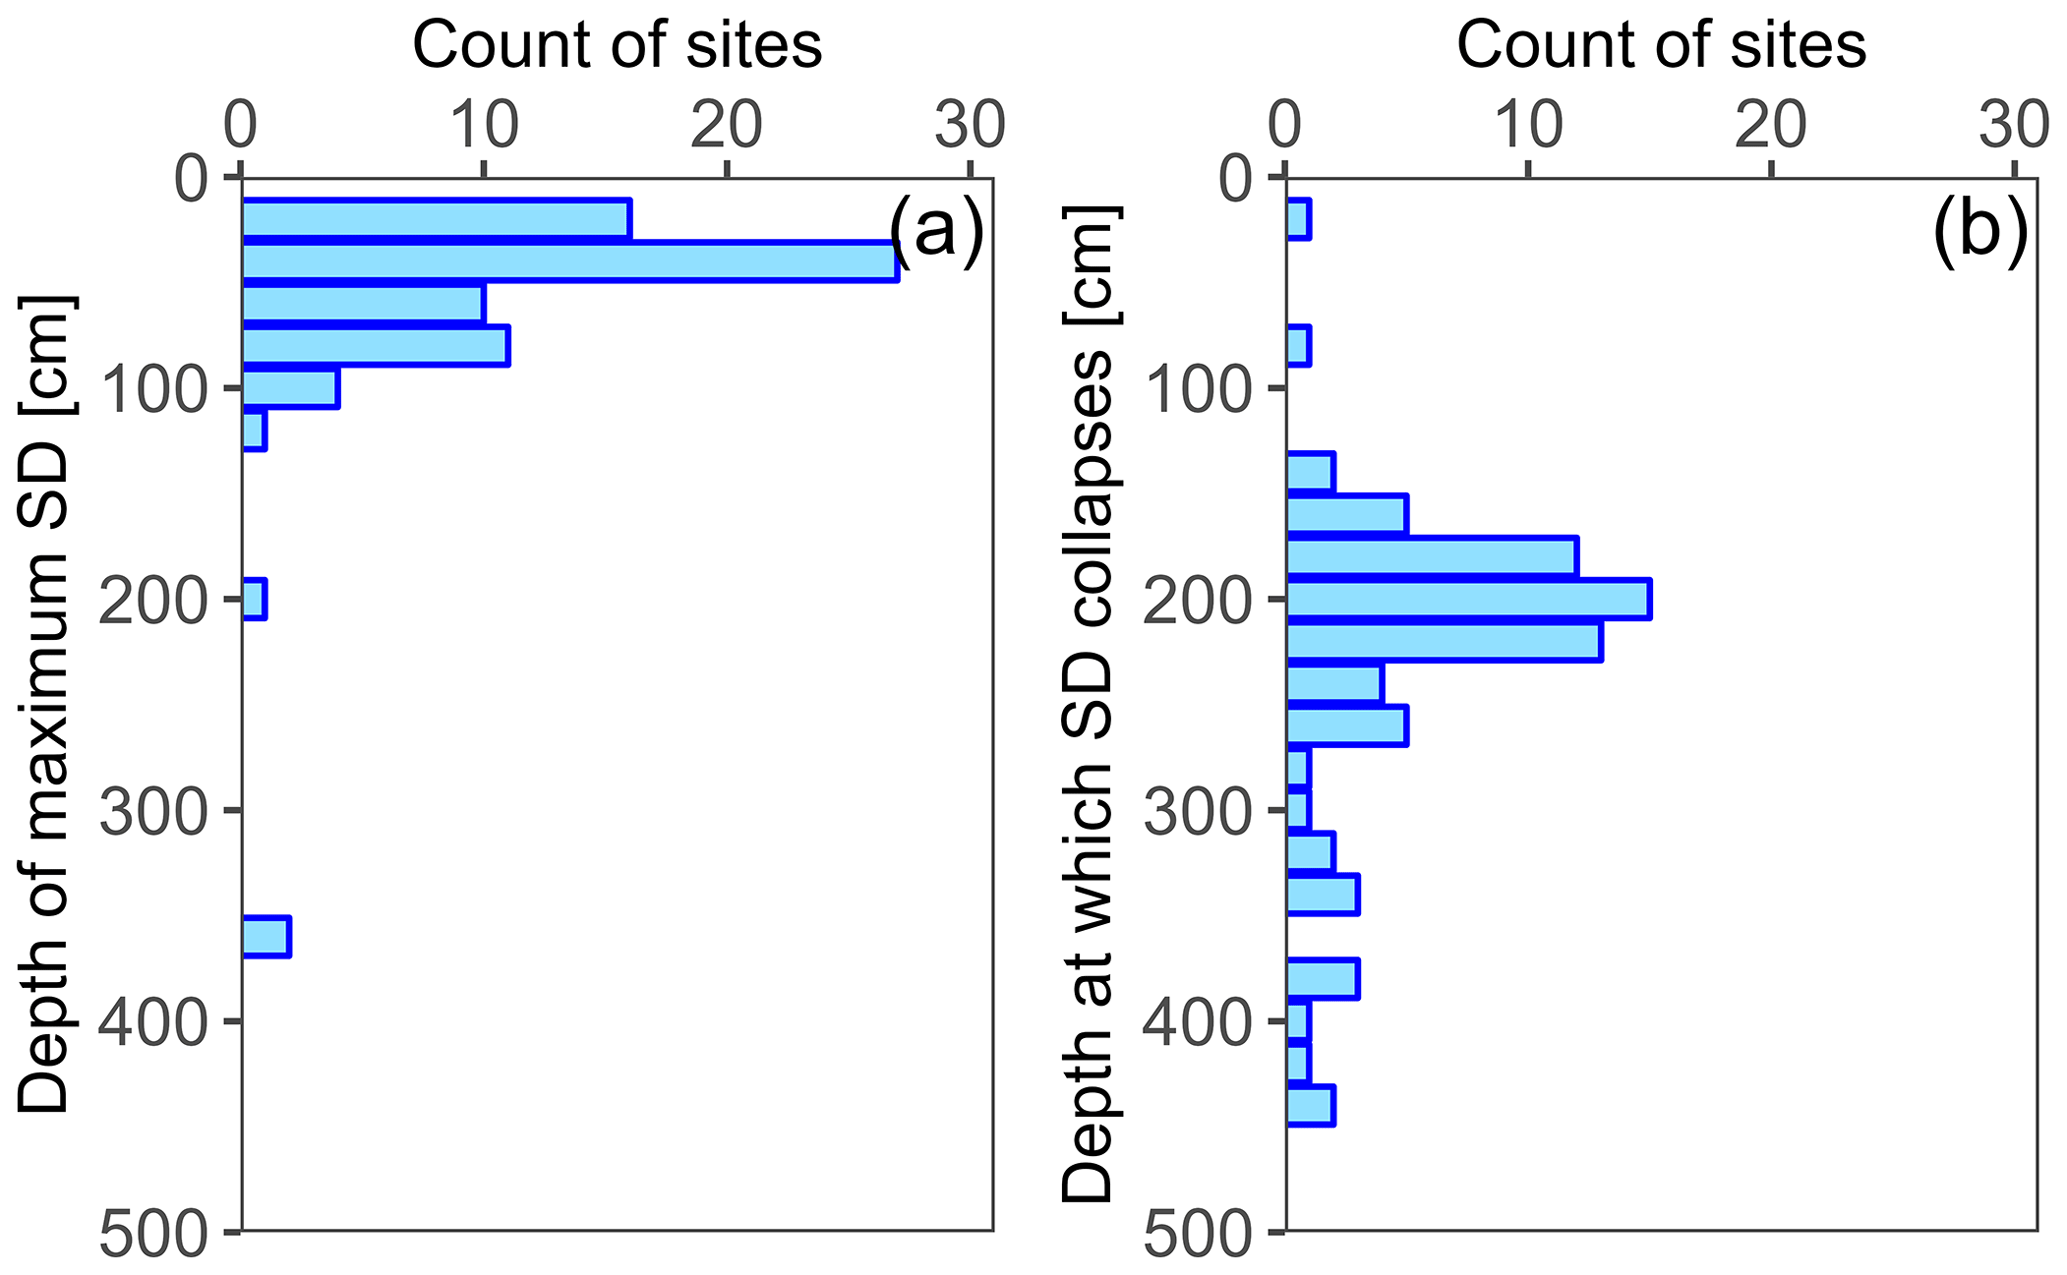
Figure 4(a) Depth of the maximum standard deviation (σi,k) and (b) depth at which the standard deviation (σi,k) collapses (i.e., converges to a small value) for the 72 monitoring sites. The remaining 17 monitoring sites were excluded from the analyses because they had several null values for deeper soils, making it impossible to calculate the depth at which the standard deviation collapses. The depth of the maximum standard deviation was between 20 and 100 cm for 94 % of the sites. The depth at which it collapses was between 160 and 260 cm for 75 % of the sites.
The seasonal patterns in average soil moisture over the top 100 cm for the NW-facing slope, SE-facing slope, and gully sites (, , and and the deviations from their annual averages (, , and ) are illustrated in Fig. 5. Average soil moisture was much higher in the gully than on the hillslopes, and the NW-facing slope was wetter than the SE-facing slope throughout the year (Fig. 5a). The seasonal cycle was also larger on the NW-facing slope than on the SE-facing slope and was smallest in the gully (Fig. 5b). Thus, seasonal changes in soil moisture were more pronounced on the slopes than in the gully, especially on the wetter (NW-facing) slope.
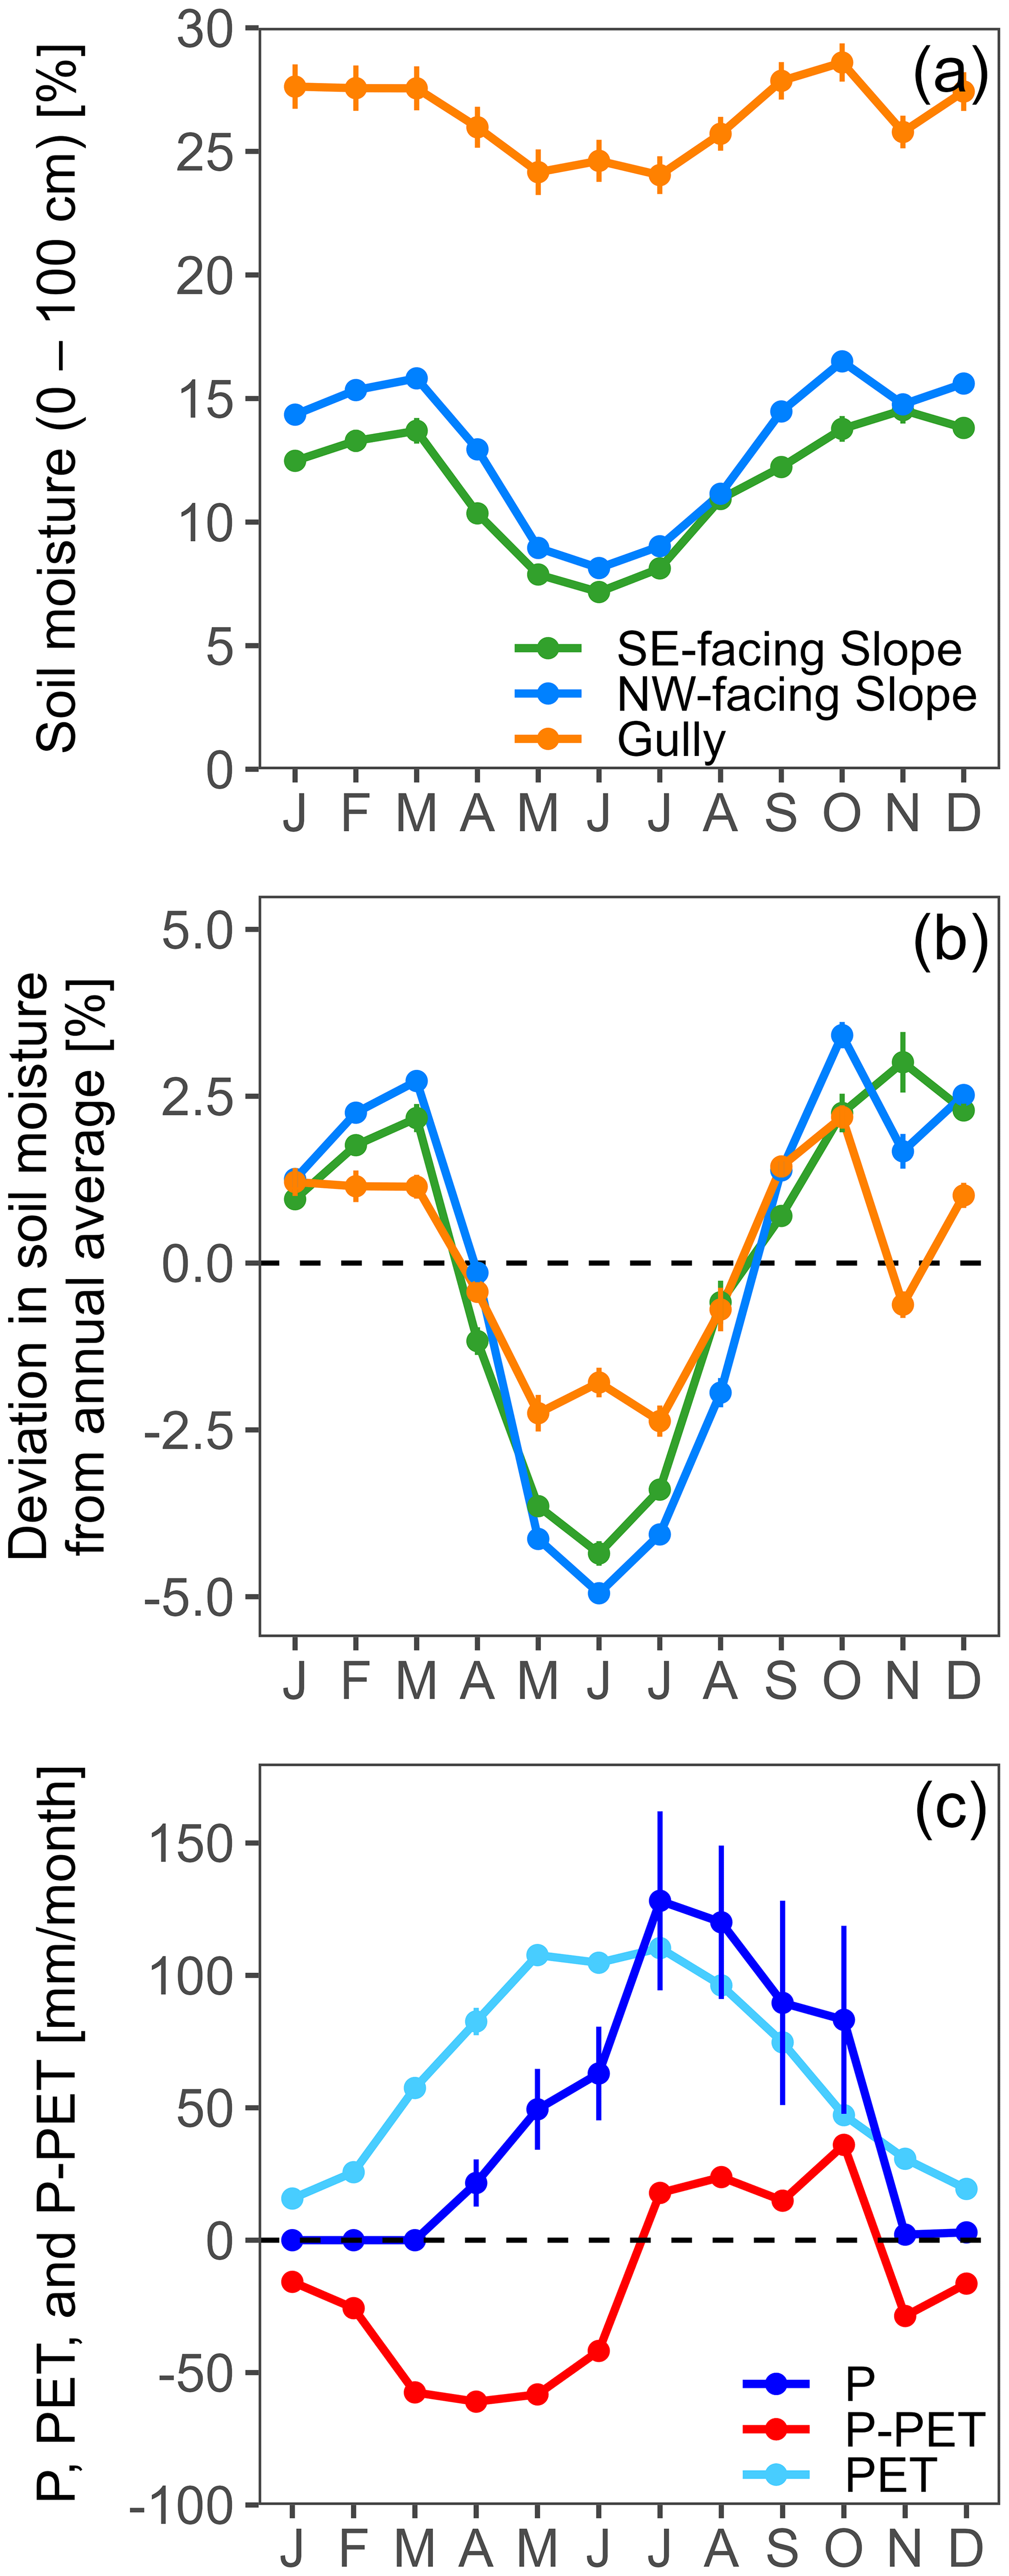
Figure 5(a) Seasonal changes in the average soil moisture in the top 100 cm of soil for the SE-facing slope (), NW-facing slope (), and gully sites (); (b) the deviations from their annual averages (, , and , respectively); and (c) potential evapotranspiration (PET), precipitation (P), and precipitation minus potential evapotranspiration (P−PET) in the Gutun catchment. Error bars in each panel indicate the standard errors. Soil moisture was much higher in the gully than on the hillslopes, with the NW-facing slope being wetter than the SE-facing slope throughout the year (a). The amplitude of the seasonal change in average soil moisture was largest for the NW-facing slope, followed by the SE-facing slope and the gully (b). Soils wetted up most rapidly between July and October (b), the period in which P exceeded PET (c). Soil dry-down occurred between March and June (b), when PET exceeded P by the largest margin (c).
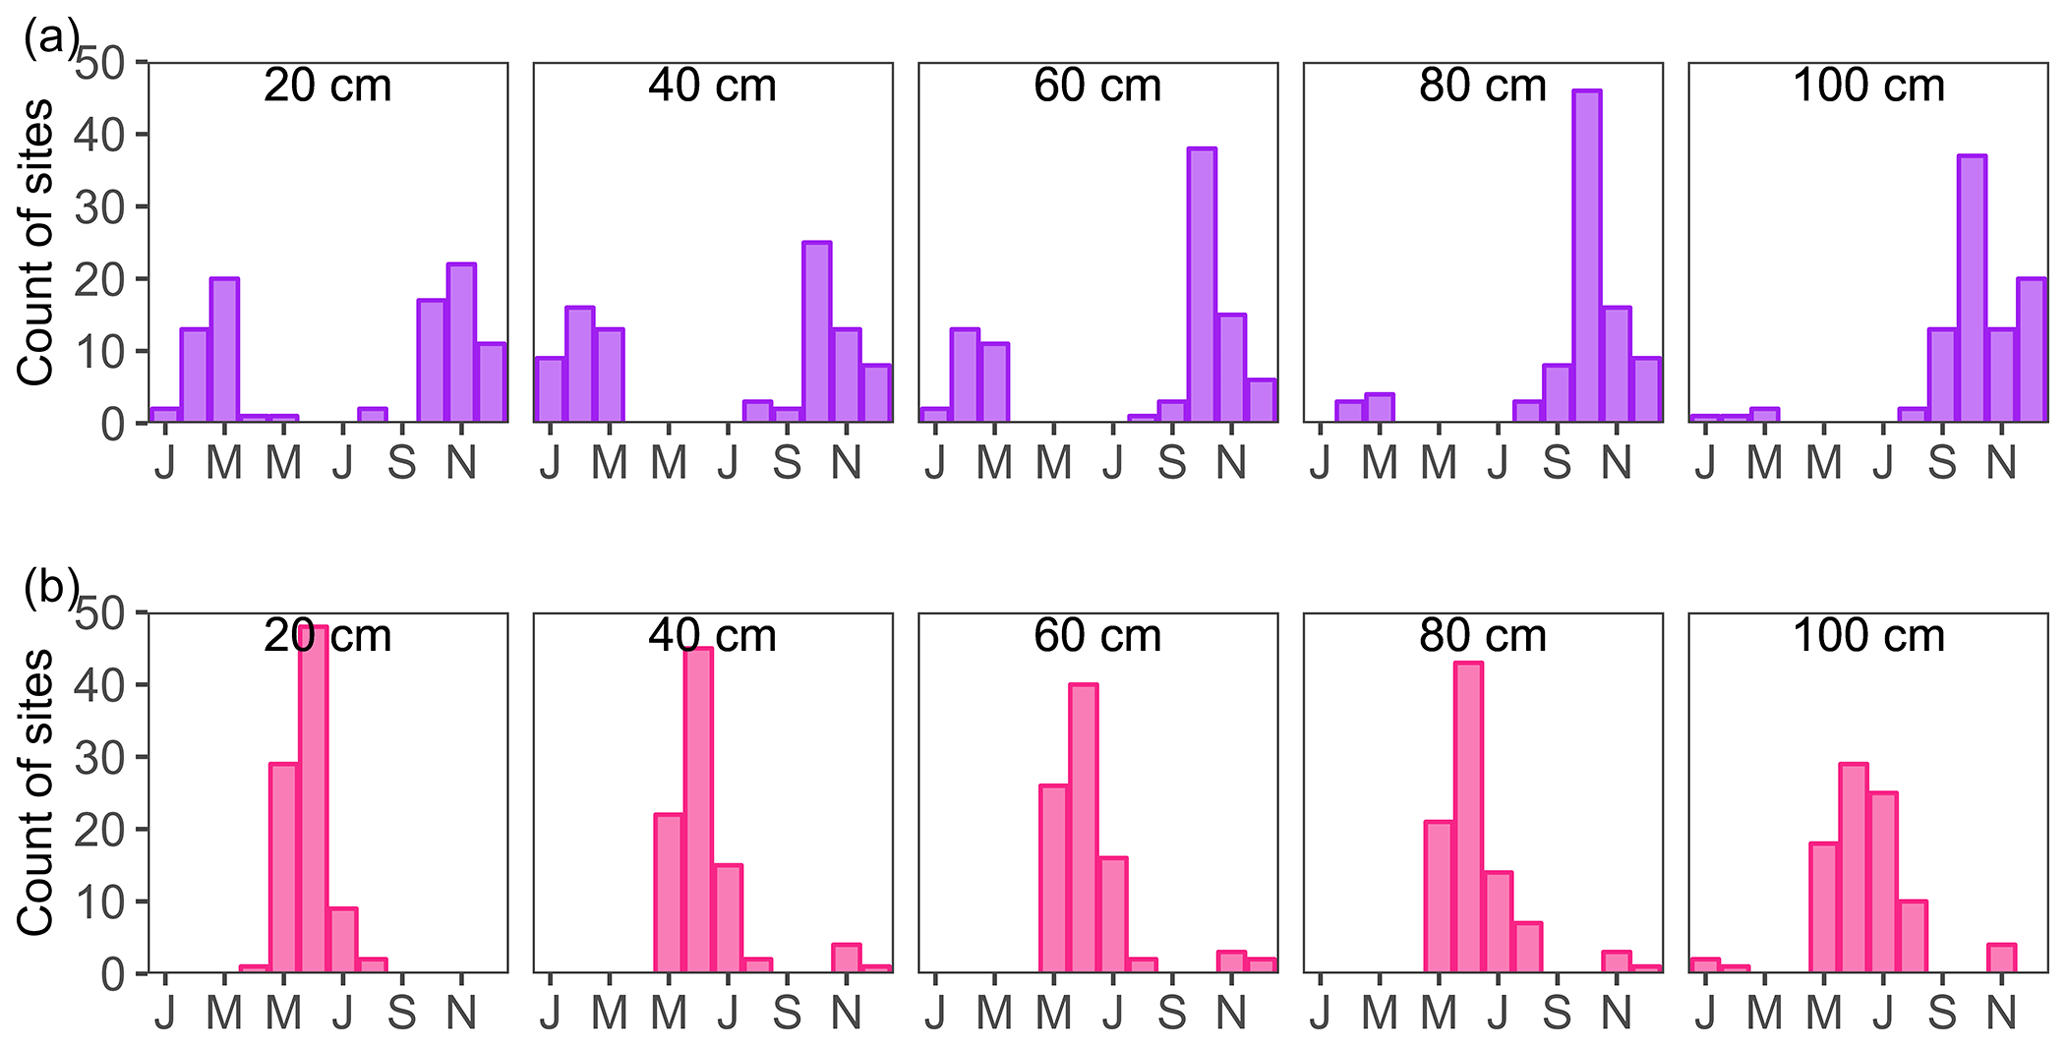
Figure 6Histograms of the month in which the (a) maximum and (b) minimum soil moisture () occurred in each soil layer in the top 100 cm of soil, based on all 89 monitoring sites across the catchment. Letters on the x axis indicate the odd-numbered months from January (J) to November (N); even-numbered months are not labeled due to space limitations. At 20–60 cm depth, the maximum soil moisture occurred mainly between October and March (but not in January), while at 80–100 cm depth it occurred mainly between September and December. The minimum soil moisture values occurred mainly in May, June, and July, regardless of depth.
Similar to the findings of Grayson et al. (1997), two dominant conditions for 0–100 cm soil moisture were identified: wet (October to March) and dry (May to July), with a wet-to-dry transition in April and a dry-to-wet transition between August and September (Fig. 5a and b). Together with the tallied histograms of the months in which the annual maximum and annual minimum soil moisture occurred for each soil layer (Fig. 6), these results suggest that soil moisture in the top 100 cm of the soil was at a minimum in the late spring and early summer, increased to a maximum during mid-autumn, and remained relatively wet until early spring. The period during which the 0–100 cm soils wetted up most rapidly (July to October; Fig. 5a and b) coincided with the months in which P exceeded PET (Fig. 5c). The period of soil dry-down (March to June; Fig. 5a and b) also coincided with the months during which PET exceeded P by the largest margin (Fig. 5c). These results are consistent with many studies worldwide that have found an association between seasonal patterns in soil moisture and imbalances between P and PET (Dymond et al., 2021; McNamara et al., 2005; Peterson et al., 2019; Singh et al., 2019; Tromp-van Meerveld and McDonnell, 2006; Williams et al., 2009), even though the soil moisture content and the duration of the wet and dry states at our site differed markedly from those in previous studies.
4.2 Spatial pattern in soil moisture
In general, the spatial variation in soil moisture in the top 100 cm of soil on the slopes () was smaller under dry conditions from May to July and larger under wet conditions from October to March (Fig. 7). This suggests that soil moisture was more homogenous under dry conditions and more heterogeneous under wet conditions. There was a roughly linear relationship between the spatial SD (σj,k, as a measure of spatial variability) and the spatial average soil moisture for the slope sites () (Fig. 8). At each depth within the top 100 cm of soil, and also for the profile average, the SD increased linearly with increasing average soil moisture (R2>0.71).
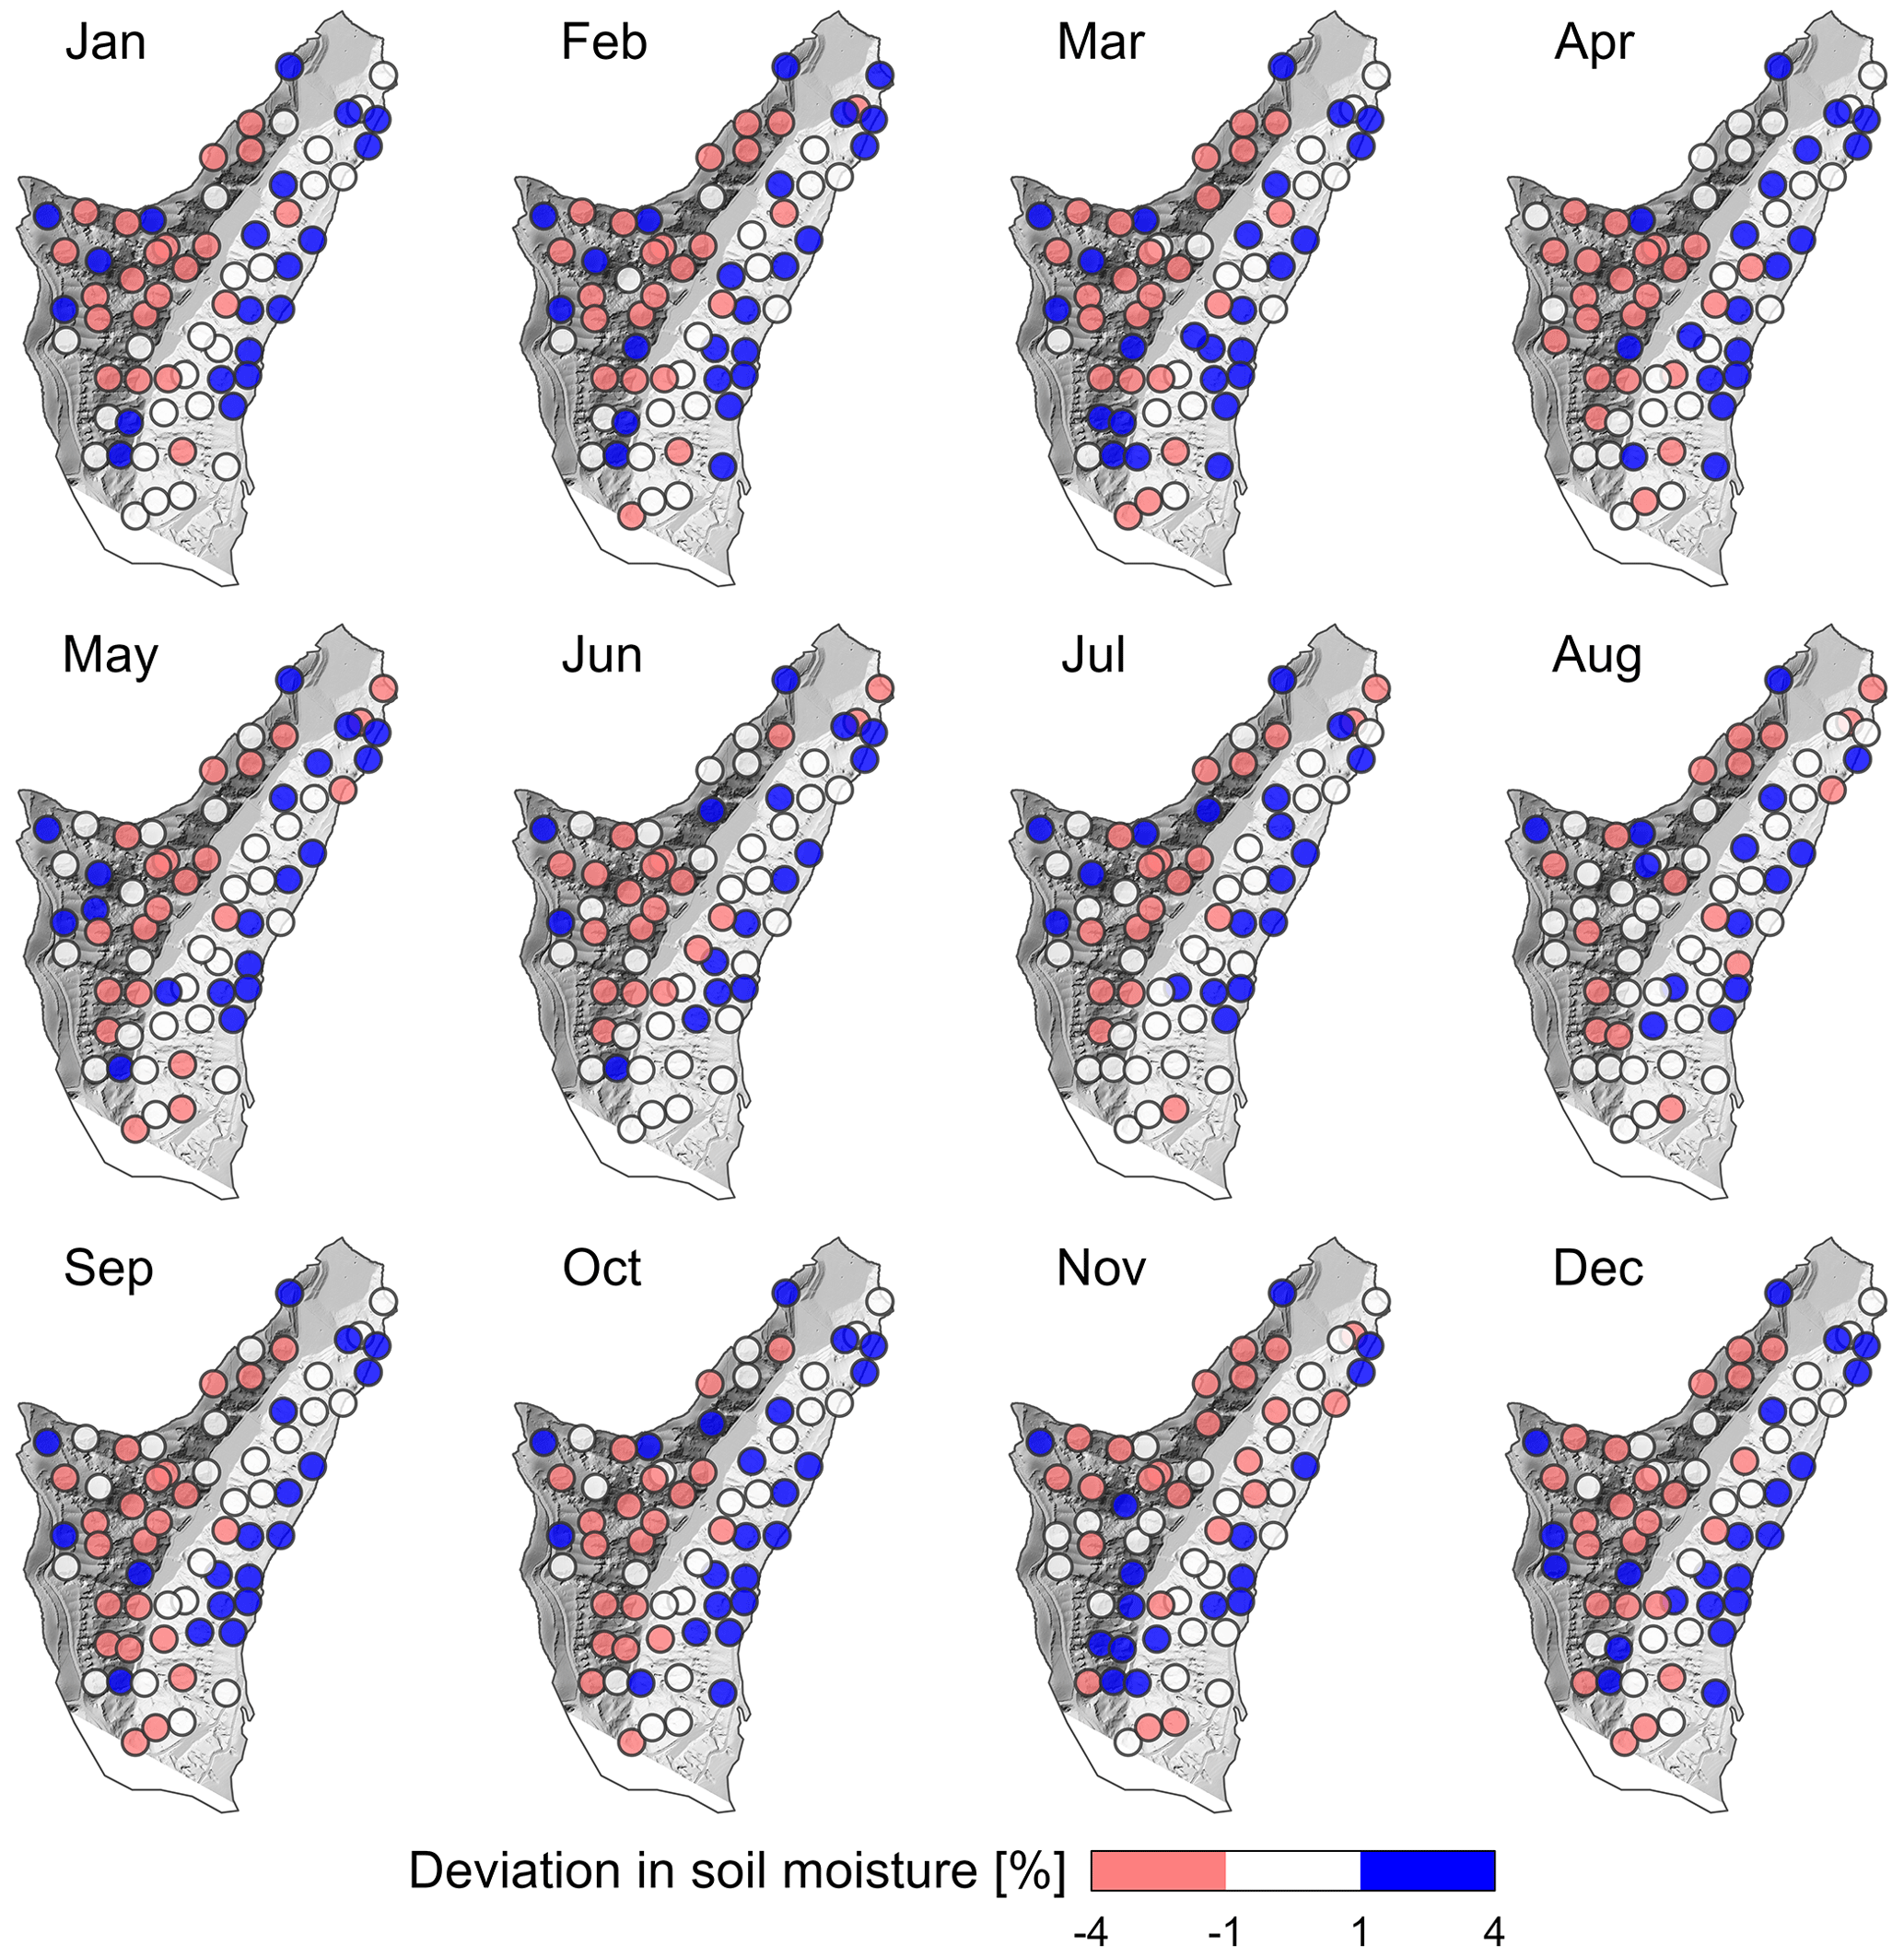
Figure 7Deviations in soil moisture at 0–100 cm () from the monthly average soil moisture for the hillslope sites. The white color indicates small deviations from the average soil moisture (values from −1 to 1). Dark blue and light red indicate soil moisture above and below the average, respectively. The underlying base map is a shaded relief map helping to distinguish between the NW- and SE-facing slopes. The darker grey in the base map indicates the SE-facing slope, and the lighter grey indicates the NW-facing slope. The spatial variation in moisture content was smaller under the dry conditions (with more locations in white color) from May to July and larger under the wet conditions from October to March. The NW-facing slope was wetter, on average, than the SE-facing slope under both wet and dry conditions.

Figure 8Relationships between the monthly spatial standard deviation (σj,k) and monthly average soil moisture at slope sites () for each depth within the top 100 cm of soil and for the profile average. Each point represents a different month of the year. The lines were fitted using a simple linear regression (R2: 0.71–0.83). The standard deviation increased roughly linearly with increasing average soil moisture across hillslope sites.
The most widely reported model for describing the relation between the spatial heterogeneity in soil moisture and mean soil moisture is a convex-upward parabola, with spatial variability peaking at intermediate values of soil moisture content (at approximately 20 %) (Brocca et al., 2010; Famiglietti et al., 2008; Jarecke et al., 2021; Peterson et al., 2019; Tague et al., 2010; Western et al., 2003). This convex parabola has been observed in loess catchments as well (Gao et al., 2011, 2015; Shi et al., 2014), where spatial variability peaked at 15 %–20 % soil moisture content. In a similar loess system, Hu et al. (2011) found that the spatial variability increased slightly with increasing soil moisture, even under wetter conditions (20 %–25 %), indicating that a natural logarithmic curve might better describe the relationship between the spatial variability and average soil moisture. In the Gutun catchment, the average soil moisture was mainly between 5 % and 15 %, which means that we may have observed only the short rising segment of a convex parabola below the variability peak or the middle section of a logarithmic curve.
Figure 7 also reveals a spatial pattern in soil moisture, with the NW-facing slope being much wetter than the SE-facing slope, which was also seen in Fig. 5a and is quantified in more detail (including the significance test) in Fig. 9. During the wet months (October to March, except for November), the NW-facing slope is markedly wetter than the SE-facing slope, while during the dry months (May to July), the difference is less distinct (Fig. 9a). The observed pattern is consistent with seasonal differences in the solar radiation reaching the two hillslopes (Fig. 9b). The topography of the catchment creates variations in the local solar angle and thus in the total solar radiation received at the surface, leading to topographically driven variations in soil drying (Fan et al., 2019; Hoylman et al., 2019; Pelletier et al., 2018; Williams et al., 2009). During the summer months, the higher solar angle in the Northern Hemisphere weakens the effect of aspect on solar radiation reaching the surface, leading to smaller differences in evaporation and thus a more consistent soil moisture between the two hillslopes at the Gutun catchment. Hu et al. (2017) and Gao et al. (2016) showed a similar pronounced impact of aspect on soil moisture patterns in other catchments in loess landscapes.
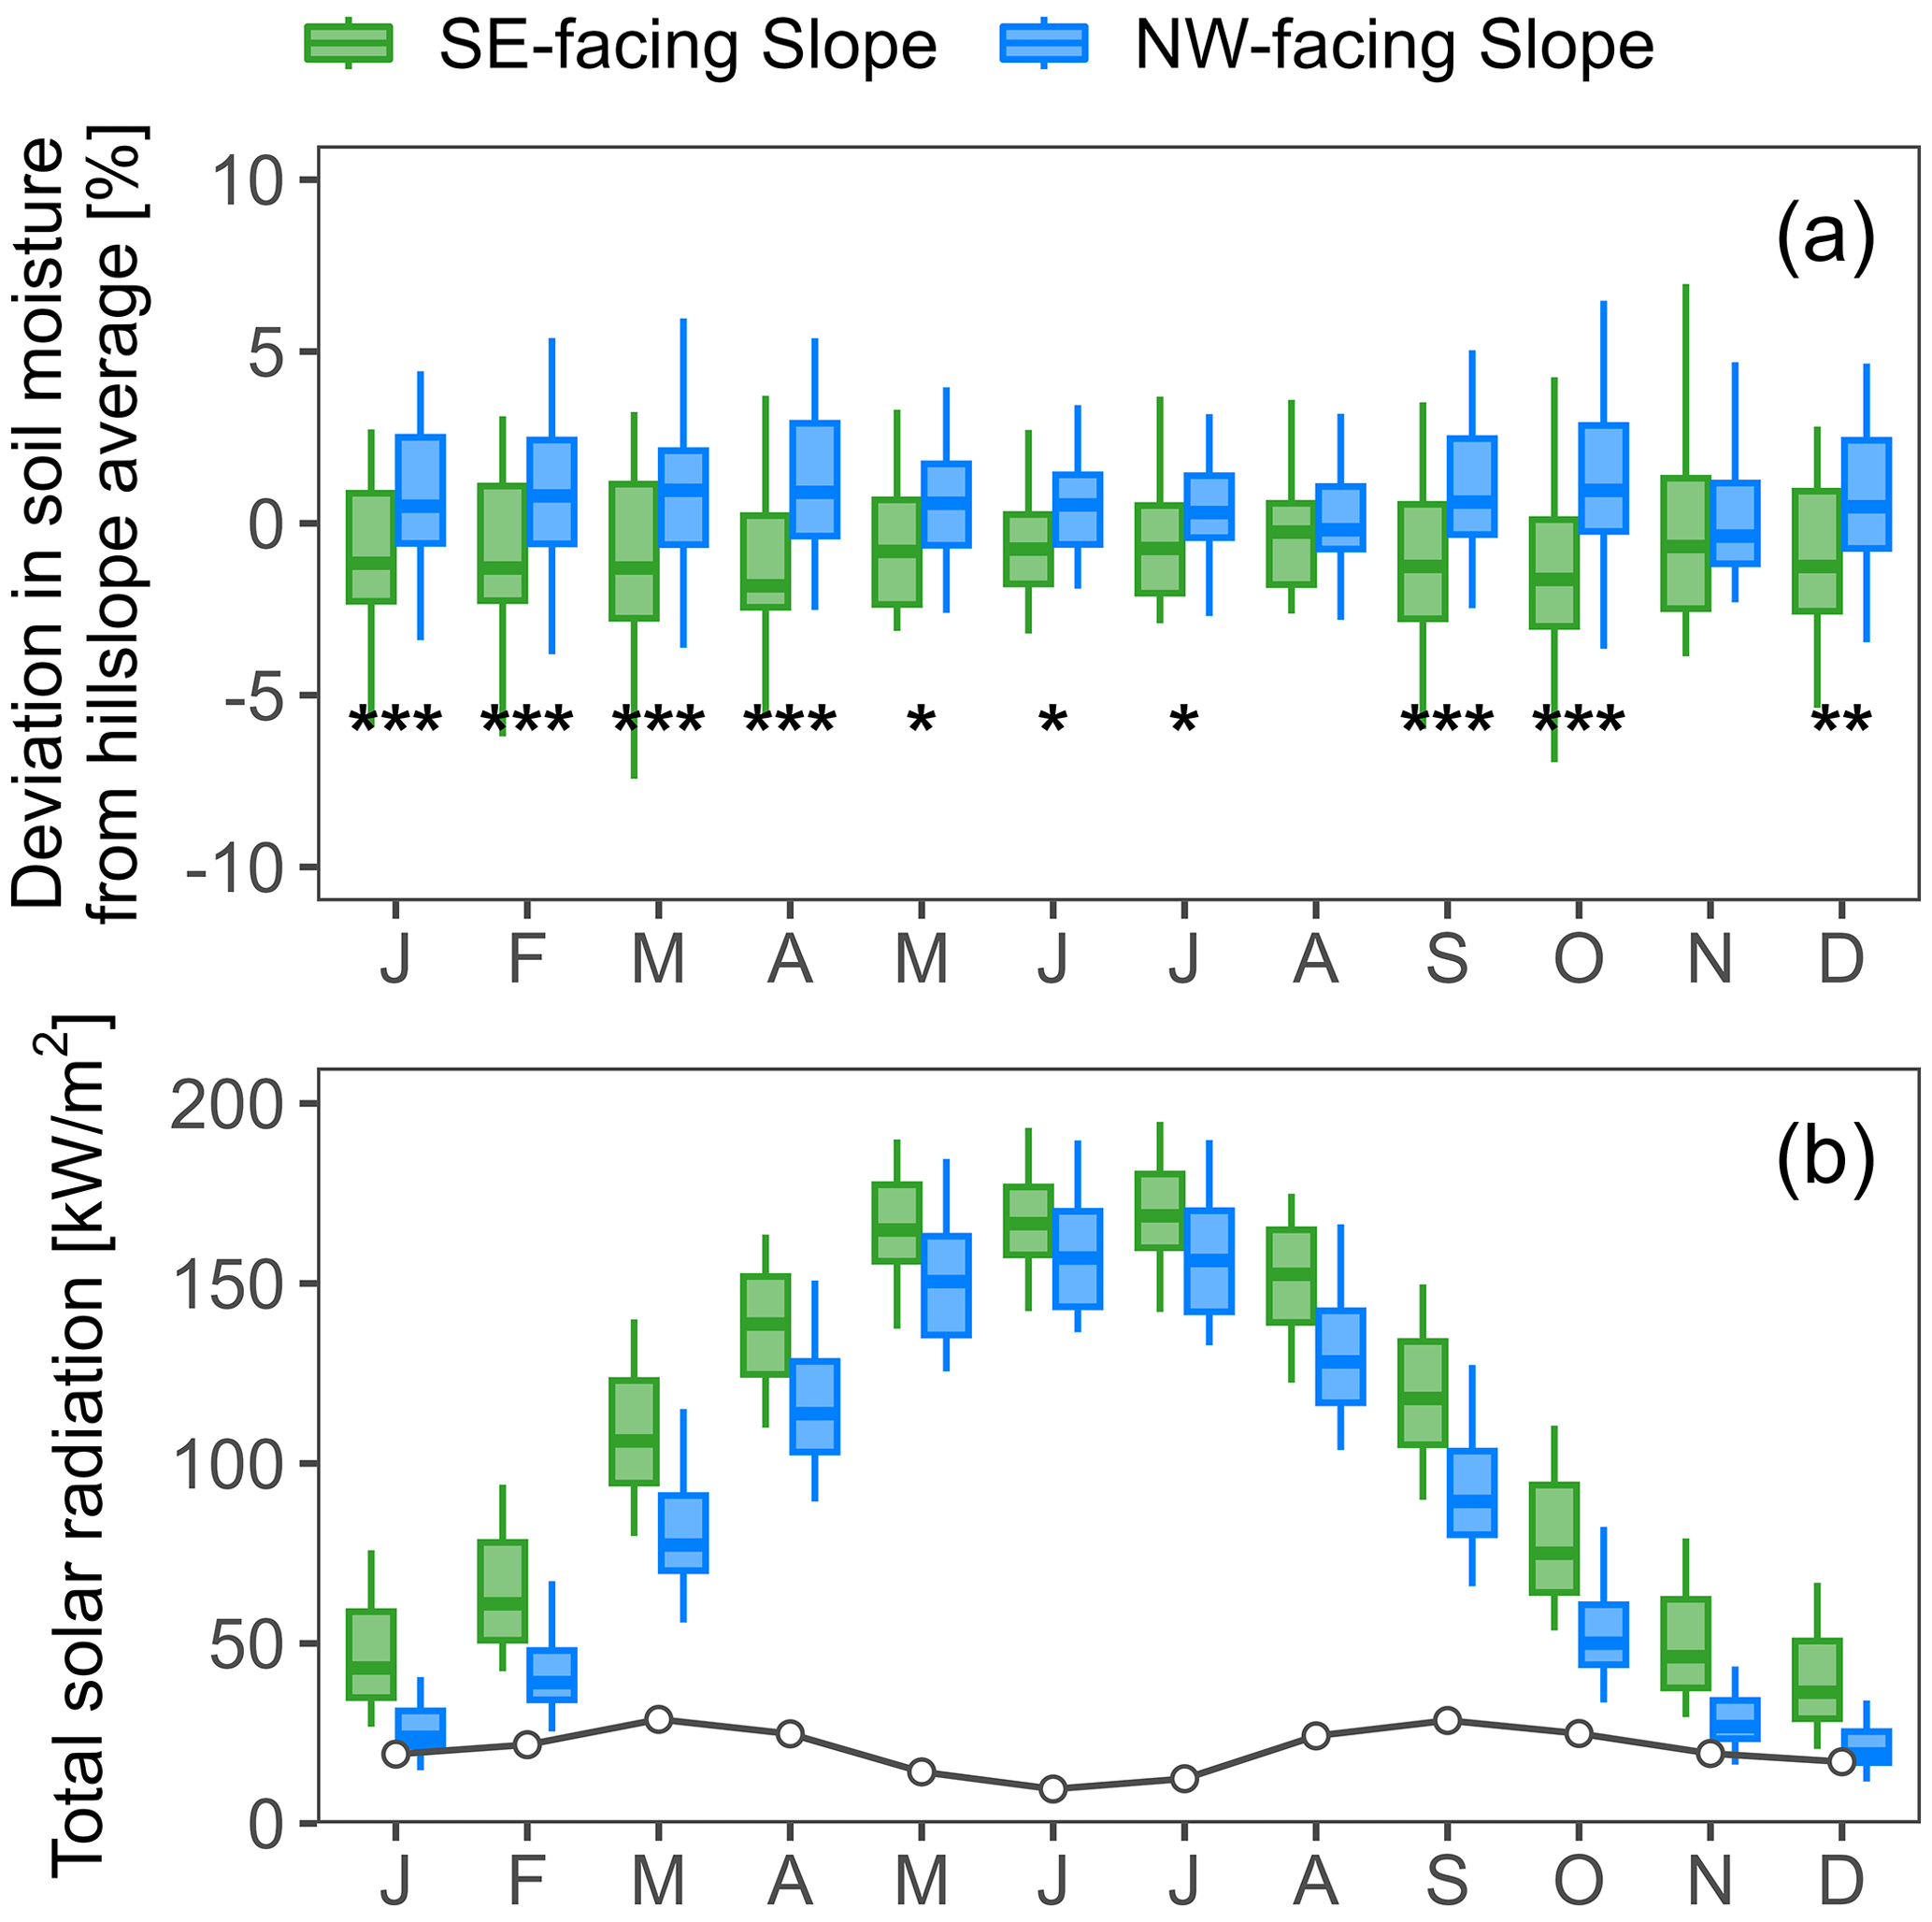
Figure 9(a) Seasonal patterns in volumetric soil moisture differences in the top 100 cm between the SE-facing and NW-facing slopes () and (b) solar radiation reaching the two hillslopes. In panel (a), *, **, and *** denote statistically significant differences at the α=0.05, 0.01, and 0.001 levels, respectively, determined by one-way ANOVA. The black line in panel (b) indicates the seasonal trend of the differences in the total solar radiation for the two hillslopes. Differences in solar radiation and soil moisture between the two hillslopes are smaller during the summer than during the rest of the year.
In contrast to findings elsewhere (e.g., Geroy et al., 2011; Gutiérrez-Jurado et al., 2007), the difference in soil moisture content between the NW- and SE-facing slopes is unlikely to be driven by differences in soil texture and related differences in water retention. Soil texture at the loess catchment is highly uniform. For the 64 sites on the slopes, the coefficients of variation for 0–100 cm average clay and silt contents were only 0.15 and 0.07, respectively. The average clay and silt contents in the 0–100 cm soils of the NW-facing slope were <1 % higher than those of the SE-facing slope. Thus, we do not think that spatial variations in soil properties are an important driver of the soil moisture spatial patterns at the Gutun catchment.
Some previous studies (e.g., Western et al., 2003) have reported that soil moisture patterns are predominantly shaped by topographic convergence (i.e., nonlocal control) and that this effect is stronger during the wet season. In contrast, the soil moisture pattern on the hillslopes at our catchment was primarily shaped by aspect (i.e., local control) and was persistent under both wet and dry conditions (Figs. 7 and 9). We found no statistically significant correlation (α=0.05) between TWI and soil moisture on the hillslopes for any soil depth or averaged over the top 100 cm of the soils in each month. Note that we focus on the relationship between TWI or aspect with soil moisture patterns at the hillslope scale, excluding the gully. At the catchment scale, soil moisture is markedly higher in the gully (Figs. 2 and 3), consistent with the high TWI values there. Topographic effects on soil moisture patterns are typically mediated by lateral flow (Grayson and Western, 2001), but such flows are unlikely to be dominant at the Gutun catchment due to the absence of impermeable bedrock or confining layers in the thick and homogeneous loess deposits. Therefore, as a typical proxy of topography, TWI is probably not a suitable index for explaining the soil moisture pattern on the hillslopes in such systems (Dymond et al., 2021).
4.3 Annual soil moisture storage change
Spatial patterns of annual soil moisture storage change (ΔS) at depths of 0–100, 100–200, and 200–300 cm are illustrated in Fig. 10. The average ΔS that we measured in the 0–300 cm soils for the entire catchment was 110 mm. This is broadly similar to the water balance estimate (Table 1), suggesting that the top 300 cm of soil accounts for most or all of the seasonal water storage in the Gutun catchment.
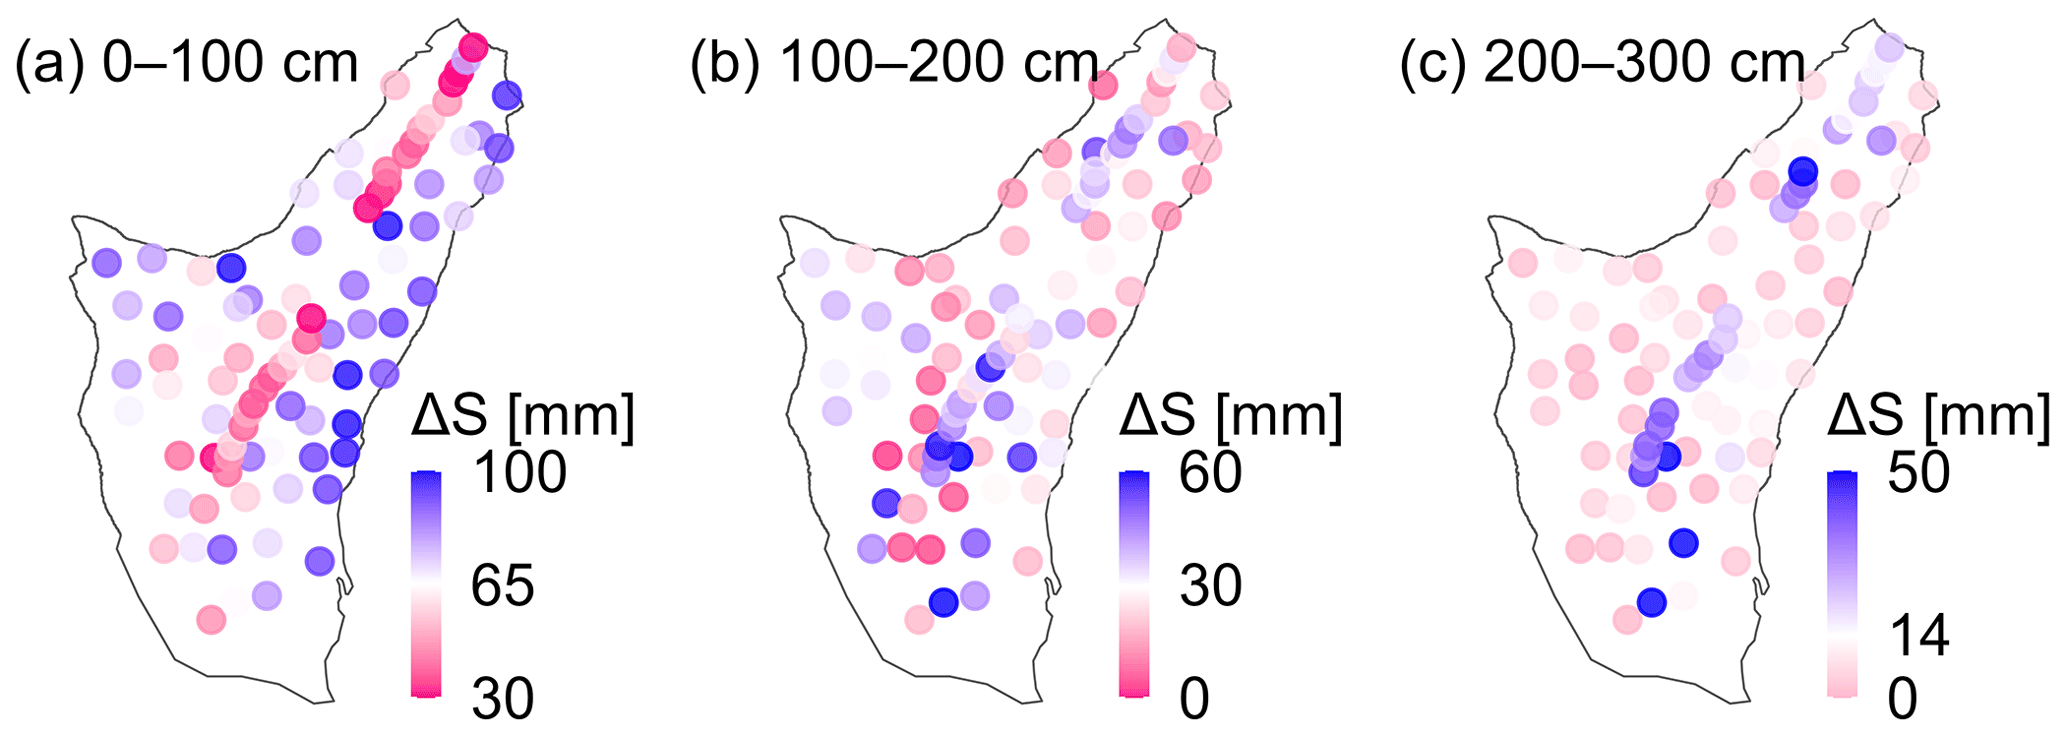
Figure 10Spatial pattern of annual soil moisture storage change (ΔS) integrated over depths of (a) 0–100 cm, (b) 100–200 cm, and (c) 200–300 cm. In the top 100 cm of the soil profile (a), soil moisture changes are much greater on the hillslopes than in the gully and greater on the NW-facing slope than on the SE-facing slope. These differences become less distinct between 100 and 200 cm (b) and become almost indistinguishable below 200 cm (c), where instead the greatest soil moisture changes occur in the gully. Note that the color scales differ among the three panels. Blue colors indicate changes that are larger than the catchment average; red values indicate changes that are smaller than the catchment average.
Table 1Estimated annual water balance of the Gutun catchment.
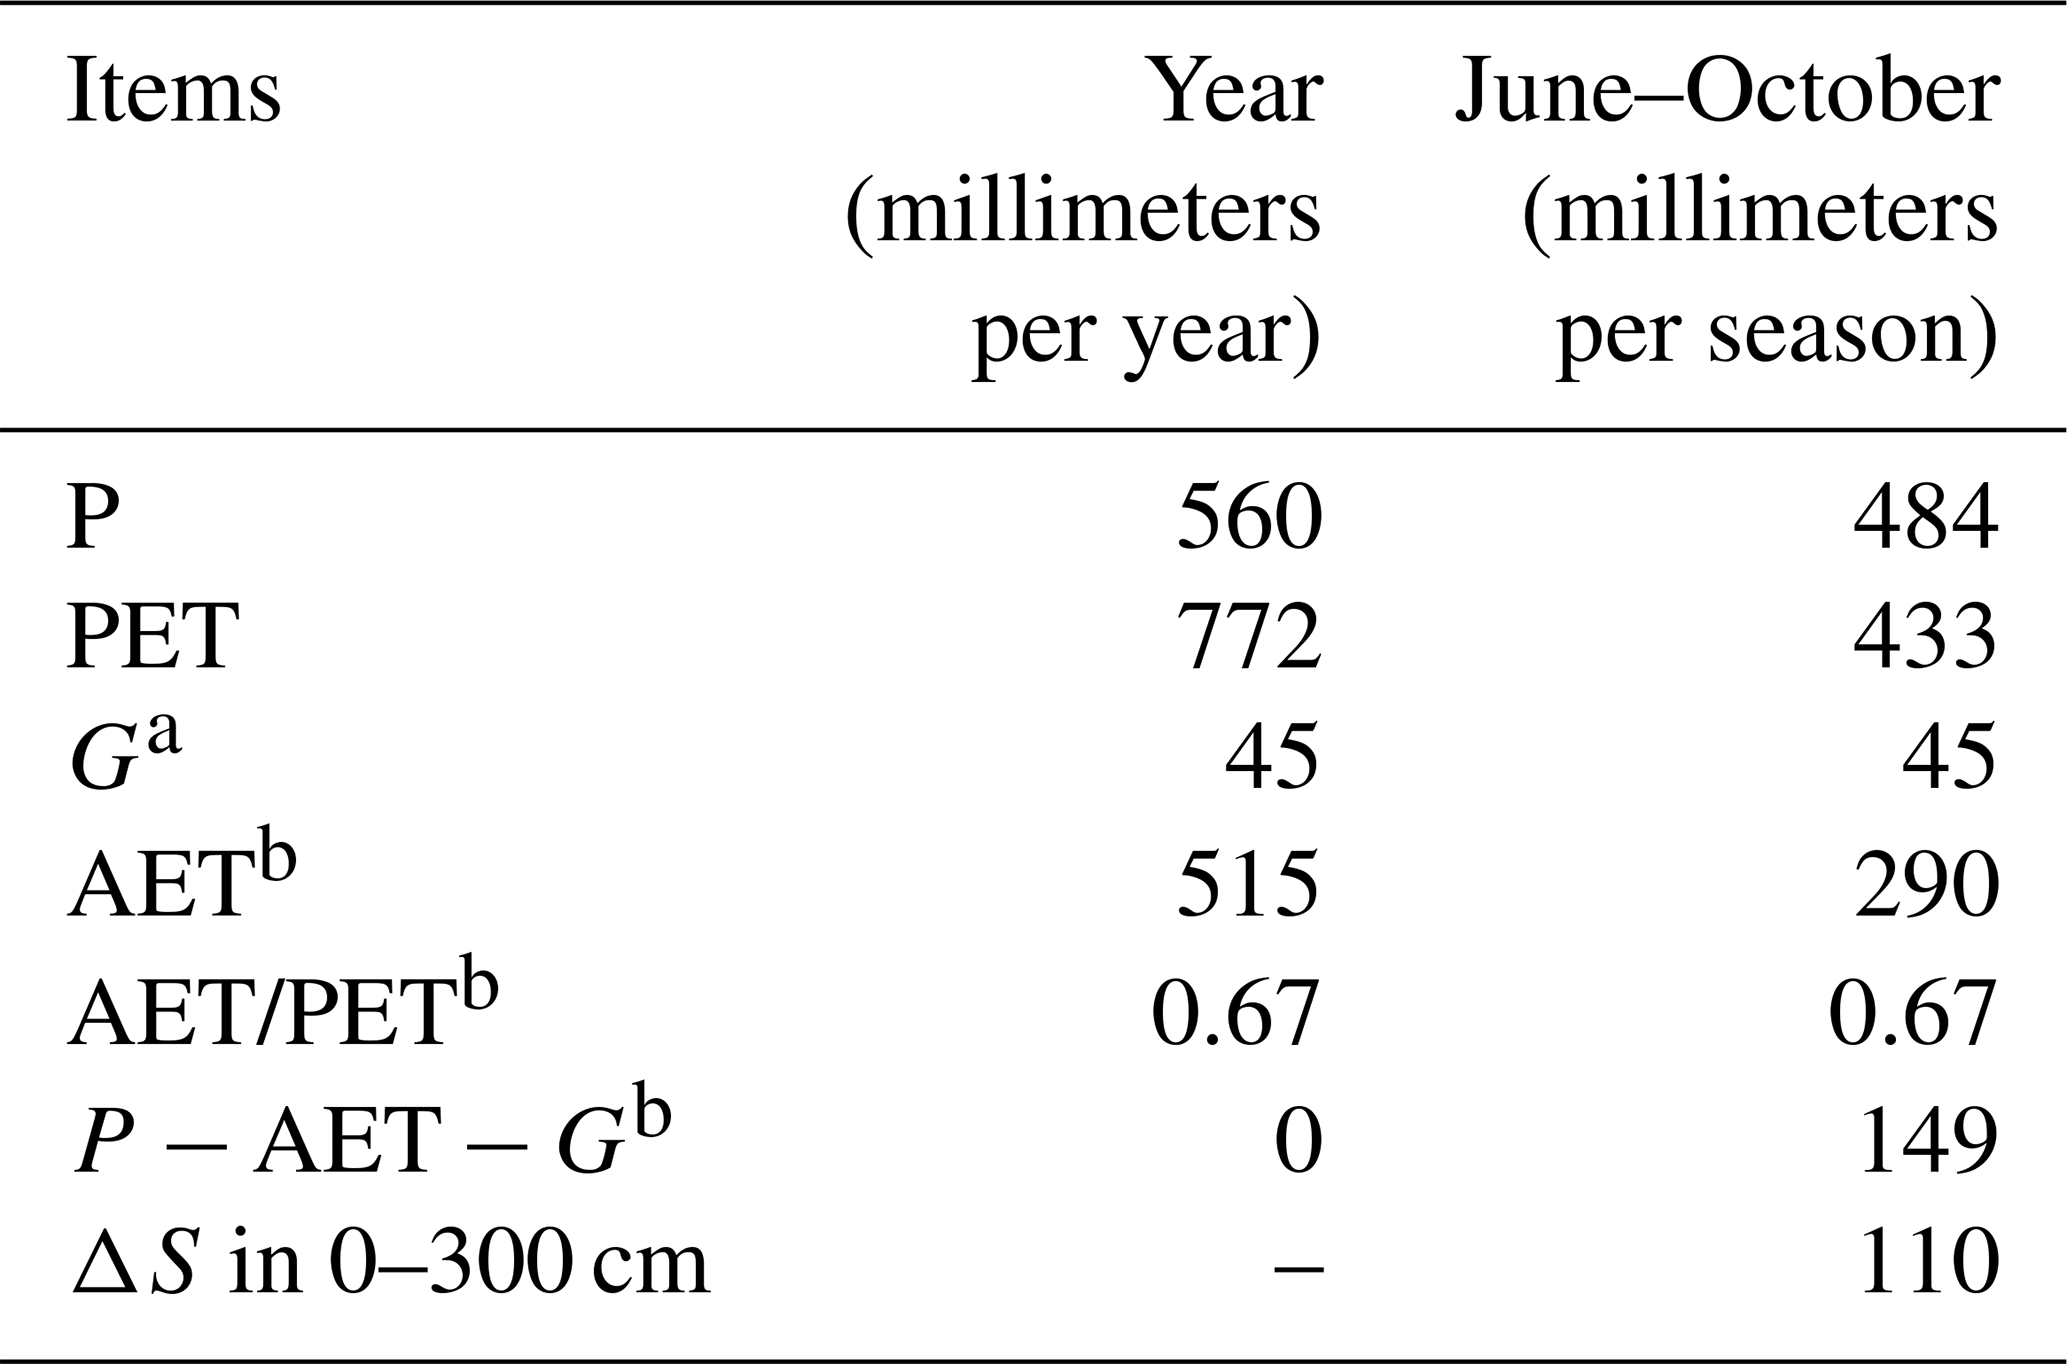
a indicates the estimate from measured streamflow. b indicates the estimate from the annual water balance.
The annual soil moisture storage change ΔS in the top meter of the soil exhibited a clear spatial pattern, being highest on the NW-facing slope, followed by the SE-facing slope, and lowest in the gully. The annual soil moisture storage change ΔS was much smaller for the 100–200 and 200–300 cm soils and also more similar between the NW- and SE-facing slopes. This suggests that, during the growing season, more water was removed from the root-zone soils on the NW-facing slope than on the SE-facing slope.
When considered together with the spatial pattern of soil moisture content in the 0–100 cm soils (Figs. 7 and 9a), these results suggest that the NW-facing slope contained more water than the SE-facing slope during the dormant season and then lost more water during the growing season but remained wetter than the SE-facing slope at the end of the growing season. These findings are consistent with the observations of Tromp-van Meerveld and McDonnell (2006) on a hillslope of the Panola Mountain Research Watershed, Georgia, USA. In their midslope locations, which had comparatively deep soils and high soil moisture storage, plants could obtain more water from the soils without limiting transpiration in the growing season. In contrast, the upslope locations had a lower soil moisture storage, and reductions in soil moisture during the growing season restricted transpiration, resulting in less water being extracted from these soils. At our site, differences in moisture storage arise from energy-driven differences in ET rather than soil depth variations. Nonetheless, the differences in ΔS between the NW- and SE-facing slopes in our study are consistent with the observations of Tromp-van Meerveld and McDonnell (2006), suggesting that the denser vegetation on the NW-facing slope (Fig. 1b) may consume more water, thereby narrowing the soil moisture gap between the two hillslopes during the growing season (Fig. 9a).
This study has documented the spatial patterns and seasonal dynamics of volumetric soil moisture in a small Loess Plateau catchment using long-term measurements up to 5 m depth in a dense network of 89 monitoring sites. The largest seasonal changes in soil moisture occurred in the upper 100 cm of the soils, with little change occurring below 260 cm. Within the upper 100 cm, soil moisture varied seasonally, primarily due to the seasonal imbalance between PET and P, with the highest soil moisture occurring during the months with the least precipitation. An aspect-dependent spatial pattern in soil moisture on the hillslopes was particularly evident under wet conditions (but was also observable under dry conditions), with the NW-facing slope having a higher soil moisture than the SE-facing slope. The seasonal variations in soil moisture storage were also larger for the NW-facing slope. Because soil texture was uniform and there was no correlation between soil moisture across the hillslopes and TWI, variations in evapotranspiration appear to have controlled the spatial pattern of hillslope soil moisture in the top 0–100 cm of the soil under both wet and dry conditions. Water balance considerations also suggest that storage in the upper 300 cm of the soil accounts for most or all of the seasonal water storage in the catchment. These observations contribute to understanding runoff generation mechanisms in Loess Plateau catchments and may be useful as reference values for sites with similar loess soils and highly seasonal climates.
The dataset underlying our findings can be downloaded from https://doi.org/10.6084/m9.figshare.24592674.v1 (Liu et al., 2023).
SL, IvM, YW, and JWK designed the study. SL, IvM, and JWK discussed the results. SL performed the analyses and wrote the first draft. YZ and YW provided the data. All the authors reviewed the paper.
The contact author has declared that none of the authors has any competing interests.
Publisher's note: Copernicus Publications remains neutral with regard to jurisdictional claims made in the text, published maps, institutional affiliations, or any other geographical representation in this paper. While Copernicus Publications makes every effort to include appropriate place names, the final responsibility lies with the authors.
We thank the National Observation and Research Station of Earth Critical Zone on the Loess Plateau for supporting our field work. We thank the Chinese Scholarship Council (grant no. 202106040099) for financially supporting our Swiss–Chinese collaboration.
This research has been supported by the National Natural Science Foundation of China (grant nos. 42177306 and 41971045) and the Western Light Innovation Cross Team Program, Chinese Academy of Sciences.
This paper was edited by Genevieve Ali and reviewed by Kendra Kaiser and two anonymous referees.
Brocca, L., Melone, F., Moramarco, T., and Morbidelli, R.: Spatial-temporal variability of soil moisture and its estimation across scales, Water Resour. Res., 46, W02516, https://doi.org/10.1029/2009WR008016, 2010.
Chen, F., Crow, W. T., Starks, P. J., and Moriasi, D. N.: Improving hydrologic predictions of a catchment model via assimilation of surface soil moisture, Adv. Water Resour., 34, 526–536, https://doi.org/10.1016/j.advwatres.2011.01.011, 2011.
Choi, M. and Jacobs, J. M.: Soil moisture variability of root zone profiles within SMEX02 remote sensing footprints, Adv. Water Resour., 30, 883–896, https://doi.org/10.1016/j.advwatres.2006.07.007, 2007.
Dymond, S. F., Wagenbrenner, J. W., Keppeler, E. T., and Bladon, K. D.: Dynamic hillslope soil moisture in a mediterranean montane watershed, Water Resour. Res., 57, e2020WR029170, https://doi.org/10.1029/2020WR029170, 2021.
Famiglietti, J. S., Ryu, D., Berg, A. A., Rodell, M., and Jackson, T. J.: Field observations of soil moisture variability across scales, Water Resour. Res., 44, W01423, https://doi.org/10.1029/2006WR005804, 2008.
Fan, Y., Clark, M., Lawrence, D. M., Swenson, S., Band, L. E., Brantley, S. L., Brooks, P. D., Dietrich, W. E., Flores, A., Grant, G., Kirchner, J. W., Mackay, D. S., McDonnell, J. J., Milly, P. C. D., Sullivan, P. L., Tague, C., Ajami, H., Chaney, N., Hartmann, A., Hazenberg, P., McNamara, J., Pelletier, J., Perket, J., Rouholahnejad-Freund, E., Wagener, T., Zeng, X., Beighley, E., Buzan, J., Huang, M., Livneh, B., Mohanty, B. P., Nijssen, B., Safeeq, M., Shen, C., van Verseveld, W., Volk, J., and Yamazaki, D.: Hillslope hydrology in global change research and earth system modeling, Water Resour. Res., 55, 1737–1772, https://doi.org/10.1029/2018WR023903, 2019.
Fu, Z., Wang, Y., An, Z., Hu, W., Mostofa, K. M. G., Li, X., and Liu, B.: Spatial and temporal variability of 0- to 5-m soil-water storage at the watershed scale, Hydrol. Process., 32, 2557–2569, https://doi.org/10.1002/hyp.13172, 2018.
Gao, X., Wu, P., Zhao, X., Shi, Y., Wang, J., and Zhang, B.: Soil moisture variability along transects over a well-developed gully in the Loess Plateau, China, Catena, 87, 357–367, https://doi.org/10.1016/j.catena.2011.07.004, 2011.
Gao, X., Zhao, X., Si, B., Brocca, L., Hu, W., and Wu, P.: Catchment-scale variability of absolute versus temporal anomaly soil moisture: Time-invariant part not always plays the leading role, J. Hydrol., 529, 1669–1678, https://doi.org/10.1016/j.jhydrol.2015.08.020, 2015.
Gao, X., Zhao, X., Wu, P., Brocca, L., and Zhang, B.: Effects of large gullies on catchment-scale soil moisture spatial behaviors: A case study on the Loess Plateau of China, Geoderma, 261, 1–10, https://doi.org/10.1016/j.geoderma.2015.07.001, 2016.
Geroy, I. J., Gribb, M. M., Marshall, H. P., Chandler, D. G., Benner, S. G., and McNamara, J. P.: Aspect influences on soil water retention and storage, Hydrol. Process., 25, 3836–3842, https://doi.org/10.1002/hyp.8281, 2011.
Grayson, R. B. and Western, A. W.: Terrain and the distribution of soil moisture, Hydrol. Process., 15, 2689–2690, https://doi.org/10.1002/hyp.479, 2001.
Grayson, R. B., Western, A. W., Chiew, F. H. S., and Blöschl, G.: Preferred states in spatial soil moisture patterns: Local and nonlocal controls, Water Resour. Res., 33, 2897–2908, https://doi.org/10.1029/97WR02174, 1997.
Grayson, R. B., Western, A. W., Walker, J. P., Kandel, D. G., Costelloe, J. F., and Wilson, D. J.: Controls on patterns of soil moisture in arid and semi-arid systems, in: Dryland Ecohydrology, edited by: D'Odorico, P. and Porporato, A., Springer, Dordrecht, 109–127, https://doi.org/10.1007/1-4020-4260-4_7, 2006.
Gutiérrez-Jurado, H .A., Vivoni, E. R., Istanbulluoglu, E., and Bras, R. L.: Ecohydrological response to a geomorphically significant flood event in a semiarid catchment with contrasting ecosystems, Geophys. Res. Lett., 34, L24S25, https://doi.org/10.1029/2007GL030994, 2007.
Han, X., Liu, J., Srivastava, P., Liu, H., Li, X., Shen, X., and Tan, H.: The dominant control of relief on soil water content distribution during wet-dry transitions in headwaters, Water Resour. Res., 57, e2021WR029587, https://doi.org/10.1029/2021WR029587, 2021.
Hoylman, Z. H., Jencso, K. G., Hu, J., Holden, Z. A., Martin, J. T., and Gardner, W. P.: The climatic water balance and topography control spatial patterns of atmospheric demand, soil moisture, and shallow subsurface flow, Water Resour. Res., 55, 2370–2389, https://doi.org/10.1029/2018WR023302, 2019.
Hu, W. and Si, B.: Revealing the relative influence of soil and topographic properties on soil water content distribution at the watershed scale in two sites, J. Hydrol., 516, 107–118, https://doi.org/10.1016/j.jhydrol.2013.10.002, 2014.
Hu, W., Shao, M., Han, F., and Reichardt, K.: Spatio-temporal variability behavior of land surface soil water content in shrub- and grass-land, Geoderma, 162, 260–272, https://doi.org/10.1016/j.geoderma.2011.02.008, 2011.
Hu, W., Chau, H. W., Qiu, W., and Si, B.: Environmental controls on the spatial variability of soil water dynamics in a small watershed, J. Hydrol., 551, 47–55, https://doi.org/10.1016/j.jhydrol.2017.05.054, 2017.
Huang, L. and Shao, M.: Advances and perspectives on soil water research in China's Loess Plateau, Earth-Sci. Rev., 199, 102962, https://doi.org/10.1016/j.earscirev.2019.102962, 2019.
Jarecke, K. M., Bladon, K. D., and Wondzell, S. M.: The influence of local and nonlocal factors on soil water content in a steep forested catchment, Water Resour. Res., 57, e2020WR028343, https://doi.org/10.1029/2020WR028343, 2021.
Jia, X., Shao, M., Zhang, C., and Zhao, C.: Regional temporal persistence of dried soil layer along south-north transect of the Loess Plateau, China, J. Hydrol., 528, 152–160, https://doi.org/10.1016/j.jhydrol.2015.06.025, 2015.
Kaiser, K. E. and McGlynn, B. L.: Nested scales of spatial and temporal variability of soil water content across a semiarid montane catchment, Water Resour. Res., 54, 7960–7980, https://doi.org/10.1029/2018WR022591, 2018.
Koster, R. D., Mahanama, S. P. P., Livneh, B., Lettenmaier, D. P., and Reichle, R. H.: Skill in streamflow forecasts derived from large-scale estimates of soil moisture and snow, Nat. Geosci., 3, 613–616, https://doi.org/10.1038/ngeo944, 2010.
Liang, W.-L., Li, S.-L., and Hung, F.-X.: Analysis of the contributions of topographic, soil, and vegetation features on the spatial distributions of surface soil moisture in a steep natural forested headwater catchment, Hydrol. Process., 31, 3796–3809, https://doi.org/10.1002/hyp.11290, 2017.
Liu, S., Meerveld, I. v., Zhao, Y., Wang, Y., and Kirchner, J. W.: Dataset for “Seasonal dynamics and spatial patterns of soil moisture in a loess catchment”, figshare [data set], https://doi.org/10.6084/m9.figshare.24592674.v1, 2023.
McNamara, J. P., Chandler, D., Seyfried, M., and Achet, S.: Soil moisture states, lateral flow, and streamflow generation in a semi-arid, snowmelt-driven catchment, Hydrol. Process., 19, 4023–4038, https://doi.org/10.1002/hyp.5869, 2005.
Owe, M., Jones, E. B., and Schmugge, T. J.: Soil moisture variation patterns observed in Hand County, South Dakota, Water Resour. Bull., 18, 949–954, https://doi.org/10.1111/j.1752-1688.1982.tb00100.x, 1982.
Pelletier, J. D., Barron-Gafford, G. A., Gutierrez-Jurado, H., Hinckley, E. L. S., Istanbulluoglu, E., McGuire, L. A., Niu, G. Y., Poulos, M. J., Rasmussen, C., Richardson, P., Swetnam, T. L., and Tucker, G. E.: Which way do you lean? Using slope aspect variations to understand Critical Zone processes and feedbacks, Earth Surf. Proc. Land., 43, 1133–1154, https://doi.org/10.1002/esp.4306, 2018.
Penna, D., Borga, M., Norbiato, D., and Dalla Fontana, G.: Hillslope scale soil moisture variability in a steep alpine terrain, J. Hydrol., 364, 311–327, https://doi.org/10.1016/j.jhydrol.2008.11.009, 2009.
Peterson, A., Helgason, W., and Ireson, A.: How spatial patterns of soil moisture dynamics can explain field-scale soil moisture variability: Observations from a sodic landscape, Water Resour. Res., 55, 4410–4426, https://doi.org/10.1029/2018WR023329, 2019.
Qiu, Y., Fu, B., Wang, J., and Chen, L.: Spatial variability of soil moisture content and its relation to environmental indices in a semi-arid gully catchment of the Loess Plateau, China, J. Arid Environ., 49, 723–750, https://doi.org/10.1006/jare.2001.0828, 2001.
Ridolfi, L., D'Odorico, P., Porporato, A., and Rodriguez-Iturbe, I.: Stochastic soil moisture dynamics along a hillslope, J. Hydrol., 272, 264–275, https://doi.org/10.1016/S0022-1694(02)00270-6, 2003.
Rosenbaum, U., Bogena, H. R., Herbst, M., Huisman, J. A., Peterson, T. J., Weuthen, A., Western, A. W., and Vereecken, H.: Seasonal and event dynamics of spatial soil moisture patterns at the small catchment scale, Water Resour. Res., 48, W10544, https://doi.org/10.1029/2011WR011518, 2012.
Shi, Y., Wu, P., Zhao, X., Li, H., Wang, J., and Zhang, B.: Statistical analyses and controls of root-zone soil moisture in a large gully of the Loess Plateau, Environ. Earth Sci., 71, 4801–4809, https://doi.org/10.1007/s12665-013-2870-5, 2014.
Singh, G., Panda, R. K., and Mohanty, B. P.: Spatiotemporal analysis of soil moisture and optimal sampling design for regional-scale soil moisture estimation in a tropical watershed of India, Water Resour. Res., 55, 2057–2078, https://doi.org/10.1029/2018WR024044, 2019.
Tague, C., Band, L., Kenworthy, S., and Tenebaum, D.: Plot- and watershed-scale soil moisture variability in a humid Piedmont watershed, Water Resour. Res., 46, W12541, https://doi.org/10.1029/2009WR008078, 2010.
Takagi, K. and Lin, H. S.: Temporal dynamics of soil moisture spatial variability in the shale hills critical zone observatory, Vadose Zone J., 10, 832–842, https://doi.org/10.2136/vzj2010.0134, 2011.
Teuling, A. J. and Troch, P. A.: Improved understanding of soil moisture variability dynamics, Geophys. Res. Lett., 32, L05404, https://doi.org/10.1029/2004GL021935, 2005.
Tromp-van Meerveld, H. J. and McDonnell, J.J .: On the interrelations between topography, soil depth, soil moisture, transpiration rates and species distribution at the hillslope scale, Adv. Water Resour., 29, 293–310, https://doi.org/10.1016/j.advwatres.2005.02.016, 2006.
Wang, Y., Shao, M., and Shao, H.: A preliminary investigation of the dynamic characteristics of dried soil layers on the Loess Plateau of China, J. Hydrol., 381, 9–17, https://doi.org/10.1016/j.jhydrol.2009.09.042, 2010.
Wang, Y., Shao, M., Zhu, Y., and Liu, Z.: Impacts of land use and plant characteristics on dried soil layers in different climatic regions on the Loess Plateau of China, Agr. Forest Meteorol., 151, 437–448, https://doi.org/10.1016/j.agrformet.2010.11.016, 2011.
Wang, Y., Shao, M., Zhang, C., Han, X., Mao, T., and Jia, X.: Choosing an optimal land-use pattern for restoring eco-environments in a semiarid region of the Chinese Loess Plateau, Ecol. Eng., 74, 213–222, https://doi.org/10.1016/j.ecoleng.2014.10.001, 2015.
Wang, Y., Sun, H., and Zhao, Y.: Characterizing spatial-temporal patterns and abrupt changes in deep soil moisture across an intensively managed watershed, Geoderma, 341, 181–194, https://doi.org/10.1016/j.geoderma.2019.01.044, 2019.
Western, A. W., Grayson, R. B., Bloschl, G., and Wilson, D. J.: Spatial variability of soil moisture and its implications for scaling, in: Scaling methods in soil physics, CRC Press, Boca Raton, 119–142, https://doi.org/10.1201/9780203011065, 2003.
Western, A. W., Zhou, S. L., Grayson, R. B., McMahon, T. A., Blöschl, G., and Wilson, D. J.: Spatial correlation of soil moisture in small catchments and its relationship to dominant spatial hydrological processes, J. Hydrol., 286, 113–134, https://doi.org/10.1016/j.jhydrol.2003.09.014, 2004.
Williams, C. J., McNamara, J. P., and Chandler, D. G.: Controls on the temporal and spatial variability of soil moisture in a mountainous landscape: the signature of snow and complex terrain, Hydrol. Earth Syst. Sci., 13, 1325–1336, https://doi.org/10.5194/hess-13-1325-2009, 2009.
Yu, B., Liu, G., Liu, Q., Wang, X., Feng, J., and Huang, C.: Soil moisture variations at different topographic domains and land use types in the semi-arid Loess Plateau, China, Catena, 165, 125–132, https://doi.org/10.1016/j.catena.2018.01.020, 2018.
Zhao, Y., Wang, Y., He, M., Tong, Y., Zhou, J., Guo, X., Liu, J., and Zhang, X.: Transference of Robinia pseudoacacia water-use patterns from deep to shallow soil layers during the transition period between the dry and rainy seasons in a water-limited region, Forest Ecol. Manage., 457, 117727, https://doi.org/10.1016/j.foreco.2019.117727, 2020.
Zhu, Y., Jia, X., Qiao, J., and Shao, M.: What is the mass of loess in the Loess Plateau of China?, Sci. Bull., 64, 534–539, https://doi.org/10.1016/j.scib.2019.03.021, 2019.