the Creative Commons Attribution 4.0 License.
the Creative Commons Attribution 4.0 License.
 | 25 Mar 2024
Process-based three-layer synergistic optimal-allocation model for complex water resource systems considering reclaimed water
Jing Liu
Wei Zhang
Shiwu Wang
Siwei Chen
The increasing water demand due to human activities has aggravated water scarcity, and conflicts among stakeholders have increased the risk of unsustainable development. Ignoring the effects of trade-offs leads to misguided policy recommendations. This study highlights the concept of synergy among different aspects of the water allocation process. A process-based three-layer synergistic optimal-allocation (PTSOA) model is established to integrate the interests of stakeholders across sub-regions, decision levels, and time steps while simultaneously coupling reclaimed water to establish environmentally friendly solutions. A synergy degree index is constructed by applying network analysis for optimization. PTSOA is applied in Yiwu, southeast China, and is shown to be able to improve the contradictions among different dimensionalities in a complex system. Overall, 2.43×10⁷–3.95×10⁷ m3 of conventional water is saved, and notable improvements in management are achieved. The application demonstrates the efficiency and excellent performance of the PTSOA model.
- Article
(6532 KB) - Full-text XML
- BibTeX
- EndNote


Water scarcity has become one of the major impediments to sustainable development of cities (Yue et al., 2020). Emerging water scarcity concerns in cities are associated with limited available water, severe water pollution, and relentlessly growing demand for water as driven by industrial growth, population growth, and higher living standards; these factors have lead to intense competition for freshwater among stakeholders of interest (Dai et al., 2018; Wu et al., 2023). However, the heterogeneous distribution of water resources at both spatial and temporal scales is common and results in water shortage risks and conflicts, which often require the optimization of water resource allocation (Friesen et al., 2017). Moreover, some satisfactory alternatives for individual stakeholders may result in negative externalities for others. Nowadays, the water resource system is becoming more and more complex and often has multiple sources and users, as well as infrastructure for the reuse of water. This kind of water resource system is called a complex system. Therefore, it is critical to develop a synergistic optimal-allocation model to alleviate conflicts and ensure the security, efficiency, equality, eco-environmental sustainability, and sustainable development of complex water resource systems simultaneously.
As equitable access to water resources is closely related to social stability, several qualitative and indirect methods have been developed to assess water allocation equality (D'Exelle et al., 2012). In cases with limited water resources, more water would be allocated to users with better economic conditions to achieve more economic benefits. Thus, stakeholders with poor economic status are ignored, resulting in imbalanced development. Consequently, actions are often needed by local government managers to avoid such situations. The Gini coefficient has been widely used to evaluate equality and enhance the optimization of water allocation in water use sectors (Xu et al., 2019; Hu et al., 2016; D'Exelle et al., 2012). However, it is unable to reflect the dynamic interactions among objectives, i.e., how objectives interact with each other and impact the equity of a system in cases with diverse alternative decisions. From the perspective of coordinated allocation, multiple goals are simultaneously considered to avoid negative effects as much as possible. Therefore, in addition to equity, coordination should be considered in water allocation systems, and these two concepts can be combined to promote systemic synergy. By identifying the dynamic interactions among objectives, the internal mechanisms of a water system can be clarified, and synergy can be achieved in cases with different potential decisions. It is also helpful to identify the hurdles and opportunities associated with sustainable development for cities and to establish specific action priorities for cities based on a comprehensive understanding of the interactions among objectives. To address this knowledge gap, a correlational network approach is applied in this study, and a synergy degree index is presented to consider both equity and coordination of water systems. Moreover, systemic analysis is used to assess the level of coordination of complex objective interactions in city water systems.
Network analysis, which has been widely used in studies of complex systems (Ball et al., 2000; Saavedra et al., 2011; Bond, 2017), is a holistic approach for exploring the characteristics of interactions among objectives. It provides clear visualization and conceptualization of the interactions among variables to fully characterize those interactions (Bali Swain and Ranganathan, 2021). An array of network metrics (for example, degree centrality, betweenness centrality, eigenvector centrality, closeness centrality, and community) can be applied to quantify the importance of objectives or targets in an interaction network (Zhou and Moinuddin, 2017) and reveal the strongly connected pairs of goals or targets in the network (Allen et al., 2019). A key network metric in such analysis is connectivity, which reflects the degree of coordination among different objectives in a system; in synergy networks, high connectivity indicates that many objectives can be achieved simultaneously and that the negative effects of interactions are mild (Wu et al., 2022). Thus, to facilitate the discovery of high-quality decision alternatives, alleviate negative conflicts among multiple utilities, and inform decision-making, a synergy degree evaluation index is established and applied to the network analysis of this study.
Due to negative externalities of individual decisions, conflicts occur not only across different users or objectives but also across hierarchical decision levels. Water use contradictions and inconsistent decision-making by multiple managers inevitably results in trade-offs, including positive and negative water resource feedback in cases with limited water availability (Wang et al., 2022). In practice, district administrators allocate water to each sector in each sub-region, and sub-region managers then make decisions based on the allocated amount of water resources (Safari et al., 2014). Since each decision-maker places emphasis on different targets, feedback and coordination among different decision-makers are of great importance. Therefore, synergistic hierarchical water allocation that achieves coordination among different decision-makers is imperative to avoid conflicts, save water, and maintain social stability.
To address these hierarchical problems, bi-level programming (BLP) has been widely used, wherein objectives at two hierarchical levels, namely, an upper level and a lower level, are co-optimized (Zhang and Vesselinov, 2016; Jin et al., 2018). The upper-level decision may be affected by actions of the lower-level decision-makers (Arora and Gupta, 2009). Yue et al. (2020) formulated a bi-level programming (BLP) framework to gain insight into the whole water allocation process with district administrators and sub-regional farmers. Li et al. (2022) built a two-level model with the overall interests of system managers at the top and the individual interests of water supply departments at the bottom. The multi-level programming problem (MLPP) was derived from the bi-level programming problem (BLPP) and is more applicable to real-world practices (Baky, 2014). However, limited studies have explored applying MLPP (more than two levels) for water resource allocation, especially in cases with unconventional water supplies.
To satisfy both long-term and short-term water needs and avoid unnecessary administration costs and water resource use caused by lack of coordination among different allocation steps, temporally synergistic allocation and optimization are needed (Haguma and Leconte, 2018). In annual water resource planning, the monthly variability of hydrologic regimes and non-stationarity of the daily water demand must be considered. As an alternative example of synergistic allocation at different time steps, Vicuna et al. (2010) used a monthly nonlinear programming model and an annual sampling stochastic dynamic programming (SSDP) model to establish a monthly operating policy. Haguma and Leconte (2018) constructed deterministic and stochastic optimization models with two time steps (intra-annual and inter-annual) and two levels of inflow variability: seasonal and inter-annual. The purpose of their short-time-step model was to derive aggregate performance functions associated with potential long-time-step decisions in these studies. However, short-term benefits should not be overlooked due to their appreciable impact on long-term effects. Accordingly, synergistic allocation that enhances both long-term and short-term allocations is of great importance for water resource management in cities. However, optimizing the structure of a model to achieve maximized benefits and balancing the trade-offs among time steps are tasks that have rarely been studied. The synergy among different time steps is addressed with a new innovative framework and a corresponding algorithm in our study.
Most of the abovementioned traditional models are based on a benefit-oriented mechanism, which leads to a high degree of satisfaction in high-benefit regions and large water shortages in other regions. The existence of high-benefit regions in a city during the allocation process often exacerbates regional disparities and heterogeneous development. Moreover, spatial factors influence allocation results, especially when there is spatial hierarchical heterogeneity among water resource allocation elements (Li et al., 2022). It is thus appropriate to conceptualize water allocation problems in a multistage framework that fully considers the interests of not only the regional authority but also sub-regional managers (Yao et al., 2019). Hence, the synergy among sub-regions must be considered to optimally allocate water resources. Ideally, the benefits of all sub-regions should be integrated equally in the model, and the weights of hyper-parameters should be adjusted to best support flexible policies.
The optimal allocation of conventional and unconventional water resources also significantly impacts water security and aquatic ecosystems. The reuse of reclaimed water is beneficial for alleviating high water supply pressure on conventional water resources and reducing the emission of pollutants. To effectively integrate conventional and unconventional water resources, Yang et al. (2008) and Han et al. (2008) introduced unconventional water resources as critical factors in water management. Avni et al. (2013) investigated the mixing of unconventional water resources with other conventional water sources to meet the magnesium requirements for drinking water and irrigation water. Yu et al. (2017) developed a cost–benefit-analysis-based utilization model for externally transferred water and desalinated water. The allocation of both conventional and unconventional water has been widely studied, but there remains a lack of methods to guide the synergistic allocation of conventional and unconventional water resources and embed reclaimed water supply systems in allocation schemes. The overexploitation of conventional water resources is not conducive to sustainable development, while extensive use of unconventional water could ultimately result in high economic burden. To synergistically integrate conventional and unconventional water resources and guide the coordinated allocation of these two types of water resources, corresponding mechanisms must be implemented. As a result, our study aims to couple the allocation of conventional water resources and unconventional water resources to establish synergistic solutions.
In summary, as insufficient water supplies and increasing water demands intensify competition for water resources and lead to conflicts among different stakeholders in different dimensions, water allocation must be optimized in cities and regions to achieve synergistic decision-making at various levels and time steps considering the value of reclaimed water. Therefore, a new process-based three-layer synergistic optimal-allocation (PTSOA) model is developed here to generate numerous candidates or Pareto solutions and identify several desirable decision alternatives. The synergy of time and space optimization is achieved in the new model to avoid waste and promote balanced spatial development. Furthermore, in the PTSOA model, reclaimed water is used to replenish conventional water resources in water-scarce areas.
The remainder of this paper is organized as follows. The mathematical model is formulated in Sect. 2. Section 3 gives a numerical example for Yiwu to demonstrate the effectiveness and efficiency of the proposed methods. The results are shown in Sect. 4; different water allocation strategies under varying inflow conditions are explored, and policy implications are discussed. Section 5 presents conclusions.
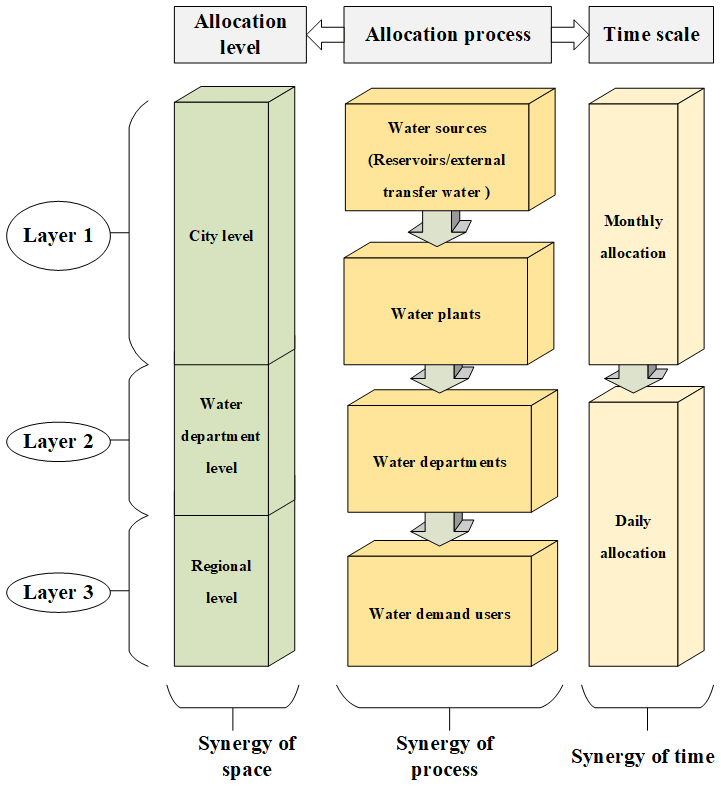
With water resources becoming increasingly scarce, multi-dimensional synergistic optimal allocation in a hierarchical system is crucial for ensuring sustainable development in water-scarce cities. There are three dimensions of synergy in the established allocation model, as shown in Fig. 1: process synergy, decision-level synergy, and timescale synergy. The synergy of the process refers to synergistic water allocation among the three stages throughout the whole allocation process to reduce waste in bridging processes, which has rarely been considered. In the three stages, first, the original water is released from reservoirs or diverted from external water transfer projects to water works; then, the water stored in water work infrastructure is supplied to different departments that need different types of water, including both conventional and reclaimed water. Finally, water is supplied to different users. Decision-level synergy refers to synergistic water allocation considering the interests of decision-makers at different levels, namely, the city, water department, and regional levels, to coordinate solutions and avoid conflicts among decision-makers. The city level represents the overall interests of a city from the perspective of government, the water supply department level represents the interests of water supply corporations, and the regional level focuses on the comprehensive benefits of each region in the city and mitigates development imbalance among regions. Optimal decision-making at the department level is constrained by the allocation results at the city level, and so on, and the final solution should satisfy the needs of decision-makers across all levels. The timescale synergy involves the coordination of the daily configuration goal with the monthly goal, the monthly goal with the yearly goal, and so on. Synergistic temporal allocation can largely alleviate time conflicts during configuration operations, ensuring that all configuration periods serve the same final configuration objectives to save water resources and improve efficiency. However, timescale synergy mainly depends on artificial operations rather than automated intelligent operations in practice. In-depth exploration has yet to be demonstrated. Consequently, the PTSOA model is constructed here to fully consider these three dimensionalities of synergy. The dimensionalities are coupled in this model to achieve the efficient maximization of comprehensive benefits at all levels under the premise of saving water resources. In Fig. 1, the gray boxes indicate the three different allocation dimensions, the green boxes indicate the three different decision levels coupled with spatial scales, the bright-yellow boxes indicate every key node in the whole allocation process, and the buff boxes indicate nested timescale.
In water-scarce cities, using reclaimed water as an alternative water source has proved to be useful in efficiently improving the environment by reducing sewage discharge. The quality of inland tributaries has deteriorated in many water-scarce cities due to limited consideration of the water environment and the large-scale emission of pollutants. Transferring reclaimed water and main river water to urban inland tributaries for ecological water replenishment is a promising approach for improving the quality of urban water environments and areas with water shortages. However, there has been a lack of studies on the integration of reclaimed water reuse systems and inland water distribution systems in allocation modeling. Therefore, in addition to saving water resources and improving efficiency through multi-dimensional synergistic allocation, the model encompasses reclaimed water reuse systems and ecological water distribution systems for inland tributaries.
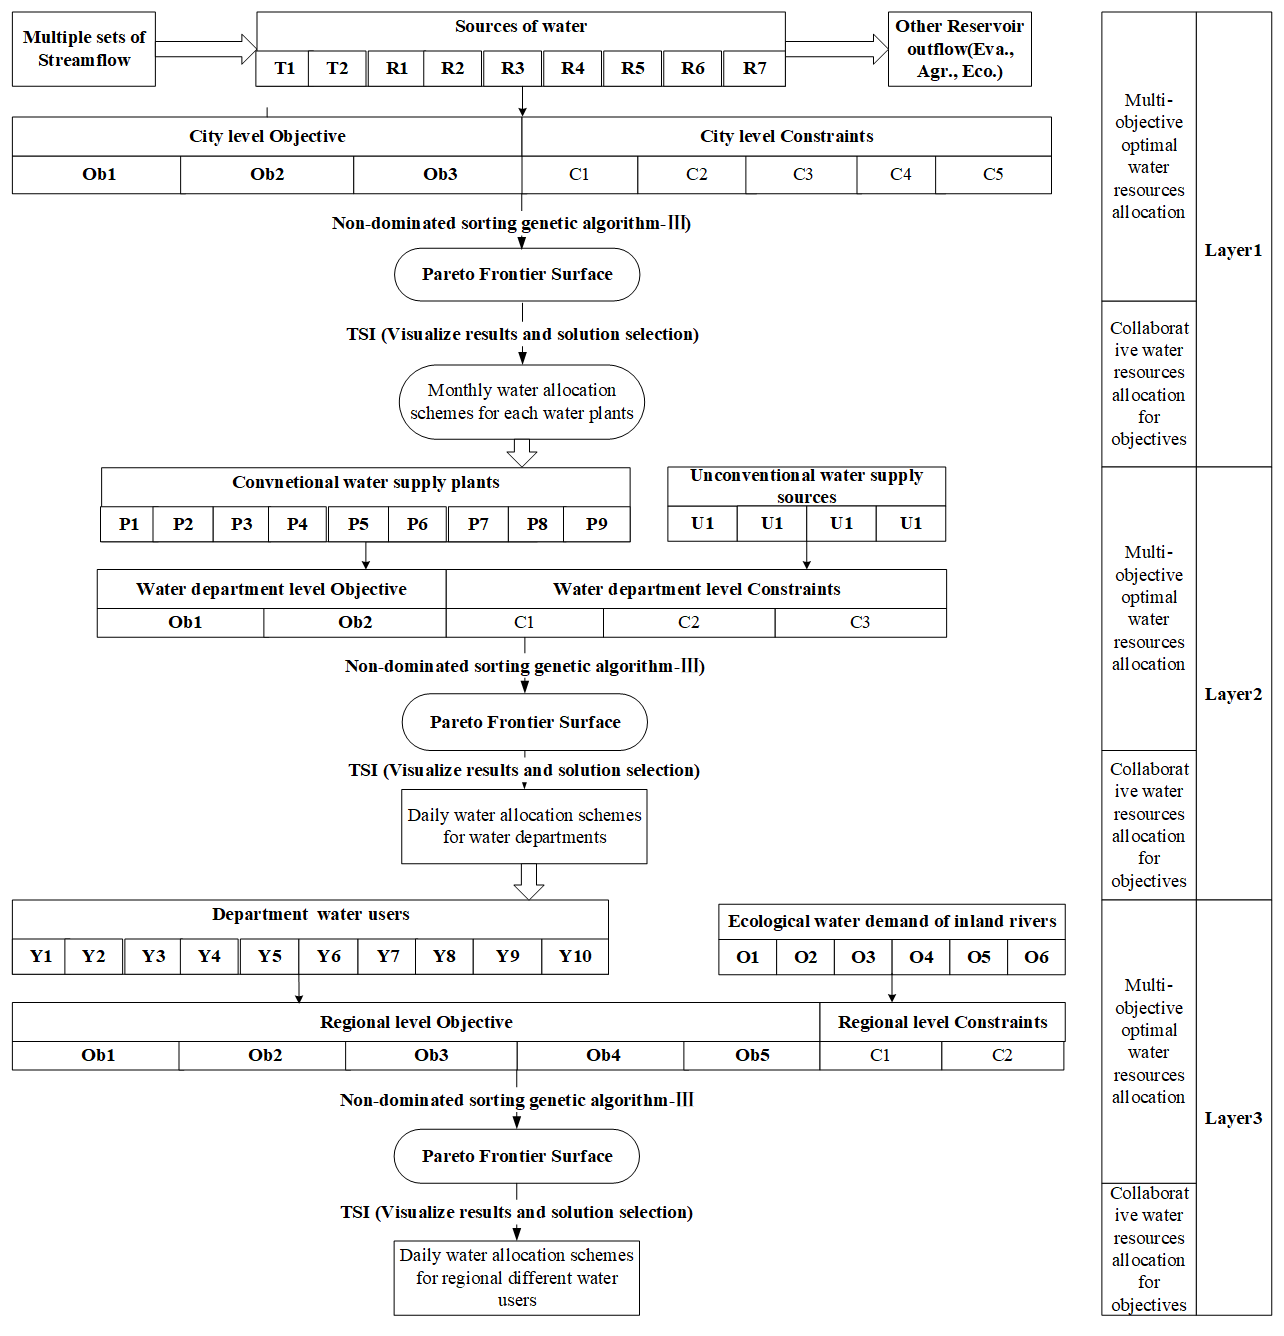
Finally, the PTSOA model is constructed to solve the multi-dimensional synergistic allocation problem involving complex water resource networks that couple reclaimed water reuse systems and inland ecological water distribution systems with multiple sources, processes, and regions to guarantee the sustainable development of water-scarce cities. To select the most synergistic solution of the PTSOA model, a new evaluation index named the synergy index (TSI) is proposed to assess the synergy degree of different decision alternatives. System entropy (H(S)) can describe the evolution direction of a water resource system and was used to promote the coordination of water supply departments in a water resource allocation system (Li et al., 2022). So, it is used for comparison to evaluate the validity of this proposed index. Furthermore, the network analysis method is applied for the first time to analyze dynamic interactions in water optimal allocation. This method visually depicts the dynamic interactions and conflicts among different subareas in a city, which is helpful for system managers to realize how the water allocation scheme in one region influences that of other areas; consequently, more reasonable and flexible measures are established based on dynamic regional development targets. The detailed framework developed in this study is shown in Fig. 2. In this figure, there are three layers in the framework, and each layer has two parts: multi-objective optimal water resource allocation and collaborative water resource allocation for objectives. In the multi-objective optimal water resource allocation, sub-layers contain key nodes in the allocation process and relevant objectives and constraints. In the collaborative water resource allocation for objectives, sub-layers contain the optimization algorithm and decision selection method.
2.1 First layer of the PTSOA decision-making process
Three dimensionalities of synergistic water resource allocation are coupled in the first layer of the PTSOA model. The first stage of the process (original water is released from reservoirs or external water transfer projects to water works) is optimized in the first layer. This stage demonstrates a strong constraint effect on the later stages. To satisfy the overall development goals of the city, the first-layer processes involve city-level decision-making. The city manager focuses on the overall goal of the complex water resource system in the city, which is the first and most important phase of the decision-making process. The established allocation scheme highly influences decision-makers at other levels, and optimal-allocation schemes at other levels must align with this overall goal. Additionally, since water resource planning in most Chinese cities is based on an annual planning period and monthly planning unit, the time step of the first layer is set as months. Finally, the monthly decision alternatives for the volume of water allocated from reservoirs to water works is obtained at the city decision level.
2.1.1 Objective functions of the first layer
Social objective function: minimization of total water supply shortages
The social objective function is established by the city manager to minimize the total water supply shortages in a water system. The objective is established to sufficiently meet the water demands of users in a water resource system. The water deficit is considered, and this objective can reflect the ability of the water supply to meet the water demand, as shown in Eqs. (1)–(3):
where D (1×10⁴ m3) is the total water demand of the system; (1×10⁴ m3), …, R, where R is the total number of sub-regions in the area; t=1, 2, …, T, where T is the total number of months in the period; S (1×10⁴ m3) is the total water supply of the water system for all waterworks; (1×10⁴ m3) is the amount of water supplied from ith reservoir to the jth waterworks in the tth month of the configuration period; i=1, 2, … I, where I refers to the total number of reservoirs; j=1, 2, … J, where J is the number of total water works; (1×10⁴ m3) is the amount of water supplied from the eth external-transfer water source to the jth water works in the tth month of the configuration period; e=1, 2,…, E, where E is the total number of external-transfer water sources in the city; αij is the water supply relationship coefficient between the ith reservoir and the jth water works, where 0 indicates no supply and 1 indicates a water supply; and βej is the water supply relationship coefficient between the eth external-transfer water source and the jth water works, where 0 indicates no supply and 1 indicates a water supply.
Economic objective function: maximization of the total water supply benefit
A city manager operates a water allocation system to maximize the overall economic benefit by establishing an economic objective function, as shown in Eqs. (4)–(7):
The overall economic benefit is the difference between the total benefit and total cost at the city level. In the equations, B (CNY – Chinese Yuan) is the total direct water supply benefit (mainly considering the income from water charges for the city). The total water supply cost consists of the reservoir water supply cost Crs and the external water supply cost Ces, k (CNY per cubic meter) denotes the water resource fees paid to the government, ci (CNY per cubic meter) denotes the water fees paid to the ith reservoir authority, m (CNY per cubic meter) is the charge to an external administrative district per unit of externally transferred water, ne (CNY per cubic meter) is the charge associated with the eth external water source per unit of transferred water, and bj (CNY per cubic meter) is the unit price of water supply revenue for the jth user.
Sustainable development objective function: maximization of the total amount of reserved water in reservoirs
In water-scarce cities, the problem of water scarcity is a serious challenge that prevents sustainable allocation of water resources. A prominent feature of most water-scarce cities is that water inflows are limited, and the fluctuations in water availability are large. Therefore, to reduce the risk that the inflows in the next configuration period are too short to meet the basic demand of the city, a sustainable development objective function is developed. The sustainable development objective function seeks to maximize the amount of water remaining in the reservoir at the end of a configuration period to hedge against drought risk and guarantee water use in the next period, as shown in Eqs. (8)–(10):
where (1×10⁴ m3) is the maximum allowable storage capacity of the ith water source, which is expressed based on the limited storage capacity of a reservoir in the flood season, and Vi (1×10⁴ m3) is the water storage capacity of the ith water source at the end of the scheduling period. As much water as possible but less than is reserved. However, a reserved water volume in the reservoir that is too high at the end of the scheduling period may lead to considerable pressure on reservoirs to urgently release water if a flood event is forecasted. The reserved water volume should be neither too large nor too small. Thus, the benefits of reservoir reserve stock must be thoroughly evaluated. Based on the characteristic of the benefit of residual water, we propose a boundary benefit function for different reserved water volumes in a reservoir. The benefit function is a piecewise function, and when Vi is less than , p increases as Vi increases. When Vi is equal to or greater than , p decreases as Vi increases. When , p decreases to 0. Ri,initial (1×10⁴ m3) is the initial storage of the ith water source, (1×10⁴ m3) is the inflow of the ith water source at the tth time step, (1×10⁴ m3) is the precipitation associated with the ith water source at the tth time step, (1×10⁴ m3) and (104 m3) are the agricultural and ecological water supplies associated with the ith water source at the tth time step respectively, and (1×10⁴ m3) is the evaporation from the ith water source at the tth time step.
2.1.2 Constraints of the first layer
The layer includes six main constraints: the reservoir water supply constraint, water demand constraint, reservoir storage constraint, water balance constraint, external water transfer constraint, and nonnegative constraint.
Reservoir water supply constraint
The maximum water available to supply from an individual reservoir is determined by the difference between the total input and total reservoir output. The inputs include inflow and precipitation, and the outputs mainly involve agricultural and environmental water supplies, evaporation, water supplied for water works, and reservoir leakage loss. All these factors directly affect the decision-making process and are incorporated into the model-building process, as shown in Eqs. (11)–(15):
where (1×10⁴ m3) denotes the total water supply from the ith reservoir at the tth time step, (1×10⁴ m3) is the maximum water available to be supplied from the ith reservoir at the tth time step, (mm) is the water surface evaporation from the ith reservoir in the tth month, (m2) is the monthly average surface area of the ith reservoir in the tth month, Vi,d (1×10⁴ m3) is the dead storage of the ith reservoir, (1×10⁴ m3) is the reservoir leakage loss from the ith reservoir at the tth time step, (1×10⁴ m3) is the storage of the ith reservoir at the t–1th time step, (1×10⁴ m3) is the storage of the ith reservoir at the tth time step, and is the tth monthly leakage coefficient for the ith reservoir.
Water demand constraint
The high-quality water demand of each subarea in a city should be satisfied in the water allocation process. High-quality water in this model refers to water that satisfies the relevant primary (surface water can be used for drinking after simple purification treatment, such as filtration and disinfection) and secondary (water is slightly polluted and can be used for drinking after routine purification treatment, such as flocculation, precipitation, filtration, disinfection, and other processes) water quality requirements according to the Chinese Standard (GB5749), as shown in Eq. (16):
where Dr (1×10⁴ m3) is the high-quality water demand in the rth sub-region, and there are a total of R sub-regions in the city. Jr is the number of water works in the rth sub-region. To ensure that the water supply guarantee in each area is greater than 80 %, the total water supplied to every subarea is greater than 80 % of its demand.
Reservoir storage constraint
In the above equations, (1×10⁴ m3) is the storage of the ith reservoir at the end of the configuration period, and Vi,f (1×10⁴ m3) is the flood-limit storage capacity.
Water balance constraint
External-transfer water constraint
In the above equation, Ee,max refers to the maximum water supply capacity of an external water source over the whole configuration period.
Nonnegative constraint
2.2 Second layer of the PTSOA decision-making model
Similarly, the second layer of the PTSOA model fuses all three dimensions of the synergistic water resource allocation mentioned previously. The second stage of the process (the water stored in water works is supplied to different departments needing water volumes of different quality) is optimized in the second layer. After city-level decision-making, a conflict of interest inevitably occurs between traditional water supply departments and unconventional water supply departments. Because conventional and unconventional water supply departments compete for limited water demand market shares, the stability of the water allocation system may be jeopardized if excessive competition is not controlled. Thus, the second layer is implemented at the department level. Decision-making at the department level seeks to guide the two water supply departments to partake in benign competition and avoid conflicts to realize synergy. In this case, the decision plan of the first layer in the hierarchy is followed. Temporally, short-term allocation changes are needed, as mentioned above; hence, the timescale of the second layer is daily. Thus, the daily decision alternatives for the volume of water allocated from water works to different water departments are obtained to make relevant decisions.
2.2.1 Objective functions of the second layer
Conventional water supply department objective function: minimization of the total amount of water retained in water works
The managers of conventional water supply departments strive to operate conventional water systems efficiently and achieve the most equitable water share possible. The amount of conventional water (of high quality) retained in a water works system is a crucial factor affecting the efficiency and benefits of conventional water supply departments. Therefore, the benefit of conventional water departments is established by minimizing the total amount of water retained in water works at the end of a configuration period, as shown in Eq. (22):
where WL (1×10⁴ m3) is the total amount of water retained in a water works system at the end of a configuration period; (1×10⁴ m3) is the water supply from the jth water works system to the zth water user on the mth day in the tth month in the period of configuration; m=1, 2, …, M; and M is the total number of days in the tth month (28, 29, 30, or 31). Additionally, z=1, 2, … Z, and Z is the total number of water users. χjz is the water supply relationship coefficient between the jth water work and the zth water user, where 0 indicates no supply and 1 indicates water supply.
Unconventional water supply objective function: maximization of the amount of unconventional water supplied
The reclaimed water reuse system and ecological water distribution system for inland tributaries are incorporated into the PTSOA model; these are associated with unconventional water supply departments. The managers of unconventional water supply departments seek to supply as much unconventional water as possible to promote their interests. Thus, the objective of unconventional water departments is established to maximize the amount of unconventional water supplied. Unconventional water mainly includes reclaimed water and river water, which is of low quality (i.e., not meeting the quality standard mentioned in Sect. 2.1.2) and is mainly used for industrial production, ecological water replenishment for inland rivers, and municipal road sprinkling.
Unconventional water departments operate reclaimed water reuse systems and ecological water distribution systems to supply unconventional water, and the associated equations (Eqs. (23)–(26)) are as follows:
where Wr (1×10⁴ m3) is the total amount of reclaimed water supplied for all water users; EWr (1×10⁴ m3) is the total amount of river water supplied to maintain ecological flows in inland tributaries; (1×10⁴ m3) is the amount of water supplied to the jth user from the nth reclaimed water source at the tth time step; n=1, …, N; N is the total number of reclaimed water sources; p(bc,bu) is a function expressing the willingness of residents to use reclaimed water; bc (CNY per 1×10⁴ m3) is the price per unit of conventional water; bu (CNY per 1×10⁴ m3) is the price per unit of unconventional water; and θnj is the water supply relationship between the nth reclaimed water source and the jth user. In this case, θnj=1 indicates a water supply relationship, and θnj=0 indicates no water supply relationship. rnz (1×10⁴ m3) is the amount of water supplied from the nth reclaimed water source to the zth inland tributary; z=1, 2,…, Z; Z is the total number of inland tributaries requiring ecological flow compensation; and θnz is the water supply relationship between the nth reclaimed water source and the zth inland tributary.
2.2.2 Constraints of the second layer
Conventional water supply constraint
According to conservation of mass, the total daily amount of conventional water allocated in the second layer should be less than the total monthly amount of conventional water allocated in the first layer, as described in Eq. (27):
Unconventional water constraints
The two types of unconventional water have separate constraints. For reclaimed water supplied to water users, the amount should satisfy the relevant water-recycling standard. The ecological water used to replenish inland tributaries is mainly pumped from reclaimed water works and main rivers. Therefore, this replenished volume is limited by the pumping capacity. The constraints for unconventional water are shown in Eqs. (28) and (29):
where δij is the sewage discharge coefficient, which is the proportion of the water supplied from sewage discharge; ηij is the sewage water reuse rate, which is the proportion of reused water in the total volume of sewage water; PU (1×10⁴ m3) is the amount of water pumped from the main river; and (t d−1) is the flow through the sth pumping station on the mth day at time step t.
Pumping constraints
In the above equations, (t d−1) denotes the upper flow boundary of the sth pumping station, (t d−1) is the power of the pth pump installed at the sth pump station, and Np is the number of pumps installed at the sth pump station.
Water quality constraint
To control the impacts of various point and nonpoint sources on receiving waterbodies in cities, water authorities impose water quality standards for the management of river basins. These standards seek to maintain the water quality at a desired target level by defining discharge limits for conventional, specific, or priority pollutants. To satisfy the relevant standards, the following water quality constraint is established:
where ψij is the sewage water treatment rate, which is the proportion of sewage water that is treated; (mg L−1) is the concentration of the uth contaminant per unit treated water required by the jth user; and Hu (kg) is the upper limit of the uth contaminant allowed to be discharged in the study area.
2.3 Third layer of the PTSOA decision-making model
After obtaining the results for the former two stages of the allocation process and the two levels of decision-making, the third model layer is constructed to achieve regional synergy. It refers to the collaborative allocation of water resources in different sub-regions of a city, and it is intended to balance and maximize the interests of each sub-region as much as possible. Additionally, the needs of different kinds of water users in different sub-regions can be met to the greatest extent possible with this approach. Therefore, the three dimensions of synergy are also fused in this layer. The third stage of the process (the water in different departments is supplied to different kinds of water users, namely, residential users, industrial users, and municipal users, in different sub-regions) is optimized in this layer. After department-level decision-making, conflicts of interest inevitably occur among various water users in different sub-regions of a city. Therefore, the third layer considers regional-level decision-making to coordinate water needs and avoid conflicts between sub-regions in the city. Moreover, the various development priorities of sub-regions are emphasized by adjusting certain hyper-parameters in the third layer. This layer is established based on the allocation scheme obtained in the second layer of the hierarchy, and the timescale of this layer is the same as that of the second.
Although water pollutants are controlled in the second layer, the detailed spatial distribution of pollutants remains unknown. If one of the sub-regions emits a greater pollution load than others such that the river pollution limit is exceeded, it constrains sustainable development and undermines the fairness of the allocation. To ensure the coordination of water quality among regions, the representative pollutant concentration of the main reach in each sub-region after configuration should meet the relevant environmental capacity requirements. If these requirements are not met, the objective function for this sub-region will call for a punishment, and more environmentally friendly plans will be searched. After sewage with pollutants is transported from outlets to waterbodies, advective transport, longitudinal dispersion, and transverse mixing will occur. At the same time, physical, chemical, and biological interactions will occur in the waterbody. To objectively describe the degradation of pollutants in water, it is necessary to use mathematical models to simulate physical dynamics. Due to the heterogeneity of pollutants entering waterbodies and the uncertainty of hydrological processes, it is usually of little practical significance to calculate the change in river water capacity over time. A steady-state model is therefore used to calculate the water capacity of the target waterbody (Cetintas et al., 2009; K. Zhang et al., 2019). When water quality changes are studied at the annual scale and complete mixing is assumed, the following equation (Eq. (31)) can be used to describe the water quality change:
where V (m3) is the volume of water, Q (m3 a−1) is the flow in and out of the system at equilibrium, Ce (g m−3) is the contamination concentration in the inflow (g m−3), C is the pollutant concentration, Sc denotes other external pollution sources (m3 a−1), and r(c) is the reaction rate of pollutants in water (g m−3 a−1). The above equation can be defined as the basic mass balance of a waterbody in a completely mixed system. Because the pollutants are evenly mixed in each small interval, the horizontal and vertical concentration gradients of pollutants can be neglected. Therefore, the model of water quality in mixed rivers under steady-state design conditions is adopted (Yue et al., 2021):
where Wc represents the water environmental capacity (t a−1), Qp is the flow in the reach (m3 s−1), CP is the pollutant concentration in the river (mg L−1), QE is the sewage discharge (m3 s−1), QS is the total flow of nonpoint sources into the reach above the control section (m3 s−1), and Cs is the target concentration of river pollutants (mg L−1). The result calculated based on the total hydrological capacity standard is often relatively large, which is generally referred to as nonconservative. To conform to real conditions, the concept of a nonuniform coefficient is introduced for correction:
This coefficient is used to assign a punishment if the water quality exceeds the relevant value in a given sub-region. Based on the coefficient value, the objective functions and constraints are adjusted accordingly. Finally, the daily decision alternatives for water allocation from water departments to water users are obtained at the regional decision level.
2.3.1 Objective function of the third layer
Regional objective function: maximization of the comprehensive benefits of each sub-region
In the above equations, bij (CNY per m3) is benefit per unit of water supply for the jth user; ωj is the penalty coefficient per unit of water deficiency; j=1, 2, …, Jr; Jr is the number of water users in rth sub-region; r=1, 2, …, R; Pr(rnz) is the penalty function for cost in the rth sub-region; ei (CNY per kW h−1) is the unit electricity fee; (kW h−1) is the electrical power consumed by the pth pump at a pump house in each hour; p ranges from 1 to Pr; Pr is the total number of pumps in the rth sub-region; ∇tr (h) is the time required for water transfer to provide support for the inland river flow in the rth sub-region; ωij (CNY) denotes the fee paid for sewage treatment; lnz (m) is the length of a water diversion pipe from the reclaimed water source n to the zth inland river; z ranges from 1 to Zr; Zr denotes the number of inland rivers in the rth sub-region; CASnz (m2) is the cross-sectional area of a pipe from the nth reclaimed water source to the zth inland river; (m3) is the maximum overflow capacity of the diversion pipe from the nth reclaimed water source to the zth inland river; Gr(xij) is the penalty function for substandard water quality in the rth sub-region; (mg L−1) is the final concentration of the uth pollutant in the control section of the zth inland river in the rth sub-region after optimal configuration; (mg L−1) is the initial concentration of the uth pollutant in the zth inland river in the rth sub-region; and q is the penalty coefficient for substandard water quality in the rth sub-region. The number of objective functions in this layer depends on the number of sub-regions divided in the city, which is based on local conditions.
2.3.2 Constraints of the third layer
Water quality constraints
Mathematical models are often developed to help satisfy the water quality standards at monitoring points (W. Zhang et al., 2019; Pourshahabi et al., 2020; Friesen et al., 2017). However, for some cities with very few monitoring points, such approaches may lead to good water quality in the monitored sections and poor water quality in other sections. In these circumstances, the quality of waterbodies in each sub-region of a city is not simultaneously maintained. To maintain the water quality in all sub-regions of a city at the desired target level, the water quality constraint in Eq. (38) is established:
where (mg L−1) denotes the control standard for the uth pollutant in the control section of the zth inland river in the rth sub-region.
2.4 Model solution
2.4.1 Synergy degree evaluation
Enhancing the understanding of the synergy among water allocation alternatives to achieve broad coordination and equilibrium is crucial. The evaluation of the synergy of a complex water resource system is strongly related to multiple complex interactions, such as the interactions among different processes, users, and regions. However, these interactions have rarely been explicitly captured in prior evaluations of water allocation. One of the key network metrics used in network analysis, connectivity, is a promising measure of the degree of coordination among different objectives in complex systems (Weitz et al., 2018). Connectivity reflects the connectedness of a given link to all possible links in the network, and the strength of each link is weighted, reflecting the number and strength of correlations (Felipe-Lucia et al., 2020). In this study, connectivity is used to embody coordination in the context of synergy, as shown in Eq. (26). Due to the limited supply of water resources, competition among different objectives is unavoidable, and the objectives cannot be fully optimized to equal extents, i.e., an increase in one target output may decrease another output. Therefore, equilibrium is integrated as another vital part of the synergy devoted to maintaining a balance among the satisfaction of each goal in a system. The equilibrium based on the principle of information entropy (Gao et al., 2013; Zivieri, 2022) is shown in Eq. (27). Information entropy is a measure of the uncertainty associated with a random variable and is used to quantify the information contained in a message, usually in bits or bits and symbols; furthermore, it has been widely used to represent the fairness or equilibrium of a system (Chen et al., 2022; Zhao et al., 2022). When H is low, the level of equilibrium in the system is high. This factor is also used to be compared with the proposed index. By combining the quantification of coordination and equilibrium, the synergy degree is appropriately determined (Eq. 29). Notably, the total synergy index (TSI) of a system is used for both generating candidate management alternatives in the generation phases of PTSOA and performing assessments of the associated level of synergy, as shown in Eqs. (41)–(44):
where is the connectivity of the ith object; cij is the Pearson correlation between the ith object and the jth object; obi and obj are the values of the ith and jth objective functions respectively; H(S) is the overall equilibrium of all objects based on the principle of information entropy, and it is abbreviated as H in the following; is the standardized value of the ith object; N is the total number of objects in the system; and obi,min and obi,max are the minimum and maximum critical thresholds of the parameter obi respectively. SSI ranges from 0 to N, approximately, and higher SSI indicates higher connectivity of the objects in the system, which means it is easier for them to promote each other. H ranges from 0 to , approximately, and lower H indicates better overall equilibrium from an objective perspective. TSI is greater than 0. When a water resource system's TSI value is higher, the degree of synergy is higher. In our application, based on actual evaluation, we define TSI≥5 as an indication that the degree of synergy is satisfactory; is defined as moderate, and 3>TSI is defined as low.
2.4.2 Hierarchical optimal algorithm design for the PTSOA model
Based on the algorithm design with a hierarchical objective function proposed by Li et al. (2022), a new level is added to the original two levels of the algorithm, and the alternative generation phase is improved for better synergy. In this algorithm, the objective functions in the upper decision level are first satisfied, and then the lower-level objective function provides an optimal result based on the results of optimal allocation in the upper level. To provide solutions that are as comprehensive as possible, the decision alternatives need to be classified into different sets for further selection. In addition, the synergy degree of the result of each layer is calculated to select optimal decisions among all Pareto front solutions. The detailed steps of the hierarchical optimal algorithm are as follows.
- I.
In the first level, calculate the objective-function (city-level) values for the social, economic, and sustainable-development components and sort the results with NSGA-III (Pourshahabi et al., 2020; Chen et al., 2017) to obtain each Pareto front F1, F2, …, Fi.
- II.
Classify the Pareto fronts into K (K is determined based on the diversity of policies) elements with the K-means algorithm (Liu et al., 2022), which is used to partition a data set into K distinct and non-overlapping clusters. To perform K-means clustering, we first specify the desired number of clusters K. Then, the K-means algorithm is used to assign each observation to exactly one of the K clusters.
- III.
Calculate the synergy degree of each individual in the front, and select the solution that yields the greatest synergy in each cluster. K solutions are obtained in the first layer.
- IV.
Use the selected K solutions in the first layer to establish constraints in the second layer. Solve the objective function of the second layer with NSGA-III.
- V.
Calculate the synergy degree of each individual in the front and select the solution that yields the greatest synergy, as well as the two solutions that maximize the conventional and unconventional water supply department objective functions in all Pareto fronts with K preconditions.
- VI.
The three selected solutions in the second layer are used to establish constraints in the third layer. Solve the objective function of the third layer with NSGA-III under the three preconditions.
- VII.
The synergy degree of each individual in the front is calculated, and the solution that yields the greatest synergy in the third layer is selected. Three solutions are obtained considering the synergy in the former two layers. Finally, the synergistic configurations optimal for all stages in the whole process are identified considering the synergy among decision levels, processes, and timescales.
3.1 Study area
Yiwu is selected as a case study to validate the applicability of the PTSOA model. This city is in southeast China, located at 29°02′13′′–29°33′40′′ N and 119°49′–120°17′ E and covering an area of 1105 km2. The area is characterized by a scarcity of water resources, and the conventional water supply is under severe stress. The regional water consumption depends heavily on transported water and external water transfer. The per-capita water resource is, in total, 622 m3, which is only 22.6 % of the provincial average and 19.1 % of the national average. Moreover, the problem of water pollution has become a bottleneck constraint for the development of Yiwu. Therefore, it represents a typical water-scarce city with limited conventional water. Notably, water quality in Yiwu has been subjected to significant environmental stress because of the negative effects of wastewater discharge with the rapid development of industry. The current water quality is poor, classified as Class V, and the main pollutant concentrations exceed the corresponding standards (Zhejiang Provincial Bureau of Natural Resources, 2020). As shown in Fig. 3, the Yiwu River crosses the city from northeast to southeast. Additionally, there are six ecological water compensation outlets in six main tributaries in the Yiwu River. In Fig. 3, the white labels indicate five sub-regions in the city, the black labels near the reservoirs are their names, the black labels named O1–O6 indicate the name of the water distribution outlets, and the labels near the lifting pump station are their names.
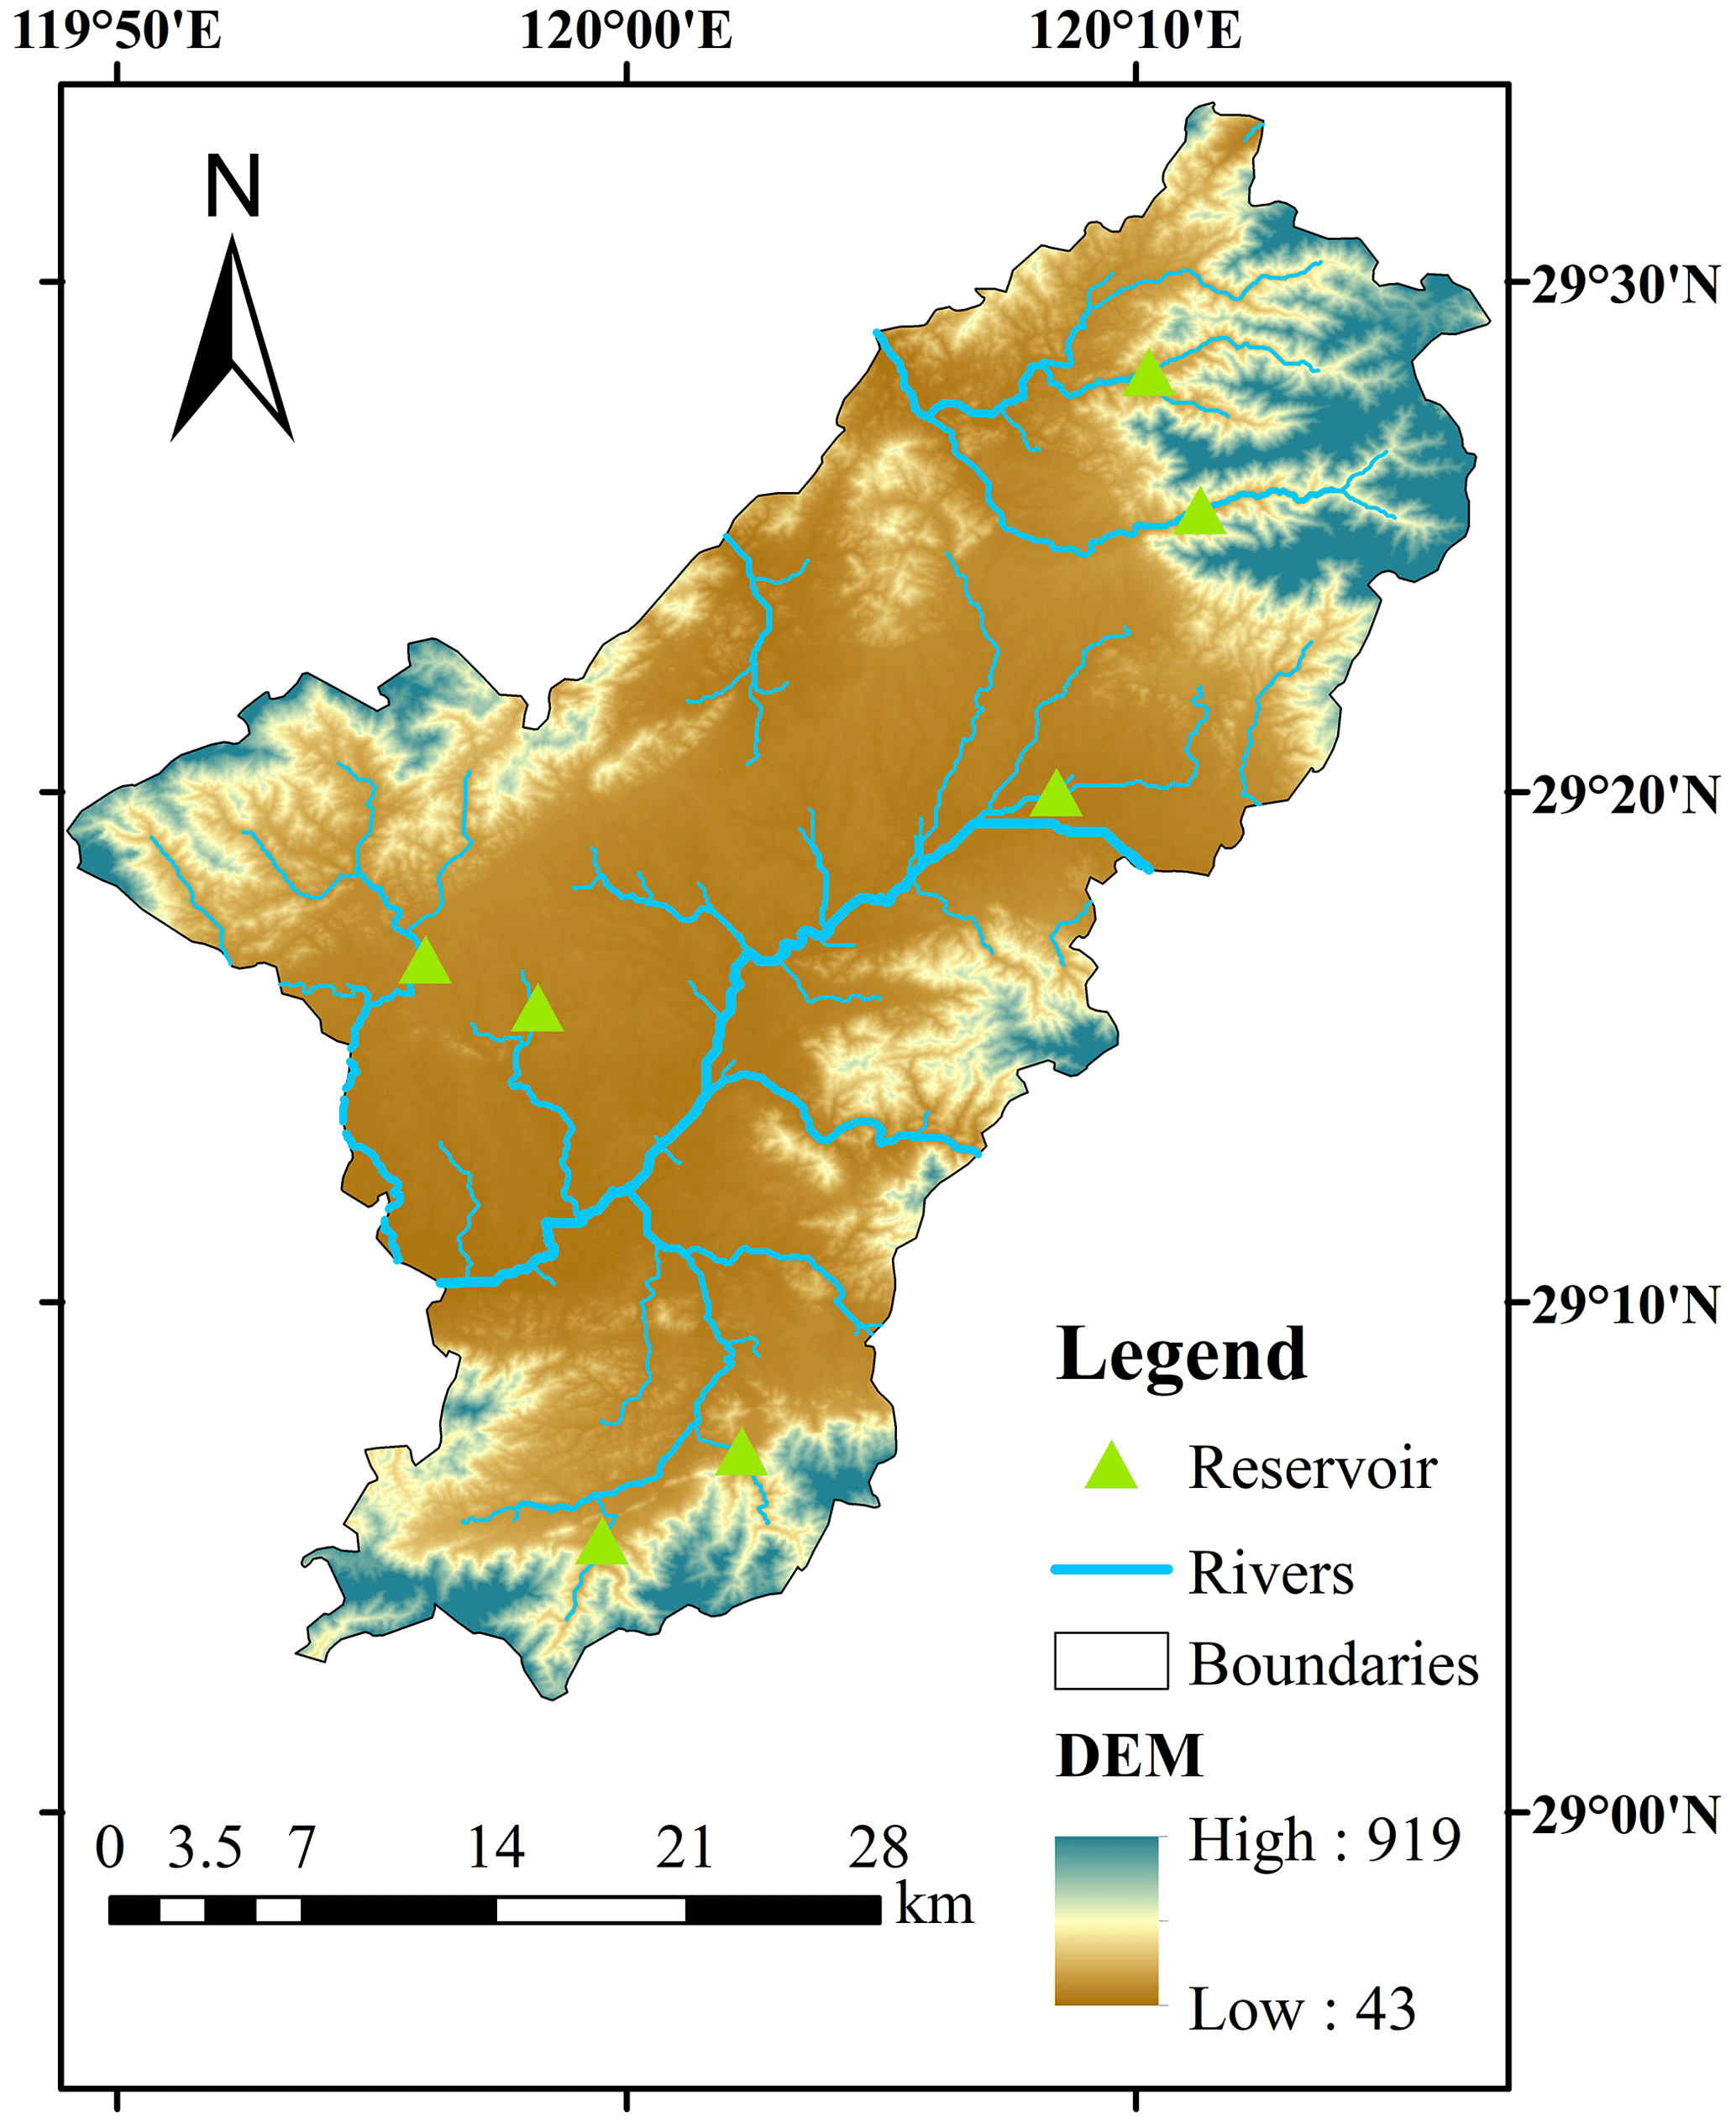
Figure 3Map of the study area.
3.2 Generalization of the complex water resource system
An initial multi-source, complementary, and mutually regulated system has been developed for Yiwu, and this system spans the entire urban water cycle (water source – water supply – water use – drainage – drainage collection – recycling and reuse). To apply the optimal water allocation model to the complex real-world water system, all stakeholders in the complex water resource system should be schematized into a topological system, as shown in Fig. 4. The diagram comprises five modules: water sources, water supply, water use, water drainage, and external discharge for all stakeholders.
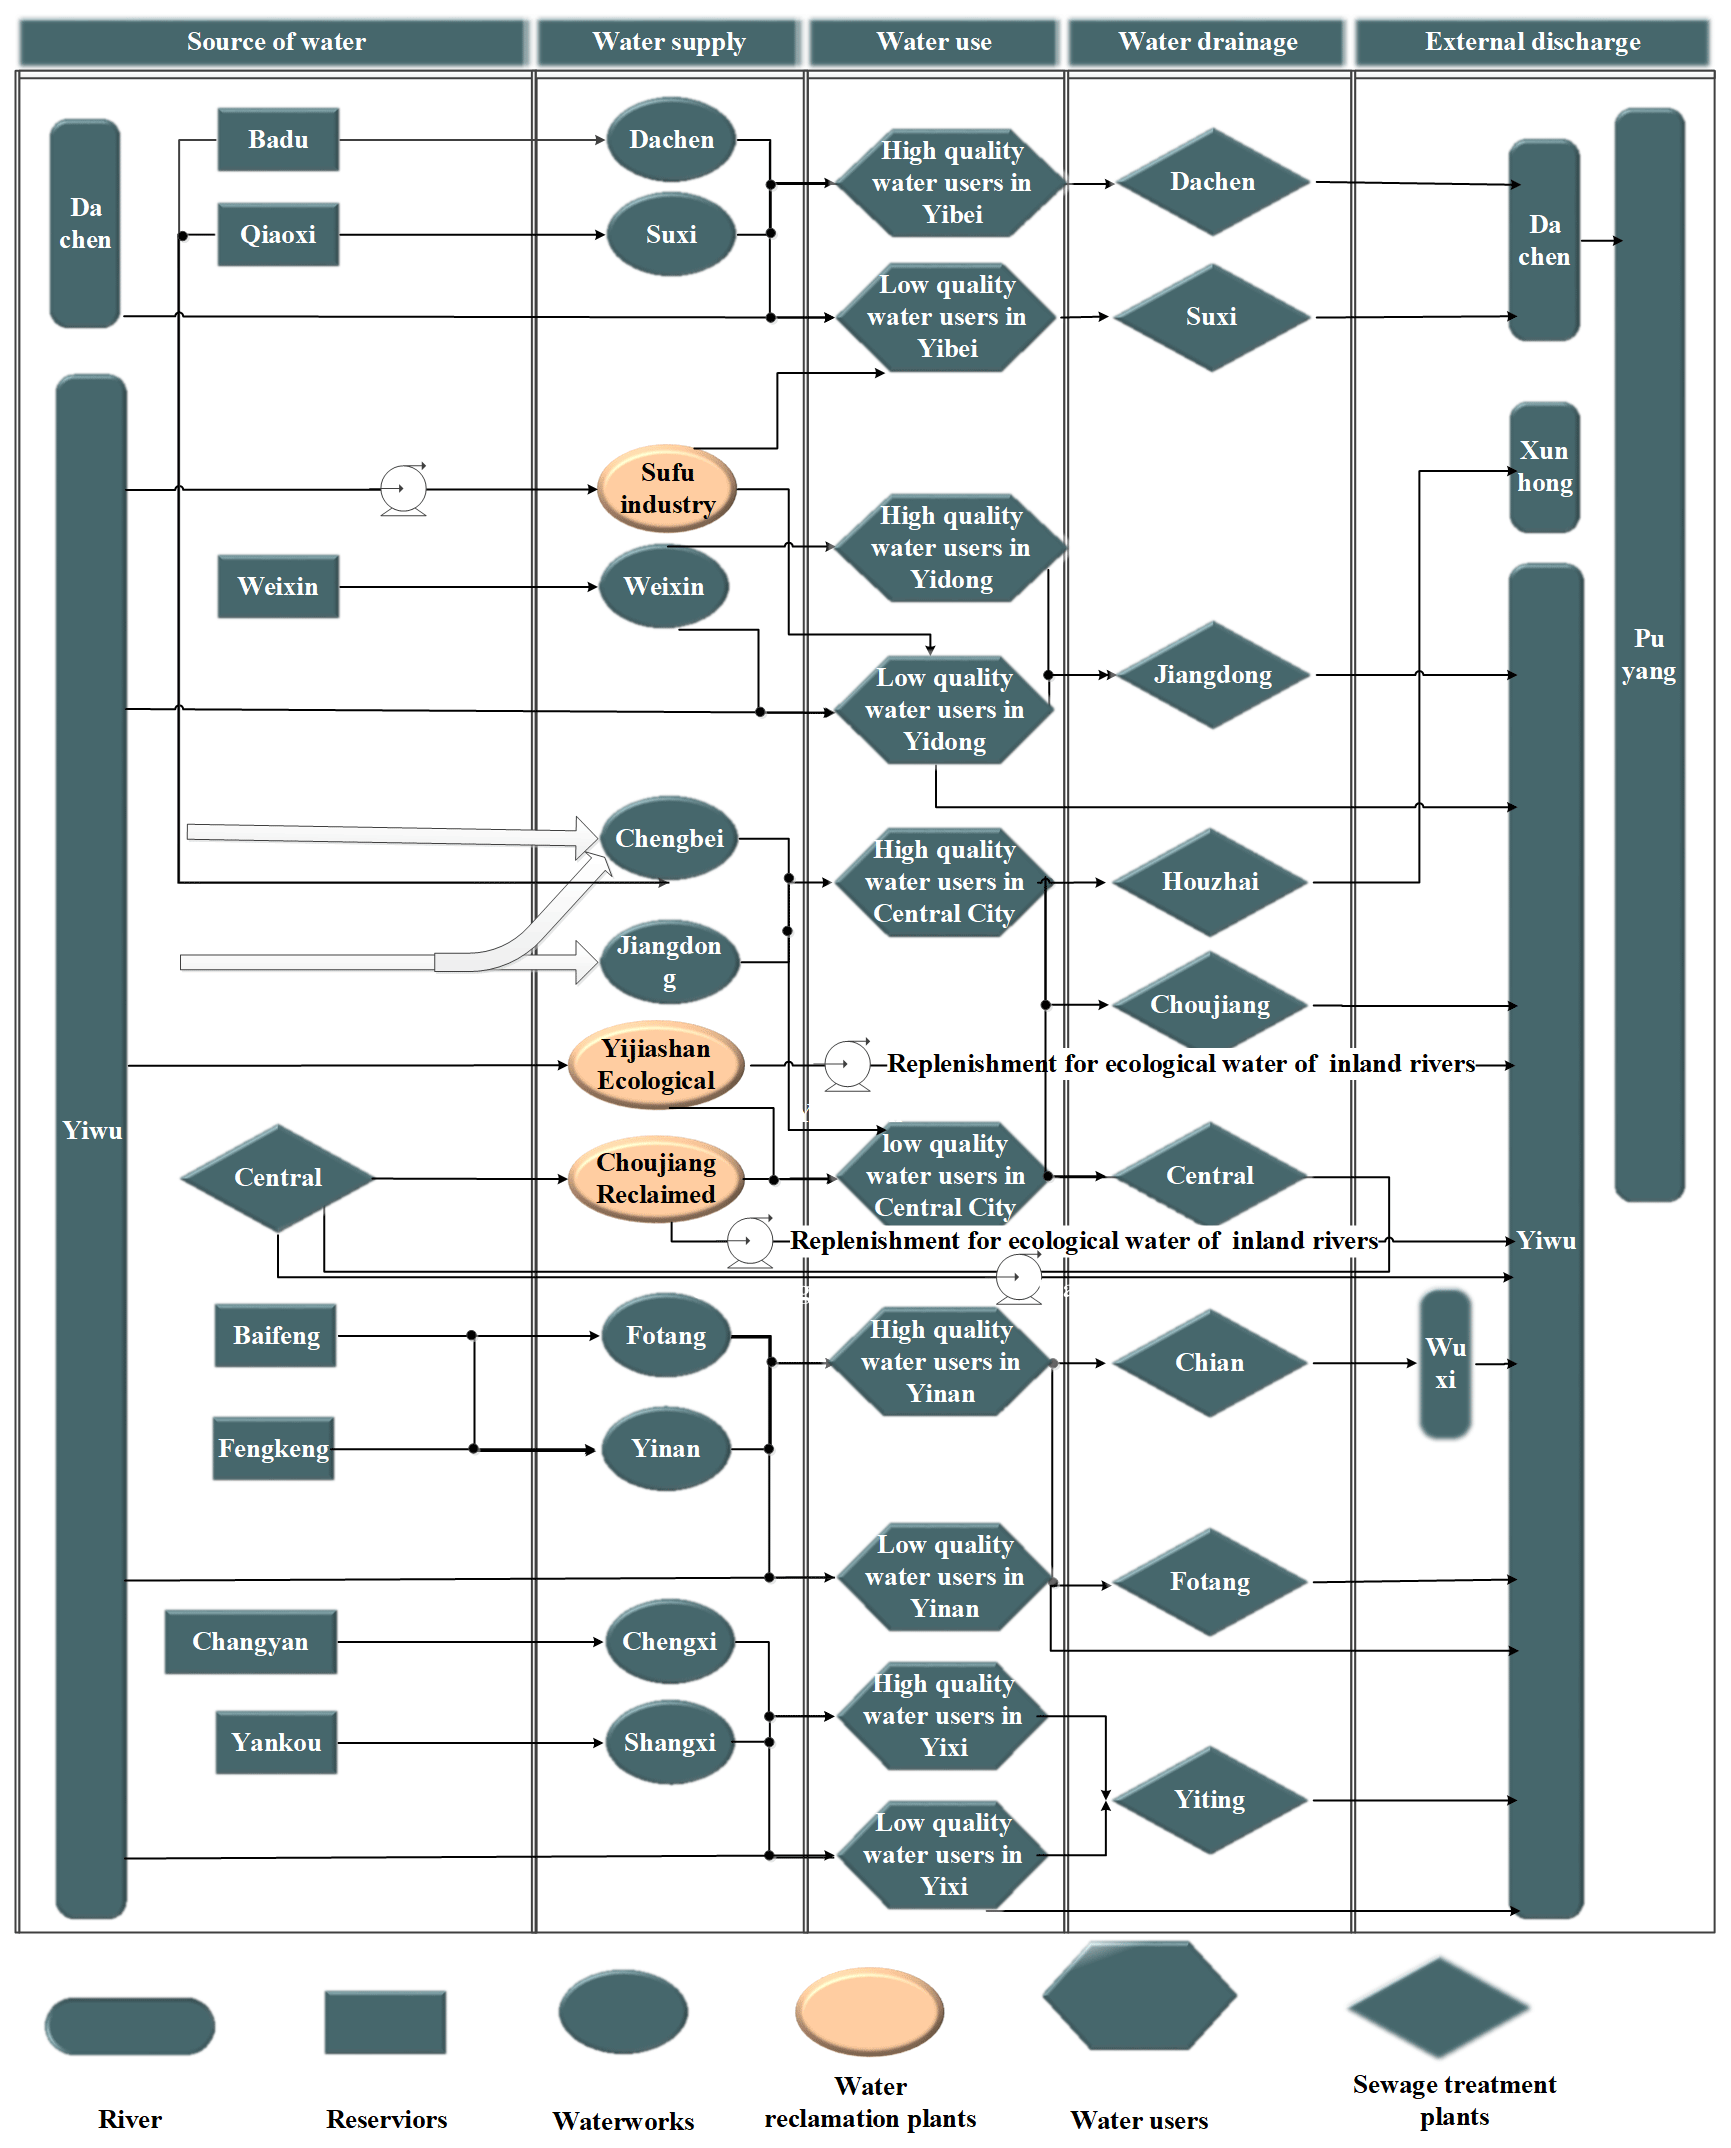
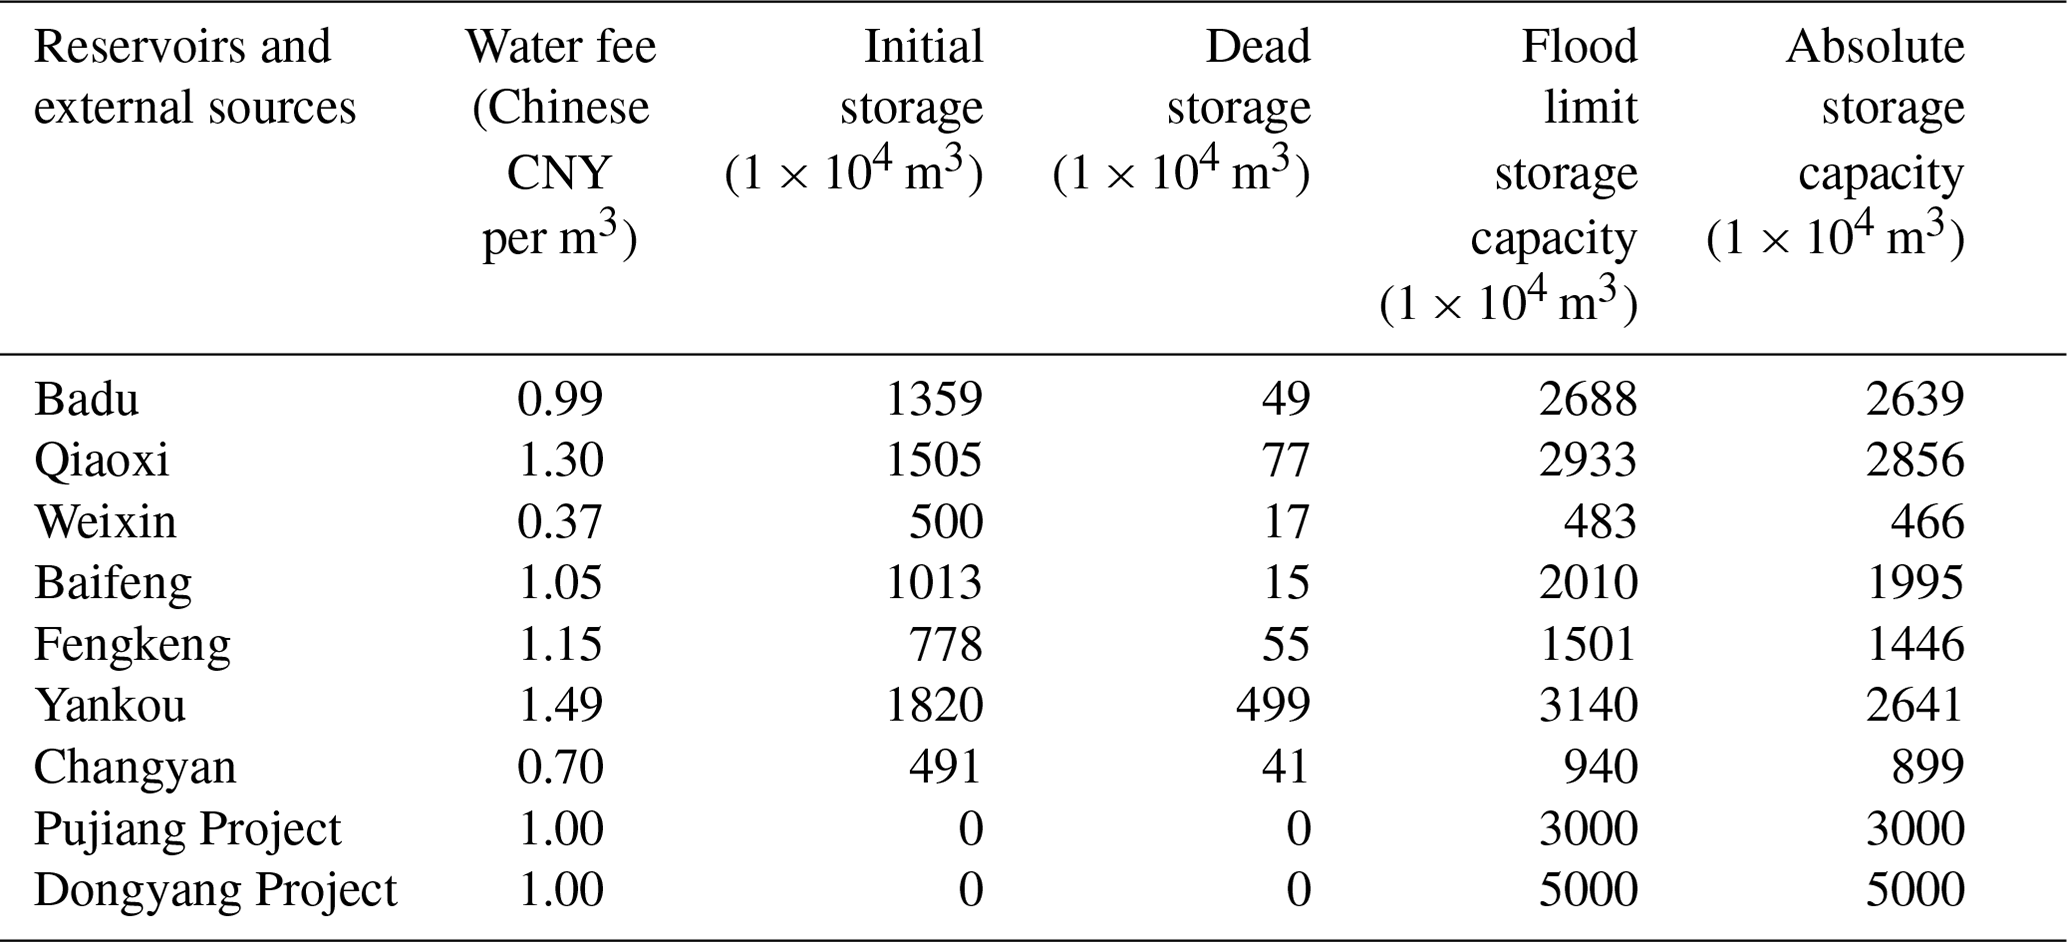
The first module includes seven main reservoirs, two water diversion projects, the Central Sewage Treatment Plant, and the Yiwu River. The seven reservoirs and two water diversion projects (as shown in Table 1) supply high-quality water. There are complex connections between the first and second modules. For example, two reservoirs supply water to one water work, or one reservoir feeds two or three water works simultaneously. The reservoirs also supply some of the agricultural and ecological waters to subareas of the city. The Yiwu River, with a total length of 38.39 km and 21 first-class tributaries in the city, and the Central Sewage Treatment Plant, as shown in Table 2, are low-quality water sources. There are no data available for agricultural irrigation water, and most agricultural irrigation water is supplied from surface water stored in hundreds of small reservoirs and mountain ponds (Yiwu Ecological Environment Status Bulletin, 2020). So, this water volume is ignored in the model.
Table 1Water demands of various regions in Yiwu in 2020 (1×10⁴ m3).

Table 2Parameters of the reservoirs and external water division projects.
For the second module, high-quality water piped from reservoirs is transported to nine urban and rural centralized waterworks (as shown in Table 2). The Yiwu River distributes low-quality water to the Yijishan Ecological Water Plant and Sufu Industrial Water Plant through the Yijishan and Baisha water pump stations respectively. The water discharged at the Central Sewage Treatment Plant is transferred to the Choujiang Industrial Water Plant. Based on the water supply project distribution and the economic and social development levels, Yiwu is divided into five districts, as shown in Table 3: the Central District, Yidong District, Yibei District, Yinan District, and Yixi District. The third module comprises both high-quality water users (high-quality water users consist of urban and rural domestic water users and some industrial water users in the water supply network of urban and rural public water plants) and low-quality water users (low-quality water users include other industrial water users, municipal water users, and ecological water replenishment for inland rivers) in each district. There are nine sewage treatment plants in the fourth module (which focuses on the drainage stage), as shown in Table 2. The non-reused water from sewage treatment plants is discharged to the external environment. Reuse processes are also considered in the system.
3.3 Parameter determination
According to the flow duration curve of the annual natural inflow data for 51 years (1963–2014), 3 years with exceedance probabilities of 50 %, 75 %, and 90 % are selected to represent normal (January 1984–January 1985, annual mean inflow: 1.33×10⁸ m3), dry (January 2008–January 2009, annual mean inflow: 1.11×10⁸ m3), and extremely dry (January 1971–January 1972, annual mean inflow: 0.63×10⁸ m3) scenarios respectively. In addition to inflow, the data used in the PTSOA model mainly include the data for the parameters in each layer. Water demand values were calculated using the Yiwu City Water Resources Comprehensive Plan 2020, as shown in Table 1.
The water resource fees paid to the government are, in total, CNY 0.3 per m3. The parameters of the reservoirs and external water division projects in Yiwu are listed in Table 2.
The Tennant method is applied to calculate the ecological water demand. In this method, the relationship between the annual average discharge and habitat quality is considered, and the percentage of the annual average natural runoff is used as the recommended value of the ecological water demand for a given river channel. According to the recommended values, the percentage of runoff required for the fish-spawning period from April to September is 30 %, and the percentage runoff in the general water consumption period (October to March) is 10 %.
Based on observations obtained with the F601 evaporator (a standard evaporation instrument widely used in China), evaporation is calculated as follows:
where EP (mm) is the evaporation of a reservoir, E (mm) is the observed evaporation, and k is a reduction coefficient. According to observations, the difference in this coefficient is quite slight within a small watershed (Zhao, 2014). Thus, k is simplified to the same value of 0.88 for every reservoir and varies throughout the year according to expert experience (Zhao, 2014). The prices of conventional water and reclaimed water are CNY 1.7 and 2.6 per m3 respectively. In our application of the model, this precipitation component associated with the water sources was calculated by the Thiessen polygon method (Liu et al., 2014) based on the measured data of seven rainfall stations (Shi Caotou, Suxi, Yiwu, Fotang, Baifeng, Fengkeng, Changfu) in the basin in the normal (January 1984–January 1985), dry (January 2008–January 2009), and extremely dry (January 1971–January 1972) scenarios.
The monthly mean monitoring data for effluent pollutant concentrations and the daily maximum processing capacities of sewage treatment plants were obtained from the monitoring systems of the sewage treatment plants. For example, the concentrations of COD, NH3-N, TN, and TP in the sewage of the Jiangdong Sewage Treatment Plant are 13.80, 0.22, 6.02, and 0.13 mg L−1 respectively. The daily maximum processing capacity of Jiangdong Sewage Treatment Work is 12×104 t d−1. The effluent quality of sewage treatment works satisfies the Class-A standard used in China. The maximum capacities of the Baisha pump station, Yijiashan pump station, Choujiang pump station, and water treatment center pump station are 13, 13.5, 10, and 4.5 t d−1 respectively.
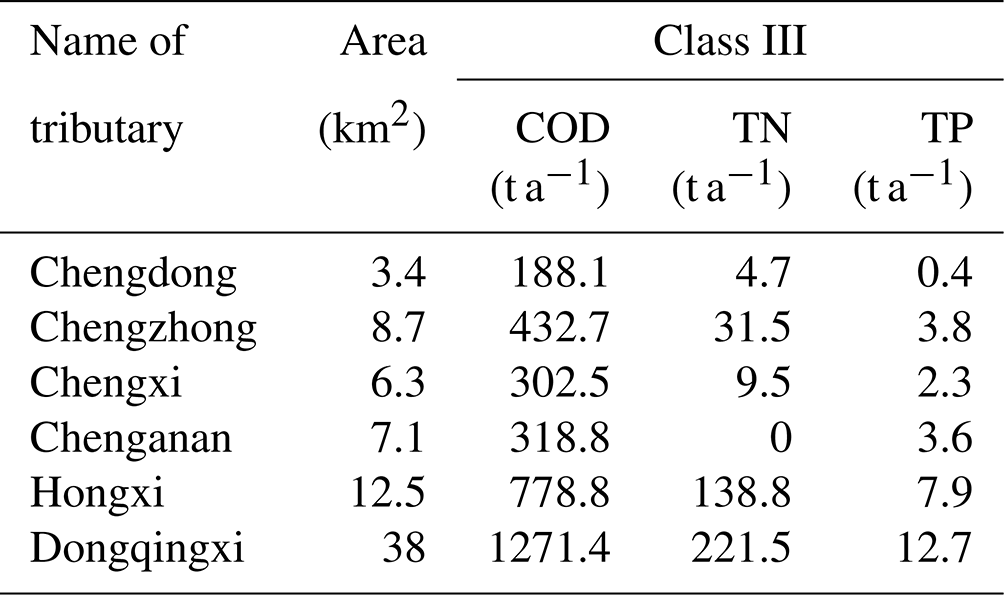
Additionally, the environmental capacities of the six tributaries that are replenished with ecological water are calculated according to Eqs. (31)–(33), and the results are listed in Table 3. COD, TP, and TN are major pollutants in Yiwu (Yiwu Ecological Environment Status Bulletin, 2020), and they are also the major controlled pollutants of all the monitoring sections. So, they were selected as representative pollutants in the tributaries to guarantee the water environmental quality of inland rivers. The water quality goals for the tributaries must conform to the Class-III standard according to GB 5749-2006 in China. The unit electricity price of pump stations in Zhejiang Province is CNY 0.41 per kW h−1. GB50014-2006 (2014 edition) stipulates that the comprehensive urban domestic sewage quota should be 80 %–90 %, and the urban comprehensive domestic sewage quota should be 90 % in areas with extensive drainage facilities. There are many influencing factors in the model, and the most important ones among them are the value of water demand, the value of available water, and some key hyper-parameters. According to the Jinhua Water Resources Bulletin (2020), the urban comprehensive domestic sewage quota is set to 90 %, and the sewage treatment rate is set to 100 %. The benefits per unit water supply for different users in different sub-regions are determined from the Yiwu Water Supplies Bureau (2020).
By solving the PTSOA model for Yiwu, synergistic optimal water allocation results for different layers (across different decision levels, water use sectors, and sub-regions) are obtained under normal, dry, and extremely dry conditions. Pareto sets are obtained across 500 runs and 1000 iterations (in most cases) of the PTSOA model with the proposed hierarchical optimization algorithm. If the feasible solutions could not be found in some cases, the number of iterations would be increased. It took approximately 34 h of CPU time on a computer with 32 GB memory and an Intel Core i7 (3.4 GHz) CPU. Therefore, in this study, each iteration for a single trial solution takes 0.24 s of CPU time on the computer with the named specifications.
4.1 First layer of the PTSOA model for synergistic optimal water allocation
To demonstrate the relationship among conflicting objectives, sets of Pareto solutions for the first layer under normal, dry, and extremely dry conditions are shown in Fig. 5. In each of the figures, the total water supply shortage, total water supply benefit, and total amount of water retained in reservoirs in Yiwu are plotted. The color of the markers indicates the classification of the solutions of the K-means method, as described in Sect. 2.4.2. All of the decision alternatives are classified into six groups marked in different colors for broad-scale decision-making. The names of the classes are marked in the figure in red (for example, K1-1 represents the first class of solutions in the normal scenario, and K3-2 represents the second class of solutions in the extremely dry scenario). The red arrows indicate optimization directions. The ideal solution is located at the top-right corner (low total water supply shortage, high total water supply benefit, and relatively high total amount of reserved water in reservoirs) of the plot. The geometries of the trade-offs vary significantly across the applications, as is expected given different hydrological conditions. Generally, the total water supply shortage and the total amount of water retained in reservoirs show an inverse relationship. In contrast, the total water supply benefit shows a direct and positive influence on the total water supply shortage. The water shortage varies in the ranges of –0.8×10⁵ m3, –2.0×10⁶ m3, and 0–3.5×10⁶ m3 in normal, dry, and extremely dry scenarios respectively. The average water demand is around 1.8×10⁸ m3, and water shortages of the selected decision alternatives are all less than 9×10⁶ m3. So, the water supply reliability of the selected decision alternatives is greater than 95 % under normal, dry, and extremely dry conditions with the consideration of water demand. The total amount of reserved water in reservoirs under normal scenarios varies in the range of 2.91×10⁷ m3 to 6.14×10⁷ m3, which is much higher than that under the extremely dry scenario, with a value of 1.44×10⁷ m3 to 2.93×10⁷ m3. This finding demonstrates that the optimal allocation is able to reconcile the present demand and future needs, even in extremely dry scenarios. The total water supply shortage in all scenarios is less than 5 % of the water demand, which indicates that the guaranteed water supply is greater than 95 %.
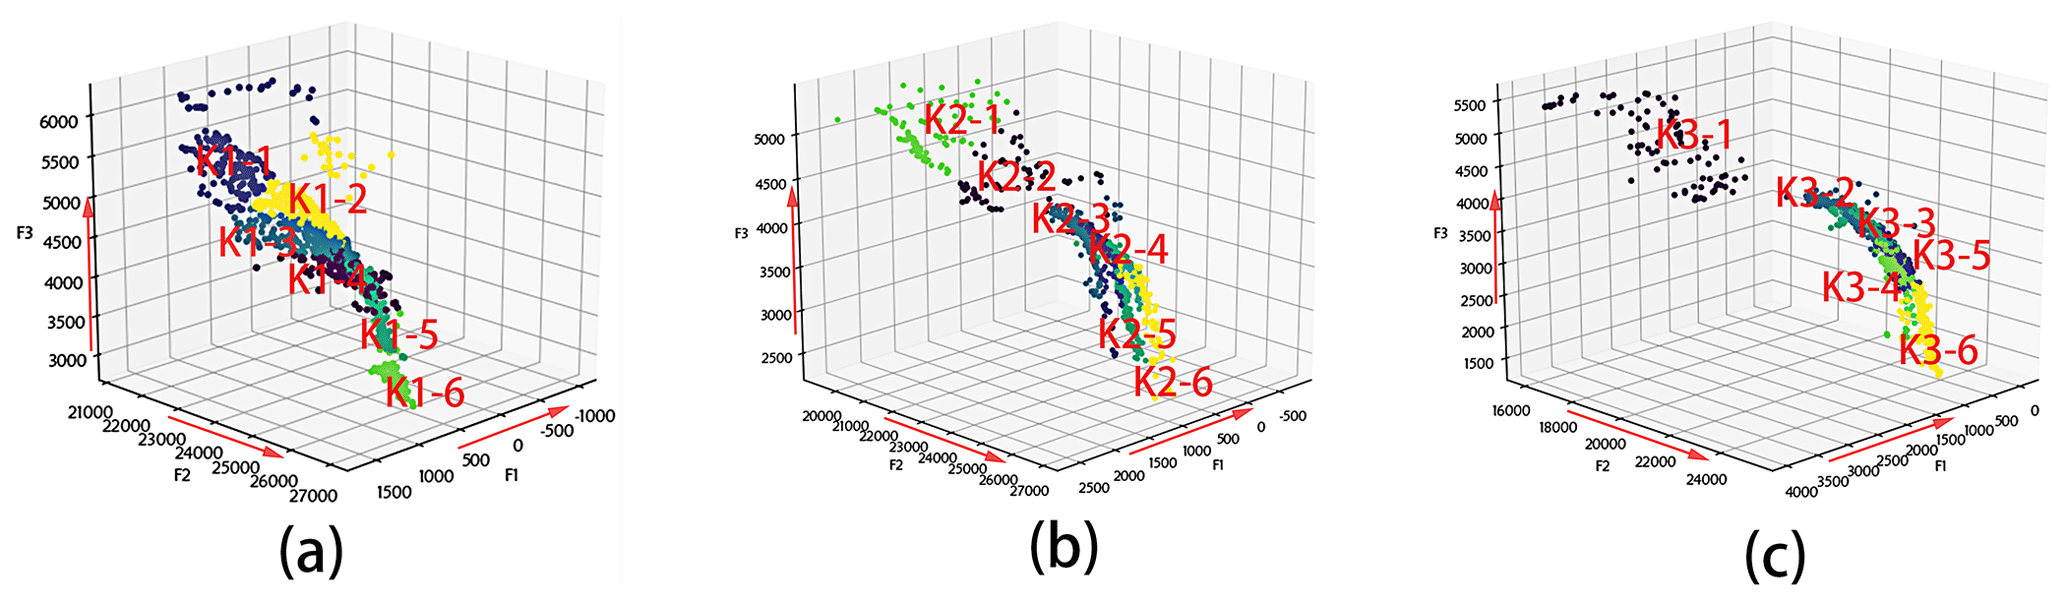
Figure 5Sets of Pareto solutions after 500 model simulations with the hierarchical optimal algorithm under (a) normal, (b) dry, and (c) extremely dry scenarios. F1: total water supply shortage, 1×10⁴ m3; F2: total water supply benefit, CNY 10 000; F3: the total amount of reserved water in reservoirs, 1×10⁴ m3. The red arrow indicates the direction of optimization. K1−n, K2−n, and K3−n represent the nth class of solutions in the normal, dry, and extremely dry scenarios respectively; n=1–6.
We further present the TSI, SSI (total connectivity), and H (overall equilibrium) values for different classes characterized based on the optimal PTSOA solutions under three scenarios, as shown in Fig. 6. In the PTSOA model, the Pareto solutions with the best TSI values are input to the second layer for further optimization. Thus, the red points in Fig. 6 represent the selected schemes for all classes. We observe that the variation in the TSI is consistent with that in the SSI in some but not all cases. In some cases, differences are mainly caused by the influence of H, which influences the optimal hydrological equilibrium, especially in dry conditions. These results suggest that, when water is very limited, equally limited water is supplied to all users, thus enhancing the overall equilibrium. We note that the SSI value is higher in the normal scenario than in the other two scenarios. We attribute this to relatively abundant water being useful for stakeholders to achieve synergy due to the reduced competition compared to other cases. The TSI values reach maximums of 5.36, 7.37, and 10.82 under normal, dry, and extremely dry conditions respectively.
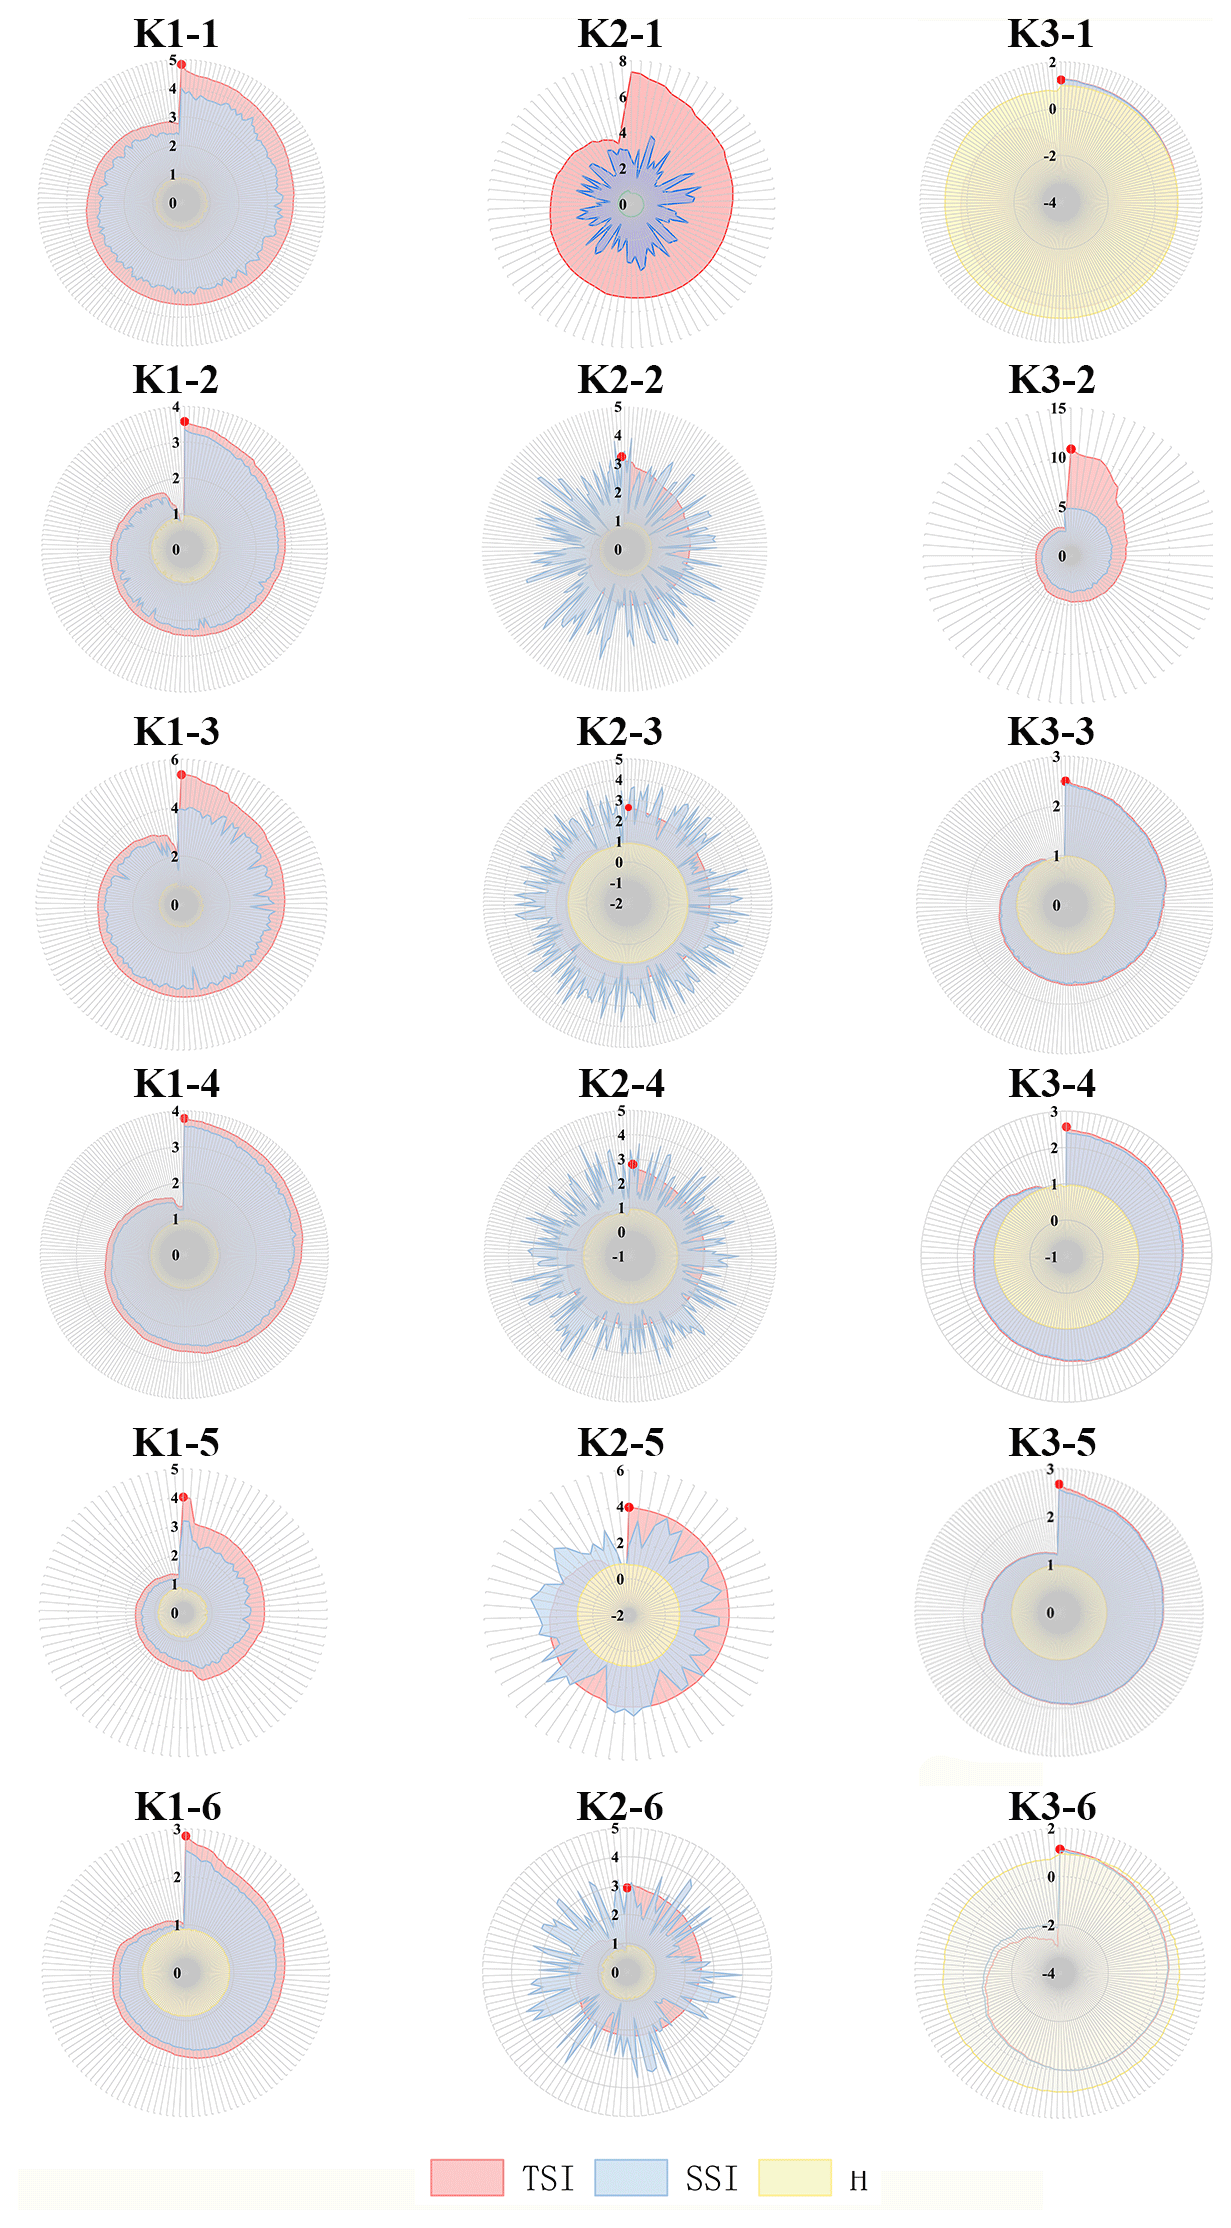
Figure 6Comparison of TSI (total synergy index), SSI (total connectivity), and H (overall equilibrium) values among various Pareto solutions in different classes for the (K1) normal, (K2) dry, and (K3) extremely dry scenarios. K1−n, K2−n, and K3−n represent the nth class of solutions in the normal, dry, and extremely dry scenarios respectively; n=1–6.
In Fig. 6, the values of TSI are significantly diverse among different scenarios and different solutions. H is widely used to evaluate the equality of different solutions (Gao et al., 2013; Li et al., 2022). As a contrast, the values of H, which are used for comparison and construction of TSI, show slight differences among solutions and are even the same in some classes. Therefore, it is difficult for decision-makers to select the best solution among all candidates if we only use H for evaluation and selection in the decision process. Compared to H, TSI introduces SSI into evaluation, and the difference in the coordination relationship between different schemes is distinguished by SSI. However, H only pays attention to the equity among the stakeholders. So, TSI is more effective and valid than H to some extent. Additionally, since TSI is used to illustrate the synergy of allocation plans under certain conditions, the three kinds of TSI values are not comparable.
As an example, Fig. 7 provides the specific water supply decision alternatives for the first layer that maximize synergy in each cluster under normal conditions. The water allocation plans for the seven main reservoirs and two external water diversion projects in every month of the configuration period are displayed. All reservoirs and water works are represented by abbreviations based on their full names in Fig. 7. For example, QX-CB is the label for the water supplied from Qiaoxi Reservoir to Chengbei Water Works. The water volumes supplied by Qiaoxi Reservoir to Chengbei Water Works (ranging from 1.78×10⁷ m3 to 3950×104 m3) and from the Pujiang External Water Division Project to Chengbei Water Works (ranging from 2.57×10⁷ m3 to 3×10⁷ m3) are relatively high in all clusters. This result is consistent with the fact that Chengbei Water Works is one of the main conventional water sources for the central city area, a region that accounts for more than 50 % of the total water demand of Yiwu. The water supplied by the two external water diversion projects from August to December is higher than that in other months. The mean monthly precipitation in these months is only 58 %–74 % of the mean annual precipitation in Yiwu, so more external water is supplied for replenishment. Baifeng and Fengkeng reservoirs supply similar volumes of water to their two connected water works.

Figure 7Water supply from each reservoir to connected water works in each month in the normal scenario 1×10⁴ m3. K1−n represents the nth class of solutions in the normal scenario; n=1–6.
4.2 Second layer of the PTSOA model for synergistic optimal water allocation
The 6×3 decision alternatives selected in the six clusters of the optimal first-layer results in the scenarios are inputs into the second layer for further optimization. As shown in Fig. 8, the total amount of water retained in water works and the amount of unconventional water supplied show a negative correlation. In the alternative generation phase of game bargaining between the two objectives, the greater the total amount of water retained in water works is, the greater the amount of unconventional water that will be supplied, which indicates that more conventional water will be saved when more unconventional water is supplied. Conversely, the amount of unconventional water supplied is affected by the total amount of water retained in water works.
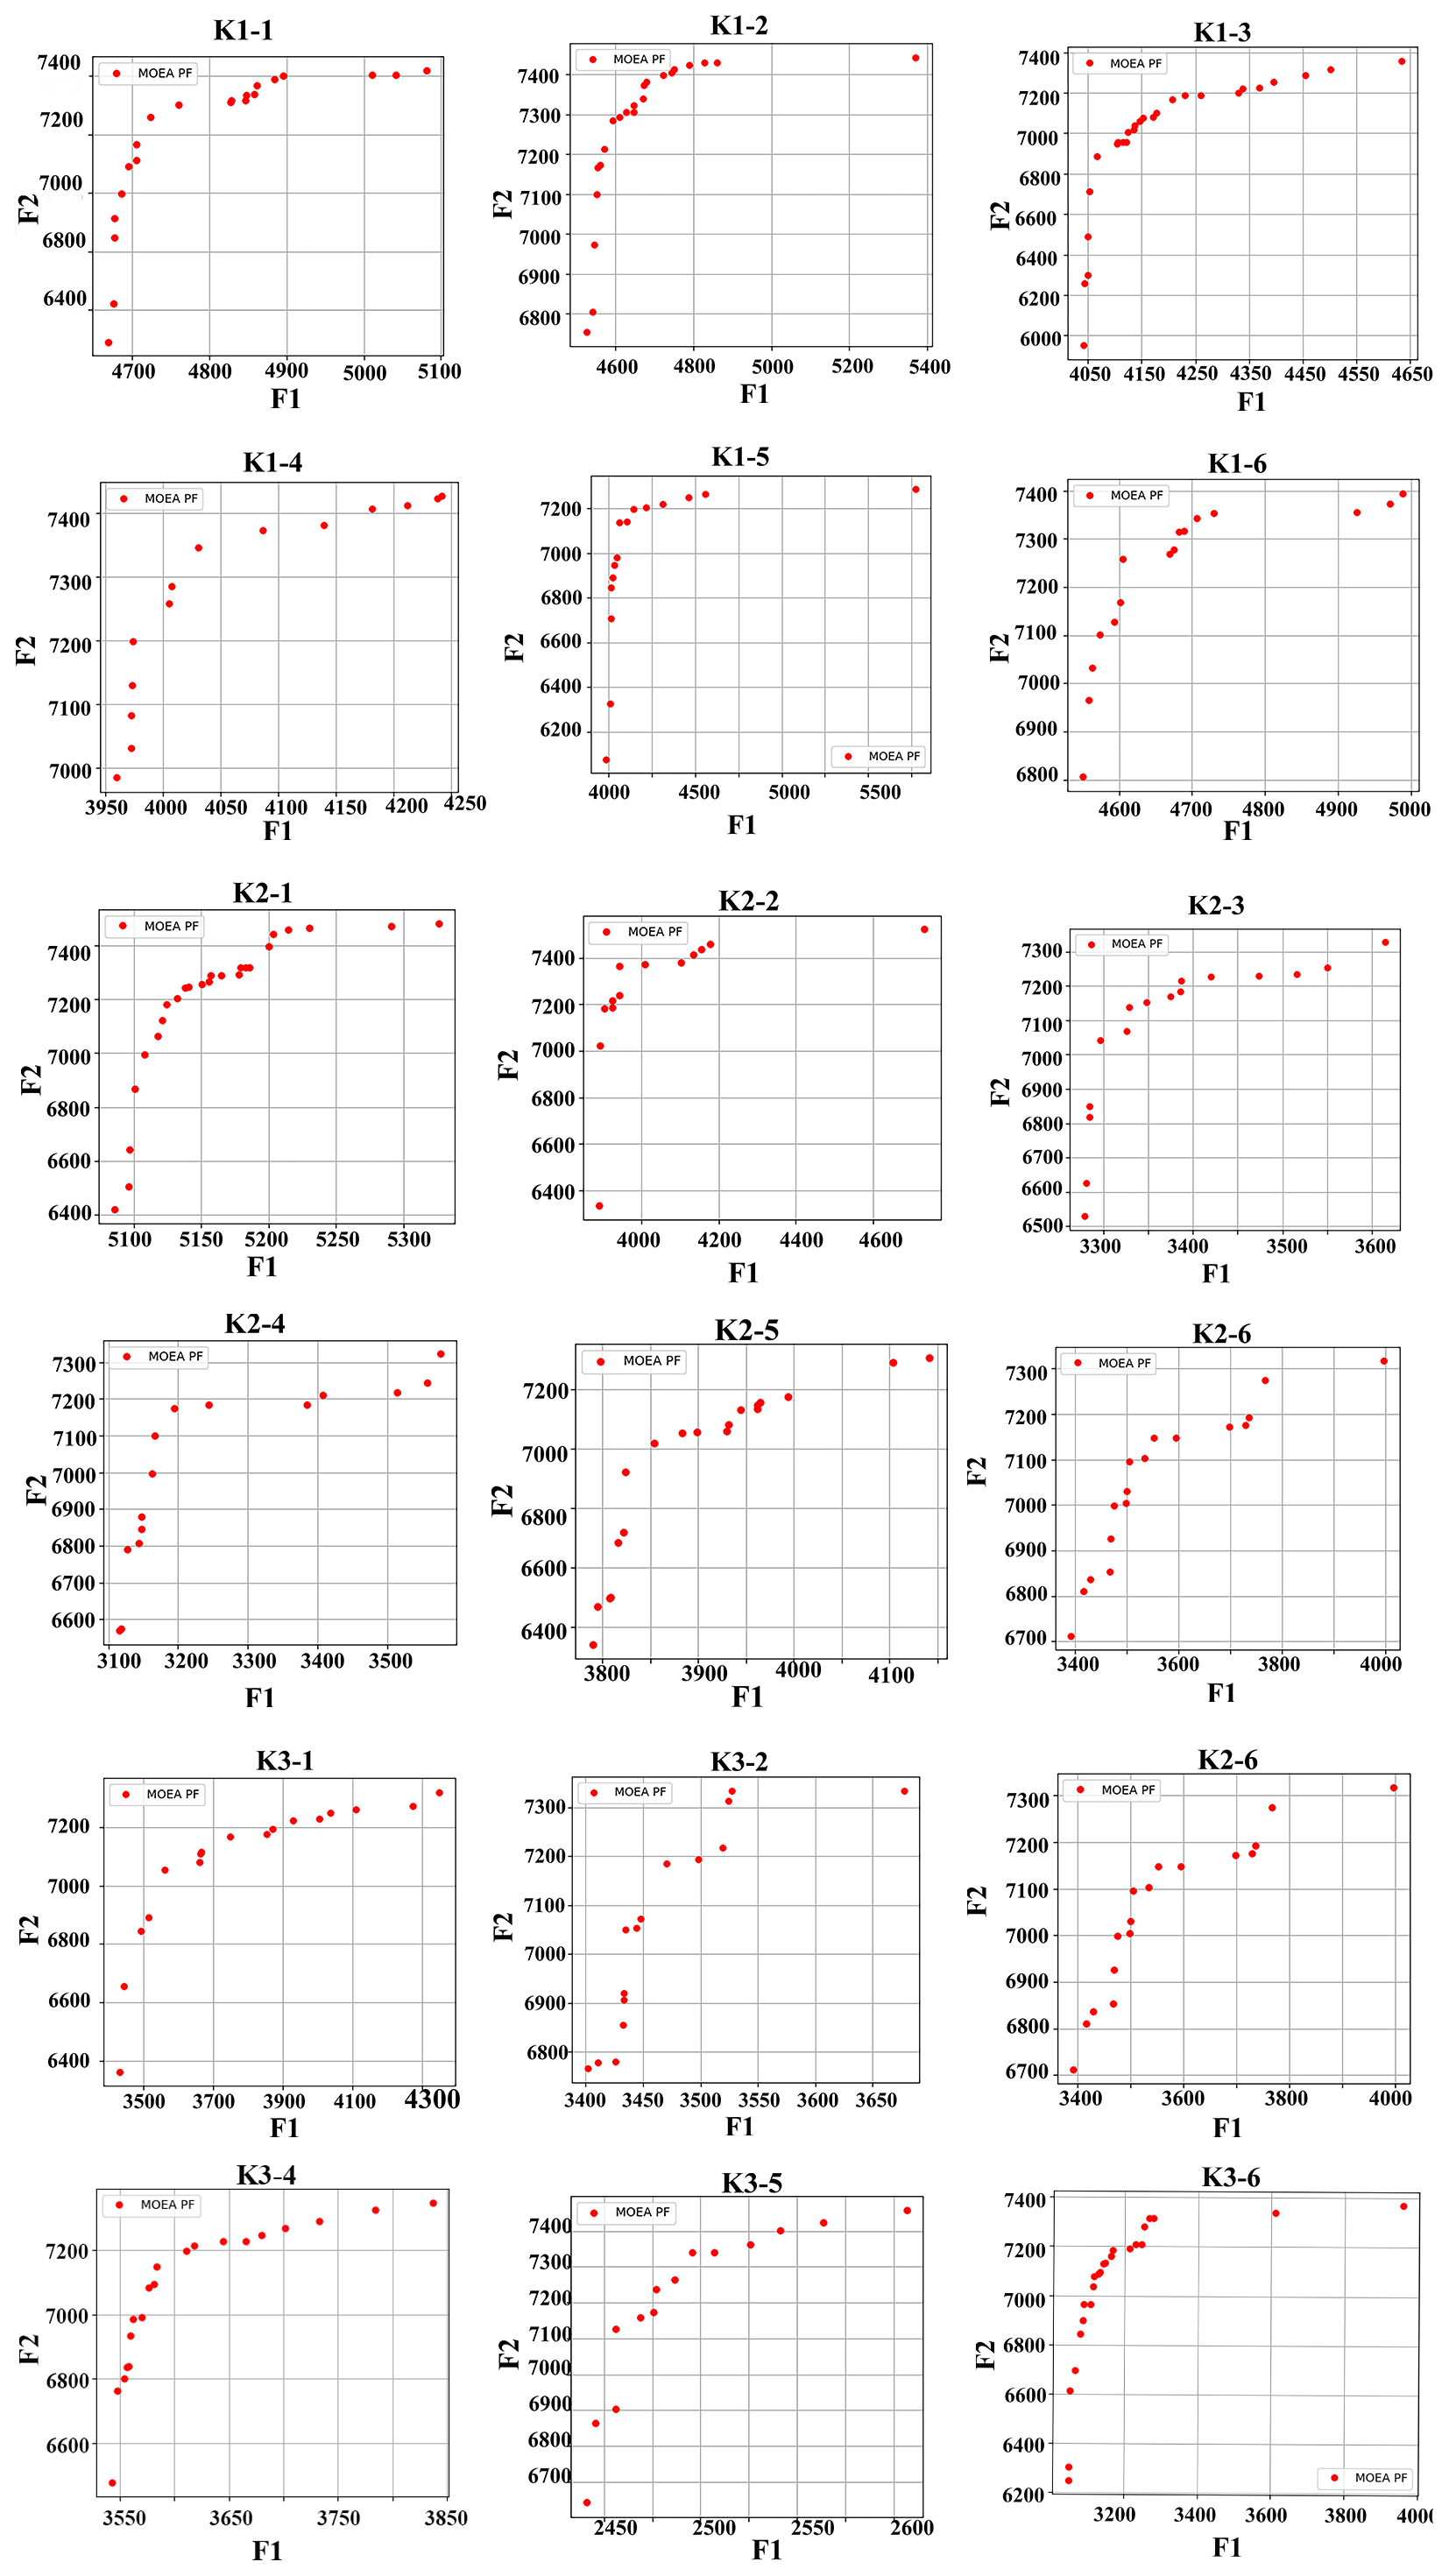
Figure 8Pareto fronts of the second layer in the PTSOA model after 500 simulations with the hierarchical optimal algorithm in the normal, dry, and extremely dry scenarios. F1 represents the total amount of water retained in water works (1×10⁴ m3); F2 represents the amount of unconventional water supplied (1×10⁴ m3). The direction of optimization is from the top-right corner to the bottom-left corner. K1−n, K2−n, and K3−n represent the nth class of solutions in the three scenarios respectively; n=1–6.
In the second layer, three alternatives in each scenario are selected as prior conditions for further optimization. In addition to the two individual extrema of the two objectives, the alternative that yields the best synergy is also identified, and it is similar to that in the first layer. In the normal scenario, the TSI values are −0.90, −1.02, and −0.88 in the cases with the optimal conventional water supply, unconventional water supply, and synergy respectively. The most synergistic approach includes 7.08×10⁴ m3 more conventional water retained than that in the conventional water supply cases and 9.72×10⁴ m3 more than that in the optimal unconventional water supply case. Therefore, the best TSI value is obtained, and the requirements of both conventional and unconventional water supply departments are also met.
Overall, the total amount of water retained in the water works ranges from 3.95×10⁷ m3 to 5.75×10⁷ m3, 3.12×10⁷ m3 to 5.31×10⁷ m3, and 2.43×10⁷ m3 to 3.96×10⁷ m3 for the three types of conditions. The total amount of unconventional water supplied ranges from 5.95×10⁷ m3 to 7.48×10⁷ m3, 6.34×10⁷ m3 to 7.56×10⁷ m3, and 6.28×10⁷ m3 to 7.37×10⁷ m3 in the normal, dry, and extremely dry scenarios respectively. Moreover, by selecting the solution with the highest TSI, 7.35×10⁷ m3, 7.56×10⁷ m3, and 7.37×10⁷ m3 of unconventional water would be supplied as an effective supplement to conventional water. In other words, conventional water would be saved by our proposed model and index in the three scenarios. It is notable that the drier the conditions are, the lower the amount of water retained in water works and the greater the amount of unconventional water supplied are. Thus, this approach is useful for cities to mitigate the risk of drought. Additionally, based on the constraints regarding the contaminants allowed to be discharged, more than 1272.21 and 48.81 t of COD and ammonia nitrogen emissions are avoided per year.
4.3 Third layer of the PTSOA model for synergistic optimal water allocation
Figure 9 shows the trade-offs among the five objectives in the third layer of the PTSOA model for the (S1) normal, (S2) dry, and (S3) extremely dry scenarios (these abbreviations are used to distinguish these results from those of the above two layers). The number following “–” represents the selected solution from the second layer. For example, S1–1 represents the normal scenario with the minimum total amount of water retained in water works, S1–2 represents the normal scenario with the maximum unconventional water supply, and S1–3 represents the normal scenario with the maximum synergy degree in the second layer. In each of these plots, the abscissa denotes the identifier for the objective functions, which ranges from 1 to 5, and the ordinate gives the objective values in the Pareto fronts (CNY 10 000). The five dimensions include the comprehensive benefits of the Yibei (1.0 dimension), Yidong (2.0 dimension), Yixi (3.0 dimension), Yinan (4.0 dimension), and central city (5.0 dimension) sub-regions. As shown in the figure, the central city achieves the most comprehensive benefit among the five sub-regions. This is primarily attributed to the large population and intensive industry in this area. However, the benefits in the other four sub-regions are also high compared to recent levels and those achieved with traditional allocation methods, as shown in Table 9. Interestingly, the comprehensive benefits in the sub-regions are greater in the scenario with the maximum synergy degree under normal conditions than in the other two scenarios. The total comprehensive benefits in the five sub-regions in this scenario are approximately CNY 230–510 million higher than those in other cases, which indicates that the solution with the highest synergy degree in the second layer is the best choice for managers in normal years.
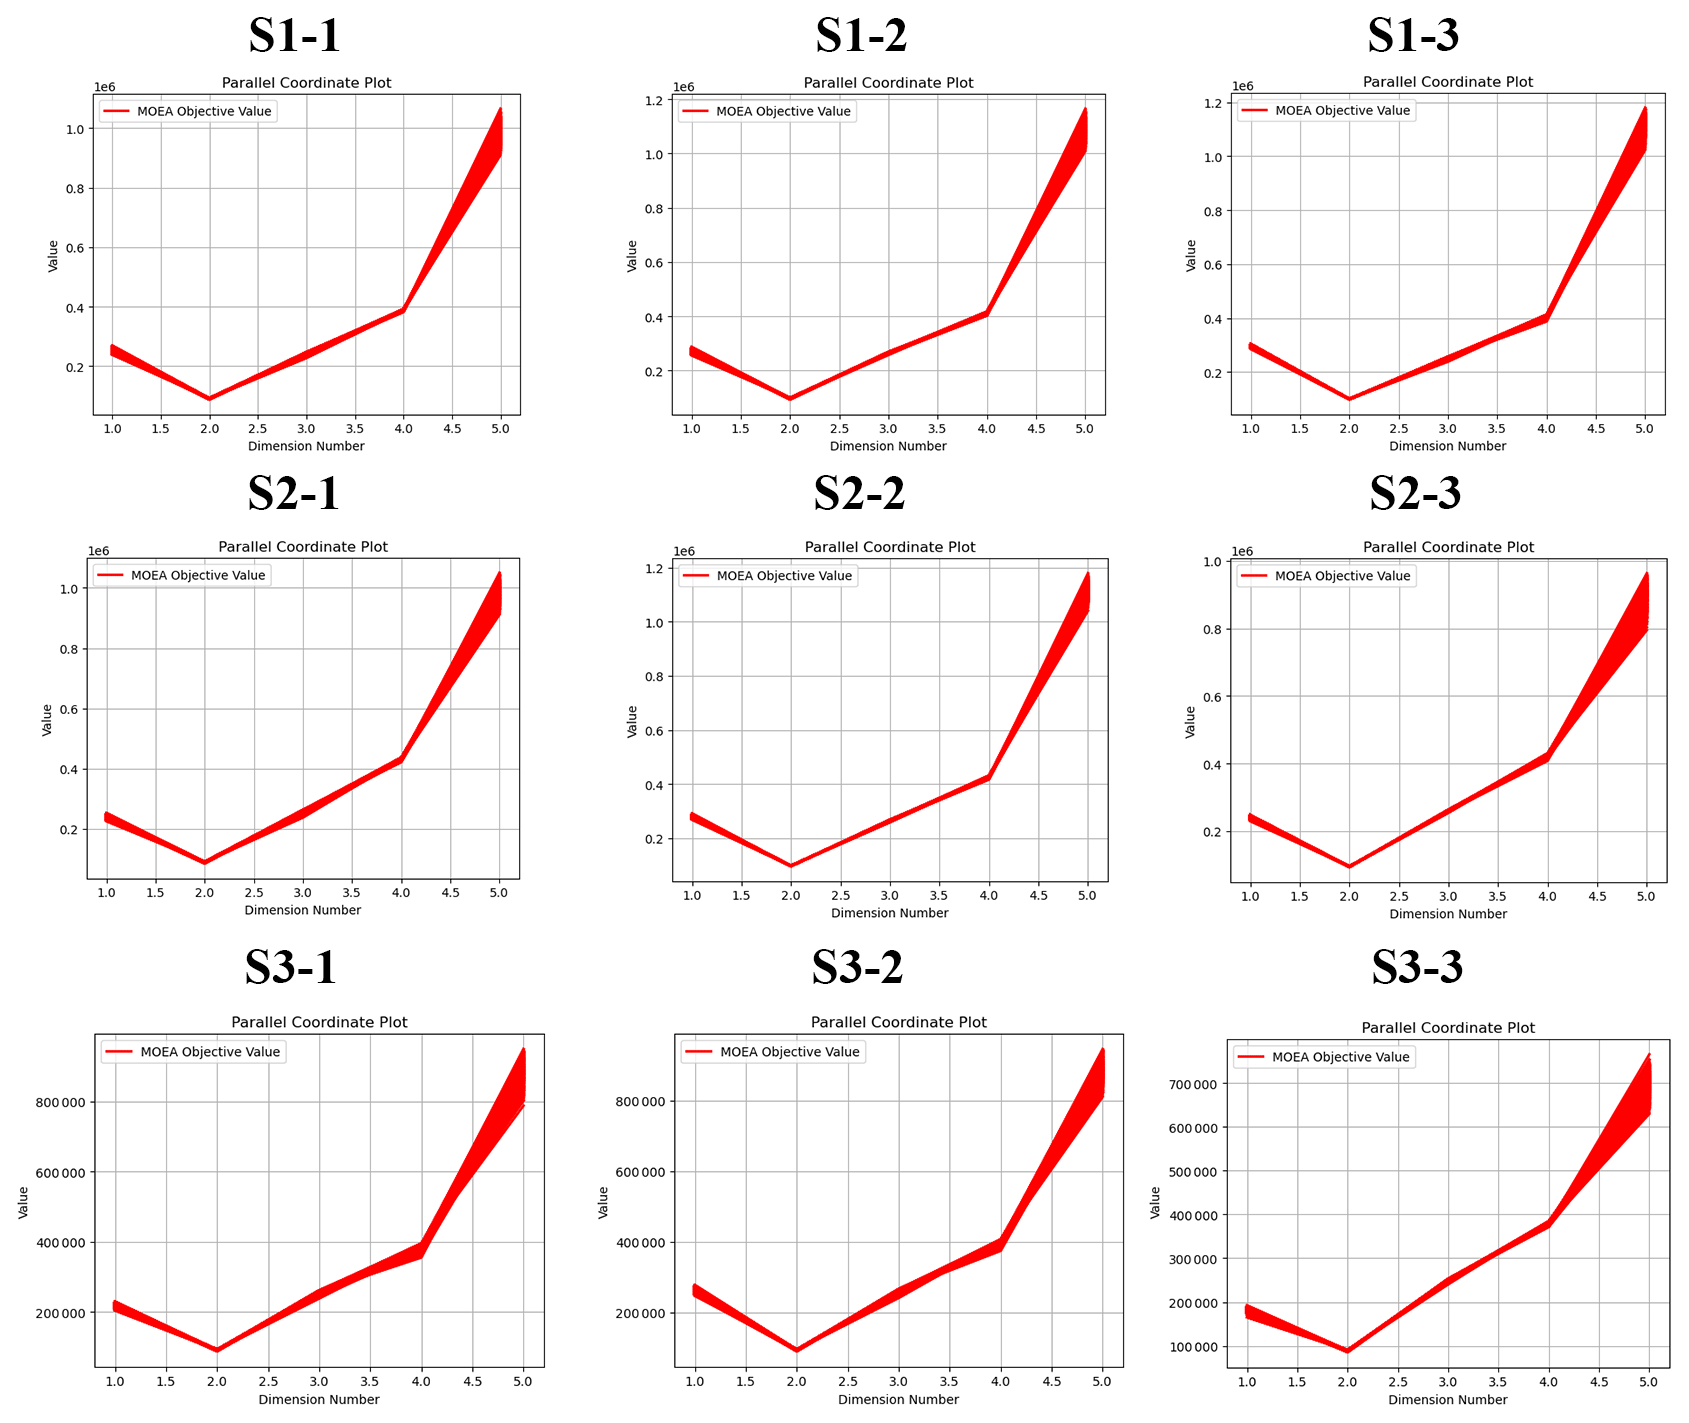
Figure 9Illustration of parallel-reference Pareto sets from the third layer in the PTSPOA model attained across all runs for the (S1) normal, (S2) dry, and (S3) extremely dry scenarios S1–1 represents the normal scenario with the minimum total amount of water retained in water works, S1–2 represents the normal scenario with the maximum unconventional water supply, and S1–3 represents the normal scenario with the maximum synergy degree in the second layer.
Figure 10 presents the optimal comprehensive benefit in each sub-region. In all scenarios, the central city is associated with the highest comprehensive benefit, followed by Yixi and Yinan, and the comprehensive benefit in Yidong is relatively low. This result may be related to Yidong, which has the smallest area (72.2 km2) and the smallest population (7.7×10⁴). Among the three normal decision alternatives, F1, F2, and F5 are highest in S1–3, with values of CNY 30.3 billion, CNY 990 million, and CNY 11.2 billion respectively. This indicates that considering the synergy degree could increase the comprehensive benefit in most sub-regions in the normal scenario. Among the alternatives in the dry and extremely dry scenarios (excluding F4 and F5), other objectives are highest in S2–2, with values of CNY 2.84 billion, CNY 963 million, and CNY 267 million respectively. It suggests that maximizing the unconventional water supply is beneficial for the system in dry conditions. Additionally, F4 is highest, with a value of CNY 2.29 billion, in S2–3 among the three solutions in the dry scenario, and F5 is highest, with a value of CNY 9.17 billion, in S3–1 in the extremely dry scenario.
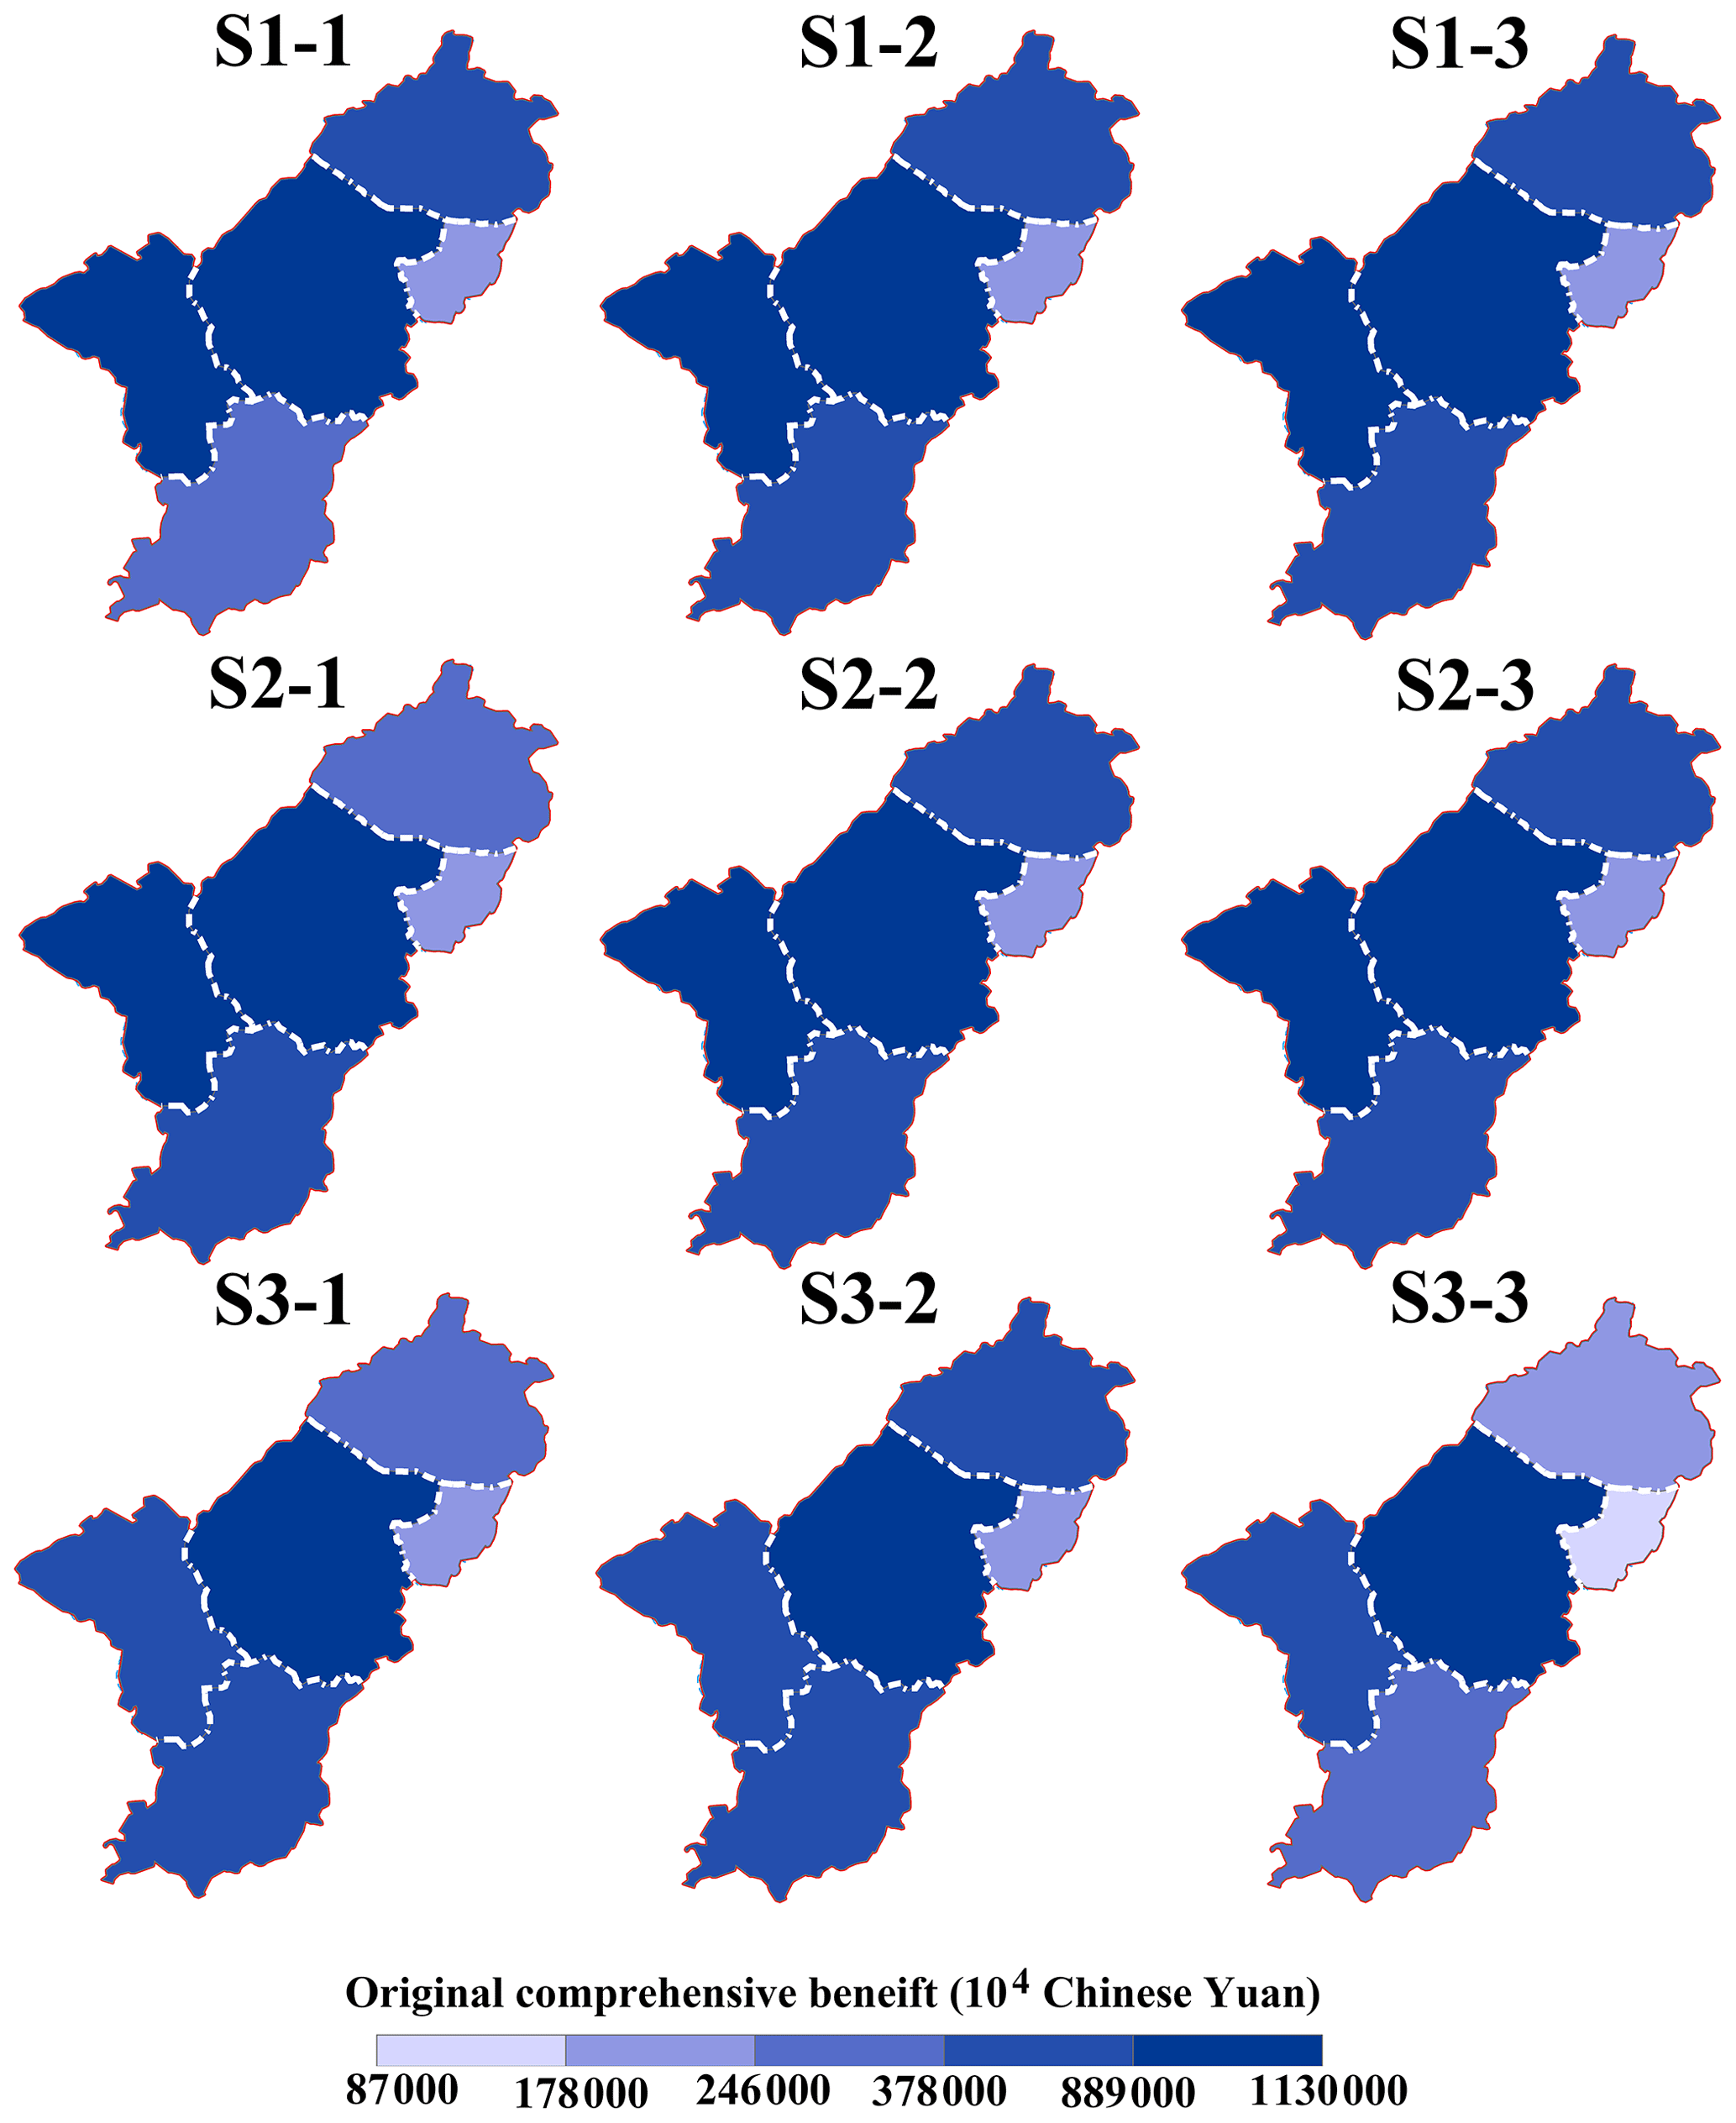
Figure 10Comprehensive benefit in five sub-regions after the regional collaborative allocation of water resources (S1 represents normal scenario, S2 represents dry scenario, and S3 represents extremely dry scenarios; S1–1 represents the normal scenario with the minimum total amount of water retained in water works, S1–2 represents the normal scenario with the maximum unconventional water supply, and S1–3 represents the normal scenario with the maximum synergy degree in the second layer).
4.4 Discussion
To assist policymakers in understanding the complex and systemic nature of complex water resource systems and reveal the dynamic interactions among objectives, network analysis and optimization were applied. Complex network analysis helps reveal the interactions among three layers with different dimensions. We determine the level of synergy in complicated water systems, identify the challenges and opportunities for sustainable development of water systems in cities with various sub-regions, and provide valuable insights and specific action priorities for these regions. In the networks shown in Fig. 11, each node represents an individual objective (F1, F2, F3, F4, and F5 represent the comprehensive benefits in Yibei, Yidong, Yixi, Yinan, and the central city, respectively), and pairwise objectives that are significantly (P<0.05) correlated are connected by a link, where the strength of each link is related to the Pearson correlation coefficient. The obtained networks with five nodes were weighted and undirected (directionality can be estimated only if the direction of causality is known). The size of the circles in the figure indicates the connectivity of each objective. We considered trade-offs (i.e., negative correlations wherein one objective improves while the other worsens) among the objectives. In most scenarios, F5 was the relatively dominant objective, signifying that other objectives disproportionately deteriorated as progress was made towards the benefit of the central city, as shown in Fig. 11. It is evident that the trade-offs are more balanced in the scenarios with the highest degrees of synergy (S1–3, S2–3, and S3–3), which indicates that the trade-offs and competitions among the objectives are alleviated when synergy is considered. The links show that the conflicts of interest between F4 and F5 in scenarios S1–1 and S2–2 are extremely notable, suggesting that the comprehensive benefits in Yinan and the central city correspond to strong negative interactions in these cases. The connectivity of most objectives was relatively low in the trade-off network in the extremely dry scenario, but F5 played a dominant role in terms of negative interactions among objectives. Moreover, as the scenario varied from normal to extremely dry, the impact of individual regional targets on the whole system diminished.
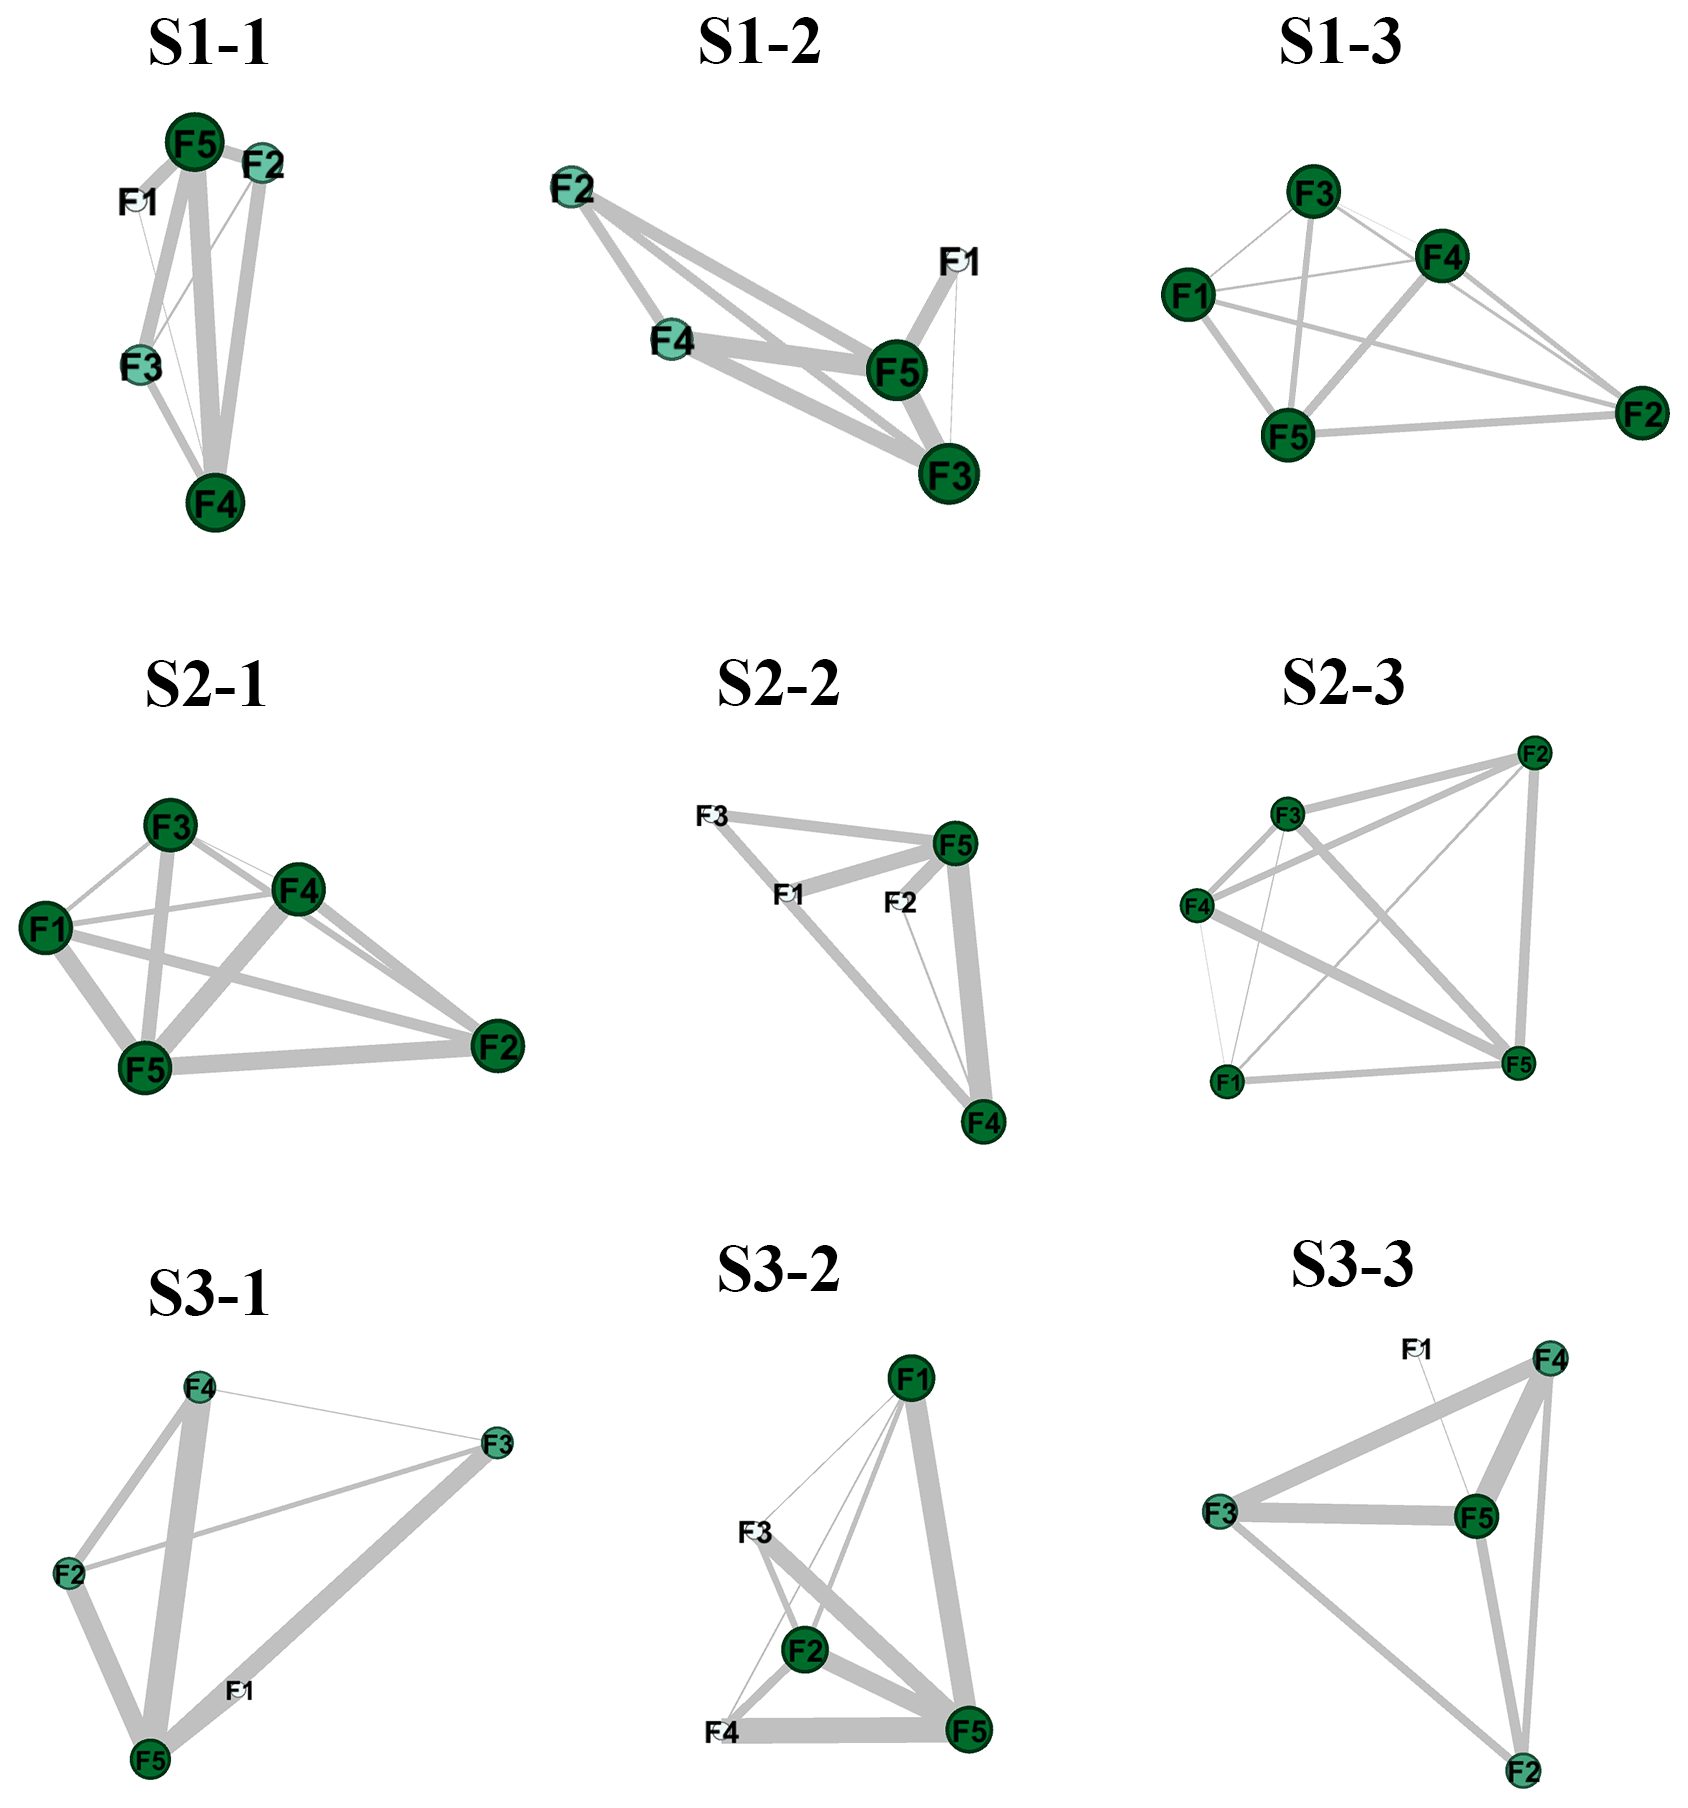
Figure 11Network analysis of the results of layer 3. The circles of F1, F2, F3, F4, and F5 represent the connectivity of each comprehensive benefit of Yibei, Yidong, Yixi, Yinan, and the central city, respectively: S1 represents the normal scenario, S2 represents the dry scenario, and S3 represents the extremely dry scenario; Sm−1 represents the normal scenario with the minimum total amount of water retained in water works, Sm−2 represents the normal scenario with the maximum unconventional water supply, and Sm−3 represents the normal scenario with the maximum synergy degree in the second layer; m=1–3.)
For comparison, we applied six widely used MOEAs, namely, NSGA-II, SPEA-II, ε-MOEA, IBEA, MOEA/D, and Borg MOEA, to solve cases with mathematical objectives (three objectives in the first layer, two objectives in the second layer, and five objectives in the third layer) with the same constraints given previously for Yiwu under normal, dry, and extremely dry conditions. The constraints and common parameters, such as the maximum number of model simulations and the simulated binary crossover (SBX) rate, are set to those used in the PTSOA model. However, it is difficult to determine feasible decision alternatives with MOEAs even though the number of iterations is increased to 20 000 (which is far beyond that considered in the previous modeling) because the complexity of the system overshadows the optimization capabilities of these traditional models. These results reconfirm the superiority, efficiency, and decoupling capability of the proposed model for optimal-allocation cases involving complex water resources systems with multiple stakeholders, multiple sources, multiple decision-makers, and embodied reused systems. By embedding the targets into hierarchical layers, the excessive abandonment of some promising alternatives is avoided, and optimal allocation is progressively achieved. In general, the hierarchical structure of the PTSOA model can simulate complicated systems with multiple complex objectives and constraints.
In addition, the six MOEAs were used to solve the equations in the third layer of the PTSOA model, and the overall targets in the first layer were determined based on these solutions. The necessary parameters and hyper-parameters were consistent with those used in the third layer of the PTSOA model. Additionally, the benefits in the current case with no optimization calculated based on the actual water supply are given for comparison. The current situation was categorized as a normal scenario, and other models were established with the same conditions to facilitate further comparison and analysis. There were distinct decision alternatives generated by each model, and the relevant results are listed based on their value ranges. As shown in Table 4, although NSGA-II and ε-MOEA yield slightly higher F2 values than PTSOA and F3 generated by IBEA (CNY 480–720 million) is higher than those obtained with PTSOA, PTSOA performs better than other models in most cases. The PTSOA model is shown to be the best model for obtaining comprehensive benefits for the sub-regions in Yiwu in the normal scenario, demonstrating that the PTSOA model offers advantages including identifying the best alternatives and achieving greater sub-regional benefits than the other models. The proposed model yields CNY 1.76–15.67 billion total comprehensive benefit improvement and can save approximately 3.2×10⁷–4.7×10⁷ m3 of conventional water compared to the current values. It is also evident that the proposed model yields the highest TSI values, reflecting the improvement achieved by considering the synergy of the system. In terms of the targets in the first layer, except for MOEA/D, other traditional models fail to retain enough water (water requirements for living under extreme drought conditions of the next configuration period) in the reservoirs to meet future basic needs. For MOEA/D, although it generates a slightly higher total water supply benefit with a value of CNY 281–312 million, the total water supply shortage and the total amount of reserved water in the reservoirs are worse than the amounts obtained with the proposed model. Borg MOEA, as an efficient and robust many-objective optimization tool, is characterized by its use of auto-adaptive multi-operator search and other adaptive features (Reed et al., 2013).
Table 4Comparison of the comprehensive benefits of the five objectives (F1, F2, F3, F4, and F5) and the TSI values in the current situation and those obtained using NSGA-II, SPEA-II, ε-MOEA, IBEA, MOEA/D, Borg MOEA, and PTSOA in the normal scenario. The bold fonts are the results of PTSOA model.
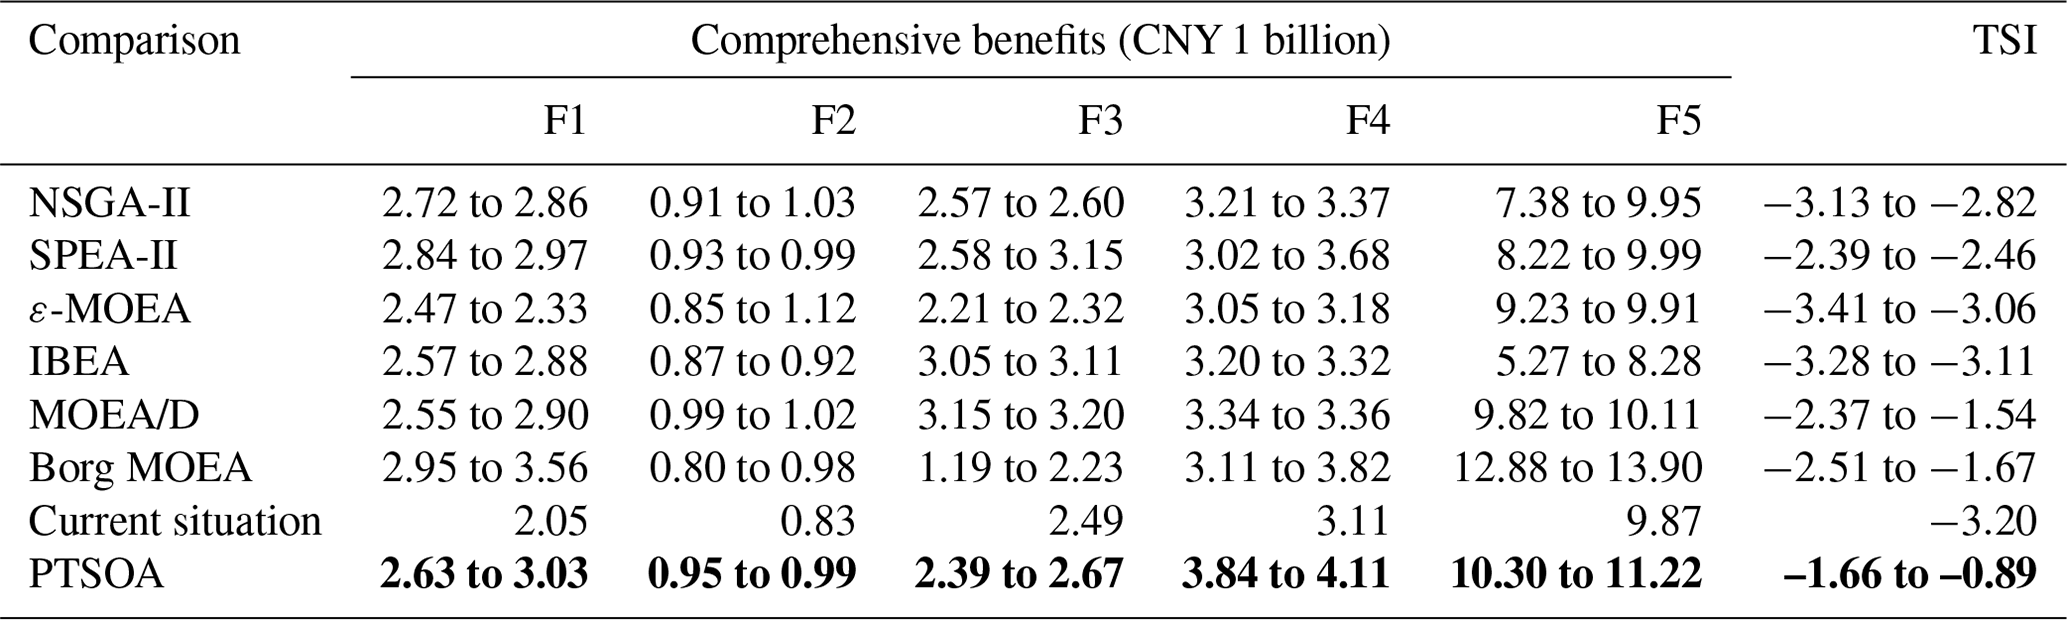
The TSI value of Borg MOEA is lower than PTSOA. Therefore, in the TSI dimension, its performance is slightly worse than the PTSOA model. However, it is noticed that the Borg MOEA algorithm could save around one-fifth of the computing time of the model (around 7 h). In the future, it would be interesting to figure out how to couple the Borg MOEA algorithm with our PTSOA model in a more efficient and synergetic way. In this study, our main focus is to find the most synergetic solution through optimization in a complex system. Thus, PTSOA has accomplished superior performance in this respect. It trades some economic benefits for enhanced water supply reliability and sustainable development, resulting in a decrease in the water supply from conventional water plants.
The consideration of reclaimed water in the proposed model effectively reduces the use of traditional water and improves the quality of the water environment by reducing sewage discharge, and other benefits are also achieved (such as meeting the quality standards for river water and guaranteeing that the ecological water demand of inland rivers is met). The results obtained by the PTSOA model may help guide both the government and general public. Our proposed model is superior to traditional models. It can not only optimize water resource utilization and secure water supplies but also enhance the synergy and environmental quality of water systems. Considering synergy across various timescales, the proposed model ensures the synergistic allocation of water resources at yearly, monthly, and daily scales while securing both present and future water supplies.
Applying optimal water allocation models to simultaneously enable economic benefits, water preferences, and environmental demands at different decision levels, timescales, and regions is a challenge. In this study, a new process-based three-layer synergistic optimal-allocation model (PTSOA) was developed and applied to a real and complex water allocation system. The model was divided into three layers to coordinate conflicts of interest among decision-makers at different levels and timescales. Furthermore, the allocation of reclaimed water was embedded in the proposed model for synergistic optimal allocation of both conventional and unconventional water. A synergistic index based on network analysis was put forward to reduce competition among different stakeholders and facilitate the positive effects of stakeholder interactions. A hierarchical optimal algorithm was designed to solve the PTSOA model.
The proposed model was applied to a typical city in southeast China with scarce water resources and developed industry. Achieving the optimal allocation of water resources in this kind of water scarcity offers a valuable reference for other counties in China. The key findings of this study are as follows. Firstly, the results demonstrated that the PTSOA model achieved synergistic allocation among hierarchical decision-makers across various timescales and in different regions, yielding the highest TSI (−1.66 to −0.89) among the contrast models. Secondly, with a synergistic approach, a reasonable amount of conventional water is retained for future use in cases with potentially high risk, with volumes of 3.95×10⁷ m3, 3.12×10⁷ m3, and 2.43×10⁷ m3 retained in normal, dry, and extremely dry scenarios respectively. Moreover, 7.35×10⁷ m3, 7.56×10⁷ m3, and 7.37×10⁷ m3 of conventional water can be saved in the three scenarios. Thirdly, considering both reclaimed water and conventional water in the optimization process efficiently improves the quality of municipal water, and more than 1272.21 and 48.81 t yr−1 of COD and ammonia nitrogen emissions are mitigated compared to those in the current situation. Lastly, distinct from previous models, the proposed optimal model was implemented with the consideration of spatial dimensions, which are important but often neglected. The results show that spatial allocation yields an improvement of 4 %–95 % for the comprehensive benefits in different sub-regions compared to the benefits achieved with traditional models, and the total comprehensive benefit increases by CNY 1.76–15.67 billion compared to that in the current situation.
These results and conclusions provide valuable references for the evaluations of other complicated water allocation systems. The optimal-allocation scheme can be determined for a complex water resource system upon consideration of stakeholder synergy and various hierarchical decision levels, timescales, and regions. More in-depth studies of synergistic optimal water allocation are needed in the future.
The data used to support the findings of this study are available from the corresponding author upon request.
JL and YPX designed all the experiments. JL and WZ collected and preprocessed the data. JL and WZ conducted all the experiments and analyzed the results. JL wrote the first draft of the paper with contributions from SW and SC. YPX supervised the study and edited the paper.
At least one of the (co-)authors is a member of the editorial board of Hydrology and Earth System Sciences. The peer-review process was guided by an independent editor, and the authors also have no other competing interests to declare.
Publisher's note: Copernicus Publications remains neutral with regard to jurisdictional claims made in the text, published maps, institutional affiliations, or any other geographical representation in this paper. While Copernicus Publications makes every effort to include appropriate place names, the final responsibility lies with the authors.
This article is part of the special issue “Drought, society, and ecosystems (NHESS/BG/GC/HESS inter-journal SI)”. It is not associated with a conference.
The editors and two reviewers are greatly acknowledged for their constructive comments that improved the quality of this paper. The Water Resources Department of Zhejiang Province and the Yiwu City Water Construction Group Co., Ltd., are also greatly acknowledged for providing the data regarding the water system of Yiwu used in this study.
This research has been supported by the Natural Science Foundation of Zhejiang Province (grant no. LZ20E090001) and the Primary Research and Development Plan of Zhejiang Province (grant no. 2021C03017).
This paper was edited by Hongkai Gao and reviewed by Veysel Yildiz and one anonymous referee.
Allen, C., Metternicht, G., and Wiedmann, T.: Prioritising SDG targets: assessing baselines, gaps and interlinkages, Sustain. Sci., 14, 421–438, https://doi.org/10.1007/s11625-018-0596-8, 2019.
Arora, S. R. and Gupta, R.: Interactive fuzzy goal programming approach for bilevel programming problem, Eur. J. Oper. Res., 194, 368–376, https://doi.org/10.1016/j.ejor.2007.12.019, 2009.
Avni, N., Eben-Chaime, M., and Oron, G.: Optimizing desalinated sea water blending with other sources to meet magnesium requirements for potable and irrigation waters, Water Res., 47, 2164–2176, https://doi.org/10.1016/j.watres.2013.01.018, 2013.
Baky, I. A.: Interactive TOPSIS algorithms for solving multi-level non-linear multi-objective decision-making problems, Appl. Math. Model., 38, 1417–1433, https://doi.org/10.1016/j.apm.2013.08.016, 2014.
Bali Swain, R. and Ranganathan, S.: Modeling interlinkages between sustainable development goals using network analysis, World Dev., 138, 105136, https://doi.org/10.1016/j.worlddev.2020.105136, 2021.
Ball, S. A., Jaffe, A. J., Crouse-Artus, M. S., Rounsaville, B. J., and O'Malley, S. S.: Multidimensional subtypes and treatment outcome in first-time DWI offenders, Addict. Behav., 25, 167–181, https://doi.org/10.1016/S0306-4603(99)00053-2, 2000.
Bond, R.: Complex networks: Network healing after loss, Nat. Hum. Behav., 1, 1–2, https://doi.org/10.1038/s41562-017-0087, 2017.
Cetintas, S., Si, L., Xin, Y. P., and Hord, C.: Learning to Identify Students' Off-Task Behavior in Intelligent Tutoring Systems, Artificial Intelligence in Education, IOS Press, 701–703, https://doi.org/10.3233/978-1-60750-028-5-701, 2009.
Chen, C., Yuan, Y., and Yuan, X.: An Improved NSGA-III Algorithm for Reservoir Flood Control Operation, Water Resour. Manage., 31, 4469–4483, https://doi.org/10.1007/s11269-017-1759-6, 2017.
Chen, Y., Ma, J., Wang, X., Zhang, X., and Zhou, H.: DE-RSTC: A rational secure two-party computation protocol based on direction entropy, Int. J. Intel. Syst., 37, 8947–8967, https://doi.org/10.1002/int.22975, 2022.
Dai, C., Qin, X. S., Chen, Y., and Guo, H. C.: Dealing with equality and benefit for water allocation in a lake watershed: A Gini-coefficient based stochastic optimization approach, J. Hydrol., 561, 322–334, https://doi.org/10.1016/j.jhydrol.2018.04.012, 2018.
D'Exelle, B., Lecoutere, E., and Van Campenhout, B.: Equity-Efficiency Trade-Offs in Irrigation Water Sharing: Evidence from a Field Lab in Rural Tanzania, World Dev., 40, 2537–2551, https://doi.org/10.1016/j.worlddev.2012.05.026, 2012.
Felipe-Lucia, M. R., Soliveres, S., Penone, C., Fischer, M., Ammer, C., Boch, S., Boeddinghaus, R. S., Bonkowski, M., Buscot, F., Fiore-Donno, A. M., Frank, K., Goldmann, K., Gossner, M. M., Hölzel, N., Jochum, M., Kandeler, E., Klaus, V. H., Kleinebecker, T., Leimer, S., Manning, P., Oelmann, Y., Saiz, H., Schall, P., Schloter, M., Schöning, I., Schrumpf, M., Solly, E. F., Stempfhuber, B., Weisser, W. W., Wilcke, W., Wubet, T., and Allan, E.: Land-use intensity alters networks between biodiversity, ecosystem functions, and services, P. Natl. Acad. Sci. USA, 117, 28140–28149, https://doi.org/10.1073/pnas.2016210117, 2020.
Friesen, J., Rodriguez Sinobas, L., Foglia, L., and Ludwig, R.: Environmental and socio-economic methodologies and solutions towards integrated water resources management, Sci. Total Environ., 581–582, 906–908, https://doi.org/10.1016/j.scitotenv.2016.12.051, 2017.
Gao, J., Liu, F., Zhang, J., Hu, J., and Cao, Y.: Information entropy as a basic building block of complexity theory, Entropy, 15, 3396–3418, https://doi.org/10.3390/e15093396, 2013.
Haguma, D. and Leconte, R.: Long-Term Planning of Water Systems in the Context of Climate Non-Stationarity with Deterministic and Stochastic Optimization, Water Resour. Manage., 32, 1725–1739, https://doi.org/10.1007/s11269-017-1900-6, 2018.
Han, Y., Xu, S. G., and Xu, X. Z.: Modeling multisource multiuser water resources allocation, Water Resour. Manage., 22, 911–923, https://doi.org/10.1007/s11269-007-9201-0, 2008.
Hu, Z., Wei, C., Yao, L., Li, L., and Li, C.: A multi-objective optimization model with conditional value-at-risk constraints for water allocation equality, J. Hydrol., 542, 330–342, https://doi.org/10.1016/j.jhydrol.2016.09.012, 2016.
Jin, S. W., Li, Y. P., and Nie, S.: An integrated bi-level optimization model for air quality management of Beijing's energy system under uncertainty, J. Hazard. Mater., 350, 27–37, https://doi.org/10.1016/j.jhazmat.2018.02.007, 2018.
Jinhua Water Resources Bulletin: Water Supplies Bureau of Jinhua, 2020.
Li, J., Song, S., Ayantobo, O. O., Wang, H., Jiaping, L., and Zhang, B.: Coordinated allocation of conventional and unconventional water resources considering uncertainty and different stakeholders, J. Hydrol., 605, 127293, https://doi.org/10.1016/j.jhydrol.2021.127293, 2022.
Liu, X., Sang, X., Chang, J., Zheng, Y., and Han, Y.: Rainfall prediction optimization model in ten-day time step based on sliding window mechanism and zero sum game, Aqua Water Infrastructure, Ecosyst. Soc., 71, 1–18, https://doi.org/10.2166/aqua.2021.086, 2022.
Liu, Y. W., Wang, W., Hu, Y. M., and Liang, Z. M.: Drought assessment and uncertainty analysis for Dapoling basin, Nat. Hazards, 74, 1613–1627, https://doi.org/10.1007/s11069-014-1259-4, 2014.
Pourshahabi, S., Rakhshandehroo, G., Talebbeydokhti, N., Nikoo, M. R., and Masoumi, F.: Handling uncertainty in optimal design of reservoir water quality monitoring systems, Environ. Pollut., 266, 115211, https://doi.org/10.1016/j.envpol.2020.115211, 2020.
Reed, P. M., Hadka, D., Herman, J. D., Kasprzyk, J. R., and Kollat, J. B.: Evolutionary multiobjective optimization in water resources: The past, present, and future, Adv. Water Resour., 51, 438–456, https://doi.org/10.1016/j.advwatres.2012.01.005, 2013.
Saavedra, S., Stouffer, D. B., Uzzi, B., and Bascompte, J.: Strong contributors to network persistence are the most vulnerable to extinction, Nature, 478, 233–235, https://doi.org/10.1038/nature10433, 2011.
Safari, N., Zarghami, M., and Szidarovszky, F.: Nash bargaining and leader-follower models in water allocation: Application to the Zarrinehrud River basin, Iran, Appl. Math. Model., 38, 1959–1968, https://doi.org/10.1016/j.apm.2013.10.018, 2014.
Vicuna, S., Dracup, J. A., Lund, J. R., Dale, L. L., and Maurer, E. P.: Basin-scale water system operations with uncertain future climate conditions: Methodology and case studies, Water Resour. Res., 46, 1–19, https://doi.org/10.1029/2009WR007838, 2010.
Wang, Y., Yin, H., Guo, X., Zhang, W., and Li, Q.: Distributed ANN-bi level two-stage stochastic fuzzy possibilistic programming with Bayesian model for irrigation scheduling management, J. Hydrol., 606, 127435, https://doi.org/10.1016/j.jhydrol.2022.127435, 2022.
Weitz, N., Carlsen, H., Nilsson, M., and Skånberg, K.: Towards systemic and contextual priority setting for implementing the 2030 agenda, Sustain. Sci., 13, 531–548, https://doi.org/10.1007/s11625-017-0470-0, 2018.
Wu, B., Quan, Q., Yang, S., and Dong, Y.: A social-ecological coupling model for evaluating the human-water relationship in basins within the Budyko framework, J. Hydrol., 619, 129361, https://doi.org/10.1016/j.jhydrol.2023.129361, 2023.
Wu, X., Fu, B., Wang, S., Song, S., Li, Y., Xu, Z., Wei, Y., and Liu, J.: Decoupling of SDGs followed by re-coupling as sustainable development progresses, Nat. Sustain., 5, 452–459, https://doi.org/10.1038/s41893-022-00868-x, 2022.
Xu, J., Lv, C., Yao, L., and Hou, S.: Intergenerational equity based optimal water allocation for sustainable development: A case study on the upper reaches of Minjiang River, China, J. Hydrol., 568, 835–848, https://doi.org/10.1016/j.jhydrol.2018.11.010, 2019.
Yang, W., Sun, D., and Yang, Z.: A simulation framework for water allocation to meet the environmental requirements of urban rivers: Model development and a case study for the Liming River in Daqing City, China, Environ. Fluid Mech., 8, 333–347, https://doi.org/10.1007/s10652-008-9093-4, 2008.
Yao, L., Xu, Z., and Chen, X.: Sustainable water allocation strategies under various climate scenarios: A case study in China, J. Hydrol., 574, 529–543, https://doi.org/10.1016/j.jhydrol.2019.04.055, 2019.
Yiwu Ecological Environment Status Bulletin: Ecological environment sub-bureau of Yiwu, https://www.yw.gov.cn/art/2021/10/27/art_1229451977_3928575.html (last access: 27 October 2021), 2020.
Yiwu Water Supplies Bureau: Yiwu Water Price Adjustment Plan, 2020.
Yu, B., Zhang, C., Jiang, Y., Li, Y., and Zhou, H.: Conjunctive use of Inter-Basin Transferred and Desalinated Water in a Multi-Source Water Supply System Based on Cost-Benefit Analysis, Water Resour. Manage., 31, 3313–3328, https://doi.org/10.1007/s11269-017-1669-7, 2017.
Yue, Q., Wang, Y., Liu, L., Niu, J., Guo, P., and Li, P.: Type-2 fuzzy mixed-integer bi-level programming approach for multi-source multi-user water allocation under future climate change, J. Hydrol., 591, 125332, https://doi.org/10.1016/j.jhydrol.2020.125332, 2020.
Yue, Q., Zhang, Y., Li, C., Xue, M., Hou, L., and Wang, T.: Research of Water Environment Capacity Allocation in Liaoning Province Based on the Analytic Network Process, Water Resour., 48, 310–323, https://doi.org/10.1134/S0097807821020111, 2021.
Zhang, K., Yan, H., Zeng, H., Xin, K., and Tao, T.: A practical multi-objective optimization sectorization method for water distribution network, Sci. Total Environ., 656, 1401–1412, https://doi.org/10.1016/j.scitotenv.2018.11.273, 2019.
Zhang, W., Lei, K., Yang, L., and Lv, X.: Impact of Riverine Pollutants on the Water Quality of Lake Chaohu, China, IOP Conf. Ser. Mater. Sci. Eng., 484, 012049, https://doi.org/10.1088/1757-899X/484/1/012049, 2019.
Zhang, X. and Vesselinov, V. V.: Energy-water nexus: Balancing the tradeoffs between two-level decision makers, Appl. Energy, 183, 77–87, https://doi.org/10.1016/j.apenergy.2016.08.156, 2016.
Zhao, J.: Analysis of the Loss of Water Surface Evaporation and Its Variation Characteristic in Zhuzhuang Reservoir, South. Tran. Tech., 12, 1672–1683, https://doi.org/10.13476/j.cnki.nsbdqk.2014.04.048, 2014.
Zhao, J., Wu, X., Guo, J., Zhao, H., and Wang, Z.: Study on the Allocation of SO2 Emission Rights in the Yangtze River Delta City Agglomeration Region of China Based on Efficiency and Feasibility, Sustain. Cities Soc., 87, 104237, https://doi.org/10.1016/j.scs.2022.104237, 2022.
Zhejiang Provincial Bureau of Natural Resources: Zhejiang Natural Resources and Statistical Yearbook on Environment, https://cnki.nbsti.net/CSYDMirror/trade/Yearbook/Single/N2021010036?z=Z008 (last access: 20 March 20024), 2020.
Zhou, X. and Moinuddin, M.: Sustainable Development Goals Interlinkages and Network Analysis: A practical tool for SDG integration and policy coherence, Institute for Global Environmental Strategies, 140 pp., https://doi.org/10.57405/iges-6026, 2017.
Zivieri, R.: Magnetic Skyrmions as Information Entropy Carriers, IEEE Trans. Magn., 58, 2–6, https://doi.org/10.1109/TMAG.2021.3092693, 2022.