the Creative Commons Attribution 4.0 License.
the Creative Commons Attribution 4.0 License.
 | 07 Mar 2024
Check dam impact on sediment loads: example of the Guerbe River in the Swiss Alps – a catchment scale experiment
Ariel Henrique do Prado
David Mair
Philippos Garefalakis
Chantal Schmidt
Alexander Whittaker
Sebastien Castelltort
Fritz Schlunegger
The construction of check dams is a common practice around the world where the aim is to reduce the damage by flooding events through mountain streams. However, quantifying the effectiveness of such engineering structures has remained very challenging and requires well-selected case studies, since the outcome of such an evaluation depends on site-specific geometric, geologic and climatic conditions. Conventionally, the check dams' effectiveness has been estimated using information about how the bedload sediment flux in the stream changes after the check dams are constructed. A permanent lowering of the bedload flux not only points to a success in reducing the probability of sediment transport occurrence but also implies that the sediment input through the system is likely to decrease. Here, we applied a method for data acquisition and two different equations (Meyer-Peter–Müller and Recking approach) to estimate and compare the sediment transport in a mountain stream in Switzerland under engineered and non-engineered conditions. Whereas the first equation is derived from a classical approach that is based on flume experiment data with a slope of less than 0.02 m m−1, the second equation (Recking) has been derived based on a bedload field dataset comprising active mountain streams under steeper conditions. We selected the Guerbe (Gürbe) River situated in the Swiss Alps as a case study, which has been engineered since the end of the 19th century. This has resulted in more than 110 check dams along a ca. 5 km reach where sediment has continuously been supplied from adjacent hillslopes, primarily by landsliding. We measured the riverbed grain size, topographic gradients and river widths within selected segments along this reach. Additionally, a gauging station downstream of the reach engineered with check dams yielded information to calibrate the hydroclimatic situation for the study reach, thus offering ideal conditions for our catchment-scale experiment. Using the acquired data and the dataset about historical runoff covering the time interval between 2009 and 2021 and considering the current engineered conditions, we estimated a mean annual volume of transported bedload which ranges from 900 to 6000 m3 yr−1. We then envisaged possible channel geometries before the check dams were constructed. We inferred (1) higher energy gradients which we averaged over the length of several check dams and which we considered a proxy for the steeper river slope under natural conditions; (2) channel widths that are smaller than those measured today, thereby anticipating that the channel was more confined in the past; and (3) larger grain size percentiles, which we consider to be similar to the values measured from preserved landslides in the region. Using such potential non-engineered scenarios as constraints, the two equations both point towards a larger sediment flux compared to the engineered state, although the results of these equations differed significantly in magnitude. Whereas the Recking approach returned estimates where the bedload sediment flux is ca. 10 times larger in comparison with the current situation, the use of the Meyer-Peter–Müller equation predicts an increase of ca. 100 times in bedload fluxes for a state without check dams. These results suggest that the check dams in the Guerbe River are highly efficient not only in regulating sediment transport by decreasing the probability of high sediment flux occurrence during torrential conditions but also in stabilizing the channel bed by avoiding incision. The most likely consequence is a stabilization of the terrain around such structures by reducing the activation of landslides.
- Article
(6331 KB) - Full-text XML
-
Supplement
(2646 KB) - BibTeX
- EndNote


Engineering structures known as check dams have been constructed in many mountainous streams around the world with the intention to mitigate hazards caused by the transfer of large volumes of sediment in relation to flooding, landsliding and debris flows (Piton et al., 2017; Lucas-Borja et al., 2021). Check dams are transversal structures built across the channel bed and made of wood, rock or concrete. They create space that can initially store sediment derived from farther upstream. Subsequently, this space is filled with material, which diminishes its capacity to store additional sedimentary material. However, even in their filled stages, the check dams seem to remain operational for three reasons. First, they prevent the stream from further incising into substratum, which in turn contributes to the stabilization of landslides and the preservation of soils on the bordering hillslopes. Second, they reduce the stream's capacity to evacuate the supplied sedimentary material due to a reduction of the channel's friction slope. And third, they contribute to the regulation of sediment transport by buffering the release of sediment into more frequent and lower discharges of material (Castillo et al., 2014; Piton et al., 2017). Although it is generally appreciated that the construction of check dams is beneficial for reducing risks, it has been a recurring challenge for engineers and the different stakeholders to take decisions about whether or not to install such infrastructure because of the high maintenance costs (e.g., Jäckle, 2013; Ramirez et al., 2022) and also because of bio-environmental concerns (e.g., Bombino et al., 2014). Furthermore, in most of these streams, the construction of check dams started before a survey on sediment flux was conducted, with the consequence that information about the pre-engineered conditions on sediment discharge is not available (Piton et al., 2017). Hence, it remains difficult to quantify the efficiency of such infrastructure, and society is left with limited information for taking decisions on whether or not to build new check dams and/or to maintain older ones. Under these circumstances, an indirect method of estimating the contribution of check dams to reduce risks is needed for stakeholders when they have to take evidence-based decisions on how to manage such infrastructure. In the past decade, Castillo et al. (2014) developed a model to estimate the efficiency of check dams. They focussed on exploring how the variations of the friction slope angles, which varied through changing the spacing between the dams, impacted the flow regime. However, since the friction slope is not the only variable that controls the transport of sediment (e.g., Meyer-Peter and Müller, 1948; Wong and Parker, 2006; Piton and Recking, 2016; Recking et al., 2016), data on slope changes alone are not sufficient to fully appreciate and predict possible reductions of risks when check dams are set in place. As an alternative approach, estimates of the sediment volumes transported on the riverbed could be used to predict the efficiency of check dams once the space behind them has been filled (Kaitna et al., 2011; Piton et al., 2017; Keiler and Fuchs, 2018). Therefore, available bedload equations that were calibrated on data acquired in active streams and flume experiments are potential tools for such an evaluation, and their application depends on variables that can be measured in the field (e.g., slope, width and grain size distributions).
To do so, we studied the Guerbe River, which is a torrent situated on the northern margin of the Swiss Alps (Fig. 1). There, the ca. 5 km long headwater reach has experienced a > 100-year-long history of check dam construction and maintenance. The first ones were installed during the 19th century and mainly consisted of structures made of wood and stone (Salvisberg, 2017). Subsequently, they were replaced by reinforced concrete dams in the 20th century, forming steps that are up to 10 m high (e.g., Fig. 1b). However, during several events through their history, the check dams failed and released a large amount of material downstream of the channel, generating a large loss to the local society (Salvisberg, 2017). After the last failure event, which occurred in January 2018 with the displacement of the ca. 4.5×10⁶ m3 large Meierisli landslide that damaged > 10 of these check dams (Andres and Badoux, 2019), the local community has been confronted with taking a decision on how to manage this situation in the future without a priori, physics-based information on the efficiency of this infrastructure. Therefore, this paper aims to offer such a quantitative evaluation. Here, we estimate the efficiency regarding the transport of bedload material for a staircase of check dams using the Guerbe River as a natural laboratory. We collect high-resolution data on the channel's metrics (slope, width) and the grain size distribution in the field, and we combine these data with information about the hydroclimatic properties of the Guerbe River basin. The scope is to estimate the modern bedload sediment flux for the current engineered state. These results are then compared with the outcome of model runs where pre-engineered conditions regarding channel metrics (slope, width) and grain size distributions are considered.
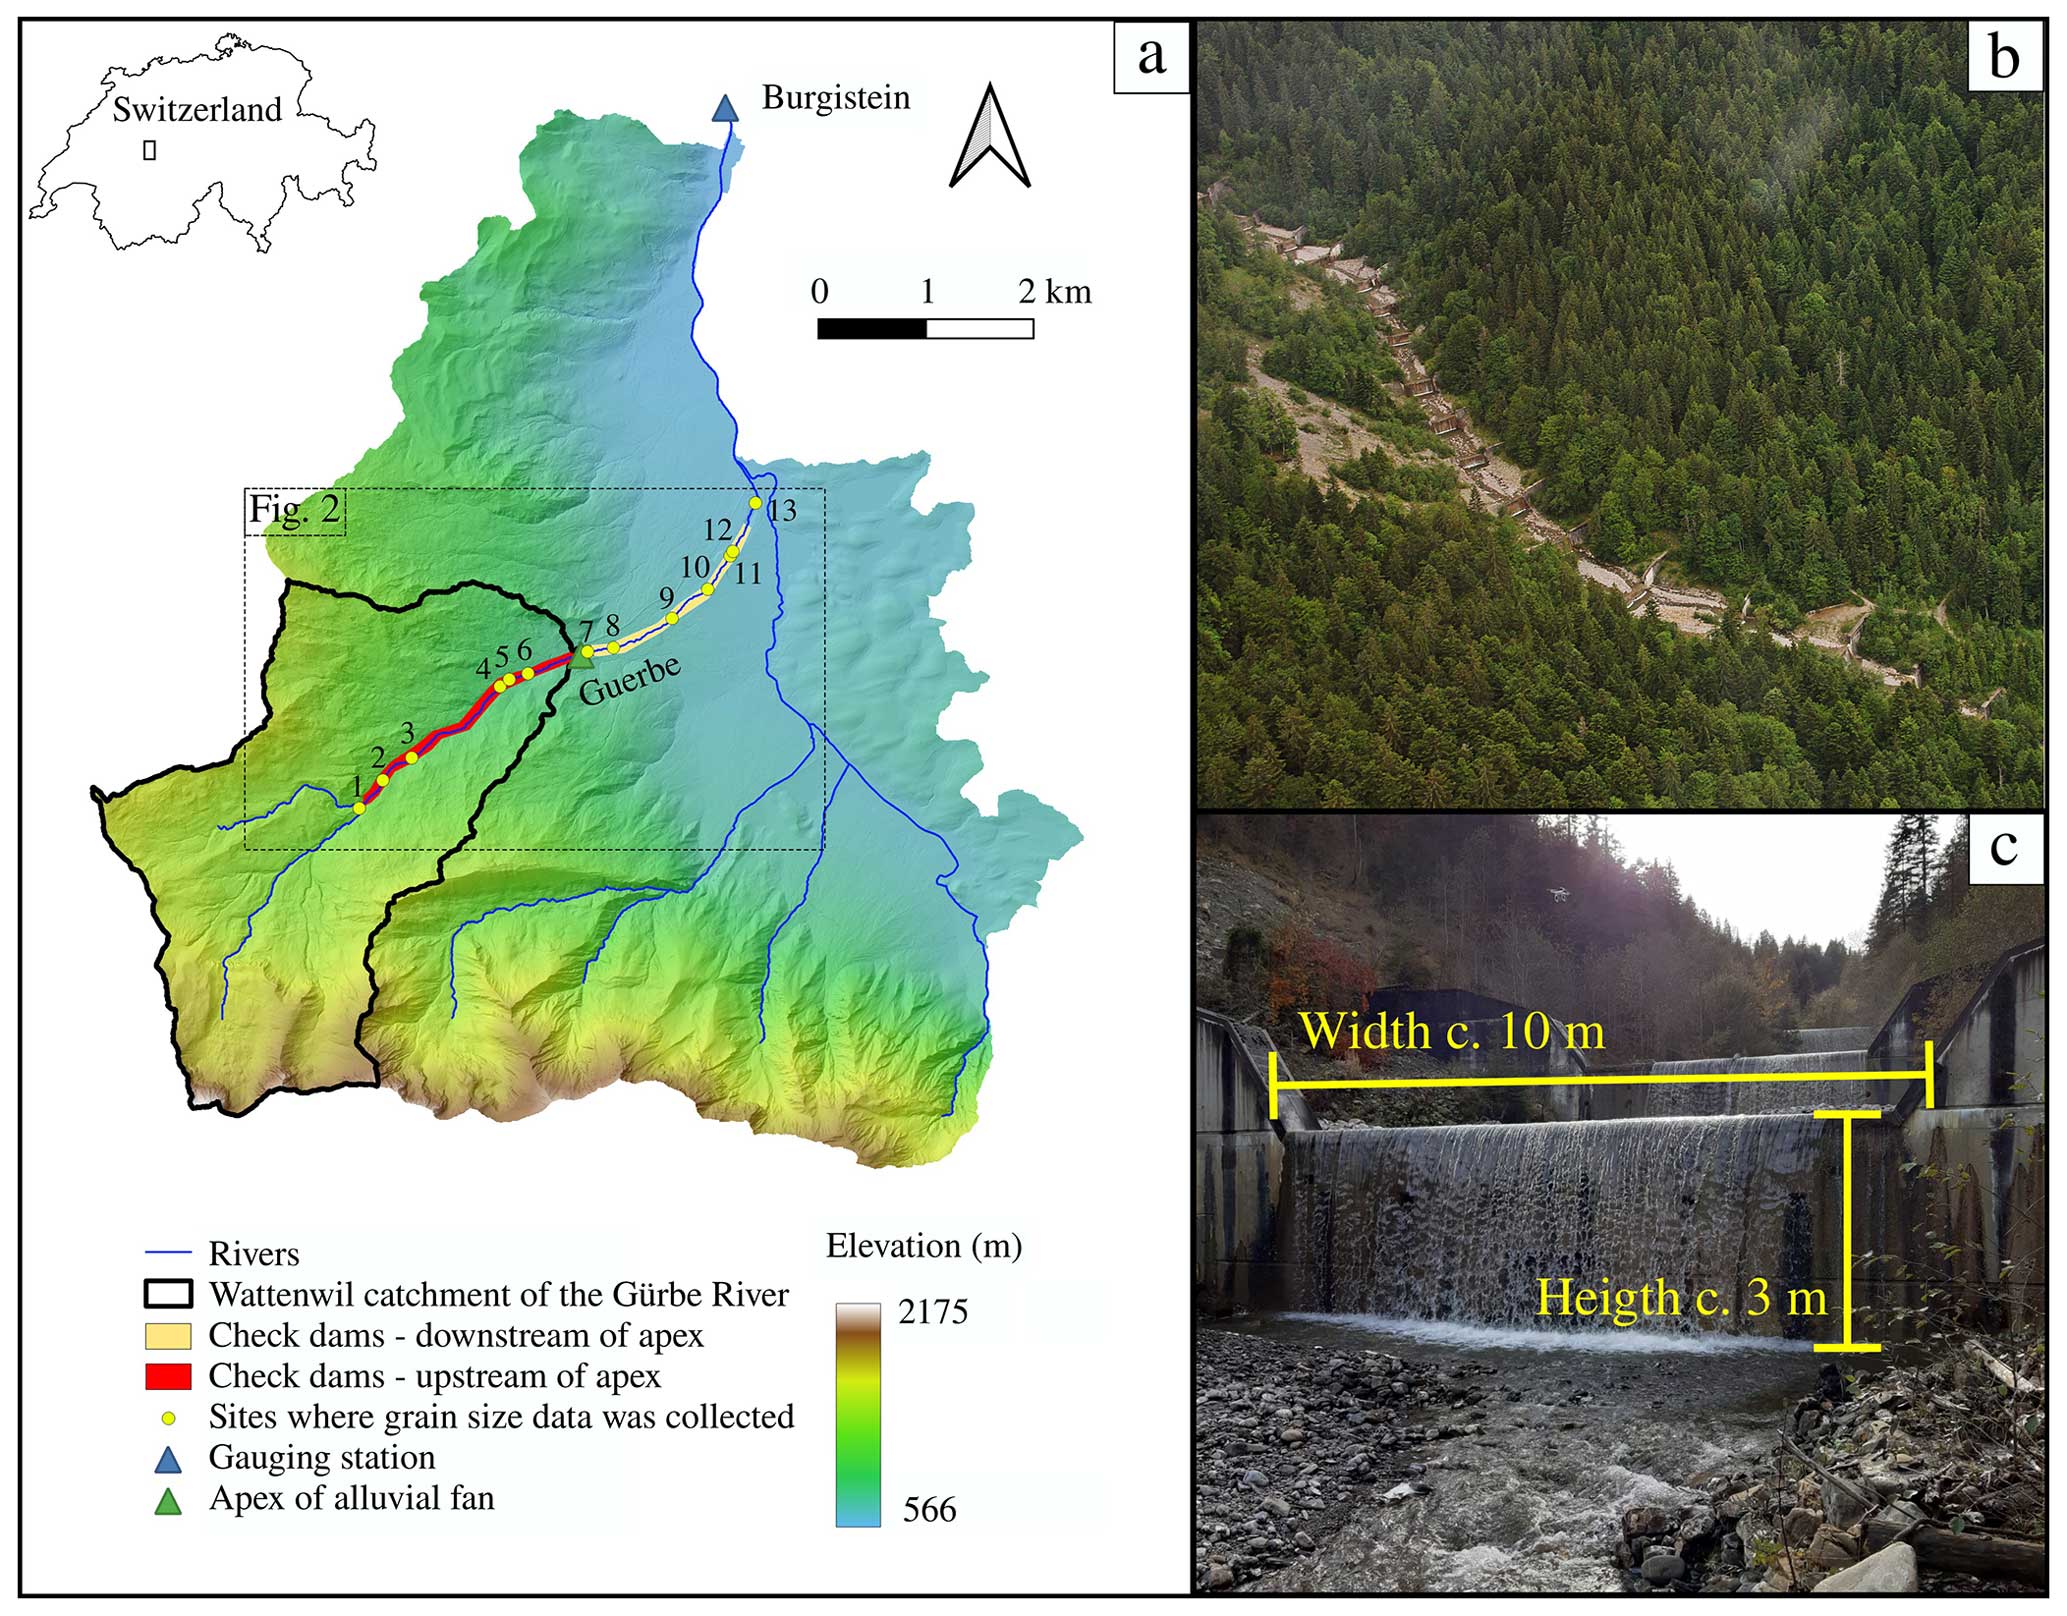
Figure 1(a) DEM of the Guerbe catchment, upstream of the Burgistein gauging station, and sub-catchment where sediment has been produced and supplied to the trunk channel (Wattenwil catchment of the Guerbe River). The dashed rectangle limits the area shown in Fig. 2. (b) Aerial picture in the Guerbe River with the staircase check dams. Additionally, the picture shows a steep non-vegetated area where recent hillslope instabilities have prevented a dense vegetation cover to establish. (c) Example of check dams with heights of ca. 3 m.
The studied reach of the Guerbe River (Fig. 1a), which is situated at the northern border of the Swiss Alps, can be segmented into four parts: (1) the headwater reach, which is the uppermost segment covering an area of ca. 5 km2, is characterized by a dendritic network made up of first- to third-order channels. The stream originates in the Gantrisch area at an altitude of ca. 1800 m a.s.l. where the bedrock is made up of steeply dipping limestones, dolostones and marls that are part of the Penninic Klippen belt (Jäckle, 2013). Towards the lower part of the headwater reach, the Mesozoic units are covered by several-metres-thick glacial till. This headwater reach transitions into a steep segment at an elevation of ca. 1200 m a.s.l. where the longitudinal stream profile of the Guerbe River shows a knickpoint (next to site 1 in Fig. 1 and circle in Fig. 2). The occurrence of such a knickpoint in the stream profile is also seen in the morphology of the bordering hillslopes where slope angles are ca. 20–25° steep. These hillslopes constitute an important sediment source of the Guerbe River. Uphill, these hillslopes mark a sharp transition towards a flatter landscape that was originally formed by glaciers, thereby also defining a knickzone on the hillslopes (Fig. 2). The second segment occurs downstream of this knickzone area, where the Guerbe River has been fully engineered by > 60 check dams. There, the bedrock comprises a suite of Late Cretaceous to Paleocene Gurnigel Flysch and the early Oligocene Lower Marine Molasse (LMM) units, both of which are alternations of shales and sandstones. They are dissected by multiple landslides along the entire ca. 2 km long second segment of the Guerbe River (red segment in Fig. 1). These landslides either originate > 1 km upstream of the Guerbe channel and are deep-seated with a decollement horizon up to 20 m below the surface (Thuner Tagblatt, 2018) or they border the Guerbe trunk stream as a few shallow-seated and < 100 m long features (decollement < 2 m deep) as our own observations have shown. Along this second reach, the Guerbe River shows a “colluvial” stream pattern as defined by Piton and Recking (2017). The third segment comprises the reach along which the river then transitions on a ca. 4 km2 large alluvial fan where the apex is located at an elevation of ca. 800 m a.s.l (white segment in Fig. 1). The stream remains channelized and with the presence of check dams on the entire fan. In the final segment, the stream enters the floodplain area, where it flows in a confined channel until its confluence with the Aare River ca. 20 km farther downstream.
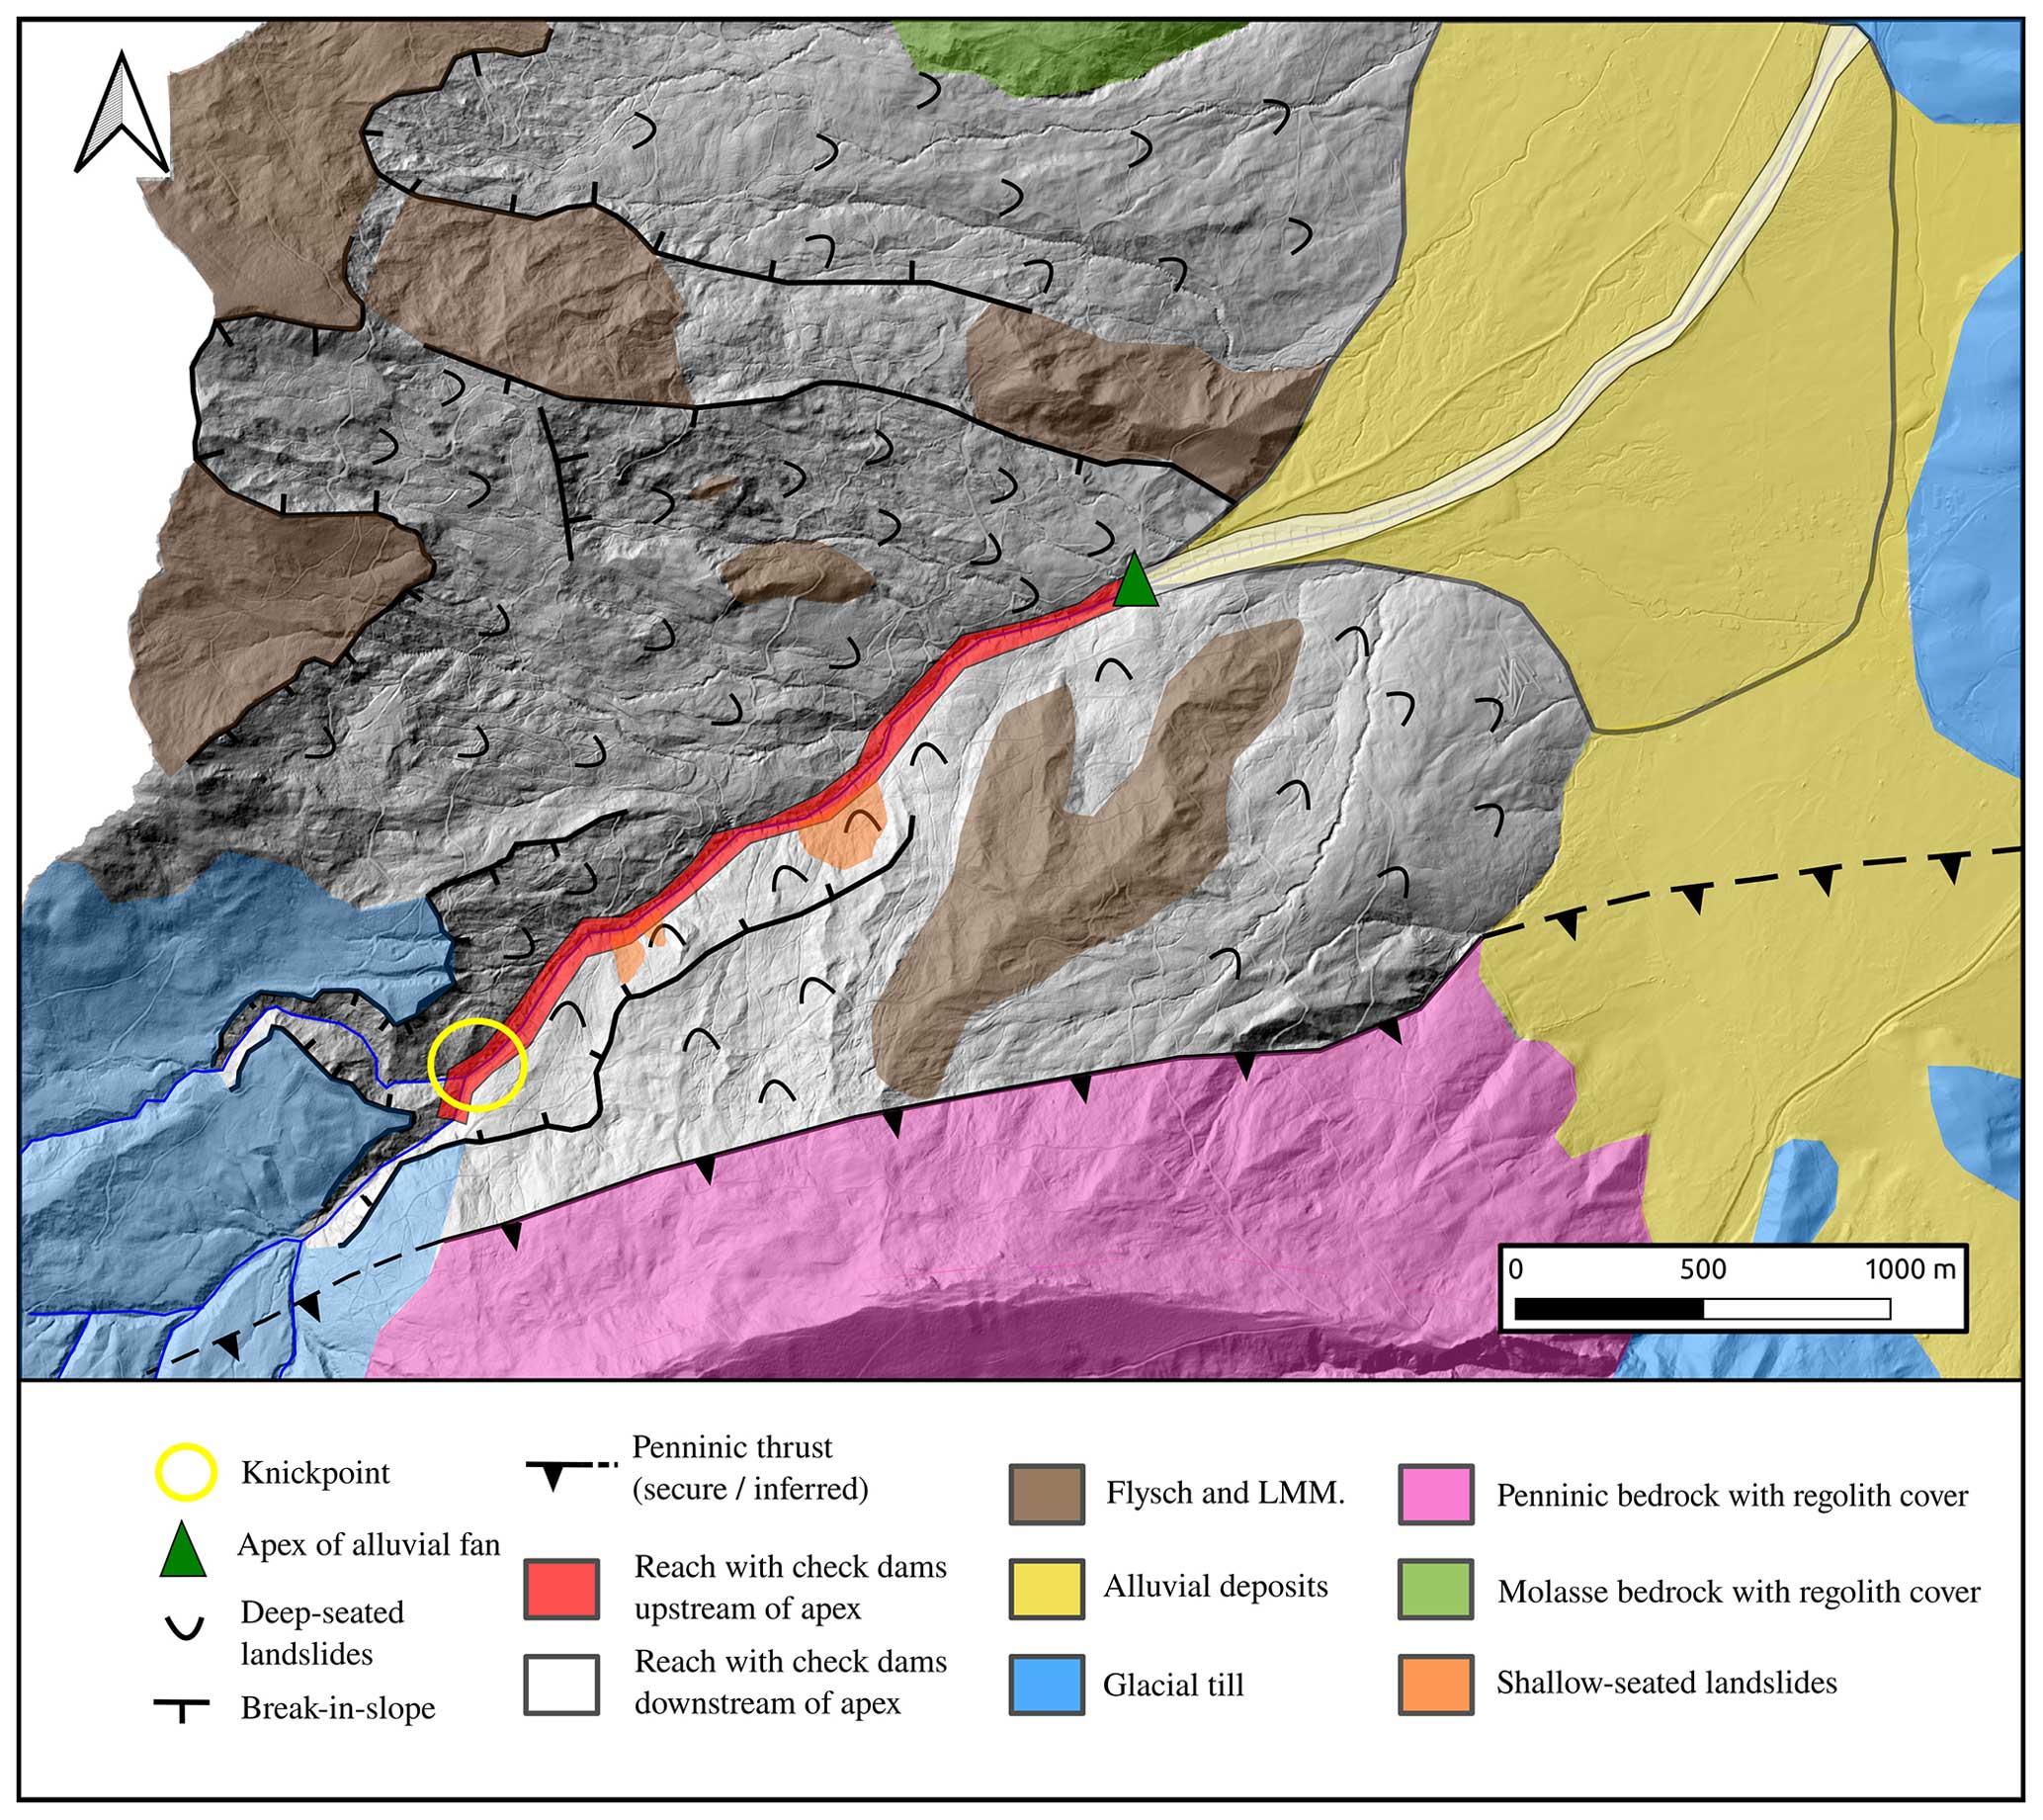
Figure 2Map of the landslides and incised areas of the Guerbe River together with the bedrock geology underlying the catchment. The knickpoint is located inside the yellow circle. See Fig. 1 for the position of this map. Here LMM denotes the Lower Marine Molasse.
The climate in the region is typical for a pre-alpine setting with a mean annual precipitation rate that ranges between 2000 mm yr−1 in the mountains and 1100 mm yr−1 at lower elevations (Ramirez et al., 2022). Accordingly, the mean annual water discharge is ca. 1.3 m3 s−1 as recorded by the Burgistein gauging station ca. 4 km downstream of the source area, and the maximum discharge during the past 22 years has been 84 m3 s−1, measured on the 29 July 1990 (Ramirez et al., 2022). Peak water flux occurs either during convective thunderstorms in summer or during periods of extended precipitation in late spring and autumn. In addition, a denudation rate of ca. 260 mm kyr−1 on our surveyed catchment was estimated from 10Be concentrations obtained from riverine quartz minerals in the Guerbe River (Delunel et al., 2020).
To assess the impact of check dams on bedload fluxes, we compare the results of bedload equations, which are based on the results of flume experiments (e.g. Meyer-Peter and Müller, 1948; Einstein, 1950; Bagnold, 1980; Wong and Parker, 2006; Parker, 2008; Recking et al., 2012) and/or field-based surveys (e.g. Karim and Kennedy, 1990; Recking, 2013; Recking et al., 2016). These equations were calibrated and validated under specific conditions of grain sizes, slopes and channel dimensions. They are not expected to provide precise predictions for bedload fluxes under extrapolated boundary conditions. Indeed, all equations present large uncertainties when used to estimate bedload flux for single events under the same boundary conditions, showing uncertainties of ±1 order of magnitude in the best scenarios (Rickenmann, 2001; Recking et al., 2012). Despite this limitation, these equations were adjusted to represent the average bedload flux under natural conditions. Therefore, they remain valuable tools when used in a relative manner for estimating changes in sediment transport capacity between engineered and non-engineered conditions in the Guerbe River.
Among the various bedload equations that have been published in the scientific literature, we chose to consider the Meyer-Peter and Müller (1948) (here referred to as MP.M.) and Recking (2013) equations, as they are representative of the two families of equations derived from flume and field data, respectively. However, their application requires that some geometric requirements regarding the spacing between check dams and the resulting flow conditions are fulfilled. These are described in Sect. 3.1. Following is the introduction of the selected bedload equations used in this work (Sect. 3.2) and the description of the methods to acquire the data to estimate the sediment fluxes. Finally, we describe the considerations for the non-engineered conditions in our estimations (Sect. 3.4).
3.1 Flow specificities related to check dams
One important functioning of the filled check dams is to reduce the kinetic energy of a mountain stream, which in turn is expected to reduce the sediment load (Castillo et al., 2014). In the reach downstream of a check dam, the largest energy dissipation occurs when the water that falls from the check dam spillway impacts the ground. The water enters a high-turbulent flow stage, thereby creating a scour and thus a pool just at the foot of the check dam (e.g. Fig. 3). A second contribution to the energy dissipation derives from the basal friction exerted by the arrangement of clasts along the riverbed as the water leaves the pool (Piton and Recking, 2016). The flow is then more uniform, and local turbulence occurs less frequently. The spacing between two adjacent check dams can affect this pattern when the distance is shorter than 30hc (where hc is the critical depth for which the Froude number is equal to 1; Piton and Recking, 2016), which is not the case for the Guerbe River since the spacing between the check dams is > 20 m and the maximum critical flow depth is 0.43 m at the apex of the alluvial fan (calculation done by using the measurements presented in the results section). This assumption is key for the application of the bedload equations presented in Sect. 3.2 since it requires the occurrence of a near-uniform flow.
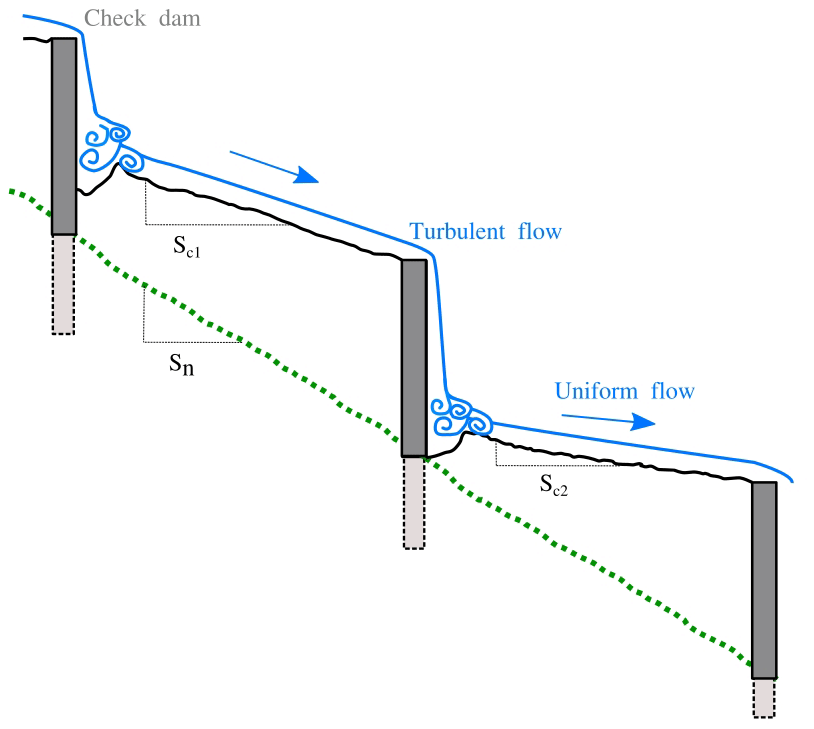
Figure 3Topographic gradient along a reach between check dams. From the engineered riverbed (black line), we calculated the engineered slope of the river (Sc). Likewise, we calculated the non-engineered slope (Sn, green dashed line) using a 300 m long reach around the site of interest.
3.2 Bedload discharge in mountain streams
Flume-based equations to estimate the volumes of bedload transported by streams have generally been developed for rivers with slopes < 0.02 m m−1 (or 1.2°) and riverbed material composed of grains with sizes that range from coarse sand to coarse gravel (e.g. Meyer-Peter and Müller, 1948; Einstein, 1950; Bagnold, 1980; Wong and Parker, 2006; Parker, 2008; Recking et al., 2012). In mountain streams, where slopes are usually steep (> 0.02 m m−1) and where the size of the transported material ranges from gravel to boulders, these equations tend to overestimate the bedload fluxes (Lamb et al., 2008). We selected the MP.M. equation due its simplicity, suitability for the gravel grain size domain and its capability of being adapted for slopes steeper than 0.02 m m−1. For such steep reaches, we considered a correction for the critical Shields shear stress (Lamb et al., 2008; Recking et al., 2012; Shvidchenko et al., 2001). Additionally, we employed the Wong and Parker (2006) formulation, which is an updated and corrected version of the Meyer-Peter and Müller (1948) formula. The selected field-based formulation proposed by Recking (2013), reformulated by Recking et al. (2016), considers different channel morphologies and was evaluated and validated for steep and coarse-grained mountain streams similar to the Guerbe River (Piton and Recking, 2017). Therefore, this equation may be suited for estimating the bedload flux in our study case. Furthermore, it is important to note that in mountain streams the amount of transported material is influenced by its availability. In this study, we clarify that bedload flux calculations are interpreted as the capacity of the torrent to transport material under specified boundary conditions.
For both the MP.M. and Recking approaches, we calculated the total bedload sediment flux (Qs) by computing the dimensionless sediment bedload flux, with the Einstein parameter (Φ) (Einstein, 1950):
where Qs is the total bedload sediment flux (m3 s−1); W is the active river width (m); g is the gravity acceleration (m2 s−1); ρs and ρw (kg m−3) are the densities of sediment and water, respectively; and D50 (m) is the 50th percentile of the riverbed surface grain sizes (b axis) and here represents the characteristic diameter of the transported material. In the following, we present the formulation to calculate Φ using the MP.M. and Recking approaches.
3.2.1 Dimensionless sediment bedload flux (Φ) based on the MP.M. approach
For an alluvial stream where water flow is considered uniform, the Einstein parameter (Φ) can be calculated by the formulation proposed by Wong and Parker (2006):
where A is a non-dimensional constant, which was set to 3.97 by Wong and Parker (2006) based on a reanalysis of the dataset obtained by Meyer-Peter and Müller (1948) through flume experiments. In this equation, the difference between the dimensionless shear stress (τ*) and the Shields (1936) parameter () is key for estimating how much sediment a stream can entrain from the riverbed if . For a non-uniform mixture of grains on a riverbed, the choice of D50 in Eq. (1) is justified for near-equal mobility conditions when grains larger and smaller than D50 are mobilized at nearly the same rate and for the same shear stress (Julien, 2010). While Wong and Parker (2006) considered a constant value 0.0495 for the Shields number, Lamb et al. (2008) proposed to employ a slope-dependent correction, mainly because the consideration of a constant Shields number will overpredict the bedload discharge in Eq. (1) for steep gradients (> 0.02), which is the case for the Guerbe River. Therefore, we considered the Shields parameter () to be dependent on the channel bed gradient S (in m m−1) following the results of field and laboratory experiments (Lamb et al., 2008):
The dimensionless shear stress (τ*) is defined following Shields (1936):
The shear stress (τ) in a riverbed is controlled by the channel depth d (in metres) for streams where the river width is W > 20 d:
Here we considered that the channel has a rectangular configuration. In the case of a uniform flow, the friction slope can be considered to be identical to the alluvial riverbed slope (S=Sbed). The water depth is calculated from the relationship between the unit water discharge (; m2 s−1) and the mean water velocity along the river depth v (expressed in m s−1):
Ferguson (2007) proposed that in a stream the mean water velocity (v) of a water column can be calculated separately for shallow- and deep-water conditions, thereby using the Manning–Strickler friction law and a roughness layer (MS/RL) term:
and
Here a1 and a2 are empirically obtained values and set to 5.5 and 2.5 (Ferguson, 2007), and D84 is the 84th percentile of the riverbed grain sizes (b axis). The water column is considered “shallow” if < 4; otherwise, it is considered deep. This formula has the advantage that it can be applied to rivers with a large range of slopes, including those encountered in mountainous streams where the slopes are steep (Zimmermann, 2010).
3.2.2 Dimensionless sediment bedload flux (Φ) based on the empirically calibrated Recking approach
A further method for calculating the reach-average bedload flux for gravelly rivers was proposed by Recking (2013). The related equations were empirically adjusted using a large dataset collected in the field, and they were validated by blind tests, which were conducted for 15 river reaches. According to this author, the Einstein parameter (Φ) can be calculated through
where τ* is the dimensionless shear stress defined in Eq. (4). The parameter accounts for the transition from the situation where only a fraction of the channel bed material is transported (partial transport) to the condition where all sedimentary material is in transport (full mobility). The original formula presented in 2013 was subsequently updated by Recking et al. (2016) to account for streams with flatbeds and step-pool patterns:
In Eq. (8), the dimensionless shear stress τ* is defined by Eq. (4), which is dependent on the flow depth (d) to estimate the shear stress (Eq. 5). In the following, we calculated the flow depth using the equation derived by Recking et al. (2016), which itself is based on the flow resistance formula proposed by Rickenmann and Recking (2011):
where and p= 0.24 if q* < 100; otherwise, p= 0.31. Therefore, we recalculated the dimensionless shear stress in the following way:
Piton and Recking (2017) used the Recking et al. (2016) formula to calculate the bedload flux considering different states of armouring on the channel bed and various sources of sediment. They compared the suitability of the equation to predict the bedload flux by using two different values as the characteristic diameter of the transported material: the 84th grain size percentile of the bedload material in transport, labelled as D84,TraBL, and the 84th percentile of the riverbed surface (D84 as in Recking et al., 2016), instead of the 50th percentile of the sediments on the riverbed surface (D50 in Eq. 11). They concluded that the choice of the characteristic diameter depends on the geomorphological context of the stream. In particular, for a colluvial stream pattern, as is the case for the Guerbe River, the use of D84,TraBL yielded better model predictions than D84. Since in our work we can only measure the grain size distribution representing the riverbed surface, we considered D50 as representing D84,TraBL. We propose that this assumption is acceptable for the Guerbe River since streams with a colluvial pattern are characterized by similar D50 and D84,TraBL values (see Fig. 4 in Rickenmann and Fritschi, 2010, for the Erlenbach stream in the Swiss Alps and Fig. 7 in Piton and Recking, 2017, for the Upper Roize stream).
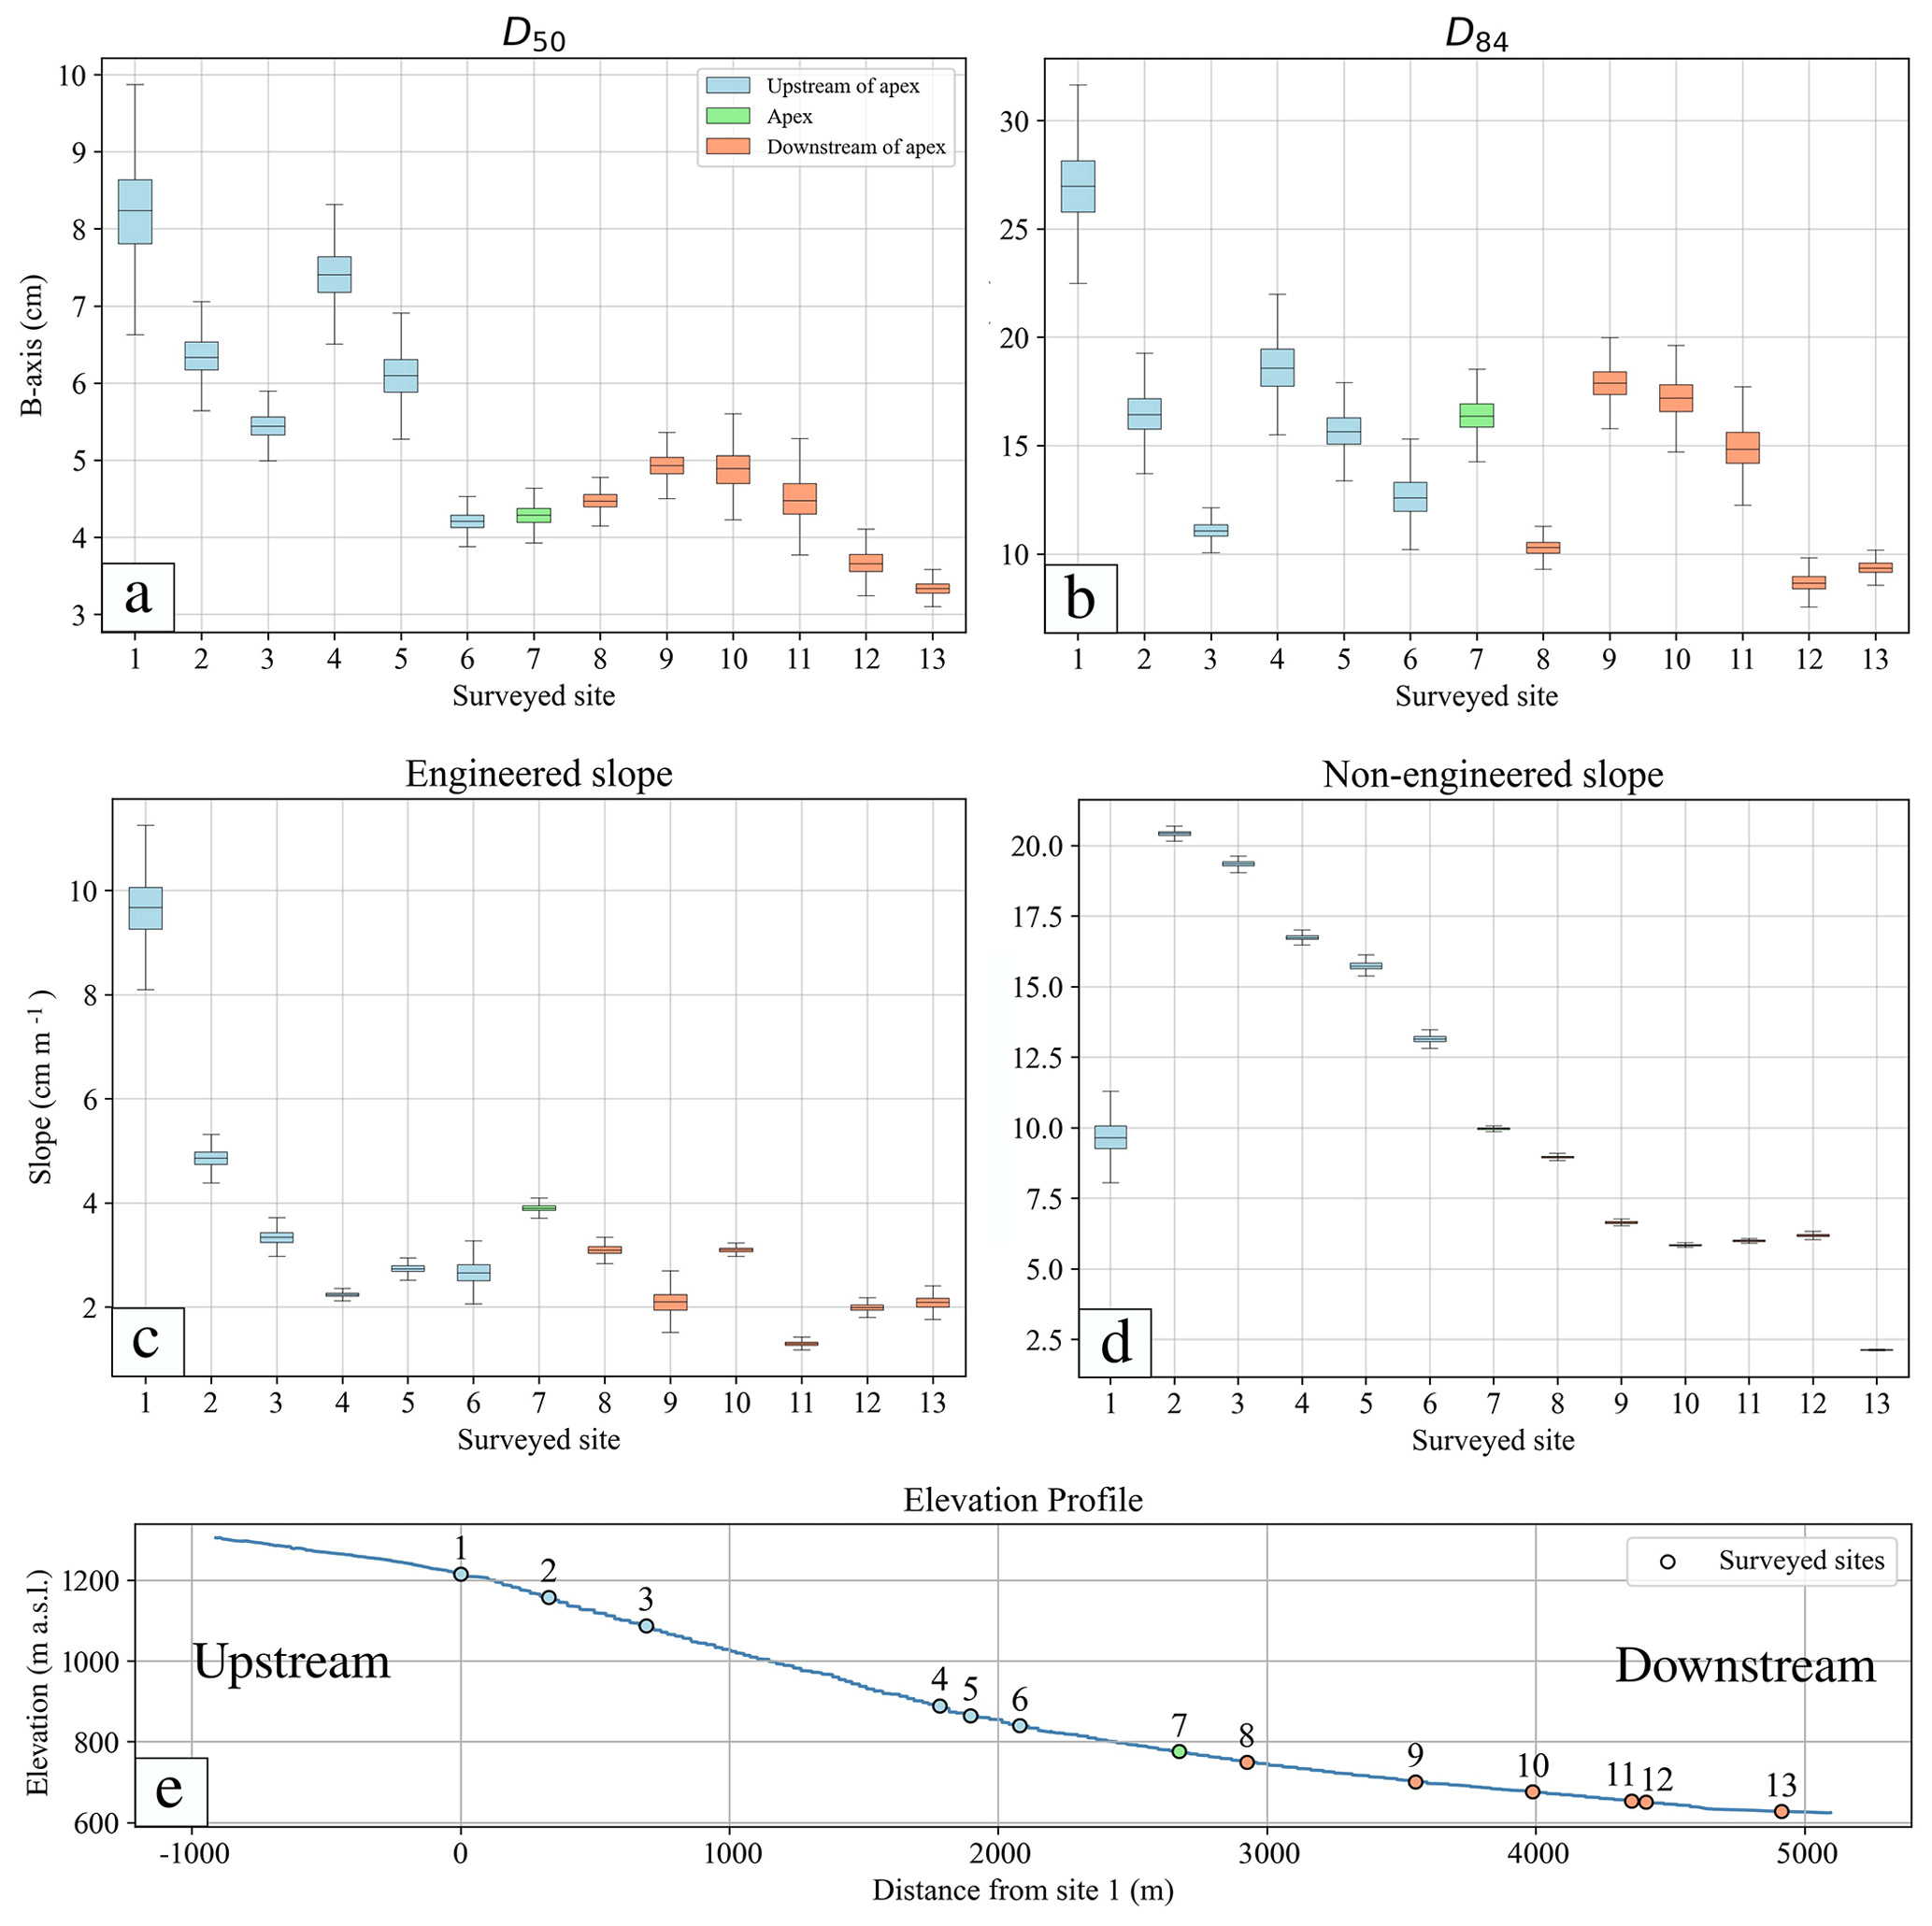
Figure 4Boxplots representing the measured parameters at the surveyed sites with propagated uncertainties. (a) Bed surface grain size D50, (b) size of D84 of the sediments on the bed surface, (c) alluvial slope for the engineered conditions and (d) alluvial slope obtained from the DEM for non-engineered conditions. (e) Elevation profile of the Guerbe River. The sites upstream and downstream of the alluvial fan's apex are indicated by the blue and red colours, respectively, and the site on the apex is indicated by the green colour.
In summary, both the Meyer-Peter and Müller (1948) and Recking et al. (2016) formulations require the same key parameters to calculate the transported bedload, which are the alluvial slope, the D50 and D84 grain size percentiles, the channel width, and water discharge.
3.3 Data acquisition
3.3.1 Uncrewed aerial vehicle (UAV) surveys and photogrammetry processing
We applied a UAV close-range setup in August–September 2021 to measure grain sizes on emerged gravel bars along the Guerbe River (Fig. 1b and c). We designed our surveys (13) and photogrammetric processing based on the workflow of Mair et al. (2022) with the aim of reducing the uncertainties related to the survey in the field and the processing of the data on the resulting grain sizes. To ensure a sufficient ground sampling distance of < 2 mm px−1 in all pictures, we conducted close-range surveys with a nominal flight altitude between 5 and 9 m above ground. For image acquisition, we used a one-level grid of nadir camera positions as backbone geometry, for which we targeted a lateral and frontal overlap between individual images of 80 %. We complemented this grid with images (5 to 20 per site) taken with oblique angles with a pitch of > 20°. The images were taken at the same survey altitude in an effort to minimize systematic errors during the photogrammetric processing (James and Robson, 2014; Carbonneau and Dietrich, 2017; James et al., 2020). All images were taken in the JPEG format with a DJI Mavic 2 Pro on-board camera (Hasselblad L1D-20c), which utilizes a global shutter. For referencing, we distributed 5 to 10 ground control points (GCPs) over each target gravel bar and measured them with a Leica Zeno GG04 Plus GNSS antenna with the real-time online Swipos-GIS/GEO RTK correction. This setup yields a horizontal precision of 2 cm and a vertical precision of 4 cm (2σ) under ideal conditions (Swisstopo, 2022). The subsequent photogrammetric processing followed standard structure from motion (SfM) workflows (e.g., James and Robson, 2012; Fonstad et al., 2013; Eltner et al., 2016), including recent updates (e.g., James et al., 2017a, b; 2020) to produce high-quality orthomosaic and digital surface models (DSMs) for each gravel bar (e.g. the Supplement Fig. S1). To do so, we used the Agisoft Metashape (v1.6 Pro) software, licensed to the Institute of Geological Sciences, University of Bern. In total, we processed 13 SfM models, with an average checkpoint/GCP precision of 26.69±17.72 mm and systematic errors < 10 cm (Table S1 in the Supplement).
3.3.2 Grain size measurements
We manually measured the size of grains on the orthomosaics that resulted from the field surveys (see section above) by applying the approach of Wolman (1954). Here we used the QGIS 3.22 open-source software to create a grid with a 0.5 m wide spacing and to measure the sizes of grains. For each grain underneath a grid intersection, we measured the lengths of the a and b axes by fixing four dots at the grains' edges, thereby using these to define the two perpendicular axes (e.g. Figs. S1 and S2). Because of the limited resolution of the images (Table S1 for image resolution), we defined a grain size measurement threshold of 2 cm. Accordingly, all grains smaller than this threshold were considered equal to 2 cm. This consideration had no effect on our values of 50th or 84th grain size percentiles since the proportion of grains smaller than 2 cm was never larger than 25 %. We then calculated the 50th and 84th percentile values from the grain size dataset to characterize each gravel bar. Following Mair et al. (2022), we estimated the related 95 % confidence intervals using a combined bootstrapping and Monte Carlo modelling approach for which we employed the survey-specific SfM uncertainties (Table S1). Here, we assumed that the grains on the gravel bars are characteristic of the material that was transported during equal mobility conditions since during these events the surveyed bars were flooded.
3.3.3 Topographic gradients and river widths
In the Guerbe River, the bedload transport is currently conditioned by the values of the engineered slopes (Sc in Fig. 3), which we measured from the DSMs obtained from the UAV images (Section 3.3.1). For non-engineered conditions, we inferred that the corresponding slopes (Sn in Fig. 3) would have been similar to the gradient of a 300 m long reach around the site of interest where grain size data were collected (150 m upstream and 150 m downstream), considering an elevation difference between at least 6 check dams. Here we used the LIDAR DEM swissALTI3D (Swisstopo, 2019) with a spatial resolution of 0.5 m2 as a basis. The slope values were then calculated by taking the difference in the topography of two points in the water flow direction and dividing this value by the distance between them. For each survey site, we repeated such measurements at least 30 times to calculate the 95 % confidence interval of the slope. Also at these sites, we measured the active river's width on 10 cm resolution orthoimages (Swisstopo, https://www.swisstopo.admin.ch/en/orthoimage-swissimage-10, last access: 5 March 2024). We determined the cross-sectional stream widths by measuring the width of the check dams' spillways downstream of our survey reach, which is considered to represent the engineered river width during flood stages.
3.3.4 Surface runoff
The water discharge is a further key parameter for calculating the sediment bedload flux (Eqs. 1 to 11). The runoff can greatly vary over a short time interval, and such variations are even stronger during the entrainment of sediment particles in mountain streams (Tuset et al., 2016). This implies that information on the local runoff is necessary to properly calculate the rates of bedload transport. Here, we used the gauging records at Burgistein (Fig. 1a) as a reference, where sensors have measured the water levels every minute since 2009. These values have then been converted to water discharge based on an empirical relationship in which the related parameters were acquired at Burgistein (Spreafico and Weingartner, 2005). This station has been operated by the Bau- und Verkehrsdirektion des Kantons Bern (https://www.bvd.be.ch/, last access: 4 March 2024), which offered us the water discharge data acquired between 2009 to 2021.
Since our area of interest is situated upstream of the Burgistein station (Fig. 1a), we downscaled the runoff values measured at Burgistein (Qb) for our sites of interest (Ql) by a factor that depends on the ratio between the size of the upstream catchment of the selected site (Al) and that of the Burgistein station (Ab). This value was then multiplied by the ratio between the mean annual precipitation rate for the corresponding catchment contributing to water runoff at the selected site (Pl) and the Burgistein station (Pb):
Here, we employed an annual precipitation rate value of Pl= 1734 mm for our study reach and Pb= 1492 mm for the basin (Ramirez et al., 2022), which contributes to the runoff at Burgistein. We then used the gauging data collected over the past 12 years, on which we estimated the range of bedload flux and also the total volume of sediment transported during this time, and we did so for engineered and non-engineered conditions in the Guerbe River. We acknowledge that this formulation deviates from the conventional method for estimating discharge at ungauged sites, which typically involves applying a power exponent to the catchment area ratio (McMahon et al., 2002). Given the wide range of values for this exponent, we opt for the use of the precipitation ratio. This ratio is grounded in data specific to our catchment and produces similar results as when applying a power exponent with values within the range of 0.9 to 0.95. We also acknowledge that the estimation of runoff upstream of a gauging station depends on multiple factors such as the groundwater level, the type of vegetation, and the thickness of the soil (Sriwongsitanon and Taesombat, 2011). However, since our gauging station is only ca. 4 km downstream of our area of interest, we inferred that neglecting these factors will not significantly bias our estimations of the local runoff values.
3.3.5 Propagation of uncertainties in estimating the bedload flux
We applied a workflow that uses Monte Carlo simulation and bootstrapping to estimate the uncertainties of the bedload predictions (see S2 for a detailed description of the workflow). We proceeded through using the uncertainties that occur upon measuring the values of the key variables as input parameters, and through fitting the gamma distributions for the range of uncertainties that are associated with the percentiles of the grain size datasets (i.e., the 95 % CI on D50 and D84). These were obtained with the method proposed by Mair et al. (2022) to simulate the related uncertainties. The scale and shape parameters of the gamma distributions that we employed for the Monte Carlo simulation are presented in Table S3. We used normal distributions for all engineered and non-engineered slopes, with the standard deviation calculated from the 95 % confidence interval divided by 4. For estimating the uncertainties on the width values, we applied a uniform distribution where the length of this distribution was defined using the measured width including a ±10 % uncertainty at each site.
3.4 Considerations of non-engineered scenarios
For the non-engineered scenarios, we considered changes not only in the slope but also in the river width and grain sizes. In particular, in a natural state, the channel widths are expected to be smaller than the widths of the check dams' spillways as is currently the case. This has been shown in various engineered mountainous streams (Piton et al., 2017; Lucas-Borja et al., 2021) and is likely also valid for the Guerbe torrent. However, predictions of natural channel widths can be challenging as the hillslope instabilities around the channel can strongly affect this parameter, and information on widths was not available for the time before the check dams in the Guerbe River were constructed. Therefore, we had to make assumptions and considered three scenarios in which the current widths were shortened by 75 %, 50 % and 25 %. Although we lack constraints to sustain these inferences, we justify the selection of these values, because upstream of site 1 where the Guerbe River is poorly engineered, the channel widths are generally narrower than the width values we get when applying a 50 % shortening. In the same sense, a prediction of grain size patterns for non-engineered conditions is speculative because of a lack of observations. Here, we used the grain size values from the bulk material upstream of site 1, which we considered to be characterizing the source signal. Indeed, mapping shows that the highly active hillslopes just upstream of site 1 have most likely been the primary material source (Figs. 1a and 2). Furthermore, because riverbed grain sizes can also be affected by abrasion during transport in mountainous torrents (Miller et al., 2014), predictions about how the calibre of the bedload material changes downstream are almost impossible to make particularly for non-engineered states in the past. Therefore, we considered the grain sizes of the inferred supply signal as maximum values, which we kept as a constant parameter along the surveyed sites for some scenarios. Consequently, the non-engineered scenarios presented in this work will be based on conservative assignments of values to the parameters, which control the transport of bedload material.
4.1 Grain size, channel slope and width, and water discharge
We obtained data on bed surface grain sizes and channel slopes for engineered and non-engineered conditions for all 13 surveyed sites (Fig. 4). The D50 values resulting from the measurements show a decreasing trend from ca. 8.3 to 2.4 cm in the downstream direction (Fig. 4a). In contrast, the sizes of D84 rapidly decay between sites 1 and 2 from > 25 to < 20 cm, after which the values fluctuate between ca. 20 and 10 cm (Fig. 4b). The measured slopes for engineered conditions display a similar pattern as D84 in the sense that the energy gradient rapidly decreases from ca. 10 to 5 cm m−1 between sites 1 and 2. The gradients then oscillate around a value of ca. 3 cm m−1 farther downstream (Fig. 4c). This pattern of alternating slope values is clearly visible for the reaches between all check dams in the dataset obtained from the 0.5 m SwissAlti3D DEM where the data collection was achieved in 2019 (Fig. S3). The non-engineered slopes are substantially different. They are flattest at site 1 and along the downstream portion of the fan (from site 7 onwards) where the values are ca. 10 cm m−1 and less (Fig. 4d). In-between, the energy gradients continuously decrease in the downstream direction, starting with ca. 20 cm m−1 at site 2 and ending with a value of 10 cm m−1 on the fan itself (Fig. 4d). This rapid increase in energy gradient between sites 1 and 2 points to the occurrence of a knickpoint in the longitudinal stream profile (see Sect. 5.3 for more details), which is also corroborated by the geomorphological map where several breaks in slope are visible on the hillslopes bordering the channel system in this area (Fig. 2). The current channel widths (thus during engineered conditions) fluctuate around a value of 15 m without displaying a clear trend in the downstream direction (Table S2). Please see Figs. 4e, 7e and 8e for illustrations of the elevation profile and the locations of all surveyed sites.
The pattern of water discharge along the surveyed reach was calculated using Eq. (12) and the records at the Burgistein gauging station as a basis (Fig. S4). Accordingly, at the fan apex, the annual peak discharge values vary between 5 and 18 m3 s−1 (Fig. 5). Note that the latter value was registered in 2021 and has been the largest discharge during the surveyed period.
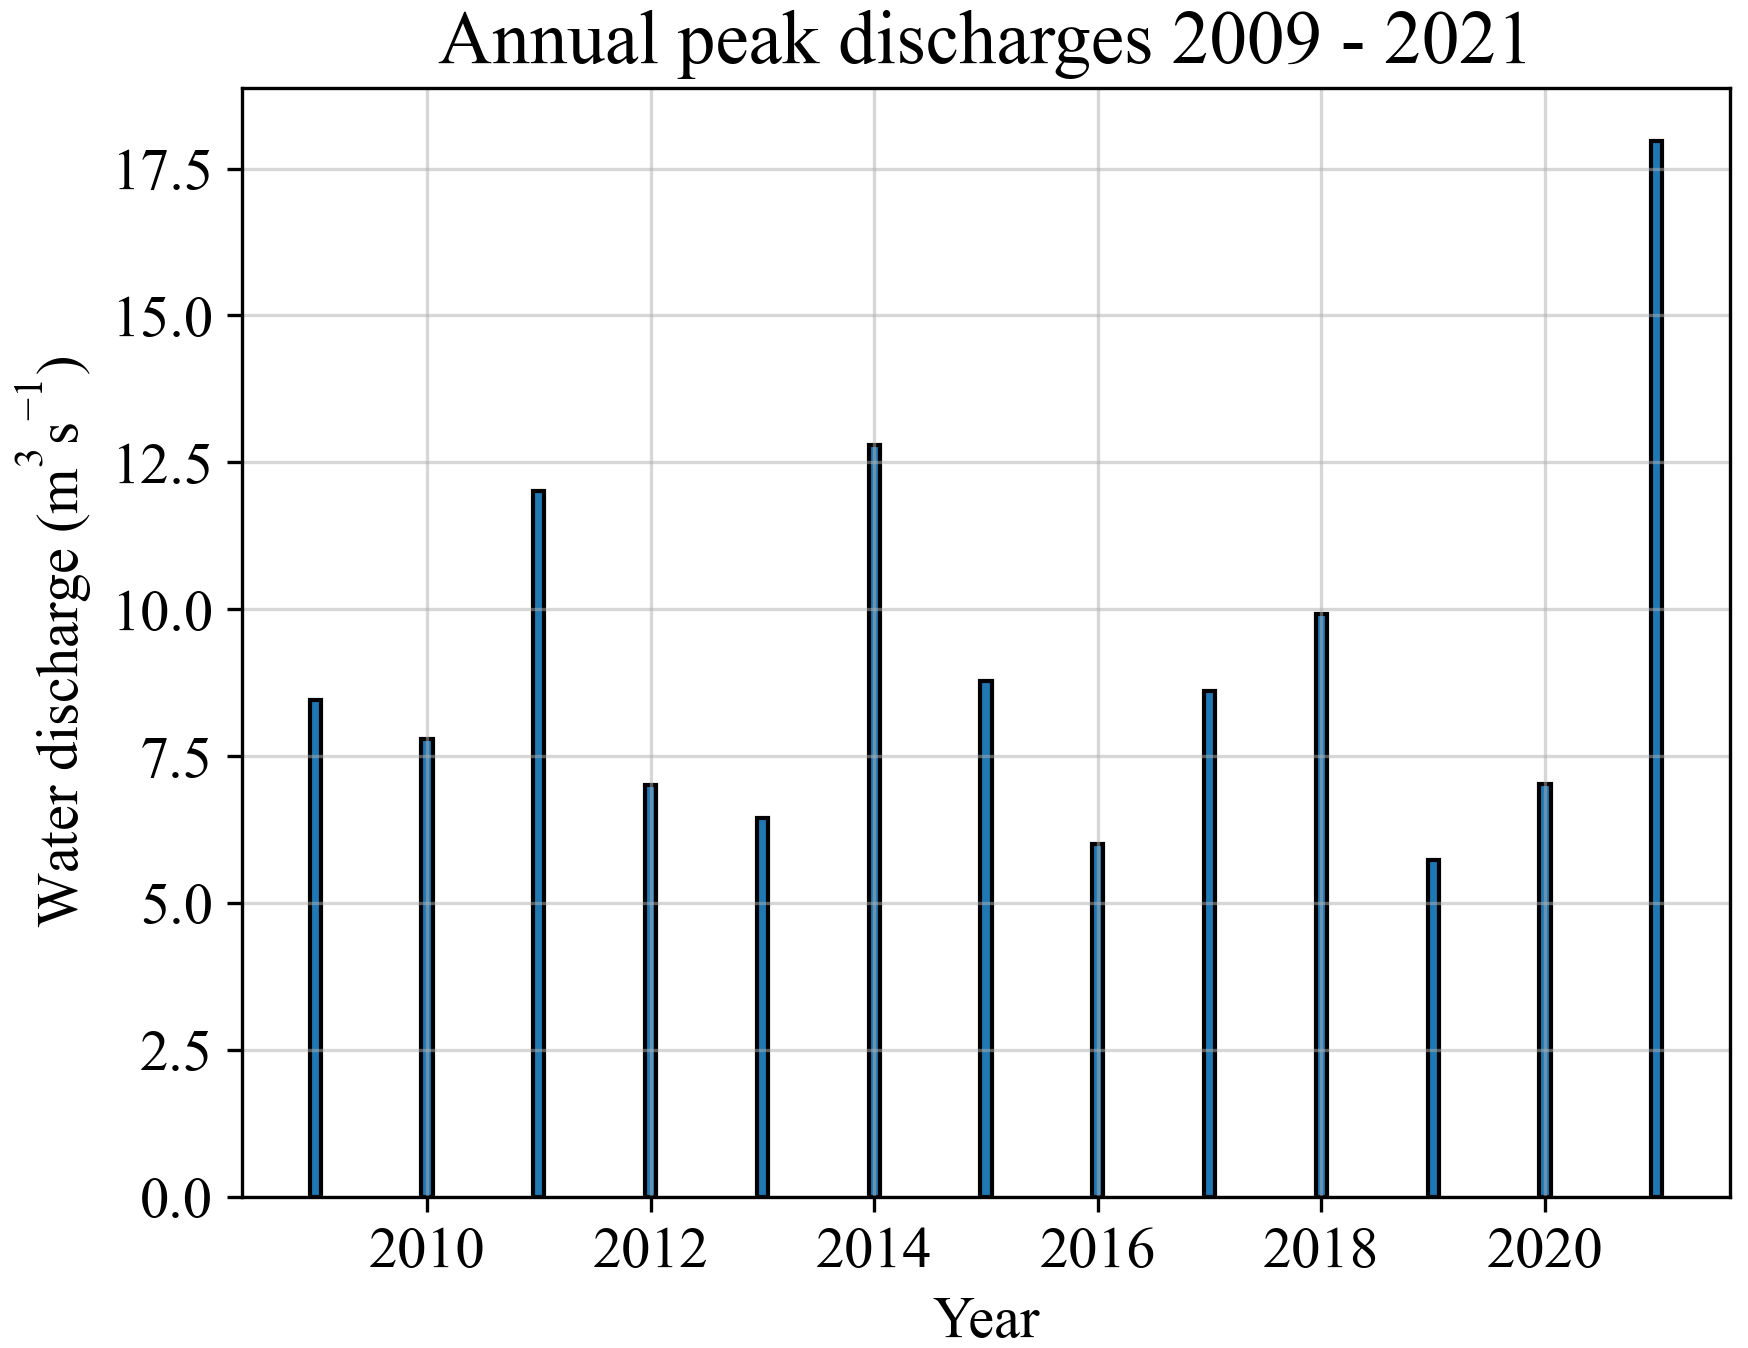
Figure 5Calculated values of annual peak discharge for the fan apex of the alluvial fan in the Guerbe River during the period between 2009 and 2021.
4.2 Bedload flux for engineered and non-engineered scenarios
We calculated the volumes of the instantaneous and mean annual bedload that can be transported along the surveyed sites by applying the MP.M. and Recking formula. Considering the constraints as elaborated in Sect. 3.4 and 4.1, the results show that for the engineered conditions, the mean annual bedload transport rate at the fan apex ranges from ca. 1000 to 6000 m3 yr−1 if the MP.M. equation is used or from 900 to 2500 m3 yr−1 if the calculations are done with the Recking approach (Fig. 6). For the non-engineered state, we calculated mean annual transport rates that are between ca. 10 (Recking formula) and 100 times higher (MP.M. formula). More specifically, the values for bedload transport at the apex vary from 30 000 to 400 000 m 3 yr−1 using MP.M.'s equation for all scenarios of channel width shortening and grain sizes (Fig. 6a). Alternatively, the values are smaller if estimated with the Recking equation, and they vary between 1000 to 150 000 m3 yr−1 (Fig. 6b). See a detailed discussion on these differences in Sect. 5.1.
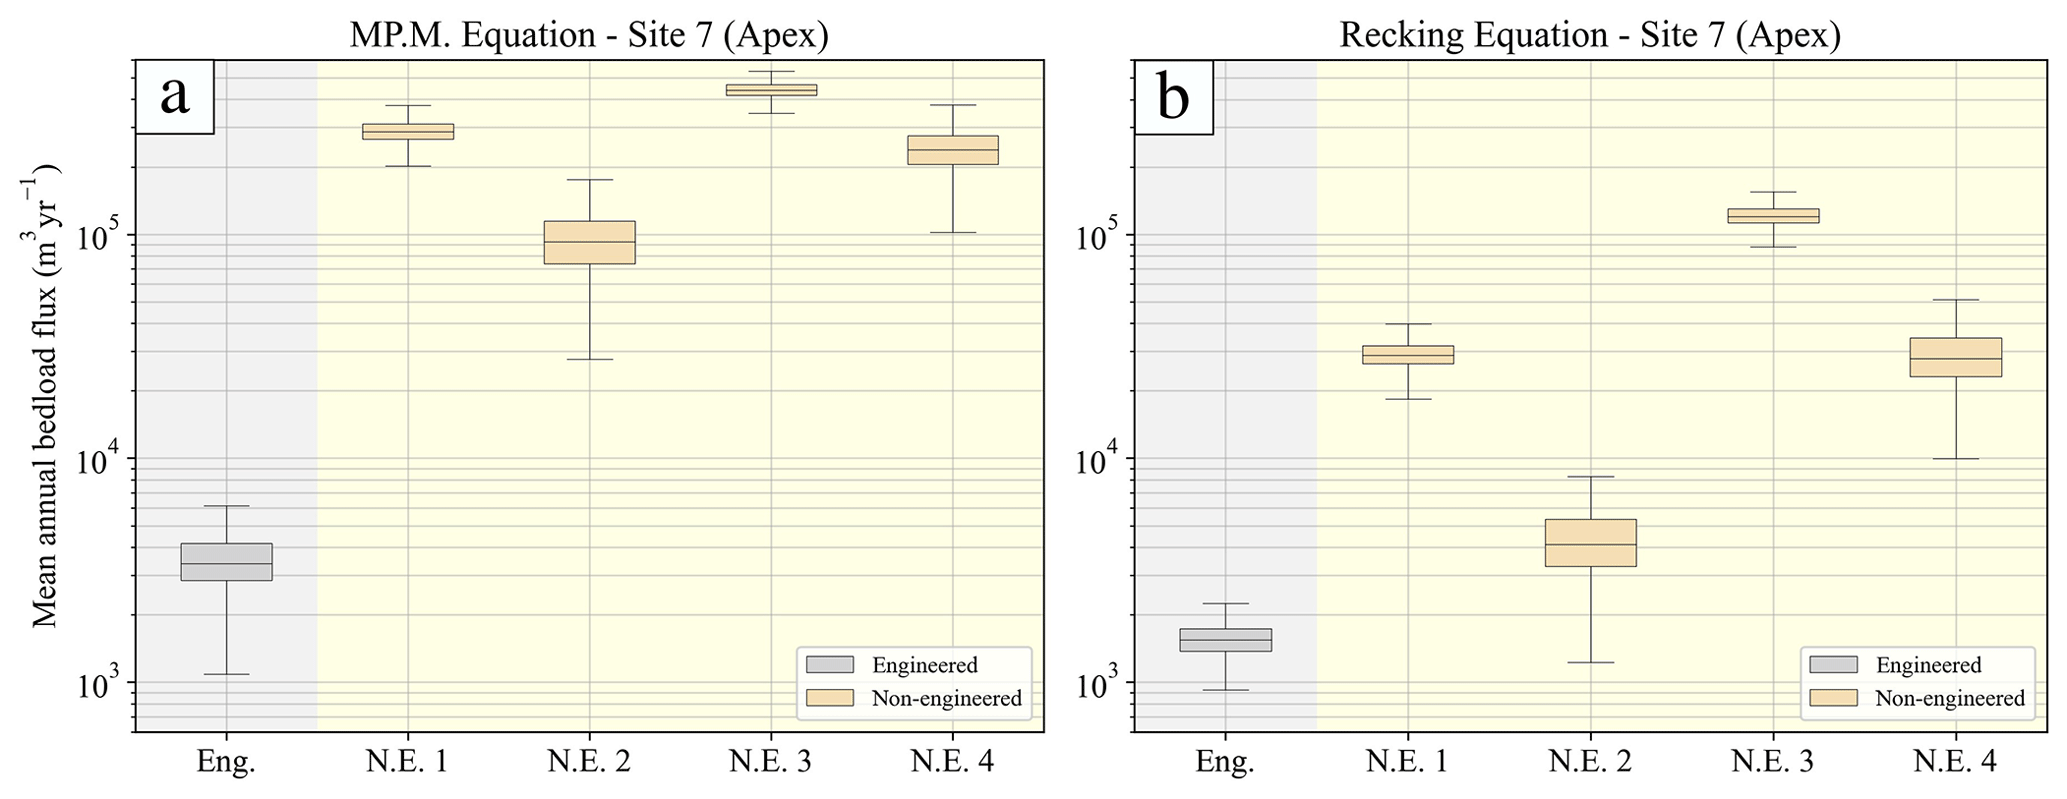
Figure 6Boxplot representation of the mean annual bedload estimates using (a) the MP.M. and (b) the Recking approaches for the Guerbe River catchment. The engineered (Eng.) and the non-engineered (N.E.) scenarios are based on using the parameters shown in Fig. 4. Specifically, the engineered scenario is based on the average of the engineered slopes, whereas the results for the non-engineered scenarios are based on: (N.E.1) a 75 % reduction of the channel width and grain sizes from site 7; (N.E. 2) a 75 % reduction of the channel width and grain sizes from site 1; (N.E. 3) a 25 % reduction of the channel width and grain sizes from site 7; and (N.E. 4) 25 % reduction of the channel width and grain sizes from site 1.
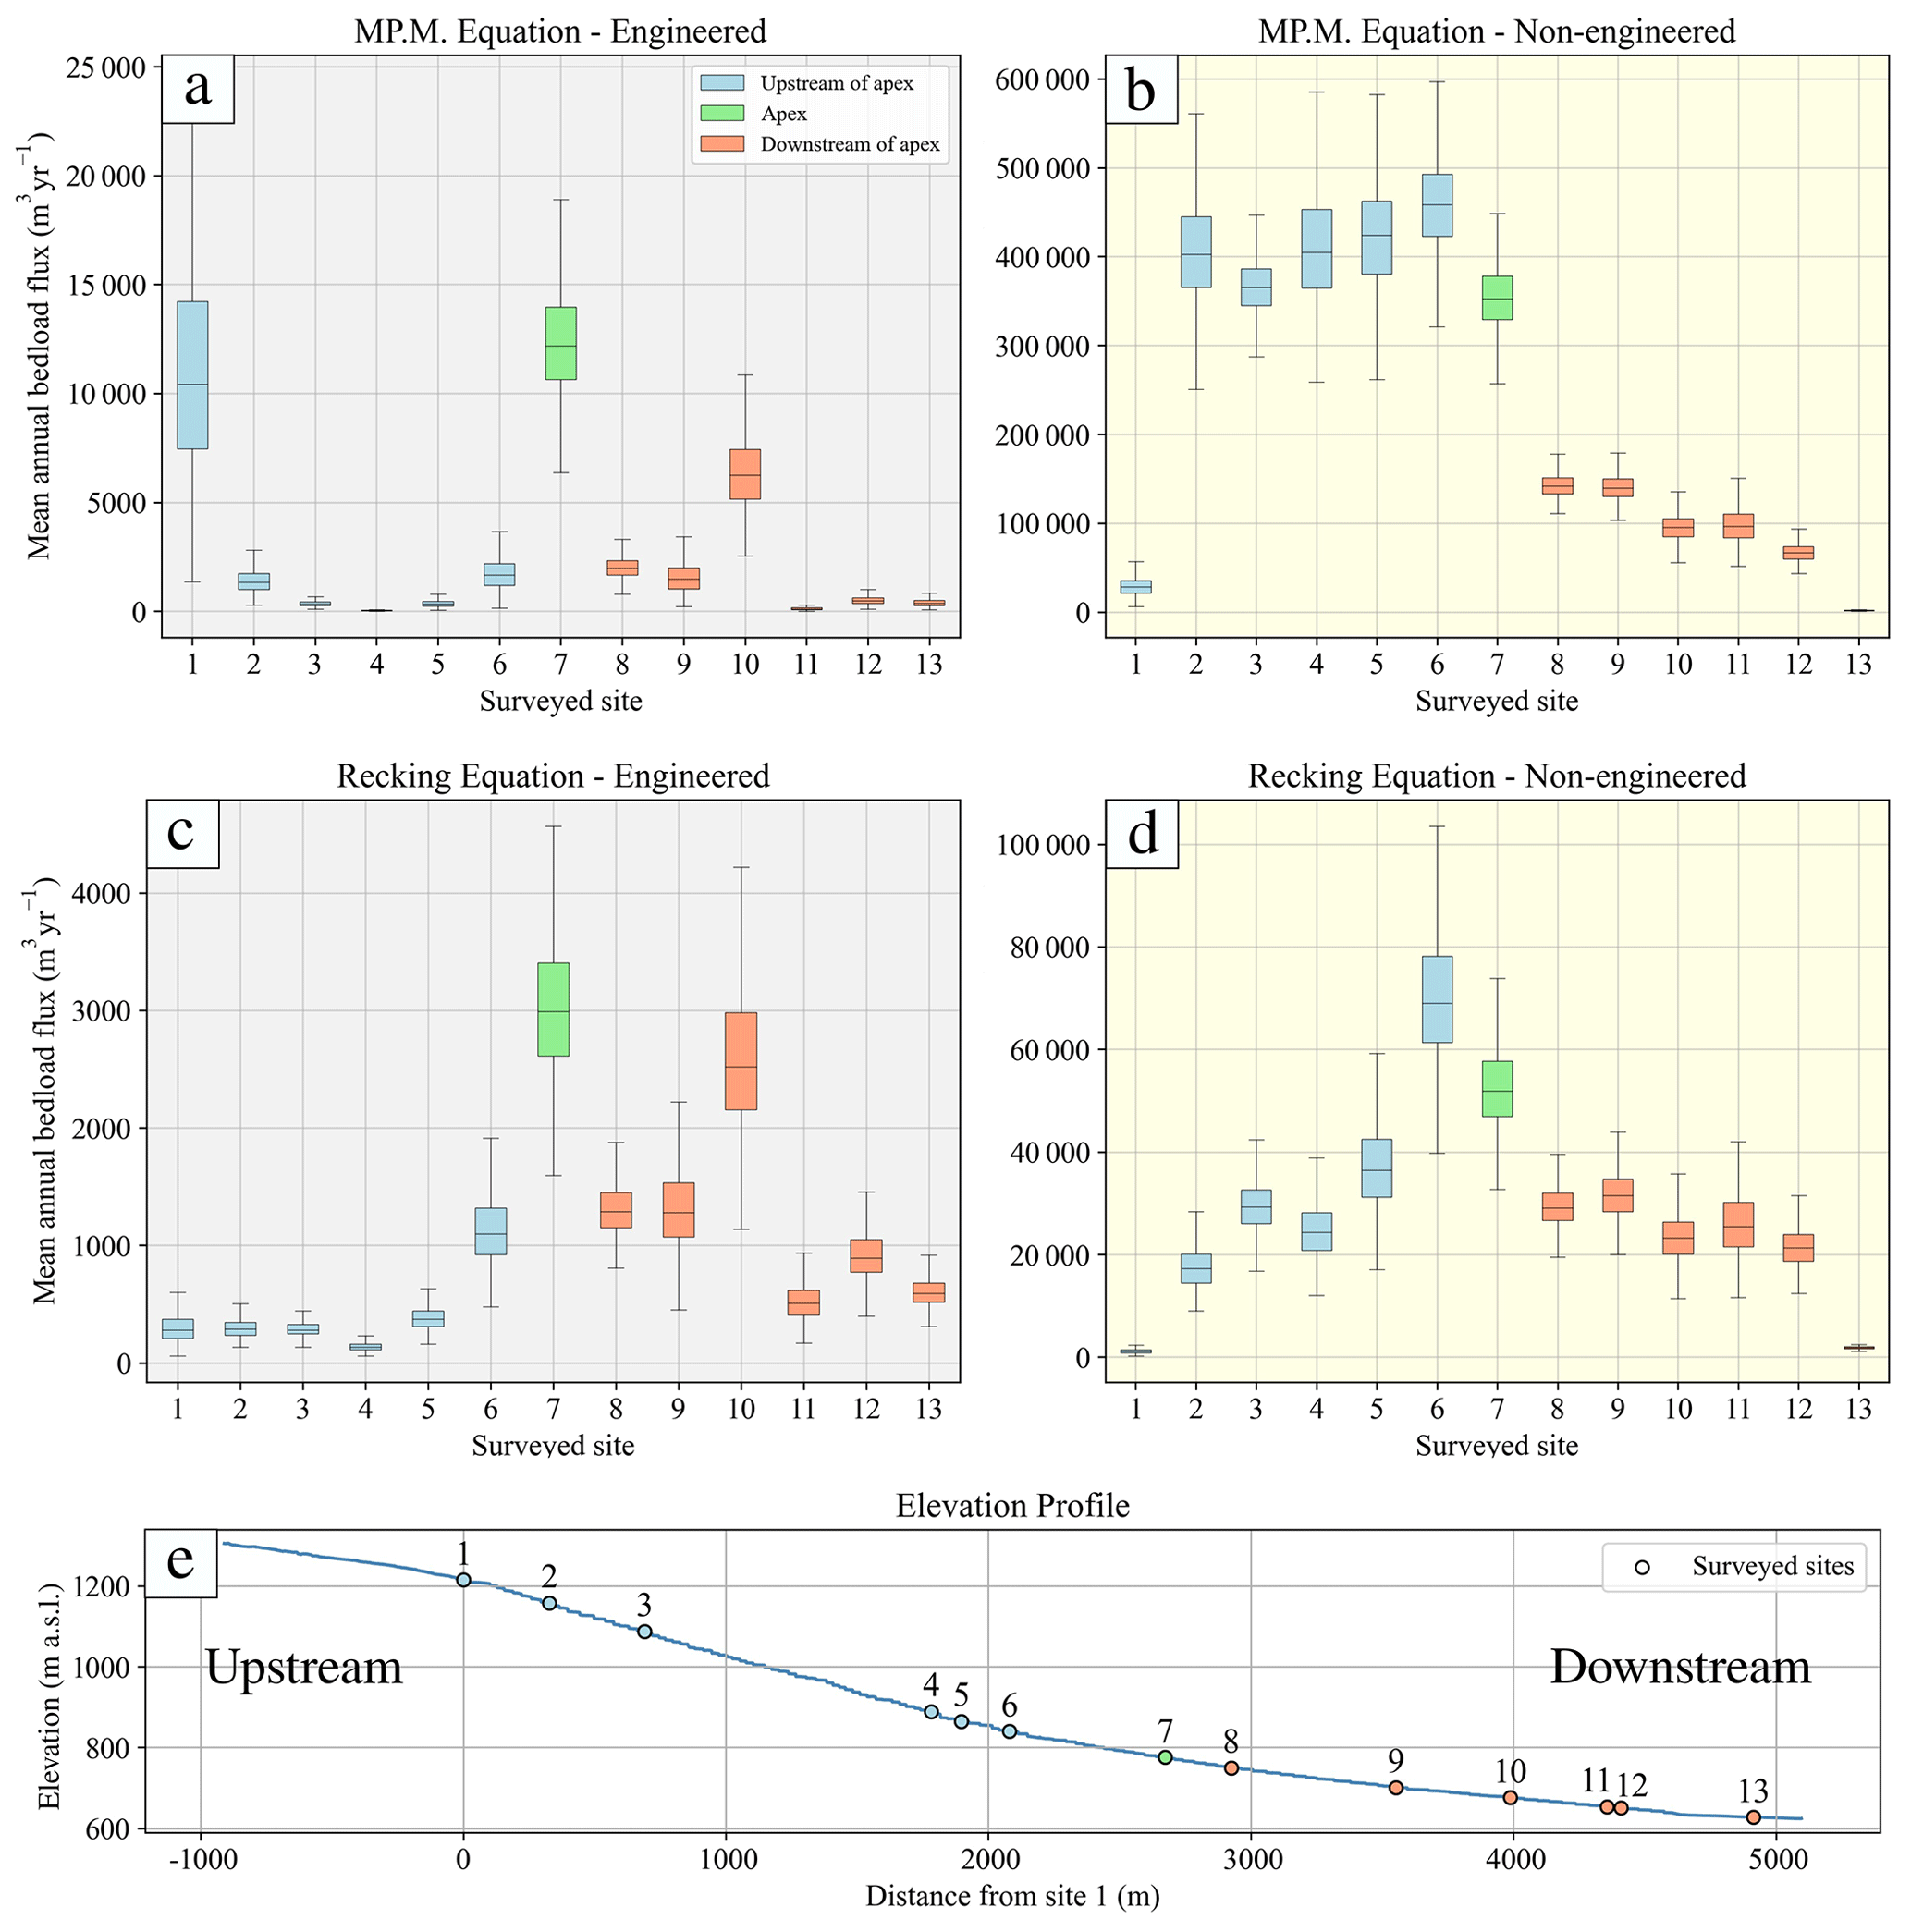
Figure 7Boxplot representation of the annual mean bedload estimates using the MP.M. and the Recking along all the surveyed sites. For the values of the parameters to compute the sediment flux for engineered (a, c) and non-engineered (b, d) scenarios, please refer to Fig. 4. Specifically, the non-engineered scenario is based on the assumption that the width of the channel is reduced by 50 %. The sites upstream and downstream of the alluvial fan apex are indicated by the blue and red colours, respectively, and the site on the apex is indicated by the green colour.
Along the segment upstream of the apex, the mean annual bedload fluxes calculated for all surveyed sites revealed specific patterns both for engineered and non-engineered conditions and also for the MP.M. and Recking approaches (Fig. 7). For the engineered conditions, the use of the MP.M. equation predicts the highest bedload flux, which is ca. 10 000 m3 yr−1 for site 1, whereas the fluxes are less than 2500 m3 yr−1 for all the other surveyed sites (Fig. 7a). In contrast, the application of the Recking equation returns values of mean annual bedload flux that are less than 1000 m3 yr−1 for all sites upstream of the fan apex (Fig. 7c). For the non-engineered conditions, the application of the MP.M. equation shows a rapid increase in the bedload capacity between sites 1 and 2, after which the values fluctuate around ca. 400 000 m3 yr−1 in the downstream direction until the fan apex (Fig. 7b). In contrast, the application of the Recking approach predicts that sediment flux continuously increases from < 1000 m3 yr−1 in the headwaters to > 60 000 m3 yr−1 near the fan apex (Fig. 7d). If the stream's response to peak discharge conditions is considered, then for engineered conditions the MP.M. equation returns a peak sediment flux at site 1 of 0.3 m3 s−1, after which the bedload flux fluctuates around a constant value that is ca. 3 times lower than at site 1 (Fig. 8a). The pattern is similar if the Recking equation is used, but the values are generally 50 % lower (Fig. 8c). In addition, also using the Recking equation, site 1 has a predicted sediment flux that is the same as farther downstream. If the non-engineered states are considered, then the application of the MP.M. and Recking equations show both the same pattern for the peak discharge scenarios, where the bedload fluxes during peak discharge are between 8 (MP.M. equation) and 20 times higher (Recking equation) than for engineered conditions (Fig. 8b and d).
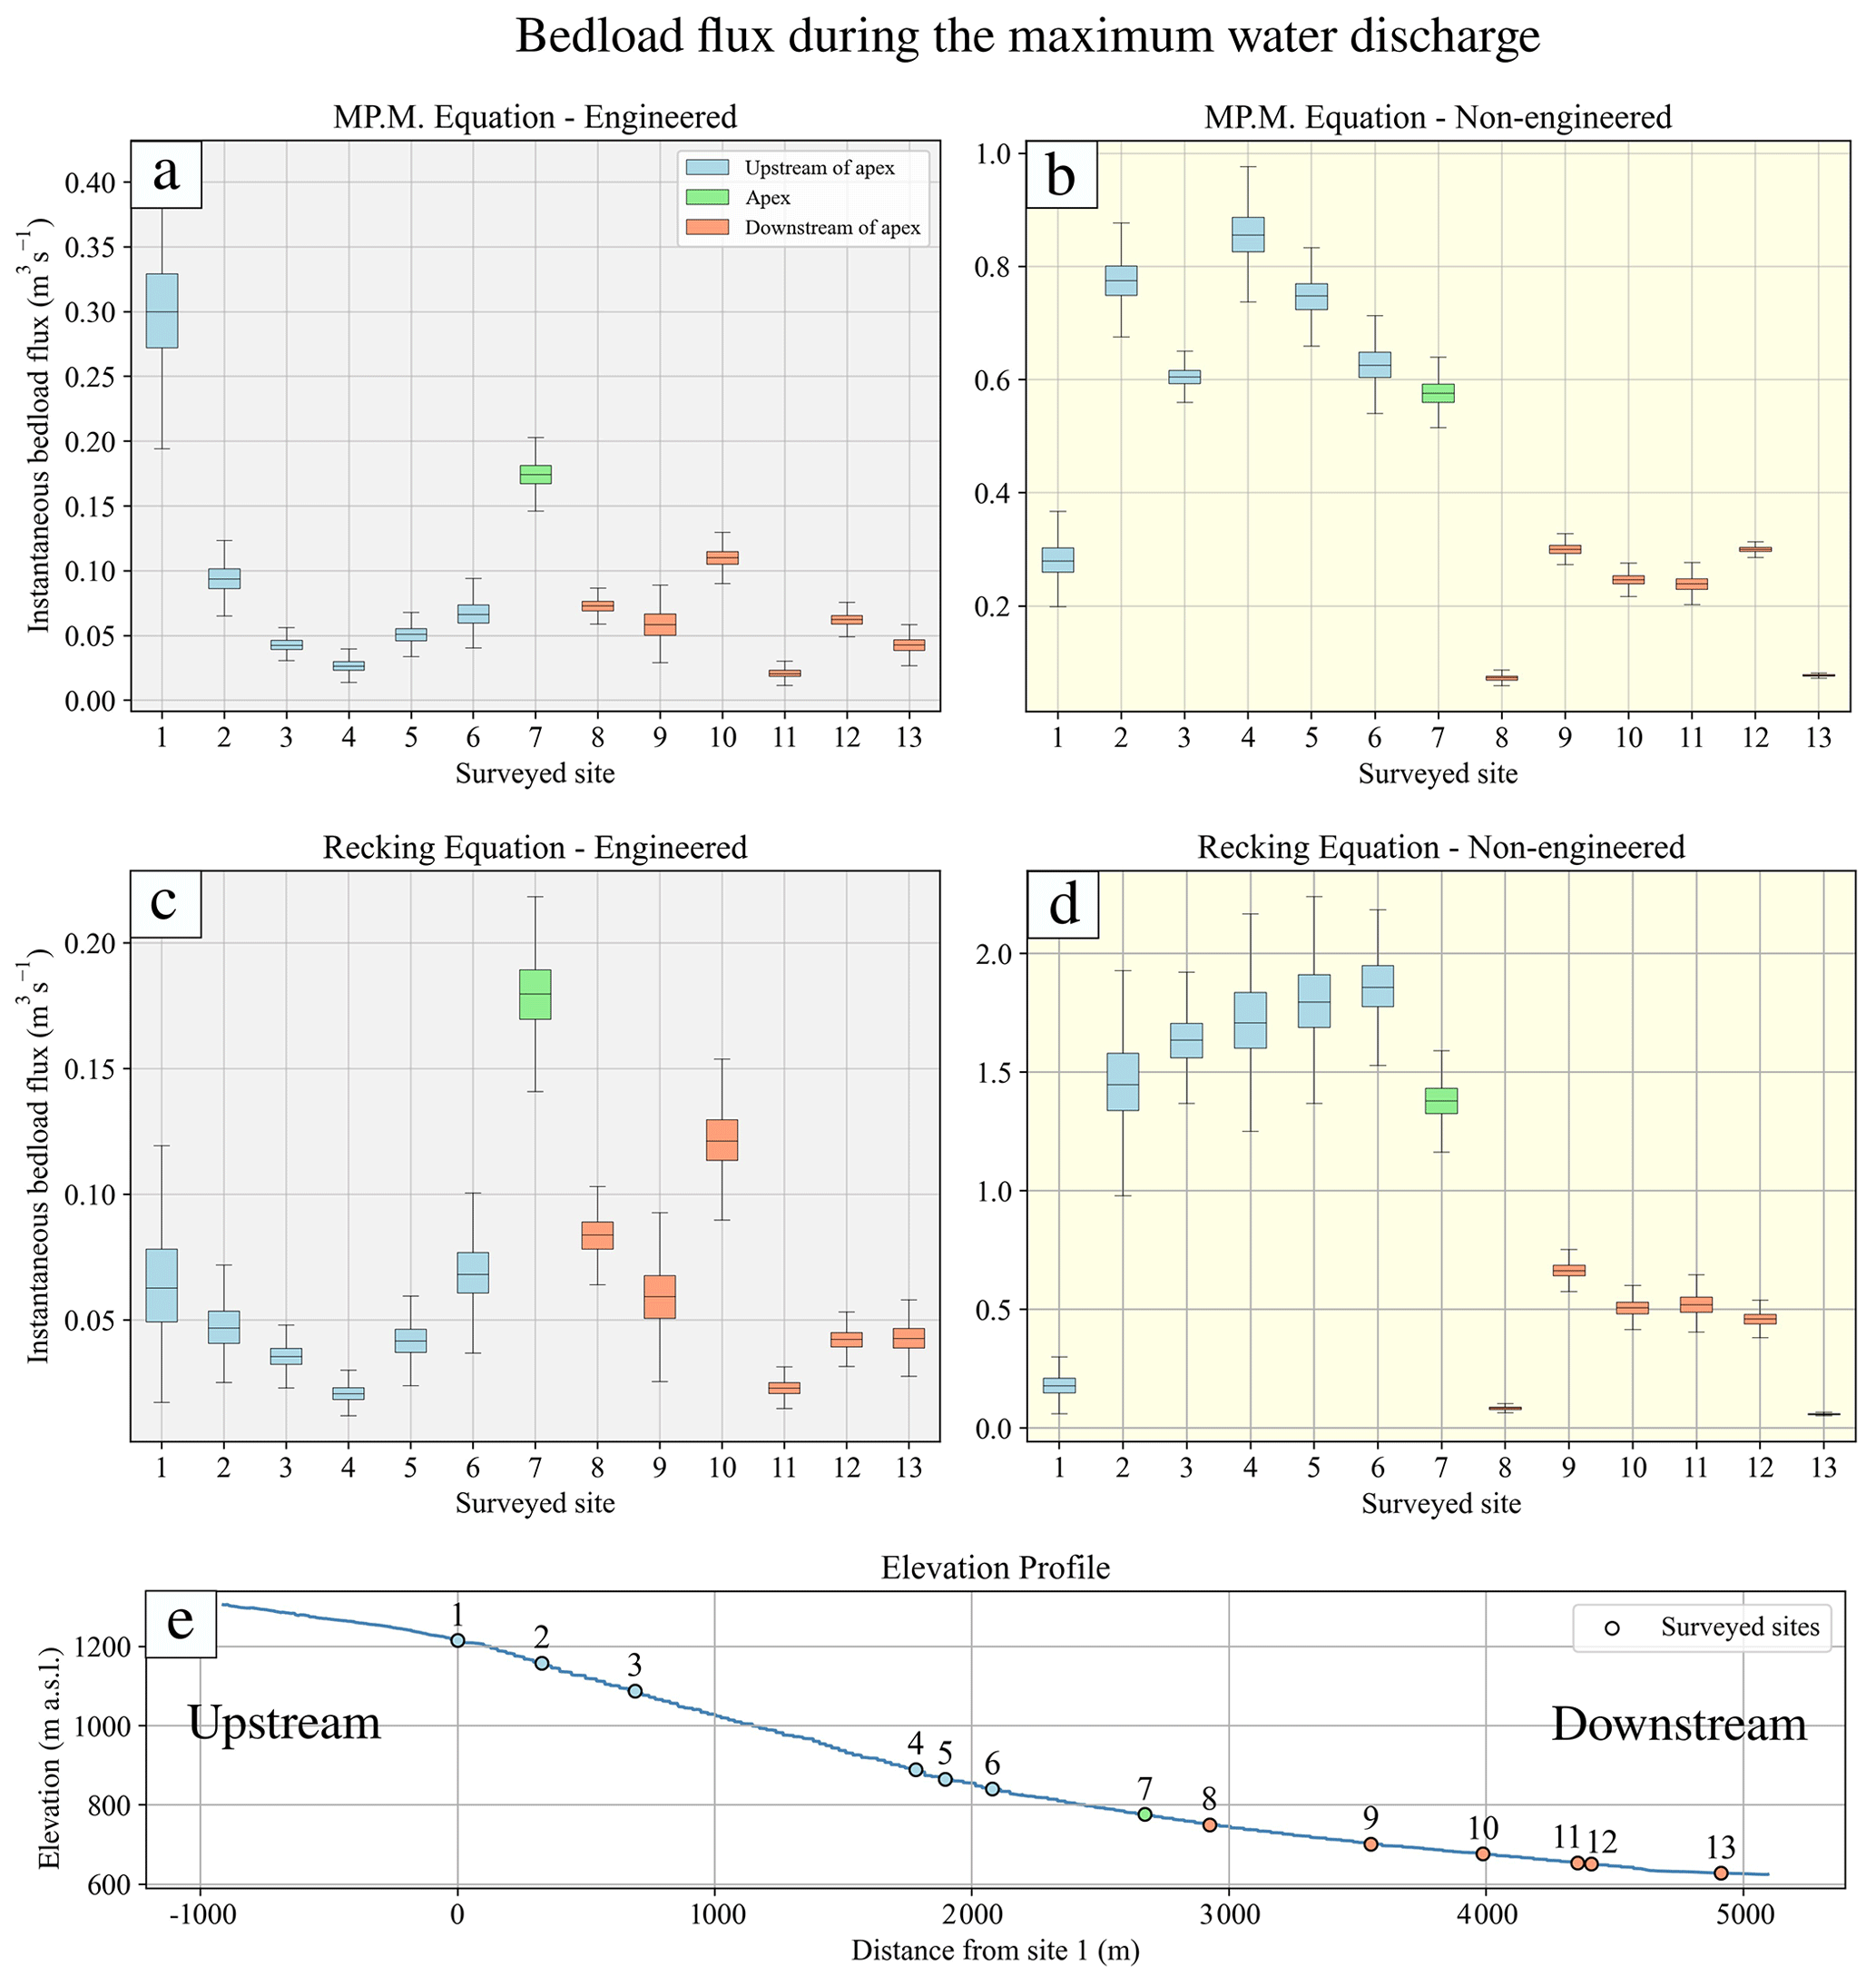
Figure 8Boxplot representation of the bedload predictions using MP.M. and Recking during the 2021 peak runoff along all the surveyed sites. The engineered (a, c) and the non-engineered (b, d) scenarios are based on the parameters shown in Fig. 4. Specifically, in the non-engineered scenario we show the results where 50 % of the current channel width is employed. The sites upstream and downstream of the alluvial fan apex are indicated by the blue and red colours, respectively, and the site on the apex is indicated by the green colour.
Downstream of the apex, the two equations yield the same pattern where both the peak and mean annual bedload fluxes have lower values than at the apex for non-engineered conditions (Figs. 7 and 8). Yet, for the engineered conditions, we observed that the flux pattern locally reached high values particularly if the Recking equation is applied. Finally, to identify potential locations of riverbed armour breaking during peak discharge, we estimated the bedload flux by applying the Shields equation (Eq. 4) with the D84 grain size as a threshold (Schlunegger et al., 2020). This estimation is a variation of the result presented in Fig. 8 for the peak discharge in 2021, where we considered armour breaking if the calculated bedload flux exceeds 0.001 m3 s−1 (Table S4). When armour breaking occurs, we anticipate a substantial material transport and expect changes in the channel morphology, including slope variations, during and after the event. Under engineered conditions, our results suggest that such channel bedform reorganization might occur at only a few specific sites (Table S4). Conversely, in a non-engineered scenario, almost all sites are predicted to experience armour-breaking conditions during a flood with a magnitude comparable to the 2021 peak discharge (Table S4).
The application of two different approaches to calculate the bedload transport capacity revealed specific differences, which become more important when considering the non-engineered status. In contrast, where bedload transport rates are calculated for engineered conditions, the differences resulting from the two formulations are less and within uncertainties. This will further be discussed in Sect. 5.1. Thereafter, we discuss how the check dams potentially contribute to the regulation of sediment transport (Sect. 5.2) and how the stabilization of the channel bed affects the consolidation of the hillslopes (Sect. 5.3).
5.1 Analysis of the equations' results
For non-engineered conditions, we consider the MP.M. approach to yield a strong overestimation of the mean annual sediment bedload flux if the results of the Recking equation are taken as a reference. We justify the selection of this benchmark because the Recking formula was explicitly validated with data from steep mountainous catchments such as the Guerbe River (see above). Furthermore, a recently published dataset on sediment load in torrent catchments reveals that for areas below 5 km2 the maximum sediment supply is approximately 13 000 m3 yr−1 (Morel et al., 2023). Similar to the Guerbe case, this value is of the same order of magnitude as the predictions by the Recking equation (N.E. 1 and N.E. 4 in Fig. 6b) and is roughly 10 times less than the predictions from the MP.M. for a non-engineered situation (Fig. 6a). This overestimation of the bedload transport rates mainly concerns the cases of low water discharge (Fig. 9b). Because low water fluxes occur more frequently during 1 year than peak discharges, the mean annual bedload transport rates will be higher. For peak discharges, however, the Recking equation predicts much higher sediment fluxes than the MP.M. equation (Fig. 9b). Since the Recking approach was also validated for peak water flux (see above), we consider the resulting values for the Guerbe River as realistic. For the engineered conditions, however, both equations predict similar sediment fluxes during low and high runoff (Fig. 9a), thereby explaining why predictions of mean annual sediment fluxes are nearly the same for both equations.
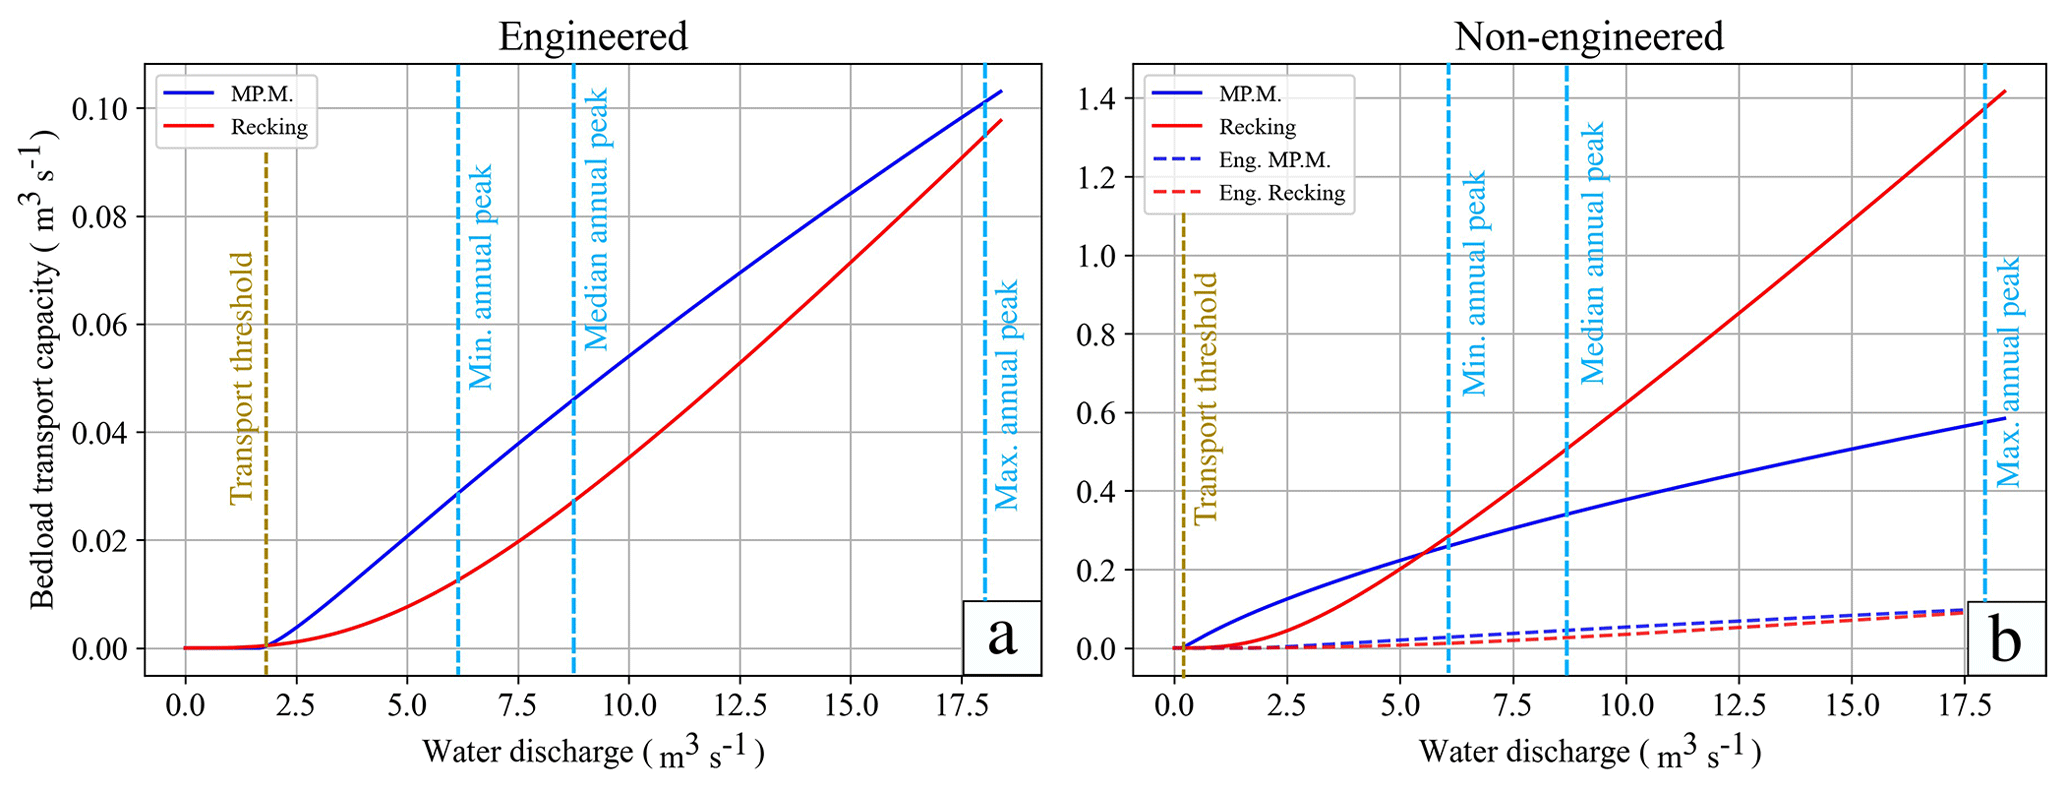
Figure 9Predicted bedload versus water discharge patterns using the MP.M. and Recking approaches for (a) engineered and (b) non-engineered conditions. These patterns were determined using data collected at site 7 (Fig. 4). Specifically, as shown in this figure, the results for the engineered scenario are based on the average of the engineered slopes. Those of the non-engineered scenario considered a 50 % reduction of the channel width at site 7 and the grain size data that were also collected at that site.
We also compare our outcomes with two available studies in the Guerbe catchment. The first one estimated the sediment budget from 10Be concentrations in the catchment (Delunel et al., 2020), where a denudation rate of approximately 260 mm kyr−1 on our surveyed catchment area gives a mean annual sediment yield of ca. 3000 m3 yr−1. Conventionally, cosmogenic data integrate denudation of timescales of several thousands of years (von Blanckenburg, 2005), and as such this value would correspond to the total sediment flux prior to the construction of the check dams. However, as will be argued below, the construction of these steps resulted in a partial disconnection between the shallow-seated landslides and the Guerbe River, particularly along the margin of the trunk channel (e.g. the Riselbruch landslide which became stabilized after the check dams were built; see Sect. 5.3). Because the foot of a landslide has been documented to release material with low 10Be concentrations (Cruz Nunes et al., 2015), we anticipate that during pre-engineered conditions the concentrations of cosmogenic 10Be in riverine quartz would have been lower. Therefore, we consider the sediment flux of ca. 3000 m3 yr−1 as representative of the current state. The second study used the CEASAR-Lisflood evolution model to estimate the total sediment load (suspended and bedload) for engineered conditions, where a mean annual sediment load of 1222 m3 yr−1 was predicted (Ramirez et al., 2022). Both results can be converted to mean annual bedload fluxes by applying a 60 % factor, based on the results of sediment budgets carried out on mountain streams in the Alps for basins that are ca. 10 km2 large (Schlunegger and Hinderer, 2003). Therefore, applying these corrections for the current engineered state, the 10Be-based bedload flux is ca. 1800 m3 yr−1, whereas the related value derived with the CEASAR-Lisflood evolution model would be in the range of ca. 700 m3 yr−1. Considering the uncertainties that are associated with estimating bedload transport, the cosmo-based sediment flux and the estimates by Ramirez et al. (2022) are in agreement with the outcome of our calculations based on the Recking formula.
5.2 Regulation of sediment transport
For engineered conditions and considering the last peak water discharge event in 2021, the predictions using the MP.M. and Recking approaches reveal site-specific fluctuations in both the transport capacity and the armour-breaking probability (Fig. 8 and Table S4). This pattern suggests that sediment transport is regulated through buffering effects where during a peak discharge event some sites will store a fraction of the supplied sediment while others will release a large portion of the previously stored material. Such regulation has already been described for filled check dams where the concrete structures (such as check dams) create fixed points along a longitudinal profile of a river, which disconnects the reaches between the dams (Piton et al., 2017). In addition, check dams reduce the length of the reach where spontaneous erosion could occur, thereby reducing the risk where large volumes of sediment are released and transported downstream in a short time (Piton and Recking, 2016). We consider that the occurrence of such a regulation is recorded by the downstream fluctuations of the alluvial slopes (Figs. 4 and S3) where segments with flat slopes have the potential to store further material, whereas reaches with steep slopes will likely represent a sediment source during a next event when large water fluxes occur. As an additional consequence of such a regulation, the grain size will rapidly become finer downstream through selective transport, particularly along the depositional sites. Such a mechanism was predicted by theory (Paola et al., 1992) and is documented by our data (Fig. 4). Note, however, that besides selective transport, the breaking of grains as they fall from the dams into the pool likely also contributes to the material becoming finer (Miller et al., 2014).
5.3 Bed stabilization and hillslope consolidation
We interpret that the check dams contribute effectively to the bed stabilization of the Guerbe River (Piton et al., 2017; Lucas-Borja et al., 2021). We infer the occurrence of such a mechanism at work using the results of the MP.M. and Recking equations, both of which predict that in the absence of check dams the mean annual transport capacity would be substantially higher. This is particularly true along the segment between sites 1 and 2 where the predictions of the sediment flux for the non-engineered state are compared to the flux values characterizing the engineered conditions (Fig. 7b and d). This is also the region where we mapped a major knickzone on the hillslopes that border the channel network (Fig. 2). Such features are usually considered evidence for the occurrence of high surface erosion and sediment production rates (Van den Berg and Schlunegger, 2012; Whittaker and Boulton, 2012; Battista et al., 2020), and they would most likely represent the sites of major sediment production in a case where no check dams were built. It appears that the check dams are stabilizing the bed, thereby reducing the erosional potential along the reach, which otherwise would be an important sediment factory.
In a scenario where the Guerbe riverbed has not been stabilized, fluvial erosion could lead to an increase in sediment supply by activating shallow-seated landslides (Piton et al., 2017; Lucas-Borja et al., 2021). Such a mechanism at work has been documented for the Erlenbach River, which is an Alpine torrent in central Switzerland (Rickenmann and Fritschi, 2010). For this basin, Molnar et al. (2010) documented an increase in the slip rates of landslides following a period of rapid fluvial dissection. For the case of the Guerbe basin, an inspection of satellite images taken between 1970 and the present from the Guerbe River discloses that between sites 1 and 2 the landslide activity in the Riselbruch (Knickpoint zone in Figs. 2, S5a and b) decreased after the construction of the check dams along this reach, leading to a reforestation of the area (Fig. S5c and d). We use this example to argue that the check dams in the Guerbe River contribute to the consolidation of the hillslopes (Piton et al., 2017; Lucas-Borja et al., 2021). This mechanism results in a stabilization of the terrain surrounding the channel, which allows for the growth of a stable vegetation as the landsliding activities decrease. Furthermore, the application of the Recking equation predicts that in the absence of check dams, such a hillslope de-consolidation will not only occur in the uppermost area surrounding the knickzone but also along the entire reach upstream of the fan apex (Fig. 7d). We base this inference on the predicted downstream increase in the bedload sediment flux.
5.4 Are check dams really effective in reducing hazard impact?
From our results, we conclude that the presence of check dams in the Guerbe River does reduce the bedload flux outcoming from the sediment production area, thus reducing the potential for hazards in the downstream reaches of the stream. However, this conclusion is only valid if we assume that the check dams will not fail over time, which has indeed not been the case with the Guerbe River during the past hundreds of years (Salvisberg, 2017). In fact, Ramirez et al. (2022) showed that a failure of one or multiple check dams releases a large amount of the material that was originally stored behind the concrete structures. These authors also showed that such failure can initiate a cascade where other dams will break in the downstream direction. It is possible that reactivation of deep-seated landslides can initiate such a failure. Recently, the displacement of the deep-seated Meierisli landslide has damaged > 10 of these structures (Andres and Badoux, 2019), with the consequence that some of them are likely to break and thus to fail in the next years. It was also found by the responsible engineers (Gabi Hunziker, personal communication, 2022) that the slip of such landslides has not been influenced by the presence of check dams during the past decades, with the consequence that they have constantly applied lateral stress on the concrete structure, causing them to eventually break. Consequently, in order to guarantee the functioning of the check dams as we described above, it is necessary that such infrastructure will be continuously maintained and repaired after some damages, and that the deep landslides will eventually be surveyed and engineered if possible. From a broader perspective, the results of our study can be extended to other steep mountain streams that have already been managed with such infrastructure. In addition, we propose that the outcome of our analysis might be used as guidelines for projects that aim at building a staircase system along a steep mountainous stream.
The analysis presented above shows that the current presence of check dams in a steep alpine stream (Guerbe River) has a major influence on mitigating the sediment production in the catchment and, consequently, reducing the risks of hazards related to high sediment fluxes. We applied two different approaches to calculate bedload fluxes, which were based on the Meyer-Peter and Müller (MP.M.) and the Recking equation, and we applied them for engineered and non-engineered conditions. Both equations resulted in similar predictions regarding mean annual bedload fluxes for the currently engineered state, and they also predict higher transport rates of bedload material for the non-engineered state. However, models that are based on the Recking solution predict an increase in bedload flux for non-engineered conditions that is ca. 10 times higher than for the engineered state, whereas the MP.M. equation predicts a bedload flux that is even 100 times larger. Since the Recking approach was calibrated with data from mountain streams with a channel floor morphology characterized by steps and pools, we consider the resulting predictions for non-engineered scenarios as more reliable than those derived from the MP.M. formula. Importantly, we find that the check dams regulate sediment transport through buffering pulses of sediment during high discharge conditions. In particular, reaches separated by check dams can either function as a sedimentary sink or as a material source. This is observed by the downstream variations of local energy gradients where segments with a higher slope could potentially act as a sediment source, whereas reaches with flatter slopes have the potential to store some of the supplied material. As a second function, we considered that check dams contributed to the stabilization of the channel bed. We infer this by our model results, particularly for the uppermost region where check dams were built. There, for non-engineered conditions, the models predict a large increase in the bedload transport rate where the slope rapidly increases downstream of a knickpoint, as would be expected for a reach characterized by a knickpoint retreat. For engineered conditions, however, our models predict that the transport rates of bedload material remain stable despite the occurrence of a knickpoint. As a consequence, the retreat of this particular knickpoint will not occur as long as the check dams are in operation. Finally, we infer that check dams also contribute to the stabilization of the bordering hillslopes, mainly because they prevent the stream from incising into the substratum. Therefore, we conclude that our approach is a useful and promising tool to evaluate the first-order efficiency of check dams in reducing bedload sediment flux in steep mountain streams.
| A | catchment area (m2); |
| D50 | sediment diameter such that 50 % of the bed surface mixture is finer grained (m); |
| D84 | sediment diameter such that 84 % of the bed surface mixture is finer grained (m); |
| Φ | dimensionless Einstein parameter; |
| g | gravity acceleration (m s−2) |
| Qs | bedload (m3 s−1); |
| q | unit water discharge (m2 s−1); |
| Q | water discharge (m3 s−1); |
| ρs | sediment density (2600 kg m−3); |
| ρw | water density (1000 kg m−3); |
| S | energy gradient (m m−1); |
| τ* | dimensionless shear stress; |
| Shields number (dimensionless); | |
| Recking equation parameter (dimensionless); | |
| τ | shear stress (N m−2); |
| v | mean water velocity in depth (m s−1); |
| W | channel width (m). |
The data used in this study are publicly sourced and reproduced in the Supplement of this paper.
The supplement related to this article is available online at: https://doi.org/10.5194/hess-28-1173-2024-supplement.
AHdP, DM, PG and FS applied the UAV close-range setup in the Guerbe River. DM designed the UAV close-range setup applied in this work. AHdP measured the grain sizes and performed the analyses described in this paper. AHdP wrote the manuscript with support from DM, PG, CS, ACW, SC and FS.
The contact author has declared that none of the authors has any competing interests.
Publisher’s note: Copernicus Publications remains neutral with regard to jurisdictional claims made in the text, published maps, institutional affiliations, or any other geographical representation in this paper. While Copernicus Publications makes every effort to include appropriate place names, the final responsibility lies with the authors.
The authors are grateful for the Bau- und Verkehrsdirektion des Kantons Bern (https://www.bvd.be.ch/, last access: 6 March 2024), which kindly offered us the water discharge data for the Guerbe River. We greatly appreciate that Swisstopo made the DEMs and images available at no cost.
This research has been supported by the University of Bern and the European Union's Horizon 2020 research and innovation programme under the Marie Skłodowska-Curie Actions (grant no. 860383).
This paper was edited by Silvia De Angeli and reviewed by two anonymous referees.
Andres, N. and Badoux, A.: Unwetterschäden in der Schweiz im Jahre 2018. Rutschungen, Murgänge, Hochwasser und Sturzereignisse, Wasser, Energie, Luft, 111, 29–38, 2019.
Bagnold, R. A.: An empirical correlation of bedload transport rates in flumes and natural rivers, P. R. Soc. Lond. A, 372, 453–473, https://doi.org/10.1098/rspa.1980.0122, 1980.
Battista, G., Schlunegger, F., Burlando, P., and Molnar, P.: Modelling localized sources of sediment in mountain catchments for provenance studies. Earth Surf. Proc. Land., 45, 3475–3487, https://doi.org/10.1002/esp.4979, 2020.
Bombino, G., Boix-Fayos, C., Gurnell, A. M., Tamburino, V., Zema, D. A., and Zimbone, S. M.: Check dam influence on vegetation species diversity in mountain torrents of the Mediterranean environment, Ecohydrology, 7, 678–691, https://doi.org/10.1002/eco.1389, 2014.
Carbonneau, P. E. and Dietrich, J. T.: Cost-effective nonmetric photogrammetry from consumer-grade sUAS: implications for direct georeferencing of structure from motion photogrammetry, Earth Surf. Proc. Land., 42, 473–486, https://doi.org/10.1002/esp.4012, 2017
Castillo, C., Pérez, R., and Gómez, J. A.: A conceptual model of check dam hydraulics for gully control: efficiency, optimal spacing and relation with step-pools, Hydrol. Earth Syst. Sci., 18, 1705–1721, https://doi.org/10.5194/hess-18-1705-2014, 2014.
Cruz Nunes, F., Delunel, R., Schlunegger, F., Akçar, N., and Kubik, P. W.: Bedrock bedding, landsliding and erosional budgets in the central European Alps, Terra Nova, 27, 370–378, https://doi.org/10.1111/ter.12169, 2015.
Delunel, R., Schlunegger, F., Valla, P. G., Dixon, J., Glotzbach, C., Hippe, K., Kober, F., Molliex, S., Norton, K. P., Salcher, B., Wittmann, H., Akçar, N., and Christl, M.: Late-Pleistocene Catchment-wide Denudation Patterns Across the European Alps, Earth-Sci. Rev., 211, 103407, https://doi.org/10.1016/j.earscirev.2020.103407, 2020.
Einstein, H. A.: The Bed-load Function for Sediment Transportation in Open Channel Flows, United States Department of Agriculture Soil Conservation Service: Washington, DC, 71, https://doi.org/10.22004/ag.econ.156389, 1950.
Eltner, A., Kaiser, A., Castillo, C., Rock, G., Neugirg, F., and Abellán, A.: Image-based surface reconstruction in geomorphometry – merits, limits and developments, Earth Surf. Dynam., 4, 359–389, https://doi.org/10.5194/esurf-4-359-2016, 2016.
Ferguson, R. I.: Flow resistance equations for gravel- and boulder-bed streams, Water Resour. Res., 43, W05427, https://doi.org/10.1029/2006WR005422, 2007.
Fonstad, M. A., Dietrich, J. T., Courville, B. C., Jensen, J. L., and Carbonneau, P. E.: Topographic structure from motion: A new development in photogrammetric measurement, Earth Surf. Proc. Land., 38, 421–430, https://doi.org/10.1002/esp.3366, 2013.
Jäckle, S.: Hydrologischer atlas der Schweiz. Wildbach Gürbe Gurnigel – Wattenwil, Vol. 6.1, Berne, Schweiz: Geographisches Institut der Universität Bern, https://hydrologischeratlas.ch/produkte/exkursionen/bern/6_1 (last access: 5 March 2024), 2013.
James, M. R. and Robson, S.: Straightforward reconstruction of 3D surfaces and topography with a camera: Accuracy and geoscience application, J. Geophys. Res.-Earth, 117, F03017, https://doi.org/10.1029/2011JF002289, 2012.
James, M. R. and Robson, S.: Mitigating systematic error in topographic models derived from UAV and ground-based image networks, Earth Surf. Proc. Land., 39, 1413–1420, https://doi.org/10.1002/esp.3609, 2014.
James, M. R., Robson, S., and Smith, M. W.: 3-D uncertaintybased topographic change detection with structure-from-motion photogrammetry: precision maps for ground control and directly georeferenced surveys, Earth Surf. Proc. Land., 42, 1769–1788, https://doi.org/10.1002/esp.4125, 2017a.
James, M. R., Robson, S., d'Oleire-Oltmanns, S., and Niethammer, U.: Optimising UAV topographic surveys processed with structure-from-motion: Ground control quality, quantity and bundle adjustment, Geomorphology, 280, 51–66, https://doi.org/10.1016/j.geomorph.2016.11.021, 2017b.
James, M. R., Antoniazza, G., Robson, S., and Lane, S. N.: Mitigating systematic error in topographic models for geomorphic change detection: accuracy, precision and considerations beyond off-nadir imagery, Earth Surf. Proc. Land., 45, 2251–2271, https://doi.org/10.1002/esp.4878, 2020.
Julien, P. Y.: Erosion and Sedimentation, Cambridge Univ. Press 2, Cambridge, UK, https://doi.org/10.1017/CBO9780511806049, 2010.
Kaitna, R., Chiari, M., Kerschbaumer, M., Kapeller, H., Zlatic-Jugovic, J., Hengl, M., and Huebl, J.: Physical and numerical modelling of a bedload deposition area for an Alpine torrent, Nat. Hazards Earth Syst. Sci., 11, 1589–1597, https://doi.org/10.5194/nhess-11-1589-2011, 2011.
Karim, F. and Kennedy, J. F.: Menu of couple velocity and sediment discharge relations for rivers, J. Hydraul. Eng., 116, 978–996, https://doi.org/10.1061/(ASCE)0733-9429(1990)116:8(978), 1990.
Keiler, M. and Fuchs, S.: Challenges for natural hazard and risk management in mountain regions of Europe, in: Oxford research encyclopedia of natural hazard science, Oxford, UK, Oxford University Press, https://doi.org/10.1093/acrefore/9780199389407.013.322, 2018.
Lamb, M. P., Dietrich, W. E., and Venditti, J.-G.: Is the critical Shields stress for incipient sediment motion dependent on channel-bed slope?, J. Geophys. Res., 113, F02008, https://doi.org/10.1029/2007JF000831, 2008.
Lucas-Borja, M. E., Piton, G., Yu, Y., Castillo, C., and Antonio Zema, D.: Check dams worldwide: objectives, functions, effectiveness and undesired effects, Catena, 204, 105390, https://doi.org/10.1016/j.catena.2021.105390, 2021.
Mair, D., Do Prado, A. H., Garefalakis, P., Lechmann, A., Whittaker, A., and Schlunegger, F.: Grain size of fluvial gravel bars from close-range UAV imagery – uncertainty in segmentation-based data, Earth Surf. Dynam., 10, 953–973, https://doi.org/10.5194/esurf-10-953-2022, 2022.
McMahon, T. A., Fenton, J., Stewardson, M., Costelloe, J., and Finlayson, B.: Estimating discharge at an ungauged site, Australian Journal of Water Resources, 5, 113–117, https://doi.org/10.1080/13241583.2002.11465197, 2002.
Meyer-Peter, E. and Müller, R.: Formulas for bed-load transport. Proceedings, 2nd Meeting IAHR, Stockholm, 39–64, https://repository.tudelft.nl/islandora/object/uuid:4fda9b61-be28-4703-ab06-43cdc2a21bd7 (last access: 5 March 2024), 1948.
Miller, K. L., Szabo, T., Jerolmack, D. J., and Domokos, G.: Quantifying the significance of abrasion and selective transport for downstream fluvial grain size evolution, J. Geophys. Res., 119, 2412–2429, https://doi.org/10.1002/2014JF003156, 2014.
Molnar, P., Densmore, A. L., McArdell, B. W., Turowski, J. M., and Burlando, P.: Analysis of changes in the step-pool morphology and channel profile of a steep mountain stream following a large flood, Geomorphology, 124, 85–94, https://doi.org/10.1016/j.geomorph.2010.08.014, 2010.
Morel, M., Piton, G., Kuss, D., Evin, G., and Le Bouteiller, C.: Statistical modeling of sediment supply in torrent catchments of the northern French Alps, Nat. Hazards Earth Syst. Sci., 23, 1769–1787, https://doi.org/10.5194/nhess-23-1769-2023, 2023.
Paola, C., Parker, G., Seal, R., Sinha, S. K., Southard, S. K., and Wilcock, P. R.: Downstream fining by selective deposition in a laboratory flume, Science, 258, 1757–1760, https://doi.org/10.1126/science.258.5089.1757, 1992.
Parker, G.: Transport of gravel and sediment mixtures, in: Sedimentation Engineering: Processes, Measurements, Modeling, and Practice, ASCE Manual 54, American Society of Civil Engineers (ASCE): Reston, VA xxi, 1132 pp., https://doi.org/10.1061/9780784408148, 2008.
Piton, G. and Recking, A.: Effects of check dams on bed-load transport and steep-slope stream morphodynamics, Geomorphology, 291, 94–105, https://doi.org/10.1016/j.geomorph.2016.03.001, 2016.
Piton, G. and Recking, A.: The concept of “travelling bedload” and its consequences for bedload computation in mountain streams, Earth Surf. Proc. Land., 42, 1505–1519, https://doi.org/10.1002/esp.4105, 2017.
Piton, G., Carladous, S., Recking, A., Tacnet, J., Liebault, F., Kuss, D., Quefféléan, Y., and Marc, O.: Why do we build check dams in Alpine streams? An historical perspective from the French experience, Earth Surf. Proc. Land., 42, 91–108, https://doi.org/10.1002/esp.3967, 2017.
Ramirez, J. A., Mertin, M., Peleg, N., Horton, P., Skinner, C., Zimmermann, M., and Keiler, M.: Modelling the long-term geomorphic response to check dam failures in an alpine channel with CAESAR-Lisflood, Int. J. Sediment Res., 37, 687–700, https://doi.org/10.1016/j.ijsrc.2022.04.005, 2022.
Recking, A.: Simple method for calculating reach-averaged bedload transport, J. Hydraul. Eng., 139, 70–75, https://doi.org/10.1061/(ASCE)HY.1943-7900.0000653, 2013.
Recking, A., Liébault, F., Peteuil, C., and Jolimet, T.: Testing bedload transport equations with consideration of time scales, Earth Surf. Proc. Land., 37, 774–789, https://doi.org/10.1002/esp.3213, 2012.
Recking, A., Piton, G., Vázquez-Tarrío, D., and Parker, G.: Quantifying the morphological print of bedload transport, Earth Surf. Proc. Land., 41, 809–822, https://doi.org/10.1002/esp.3869, 2016.
Rickenmann, D.: Comparison of bed load transport in torrents and gravel bed streams, Water Resour. Res., 37, 3295–3305, https://doi.org/10.1029/2001WR000319, 2001.
Rickenmann, D. and Fritschi B.: Bedload transport measurements using piezoelectric impact sensors and geophones, in: Bedload-surrogate monitoring technologies: U.S. Geological Survey Scientific Investigations Report 2010–5091, edited by: Gray, J. R., Laronne, J. B., and Marr, J. D. G., Reston, VA; 407–423, https://www.dora.lib4ri.ch/wsl/islandora/object/wsl:11935 (last access: 5 March 2024), 2010.
Rickenmann, D. and Recking, A.: Evaluation of flow resistance in gravel-bed rivers through a large field dataset, Water Resour. Res., 47, 1–22, https://doi.org/10.1029/2010WR009793, 2011.
Salvisberg, M.: Die unzahmbare Gürbe: Überschwemmungen und hochwasserschutz seit dem 19. Jahrhundert, Basel, Schweiz: Schwabe AG, ISBN 3796537154, 2017.
Schlunegger, F. and Hinderer, M.: Pleistocene/Holocene climate change, reestablishment of fluvial drainage network and increase in relief in the Swiss Alps, Terra Nova, 15, 88–95, https://doi.org/10.1046/j.1365-3121.2003.00469.x, 2003.
Schlunegger, F., Delunel, R., and Garefalakis, P.: Short communication: Field data reveal that the transport probability of clasts in Peruvian and Swiss streams mainly depends on the sorting of the grains, Earth Surf. Dynam., 8, 717–728, https://doi.org/10.5194/esurf-8-717-2020, 2020.
Shields, A.: Application of similarity principles and turbulence research to bed load movement, SCSC Laboratory, California Institute of Technology, USDA, Pasadena, CA, https://authors.library.caltech.edu/records/1hysg-j4j53 (last access: 5 March 2024), 1936.
Shvidchenko, A., Pender, G., and Hoey, T. B.: Critical shear stress for incipient motion of sand/gravel streambeds, Water Resour. Res., 37, 2273, https://doi.org/10.1029/2000WR000036, 2001.
Spreafico, M. and Weingartner, R.: The hydrology of Switzerland. Selected aspects and results (Reports, Bundesamt f. Wasser u.Geologie (BWG) Water Series No. 7), https://www.bafu.admin.ch/bafu/en/home/topics/water/water--publications/publications-water/the-hydrology-in-switzerland.html (last access: 5 March 2024), 2005.
Sriwongsitanon, N. and Taesombat, W.: Effects of land cover on runoff coefficient, J. Hydrol., 410, 226–238, https://doi.org/10.1016/j.jhydrol.2011.09.021, 2011.
Swisstopo: Swiss Positioning Service swipos, https://www.swisstopo.admin.ch/en/geodata/geoservices/swipos.html, last access: 26 February 2022.
Thuner Tagblatt: Gürbe-Schwellen können nicht repariert werden, https://www.thunertagblatt.ch/guerbe-schwellen-koennen-nicht-repariert-werden-360476583456 (last access: 5 March 2024), 2018.
Tuset, J., Vericat, D., and Batalla, R.: Rainfall, runoff and sediment transport in a Mediterranean mountainous catchment, Sci. Total Environ., 540, 114–132, https://doi.org/10.1016/j.scitotenv.2015.07.075, 2016.
Van den Berg, F., and Schlunegger, F.: Alluvial cover dynamics in response to floods of various magnitudes: The effect of the release of glaciogenic material in a Swiss Alpine catchment, Geomorphology, 141–142, 112–133, https://doi.org/10.1016/j.geomorph.2011.12.030, 2012.
von Blanckenburg, F.: The control mechanisms of erosion and weathering at basin scale from cosmogenic nuclides in river sediment, Earth Planet. Sc. Lett., 237, 462–479, https://doi.org/10.1016/j.epsl.2005.06.030, 2005.
Whittaker, A. C. and Boulton, S. J.: Tectonic and climatic controls on knickpoint retreat rates and landscape response times, J. Geophys. Res., 117, F02024, https://doi.org/10.1029/2011JF002157, 2012.
Wong, M. and Parker, G.: Re-analysis and correction of bed load relation of Meyer-Peter and Muller using their own database, J. Hydraul. Eng., 132, 1159–1168, https://doi.org/10.1061/(ASCE)0733-9429(2006)132:11(1159), 2006.
Wolman, M. G.: A method of sampling coarse riverbed material, T. Am. Geophys. Union, 35, 951, https://doi.org/10.1029/TR035i006p00951, 1954.
Zimmermann, A.: Flow resistance in steep streams: an experimental study, Water Resour. Res., 46, W09536, https://doi.org/10.1029/2009WR007913, 2010.