the Creative Commons Attribution 4.0 License.
the Creative Commons Attribution 4.0 License.
 | 15 Feb 2023
Effects of dynamic changes of desiccation cracks on preferential flow: experimental investigation and numerical modeling
Jiaming Zhang
Zhi Zhou
Juan P. Aguilar-Lopez
Roberto Greco
Thom Bogaard
Preferential flow induced by desiccation cracks (PF-DC) has been proven to be an important hydrological effect that could cause various geotechnical engineering and ecological environment problems. Investigation on the PF-DC remains a great challenge due to the soil shrinking–swelling behavior. This work presents an experimental and numerical study of the PF-DC considering the dynamic changes of desiccation cracks. A soil column test was conducted under wetting–drying cycles to investigate the dynamic changes of desiccation cracks and their hydrological response. The ratios between the crack area and soil matrix area (crack ratio), crack aperture and depth were measured. The soil water content, matrix suction and water drainage were monitored. A new dynamic dual-permeability preferential flow model (DPMDy) was developed, which includes physically consistent functions in describing the variation of both porosity and hydraulic conductivity in crack and matrix domains. Its performance was compared to the single-domain model (SDM) and rigid dual-permeability model (DPM) with fixed crack ratio and hydraulic conductivity. The experimental results showed that the maximum crack ratio and aperture decreased when the evaporation intensity was excessively raised. The self-closure phenomenon of cracks and increased surficial water content was observed during low-evaporation periods. The simulation results showed that the matrix evaporation modeled by the DPMDy is lower than that of the SDM and DPM, but its crack evaporation is the highest. Compared to the DPM, the DPMDy simulated a faster pressure head building-up process in the crack domain and higher water exchange rates from the crack to the matrix domain during rainfall. Using a fixed crack ratio in the DPM, whether it is the maximum or the average value from the experiment data, will overestimate the infiltration fluxes of PF-DC but underestimate its contribution to the matrix domain. In conclusion, the DPMDy better described the underlying physics involving crack evolution and hydrological response with respect to the SDM and DPM. Further improvement of the DPMDy should focus on the hysteresis effect of the soil water retention curve and soil deformation during wetting–drying cycles.
- Article
(16060 KB) - Full-text XML
- BibTeX
- EndNote


Desiccation cracks are prevalent in clay-dominated soils due to water loss and often lead water to bypass the surface soil matrix and rapidly infiltrate into subsoil as preferential flow (Davidson, 1984; Weiler, 2005). Positively, the preferential flow induced by desiccation cracks (PF-DC) can promote the migration of farmland organic matter (Vervoort et al., 2003) and reduce surface runoff (Pei et al., 2020; Zhang et al., 2021a). Negatively, it also has proven to be an important hydrological mechanism that could lead to geotechnical engineering and ecological environment problems, such as dike and slope instability (Jamalinia et al., 2020; Zhang et al., 2021b), shallow landslides (Bogaard and Greco, 2015; Caris and Van Asch, 1991; Luo et al., 2021), groundwater pollution (Chaduvula et al., 2022; Chen et al., 2002; Mooney and Morris, 2008; Schlögl et al., 2022) and reduction of irrigation efficiency (Greve et al., 2010; Smith et al., 2005; Wang et al., 2018; Wang et al., 2022). Under the current background of frequent extreme flood–drought climate events, its negative effects will be more prominent (Tichavsky et al., 2019). Investigations on the PF-DC are of great significance in guiding scientific research and practical design in the above disciplines.
A unique characteristic of the desiccation cracks is their dynamic features, often causing instantaneous variation of crack proportion, depth and connectivity with moisture content. Previous efforts have attempted to reveal the effects of crack dynamics on the PF-DC through experimental studies, but most of them focused on the short-term wetting process and obtained only qualitative results, and debates remained. For instance, Favre et al. (1997) and Liu et al. (2003) stated that crack closure due to wetting can cause a significant reduction or even disappearances in the preferential flow. However, other studies found that the PF-DC also leads water to rapidly infiltrate into deep soil, even when desiccation cracks are nearly closed (Baram et al., 2012; Greve et al., 2010; Luo et al., 2021; Tuong et al., 1996; Sander and Gerke, 2007). Cheng et al. (2021) conducted a series of constant-head permeability tests with the hydraulic head gradient of 15 kPa. They stated that 4 % of surface crack ratio could be a critical value for determining whether desiccation cracks cause a significant increase in the infiltration rate or not. However, this value may vary with different soils, rainfall patterns and sample scales and thus lacks general applicability. Indeed, PF-DC has long-term and complex spatiotemporal variability due to crack dynamics during wetting–drying cycles. Therefore, short-term and small-scale infiltration tests (i.e., laboratory permeability tests) are not enough to reveal the complex hydrological process induced by PF-DC. Meanwhile, it is also difficult to quantitatively study PF-DC only through experiments. An improved understanding of the PF-DC combined with theoretical methods is also needed.
Regarding the theoretical methods, explicit crack models (EMs) (Hendrickx and Flury, 2001; Khan et al., 2017; Xie et al., 2020), dual-porosity models (DPoMs) (van Genuchten, 1980; van Genuchten and Wierenga, 1976) and dual-permeability models (DPMs) (Aguilar-López et al., 2020; Gerke and van Genuchten, 1993b, a) were developed to simulate preferential flow in cracked clay soils. EMs were constructed based on the single-domain (or single-permeability) framework, which requires definition of the details involving the geometry, spatial distribution and hydrological properties of each crack. Such a requirement may be conceptually correct but makes it difficult to simulate network-distributed desiccation cracks due to considerable computational burden (Aguilar-López et al., 2020). The DPoM and DPM concepts belong to the dual-domain framework that assumes the soil pore system can be represented as two overlapping interacting regions, one which represents the matrix domain with micropores and the other one which represents the crack domain with mesopores–macropores (Šimùnek et al., 2003). Those models represent the cracks in the soil as an implicit form which need not prescribe geometrical and spatial features of the desiccation cracks. The DPoM concept holds the simplifying stipulation that water only flows through the shrinkage cracks rather than the soil matrix, which is unrealistic in many cases. To remedy this shortcoming, a classical DPM was developed, where the water flow in soil matrix and crack domain was simulated using the Richards' equation (Aguilar-López et al., 2020; Coppola et al., 2012; Gerke and Maximilian Köhne, 2004; Gerke and van Genuchten, 1993a) or Green–Ampt model (Davidson, 1984; Stewart, 2019; Weiler, 2005) building on Darcy's law. However, some critics emerged that the Richards' equation building on the capillarity, not existing in large PF paths (e.g., tensile cracks and biological holes), is not suitable to simulate the PF (Larsbo and Jarvis, 2003; Nimmo, 2010, Nimmo et al., 2021). Consequently, some improved DPMs were developed, where water flow in the crack domain was simulated by the Navier–Stokes equation (Germann and Karlen, 2016; Nimmo, 2010), kinematic wave equation (Greco, 2002; Larsbo and Jarvis, 2003) and Poiseuille model (Lepore et al., 2009). Although these improved DPMs better captured the characteristics of the water flow in the crack domain, the classical DPM concept has still been widely accepted and used in simulating preferential flow in soils due to its easily available parameters, reasonably satisfactory prediction to the measurements and high computation efficiency (Jarvis et al., 2016). Most importantly, a recent numerical study conducted by Aguilar-López et al. (2020) proved that effective parameter selection in the DPMs can achieve similar modeling results to the EMs.
Nevertheless, classical DPMs often adopt the assumption that crack volume and hydrological properties remain constant in both time and space, which is unfeasible to capture the full dynamics of PF-DC. Some attempts have been made to incorporate the dynamic nature of desiccation cracks into DPM including the SWAP family of models, i.e., LEACHM, which simulates PF-DC using a shrinkage characteristic and water loss (Kroes et al., 2000) but neglects the water exchange process occurring at the interface between two domains. Such a process has widely been confirmed to be significant in cracked soils (Greve et al., 2010; Krisnanto et al., 2016; Tuong et al., 1996). A later modification of SWAP incorporated the aforementioned process but at the cost of neglecting shrink–swell behavior of soil. The VIMAC model developed by Greco (2002) solved previous problems but against the cost of inducing many parameters which are difficult to determine from experiments or measurements. Coppola et al. (2012, 2015) took another step forward to allow crack volume and/or hydrological properties to vary as a function of soil shrinkage. However, the relationship proposed in the model, an empirical natural logarithm function involving the suction head and crack proportion, is not directly transferable to other types of soil. Stewart et al. (2016b) deduced a shrinking–swelling model, with relatively clear physical meaning and high consistency, and recently incorporated it into a Green–Ampt-based DPM (Stewart, 2018). While an analytical solution was obtained, the intrinsic limitation of the Green–Ampt approach (i.e., hypothesis of the wetting front and request for a constant boundary condition) hindered the further application of this model in complicated scenarios.
The objective of this research was to investigate the PF-DC from the experimental perspective in combination with an effective modeling approach. Hence, a soil column test was conducted to investigate the dynamic changes of desiccation cracks and hydrological response. The variation of crack geometry, including crack ratio, width and depth, was measured. The soil moisture content, matrix suction and water drainage were also monitored. Meanwhile, we developed a dynamic dual-permeability preferential flow model by incorporating the shrinking–swelling model proposed by Stewart et al. (2016b). The performance of the model was evaluated by comparing the simulated results with measured data.
2.1 Testing apparatus
To investigate the effects of dynamic changes of desiccation cracks on preferential flow, a soil column infiltration test was conducted under wetting–drying cycles (abbreviated as WD cycles hereafter). The testing apparatus consisted of a rainfall-evaporation system, an environment monitoring device, a plexiglass column, a HD camera, hydrological sensors and a drainage measurement device (Fig. 1).
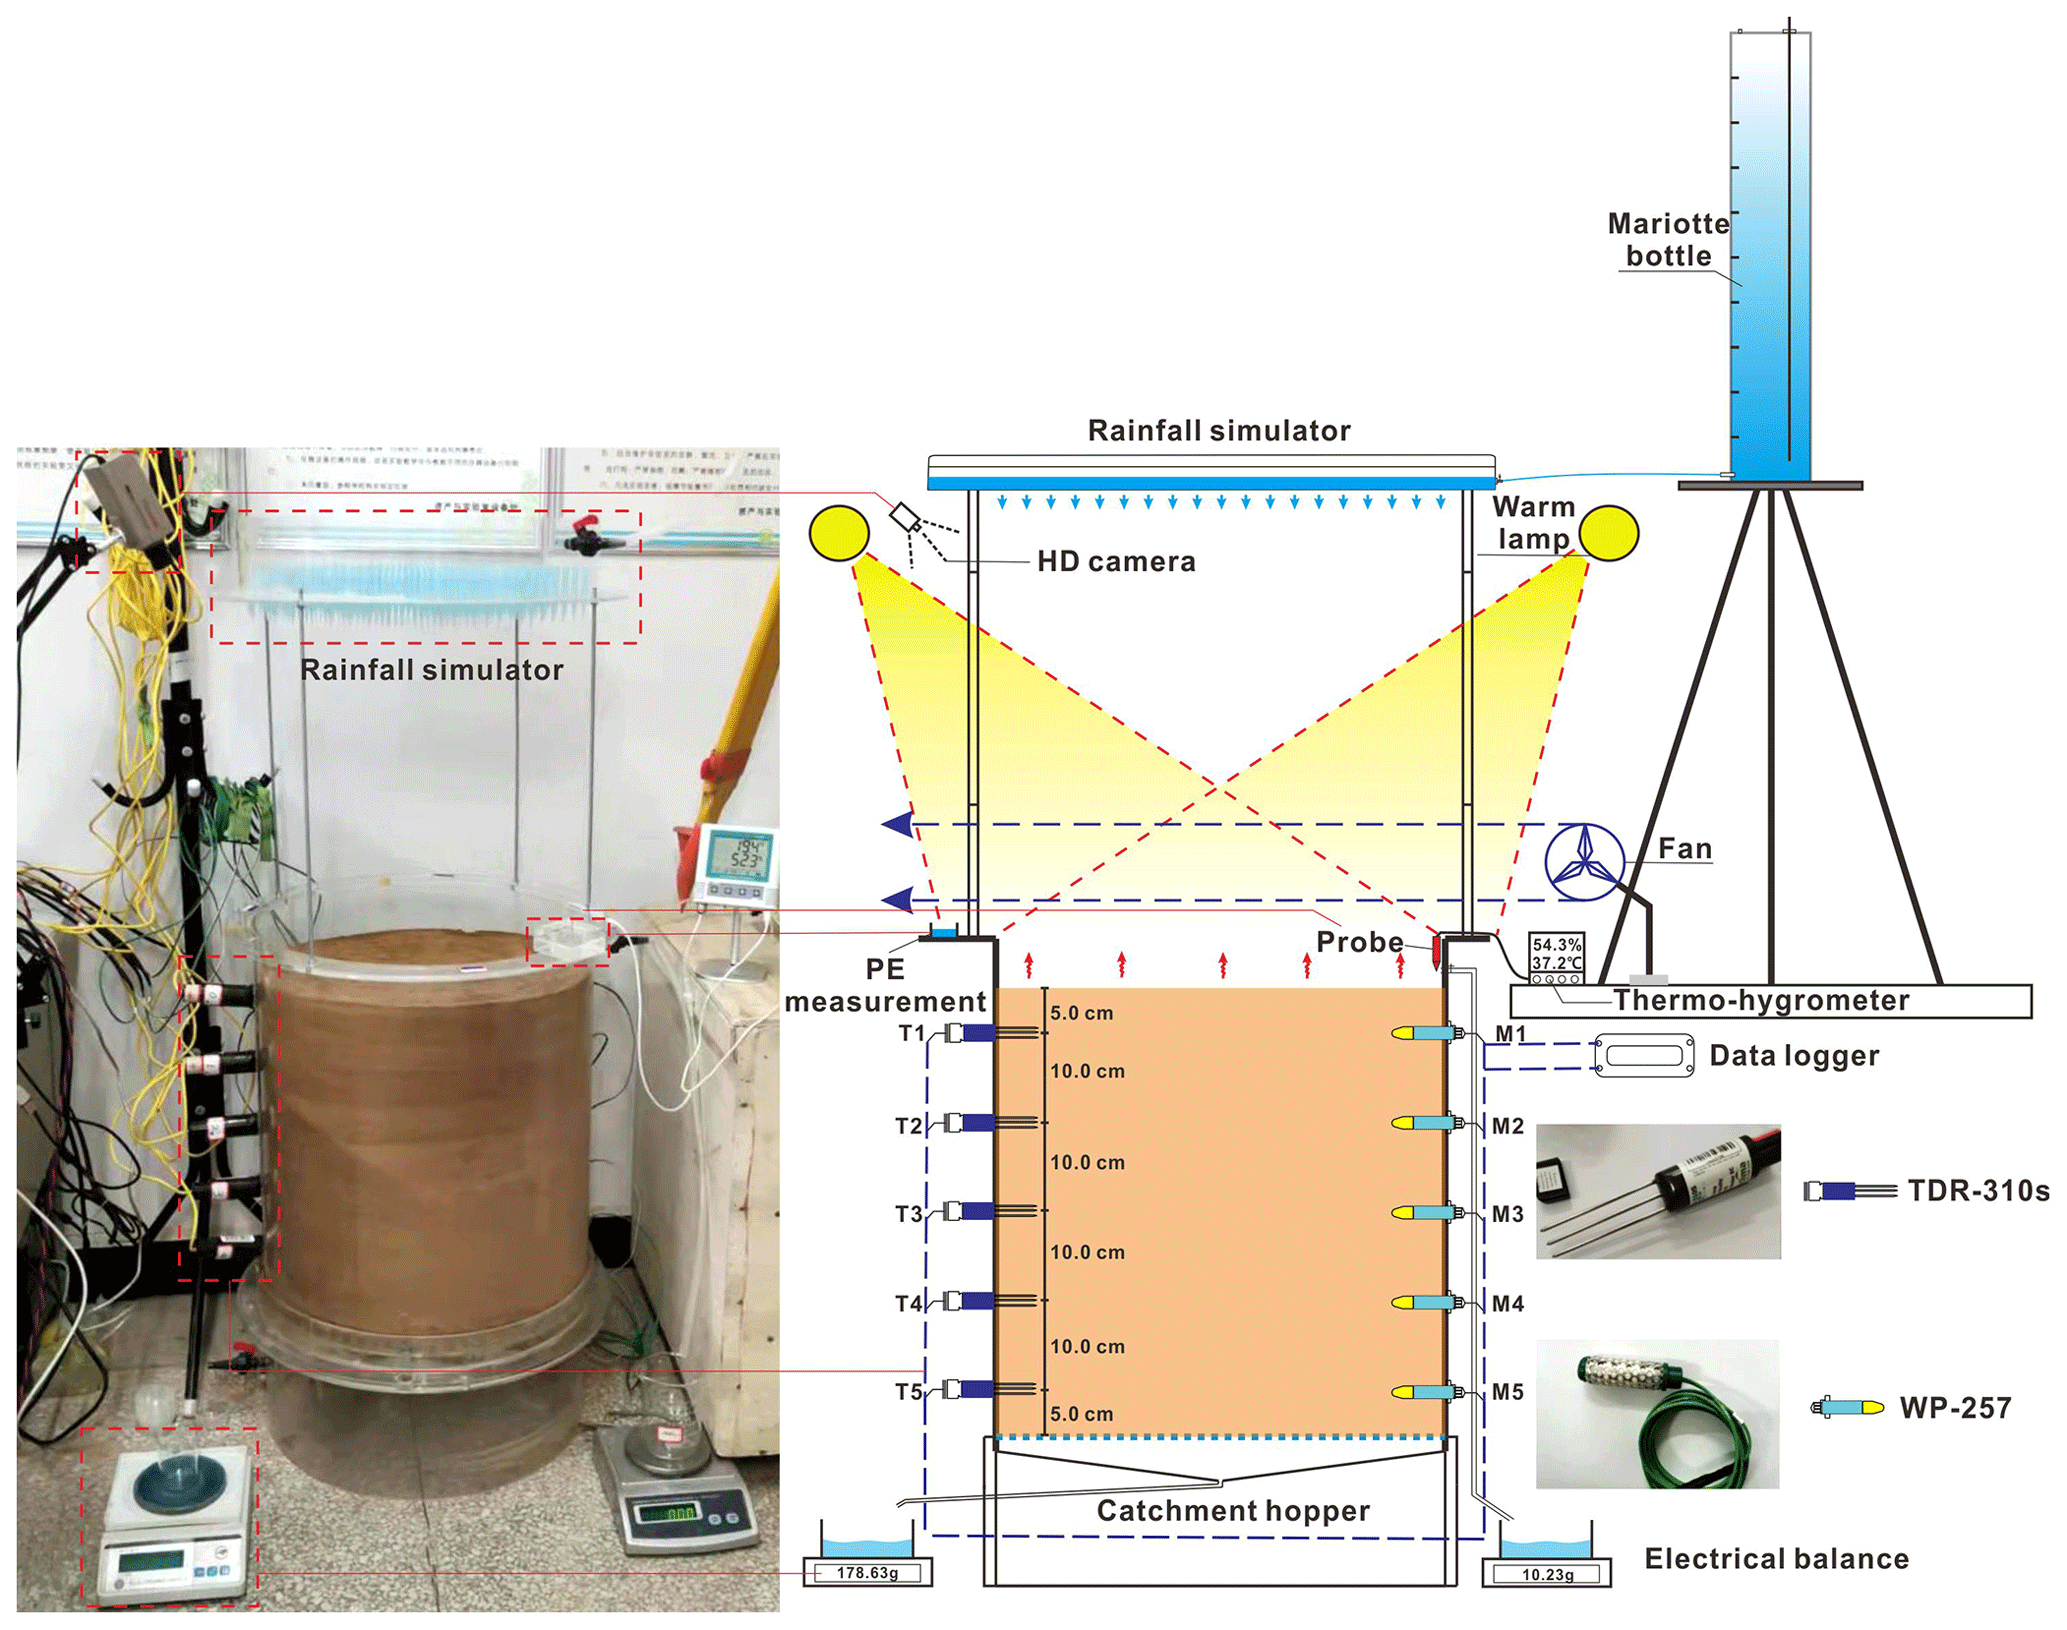
The rainfall-evaporation system included a rainfall simulator and two warm lamps as well as a small fan. The rainfall simulator was 0.5 m above the soil surface, which can produce rainfall with the intensity of 24–120 mm h−1. The warm lamps and a small fan were put near the soil surface to accelerate water evaporation. The environment monitoring device consisted of a thermo-hygrometer that connected a probe above the soil surface to detect the environmental temperature and humidity and a water container to measure the potential evaporation.
The plexiglass column was composed of a column (with a height of 60 cm and a diameter of 50 cm) placed on a catchment hopper which was used to collect and drain out water from the soil column.
The HD camera (TTQ-J2, constant focal length: 35 mm) was fixed on the slope above the soil surface to take photos at regular intervals during the drying periods.
Hydrological sensors, including five soil moisture content–temperature sensors (Acclima, TDR-310s, with a measurement moisture content range of 0 %–100 % and an accuracy of ±2 % and a temperature range of ∘C and an accuracy of ±0.2∘C) and five water potential sensors (Campbell, WP-257, with a measurement range of −200–0 kPa and an accuracy of ±0.5 kPa), were used to monitor the hydrological response during WD cycles. Five TDR-310s and five WP-257s were inserted into the soil column from the two opposite sides of the plexiglass column, respectively, with the same height spacing of 10 cm from top to bottom.
The drainage measurement device, including two electronic balances, was used to record the cumulative water drainage from the soil column.
2.2 Materials
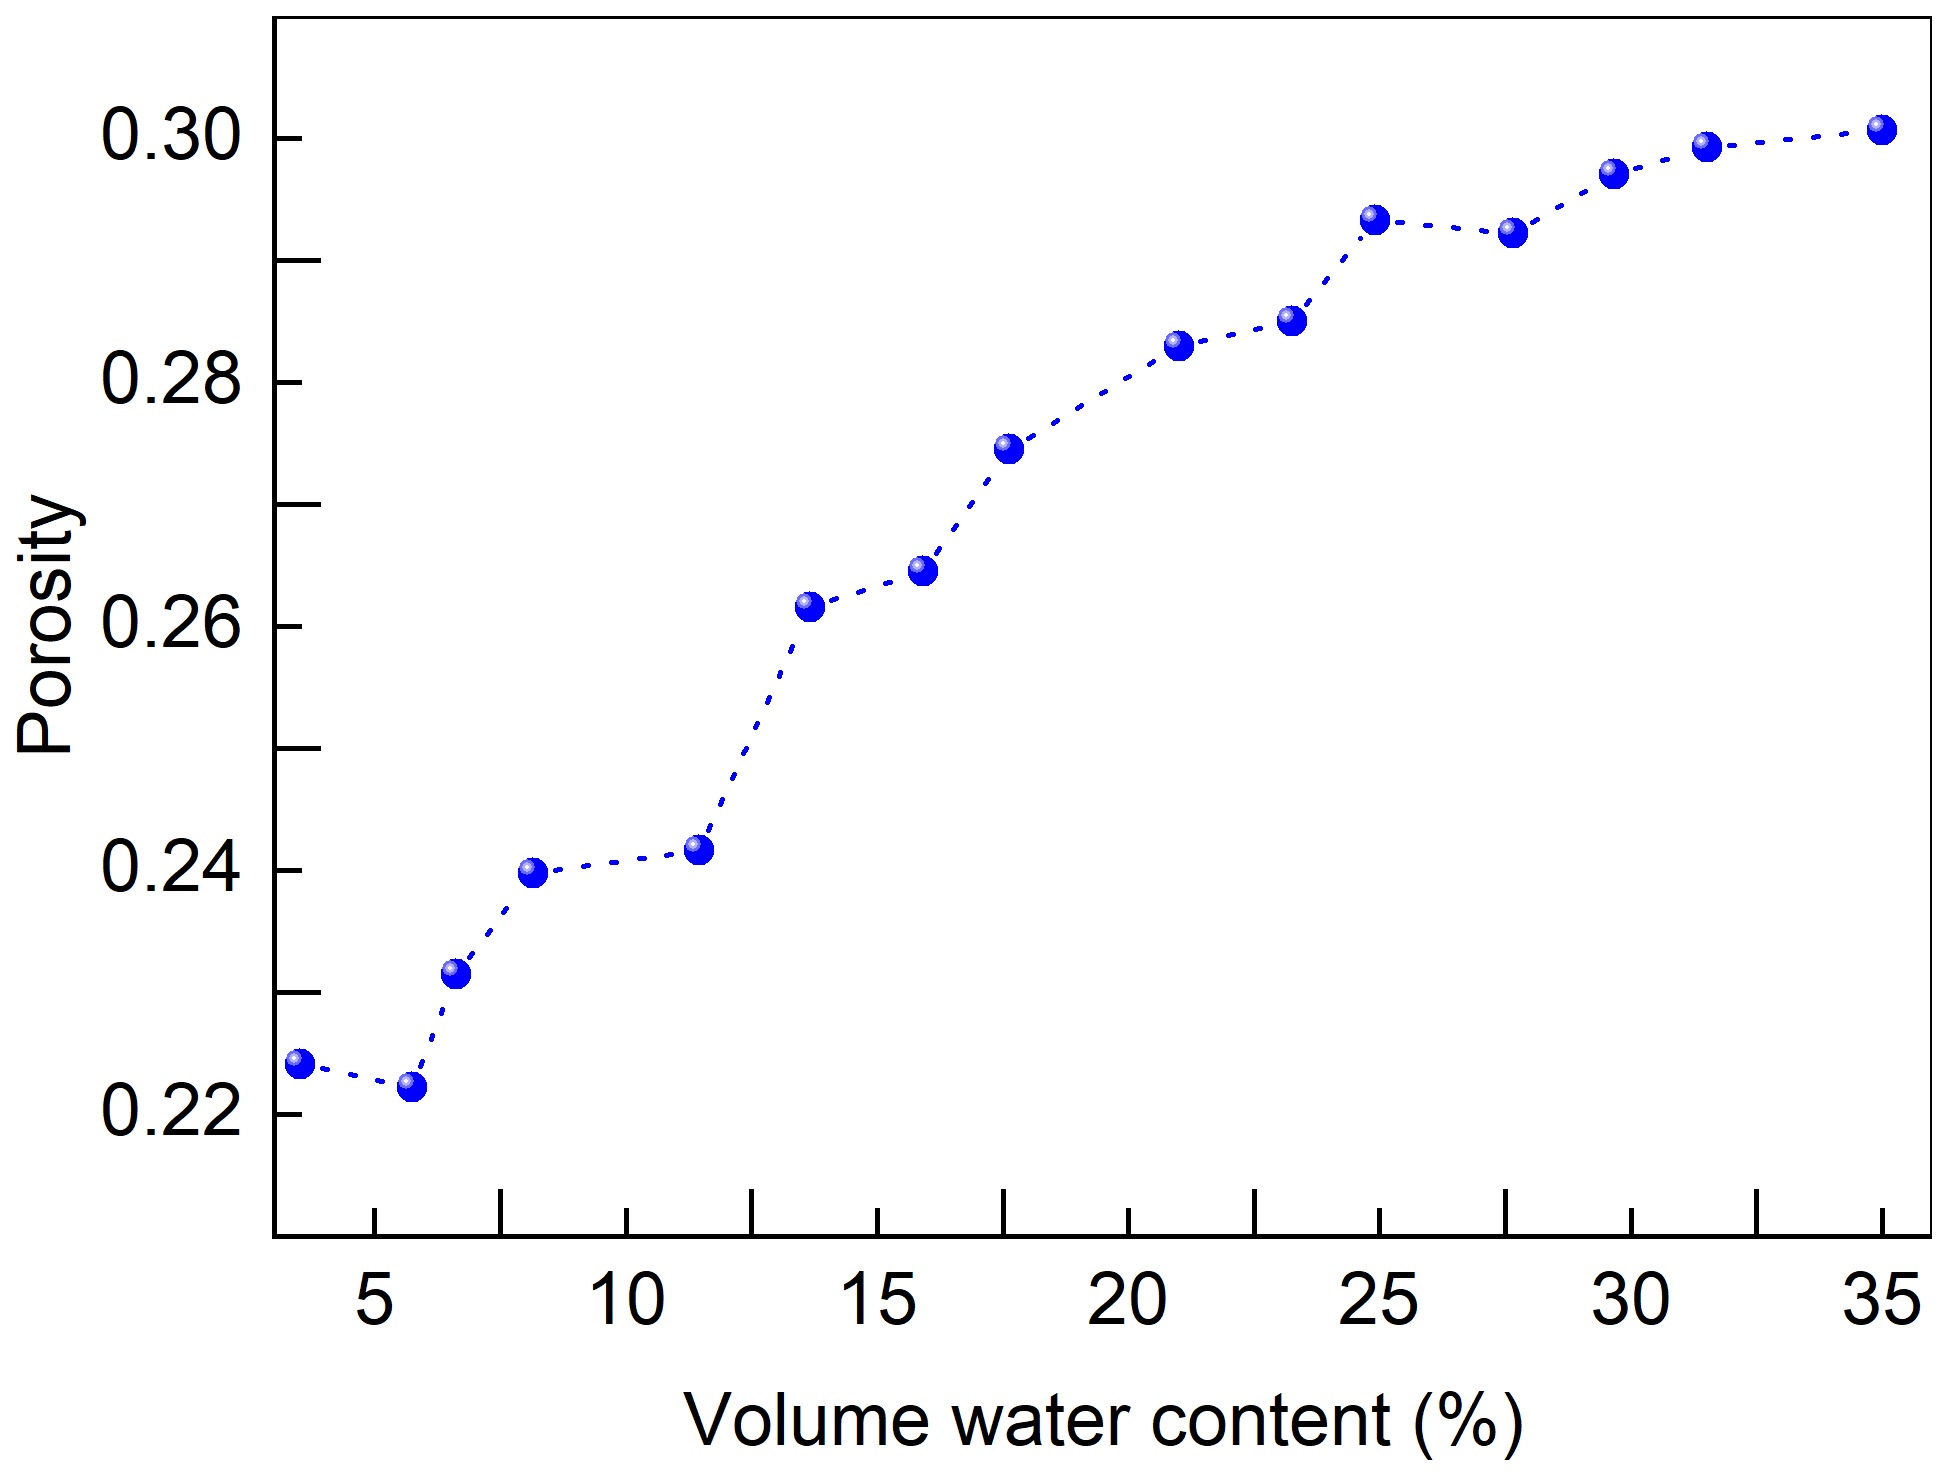
The soil used in the test was taken from Zongyang County, Anhui, China. Table 1 shows the basic physical parameters and main mineral composition of the soil samples. The soil found in this study is classified as weak expansive soil. The saturated hydraulic conductivity was measured on reconstituted soil cores with a dry density of 1.55 g cm−3 (the same as the soil column). In addition, the shrinkage curve of the saturated soil core was also obtained using a similar method proposed in Wen et al. (2021). The difference is that we measured the vertical deformation in regular time intervals instead of continuous monitoring. Figure 2 shows the variation of soil porosity with the volumetric water content.
Table 1Basic physical parameters of the soil sample.

Gs – specific gravity (–); ωopt – optimal moisture content (g g−1), which refers to the water content corresponding to the maximum dry density; ρd,max – the maximum dry density (g cm−3); Ll – liquid limit (%); Pl – plastic limit (%); δef – free swelling ratio (%); Cillite, Ckaolinite, Cquartz and Calbite – content of illite, kaolinite, quartz and albite, respectively (%); and Ks – saturated hydraulic conductivity (m s−1).
To ensure the homogeneity of the soil column, soil samples were compacted in 10 layers, and each layer was 5 cm thick. Prior to filling soil into the plexiglass column, the soil samples with the total weight required for each layer were prepared according to the designed density (dry density of 1.55 g cm−3) and gravimetric water content (10 %). Then, the soil samples were compacted in the plexiglass column using a rubber hammer. The soil column was constructed within 1 d. After that, the soil column was allowed to stand for 3 d to obtain stable records of the hydrological sensors.
2.3 Data collection
In the soil column test, the following data were collected:
-
Boundary conditions were collected, including rainfall intensity (r; mm h−1) and potential evaporation (PE; mm h−1) at a 1 h time interval and temperature (T; ∘C) and relative humidity (RH; %) at a 5 min time interval.
-
Hydrological data, including volume water content (θexp; %) and soil matrix suction (Sexp; kPa), as well as cumulative drainage from the top (Dtop; g) and bottom (Dbottom; g) of the soil column, were collected at different depths at a 5 min time interval.
-
Crack geometric data, including the crack ratio (wc,exp), the crack aperture (wj,exp) and the maximum crack depth (dmax; mm), were collected. The wc,exp and wj,exp were obtained via processing of the crack photos, which were taken at 20 min intervals during drying periods. The image processing method mainly includes two steps as shown in Fig. 3. The dmax was measured by thin wire before each rainfall event.
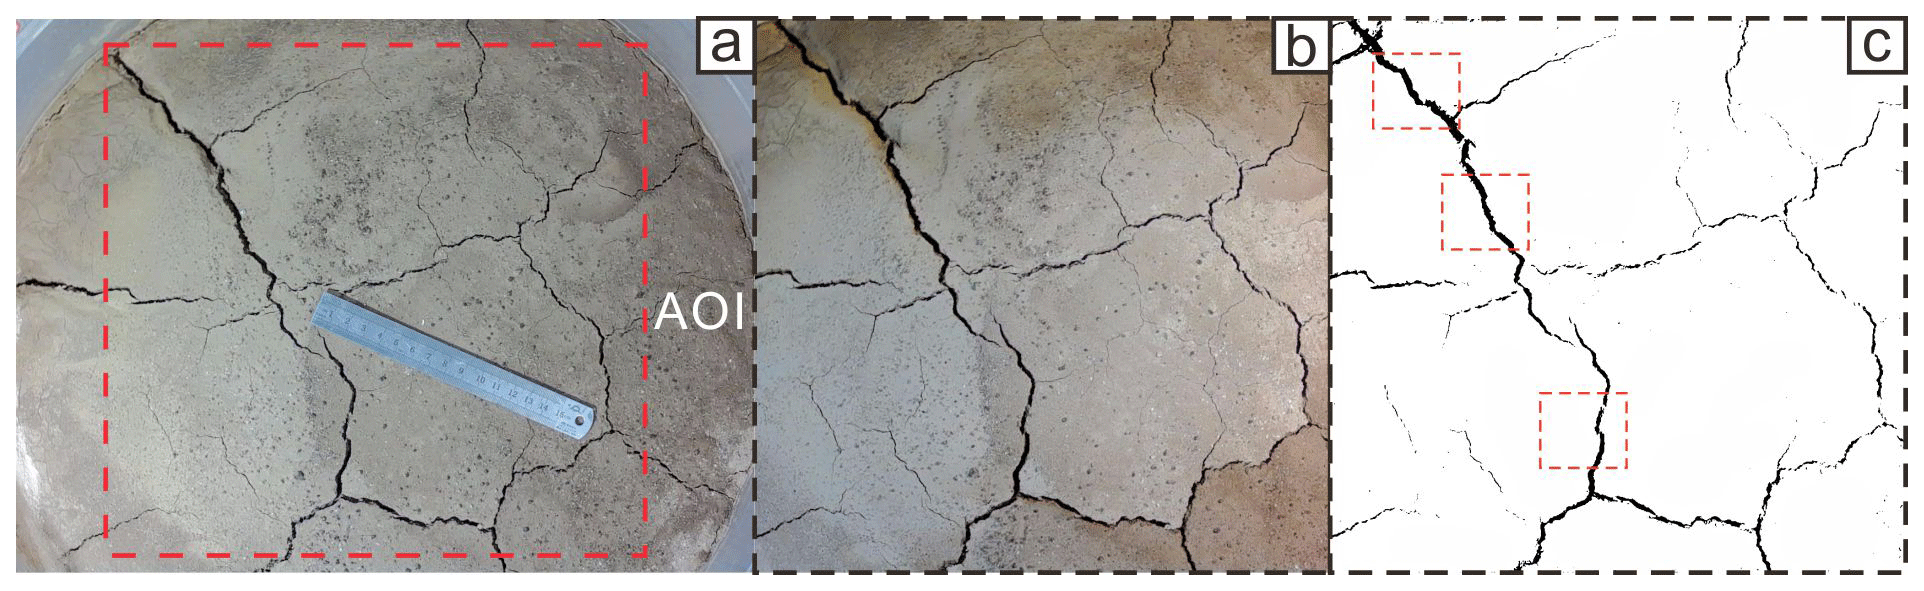
Figure 3Process of crack image processing. (a) A photo obtained from the HD camera, 800 pixels × 1400 pixels. (b) A crack image after cropping and pixel enhancement, 1044 pixels × 1005 pixels. (c) A crack image after binarization and denoising; the crack ratio was calculated as the crack area divided by the overall area of interest, and the crack aperture was calculated as the average value of crack aperture from three different positions.
2.4 Test procedure
The overall experimental process included two stages of WD cycles. The purpose of the first stage was to generate a relatively stable surface pattern of the desiccation cracks. The first stage was from 5 January 2022 at 15:00 to 28 February 2022 at 09:00 and included 13 WD cycles.
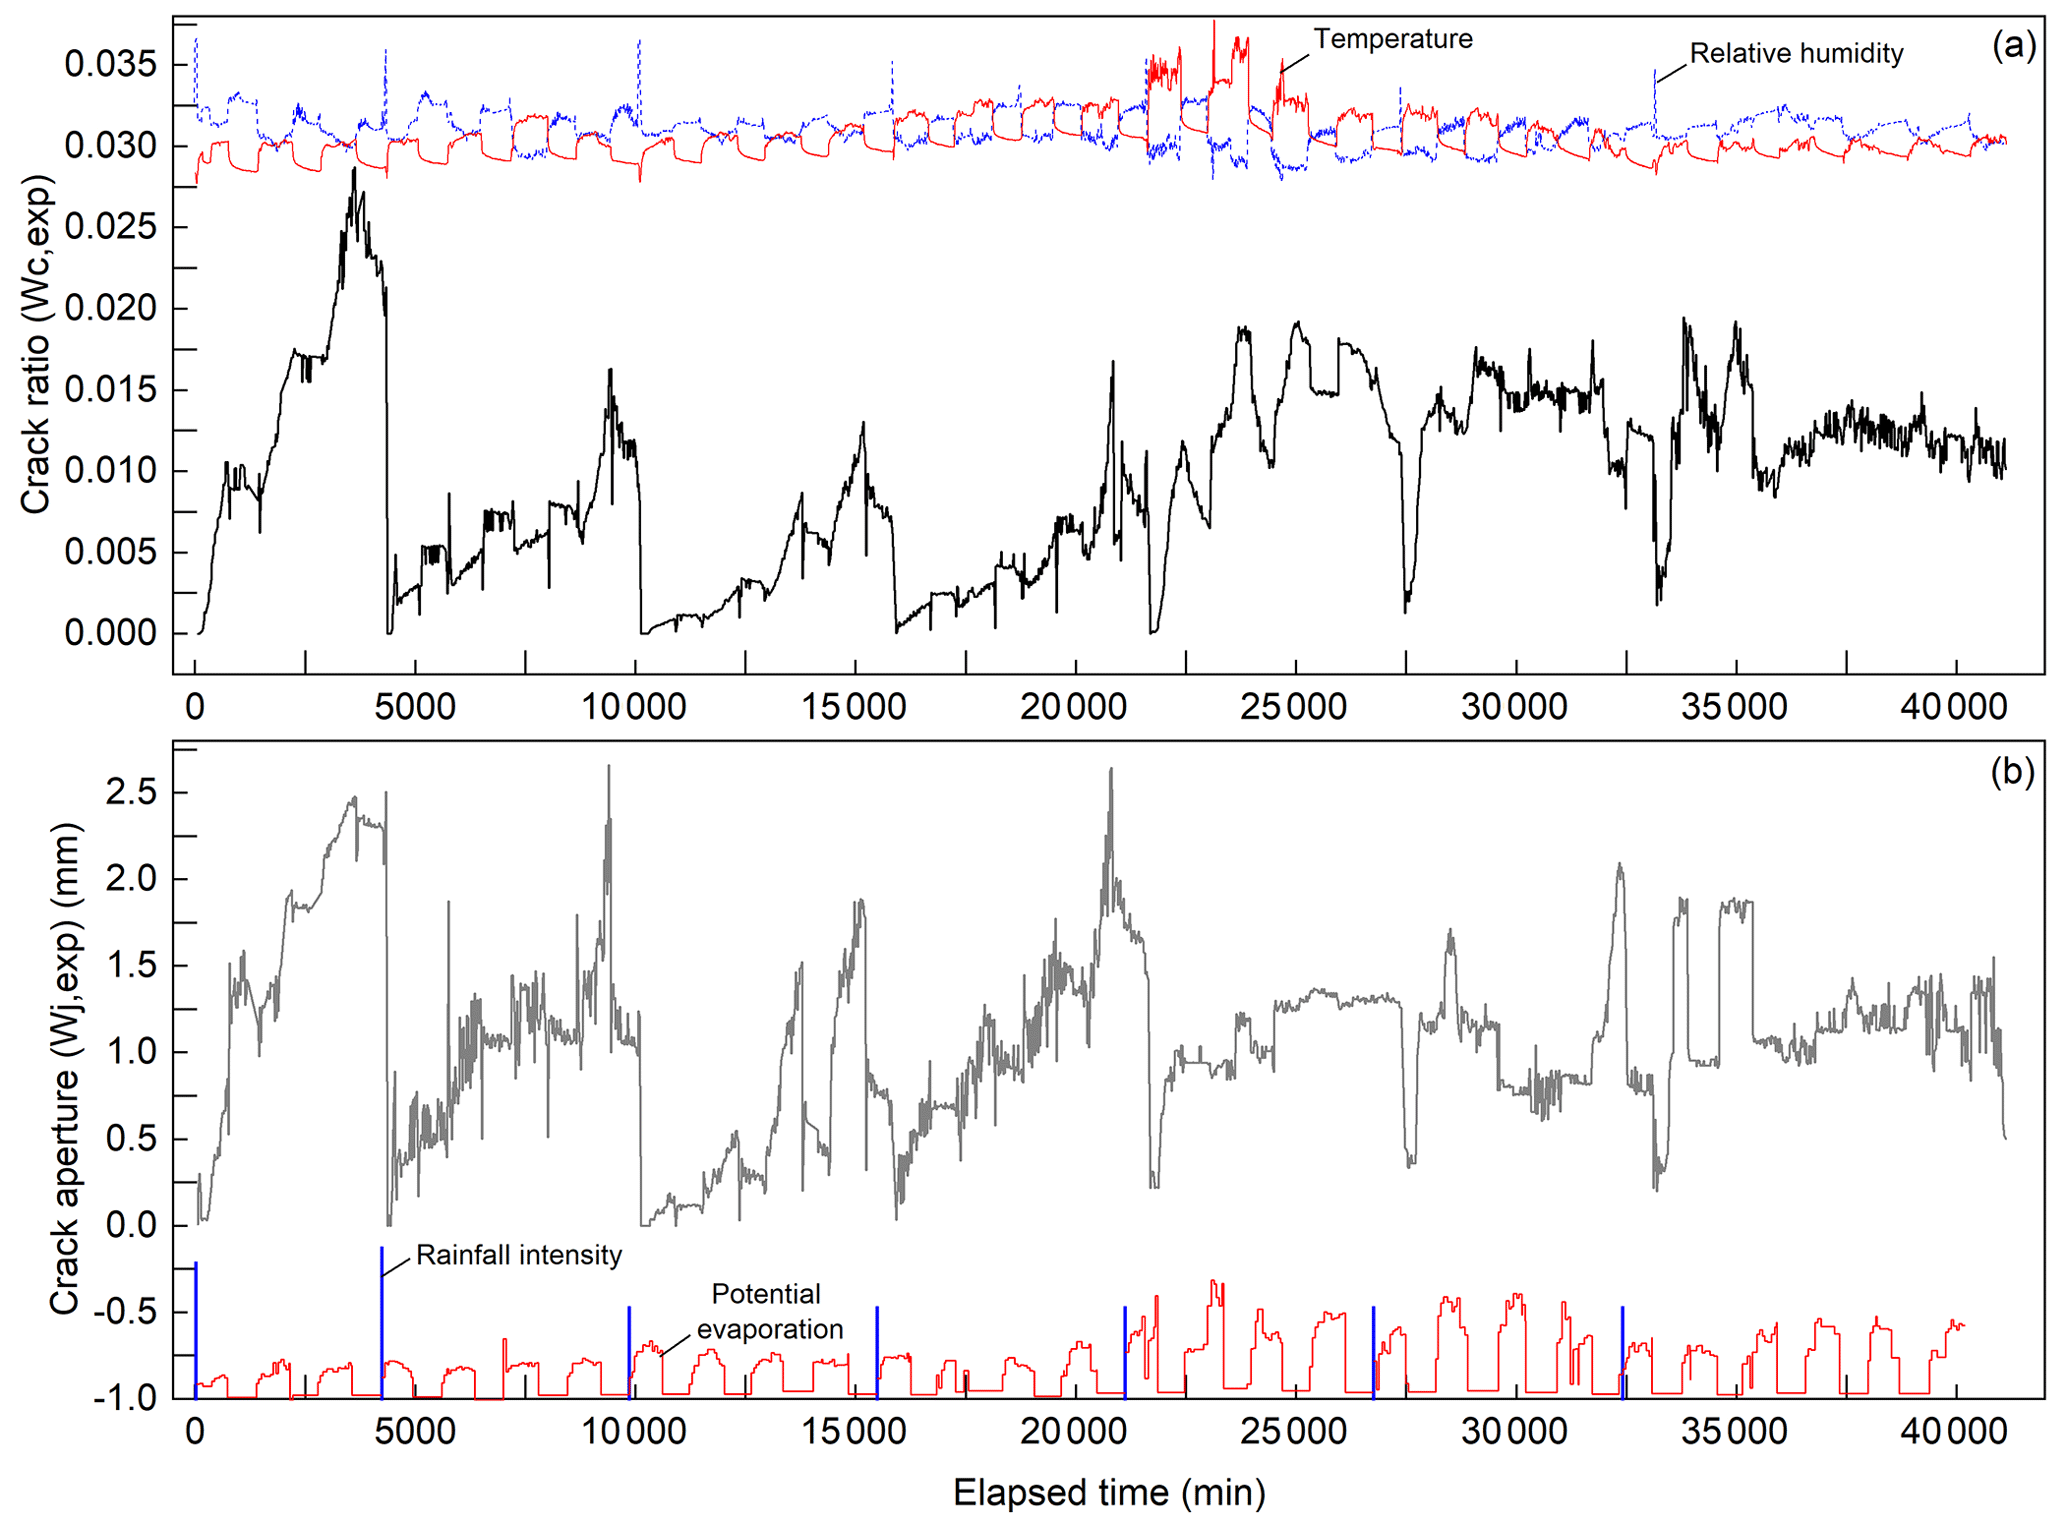
The second stage was from 28 February 2022 at 09:00 to 28 March 2022 at 22:30 and included seven WD cycles. Figure 4 presents the variation of rainfall, evaporation, temperature and relative humidity in the entire experiment process. Because the two warm lamps and fan were closed during the night, two kinds of evaporation intensity can be observed during the drying periods. In addition, the average environment temperature in the fifth WD cycle was higher because we turned up the power of the two warm lamps. In this current study, we mainly focus on the second stage of WD cycles.
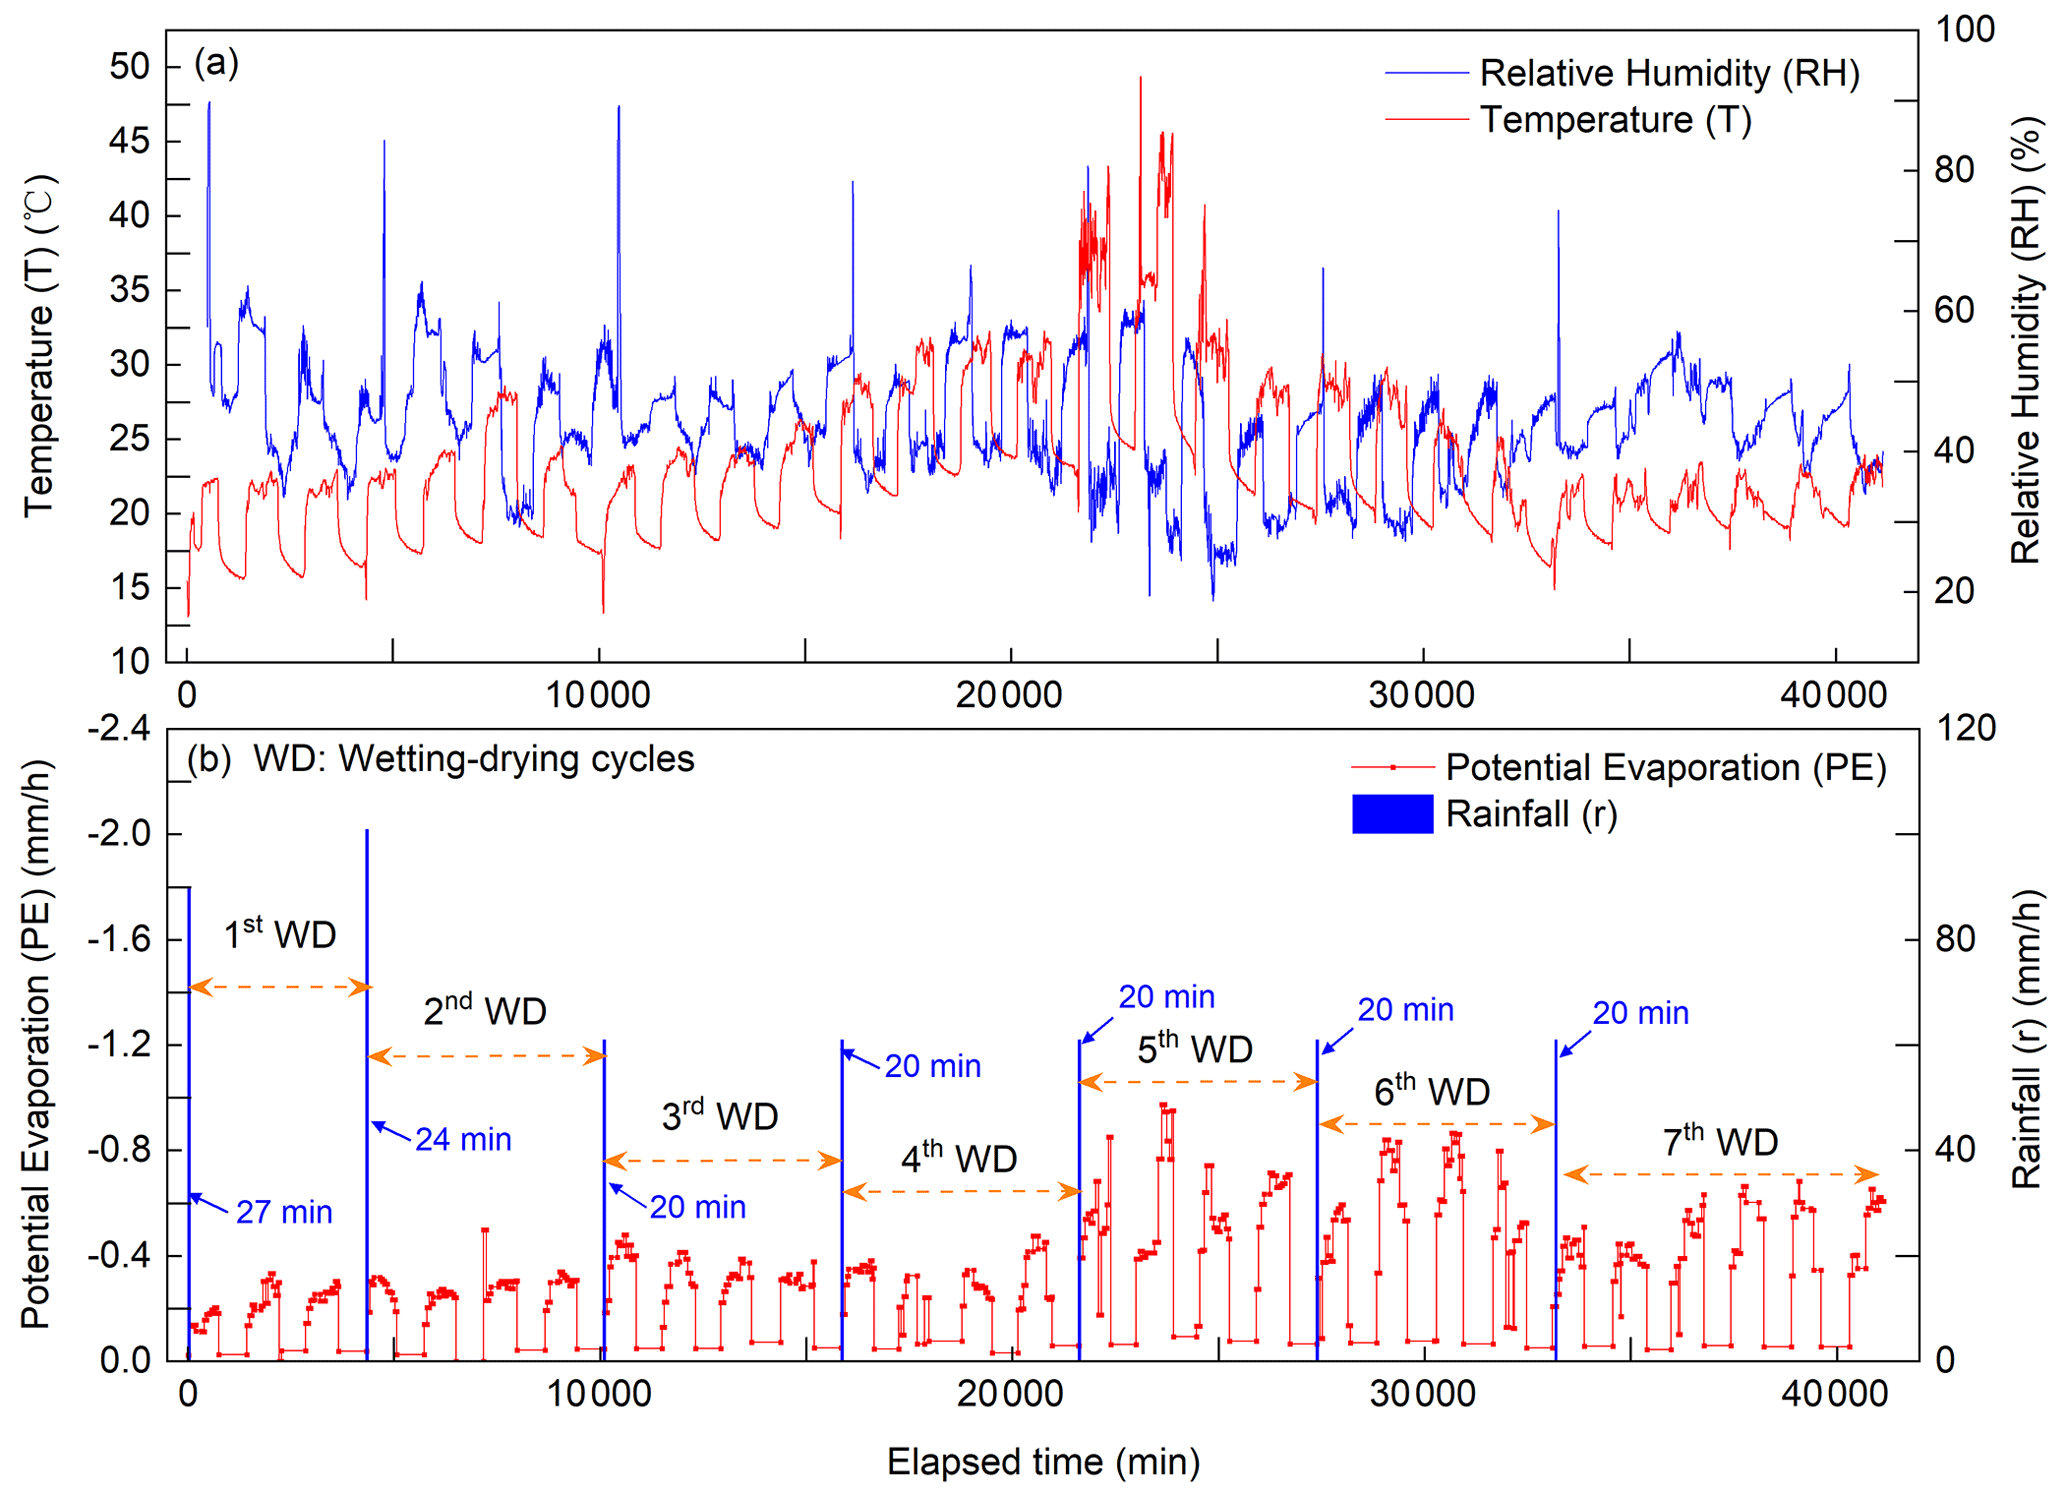
Figure 4Environmental conditions of the experiment. (a) Time series of temperature and relative humidity. (b) Rainfall intensity and potential evaporation.
3.1 Dual-permeability model (DPM)
The DPM concept used in this study corresponds to the one developed by Gerke and van Genuchten (1993a). The model divides the flow domain into two overlapping and interacting continua according to the volumetric ratios of each domain, where two coupled 2-D Richards' equations are used to describe the matrix flow and preferential flow as
where the subscripts “c” and “m” indicate the crack and matrix domains, respectively; h (m) is the pressure head; C represents the specific water capacity, (1 m−1); θ (–) is the volumetric water content; K (m s−1) is the isotropic hydraulic conductivity; z (m) is the elevation head; w (–) is the volumetric ratio of the crack domain or matrix domain over the bulk soil volume; Γw is the water exchange term (1 s−1) between the two domains; αw (1 m−2) is the effective water transfer coefficient; and Ka (m s−1) is the interface hydraulic conductivity.
The hydraulic properties of the two domains are parameterized based on the Mualem–van Genuchten soil water retention curves (SWRCs) (Mualem, 1976; van Genuchten, 1980) as
where Se (–) is the effective saturation; θs (–) and θr (–) are the saturated and residual volumetric water content, respectively; α (1 m−1), n (–) and m (–) are fitting parameters; Ks (m s−1) is the saturated hydraulic conductivity; and Kr (–) is the relative hydraulic conductivity.
According to Gerke and van Genuchten (1993a), the total porosity ε (–), total volume water content θ (–), total hydraulic conductivity K (m s−1) and total volumetric flux (m s−1) in terms of the volume ratio of each domain can be expressed as
Note that the total porosity ε is defined as the total pore volume (Vp) divided by total soil volume (V), while εm (or εc) is defined as the pore volume in the matrix (Vp,m) (or crack, Vp,c) domain divided by the volume of that domain (Vm or Vc). The total volume water content has the same definition.
In the case of a DPM, a specified flux i is divided between the matrix and crack domains as
where ic and im are the effective boundary fluxes into each domain (m s−1).
Considering a rainfall condition, the effective boundary fluxes of the two domains are initially equal to rainfall intensity (r) due to the infiltration capacity of each domain being larger than r (Dusek et al., 2008), and therefore the boundary fluxes of each domain can be written as
As the soil keeps wetting, the decrease of the pressure head gradient may firstly lead to the infiltration capacity of the matrix domain dropping to a value less than r. Then, ponding occurs on the surface of the soil matrix, and the boundary condition changes to a specified pressure head boundary. This transformation can be achieved in COMSOL, a multiphysics solver and simulation software package building on the finite element method, using a combined type of boundary (Dirichlet and Neumann) proposed by Chui and Freyberg (2009). Once ponding occurs on the matrix domain, the surplus water from that domain infiltrates into the crack domain, and its effective flux increases to
When the retained water volume in the cracks exceeds its storage capacity, water will pond on the surface of the crack domain.
Considering an evaporation condition, the Wilson–Fredlund–Barbour–Penman experimental function model (Wilson et al., 1997) was used to calculate the actual evaporation of each domain:
where AE is the actual evaporation; PE is the potential evaporation measured in the experiment; S (kPa) is total matric suction at the soil surface; g (m s−2) is the gravitational acceleration constant; ωv is molecular mass of water, 0.018 kg mol−1; ξ is a dimensional empirical parameter with a suggested value of 0.7; ha is relative humidity of overlying air; γw is unit mass of water, 9.807 kN m−3; R is the universal gas constant, 8.314 J (mol K)−1; and Ts (∘C) is the soil surface temperature.
3.2 Dynamic dual-permeability model (DPMDy)
3.2.1 Porosity description
In Stewart et al. (2016a, b) and Stewart (2018), the total porosity (ϕmax) of a cracked soil was divided into three domains: aggregates (or soil matrix), cracks (voids from horizontal deformation induced by desiccation cracks) and subsidence (voids from vertical deformation induced by desiccation cracks). In Stewart et al. (2016a), the distributions of these domains change as a function of a unified water content, U:
where the subscripts “matrix”, “crack” and “sub” refer to the aforementioned three domains. In this study, we assume that the horizontal deformation dominates the formation of desiccation cracks; thus ϕsub(U) can be neglected.
Stewart et al. (2016a) then deduced the porosities of each domain as
where p and q are functional shape parameters; ϕmax is the maximum porosity of a soil core prior to shrinkage and thus also represents the total porosity; ϕmin is the minimum porosity of the matrix domain; and U is a unified water content (defined as water content u divided by its saturated value umax), which can be approximately estimated to be the saturation degree (Se,m) in an SWRC function of the soil matrix (Stewart et al., 2016a). Indeed, Eq. (16) represents a shrinkage curve function in which four parameters can be obtained through a shrinkage test.
Substituting Se,m as U and incorporating Eq. (5) into Eqs. (16) and (17), we can obtain the porosity of the two domains as a function of pressure head h:
With these porosity equations in mind, we can rewrite Eqs. (4) and (7) as
Because the crack domain is mainly composed of voids, we assume here that Vp,c is equal to Vc, and thus εc=1. Through this assumption, we obtained a physically consistent definition of how the porosity and crack volume vary as functions of saturation degree as follows:
3.2.2 Water content and hydraulic conductivity
In terms of Eq. (8), the total water content of the soil volume can be expressed as
Regarding the hydraulic conductivity of each domain, the classical DPM often assumed it to be equal to the product of a fixed Ks and the relative hydraulic conductivity Kr of the corresponding domain. In the DPMDy, the van Genuchten–Mualem equation is adopted in the matrix domain, while in the cracks, where capillarity has little effect on water flow, we set Kr=1. Hence, the following equations are obtained:
where Kc,s and Km,s refer to the saturated hydraulic conductivity in crack and matrix domains, respectively.
However, the Kc,s and Km,s are transient variables that change with the crack geometries in the crack domain and porosity in the matrix domain, which should be taken into consideration in a shrinking–swelling soil. To solve this issue, Stewart et al. (2016b) further deduced models that describe the relationships between Km,s, Kc,s and Se,m.
where is the maximum saturated hydraulic conductivity of the crack domain (at 0) when the crack aperture achieves the maximum value, and is the maximum saturated hydraulic conductivity of the matrix domain (at 1) when the radius of cylindrical pores in that domain achieves the maximum value (see Eqs. 25 and 27 in Stewart et al., 2016b). The assumption 1 means that the magnitude of Kc only depends on the crack area or the saturated degree of the soil matrix domain.
Incorporating Eqs. (26) and (27) into Eq. (9) obtains
Note that can be obtained by a laboratory-based infiltration test through a saturated soil core prior to shrinkage. Then, Eq. (29) can be used to fit the through the overall saturated hydraulic conductivity (measured Ks) under different crack volume or ratio. Alternatively, can also be approximately calculated as
where stands for the maximum crack aperture measured in the experiment (m), g is the gravity acceleration constant (m s−2) and v is the water kinematic viscosity (m2 s−1). This equation is a relation to the cubes of the aperture of a crack with respect to the crack inner flux, which is based on the derivation of laminar flow between parallel plates for Hagen–Poiseuille type of flow (Snow, 1965).
Eventually, we can simulate the hydrological process considering the dynamic changes of desiccation cracks by incorporating Eqs. (19), (21), (26), (27) and (28) into the DPM.
4.1 Crack dynamic changes
Figure 5 presents typical images of crack evolution during each WD cycle. Intuitively, it seems that the crack area and width did not show an obvious increasing trend with the WD cycles as expected. Conversely, during the first to fourth WD cycles, the cracks at the same moment after rainfall (Fig. 5b2–4) and the final state (Fig. 5c2–4) decreased significantly, even though the environmental temperature (T) and the potential evaporation (PE) increased in these periods. The cracks increased significantly from the fifth WD cycle on, but most of them were finer than before. Overall, cracks in the first WD cycle are wider than those formed in other cycles.
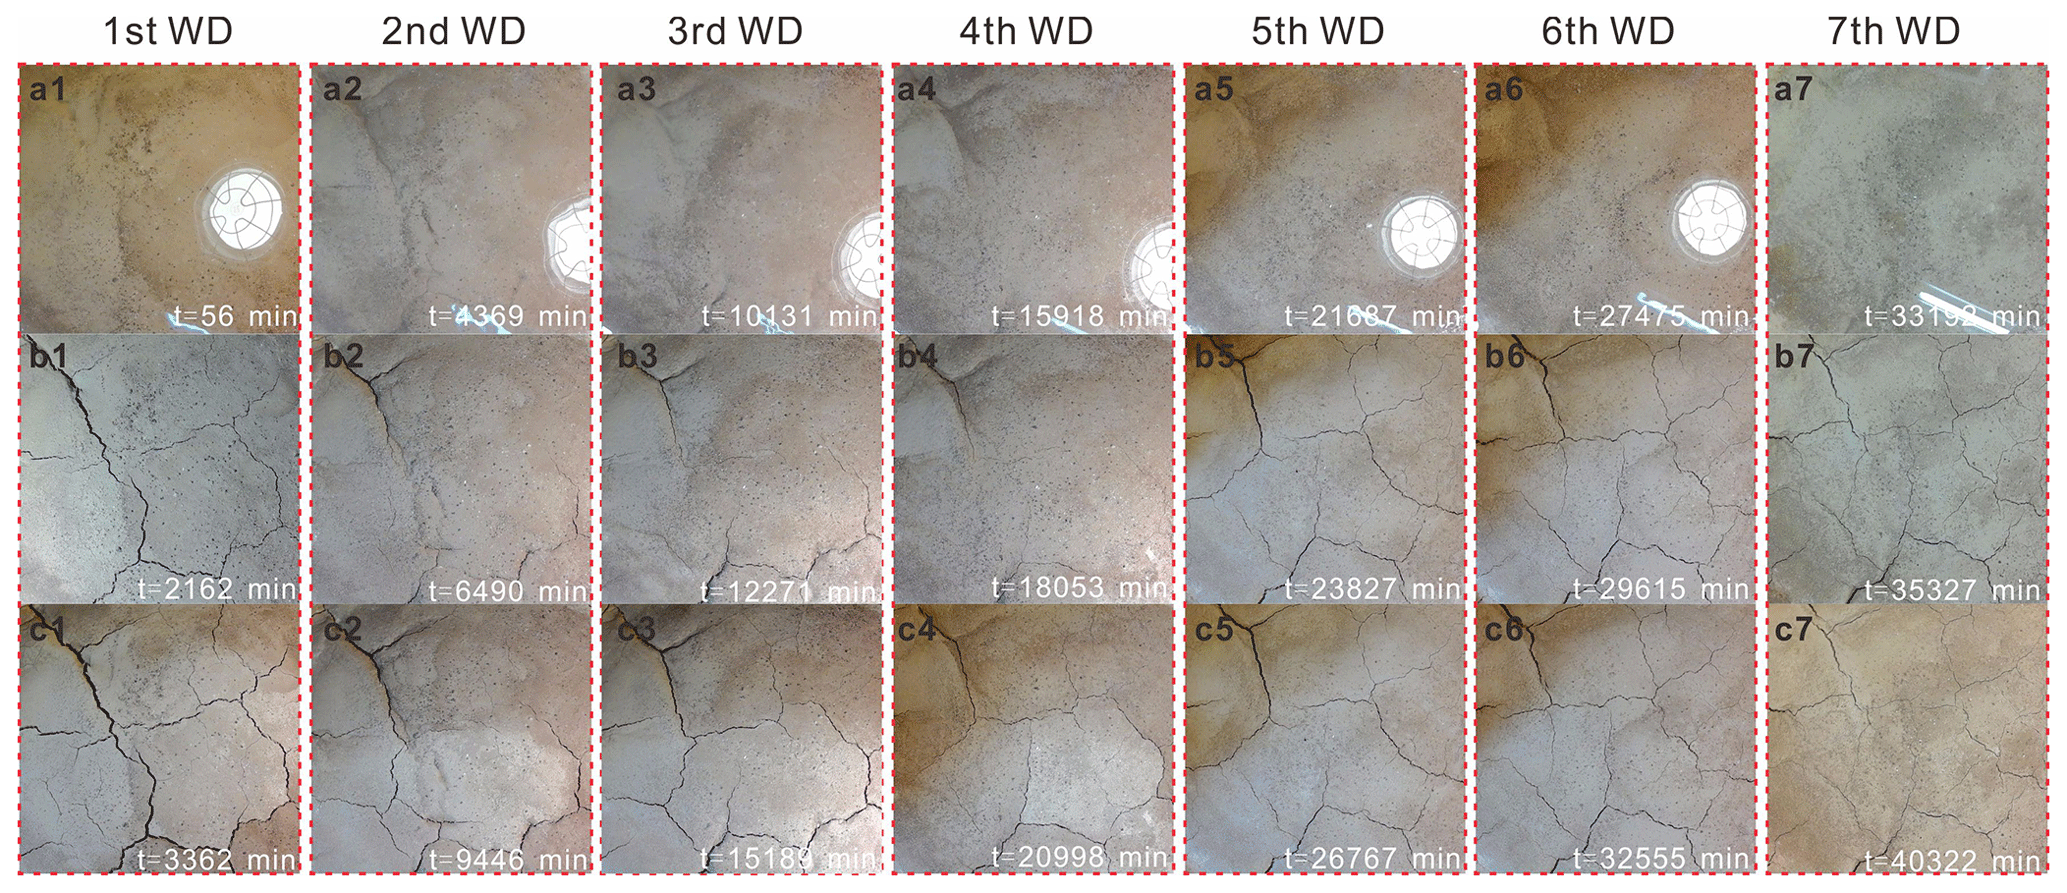
Figure 5Typical images of crack evolution in seven wetting–drying cycles. (a1–7) Water ponds on the soil surface after rainfall, (b1–7) crack images at the 2135th min after each rainfall event and (c1–7) crack images at the end of the final high-evaporation period during each wetting–drying cycle.
Figure 6 quantitatively shows the variation of crack ratio (wc,exp) and crack aperture (wj,exp) in the experiment. Overall, the variation curves corresponded to the intuitive descriptions mentioned above. In particular, an unexpected result was that the T and PE in the fifth and sixth WD cycles were higher than in previous cycles, but their maximum wc,exp and wj,exp became smaller. During a single WD cycle, the wc,exp and wj,exp have a similar trend, which shows a dramatic decrease during rainfall, rapid increase in high-evaporation periods, and slow increase or even decrease in low-evaporation periods. More specifically, during the rainfall periods, the crack closure process was not significant until the water ponded on the soil matrix, then ponded water flowed into the cracks, leading to acceleration of the crack closure. Note that cracks were not completely closed, even when they were full of water (Fig. 5a1–7). The minimum crack ratio under such conditions is approximately 0.1 %. In the evaporation periods, the maximum crack ratio reaches 2.87 %, and the maximum crack aperture reaches 2.6 mm. In addition, Fig. 7 shows the maximum crack depth (dmax) measured after each cycle. It can be seen that dmax increased substantially after the first WD cycle and then slightly increased in the last six cycles, with a maximum value of 23.8 cm.

4.2 Hydrological response
Table 2 presents the manually recorded results of external hydrological responses involving ponding and drainage during each WD cycle. It can be seen that the ponding occurred on the soil surface within 5 min after each rainfall event. The ponding duration in each rainfall event mainly decreased with WD cycles. Note that the ponding depth in each rainfall event was below the upper drainage outlet. Regarding the water drainage, approximately 1.4 kg of water (the total water mass was 8 kg) was leaked during the first rainfall event due to the interspace between the soil and the plexiglass column and the hydrological sensors. Then, we sealed the interspace using clay powder and polyurethane cement (soft materials without constraining effects on the soil swelling) after each drying process, and subsequently, no water drainage was observed at the bottom outlet.
Table 2Manual readings of external hydrological responses.
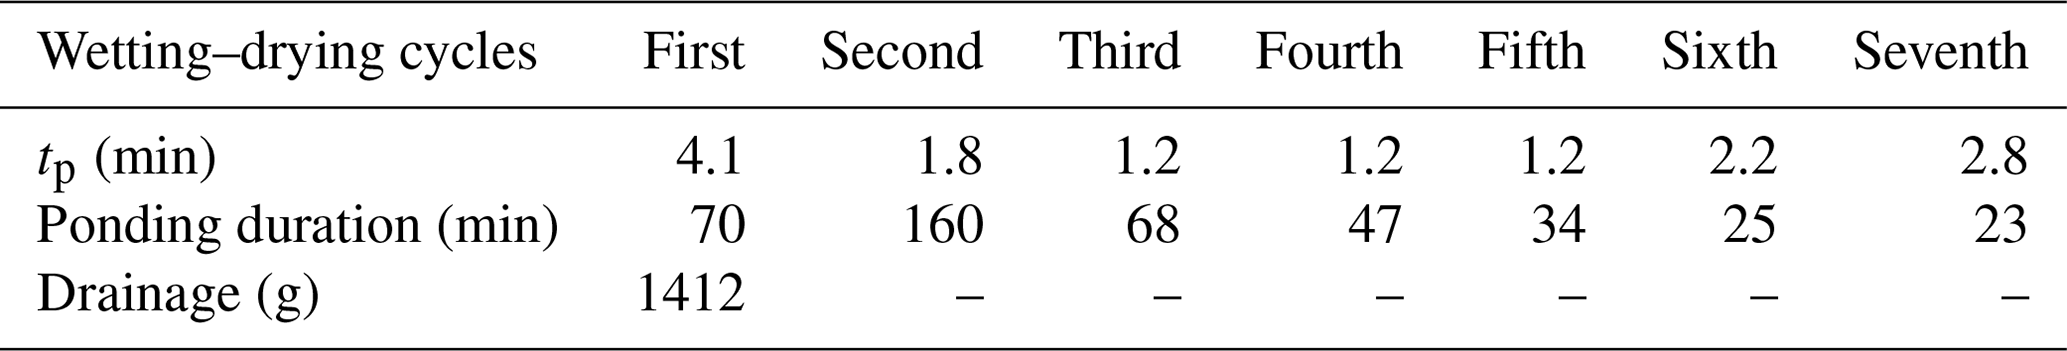
tp (min) – beginning of ponding after each rainfall event.
Figure 8 shows the internal hydrological responses recorded by the soil moisture and water potential sensors. Because the M2 and M4 were damaged during soil compaction, no matric suction data were obtained at their depths. Overall, water content at all depths increased during rainfall and decreased during evaporation, where T1 showed the most sensitive responses to the WD cycles. During rainfall, the time for water content to respond to each rainfall event increased with depth, but the time difference among all depths decreased significantly from the second WD cycle on. During the drying periods, an interesting phenomenon was that the water content at 5 cm depth showed an overall decline trend, but transient increases of water content frequently appeared during low-evaporation periods. Such transient increases seem to be related to the slow decrease of crack ratio as mentioned in Sect. 4.1. Regarding the matric suction, its variation trend was similar to the water content but showed more delayed responses to the environmental conditions, especially in the last three WD cycles. Additionally, Fig. 8b also implies that soil at 5 cm depth reached saturation during each rainfall event, while soil below the 25 cm depth was in the unsaturated state in the whole experiment process.

5.1 Setup of numerical model
The single-domain model (SDM), dual-permeability model (DPM) and dynamic DPM (DPMDy) were implemented in a finite element solver for Richards' equation as part of the COMSOL Multiphysics® software (COMSOL 5.6). As shown in Fig. 9, they have the same 2-D size, boundary conditions, mesh structure and initial condition. The model domain is 0.5 m by 0.5 m, the same as the soil column. Because the measured maximum crack depth was 23.8 cm, we specified the crack domain existing within the upper 25 cm depth of the soil column.
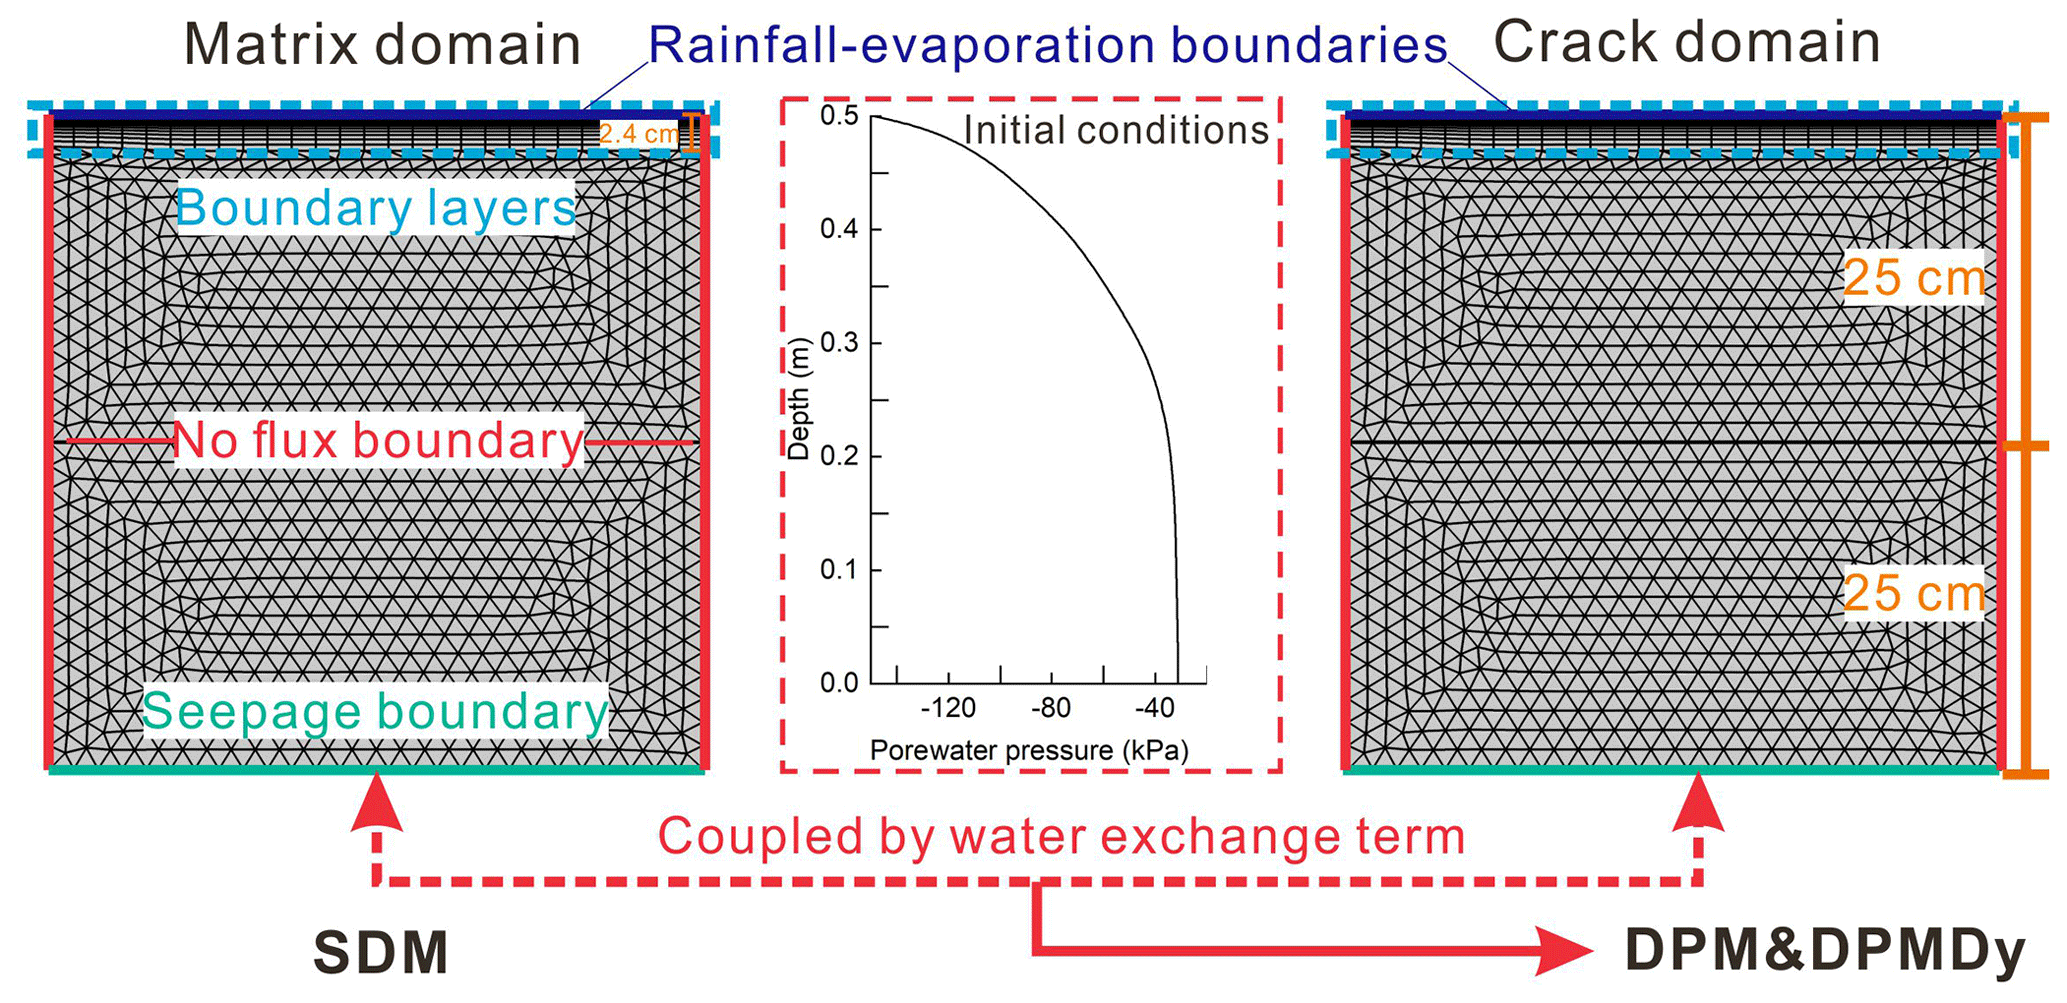
The boundary conditions at the top were set as a combined type of boundary conditions (as mentioned in Sect. 3.1) for representing the rainfall, ponding and evaporation process recorded in the experiment; the bottom side is a seepage boundary condition; and the left and right sides of the model are no-flux boundaries.
Because the pressure head in the surface area may change frequently and drastically during WD cycles, a refined mesh structure with dense boundary layers was used to capture the transient hydrological conditions. The boundary layers included 15 layers of rectangular grid, with a minimum and maximum thickness of approximately 0.04 and 0.3 cm, respectively. A coarser free-triangle mesh (average length of 1.8 cm) was defined below the boundary layers. The initial condition both in matrix and crack domains was set as the distribution of porewater pressure measured from the experiment prior to the first WD cycle.
5.2 Parameters
5.2.1 Shrinkage parameters
As shown in Fig. 10, using Eq. (18) to fit the measured shrinkage curve in Fig. 2, we obtained the four shrinkage parameters as , , and . Then, the variation of porosity in the crack domain (or crack ratio wc) and the matrix domain (εm) could be obtained using Eqs. (21) and (22), respectively. Note that the minimum wc calculated by Eq. (21) was set as 0.001 considering the incomplete closure of cracks during rainfall.
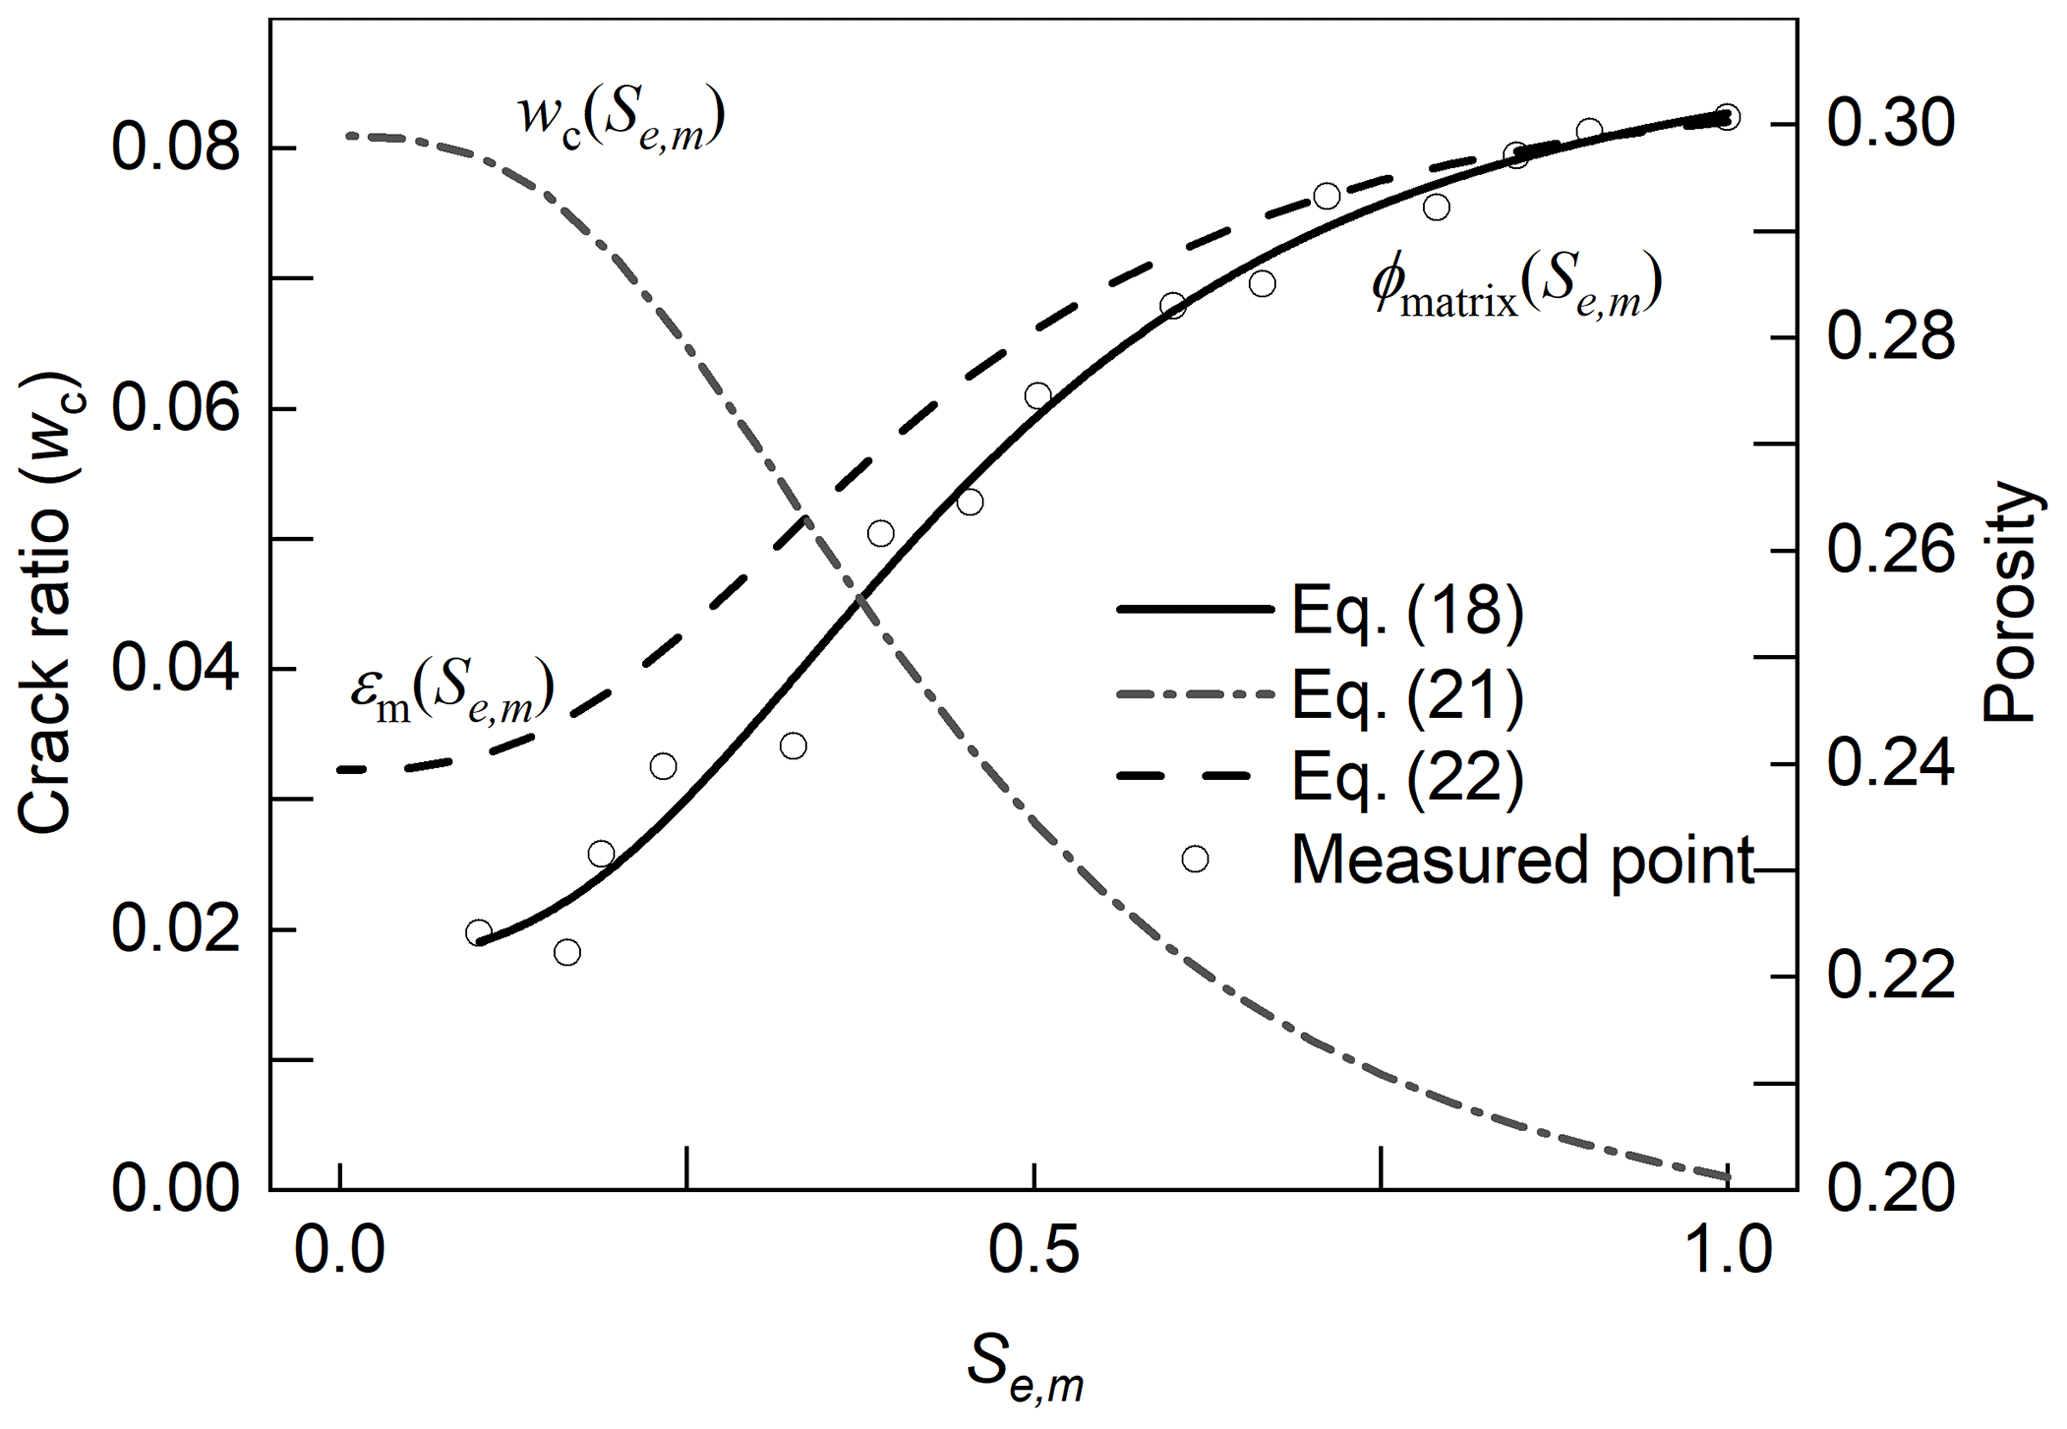
Figure 10Fitted shrinkage curve (solid line) and modeled porosity variation of matrix (dashed line) and crack domains (dashed–dotted line).
5.2.2 Soil water retention parameters
Figure 11 shows the measured matric suction versus volume water content at different depths. The SWRCs were estimated using a best fit of the van Genuchten–Mualem equation to measured soil water retention data. It can be seen that the WD cycles lead to hysteretic curves in the SWRC at 5 cm and 25 cm depths, while those at the 45 cm depth rarely show hysteretic curves. This result may also indicate that most of the cracks exist within the upper 25 cm depth of the soil column. In this study, we simply estimated an approximate single SWRC of the soil matrix through experiment data instead of incorporating the hysteretic curves into the model. For instance, the estimated SWRC in Fig. 11a lies between the wetting SWRC and drying SWRC to capture the overall characteristics of wetting–drying SWRCs as far as possible. Note that the shape parameter n in the upper matrix domain is slightly smaller than the lower one considering the upper soil matrix may become denser after long-term WD cycles (13 times, 54 d). Regarding the SWRC of the crack domain, as we assume the crack domain does not contain any solids, the saturated water content (θc,s) and the residual water content (θc,s) of that domain were set to be 0.99 and 0.01, respectively. Meanwhile, because the SWRC of the crack domain cannot be experimentally determined, we assigned the other two SWRC parameters (a= 1.5 and nc= 2) to mimic coarse-textured soil like behavior and to be consistent with Poiseuille law, which implies little effect of capillarity on flow through the cracks.

Figure 11Measured and estimated SWRC at different depths: (a) 5 cm, (b) 25 cm and (c) 45 cm.
5.2.3 Hydraulic conductivity
As mentioned in Eq. (29), the maximum saturated hydraulic conductivity of matrix domain () equals the saturated hydraulic conductivity (Ks) measured in the laboratory. Here, we set m s−1. Regarding the, it was calculated using Eq. (30), where the was set to 2.6 mm obtained from Fig. 6b. Then, the variation curve of transient saturated hydraulic conductivity of the matrix domain (Km,s) and the crack domain (Kc,s) could be obtained using Eqs. (27) and (28), respectively. Note that here we slightly modified Eq. (28) as follows:
This modification not only avoided the Kc,s dropping to zero, thus benefitting the numerical convergence, but also was reasonable when considering the incomplete closure of cracks during rainfall. The was also estimated using Eq. (30) with a suggested 0.01 mm. Further, the variation of Km and Kc with the pressure head (h) in the DPMDy could be calculated by combining Eqs. (24), (26) and (28). Figure 12 presents Km and Kc in the three models. Note that the pressure head in Kc(hm) of the DPMDy refers to that of the matrix domain (hm), while h in Kc(hc) of the DPM refers to that of the crack domain (hc).
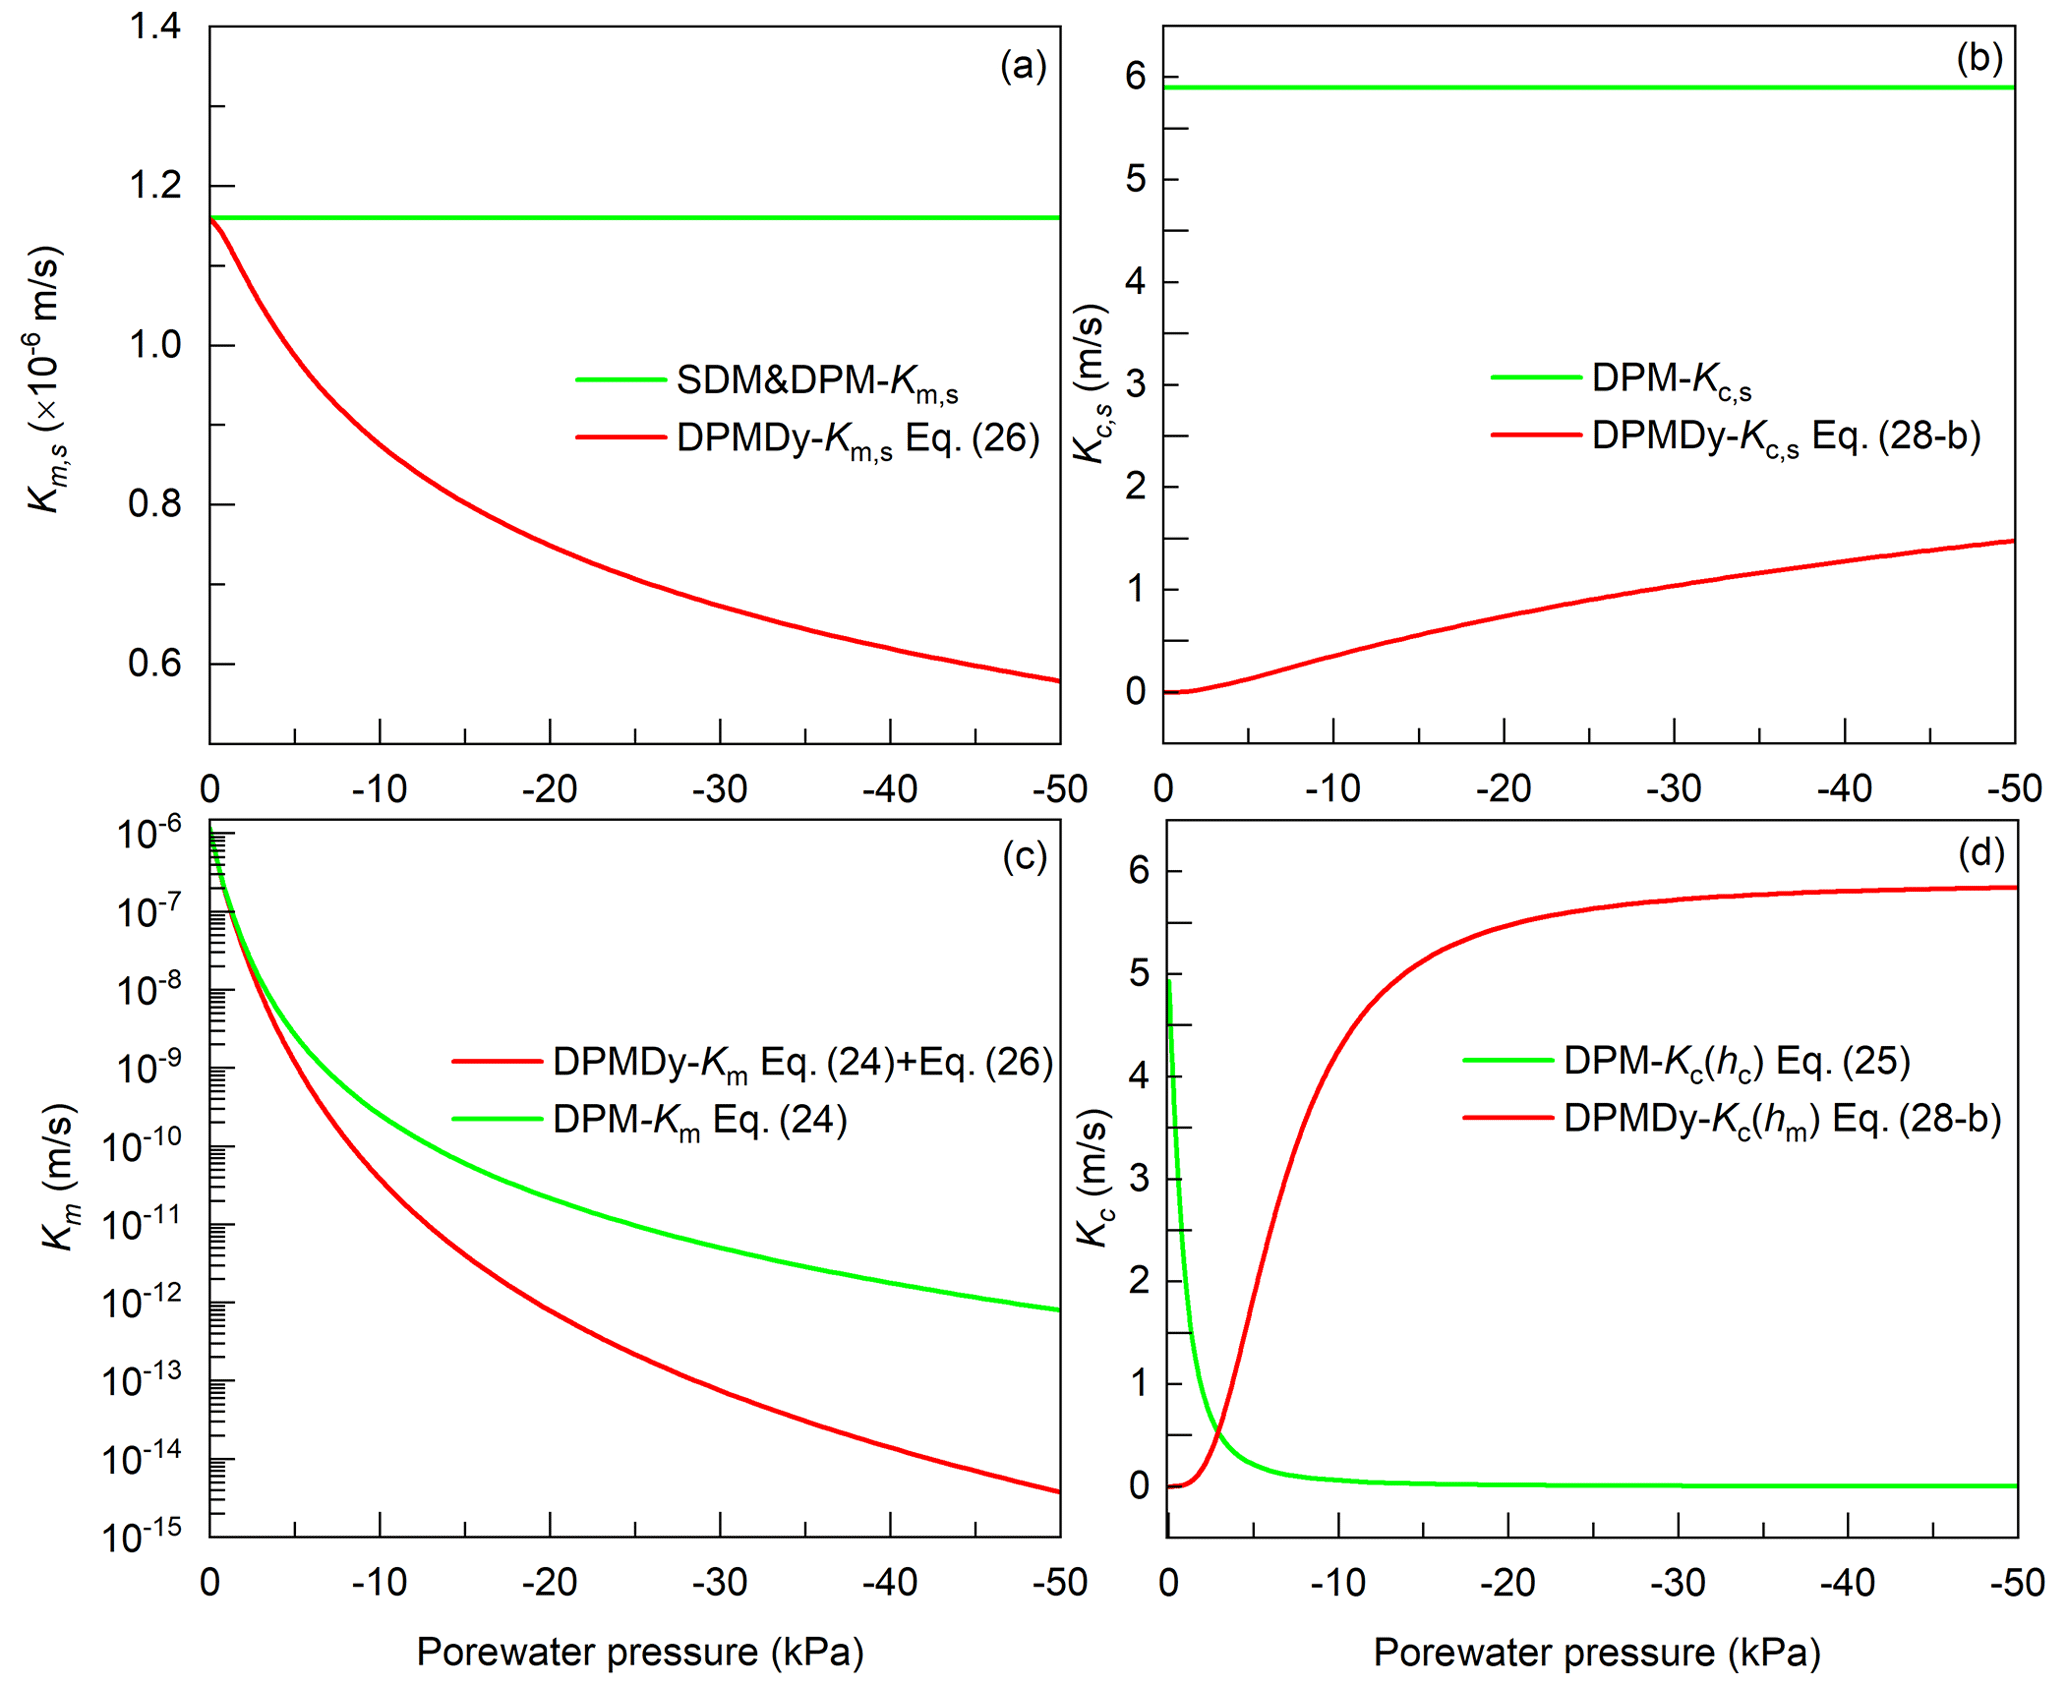
Figure 12Modeled hydraulic conductivity of each domain in the three models. (a) Saturated hydraulic conductivity of the matrix domain, (b) saturated hydraulic conductivity of the crack domain, (c) transient hydraulic conductivity of the matrix domain and (d) transient hydraulic conductivity of the crack domain.
5.2.4 Water exchange between and pore domains
In the dual-permeability concept, another important parameter is the hydraulic conductivity of the interface between matrix and crack domains (Ka). Generally, Ka was often estimated as the arithmetic mean of hydraulic conductivity of the two domains (Arora et al., 2011; Coppola et al., 2012, 2015; Gerke and van Genuchten, 1993b; Laine-Kaulio et al., 2014; Shao et al., 2015). However, this approximation may overestimate the Ka when the hydraulic conductivity of the crack domain is much higher than that of the matrix domain, especially in cracked clays. In our current study, a Ka function reformulated by Gerke et al. (2013) was adopted.
This formulation represents the flow occurring from the highest head toward the lowest head but being regulated by the less permeable of the two subsystems in that instant of time (Aguilar-López et al., 2020).
Regarding the αw, experimental results presented by Song et al. (2018) showed that the saturated Ka may be 1 order of magnitude larger than the Km,s, which will represent an enlarging coefficient ranging from 10 to 18. Hence, the αw was set as 10 m−2 considering the saturated determined by Eq. (31) is equal to the Km,s.
All parameters and parametric methods for the SDM, DPM and DPMDy are listed in Table 3.
Table 3Summary of parameters and parametric methods for the SDM, DPM and DPMDy.
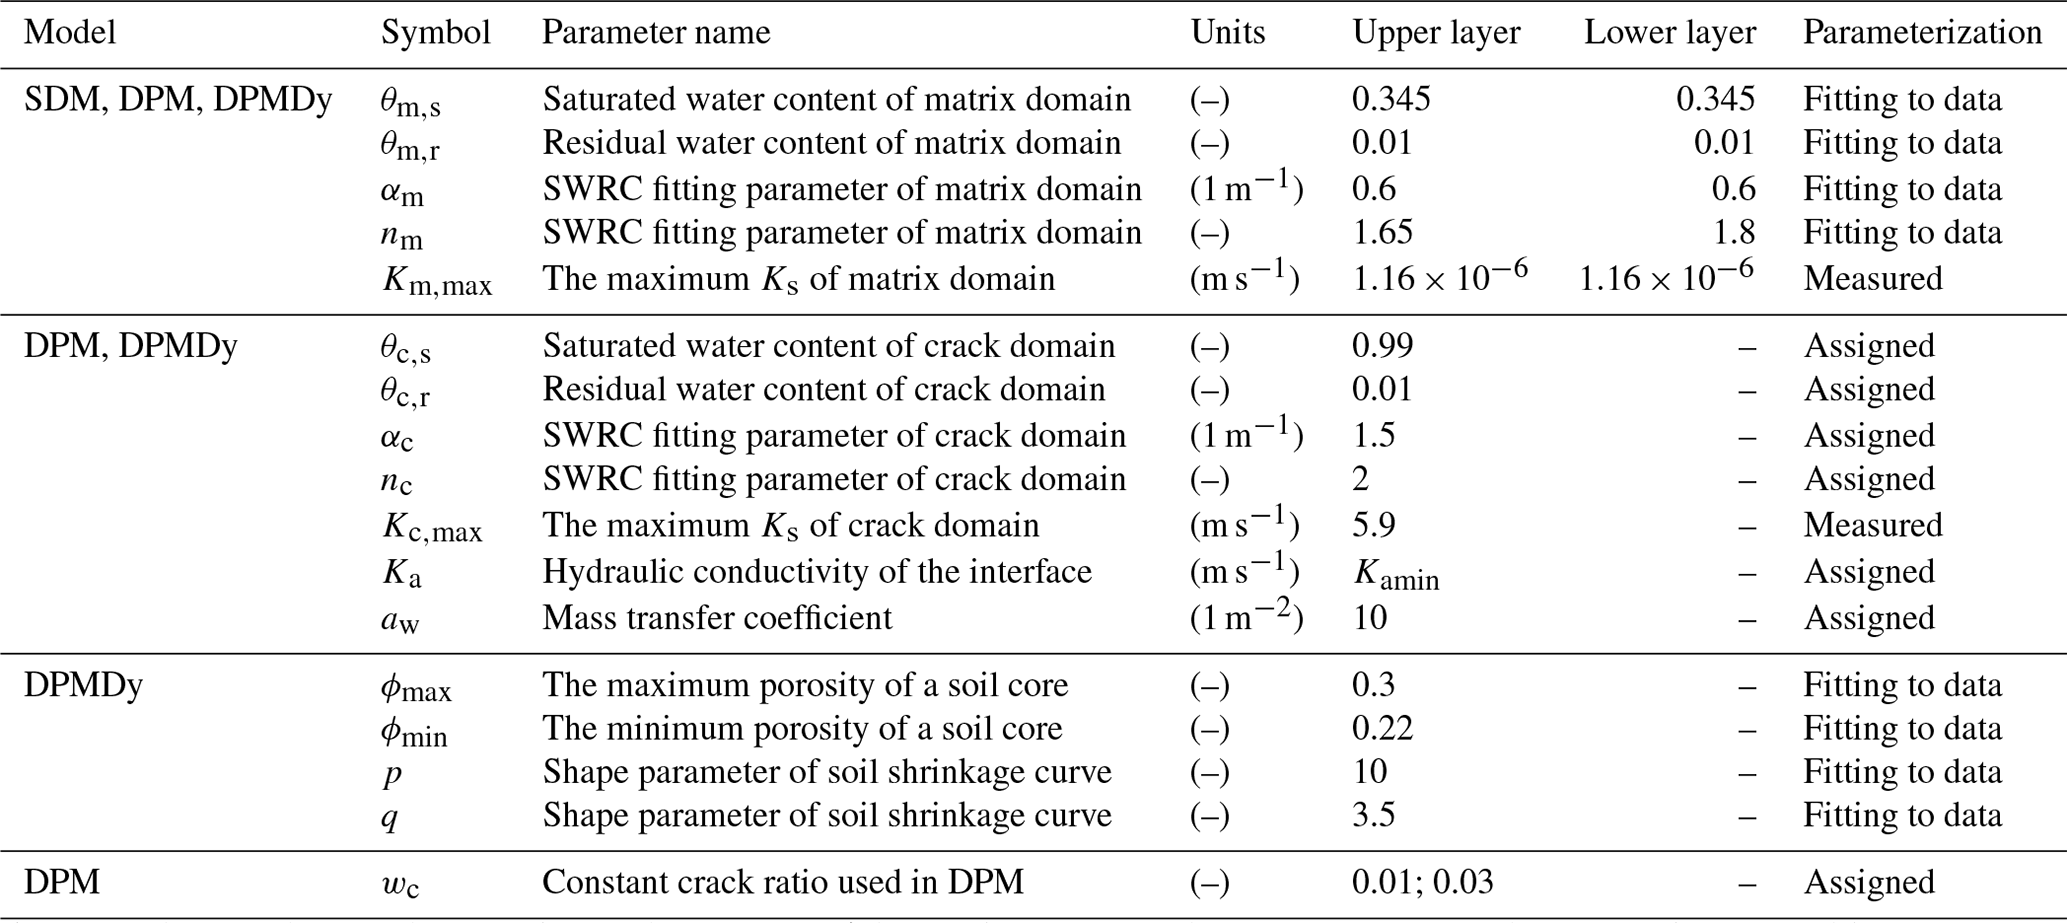
SDM: single-domain model. DPM: dual-permeability model neglecting crack dynamic changes. DPMDy: dynamic DPM. wc= 0.01 and 0.03 refer to the average and the maximum value of the measured crack ratio, respectively.
5.3 Simulation results
5.3.1 Boundary flow
Figure 13 shows the temporal evolution of the boundary flow velocity simulated by the SDM, DPM and DPMDy. As shown in Fig. 13a1 and a3, during drying periods, the matrix domain dominates the soil evaporation process and was responsible for 97 %–99 % of the total evaporation in all the dual-permeability models. The matrix evaporation rate (em) simulated by the DPMDy was overall lower than that of the SDM and DPM during high-intensity evaporation periods, but the crack evaporation rate (ec) simulated by the DPMDy, especially during the last three drying periods, was approximately 1 to 2 orders of magnitude larger than that of the DPM (see the enlarged image in Fig. A1).
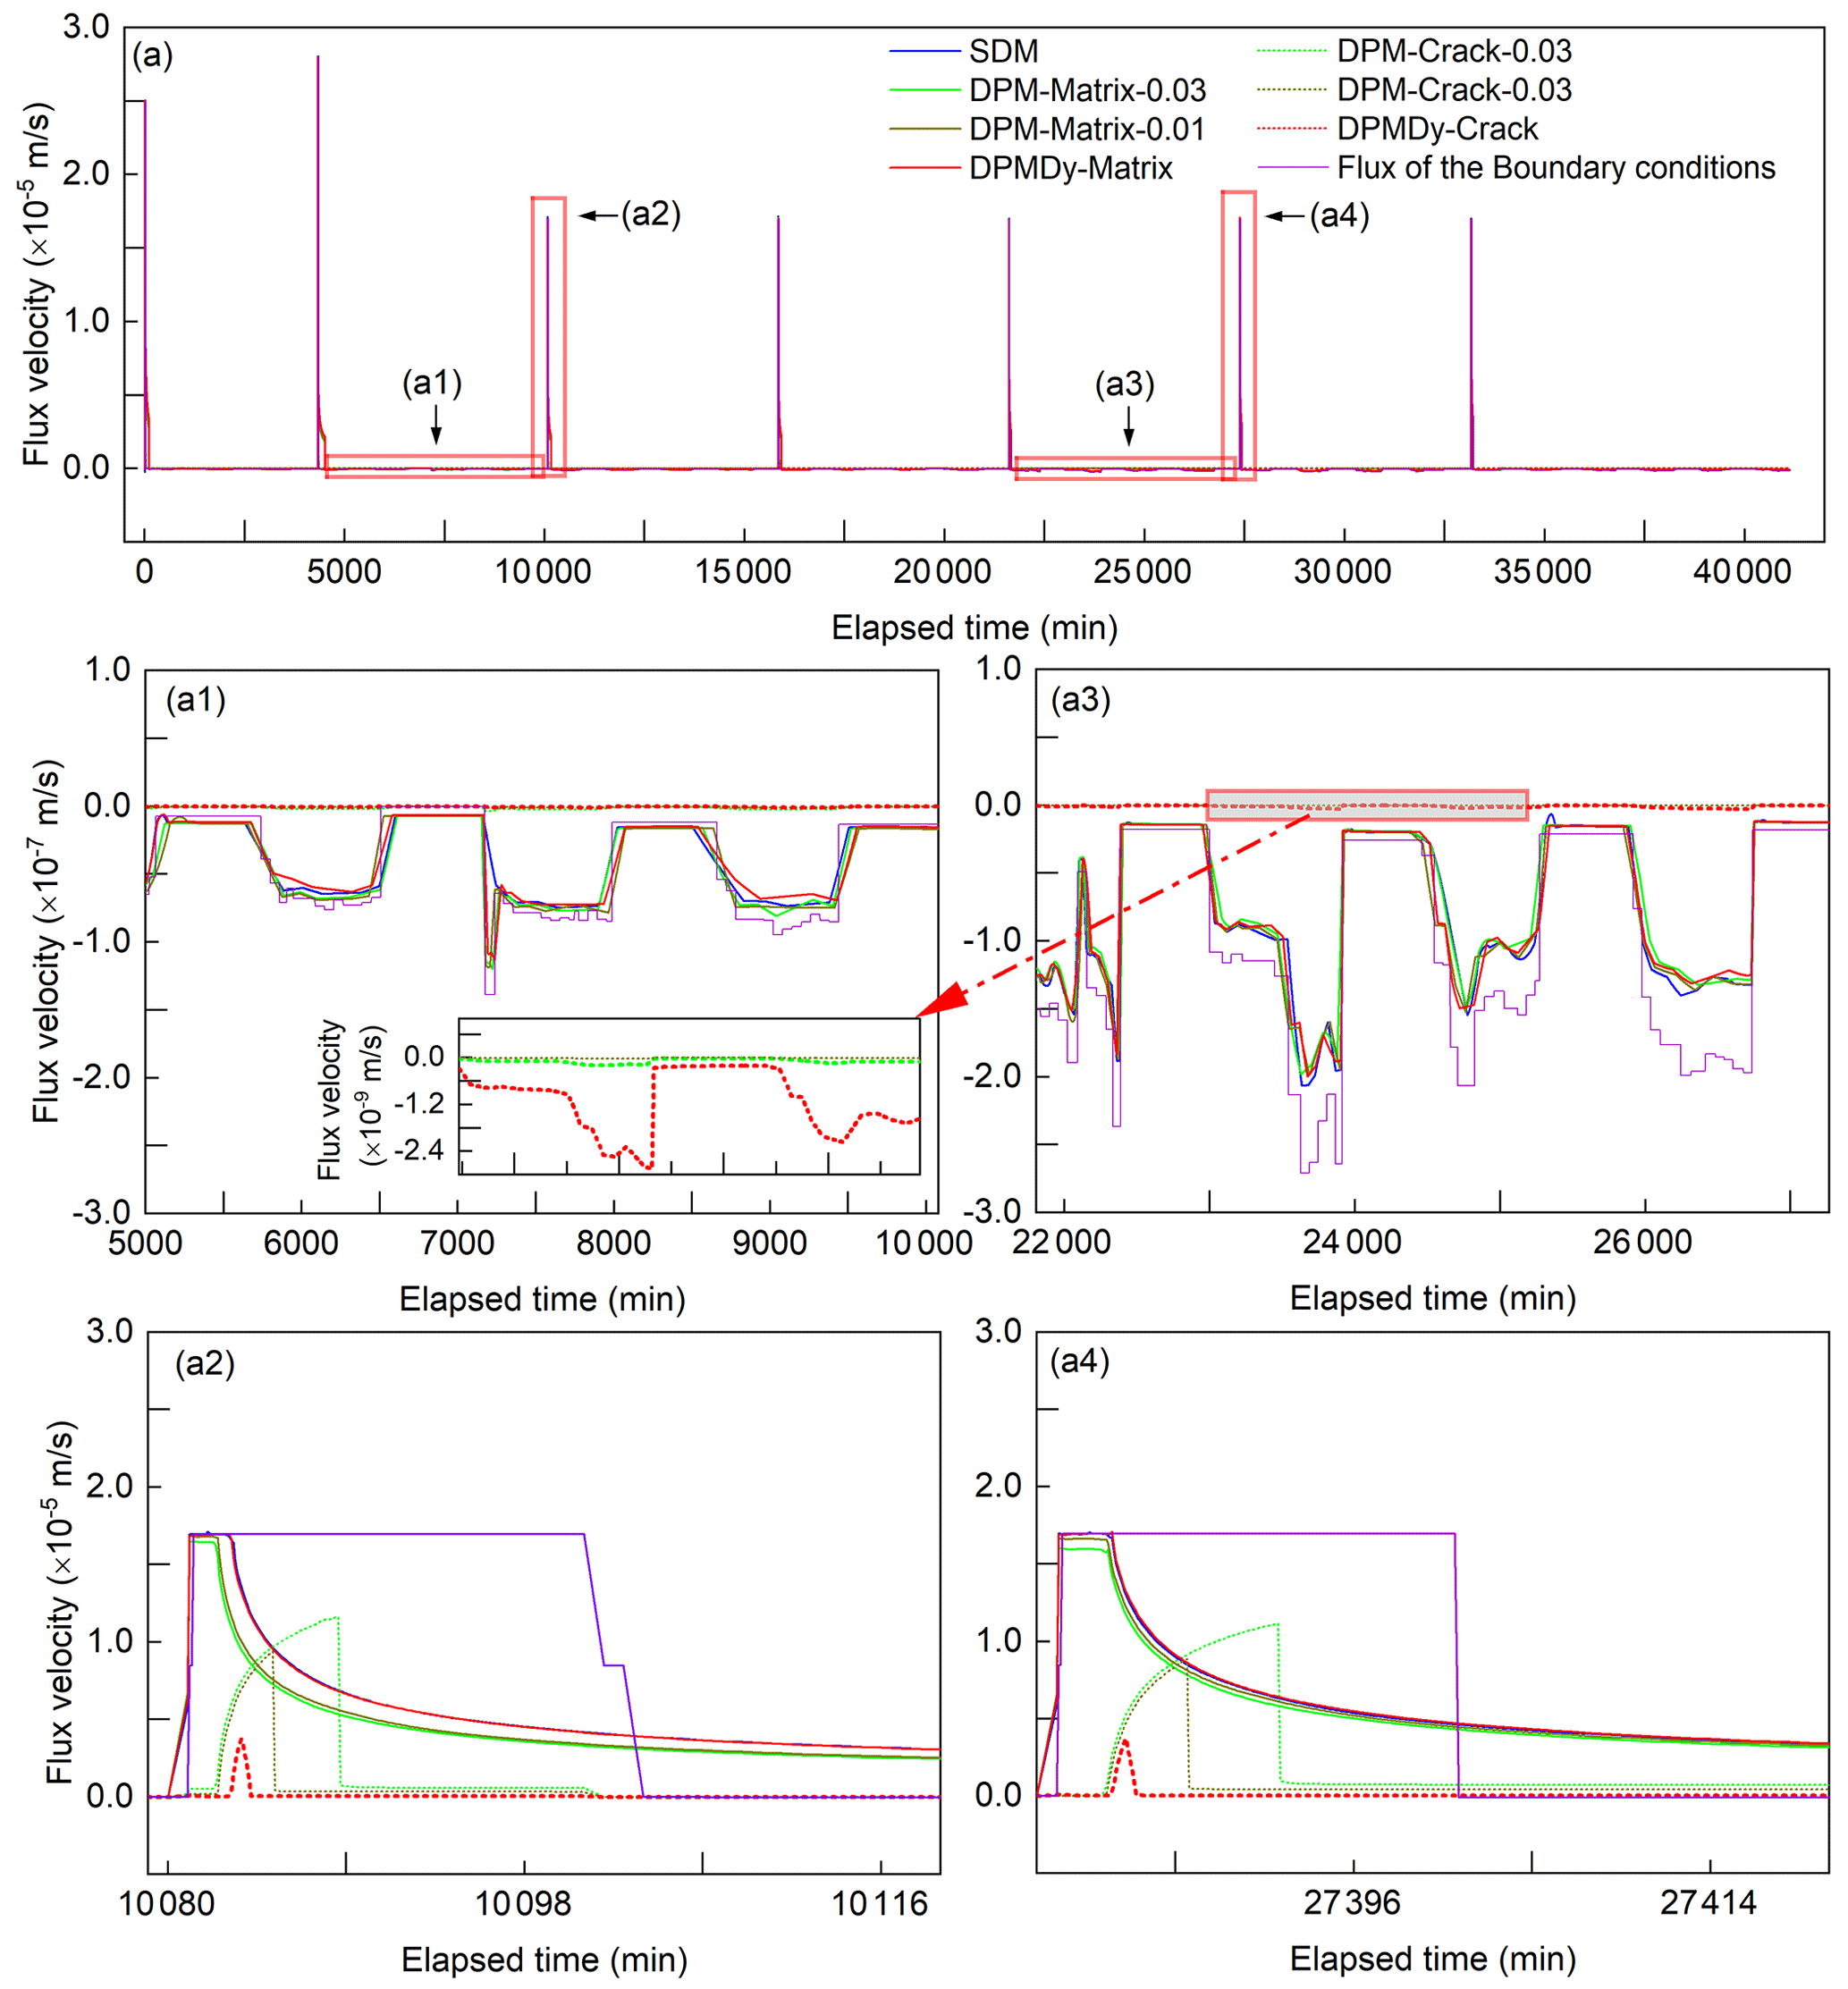
Figure 13Boundary flow simulated by the SDM, DPM and DPMDy. (a) Flow velocity of the boundary conditions and simulated results; (a1) and (a2) are the enlarged images of the flow velocity during the second drying and third wetting process, respectively; (a3) and (a4) are the enlarged images of the flow velocity during the fifth drying and sixth wetting process, respectively. The positive value is for infiltration and negative for evaporation.
With regard to the wetting process, Fig. 13a2 and a4 represent two typical infiltration patterns before and after the fifth drying period (with significantly increased evaporation intensity). Overall, matrix flow still dominated the infiltration process in all the dual-permeability models due to the relatively small crack ratio and depth. For the SDM, all the rainfall infiltrates into the soil during the beginning of rainfall events. When the soil surface gets saturated, water ponding occurred, and the soil infiltration rate gradually decreased. In the DPM and DPMDy, the surplus water after matrix ponding infiltrates into the crack domain as preferential flow, and water will pond on the overall soil surface when the crack domain reached its storage capacity. Recall that the crack volume in the DPMDy decreases with the matrix getting moist, while that in the DPM keeps constant. Consequently, the ponding time of the crack domain simulated by the DPMDy in the third rainfall event (inflection point of the dashed red line in Fig. 13a2) was 1.6 and 4.8 min earlier than that of the DPM-0.01 and DPM-0.03 (rigid dual-permeability model with crack ratio of 0.01 and 0.03, respectively), respectively. The cumulative preferential flow simulated by the DPMDy was 87.4 % and 95.2 % less than that of the DPM-0.01 and DPM-0.03, respectively. A similar rainfall pattern was obtained during the sixth rainfall event.
5.3.2 Water balance
By integrating the boundary flow velocity in Fig. 13a, the total cumulative flux for the experiment and the three models was obtained (Fig. 14a). In the experiment, the variation of water flux was estimated by calculating the sum of the difference between θini (initial volume water content) and θt=i (volume water content at any time) in the five monitoring depths. Meanwhile, the water evaporation during water ponding was also estimated and added to the total flux volume. Regarding the numerical model, the water balance was obtained by integrating all flow components along the upper and lower boundaries. The steep increase stage of each curve represents cumulative input water flux during wetting periods, and the gradual decrease stage represents cumulative output water flux during drying periods. To evaluate the performance of each model on the water balance, the measured cumulative input and output water fluxes in each wetting and drying stage were compared to the simulated ones (Fig. 14b).

Figure 14Water balance for the measured and simulated results. (a) Temporal evolution of total water flux calculated from the measured water content, SDM, DPM and DPMDy, and (b) measured versus modeled cumulative flux during each drying and wetting stage.
In Fig. 14a, the results show that the total infiltration (It,inf) and evaporation flux (Et,eva) estimated from measured θexp were 171 and 138.95 mm, respectively. The It,inf was 5.86 % less than the supplied water (183.44 mm) due to the water leakage. The Et,eva was 16.48 % less than the cumulative PE (166.36 mm) because of the limit of the soil actual evaporation. Regarding the simulation results, the coefficient of determination (R2) and intercept were used to evaluate the errors made by the three models. As shown in Fig. 14b, the slope of each fitting curve was fixed as 1. The SDM and DPMDy have relatively smaller intercepts and slightly higher R2 than that of the DPM-0.01 and DPM-0.03, indicative of a better coincidence to the measured data. Overall, the errors in water balance caused by the three models were acceptable in this study.
5.3.3 Crack dynamic changes and hydrological response
Figure 15 shows part of the comparison results between the measured data and the three models. Detailed descriptions of all the comparison results are presented in Appendix A. Overall, all models show similar response trends with the measured data. Divergences among the three models mainly appeared during drying.
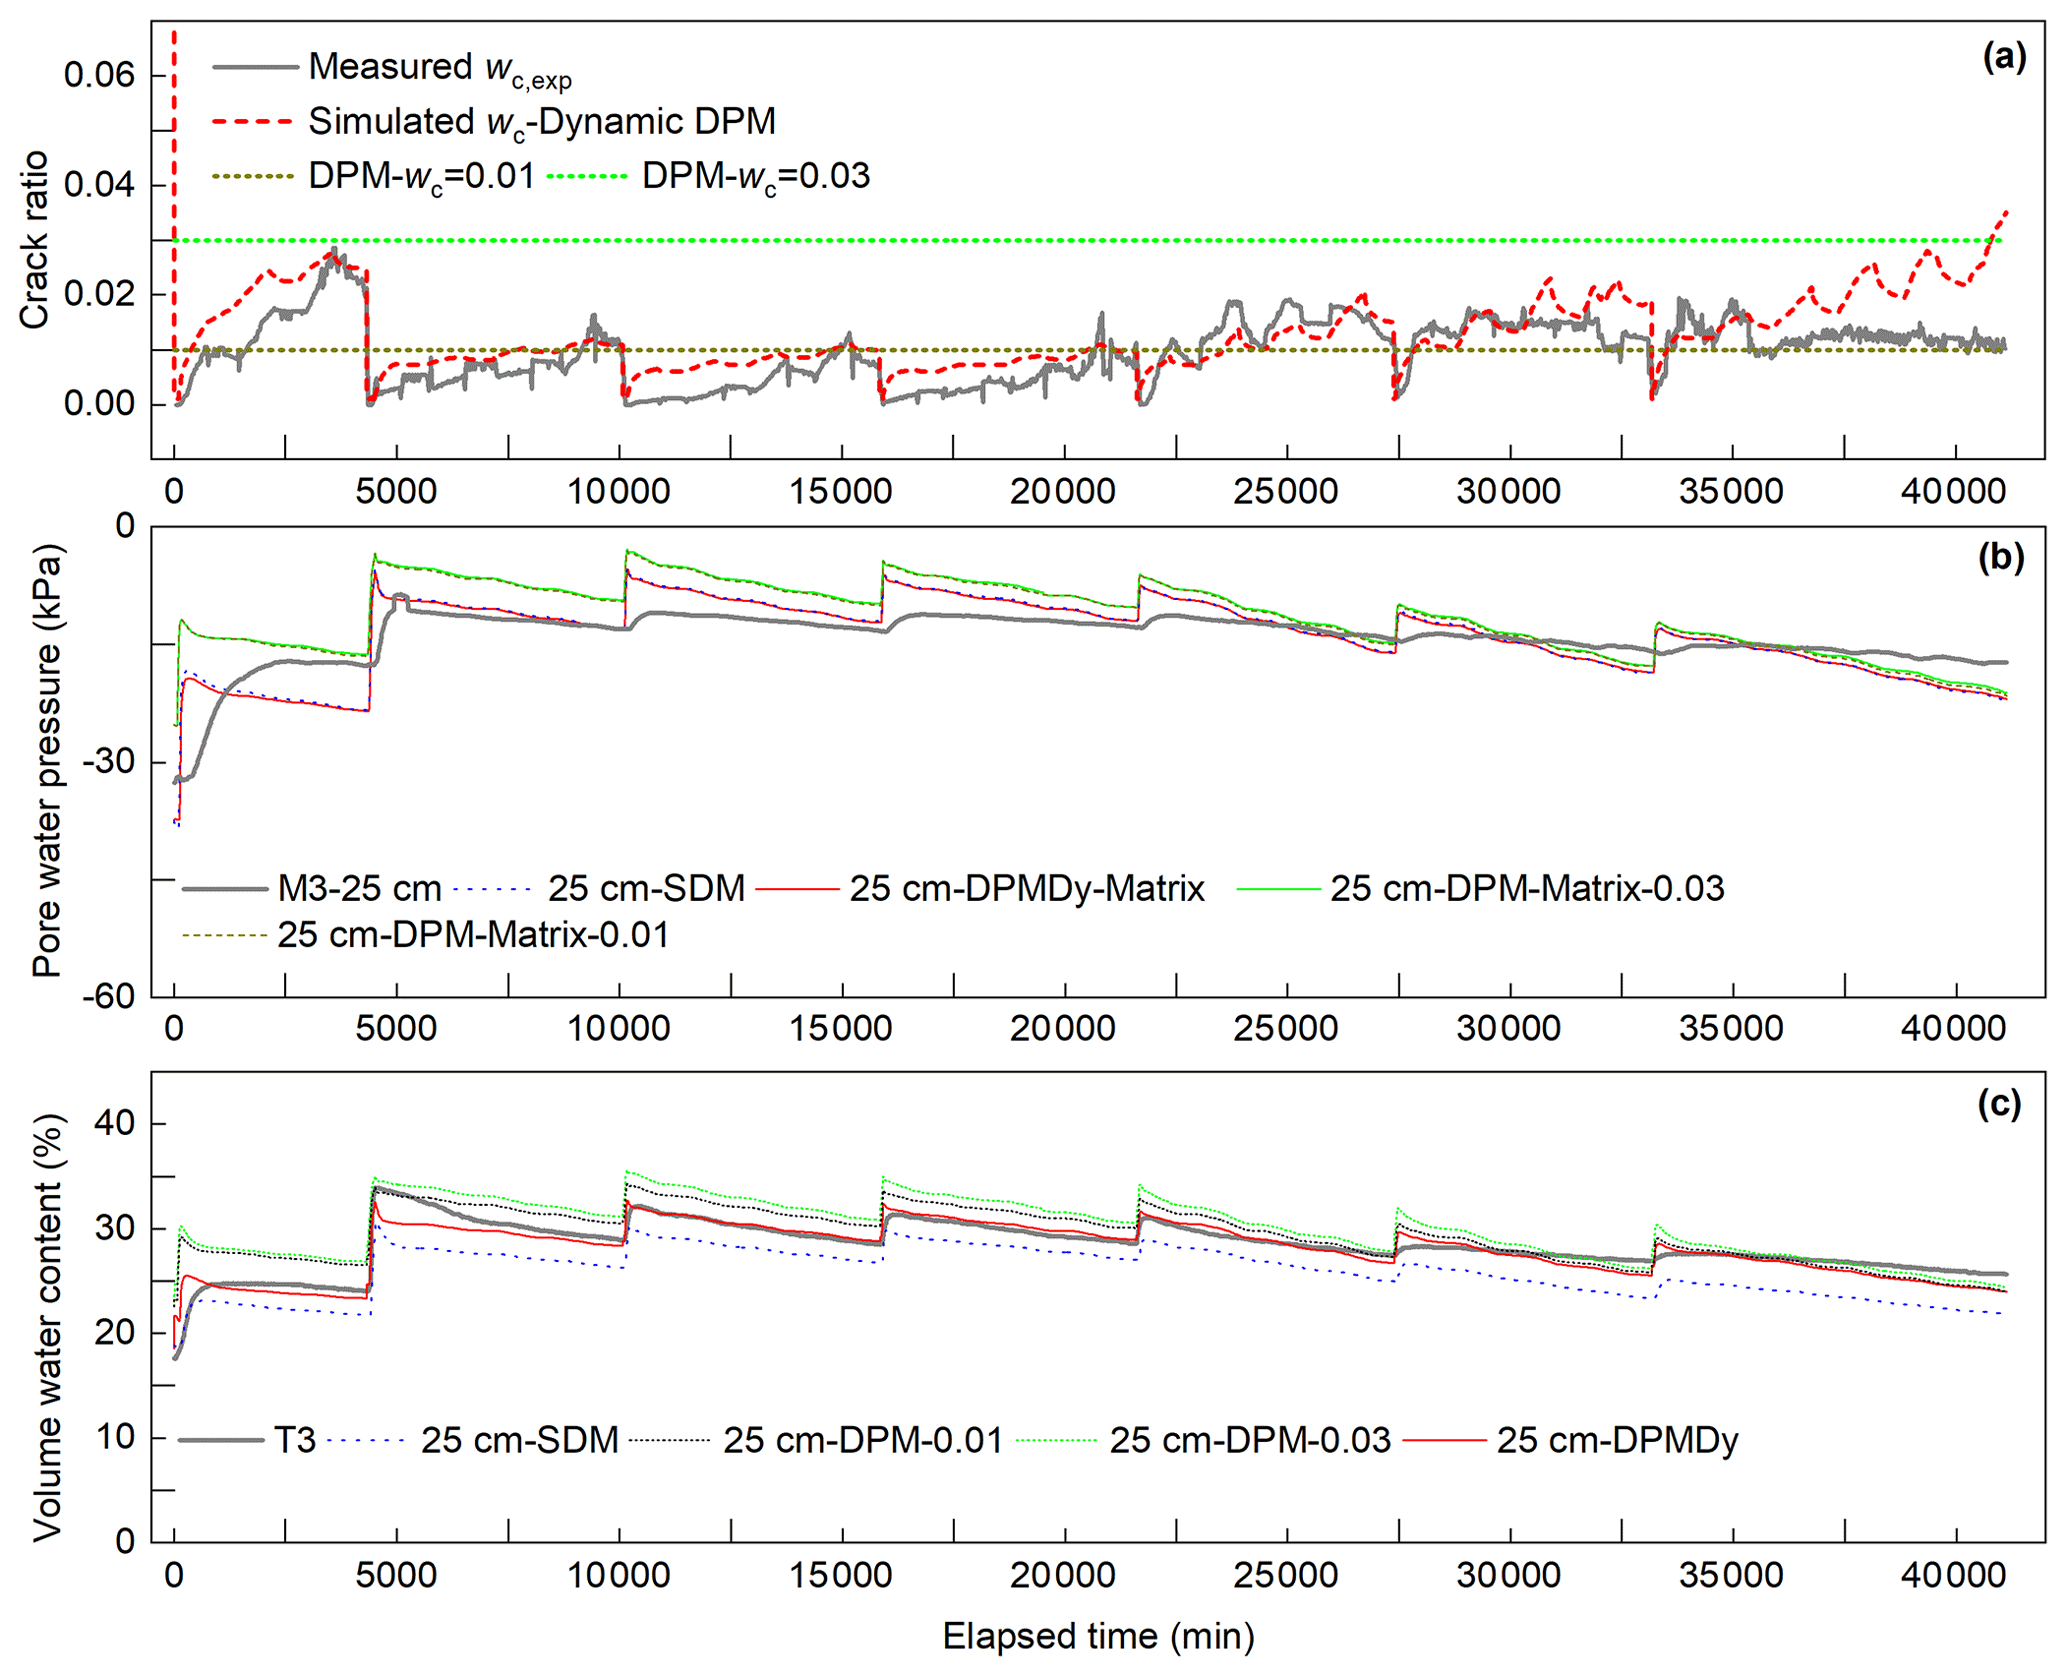
Figure 15Temporal evolution of the measured and simulated crack ratio, matric suction and volumetric water content. (a) Measured and simulated crack ratio on soil surface, (b) measured and simulated matric suction at 25 cm depth and (c) measured and simulated total water content at 25 cm depth.
In Fig. 15a, the simulated surficial wc,sim was not only generally close to the wc,exp in value and trend, but also it captured the transient slow decrease in wc,exp during low-evaporation periods. Notably, significant overprediction appeared in the sixth and seventh wetting–drying cycles.
In Fig. 15b, the matric suction (Ssim) at the 25 cm depth simulated by SDM and DPMDy was close to each other and had an average divergence 2.26 kPa to the measured data. The Ssim simulated by DPM had a greater average divergence of 3.4 kPa to the measured data. These values showed systematic underprediction compared to the Ssim simulated by SDM and DPMDy, but their differences became smaller with the increasing WD cycles.
In Fig. 15c, the total volumetric water content θsim simulated by SDM was much lower with respect to the DPMDy and DPM. The θsim simulated by DPM-0.01 and DPM-0.03 overpredicted the volumetric water content. The DPMDy provided better prediction results but also showed slight underprediction to the measured data in the last two WD cycles.
6.1 Crack dynamic changes
Our experimental results demonstrated that the crack evolution is not always positively correlated to the increase of the WD cycles, T and PE. For instance, the 5 cm θexp at the end of the final three WD cycles was lower than that in the first WD cycle due to the increased T and PE, but the maximum wc,exp measured during the final three WD cycles was much less than that in the first WD cycle. From the energy-driven perspective, soil cracking and propagation can be regarded as a process that the shrinkage energy (or stress), built up from the evaporation and thermal radiation, was released until a critical moment when the tensile strength of soil is reached (Peron et al., 2009; Xu et al., 2022; Tian et al., 2022). If the environmental condition changes in a stable range, the desiccation cracks will vary within the crack pattern and the maximum wj,exp that were formed under the maximum shrinkage energy. In this case, new desiccation cracks will not appear in the remained soil matrix during WD cycles (Fig. 5b1–b4). One reason is that the shrinkage energy can be fully released via previous cracks. The other reason is that the shrinkage energy is not high enough to split the soil matrix that has a denser structure (or higher tensile strength) than its initial state prior to shrinkage (Luo et al., 2021). However, once the evaporation rate and thermal radiation increase to exceed the stable range, higher shrinkage energy will lead to new cracks appearing in the soil matrix that will concurrently restrain the width increase of the previous cracks (Wang et al., 2018; Xu et al., 2021). This is the reason that cracks in the final three WD cycles are finer than the first four WD cycles. Our model describes the crack evolution mainly from the hydrological-driven perspective that assumed the surface crack pattern has become stable after undergoing 13 WD cycles and has a constant function relationship with the water content. Indeed, this assumption is reasonable for natural soils under atmospheric environmental conditions. However, our experiment not only used reconstituted soil, but also intensely changed the environmental conditions since the fifth WD cycle. Therefore, the model overpredicted wc,exp at the end of the sixth and seventh WD cycles.
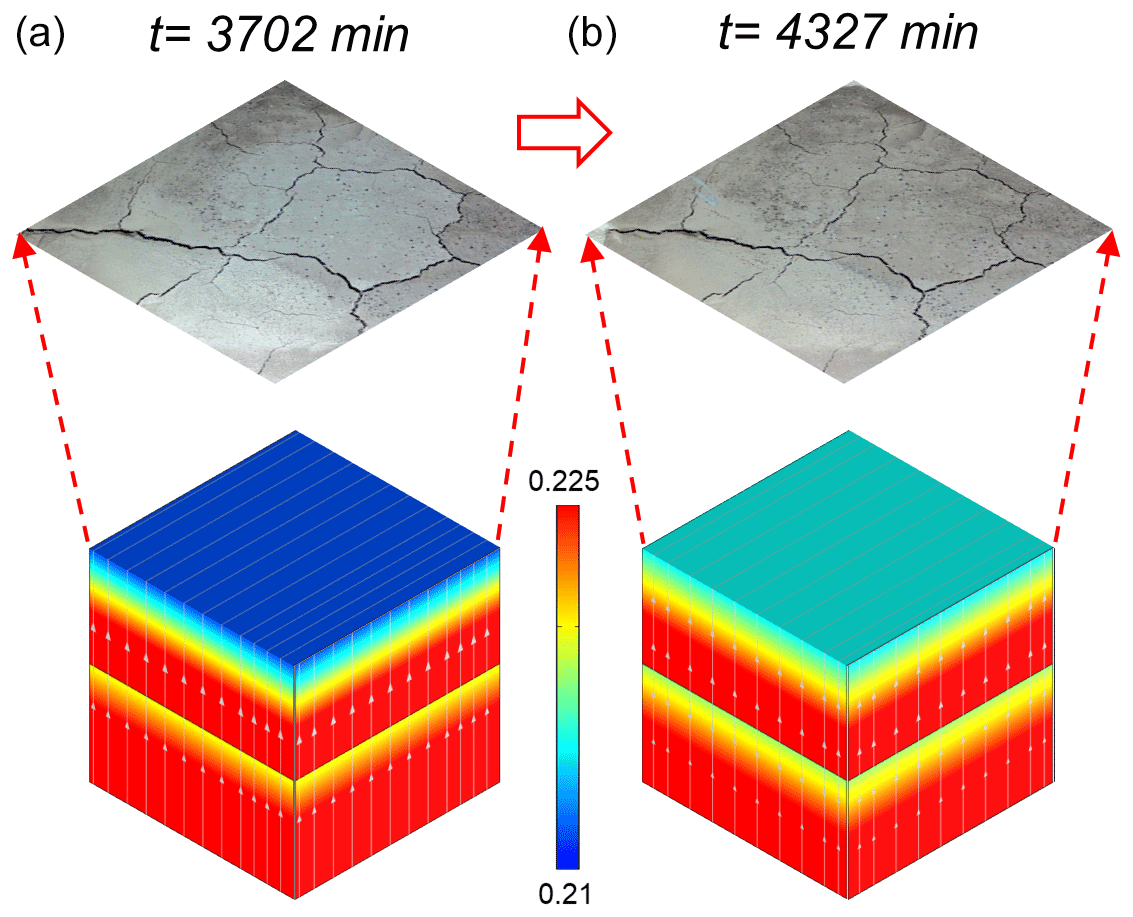
Figure 16Crack images at t= 3702 and 4327 min (photo at the top of the panels) as well as the vertical distribution of water content in the numerical model (lower part of the panels) during the low-evaporation process. Panel (a) shows the beginning of the final low-evaporation stage during the first drying periods, while panel (b) shows the end of the final low-evaporation stage during the first drying periods.
In addition, another interesting phenomenon is the transient decrease in wc,exp and increase in θexp measured at 5 cm depth during low-evaporation periods, which we called a “self-closure” process. In light of Figs. 6 and 8, the self-closure process appeared to be always accompanied by relatively high RH. From the insight of the experiment, it is natural and common to infer that the moist air wetted the surface soil from top to bottom, resulting in the self-closure phenomenon. Interestingly, our model does not incorporate the vapor flow into the boundary conditions, and also the evaporation boundary only involves the outflow of water, but it still managed to capture the self-closure process. Figure 16 shows the crack images at t= 3702 and 4327 min as well as the corresponding cloud chart of θsim. It can be seen that the soil surface became moist during the low-evaporation period, which is a typical external phenomenon reflecting the self-closure process. The simulation results show that θsim near the surface soil increased during evaporation, while θsim at deep soils decreased, indicative of evaporation causing the deep water to move up and wet the surface soil from bottom to top. We further found that the process occurred because the water flow driven by the soil water potential gradients, existing between the wet and dry soil layers, overcame the gravity. Indeed, this kind of “hydraulic lift” process frequently occurs in planted soils where root zone soil can force water flow from moist, deep soil layers to dry, shallow soil layers (Richards and Caldwell, 1987; Bauerle et al., 2008) but was rarely reported in homogeneous bare soil. We infer that the evaporation boundary conditions using Eq. (14) might play a positive role in causing water to move up and constraining it within the surficial soil depths when the evaporation intensity decreased. In any case, our results provide an additional possible explanation to the self-closure phenomenon. Further quantitative analysis based on a gas–liquid two-phase flow model is needed to compare the contribution of hydraulic lift and moist air to the self-closure process of cracks.
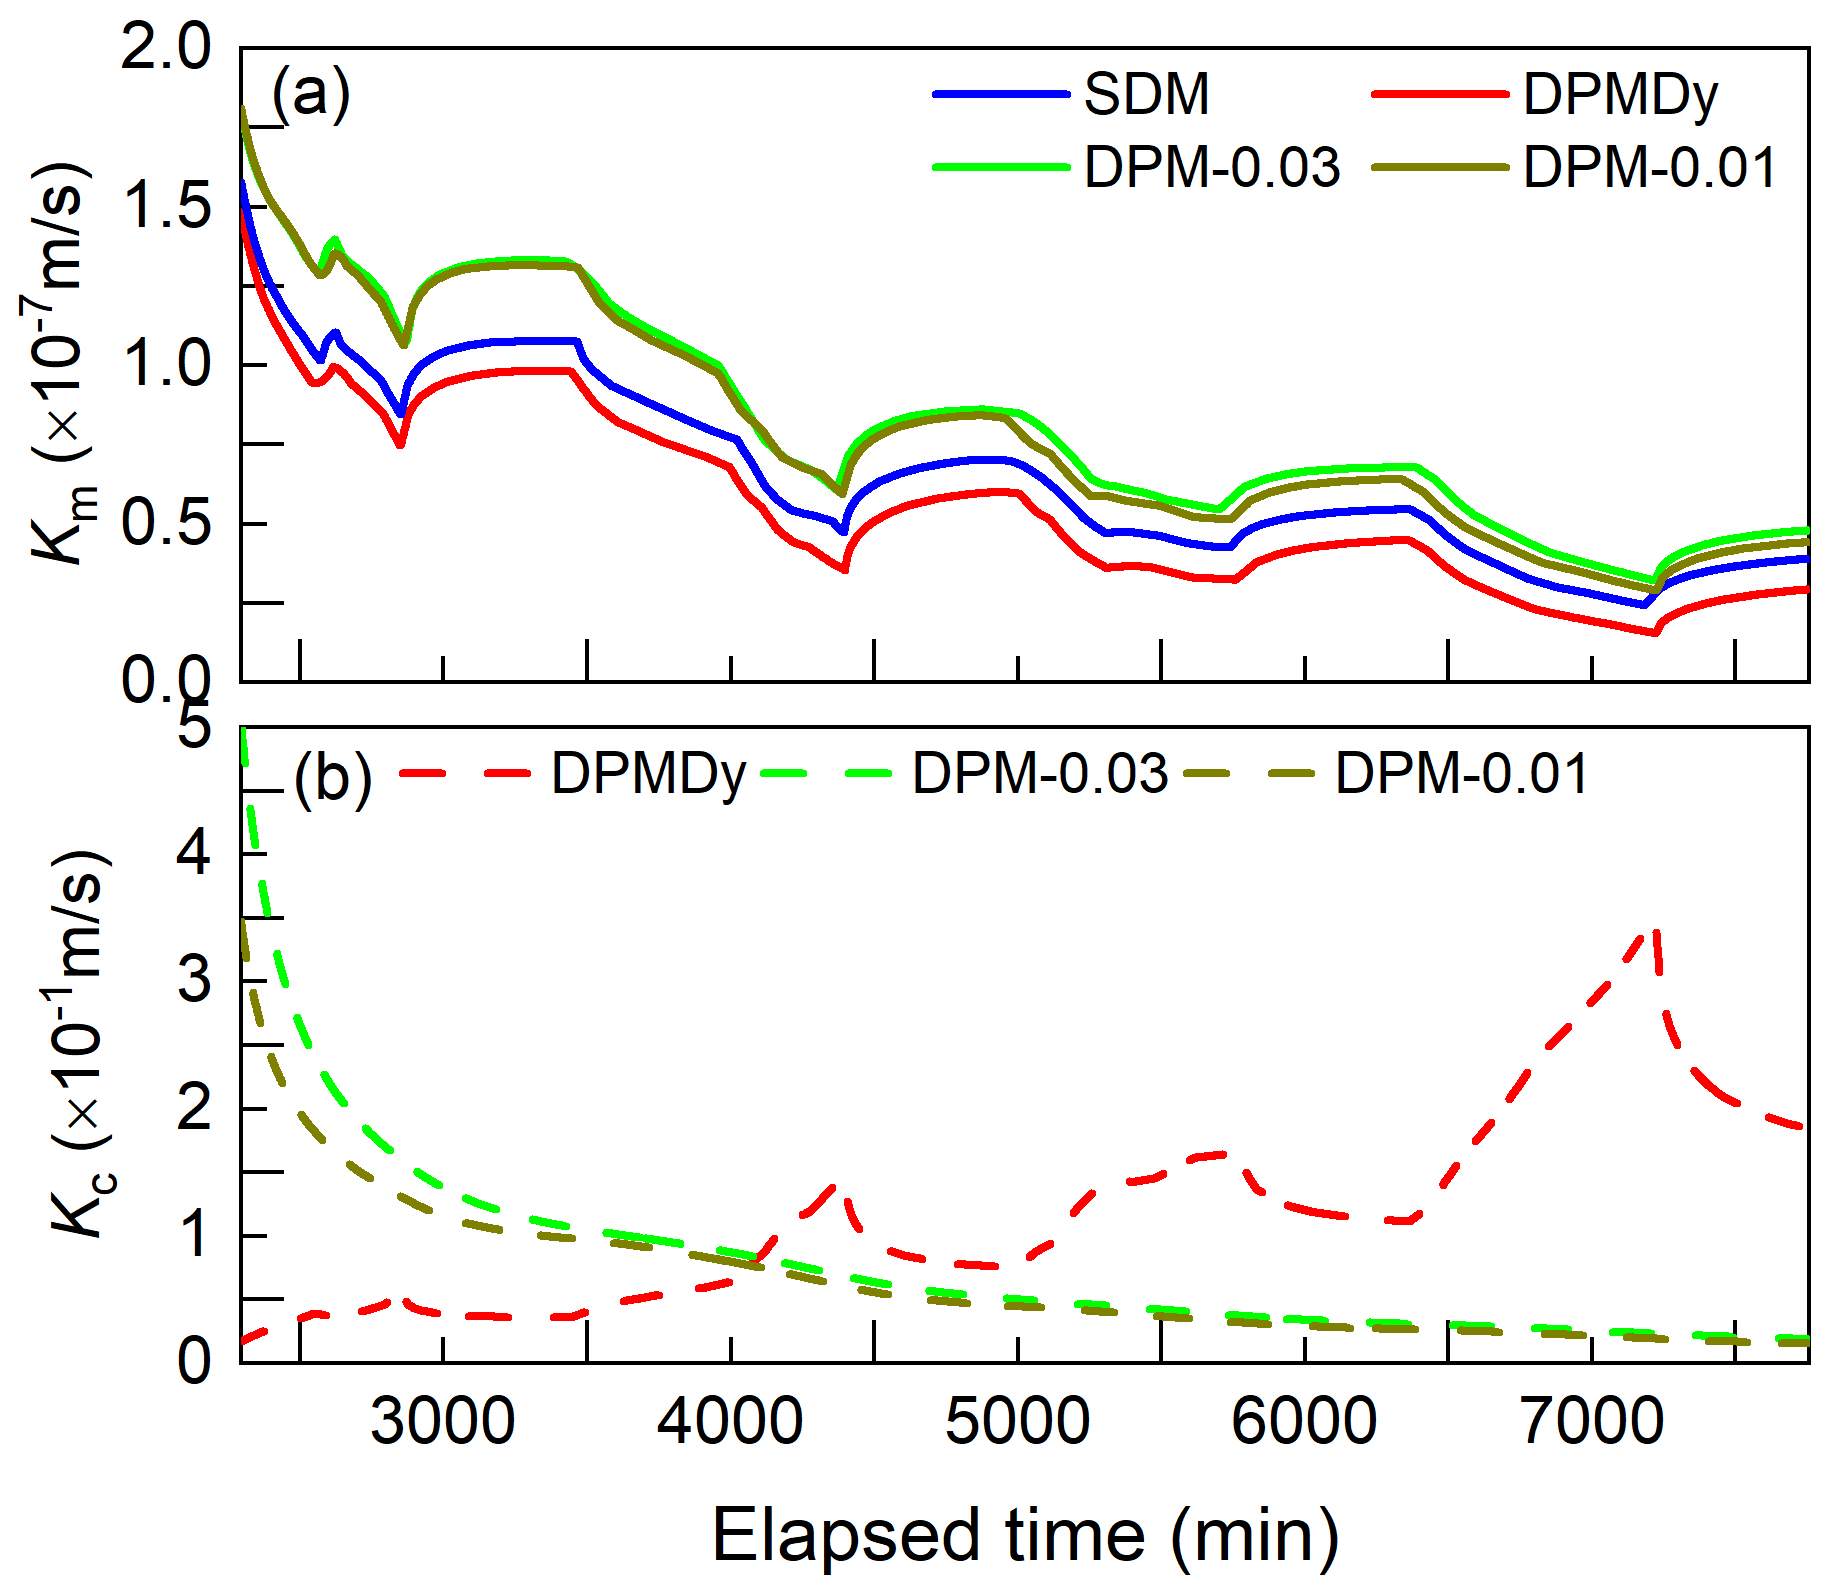
Figure 17Variation of boundary Km and Kc in each model during the fifth drying periods. (a) Km and (b) Kc.
6.2 Water flow with dynamic changes of desiccation cracks
6.2.1 Water fluxes
As mentioned in Sect. 5.3.1, during the drying process, the matrix and crack evaporation simulated by the DPMDy are overall lower and higher than other models, respectively. It can be explained by looking at the variation of boundary Km and Kc in each model. Take the time span in Fig. 13a2 as an example; because the DPMDy considers the effects of matrix shrinkage on the Km using Eq. (26), the Km,DPMDy is always approximately 20 % and 30 % lower than that of the SDM and DPM, respectively (Fig. 17a). Conversely, because the DPM links the Kc with the saturation degree of the crack domain (see Eq. 25), the Kc,DPM is destined to decrease with the decreased saturation degree of the crack domain induced by drying, while the Kc,DPMDy increases with the crack development induced by drying in light of Eq. (28-b). The ultimate Kc,DPMDy is 80 % higher than the Kc,DPM (Fig. 17b). Indeed, the decrease in Kc with the drying process is an unrealistic and physically unreasonable result. We can imagine that after long-term drought, the Kc,DPM will decline to nearly zero according to Fig. 12d, which will greatly underestimate the propagation of the PF-DC in the subsequent storm event. However, many laboratory and field experiments have observed that heavy rainfall following a long-term drought facilitated PF-DC (Baram et al., 2012, 2013; Greve et al., 2010; Kurtzman and Scanlon, 2011; Schlögl et al., 2022). By contrast, the DPMDy has the potential to capture this process for its increasing Kc with the enlarging desiccation crack during the long-term drought. In this study, because the experiment scale (or crack volume) is small, the increment of PF-DC simulated by the DPMDy after high-intensity evaporation is not significant (despite increment = 25 %), but we believe the DPMDy will have a better performance in a larger scale (i.e slope scale).
6.2.2 Water exchange and distribution
For the dual-permeability model, the two domains are coupled by the water exchange term (Eq. 3) that is governed by the pressure head difference between the two domains (), water exchange coefficient (αw) and the hydraulic conductivity between the two domains (Ka). The higher the Γw, the quicker the two domains equilibrate. Generally, the higher Γw leads to faster water exchange from the crack domain into the matrix domain and thus boosts the contribution of preferential flow to the water distribution in the soil matrix. According to previous studies, the commonly used magnitude of the product of saturated αwKa in clay soils ranges from 10−5 m−1 s−1 (Aguilar-López et al., 2020) to 10−6 m−1s−1 (Coppola et al., 2012, 2015; Gerke and Maximilian Köhne, 2004; Vogel et al., 2000). In this study, the saturated αwKa is m−1 s−1, which falls in the reasonable range. Building on the above statement, the Δh and water exchange rates () for both the DPM and DPMDy at the 5, 15 and 25 cm depths during the sixth rainfall event are graphed in Fig. 18.
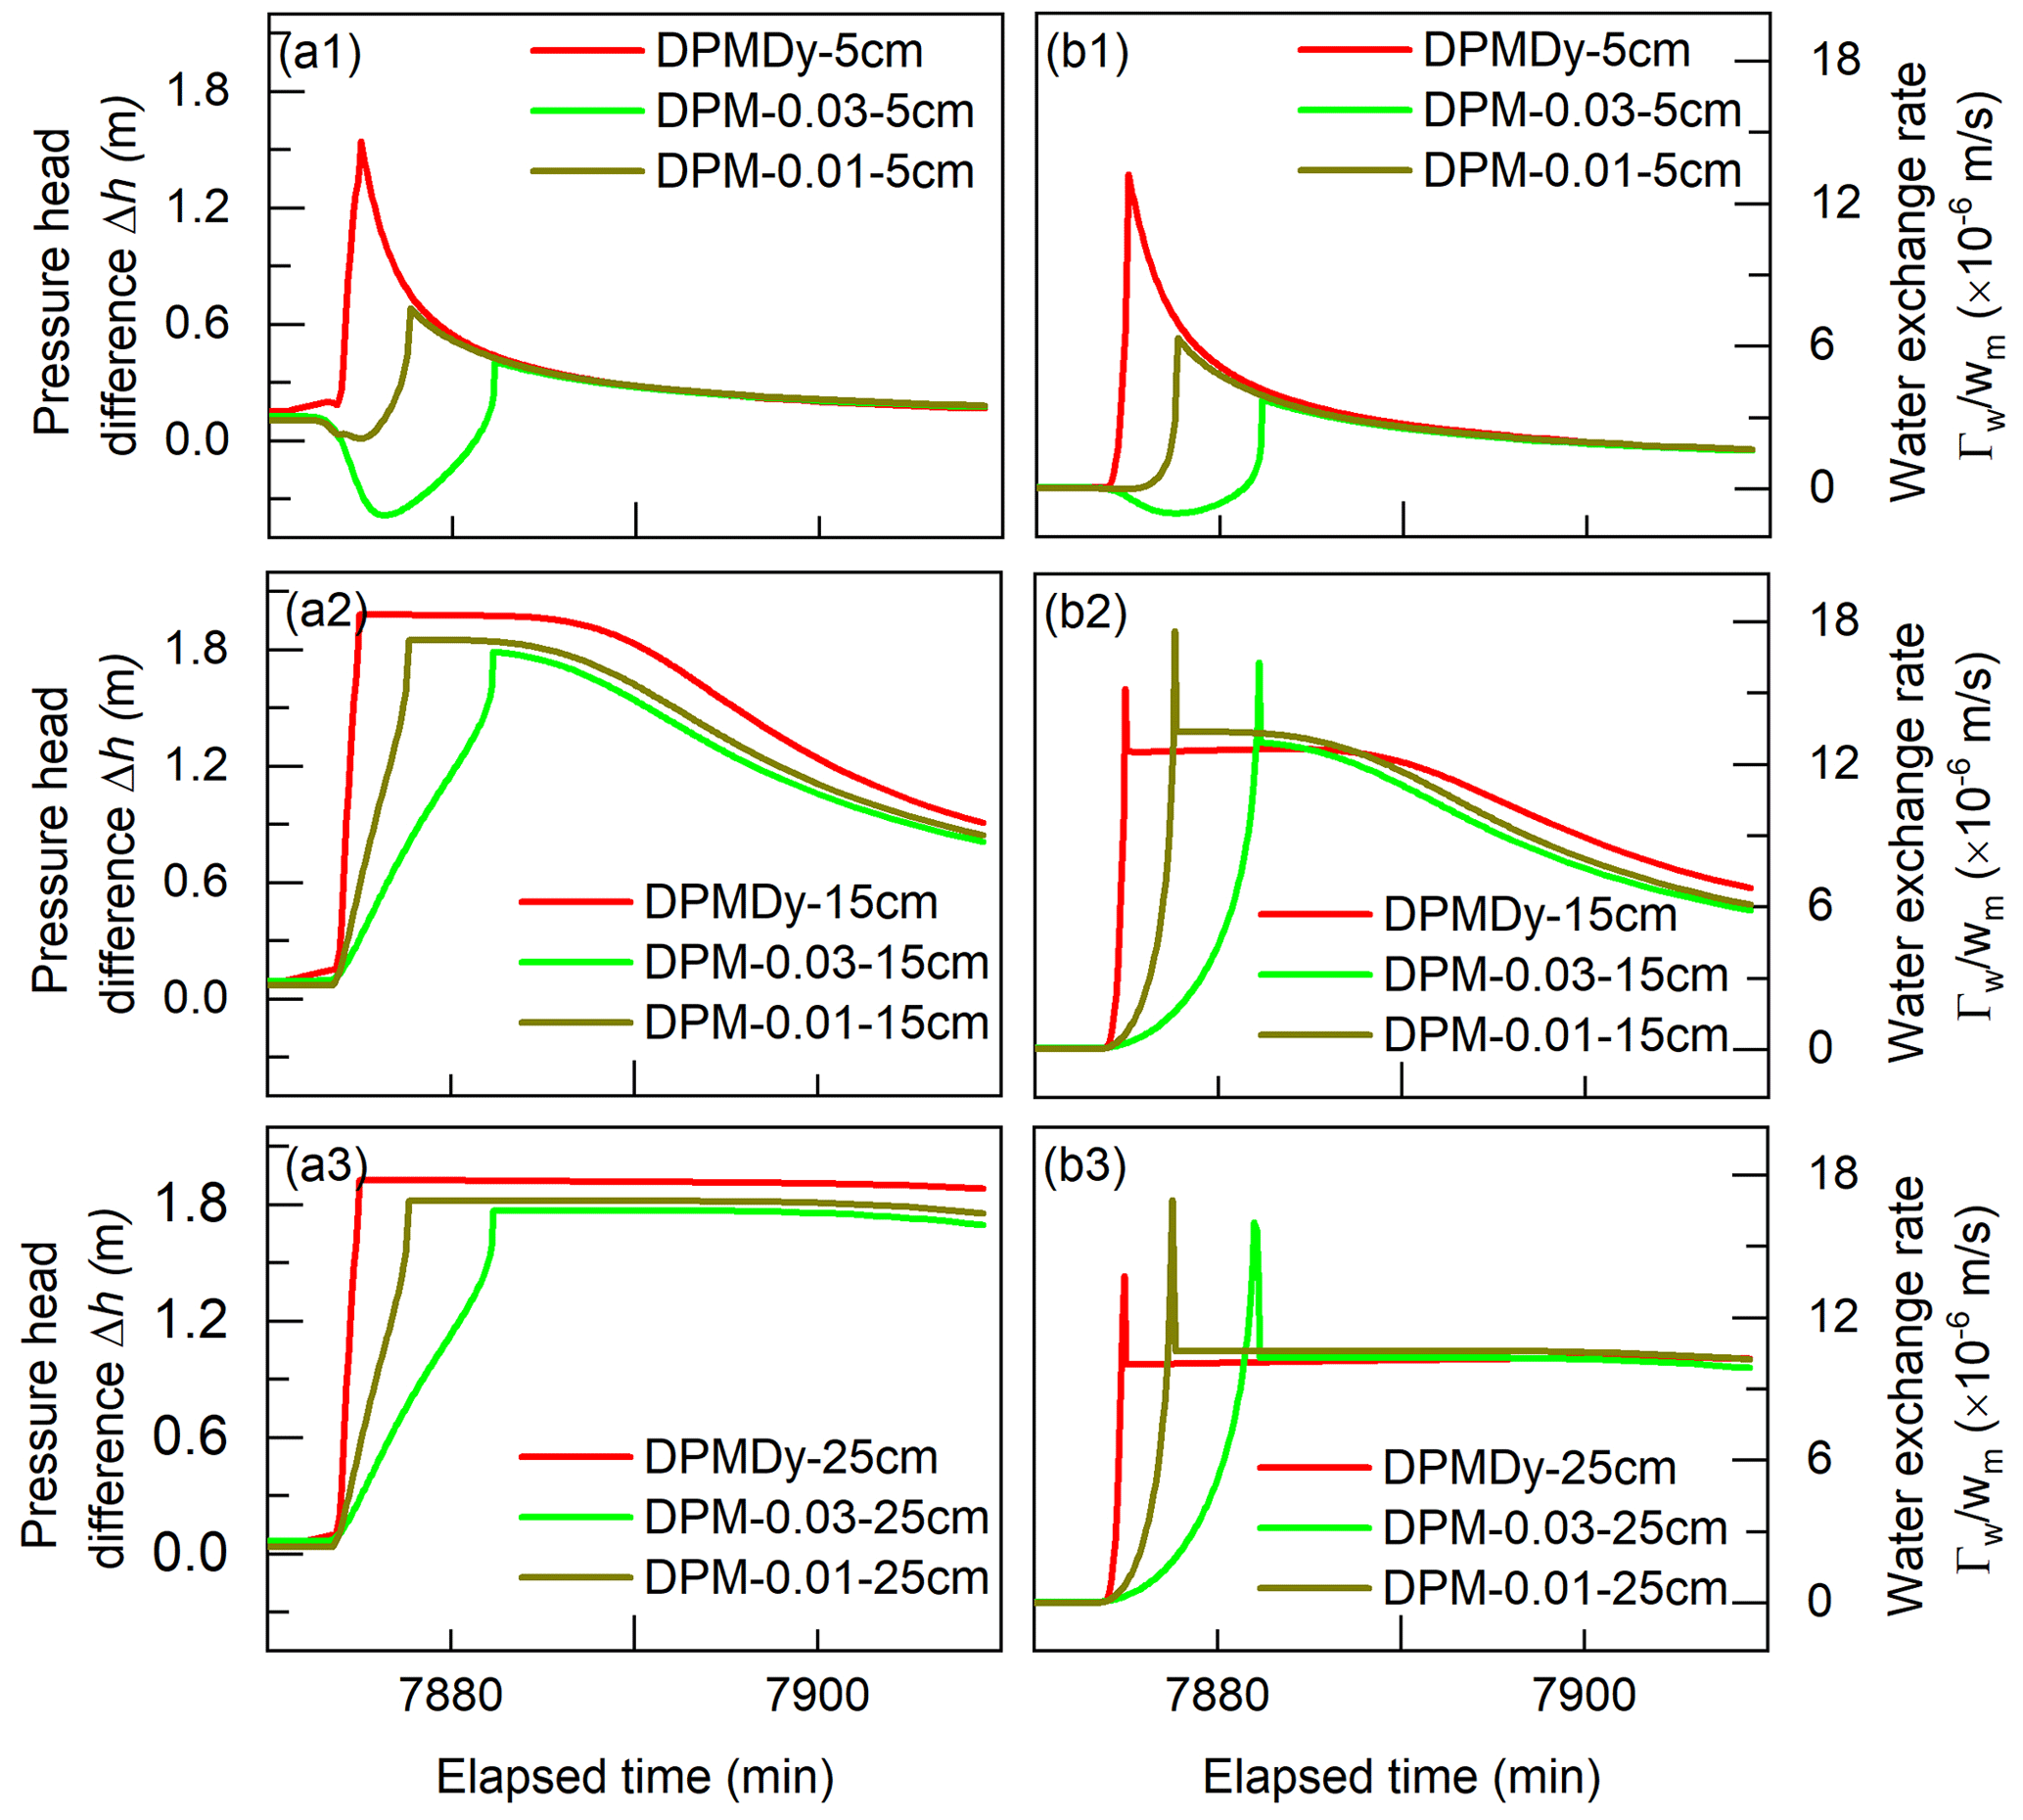
Figure 18Pressure head difference (a1–a3) and water exchange rate (b1–b3) between the two domains at the 5, 15 and 25 cm depths during the sixth rainfall event. The positive value of water exchange rate is for the water flowing from the crack to the matrix domain, while the negative value is for the opposite direction.
As shown in Fig. 18a1–a3, Δh at all depths simulated by both the DPM and DPMDy rapidly reaches a positive peak value and gradually decreases with the rainfall process. The rapidly increasing positive value is because the crack domain reaches saturation earlier than the surrounding soil matrix due to the influx of preferential flow and the small crack storage space in this study. The decrease in the Δh is ascribed to the increase in hm with water exchanging from the crack to the matrix domain. Notably, the crack closure process during the rainfall process leads to a decrease in crack volume (or crack water storage space); the “water table” (saturated zone) in the shrinking cracks elevates faster than that in the constant larger crack volume, which means the hc simulated by DPMDy is higher than the DPM-0.01 and DPM-0.03. Consequently, the time for Δh reaching the peak value simulated by the DPMDy is the earliest at all the three depths, followed by the DPM-0.01 and DPM-0.03. The simulated by the DPMDy shows the similar trend to the Δh (Fig. 18b1–b3). During the sixth rainfall event, its cumulative at the 5, 15 and 25 cm depths is (26 %, 50 %), (10 %, 26 %) and (3 %, 14 %) larger than that of the DPM-0.01 and DPM-0.03, respectively.
This result means that the crack closure during wetting benefits the building-up process of the pressure head in the crack domain and thus can promote water exchange from the crack into the matrix domain. It corresponds to some experimental results that the PF-DC also exists and leads water to rapidly infiltrate into soils even if desiccation cracks are nearly closed (Baram et al., 2012; Greve et al., 2010; Luo et al., 2021; Sander and Gerke, 2007; Tuong et al., 1996). It also means using the DPM may overestimate the flux of PF-DC but underestimate the water exchange coming from the PF-DC. Because the experimental scale, crack ratio and depth in this study are small, the difference of simulation result involving the matric suction and water content between the DPM and DPMDy is not very significant. However, we can imagine that the deviation caused by the DPM at a larger scale will be more significant, especially in a typical shrinking–swelling soil slope under long-term WD cycles.
6.3 Model performance
We evaluated the prediction errors of different models to the measured matric suction, water content and crack ratio using a fixed slope line as the same in Sect. 5.3.2 (see Fig. A3 and Table 4). Overall, the DPMDy, which incorporates the dynamic changes of desiccation cracks and hydraulic conductivity into the dual-permeability model, has an overall better performance than the SDM and DPM, as indicated by the small intercept and high R2. With regard to the water flux, while the three models all give a good fit with the measured data, the DPM overpredicted the water flux of PF-DC but underestimated the water exchange from cracks to the soil matrix compared to other models. It implies that adopting a constant crack volume in the DPM, whether it is an average or a maximum value of the measured crack ratio, will overestimate the PF-DC, which may be unsuitable to evaluate the irrigation efficiency. With regard to the matric suction (or porewater pressure), although the SDM has good performance as the DPMDy does, it significantly underpredicted the volume water content and thus may overestimate landslide stability in a moisture-content-dependent threshold method. Further, we expect that the SDM may show much poorer performance if one applies it to scenarios where the cracks are deeper and the soil has a higher swelling–shrinking ability than that of our experiment. A comprehensive model sensitivity analysis will be conducted in our future work.
Table 4Summary of fitting performance of different models to measured data.
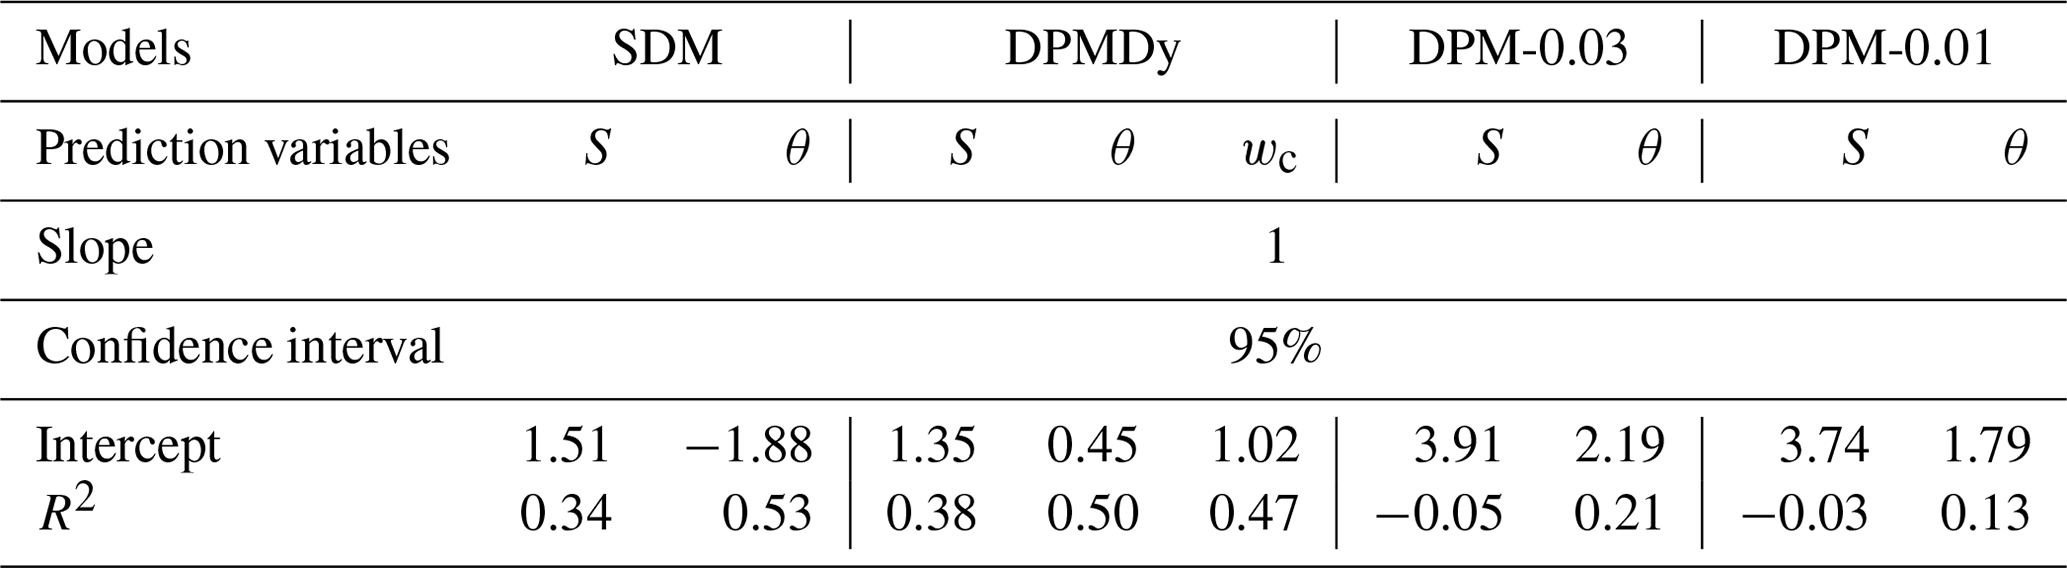
Compared to other dynamic preferential flow models, the DPMDy developed in this study also has its unique advantages. Firstly, the variation of crack volume (or crack ratio) in our model is deduced from the changes of matrix porosity due to shrinkage and thus has a universal definition. Instead, Coppola et al. (2012, 2015) linked the crack ratio to the suction head with an empirical natural logarithm function, which is not transferable to other types of soils. Secondly, the results support the suitability, in the crack domain, where capillarity has little effect, of V–G SWRC with effective parameters and a constant relative hydraulic conductivity (Kr= 1). In fact, a common defect in classical DPMs is that they often set the hydraulic conductivity of the crack domain (Kc) to vary as a function of the saturated degree calculated from the SWRC of the crack domain (i.e Eq. 25). This will lead to an unreasonable extremely low Kc in drying initial conditions (Aguilar-López et al., 2020). Setting Kr= 1 ensures that the magnitude of Kc only depends on the crack area or the saturated degree of the soil matrix domain, which provides a potential solution for remedying the shortcoming mentioned above. Thirdly, compared to some dynamic preferential flow models neglecting the water exchange between the two domains (Jamalinia et al., 2020; Kroes et al., 2000; Luo et al., 2021; Stewart, 2018) or ones adopting an arithmetic mean of hydraulic conductivity of the two domains (Coppola et al., 2012, 2015; Laine-Kaulio et al., 2014; Shao et al., 2018) that tends to overestimate the water exchange, our model tentatively adopts an improved exchange term proposed by Gerke et al. (2013), which we showed to be a logical and satisfactory improvement in simulating water exchange in our experiment.
However, in the current study, the hysteresis effect was neglected in both the soil deformation and SWRC because we assumed the soil shrinking–swelling behavior has less influence on the pore-size distribution (or SWRC shape) but more influence on the porosity (or hydraulic conductivity). This assumption inevitably caused some errors when compared to the measured water content, especially for the surficial soil layer that has been significantly affected by the WD cycles. Our future work will try to incorporate the hysteresis effect into the current model to further improve the prediction strength. In addition, we have to remind the reader again that because the shrinking–swelling model in our method is developed based on the hydrological-driven perspective, it may be more suitable in the natural soil layer where the crack pattern already has a stable state after long-term WD cycles.
This study combined an experimental study and a numerical simulation to quantify the preferential flow induced by dynamic changes of desiccation cracks (PF-DC). A soil column infiltration test under wetting–drying conditions was conducted to investigate dynamic changes of desiccation cracks and the accompanying water infiltration process. The variation of crack geometry, including crack ratio, width and depth, was measured. The soil volumetric water content, matric suction and water drainage were also monitored. A new dynamic dual-permeability model (DPMDy) was developed to account for the PF-DC, which includes physically consistent functions in describing the variation of both porosity and hydraulic conductivity in crack and matrix domains. The performance of the single-domain model (SDM), rigid dual-permeability model (DPM) and DPMDy was evaluated by comparing their simulation results to the monitoring data.
Overall, the DPMDy performed not only better in its prediction of the crack evolution and hydrological response with respect to the SDM and DPM, but it also provided much better descriptions of the underlying physics involving the PF-DC. During the drying periods, the matrix evaporation modeled by the DPMDy is lower than that of the SDM and DPM due to considering the permeability decay induced by soil shrinkage. But the crack evaporation modeled in the DPMDy approach is the highest because it managed to capture the raised crack permeability induced by drying–enlarging desiccation cracks. Compared to the DPM with a fixed crack volume, the DPMDy revealed that the crack closure process during wetting will lead to a faster pressure head building-up process in the crack domain and higher water exchange rates from the crack to the matrix domain. Additionally, using a fixed crack ratio in the DPM, whether it is the maximum or the average value from the experiment data, will overestimate the infiltration fluxes of PF-DC but underestimate its contribution to the matrix domain.
The DPMDy developed here has a physically consistent definition. It remedies the shortcomings DPM and other dynamic preferential flow models in defining the dynamic changes of desiccation cracks and hydraulic properties of the crack domain and interface. Future works should focus on considering the hysteresis effect of the SWRC during wetting–drying cycles in the model and its application to complex field situations.
Figures A1 and A2 show the temporal evolution of the measured and simulated crack ratio on the soil surface, matric suction (negative porewater pressure) and volumetric water contents at the five monitoring depths (5, 15, 25, 35 and 45 cm).
In Fig. A1a, the simulated wc,sim was not only generally close to the wc,exp in value and trend, but also it captured the transient slow decrease in wc,exp during low-evaporation periods.
In Fig. A1b–f, the matric suction (Ssim) simulated by SDM and DPMDy is close to each other and has average divergence of 2.75, 2.26 and 5.02 kPa to the measured data at the 5, 25 and 45 cm depths, respectively. The Ssim simulated by DPM has a greater average divergence of 2.78, 3.4 and 7.43 kPa to the measured data at the three corresponding depths.
In Fig. A2a–e, the volumetric water content θsim simulated by SDM was much lower than that simulated by DPMDy and DPM. In most depths (except the 5 and 45 cm depth), SDM systematically underpredicted the volumetric water content during both wetting and drying periods. By contrast, the θsim simulated by DPM-0.01 and DPM-0.03 overpredicted the volumetric water content. The DPMDy gave overall better prediction results in most depths but has significant divergences to the measured data at the depth of 5 cm, and so are the other two models.
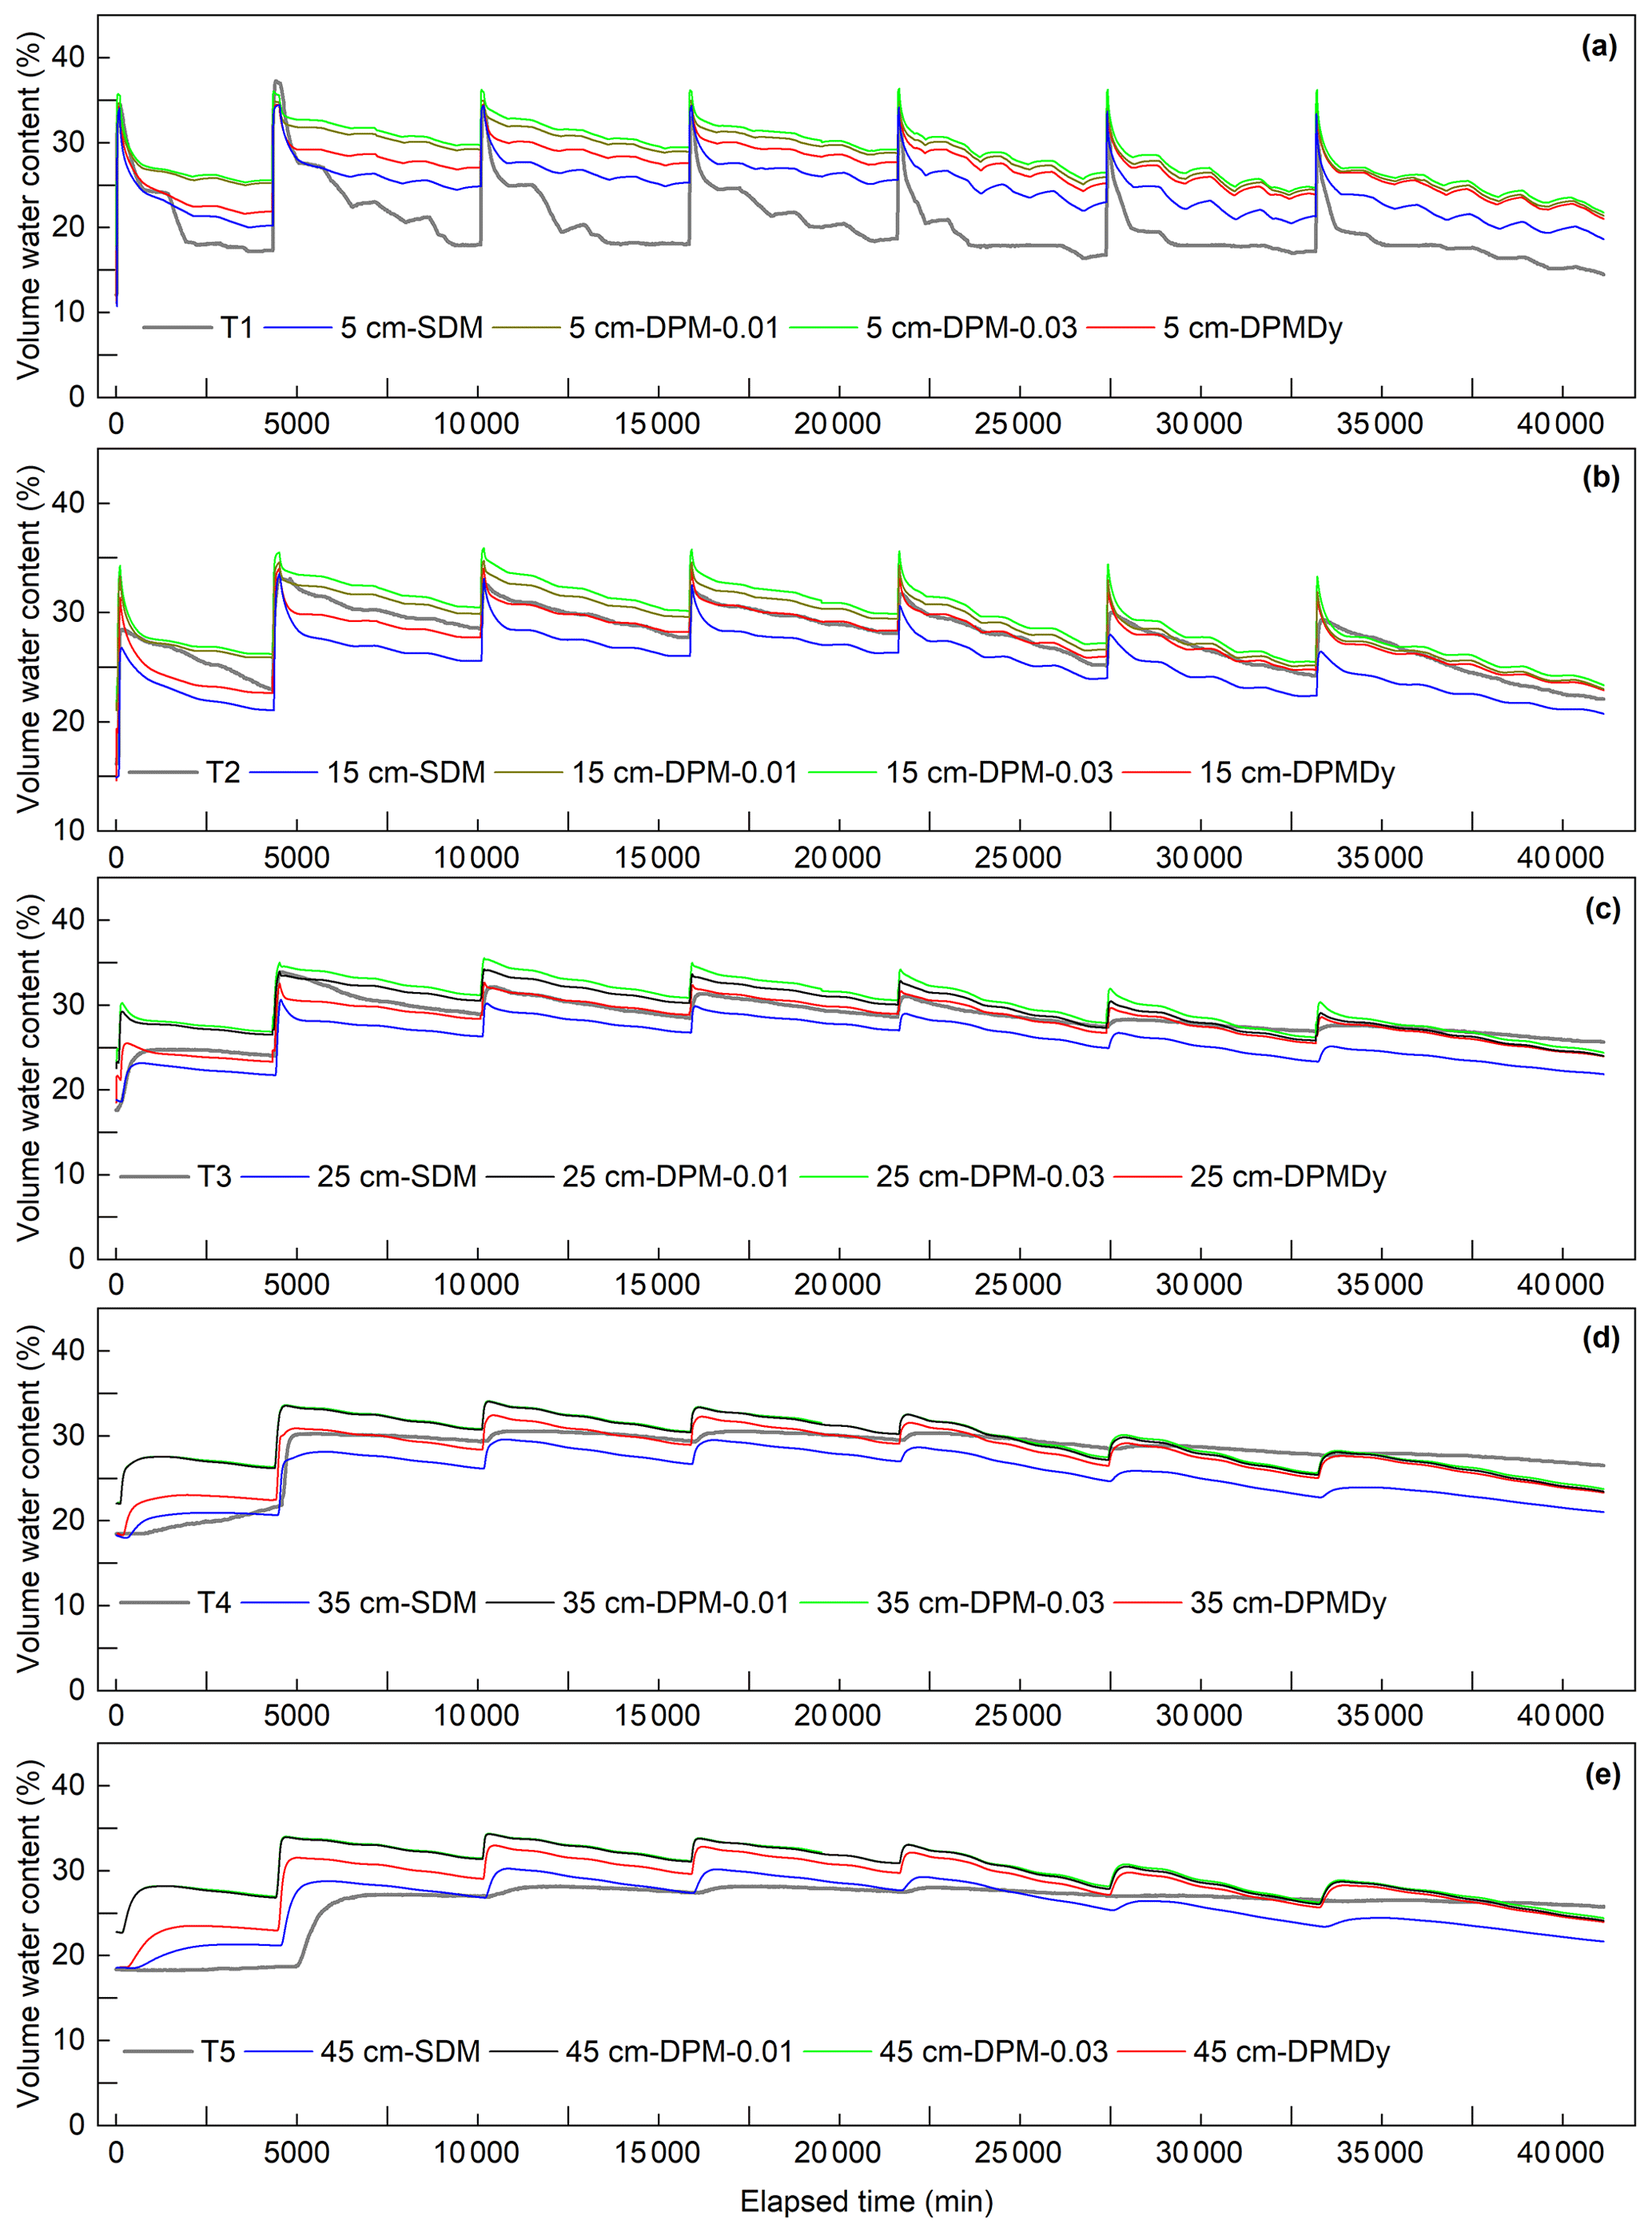
Figure A1Temporal evolution of the measured and simulated crack ratio and matric suction at different depths. (a) Measured and simulated crack ratio (dynamic DPM) on soil surface and (b–f) measured and simulated matric suction (single-domain model, DPM and dynamic DPM) at depths of 5, 15, 25, 35 and 45 cm.

Figure A2Temporal evolution of the measured and simulated volumetric water content at depths of 5, 15, 25, 35 and 45 cm. Note that the simulated volumetric water content demonstrated here is the total volumetric water content that was combined with the combined matrix and crack domains using Eq. (8).
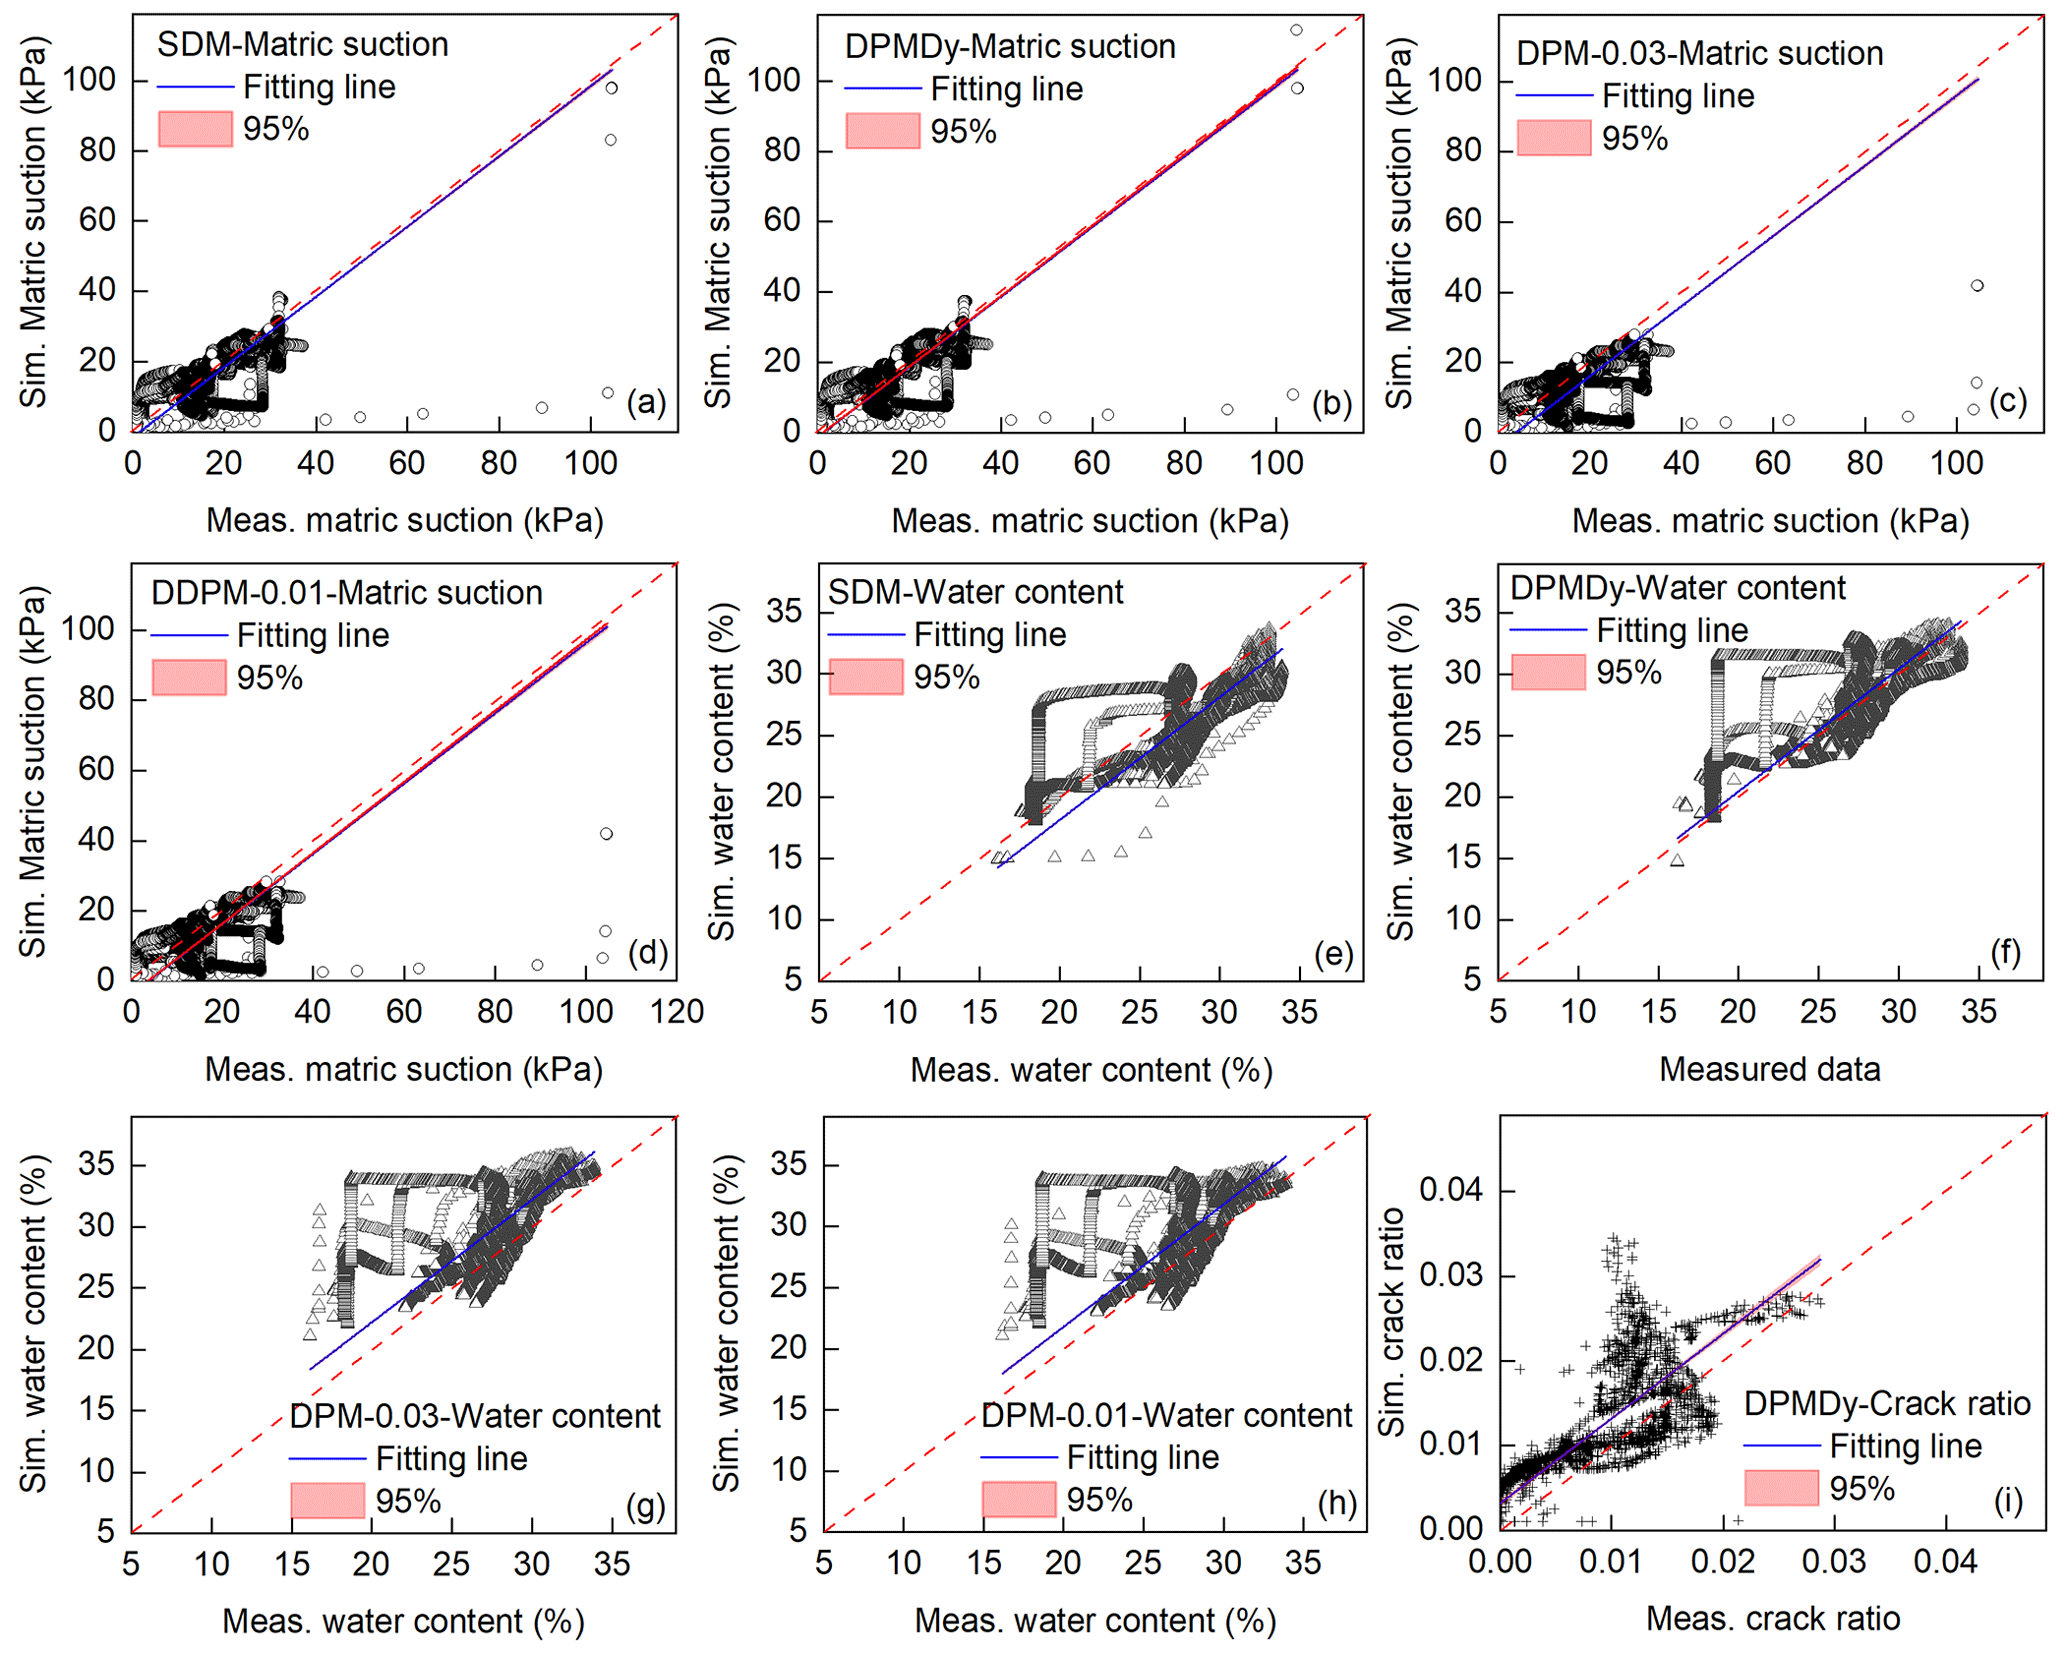
Figure A3Scatter plots of modeled vs. measured data. Panels (a), (b), (c) and (d) refer to the matric suction simulated by SDM, DPMDy, DPM-0.03 and DPM-0.01, respectively; panels (e), (f), (g) and (h) refer to the volumetric water content simulated by SDM, DPMDy, DPM-0.03 and DPM-0.01, respectively; and panel (i) refers to the crack ratio simulated by DPMDy. “Sim.” means “simulated”, and “Meas.” means “measured”.
| PF-DC | Preferential flow induced by desiccation cracks |
| SDM | Single-domain model |
| EMs | Explicit crack models |
| DPoM | Dual-porosity model |
| DPM | Rigid dual-permeability model with fixed crack ratio and hydraulic conductivity |
| DPM-0.01 | Rigid dual-permeability model with crack ratio of 0.01 |
| DPM-0.03 | Rigid dual-permeability model with crack ratio of 0.03 |
| DPMDy | Dynamic DPM with changing crack ratio and hydraulic conductivity |
| WD cycles | Wetting–drying cycles |
| θ | Total water content (combined matrix and crack domains) (m3 m−3) |
| θexp | Volumetric water content measured in the experiment (m3 m−3) |
| θm | Volumetric water content of the matrix domain (m3 m−3) |
| θc | Volumetric water content of the crack domain (m3 m−3) |
| θm,s | Saturated volumetric water content of the matrix domain (m3 m−3) |
| θm,r | Residual volumetric water content of the matrix domain (m3 m−3) |
| θc,s | Saturated volumetric water content of the crack domain (m3 m−3) |
| θc,r | Residual volumetric water content of the crack domain (m3 m−3) |
| Se,m | Saturation degree of the matrix domain (m3 m−3) |
| Se,c | Saturation degree of the crack domain (m3 m−3) |
| αm | Parameter for the van Genuchten water retention curve of the matrix domain (1 m−1) |
| nm | Parameter for the van Genuchten water retention curve of the matrix domain (1 m−1) |
| mm | Parameter for the van Genuchten water retention curve of the matrix domain (1 m−1) |
| αc | Parameter for the van Genuchten water retention curve of the crack domain (1 m−1) |
| nc | Parameter for the van Genuchten water retention curve of the crack domain (1 m−1) |
| mc | Parameter for the van Genuchten water retention curve of the crack domain (1 m−1) |
| hm | Pressure head of the matrix domain (m) |
| hc | Pressure head of the crack domain (m) |
| Cc | Specific water capacity of the crack domain, which is defined as (1 m−1) |
| Cm | Specific water capacity of the matrix domain, which is defined as (1 m−1) |
| Ks | Total transient saturated hydraulic conductivity of the soil (combined matrix and crack domains) (m s−1) |
| Kc | Transient hydraulic conductivity of the crack domain (m s−1) |
| Kc,s | Saturated hydraulic conductivity of the crack domain (m s−1) |
| The maximum crack hydraulic conductivity when the crack reaches its maximum crack aperture (m s−1) | |
| The minimum crack hydraulic conductivity when the crack reaches its minimum crack aperture (m s−1) | |
| Kc,r | Relative hydraulic conductivity of the crack domain (m3 m−3) |
| Km | Transient hydraulic conductivity of the matrix domain (m s−1) |
| Km,s | Saturated hydraulic conductivity of the matrix domain (m s−1) |
| The maximum matrix hydraulic conductivity prior to soil shrinkage (m s−1) | |
| Km,r | Relative hydraulic conductivity of the matrix domain (m3 m−3) |
| Ka | Hydraulic conductivity between the matrix and crack domains (m s−1) |
| An improved hydraulic conductivity between the matrix and crack domains reformulated by Gerke et al. (2013) (m s−1) | |
| Γw | Water exchange term between the crack and matrix domains (1 s−1) |
| wc | Crack ratio, which is defined as volumetric ratio between the crack domain and the overall soil volume (m3 m−3) |
| wc,exp | Surface crack ratio measured in the experiment (m2 m−2) |
| wj,exp | Average crack aperture (or crack width) measured in the experiment (m) |
| The maximum average crack aperture measured in the experiment (m) | |
| dmax | The maximum crack depth measured in the experiment (m) |
| wm | Volumetric ratio between the matrix domain and the overall soil volume (m3 m−3) |
| αw | Effective water transfer coefficient (1 m−2) |
| V | Total soil volume (combined matrix and crack domains) (m3) |
| Vm | Volume of the soil matrix domain (m3) |
| Vc | Volume of the crack domain (m3) |
| Vp | Total pore volume (m3) |
| Vp,m | Pore volume in the matrix domain (m3) |
| Vp,c | Pore volume in the crack domain (m3) |
| ε | Total soil porosity (combined matrix and crack domains), which is defined as (m3 m−3) |
| εm | Effective porosity of the matrix domain, which is defined as |
| εc | Effective porosity of the crack domain, which is defined as |
| i | Total effective infiltration rate (combined matrix and crack domains) (m s−1) |
| im | Effective infiltration rate of the matrix domain (m s−1) |
| ic | Effective infiltration rate of the crack domain (m s−1) |
| em | Effective evaporation rate of the matrix domain (m s−1) |
| ec | Effective evaporation rate of the crack domain (m s−1) |
| r | Rainfall intensity (m s−1) |
| AE | Actual evaporation rate (m s−1) |
| PE | Potential evaporation rate (m s−1) |
| S | Total matric suction at the soil surface (kPa) |
| Sexp | Soil matric suction measured in the experiment (kPa) |
| g | Gravitational acceleration constant (m s−2) |
| ωv | Molecular mass of water (kg mol−1) |
| ξ | Dimensional empirical parameter with a suggested value of 0.7 |
| ha | Relative humidity of soil overlying air |
| γw | Unit mass of water (kN m−3) |
| R | Universal gas constant J (mol K)−1 |
| Ts | Soil surface temperature (∘C) |
| ϕmax | Total porosity (or the maximum porosity) of a soil core prior to soil shrinkage, which is defined as and thus is equal to the ε (m3 m−3) |
| ϕmin | The minimum porosity of the matrix domain (m3 m−3) |
| ϕmatrix | Porosity of the matrix domain, which is defined as (m3 m−3) |
| ϕcrack | Porosity of the crack domain, which is defined as (m3 m−3) |
| ϕsub | Porosity of the subsidence zone, which is defined as voids induced by soil subsidence divided by the total soil volume (m3 m−3) |
| U | A unified water content, which is defined as the gravimetric water content u divided by its saturated value umax |
| p | Functional shape parameters of the soil shrinkage curve |
| q | Functional shape parameters of the soil shrinkage curve |
| v | Water kinematic viscosity (m2 s−1) |
| tp | Beginning of ponding time after each rainfall event (min) |
| Δh | Pressure difference between the crack and matrix domains, which is defined as hc−hm |
The source code and the data generated from this study are available from the corresponding author upon reasonable request.
YL: conceptualization, methodology, investigation and writing (original draft preparation). JZ: supervision, writing (review and editing) and project administration. ZZ: resources, software and investigation. JPAL: writing (review and editing). RG: writing (review and editing). TB: supervision, writing (review and editing) and funding acquisition.
At least one of the (co-)authors is a member of the editorial board of Hydrology and Earth System Sciences. The peer-review process was guided by an independent editor, and the authors also have no other competing interests to declare.
Publisher’s note: Copernicus Publications remains neutral with regard to jurisdictional claims in published maps and institutional affiliations.
This paper was written during the visiting research exchange of Yi Luo at TU Delft in summer 2022. The experiment was conducted from January to March 2022 in China. Ming-jian Hu and his research group are thanked for their great help in providing TDR probes. Yi Luo's Chinese colleagues Yuhao Li, Zhan Yang, Xiang Li and Zijian Shen are thanked for their contribution to the experiment monitoring. The authors would also like to thank the editor and anonymous reviewers for their valuable comments that substantially improved this paper.
This work was financially supported by the National Natural Science Foundation of China (grant no. 42177166) and the Fundamental Research Funds for National University, China University of Geosciences (Wuhan). It was also partially funded by the Plan of Anhui Province Transport Technology Progress (grant no. 2018030) and the Engineering Research Center of Rock-Soil Drilling & Excavation and Protection, Ministry of Education (grant no. 202210).
This paper was edited by Alberto Guadagnini and reviewed by two anonymous referees.
Aguilar-López, J. P., Bogaard, T. A., and Gerke, H. H.: Dual-Permeability Model Improvements for Representation of Preferential Flow in Fractured Clays, Water Resour. Res., 56, e2020WR027304, https://doi.org/10.1029/2020wr027304, 2020.
Arora, B., Mohanty, B. P., and McGuire, J. T.: Inverse estimation of parameters for multidomain flow models in soil columns with different macropore densities, Water Resour. Res., 47, W04512, https://doi.org/10.1029/2010WR009451, 2011.
Baram, S., Kurtzman, D., and Dahan, O.: Water percolation through a clayey vadose zone, J. Hydrol., 424–425, 165–171, https://doi.org/10.1016/j.jhydrol.2011.12.040, 2012.
Baram, S., Ronen, Z., Kurtzman, D., Külls, C., and Dahan, O.: Desiccation-crack-induced salinization in deep clay sediment, Hydrol. Earth Syst. Sci., 17, 1533–1545, https://doi.org/10.5194/hess-17-1533-2013, 2013.
Bauerle, T. L., Richards, J. H., Smart, D. R., and Eissenstat, D. M.: Importance of internal hydraulic redistribution for prolonging the lifespan of roots in dry soil, Plant Cell Environ., 31, 177–186, https://doi.org/10.1111/j.1365-3040.2007.01749.x, 2008.
Bogaard, T. A. and Greco, R.: Landslide hydrology: from hydrology to pore pressure, WIREs Water, 3, 439–459, https://doi.org/10.1002/wat2.1126, 2015.
Caris, J. P. T. and Van Asch, T. W. J.: Geophysical, geotechnical and hydrological investigations of a small landslide in the French Alps, Eng. Geol., 31, 249–276, https://doi.org/10.1016/0013-7952(1)90011-9, 1991.
Chaduvula, U., Viswanadham, B. V. S., and Kodikara, J.: Centrifuge model studies on desiccation cracking behaviour of fiber-reinforced expansive clay, Geotext. Geomembranes., 50, 480–497, https://doi.org/10.1016/j.geotexmem.2022.02.001, 2022.
Chen, C., Roseberg, R. J., and Selker, J. S.: Using microsprinkler irrigation to reduce leaching in a shrink/swell clay soil, Agr. Water Manage., 54, 159–171, https://doi.org/10.1016/s0378-3774(01)00150-0, 2002.
Cheng, Q., Tang, C.-S., Xu, D., Zeng, H., and Shi, B.: Water infiltration in a cracked soil considering effect of drying-wetting cycles, J. Hydrol., 593, 125640, https://doi.org/10.1016/j.jhydrol.2020.125640, 2021.
Chui, T. F. M. and Freyberg, D. L.: Implementing Hydrologic Boundary Conditions in a Multiphysics Model, J. Hydrol. Eng., 14, 1374–1377, https://doi.org/10.1061/(asce)he.1943-5584.0000113, 2009.
Coppola, A., Gerke, H. H., Comegna, A., Basile, A., and Comegna, V.: Dual-permeability model for flow in shrinking soil with dominant horizontal deformation, Water Resour. Res., 48, W08527, https://doi.org/10.1029/2011wr011376, 2012.
Coppola, A., Comegna, A., Dragonetti, G., Gerke, H. H., and Basile, A.: Simulated Preferential Water Flow and Solute Transport in Shrinking Soils, Vadose Zone J., 14, 1–22, https://doi.org/10.2136/vzj2015.02.0021, 2015.
Davidson, M. R.: A Green-Ampt Model of infiltration in a cracked soil, Water Resour. Res., 20, 1685–1690, https://doi.org/10.1029/WR020i011p01685, 1984.
Dusek, J., Gerke, H. H., and Vogel, T.: Surface Boundary Conditions in Two-Dimensional Dual-Permeability Modeling of Tile Drain Bromide Leaching, Vadose Zone J., 7, 1287–1301, https://doi.org/10.2136/vzj2007.0175, 2008.
Favre, F., Boivin, P., and Wopereis, M. C. S.: Water movement and soil swelling in a dry, cracked Vertisol, Geoderma, 78, 113–123, https://doi.org/10.1016/s0016-7061(97)00030-x, 1997.
Gerke, H. H. and Maximilian Köhne, J.: Dual-permeability modeling of preferential bromide leaching from a tile-drained glacial till agricultural field, J. Hydrol., 289, 239–257, https://doi.org/10.1016/j.jhydrol.2003.11.019, 2004.
Gerke, H. H. and van Genuchten, M. T.: A dual-porosity model for simulating the preferential movement of water and solutes in structured porous media, Water Resour. Res., 29, 305–319, https://doi.org/10.1029/92wr02339, 1993a.
Gerke, H. H. and van Genuchten, M. T.: Evaluation of a first-order water transfer term for variably saturated dual-porosity flow models, Water Resour. Res., 29, 1225–1238, https://doi.org/10.1029/92wr02467, 1993b.
Gerke, H. H., Dusek, J., and Vogel, T.: Solute Mass Transfer Effects in Two-Dimensional Dual-Permeability Modeling of Bromide Leaching From a Tile-Drained Field, Vadose Zone J., 12, 1–21, https://doi.org/10.2136/vzj2012.0091, 2013.
Germann, P. F. and Karlen, M.: Viscous-Flow Approach to In Situ Infiltration and In Vitro Saturated Hydraulic Conductivity Determination, Vadose Zone J., 15, 1–15, https://doi.org/10.2136/vzj2015.05.0065, 2016.
Greco, R.: Preferential flow in macroporous swelling soil with internal catchment: model development and applications, J. Hydrol., 269, 150–168, https://doi.org/10.1016/s0022-1694(02)00215-9, 2002.
Greve, A., Andersen, M. S., and Acworth, R. I.: Investigations of soil cracking and preferential flow in a weighing lysimeter filled with cracking clay soil, J. Hydrol., 393, 105–113, https://doi.org/10.1016/j.jhydrol.2010.03.007, 2010.
Hendrickx, J. M. H. and Flury, M.: Conceptual Models of Flow and Transport in the Fractured Vadose Zone, in: Panel on Conceptual Models of Flow and Transport in the Fractured Vadose Zone, National Academy Press, Washington D.C., 149–187, ISBN 0-309-50130-X, 392 pp., 2001.
Jamalinia, E., Vardon, P. J., and Steele-Dunne, S. C.: The impact of evaporation induced cracks and precipitation on temporal slope stability, Comput. Geotech., 122, 103506, https://doi.org/10.1016/j.compgeo.2020.103506, 2020.
Jarvis, N., Koestel, J., and Larsbo, M.: Understanding Preferential Flow in the Vadose Zone: Recent Advances and Future Prospects, Vadose Zone J., 15, 1–11, https://doi.org/10.2136/vzj2016.09.0075, 2016.
Khan, M. S., Hossain, S., Ahmed, A., and Faysal, M.: Investigation of a shallow slope failure on expansive clay in Texas, Eng. Geol., 219, 118–129, https://doi.org/10.1016/j.enggeo.2016.10.004, 2017.
Krisnanto, S., Rahardjo, H., Fredlund, D. G., and Leong, E. C.: Water content of soil matrix during lateral water flow through cracked soil, Eng. Geol., 210, 168–179, https://doi.org/10.1016/j.enggeo.2016.06.012, 2016.
Kroes, J. G., Wesseling, J. G., and Van Dam, J. C.: Integrated modelling of the soil – water – atmosphere – plantsystem using the model SWAP 2.0 an overview of theory andan application, Hydrol. Process., 14, 1993–2002, 2000.
Kurtzman, D. and Scanlon, B. R.: Groundwater Recharge through Vertisols: Irrigated Cropland vs. Natural Land, Israel, Vadose Zone J., 10, 662–674, https://doi.org/10.2136/vzj2010.0109, 2011.
Laine-Kaulio, H., Backnäs, S., Karvonen, T., Koivusalo, H., and McDonnell, J. J.: Lateral subsurface stormflow and solute transport in a forested hillslope: A combined measurement and modeling approach, Water Resour. Res., 50, 8159–8178, https://doi.org/10.1002/2014wr015381, 2014.
Larsbo, M. and Jarvis, N. J.: MACRO5.0. A model of water flow and solute transport in macroporous soil, Technical description, https://www.slu.se/globalassets/ew/org/centrb/ckb/modeller_dokument/macro-5.0-technical-report-2003.pdf (last access: 7 February 2023), 2003.
Lepore, B. J., Morgan, C. L. S., Norman, J. M., and Molling, C. C.: A Mesopore and Matrix infiltration model based on soil structure, Geoderma, 152, 301–313, https://doi.org/10.1016/j.geoderma.2009.06.016, 2009.
Liu, C.-W., Cheng, S.-W., Yu, W.-S., and Chen, S.-K.: Water infiltration rate in cracked paddy soil, Geoderma, 117, 169–181, https://doi.org/10.1016/s0016-7061(03)00165-4, 2003.
Luo, Y., Zhang, J.-m., Zhou, Z., Shen, Z.-j., Chong, L., and Victor, C.: Investigation and prediction of water infiltration process in cracked soils based on a full-scale model test, Geoderma, 400, 115111, https://doi.org/10.1016/j.geoderma.2021.115111, 2021.
Mooney, S. J. and Morris, C.: A morphological approach to understanding preferential flow using image analysis with dye tracers and X-ray Computed Tomography, Catena, 73, 204–211, https://doi.org/10.1016/j.catena.2007.09.003, 2008.
Mualem, Y.: A new model for predicting the hydraulic conductivity of unsaturated porous media, Water Resour. Res., 12, 513–522, https://doi.org/10.1029/WR012i003p00513, 1976.
Nimmo, J. R.: Theory for Source-Responsive and Free-Surface Film Modeling of Unsaturated Flow, Vadose Zone J., 9, 295–306, https://doi.org/10.2136/vzj2009.0085, 2010.
Nimmo, J. R., Perkins, K. S., Plampin, M. R., Walvoord, M. A., Ebel, B. A., and Mirus, B. B.: Rapid-Response Unsaturated Zone Hydrology: Small-Scale Data, Small-Scale Theory, Big Problems, Front. Earth Sci., 9, 613564, https://doi.org/10.3389/feart.2021.613564, 2021.
Pei, P., Zhao, Y., Ni, P., and Mei, G.: A protective measure for expansive soil slopes based on moisture content control, Eng. Geol., 269, 105527, https://doi.org/10.1016/j.enggeo.2020.105527, 2020.
Peron, H., Hueckel, T., Laloui, L., and Hu, L. B.: Fundamentals of desiccation cracking of fine-grained soils: experimental characterisation and mechanisms identification, Can. Geotech. J., 46, 1177–1201, https://doi.org/10.1139/t09-054, 2009.
Richards, J. H. and Caldwell, M. M.: Hydraulic lift: Substantial nocturnal water transport between soil layers by Artemisia tridentata roots, Oecologia, 73, 486–489, https://doi.org/10.1007/BF00379405, 1987.
Sander, T. and Gerke, H. H.: Preferential Flow Patterns in Paddy Fields Using a Dye Tracer, Vadose Zone J., 6, 105–115, https://doi.org/10.2136/vzj2006.0035, 2007.
Schlögl, J., Wimmer, B., Cramaro, L., Wirsching, J., Poll, C., Pagel, H., Kandeler, E., Huhn, C., Griebler, C., Stumpp, C., and Haderlein, S. B.: Heavy rainfall following a summer drought stimulates soil redox dynamics and facilitates rapid and deep translocation of glyphosate in floodplain soils, Environ. Sci. Process. Impacts, 24, 825–838, https://doi.org/10.1039/d1em00527h, 2022.
Shao, W., Bogaard, T. A., Bakker, M., and Greco, R.: Quantification of the influence of preferential flow on slope stability using a numerical modelling approach, Hydrol. Earth Syst. Sci., 19, 2197–2212, https://doi.org/10.5194/hess-19-2197-2015, 2015.
Shao, W., Yang, Z., Ni, J., Su, Y., Nie, W., and Ma, X.: Comparison of single- and dual-permeability models in simulating the unsaturated hydro-mechanical behavior in a rainfall-triggered landslide, Landslides, 15, 2449–2464, https://doi.org/10.1007/s10346-018-1059-0, 2018.
Šimùnek, J., Jarvis, N. J., van Genuchten, M. T., and Gärdenäs, A.: Review and comparison of models for describing non-equilibrium and preferential flow and transport in the vadose zone, J. Hydrol., 272, 14–35, https://doi.org/10.1016/s0022-1694(02)00252-4, 2003.
Smith, R. J., Raine, S. R., and Minkevich, J.: Irrigation application efficiency and deep drainage potential under surface irrigated cotton, Agr. Water Manage., 71, 117–130, https://doi.org/10.1016/j.agwat.2004.07.008, 2005.
Snow, D. T.: A parallel plate model of fractured permeable media, University of California, Berkeley ProQuest Dissertations Publishing, https://www.proquest.com/openview/083167b0b929ebc8e8a2a944692070ec/1?pq-origsite=gscholar&cbl=18750&diss=y (last access: 7 February 2023), 1965.
Song, L., Li, J., Garg, A., and Mei, G.: Experimental study on water exchange between crack and clay matrix, Geomech. Eng., 14, 283–291, https://doi.org/10.12989/gae.2018.14.3.283, 2018.
Stewart, R. D.: A Dynamic Multidomain Green-Ampt Infiltration Model, Water Resour. Res., 54, 6844–6859, https://doi.org/10.1029/2018wr023297, 2018.
Stewart, R. D.: A Generalized Analytical Solution for Preferential Infiltration and Wetting, Vadose Zone J., 18, 1–10, https://doi.org/10.2136/vzj2018.08.0148, 2019.
Stewart, R. D., Rupp, D. E., Abou Najm, M. R., and Selker, J. S.: A Unified Model for Soil Shrinkage, Subsidence, and Cracking, Vadose Zone J., 15, 1–15, https://doi.org/10.2136/vzj2015.11.0146, 2016a.
Stewart, R. D., Abou Najm, M. R., Rupp, D. E., and Selker, J. S.: Modeling multidomain hydraulic properties of shrink-swell soils, Water Resour. Res., 52, 7911–7930, https://doi.org/10.1002/2016wr019336, 2016b.
Tian, B.-G., Cheng, Q., Tang, C.-S., Zeng, H., Xu, J.-j., and Shi, B.: Effects of compaction state on desiccation cracking behaviour of a clayey soil subjected to wetting-drying cycles, Eng. Geol., 302, 106650, https://doi.org/10.1016/j.enggeo.2022.106650, 2022.
Tichavsky, R., Ballesteros-Canovas, J. A., Silhan, K., Tolasz, R., and Stoffel, M.: Dry Spells and Extreme Precipitation are The Main Trigger of Landslides in Central Europe, Sci. Rep.-UK, 9, 14560, https://doi.org/10.1038/s41598-019-51148-2, 2019.
Tuong, T. P., Cabangon, R. J., and Wopereis, M. C. S.: Quantifying Flow Processes during Land Soaking of Cracked Rice Soils, Soil Sci. Soc. Am. J., 60, 872–879, https://doi.org/10.2136/sssaj1996.03615995006000030028x, 1996.
van Genuchten, M. T.: A Closed-form Equation for Predicting the Hydraulic Conductivity of Unsaturated Soils, Soil Sci. Soc. Am. J., 44, 892–898, https://doi.org/10.2136/sssaj1980.03615995004400050002x, 1980.
van Genuchten, M. T. and Wierenga, P. J.: Mass Transfer Studies in Sorbing Porous Media I. Analytical Solutions, Soil Sci. Soc. Am. J., 40, 473–480, https://doi.org/10.2136/sssaj1976.03615995004000040011x, 1976.
Vervoort, R. W., Silburn, M., and Kirby, M.: Near surface water balance in the Northern Murray-Darling Basin, Water Sci. Technol., 48, 207–214, https://doi.org/10.2166/wst.2003.0442, 2003.
Vogel, T., Gerke, H. H., Zhang, R., and Van Genuchten, M. T.: Modeling flow and transport in a two-dimensional dual-permeability system with spatially variable hydraulic properties, J. Hydrol., 238, 78–89, https://doi.org/10.1016/s0022-1694(00)00327-9, 2000.
Wang, C., Zhang, Z.-y., Fan, S.-m., Mwiya, R., and Xie, M.-x.: Effects of straw incorporation on desiccation cracking patterns and horizontal flow in cracked clay loam, Soil Till. Res., 182, 130-143, https://doi.org/10.1016/j.still.2018.04.006, 2018.
Wang, Z., Liu, J., Hamoud, Y. A., Wang, Y., Qiu, R., Agathokleous, E., Hong, C., and Shaghaleh, H.: Natural 15N abundance as an indicator of nitrogen utilization efficiency in rice under alternate wetting and drying irrigation in soils with high clay contents, Sci. Total Environ., 838, 156528, https://doi.org/10.1016/j.scitotenv.2022.156528, 2022.
Weiler, M.: An infiltration model based on flow variability in macropores: development, sensitivity analysis and applications, J. Hydrol., 310, 294–315, https://doi.org/10.1016/j.jhydrol.2005.01.010, 2005.
Wen, T., Wang, P., Shao, L., and Guo, X.: Experimental investigations of soil shrinkage characteristics and their effects on the soil water characteristic curve, Eng. Geol., 284, 106035, https://doi.org/10.1016/j.enggeo.2021.106035, 2021.
Wilson, G. W., Fredlund, D. G., and Barbour, S. L.: The effect of soil suction on evaporative fluxes from soil surfaces, Can. Geotech. J., 34, 145–155, https://doi.org/10.1139/t96-078, 1997.
Xie, C., Ni, P., Xu, M., Mei, G., and Zhao, Y.: Combined measure of geometry optimization and vegetation for expansive soil slopes, Comput. Geotech., 123, 103588, https://doi.org/10.1016/j.compgeo.2020.103588, 2020.
Xu, J.-J., Tang, C.-S., Cheng, Q., Xu, Q.-l., Inyang, H. I., Lin, Z.-Y., and Shi, B.: Investigation on desiccation cracking behavior of clayey soils with a perspective of fracture mechanics: a review, J. Soils Sediments, 22, 859–888, https://doi.org/10.1007/s11368-021-03082-y, 2021.
Xu, J.-J., Tang, C.-S., Cheng, Q., Vahedifard, F., Liu, B., and Shi, B.: Monitoring and early detection of soil desiccation cracking using distributed fibre optical sensing, Géotechnique, 1–12, https://doi.org/10.1680/jgeot.21.00397, 2022.
Zhang, J., Luo, Y., Zhou, Z., Victor, C., and Duan, M.: Research on the rainfall-induced regional slope failures along the Yangtze River of Anhui, China, Landslides, 18, 1801–1821, https://doi.org/10.1007/s10346-021-01623-7, 2021a.
Zhang, J., Luo, Y., Zhou, Z., Chong, L., Victor, C., and Zhang, Y.: Effects of preferential flow induced by desiccation cracks on slope stability, Eng. Geol., 288, 106164, https://doi.org/10.1016/j.enggeo.2021.106164, 2021b.