the Creative Commons Attribution 4.0 License.
the Creative Commons Attribution 4.0 License.
 | 02 Jan 2023
Operationalizing equity in multipurpose water systems
Guang Yang
Matteo Giuliani
Andrea Castelletti
Participatory decision-making is a well-established approach to address the increasing pressure on water systems induced by growing multi-sectoral demands and increased competition among different water users. However, most existing approaches search for system-wise efficient solutions and do not quantify their distributional effect among the stakeholders. In this work, we investigate how to operationalize equity principles to design improved water systems operations that better balance efficiency and justice. More specifically, we explore the extent to which the inclusion of equity principles reshapes the space of efficient solutions. Numerical experiments are conducted on the Lake Como system, Italy, operated primarily for flood control and irrigation water supply while also providing recreation and river ecosystem services. Our results show how incorporating equity considerations into the design of water system operations enriches the solution space by generating more compromise solutions than those obtained using a traditional multi-objective optimization. Moreover, we find that including equity in the operating policy design can indirectly improve the performance of marginalized sectors, such as recreation and ecosystem, which are not explicitly considered by the current lake operation. Lastly, we illustrate how the aggregation of multi-sectoral interests into an equity index strongly shapes our results. Thus, eliciting the preference structure of stakeholders and policymakers becomes paramount for the identification of a fair balance across competing interests. This work bridges the gap between multi-objective optimization approaches and equity-informed decision-making for real-world water resources planning and management, providing an effective tool to promote efficient and equitable policies.
- Article
(8655 KB) - Full-text XML
-
Supplement
(825 KB) - BibTeX
- EndNote


Proper operation of existing water systems is widely recognized as one of the most important and cost-effective ways to improve water use efficiency and reduce stresses caused by rapid population growth and socioeconomic development (Ehsani et al., 2017; Giuliani et al., 2016a; Olsson, 2015). Water reservoirs generally serve multiple and competing purposes, including flood control, irrigation, power generation, navigation, and river ecosystem maintenance, but limited water resources make it impossible to fully and simultaneously satisfy all of these water users (Billington and Jackson, 2006; Groenfeldt, 2019). At the same time, growing energy and food demands are putting additional pressure on these systems and are exacerbating conflicts (Ehsani et al., 2017; Giuliani et al., 2016a; Olsson, 2015), which are often related to emerging adverse social and environmental consequences caused by water infrastructure (Graham et al., 2020; Poff et al., 2016; Poff and Schmidt, 2016; Sabo et al., 2017; Schmitt et al., 2018) and to water security (D'Odorico et al., 2018; Liu et al., 2018; Scanlon et al., 2017). These challenges represent a well-established topic in the water systems analysis community since the Harvard Water Program (Maass et al., 1962), promoting the idea of adopting a posteriori decision-making based on trade-off analysis between competing objectives (Cohon and Marks, 1975; Maier et al., 2014; Nicklow et al., 2010; Reed et al., 2013).
Traditionally, water system operations are formulated as multi-objective decision-making problems, and the underlying conflicts among objectives capturing the interests of different stakeholders yield a set of Pareto-optimal (or efficient) solutions rather than a single optimal solution (Loucks and Van Beek, 2017). A solution is defined as being Pareto optimal (or non-dominated) if no other solution gives a better value for one objective without degrading the performance in at least one other objective. In this context, most existing approaches search for the Pareto-optimal set to explore trade-offs between operating objectives (Geressu and Harou, 2019; Giuliani et al., 2014; Kasprzyk et al., 2009; Schmitt et al., 2018). However, Pareto optimality pursues system-wise efficiency and ignores the distributional effects of the optimal solutions among the different stakeholders, potentially resulting in inequitable outcomes. Here, equity is defined as “the provision of a consistent minimum quality and quantity, determined at the local level, of water services to all end-users” (Osman and Faust, 2021). The potential inconsistency between efficiency and equity might inadvertently bias the analysis on efficient but unfair solutions that the stakeholders will hardly accept (Cai et al., 2002, 2003; Cai, 2008; Loucks, 1997), while including equity among the objectives can be useful to ensure that the negotiations on the solution to be implemented succeed smoothly (Jafino et al., 2021).
There is a growing interest in equity-related research in the water resources literature, with Fletcher et al. (2022) recently offering some actionable recommendations about the integration of equity into the water resources planning. For example, Wang et al. (2008) developed a cooperative water allocation model to achieve fair and efficient water allocation among competing stakeholders at the basin level. Girard et al. (2016) designed cost-effective and equitable portfolios for water resource adaptation to climate change in the Orb River basin by implementing cooperative game theory and social justice approaches. Siddiqi et al. (2018) developed a set of reliability and equity metrics to quantitatively evaluate the water security in a canal irrigation system in the Indus basin. Ciullo et al. (2020) proposed a decision criterion to account for the geographical distribution of flood risk in the transboundary area of the German–Dutch Lower Rhine River and investigate the impact of equity criteria on flood risk management. Gullotta et al. (2021) improved the equity among users of a water distribution network in northern Italy by optimizing the placement of control valves to maximize the uniformity coefficient (an equity index proposed in Gottipati and Nanduri, 2014). Kazemi et al. (2020) optimized the water allocation in the Sefidrud Basin in Iran for the maximum water use revenue and minimum Gini index (which was introduced by Gini, 1921, to measure income inequality). Although these works promote equity in water resource systems by fairly distributing benefits or risks, the impacts of equity on multi-objective decision-making and how equity affects the trade-offs between conflicting objectives have not yet been studied.
In this work, we investigate how to operationalize equity principles into the multi-objective design of improved water systems operations that better balance trade-offs among competing stakeholders' interests. The approach is demonstrated on the Lake Como system, a regulated lake in northern Italy that has historically been operated for flood protection and irrigation supply. Over the last few years, the increasing frequency and intensity of severe droughts have emphasized the importance of additional, so far marginalized services provided by the lake operations, such as preventing low lake levels in order to support recreational activities and ecosystem preservation downstream of the lake.
The paper provides two main contributions. First, we analyze alternative problem formulations to assess how the inclusion of equity principles reshapes the space of efficient solutions with respect to both a traditional optimization considering only primary objectives and an inclusive optimization that accounts for primary as well as historically marginalized objectives. Second, we explore the sensitivity of the resulting solutions with respect to the definition of the equity metric, which, in a multi-objective problem, requires the aggregation of multiple objective functions into a single index (e.g., coefficient of variation). As aggregated objective functions might adversely bias the designed alternatives in unpredictable ways (Kasprzyk et al., 2016), this is an important aspect to explore for effectively operationalizing equity in multipurpose water systems. Moreover, the aggregation of primary and marginalized objectives into an equity index makes our approach a hybrid method that blends a posteriori decision-making with an aggregated objective formulated a priori, which can become particularly promising to stretch our ability to solve multi-objective problems with high numbers of objectives.
The rest of the paper is organized as follows: Sect. 2 introduces the Lake Como study site; Sect. 3 describes the adopted methodology; the results and discussion are reported in Sect. 4; and the conclusions and final remarks are presented in Sect. 5.
Lake Como, also known as “Lario”, is the third largest lake in Italy and the fifth deepest lake in Europe; it has an active storage capacity of 254×106 m3 and a depth of over 400 m. The catchment area of Lake Como is approximately 4552 km2, with the lake serving an irrigation-fed cultivated area of about 1300 km2 (Fig. 1). The major crops within the agricultural area include cereals, maize, and temporary grasslands for livestock. The climate of Lake Como is temperate around the lake and cold in the upper Alpine catchment (Peel et al., 2007). The hydrologic regime is snow-rainfall dominated, with the dry seasons in winter and summer and the wet seasons in late-spring and autumn, respectively.

Figure 1Map of the Lake Como system in the Lombardy region, northern Italy. The map was generated via QGIS using layers from the geoportal of Regione Lombardia (http://www.geoportale.regione.lombardia.it/, last access: July 2016).
The lake's shape is close to an inverted letter “Y”, and the city Como is located on its southwestern branch. Because of the southwestern river branch terminates at a dead end and the lowest elevation on the lake shoreline is found at Como, this area is prone to flooding. Thus, the regulation of Lake Como has historically mostly been studied by looking at the conflict between irrigation water supply and flood control (Denaro et al., 2017; Giuliani et al., 2020; Guariso et al., 1986). Spring and summer snowmelt primarily creates the seasonal storage of Lake Como, which can be reallocated to satisfy the summer water demand peak for irrigation. Storing more water in spring would benefit the irrigation water supply in summer; however, this strategy could lead to high lake levels for longer periods and, thus, increase the risk of flood.
Lake Como is also a popular tourist destination because of its beautiful Alpine landscape and abundant wildlife, and it is a scenic spot for sailing, boating, and windsurfing. Interests related to ecosystems, tourism, navigation, and fishing have also been attracting more and more attention with respect to Lake Como water governance in recent years (Carvalho et al., 2019; Grizzetti et al., 2016). Accordingly, the Lake Como operation design can be formulated as a problem that involves up to four competing objectives, where recreation services (e.g., tourism and navigation) and river ecosystem maintenance downstream of the lake are added to irrigation water supply and flood control.
3.1 Model description
The model of the system reproduces the dynamics of Lake Como by using a mass-balance equation of the lake storage st (m3) assuming a modeling and decision-making time step Δt=24 h, where the lake releases are determined by the lake operating policy:
Here, qt+1 (m3 s−1) and rt+1 (m3 s−1) are the net inflow (i.e., inflow minus evaporation losses) to the lake and the actual lake release in the time period [t, t+1), respectively. Specifically, the release volume rt+1 is determined by a non-linear, stochastic function that depends on the release decision ut (Soncini-Sessa et al., 2007) and accounts for the effect of the uncertain inflows between the time t (at which the decision is made) and the time t+1 (at which the release is completed). The release rt+1 does not necessarily equal the decision ut due to existing legal and physical constraints on the lake level and release (e.g., spills and dead storage). According to the daily time step, the Adda River can be described by a plug-flow model to simulate the transfer of the lake releases from the lake outlet to the intake of the irrigation canals. The water diversions from the Adda River into the irrigation canals are regulated by the water rights of the agricultural districts.
The lake operating policies that determine the release decision ut are defined as Gaussian radial basis functions (RBFs; Buşoniu et al., 2011) as follows:
where K is the number of RBFs, ωk is the weight of the kth RBF, M is the number of input variables Xt, and ck and bk are the M-dimensional center and radius vectors of the kth RBF, respectively. Lake level ht, previous-day inflow qt, and the day of the year τt are used as input variables (i.e., ), and the number of RBFs is set to four (K=4), which proved effective in our previous works (Giuliani et al., 2016b, 2020). The final parameters vector can be summarized as ; thus, it contains 29 parameters (decision variables) to determine the release decision ut. The operating policies are then optimized using the evolutionary multi-objective direct policy search (EMODPS) method (Giuliani et al., 2016b), a reinforcement learning approach that combines direct policy search, non-linear approximating networks, and multi-objective evolutionary algorithms.
3.2 Operating objectives
Building on previous works (Galelli and Soncini-Sessa, 2010; Giuliani and Castelletti, 2016; Giuliani et al., 2016c; Zaniolo et al., 2021), we formulate the following four objectives that capture the competing interests introduced in the previous section:
- a.
Flood control – the high-level reliability (to be maximized) – which is defined as
where nF is the number of days in the evaluation horizon H during which the lake level is above a flood level threshold.
- b.
Irrigation water supply – the daily average volumetric reliability (to be maximized) – which is defined as
where Yt+1 (m3) is the daily volume of water available for irrigation, subject to the minimum environmental flow constraint to ensure adequate environmental conditions in the Adda River downstream of the abstraction point, and wt (m3) is the corresponding irrigation demand.
- c.
Recreation services – the low-level reliability (to be maximized) – which is defined as
where nR is the number of days in the evaluation horizon H during which the lake level is below a time-varying, low-level threshold equal to the 10th percentile of the historical lake level.
- d.
River ecosystem – the reliability of environmental flow (to be maximized) – which is defined as
where nE is the number of days in the evaluation horizon H during which , with and representing the mean and standard deviation, respectively, of the Adda river flow under natural conditions. It is worth noting that the ecosystem in the case study is sensitive to both high and low flows; thus, we aim at maintaining the lake release within a range approximating the natural variability instead of considering only a minimum flow threshold as traditionally done in the literature.
3.3 Operationalizing equity
The equity index considered in this study is formulated, following Siddiqi et al. (2018), as the ratio between the standard derivation (σ) and mean (μ) of the performance in the four objectives introduced in the previous section, i.e.,
The lower the value of ζ, the more equitable the solution, with low values of ζ obtained for high values of the original objectives with a limited performance dispersion across the four objective functions. When the objectives capturing diverse stakeholders' interests are expressed in different units of measure or explore different performance ranges, it could be necessary to map the original objectives into a satisfaction value by applying a value function. The latter allows for rescaling of all of the objectives into a dimensionless scale (e.g., from zero to one) by means of a linear or non-linear transformation. Assessing the equity index by computing the mean and standard deviation of satisfaction values rather than objectives is expected to improve the analysis by working on commensurable quantities.
However, the ranges of performance attained by the different sets of solutions across the four objectives could be not identical. Using the equity index directly computed by aggregating the reliability performance across the four objectives may lead to some bias in the equity assessment, especially when the minimum and maximum performance values are significantly different. For example, if the respective ranges of JF and JE are [0.7, 1.0] and [0.6, 0.9], a fair solution with 0.85 reliability in all objectives would imply that JE would be highly satisfied, as 0.85 is close to the maximum value of 0.9; conversely, the performance in JF would only be intermediate, as 0.85 is still much lower than the maximum value of 1.0. To mitigate this bias, a value function can be used to first transform each objective into a satisfaction value expressed on a dimensionless scale (e.g., from zero to one), with the equity index computed by aggregating the satisfaction values as follows:
where fF(⋅), fI(⋅), fR(⋅), and fE(⋅) are the value functions of JF, JI, JR, and JE, respectively.
To explore the sensitivity of our results with respect to the use of different value functions, we examine the impacts of adopting both a linear and a non-linear value function (see Fig. 2). The linear value function maps a performance value x to x' in the range [0, 1], where these extremes correspond to the lowest and highest values of reliability across all of the solutions, respectively. In the non-linear value function, we hypothesized a function that requires high values of JF and JI to get high values of satisfaction in these objectives because the historical operation of the Lake Como has primarily focused on flood control and irrigation water supply while accepting lower levels of reliabilities in terms of JR and JE. It should be noted that the purpose of this experiment is only to test the sensitivity of the equity index to the use of different value functions rather than capturing the preference structure of real stakeholders.
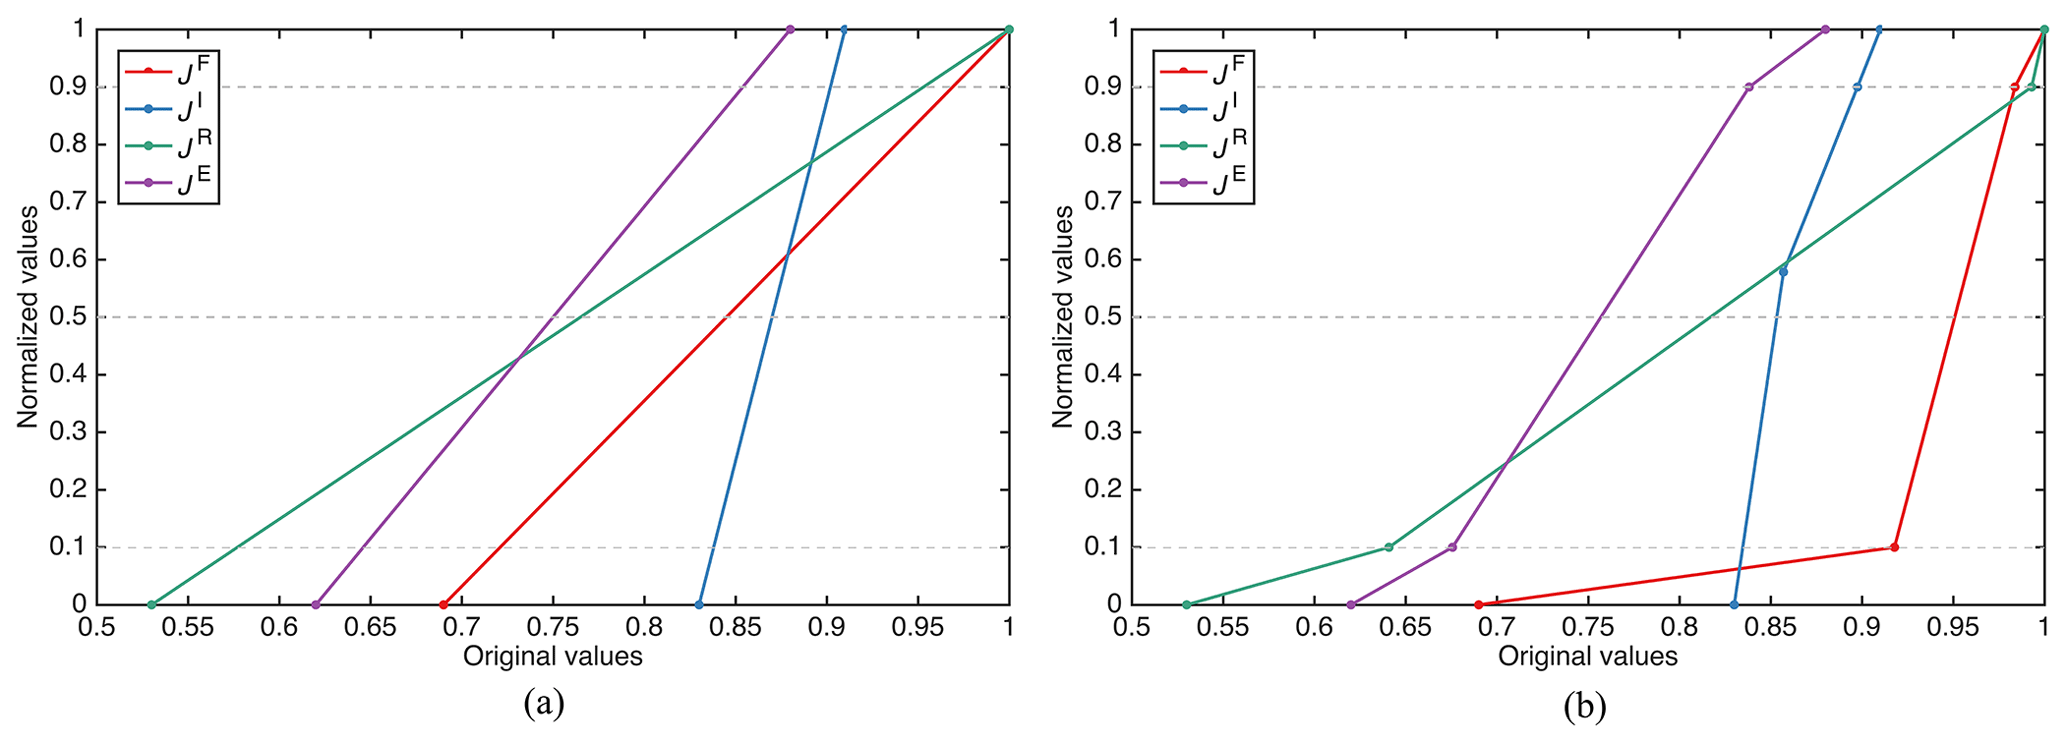
Figure 2Linear (a) and non-linear (b) value functions of JF, JI, JR, and JE in the formulation of the equity index.
3.4 Experimental settings
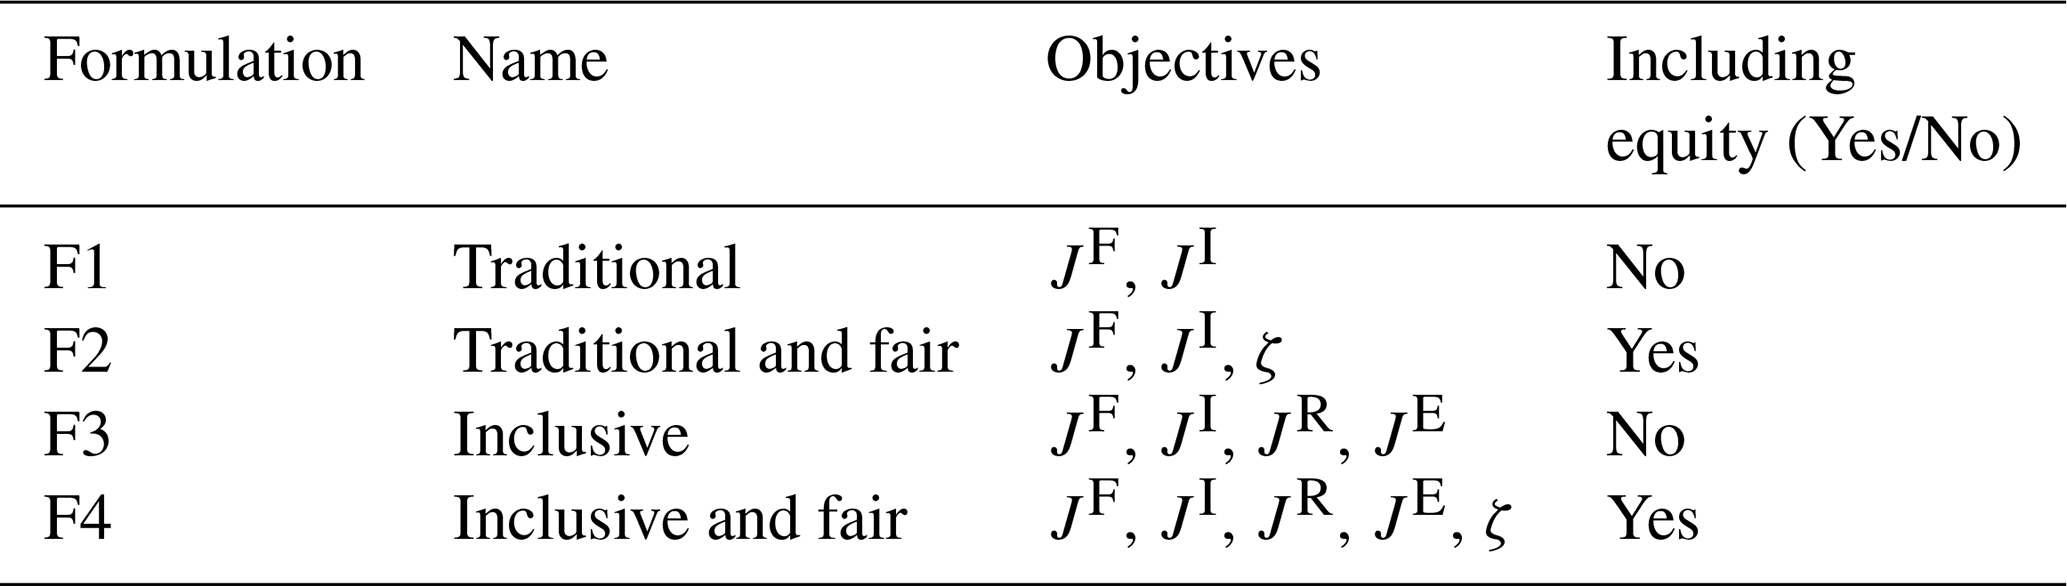
As mentioned, the Lake Como operator has traditionally considered two primary objectives: irrigation water supply and flood control. More recently, other needs such as recreation services and river ecosystem maintenance have been emerging due to increasingly frequent droughts. This motivates us to investigate how to fairly account for these previously marginalized objectives in the policy design. In this work, we contrast four rival formulations of the Lake Como EMODPS problem (Table 1) that can be summarized as follows:
-
F1, the traditional formulation, ;
-
F2, the traditional and fair formulation, ;
-
F3, the inclusive formulation, ;
-
F4, the inclusive and fair formulation, .
F1 is a traditional multi-objective optimization problem that only searches for the maximum of the two primary objectives. F3 is an inclusive optimization that instead considers all four objectives. Finally, F2 and F4 add the equity index from Eq. (8) to the traditional and inclusive formulations, respectively. While the comparison between the traditional and inclusive formulations will provide the benefit of including all objectives into the policy design, the comparison between F1 vs. F2 and F3 vs. F4 will focus on assessing the value of including an equity-related objective function in either the traditional multi-objective optimization or the inclusive optimization problems. Finally, the comparison between F2 and F3 allows one to investigate the differences between using the equity index as a means to indirectly include the traditionally marginalized objectives in the problem formulation or to formulate an inclusive optimization that directly includes all stakeholders' interests as separated objectives.
The parameters in RBFs-based policies are optimized using the Borg multi-objective evolutionary algorithm (Hadka and Reed, 2013), which has been proven to be highly robust in solving multi-objective control policy optimization problems (Salazar et al., 2016). The number of the function evaluations is 2 million, the same as in previous Lake Como operation optimization (Denaro et al., 2017). To ensure solution diversity and reduce the impact of stochastic factors on the optimal solutions, each optimization was randomly repeated 10 times (i.e., the final set of non-dominated solutions for each formulation are obtained from 10 random optimization trials). In total, the analysis comprises 80 million simulations that required approximately 600 computing hours on an Intel Xeon E5-2660 2.20 GHz with 32 processing cores and 96 GB RAM.
4.1 Multi-objective optimization and equity operationalization
The optimization results of problems F1–F4 can be evaluated in terms of four operation objectives along with the equity index using the parallel coordinates plots in Fig. 3, where each line crossing multiple axes represents one Pareto-optimal solution. The leftmost axis represents different problem formulations (e.g., the value “2” refers to F2); apart from the axis, the line color is also used to differentiate various problem formulations. The other axes represent the solution performance in terms of flood control, irrigation water supply, recreation, environment, and equity. The axis for equity is reversed to ensure that the direction of preference is always upward; thus, the ideal solution would be a horizontal line at the top of each plot. The diagonal lines between adjacent axes infer the conflicts between different objectives. The density distributions of the solutions' performance across the four formulations is illustrated in the Supplement (Fig. S1).
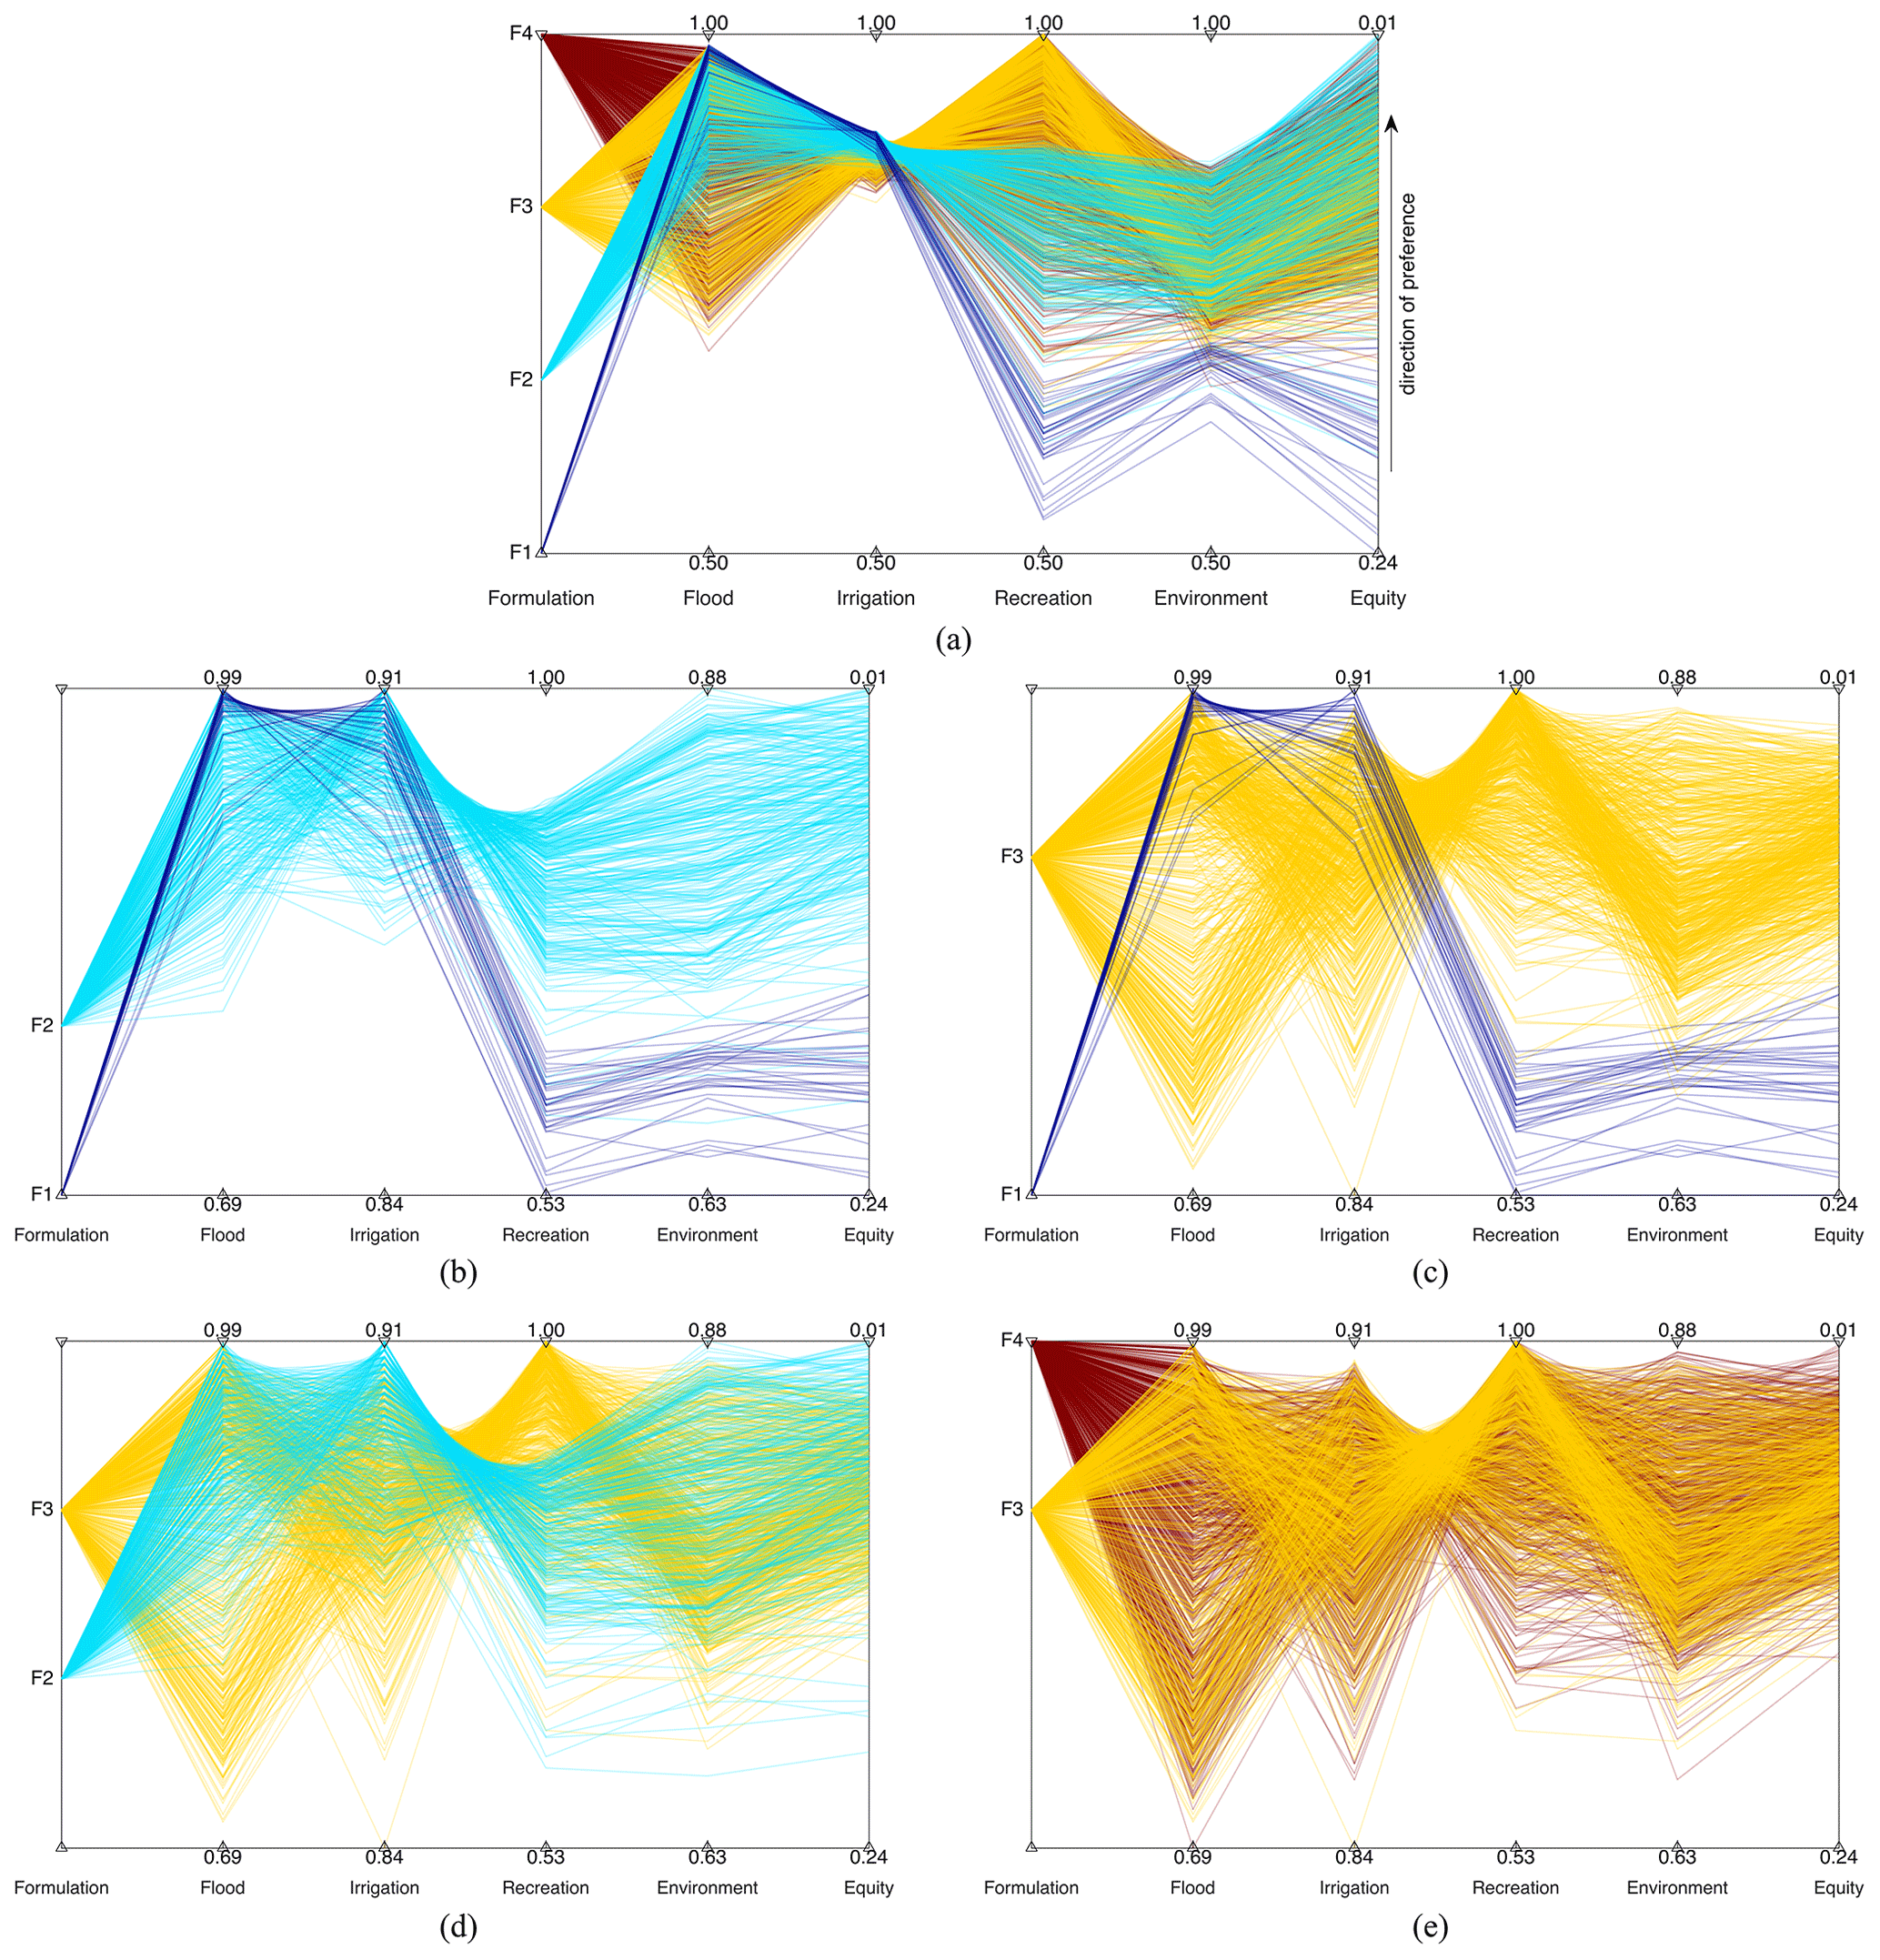
Figure 3Parallel coordinates plot of comparisons between (a) all formulations, (b) traditional vs. traditional and fair, (c) traditional vs. inclusive, (d) traditional and fair vs. inclusive, and (e) inclusive vs. inclusive and fair. Each line connecting multiple axes represents one optimized solution, the horizontal dash line represents the mean line, and each type of line color represents one problem formulation. The axes with the labels “Flood”, “Irrigation”, “Recreation”, “Environment”, and “Equity” refer to the corresponding performance of JF, JI, JR, JE, and ζ, respectively, and the direction of solution preference is upward. It should be noted that panel (a) uses the same lower and upper axis bounds for each objective to better compare their best and worst performance and discover compromise solutions (shown with approximately horizontal lines), whereas panels (b), (c), (d), and (e) use the minimum and maximum performance values of formulations F1, F2, F3, and F4 as the lower and upper axis bounds, respectively.
According to Fig. 3a, different problem formulations generate diverse solution spaces. F1 attains good performance in the objectives JF and JI (up to 0.99 and 0.91, respectively) that this formulation is optimizing, but it attains low performance on the non-optimized objectives JR and JE (lower than 0.67 and 0.72, respectively). Consequently, the equity of these solutions across the four objectives is low. Moving from F1 to F2 allows the attainment of better equity values; however, this induces performance degradation in terms of JF. The inclusive optimization supports the full exploration of the trade-offs between the four objectives, remarkably improving JR but degrading the performance in terms of JF and JI (i.e., the maximum performance in JR is equal to 1, whereas the worst solution in flood and irrigation supply is much lower than with F1 or F2). Notably, the solutions of F3 attain worse values of equity than the solutions of F2. Lastly, moving from F3 to F4 produces a small improvement in terms of equity, with minor differences in the performance across the four objectives. Interestingly, F2 generates solutions that perform very well in terms of JE, although this objective is not directly included in the optimization and is only indirectly considered through the minimization of ζ. This happens because the upper bound of JE in F1 is much lower than other objectives; thus, the equity index tends to decrease as the value of JE increases. Optimizing equity can, therefore, be a way of improving the objective(s) of marginalized stakeholders with the lowest level of satisfaction (e.g., the JE with the lowest upper bound in this case study). It needs to be noted that F3, which directly includes JE, should theoretically outperform F2 in the environmental objective. The difference in the best environment performance between F2 and F3 is likely attributable to the increasing challenges introduced by the additional objectives considered in this work. According to the boxplot of the best performance of the 10 random optimization trials reported in the Supplement (Fig. S2), the median of the best performance of F2 and F3 is indeed almost equivalent. Moreover, a new problem formulation F3b including flood, irrigation, and environment (i.e., removing the recreation objective from F3 to have the same number of objectives as F2) can obtain better performance than F2 by directly optimizing the environment. Including an additional and strongly conflicting objective (recreation) in F3 makes the search for the best environment more challenging.
To better quantify the differences in the solutions obtained with F1–F4, we computed the hypervolume indicator along with the best and worst performance in each objective across the four formulations (see Fig. 4). Results show that F3 and F4 have similar and the highest hypervolume, followed by F2, whereas F1 has much lower hypervolume. Apparently, non-dominated solutions obtained from F3 and F4 tend to be efficient on JR and JE, which are not explicitly optimized in F1 and F2. It needs to be noted that formulation F2 attains a very good performance in the environment objective because the upper bound of JE is lower than other objectives; thus, the equity index tends to improve as the value of JE increases.
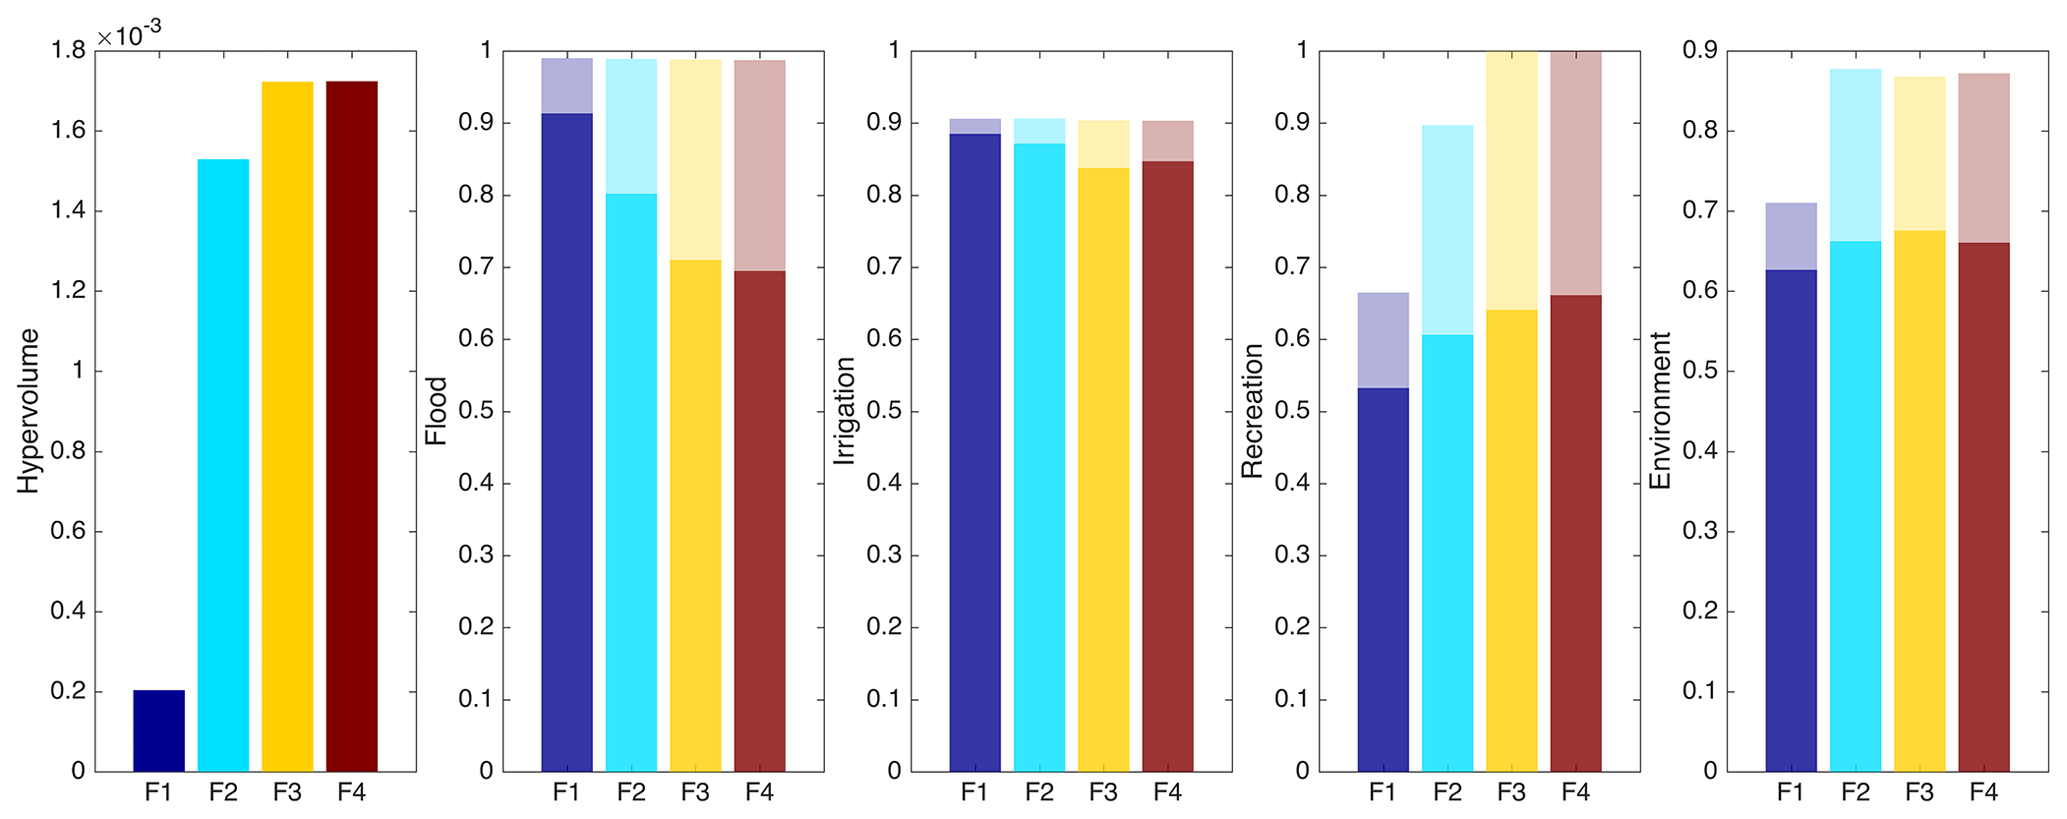
Figure 4The hypervolume indicator and the best (transparent bar) and worst (solid bar) performance in each objective across the four formulations (F1–F4).
To further understand the benefit of adding an equity objective to both the traditional (F1) and the inclusive (F3) formulations, we compute the number of compromise solutions for each formulation considering only the policies that exceed increasing performance thresholds in all objectives (Fig. 5). There are 0, 47, 30, and 49 solutions with reliability greater than 0.85 in all objectives in F1, F2, F3, and F4, respectively, clearly demonstrating how including the equity metric discovers favorable compromises that are not found by conventional formulations. Interestingly, these compromise solutions account for 0 %, 15.8 %, 4.3 %, and 6.1 % of the total number of solutions obtained in each formulation, suggesting that formulation F2 is the most “efficient” in terms of finding compromise solutions. This is also confirmed by observing how the slope of the yellow (F3) and brown (F4) lines in Fig. 5 are steeper than the cyan (F2) line, meaning that the number of compromise solutions in F3 decreases more evidently than in F2 for increasing performance thresholds.

Figure 5Number of compromise solutions for formulations F1–F4 that exceed increasing performance thresholds in all objectives.
These results motivate us to investigate how the considered equity metric changes across the different sets of solutions. Figure 6 shows that the values of the equity index vary mainly with the standard deviation σ of the performance in terms of the four objectives instead of the corresponding mean μ: the equity index consistently increases with σ, but it can have different values for the same μ value, especially in the situation of inequity. The reason for this is that the trade-off between different objectives can lead to notably different σ but similar μ for two different solutions (e.g., in Fig. 2b, high values of JI generally correspond to low values of JR). The results in Fig. 5 show that the maximum μ value increases from 0.81 for F1 to 0.90 and 0.91 for F2 and F3, respectively. The μ here can be considered as a proxy for overall performance, and its significant increase indicates the advantages of solutions from F2 and F3 over F1. However, higher μ does not precisely refer to a better solution, as the profits per unit increment of the four objectives are different. In the traditional formulation, the non-optimized objectives introduce variability in system-wise performance that leads to low equity. Conversely, F2 optimizes the equity index computed across the four objectives, and this generates a substantial improvement at the system level because of the indirect consideration of the marginalized objectives in the policy design. When transiting from F3 to F4, the equity index instead conveys smaller additional information, so the advantage of F4 over F3 is less evident.
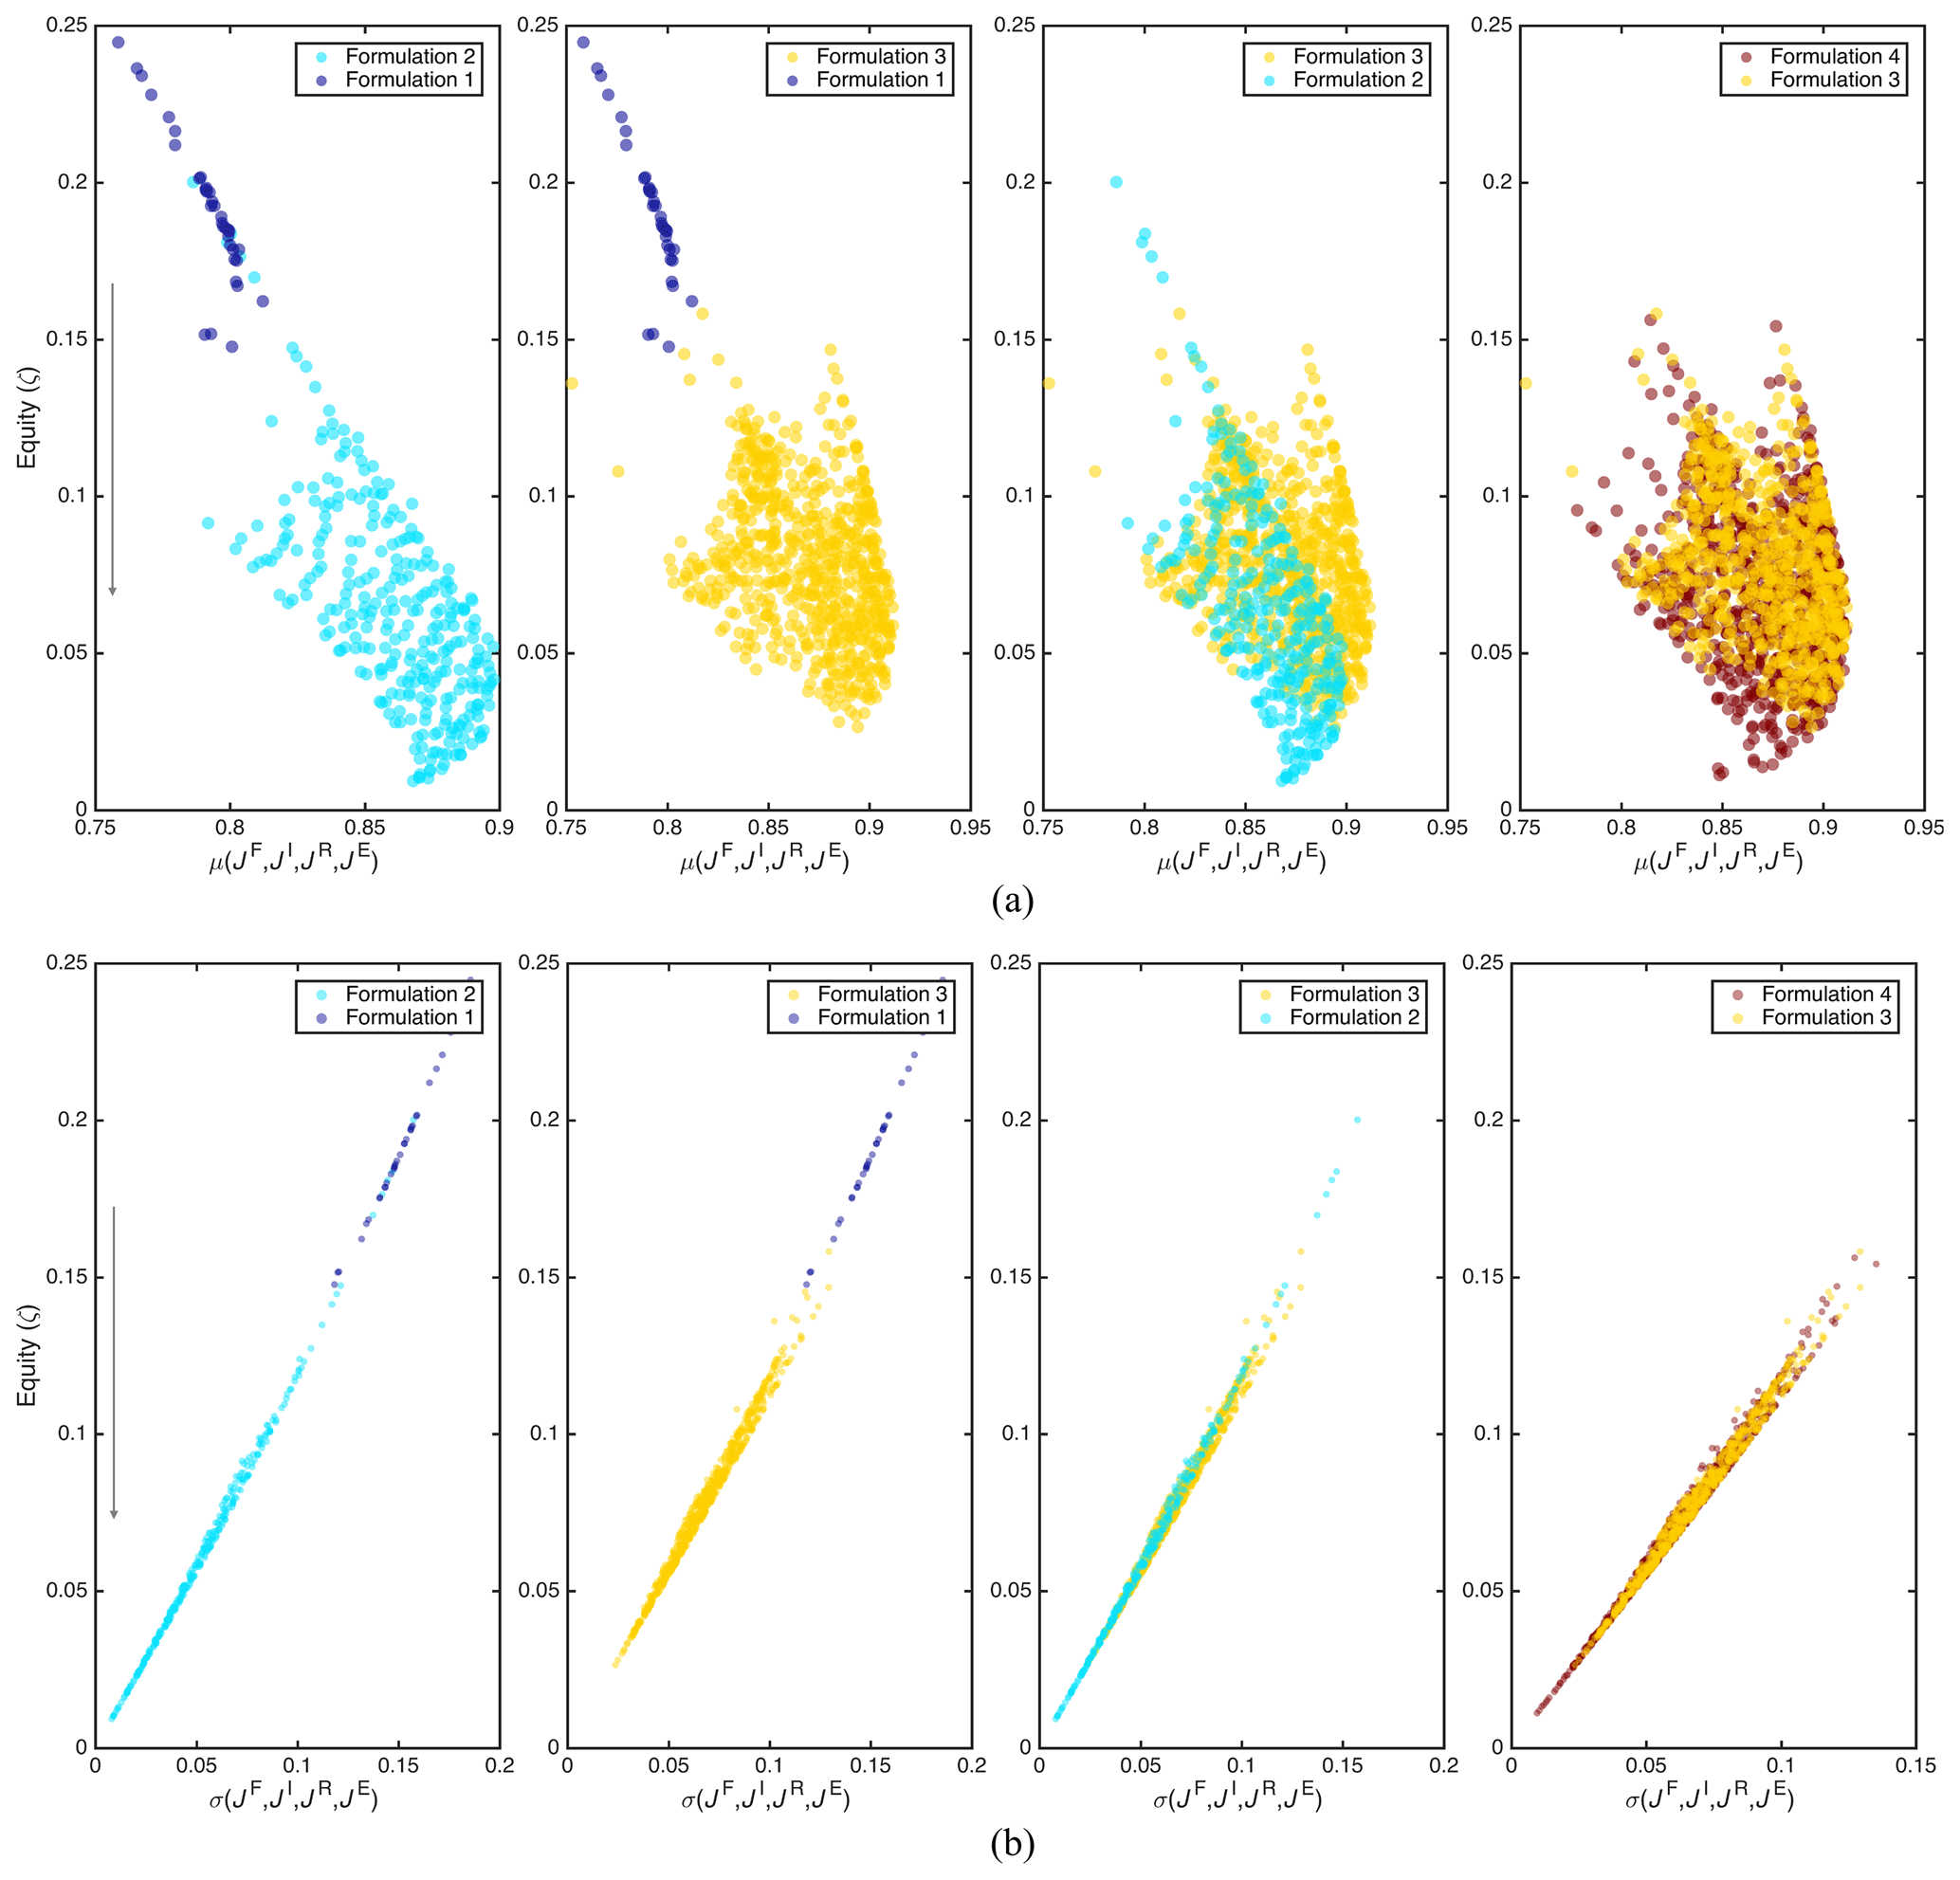
Figure 6Comparisons of the relationship between the equity index and (a) mean μ and (b) standard derivation σ of JF, JI, JR, and JE for solutions from problems F1–F4. Each dot in the scatterplots represents one optimal solution. Solutions with a lower equity index ζ and higher performance mean value μ (JF, JI, JR, JE) are generally preferable. The arrow on the y axis shows the direction of preference.
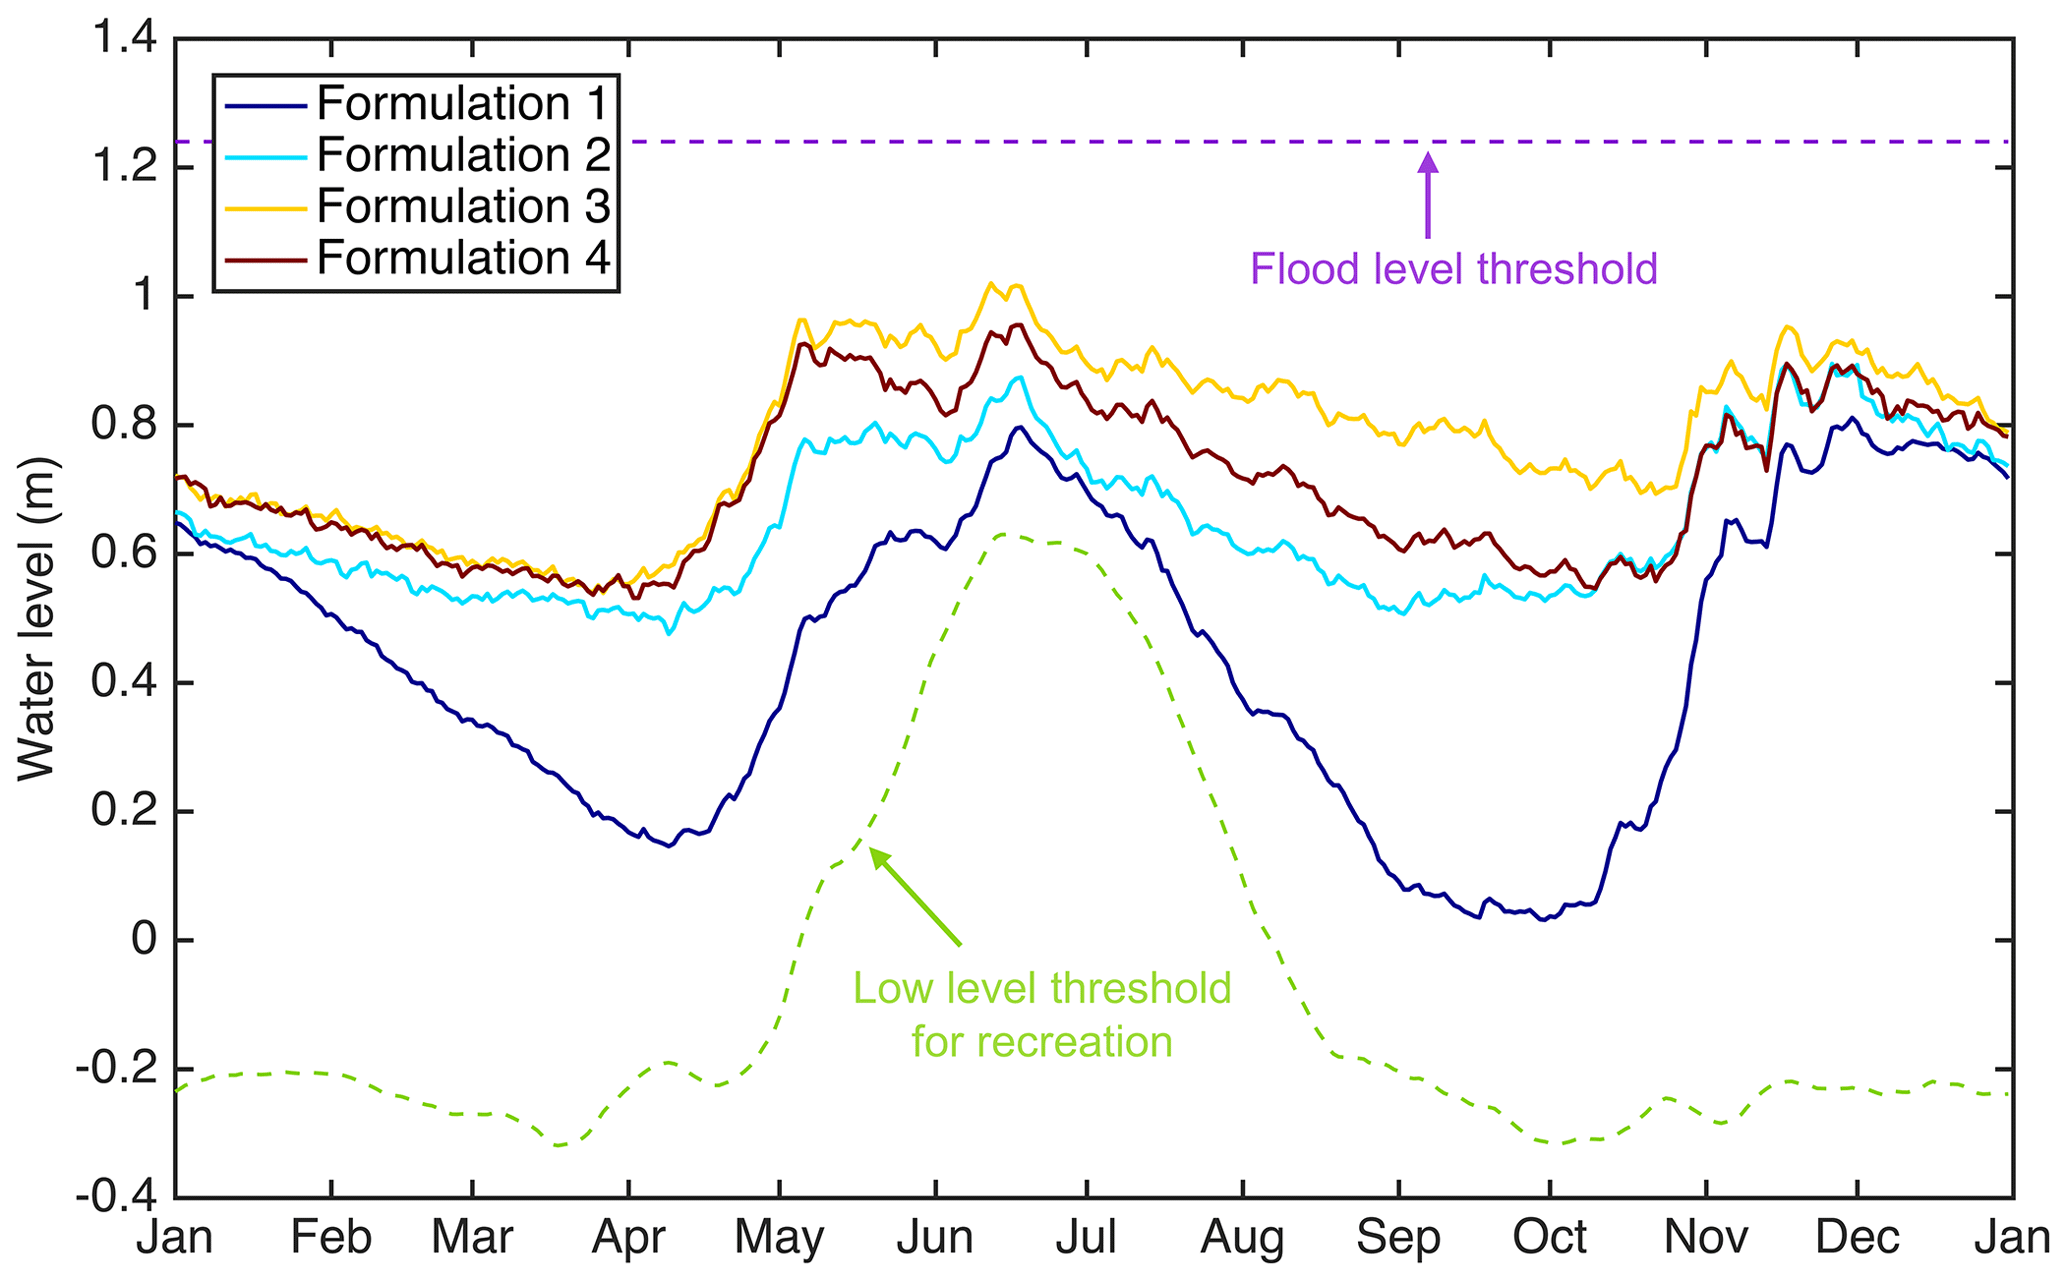
Figure 7Trajectories of the average lake level for the best equitable solution in each problem formulation.
Lastly, the impacts of problem formulations on the resulting dynamics of Lake Como can be evaluated by comparing the simulated trajectories of lake levels under the best equitable solution for F1–F4. Results in Fig. 7 show that the best equitable solution of F1 leads to the lowest water level, especially during the late spring to reduce the flood risk, and that the water level concurrently drops significantly during the summer for better irrigation water supply, which are the only two objectives considered in this formulation. Conversely, the inclusive formulation F3 increases the lake level, especially in the late summer, as required to attain high performance in JR. The water level under the equitable solutions of F2 and F4 is between that of F1 and F3, which indicates the identification of a compromise that balances the conflicting objectives.
4.2 Impacts of objectives' aggregation into the equity index
To investigate the role of alternative formulations of the equity index corresponding to different aggregations of the multiple objectives, we repeated our analysis using a linear and a non-linear value function (see Fig. 2) to map the original objectives into satisfaction values. Figure 8 illustrates the results for the traditional and fair formulation (F2), where each line represents the performance of the optimized solution in terms of JF, JI, JR, and JE (as in Fig. 2) along with three equity indexes computed with either the original values of reliability or the satisfaction values returned by the linear and non-linear value functions. As the performance difference between linear and non-linear value functions is less notable for F4, the corresponding comparisons are not reported.
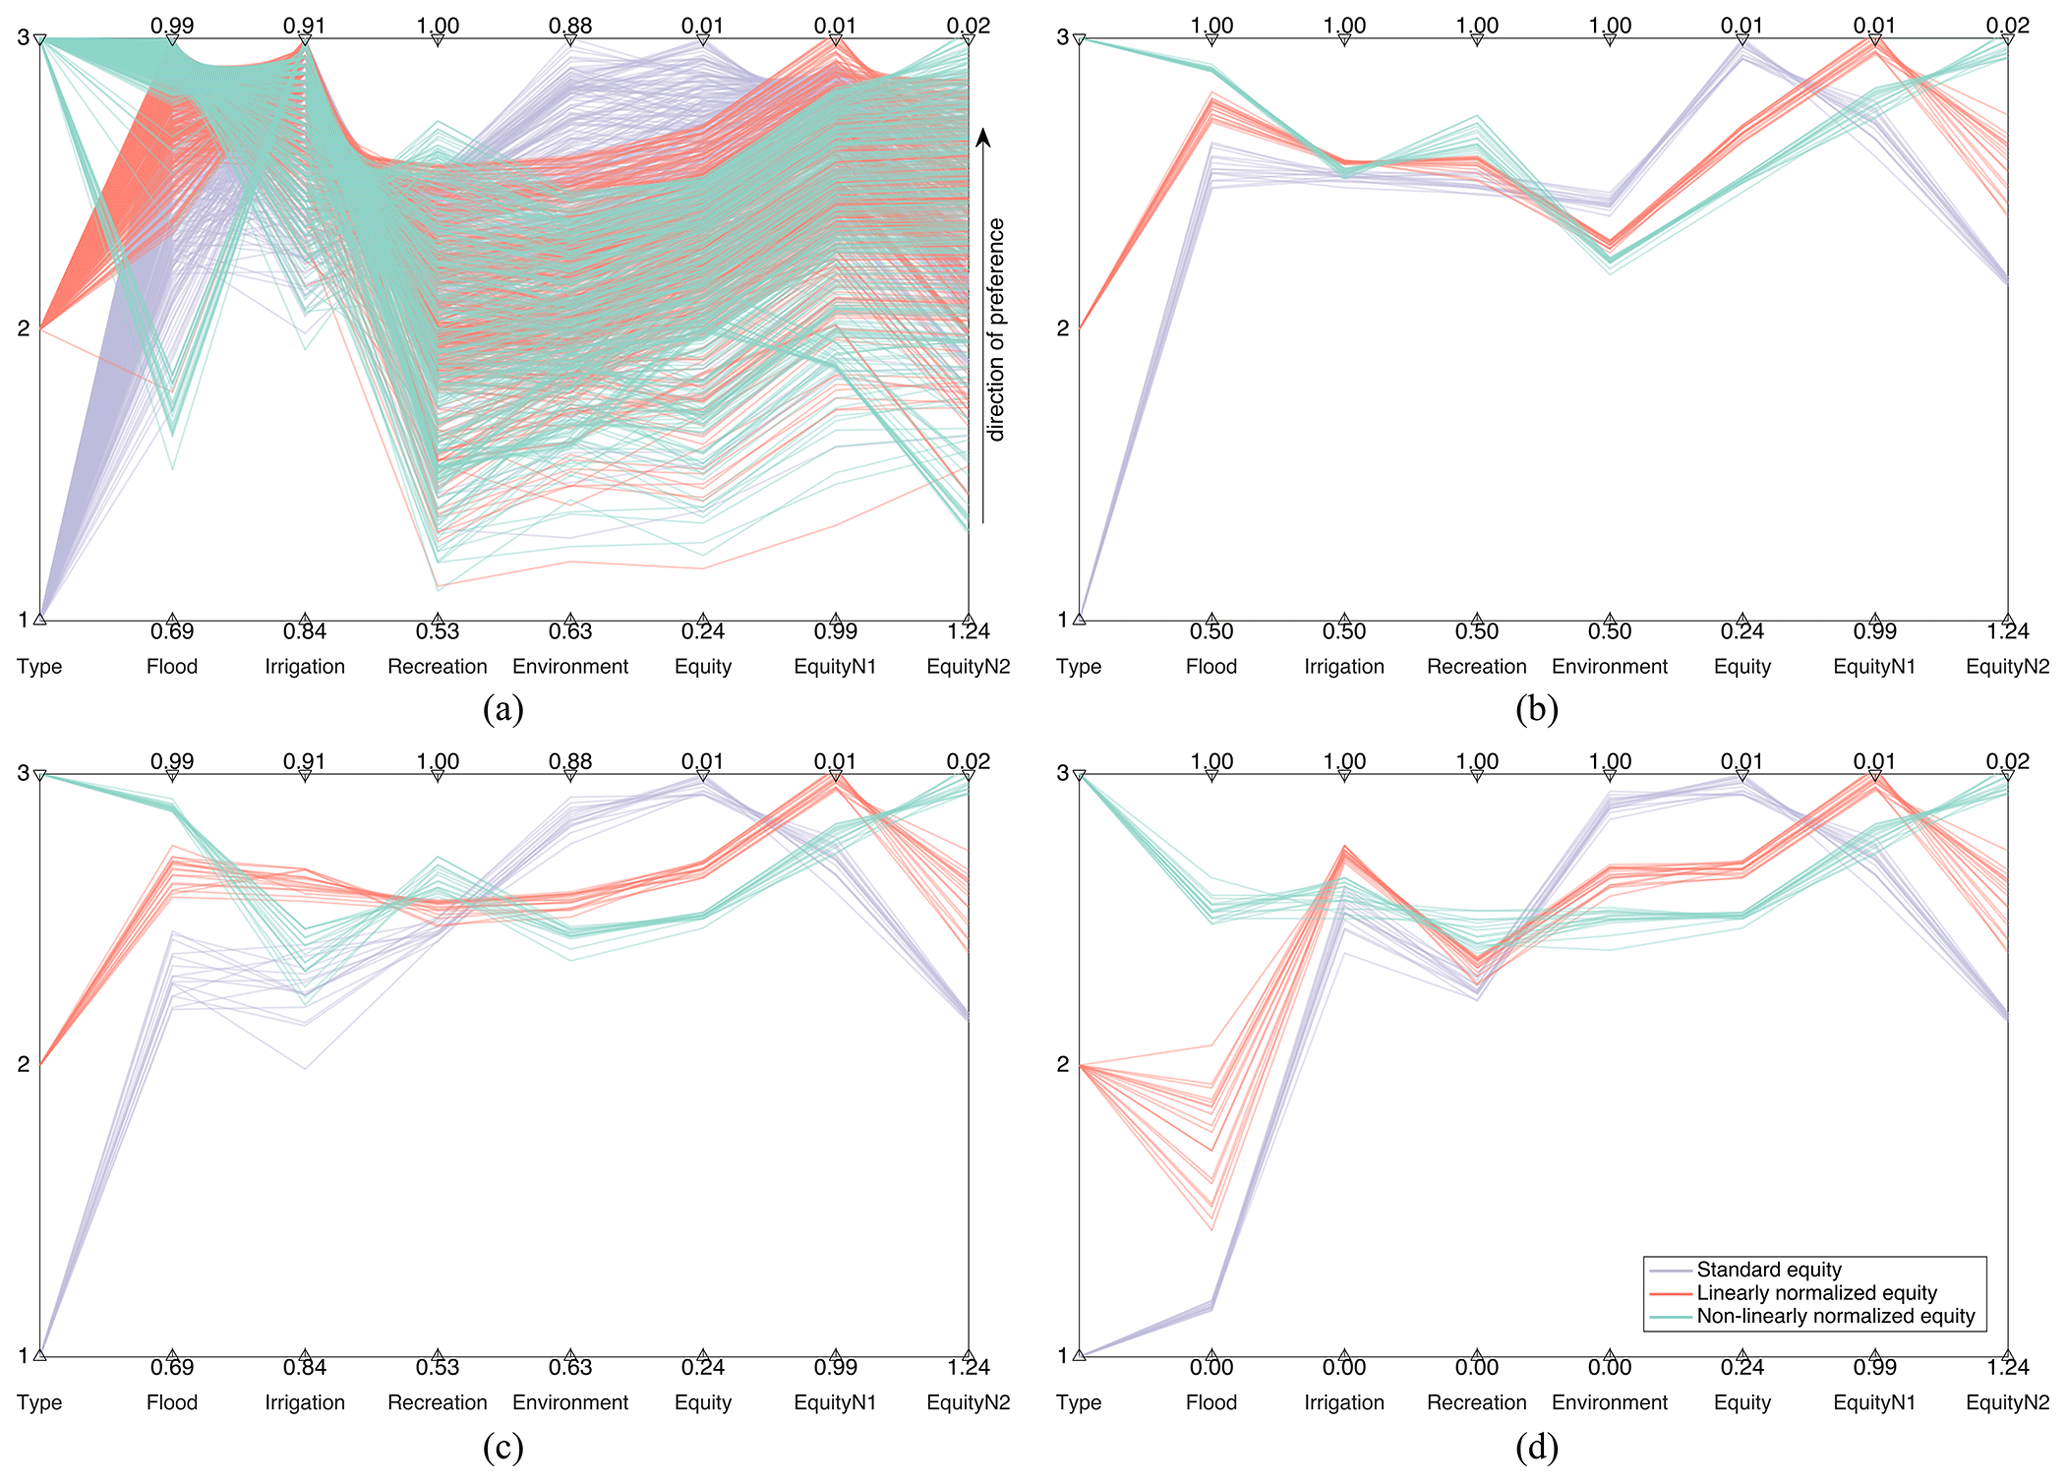
Figure 8Parallel plot of (a) all solutions and (b, c, d) 5 % solutions with the lowest (standard, linearly normalized, or non-linearly normalized) equity index in problem formulation F2. Type 1, 2, and 3 refer to optimizations minimizing the standard, linearly normalized, and non-linearly normalized equity index, respectively. Panels (a), (b), and (c) show the performance value, whereas panel (d) shows the performance scores; panels (b) and (d) have the same lower and upper bounds for all axes (of JF, JI, JR, and JE), whereas panels (a) and (c) use the minimum and maximum performance values of problems F1–F4 as the lower and upper axis bounds.
According to Fig. 8a, using standard equity (violet lines) yields solutions with a high level of JE, which can be explained by the low upper bound of JE, as also noted in Fig. 3. Conversely, using the equity index computed on satisfaction values tends to obtain a high level of performance in terms of JF due to the upper bound of JF, leading to relatively lower JE but higher JF than using the standard equity. Furthermore, using a linear or non-linear value function also affects the equitable operating policy design. The non-linear value function tends to get relatively higher JF and JR but lower JE than the linear value function because steeper slopes in value function curves occur at a high level of JF and JR (i.e., the improvement of JF and JR will be considered more important than the improvement of JE). Thus, the preferences of stakeholders and decision-makers should be embedded in the equity index formulation to ensure better performance in terms of more important objectives.
Figure 8b, c, and d illustrate the 5 % most equitable solutions with respect to the different formulations of the equity index. The nearly horizontal lines between axes JF and JE represent solutions attaining an equity index close to zero. Solutions using standard equity tend to get higher JE values (close to 0.88) but lower JF, JI, and JR values than using normalized equity. When JF, JI, and JR are higher than 0.88, decreasing the standard equity index will always increase the JE value but may deteriorate other objectives (i.e., there a clear trade-off exists between equity index minimization and JF, JI, and JR maximization). Standard equity leads to all objective performance values being close to 0.88 (Fig. 8b). In contrast, linearly and non-linearly normalized equity yields more evenly distributed performance scores. The horizontal red lines in Fig. 8c show that all objectives have the same linearly normalized score, as the y-axis limits of Fig. 8c are actually the objective ranges, while the cyan horizontal lines in Fig. 8d mean the same non-linearly normalized score for all objectives. Moreover, using linearly normalized equity to some degree improves JI (Fig. 8c), whereas using non-linearly normalized equity tends to get more solutions with a high level of JF than linearly normalized equity, which is especially notable from the comparisons of performance scores in Fig. 8d. It is worth noting that the means of all objective values from solutions using these three types of equity index formulations seem close to each other, with non-linear normalization obtaining higher JF and JR values but lower JI and JE values than linear normalization, and no normalization producing relatively higher JE values but lower JF, JI, and JR values. This further indicates that a low equity index is achieved mainly by lowering the standard deviation of the performance, instead of by increasing the mean of objective values, in accordance with the results in Fig. 6.
In this paper, we incorporated equity principles into the operation design of multipurpose water reservoirs. Using the real-world case study of Lake Como in northern Italy, the potential for operationalizing equity indexes is assessed by means of a rival framings experiment in which we compare the solutions obtained by formulating alternative problems with a different number of objectives. Moreover, we assess the sensitivity of the proposed approach with respect to the value functions adopted for aggregating the different objectives in the computation of the equity index.
The comparison between operating policies designed with and without considering equity amongst the operating objectives shows the following: (1) including equity in the operation design can indirectly improve marginalized objectives that are not explicitly considered in the optimization problem; (2) when marginalized objectives are also explicitly included, the addition of an equity indicator still generates more compromise solutions mitigating the conflicts between the operating objectives.
Our work also emphasizes that the search for equitable solutions across multi-sectoral interests depends on how the multiple objectives are combined to formulate the equity index. Results show that using an equity index based on the original reliabilities can favor or negatively impact some objectives in a way that is difficult to control. Thus, the adoption of participatory approaches for eliciting the preference structure of stakeholders and policymakers becomes paramount for the operationalization of equity principles to rescale the objectives and represent a fair balance across competing interests.
Our methodology is demonstrated using Lake Como as a case study, as the lake is operated by a single authority (i.e., Consorzio dell'Adda) that acts as something of a social planner, first analyzing the trade-offs across the interests of multiple stakeholders and then implementing a selected compromise policy. However, the same approach can also serve as the basis for an interactive negotiation with multiple stakeholders who can discuss and analyze the same set of solutions examined by the social planner in order to find an acceptable compromise. However, it is important to stress that, in both cases, the formulation of the equity index should be co-designed with the stakeholders via the identification of suitable value functions to map the original objectives into satisfaction values that allow the aggregation of the originally incommensurable objectives into an equity index.
The definition of equity is not unique in the literature. Beside the equity index used in this study, it could be interesting to investigate the impacts of alternative definitions of equity on water resources decision-making and how to select an appropriate equity metric for a specific problem. Moreover, although equitable solutions can help to mitigate the conflicts among multiple objectives, it is still not easy to design an objective value function and, thus, choose an equitable policy agreed upon by all stakeholders. Further research could focus on the formulation of guidelines for the identification of satisfactory alternative from the set of Pareto-optimal solutions. Finally, the equity in this study is assumed to be static throughout all experiments, but it could dynamically change over time according to the potential evolution of stakeholders' and decision-makers' preferences. It would be interesting to evaluate the dynamics of equity under varying conditions, including future climate scenarios and modifications to the irrigation systems.
Observations of lake inflows were provided by Consorzio dell'Adda (http://www.addaconsorzio.it, Consorzio dell'Adda, 2022). The source code for the Lake Como simulation and EMODPS implementation is available from Zenodo (https://doi.org/10.5281/zenodo.7401169, Giuliani and Yang, 2022).
The supplement related to this article is available online at: https://doi.org/10.5194/hess-27-69-2023-supplement.
GY, MG, and AC designed the research. GY conducted the numerical experiments and led the data analysis, including the production of the figures in the paper. MG and AC contributed to the analysis of results. All authors were involved in the writing of the paper.
The contact author has declared that none of the authors has any competing interests.
Publisher’s note: Copernicus Publications remains neutral with regard to jurisdictional claims in published maps and institutional affiliations.
The work has been supported by the “Mind the Water Cycle Gap: Innovating Water Management Optimisation Practice” (IN-WOP) research project, funded by the Water Joint Programming Initiative 2018 (grant no. JPI18_00104).
This paper was edited by Günter Blöschl and reviewed by two anonymous referees.
Billington, D. P. and Jackson, D. C.: Big dams of the New Deal era: A confluence of engineering and politics, University of Oklahoma Press, 20–25, ISBN 0806137959, 9780806137957, 2006.
Buşoniu, L., Ernst, D., De Schutter, B., and Babuška, R.: Cross-entropy optimization of control policies with adaptive basis functions, Systems, Man, and Cybernetics, Part B: Cybernetics, IEEE Transactions on, 41, 196–209, 2011.
Cai, X.: Water stress, water transfer and social equity in Northern China – Implications for policy reforms, J. Environ. Manage., 87, 14–25, 2008.
Cai, X., McKinney, D. C., and Lasdon, L. S.: A framework for sustainability analysis in water resources management and application to the Syr Darya Basin, Water Resour. Res., 38, 21-1–21-14, https://doi.org/10.1029/2001WR000214, 2002.
Cai, X., McKinney, D. C., and Rosegrant, M. W.: Sustainability analysis for irrigation water management in the Aral Sea region, Agr. Syst., 76, 1043–1066, 2003.
Carvalho, L., Mackay, E. B., Cardoso, A. C., Baattrup-Pedersen, A., Birk, S., Blackstock, K. L., Borics, G., Borja, A., Feld, C. K., and Ferreira, M. T.: Protecting and restoring Europe's waters: An analysis of the future development needs of the Water Framework Directive, Sci. Total Environ., 658, 1228–1238, 2019.
Ciullo, A., Kwakkel, J. H., De Bruijn, K. M., Doorn, N., and Klijn, F.: Efficient or Fair? Operationalizing Ethical Principles in Flood Risk Management: A Case Study on the Dutch-German Rhine, Risk Anal., 40, 1844–1862, 2020.
Cohon, J. L. and Marks, D. H.: A review and evaluation of multiobjective programing techniques, Water Resour. Res., 11, 208–220, 1975.
Consorzio dell’Adda: http://www.addaconsorzio.it, last access: August 2020.
D'Odorico, P., Davis, K. F., Rosa, L., Carr, J. A., Chiarelli, D., Dell'Angelo, J., Gephart, J., MacDonald, G. K., Seekell, D. A., and Suweis, S.: The global food-energy-water nexus, Rev. Geophys., 56, 456–531, 2018.
Denaro, S., Anghileri, D., Giuliani, M., and Castelletti, A.: Informing the operations of water reservoirs over multiple temporal scales by direct use of hydro-meteorological data, Adv. Water Resour., 103, 51–63, 2017.
Ehsani, N., Vörösmarty, C. J., Fekete, B. M., and Stakhiv, E. Z.: Reservoir operations under climate change: storage capacity options to mitigate risk, J. Hydrol., 555, 435–446, 2017.
Fletcher, S., Hadjimichael, A., Quinn, J., Osman, K., Giuliani, M., Gold, D., Figueroa, A. J., and Gordon, B.: Equity in water resources planning: a path forward for decision support modelers, J. Water Res. Plan. Man., 148, 02522005, https://doi.org/10.1061/(ASCE)WR.1943-5452.0001573, 2022.
Galelli, S. and Soncini-Sessa, R.: Combining metamodelling and stochastic dynamic programming for the design of reservoir release policies, Environ. Model. Softw., 25, 209–222, 2010.
Geressu, R. T. and Harou, J. J.: Reservoir system expansion scheduling under conflicting interests, Environ. Model. Softw., 118, 201–210, 2019.
Gini, C.: Measurement of inequality of incomes, The Economic Journal, 31, 124–126, 1921.
Girard, C., Rinaudo, J. D., and Pulido-Velazquez, M.: Sharing the cost of river basin adaptation portfolios to climate change: Insights from social justice and cooperative game theory, Water Resour. Res., 52, 7945–7962, 2016.
Giuliani, M. and Castelletti, A.: Is robustness really robust? How different definitions of robustness impact decision-making under climate change, Clim. Change, 135, 409–424, 2016.
Giuliani, M. and Yang, G.: EILab-Polimi/LakeComo: First release of LakeComo_equity code (v1.0), Zenodo [code], https://doi.org/10.5281/zenodo.7401169, 2022.
Giuliani, M., Herman, J. D., Castelletti, A., and Reed, P.: Many-objective reservoir policy identification and refinement to reduce policy inertia and myopia in water management, Water Resour. Res., 50, 3355–3377, 2014.
Giuliani, M., Anghileri, D., Castelletti, A., Vu, P. N., and Soncini-Sessa, R.: Large storage operations under climate change: expanding uncertainties and evolving tradeoffs, Environ. Res. Lett., 11, 035009, https://doi.org/10.1088/1748-9326/11/3/035009, 2016a.
Giuliani, M., Castelletti, A., Pianosi, F., Mason, E., and Reed, P. M.: Curses, tradeoffs, and scalable management: Advancing evolutionary multiobjective direct policy search to improve water reservoir operations, J. Water Res. Plan. Man., 142, 04015050, https://doi.org/10.1061/(ASCE)WR.1943-5452.0000570, 2016b.
Giuliani, M., Li, Y., Castelletti, A., and Gandolfi, C.: A coupled human-natural systems analysis of irrigated agriculture under changing climate, Water Resour. Res., 52, 6928–6947, 2016c.
Giuliani, M., Crochemore, L., Pechlivanidis, I., and Castelletti, A.: From skill to value: isolating the influence of end user behavior on seasonal forecast assessment, Hydrol. Earth Syst. Sci., 24, 5891–5902, https://doi.org/10.5194/hess-24-5891-2020, 2020.
Gottipati, P. V. and Nanduri, U. V.: Equity in water supply in intermittent water distribution networks, Water Environ. J., 28, 509–515, 2014.
Graham, N. T., Hejazi, M. I., Chen, M., Davies, E. G., Edmonds, J. A., Kim, S. H., Turner, S. W., Li, X., Vernon, C. R., and Calvin, K.: Humans drive future water scarcity changes across all Shared Socioeconomic Pathways, Environ. Res. Lett., 15, 014007, https://doi.org/10.1088/1748-9326/ab639b, 2020.
Grizzetti, B., Liquete, C., Antunes, P., Carvalho, L., Geamănă, N., Giucă, R., Leone, M., McConnell, S., Preda, E., and Santos, R.: Ecosystem services for water policy: Insights across Europe, Environ. Sci. Pol., 66, 179–190, 2016.
Groenfeldt, D.: Water ethics: a values approach to solving the water crisis, Routledge, 2nd edition, https://doi.org/10.4324/9781351200196, 2019.
Guariso, G., Rinaldi, S., and Soncini-Sessa, R.: The management of Lake Como: A multiobjective analysis, Water Resour. Res., 22, 109–120, 1986.
Gullotta, A., Butler, D., Campisano, A., Creaco, E., Farmani, R., and Modica, C.: Optimal location of valves to improve equity in intermittent water distribution systems, J. Water Res. Plan. Man., 147, 04021016, https://doi.org/10.1061/(ASCE)WR.1943-5452.0001370, 2021.
Hadka, D. and Reed, P.: Borg: An auto-adaptive many-objective evolutionary computing framework, Evol. Comput., 21, 231–259, 2013.
Jafino, B. A., Kwakkel, J. H., Klijn, F., Dung, N. V., van Delden, H., Haasnoot, M., and Sutanudjaja, E. H.: Accounting for multisectoral dynamics in supporting equitable adaptation planning: A case study on the rice agriculture in the Vietnam Mekong Delta, Earth's Future, 9, e2020EF001939, https://doi.org/10.1029/2020EF001939, 2021.
Kasprzyk, J. R., Reed, P. M., Kirsch, B. R., and Characklis, G. W.: Managing population and drought risks using many-objective water portfolio planning under uncertainty, Water Resour. Res., 45, W12401-1–W12401-18, https://doi.org/10.1029/2009WR008121, 2009.
Kasprzyk, J. R., Reed, P. M., and Hadka, D. M.: Battling arrow's paradox to discover robust water management alternatives, J. Water Res. Plan. Man., 142, 04015053, https://doi.org/10.1061/(ASCE)WR.1943-5452.0000572, 2016.
Kazemi, M., Bozorg-Haddad, O., Fallah-Mehdipour, E., and Loáiciga, H. A.: Inter-basin hydropolitics for optimal water resources allocation, Environ. Monit. Assess., 192, 1–10, 2020.
Liu, J., Hull, V., Godfray, H. C. J., Tilman, D., Gleick, P., Hoff, H., Pahl-Wostl, C., Xu, Z., Chung, M. G., and Sun, J.: Nexus approaches to global sustainable development, Nature Sustain., 1, 466–476, 2018.
Loucks, D. P.: Quantifying trends in system sustainability, Hydrol. Sci. J., 42, 513–530, 1997.
Loucks, D. P. and Van Beek, E.: Water resource systems planning and management: An introduction to methods, models, and applications, Springer, 213–300, ISBN 3319442325, 9783319442327, 2017.
Maass, A., Hufschmidt, M. M., Dorfman, R., Thomas, J. H. A., Marglin, S. A., and Fair, G. M.: Design of Water-Resource Systems: New Techniques for Relating Economic Objectives, Engineering Analysis, and Governmental Planning, Cambridge, MA and London, England: Harvard University Press, https://doi.org/10.4159/harvard.9780674421042, 1962.
Maier, H. R., Kapelan, Z., Kasprzyk, J., Kollat, J., Matott, L. S., Cunha, M. C., Dandy, G. C., Gibbs, M. S., Keedwell, E., and Marchi, A.: Evolutionary algorithms and other metaheuristics in water resources: Current status, research challenges and future directions, Environ. Model. Softw., 62, 271–299, 2014.
Nicklow, J., Reed, P., Savic, D., Dessalegne, T., Harrell, L., Chan-Hilton, A., Karamouz, M., Minsker, B., Ostfeld, A., and Singh, A.: State of the art for genetic algorithms and beyond in water resources planning and management, J. Water Res. Plan. Man., 136, 412–432, 2010.
Olsson, G.: Water and energy: threats and opportunities, IWA publishing, 2nd edition, 39–45, ISBN 1780406932, 9781780406930, 2015.
Osman, K. K. and Faust, K. M.: Toward operationalizing equity in water infrastructure services: Developing a definition of water equity, ACS ES&T Water, 1, 1849–1858, 2021.
Peel, M. C., Finlayson, B. L., and McMahon, T. A.: Updated world map of the Köppen-Geiger climate classification, Hydrol. Earth Syst. Sci., 11, 1633–1644, https://doi.org/10.5194/hess-11-1633-2007, 2007.
Poff, N. L. and Schmidt, J. C.: How dams can go with the flow, Science, 353, 1099–1100, 2016.
Poff, N. L., Brown, C. M., Grantham, T. E., Matthews, J. H., Palmer, M. A., Spence, C. M., Wilby, R. L., Haasnoot, M., Mendoza, G. F., and Dominique, K. C.: Sustainable water management under future uncertainty with eco-engineering decision scaling, Nat. Clim. Change, 6, 25–34, 2016.
Reed, P. M., Hadka, D., Herman, J. D., Kasprzyk, J. R., and Kollat, J. B.: Evolutionary multiobjective optimization in water resources: The past, present, and future, Adv Water Resour., 51, 438–456, 2013.
Sabo, J. L., Ruhi, A., Holtgrieve, G. W., Elliott, V., Arias, M. E., Ngor, P. B., Räsänen, T. A., and Nam, S.: Designing river flows to improve food security futures in the Lower Mekong Basin, Science, 358, eaao1053, https://doi.org/10.1126/science.aao1053, 2017.
Salazar, J. Z., Reed, P. M., Herman, J. D., Giuliani, M., and Castelletti, A.: A diagnostic assessment of evolutionary algorithms for multi-objective surface water reservoir control, Adv. Water Resour., 92, 172–185, 2016.
Scanlon, B. R., Ruddell, B. L., Reed, P. M., Hook, R. I., Zheng, C., Tidwell, V. C., and Siebert, S.: The food-energy-water nexus: Transforming science for society, Water Resour. Res., 53, 3550–3556, 2017.
Schmitt, R. J., Bizzi, S., Castelletti, A., and Kondolf, G.: Improved trade-offs of hydropower and sand connectivity by strategic dam planning in the Mekong, Nature Sustain., 1, 96–104, 2018.
Siddiqi, A., Wescoat Jr., J. L., and Muhammad, A.: Socio-hydrological assessment of water security in canal irrigation systems: a conjoint quantitative analysis of equity and reliability, Water Security, 4, 44–55, 2018.
Soncini-Sessa, R., Weber, E., and Castelletti, A.: Integrated and participatory water resources management-theory, Elsevier, 1st edition, 114–121, ISBN 0080551416, 9780080551418, 2007.
Wang, L., Fang, L., and Hipel, K. W.: Basin-wide cooperative water resources allocation, Eur. J. Oper. Res., 190, 798–817, 2008.
Zaniolo, M., Giuliani, M., and Castelletti, A.: Neuro-Evolutionary Direct Policy Search for Multiobjective Optimal Control, IEEE Transactions on Neural Networks and Learning Systems, 33, 5926–5938, https://doi.org/10.1109/TNNLS.2021.3071960, 2021.