the Creative Commons Attribution 4.0 License.
the Creative Commons Attribution 4.0 License.
 | 27 Jan 2023
Contribution of rock glacier discharge to late summer and fall streamflow in the Uinta Mountains, Utah, USA
Alexander L. Handwerger
Water draining from rock glaciers in the Uinta Mountains of Utah (USA) was analyzed and compared with samples of groundwater and water from the primary stream in a representative 5000 ha drainage. Rock glacier water resembles snowmelt in the early summer but evolves to higher values of d-excess and greatly elevated Ca and Mg content as the melt season progresses. This pattern is consistent with models describing a transition from snowmelt to melting of seasonal ice to melting of perennial ice in the rock glacier interior in late summer and fall. Water derived from this internal ice appears to have been the source of ∼25 % of the streamflow in this study area during September of 2021. This result emphasizes the significant role that rock glaciers can play in the hydrology of high-elevation watersheds, particularly in summers following a winter with below-average snowpack.
- Article
(9533 KB) - Full-text XML
- BibTeX
- EndNote


Contemporary climate change is responsible for an array of dramatic effects in high mountain environments (Adler et al., 2019; Chakraborty, 2021). Average temperatures of air (Bonfils et al., 2008; Minder et al., 2018) and permafrost (Biskaborn et al., 2019) are rising, glaciers are retreating (Sakai and Fujita, 2017; Sommer et al., 2020), the ranges of plants (Alexander et al., 2018; Albrich et al., 2020) and animals (Millar and Westfall, 2010; Rödder et al., 2021) are shifting, and ecosystem services (Egan and Price, 2017; Palomo, 2017) and the societies that depend on them (McDowell et al., 2019; Xenarios et al., 2019) are in a phase of readjustment. Documenting and understanding these changes is of crucial importance in mitigating natural hazards (Stoffel and Corona, 2018; Thaler et al., 2018), anticipating future scarcity of water resources (Beniston et al., 2018; Rowan et al., 2018), designing appropriate conservation strategies (Catalan et al., 2017), and planning for a future in which mountain environments look and function differently than they have for the past century (Huss et al., 2017).
A component of mountain landscapes with strong potential to document past and present environmental changes, and a notable vulnerability to climatic perturbations, are features known as rock glaciers. Typically present in cold environments that are too dry for the formation of ice glaciers, rock glaciers are mixtures of rock debris and perennial ice that move downslope through a combination of creep and basal shear (Wahrhaftig and Cox, 1959; Giardino et al., 1987; Giardino and Vitek, 1988). Given their genesis, their composition, and their behavior, rock glaciers exist at the intersection of climate, the cryosphere, and hydrology.
Traditionally, rock glacier research focused on the distribution and paleoclimatic significance of these features (Konrad et al., 1999; Johnson et al., 2021). Modern updates to these investigations are applying high precision GPS (Buchli et al., 2018), photogrammetry (Kenner et al., 2018), surface-exposure dating (Lehmann et al., 2022), and remote sensing to monitor rock glacier movement (Strozzi et al., 2020), offering an unprecedented understanding of the relationship between rock glacier behavior and climate change. Studies have also sought to explore the role of rock glaciers as refugia for cold-adapted organisms in the face of warming temperatures (Millar et al., 2015; Brighenti et al., 2021).
An additional topic with critical importance in regions characterized by water scarcity is the contribution of rock glaciers to high mountain hydrology (Rangecroft et al., 2015; Jones et al., 2019). The interconnected pore space within the typically coarse debris comprising a rock glacier allows these features to serve as aquifers, storing and releasing water over a variety of timescales (Geiger et al., 2014; Harrington et al., 2018; Wagner et al., 2020; Halla et al., 2021). Moreover, perennial ice within the interior of an active rock glacier is a reservoir of longer-term storage that is nonetheless vulnerable to being lost from the system through melting in excess of new ice formation. Studies have investigated the ice content of rock glaciers using geophysical methods such as ground-penetrating radar and invasive approaches like drilling (Krainer and Mostler, 2002; Krainer et al., 2015; Petersen et al., 2020; Wagner et al., 2021). Extrapolation from these investigations and the incorporation of empirical transfer functions have supported estimates of rock glacier water storage for some areas (Azócar and Brenning, 2010; Rangecroft et al., 2015; Janke et al., 2017; Jones et al., 2018). Nonetheless, uncertainty remains about how much ice is stored within rock glaciers, the vulnerability of this ice to climate warming, and how much ice may already be melting and contributing to base flow, particularly in late summer after the melting of seasonal snow has ceased.
Here, we investigate the water draining from representative rock glaciers in the Uinta Mountains in northeastern Utah, a mountain range in which rock glaciers have been inventoried (Munroe, 2018) and monitored (Brencher et al., 2021) in previous work. Automated samplers were used to collect time series of water discharging from two rock glaciers, a non-rock glacier spring, and along the primary stream. All samples were analyzed for cation chemistry and stable isotopes to test two related hypotheses: (1) that the rock glacier springs would exhibit properties distinct from the other water sources and consistent with the melting of internal ice in late summer; and (2) that late summer streamflow along the primary stream would contain a non-trivial amount of rock glacier-sourced water.
The study area for this project is in the upper West Fork Whiterocks River watershed in the southeastern sector of the Uinta Mountains (Fig. 1). The watershed has an area of ∼5000 ha above the lowest sampling site, and elevations range from 2960 to over 3700 m. The Uinta Mountains (hereafter “the Uintas”) are a substantial component of the Rocky Mountain system located in northeastern Utah in the western United States. The Uintas are the highest mountains in this region, reaching elevations in excess of 4 km. The bedrock of the Uintas is a thick sequence of Precambrian siliciclastic rocks that was uplifted during the Laramide orogeny beginning in the early Paleogene (Sears et al., 1982; Hansen, 1986; Dehler et al., 2007). Pleistocene valley glaciers eroded deep cirques and glacial canyons and deposited massive lateral and end moraine systems (Atwood, 1909; Munroe and Laabs, 2009). No ice glaciers remain in these mountains today; however, the climate at higher elevations, where mean annual temperatures are <0 ∘C (Munroe, 2006), supports patterned ground, talus, and abundant rock glaciers. Previous work using optical imagery (Munroe, 2018) and satellite-based radar interferometry (Brencher et al., 2021) identified more than 200 active rock glaciers in the Uintas, and many more that are no longer moving. Eight rock glaciers totaling 170 ha are mapped within the West Fork Whiterocks drainage (Fig. 1).
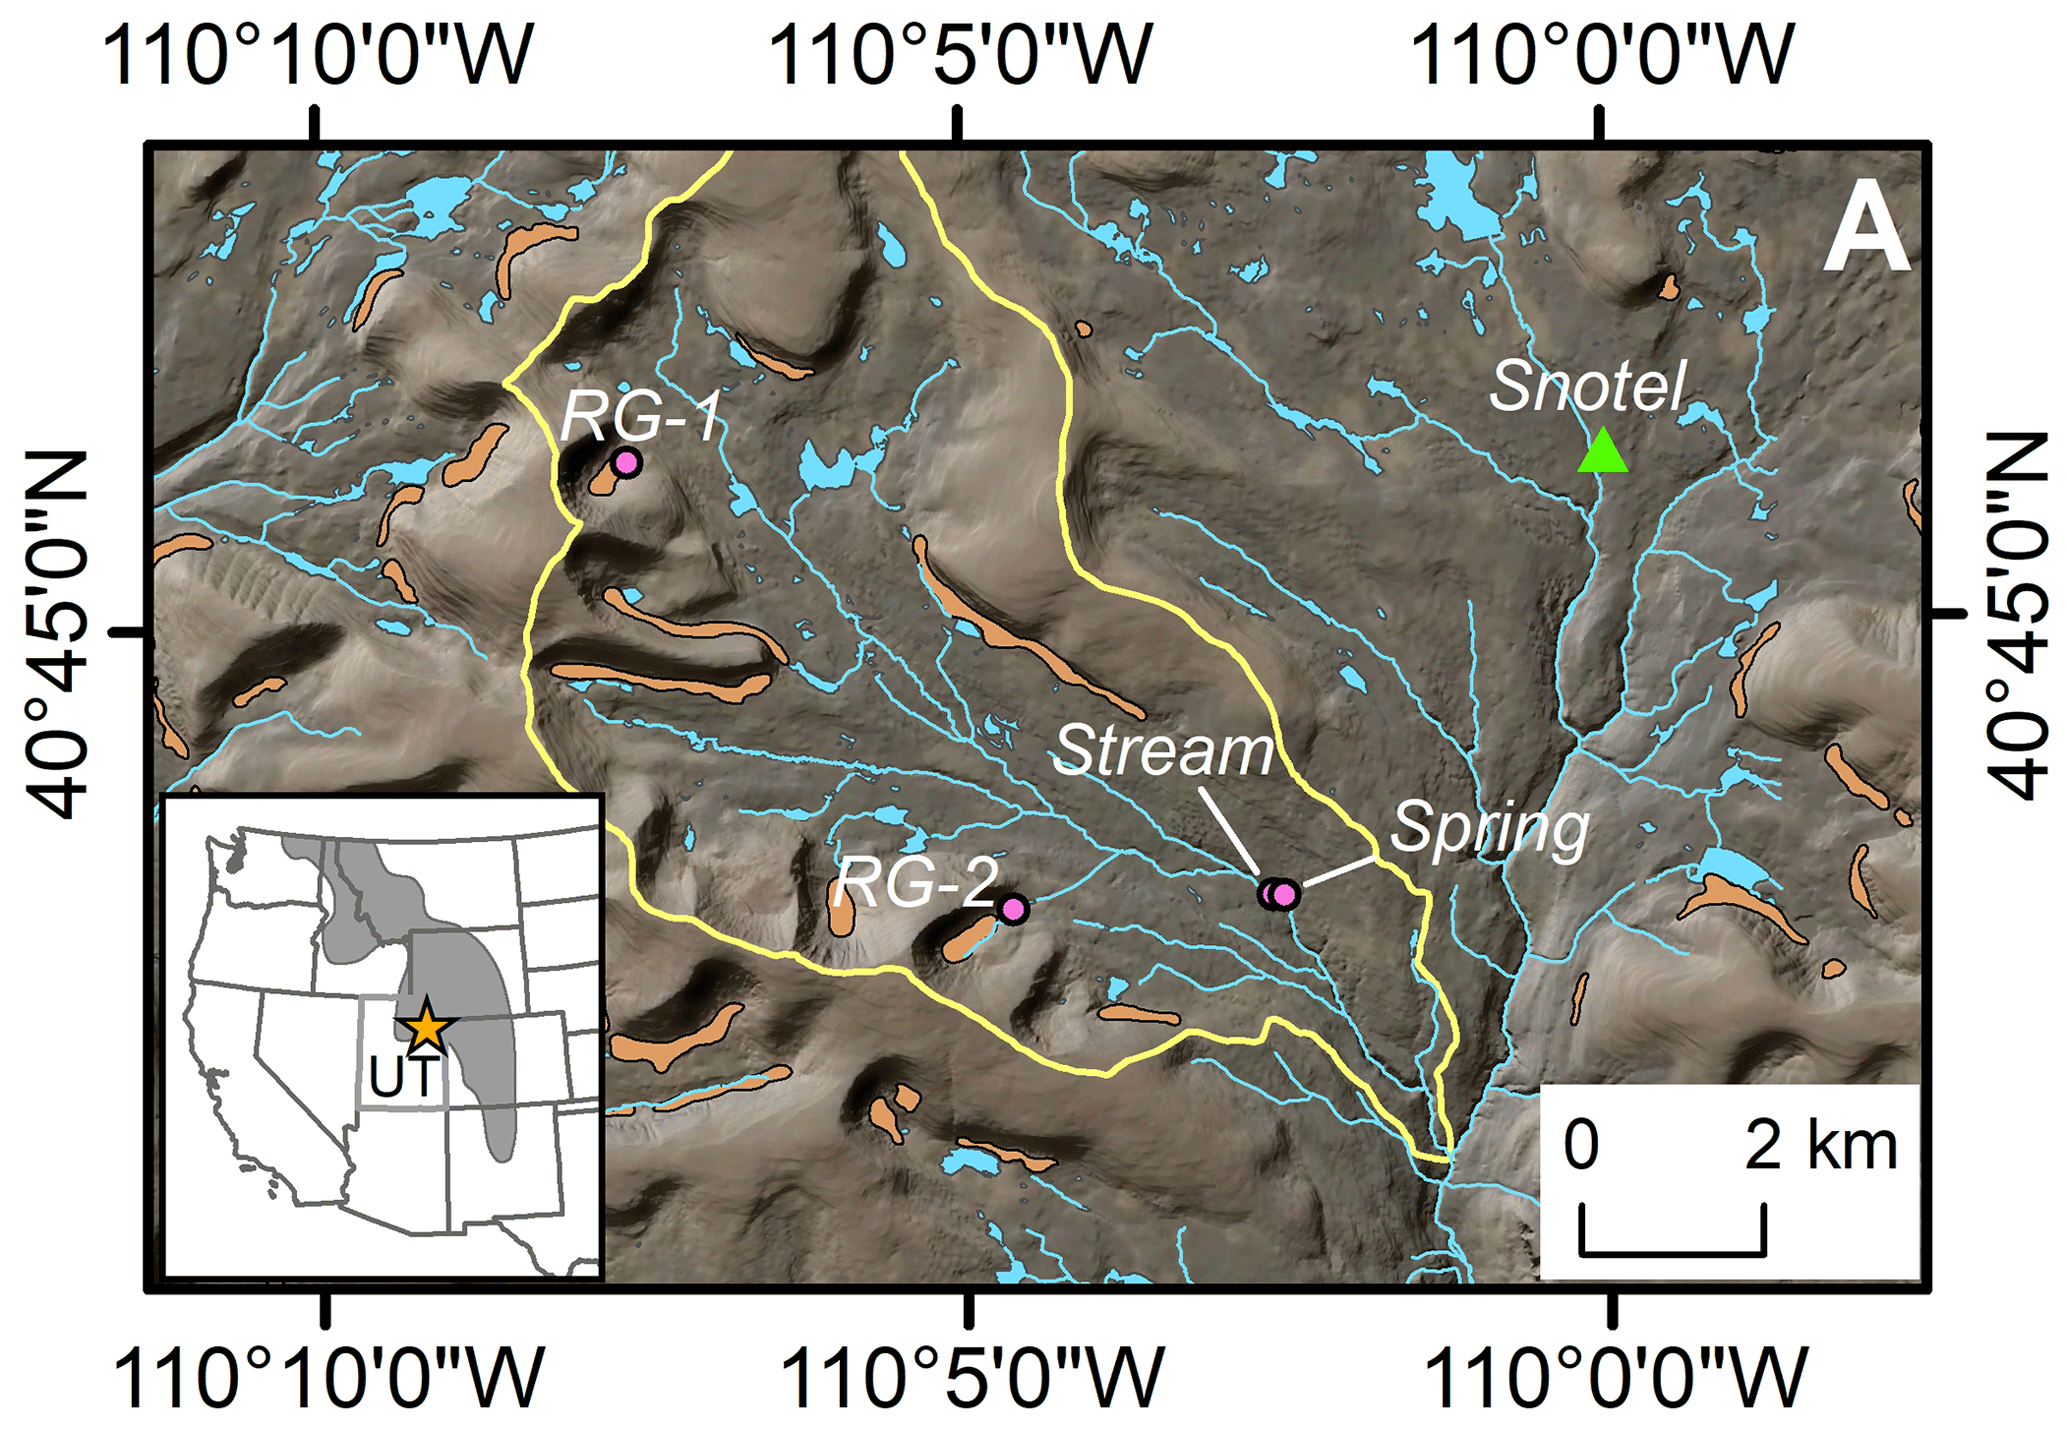
Figure 1Location map of the study area. Inset shows location of the Uinta Mountains (orange star) within the state of Utah (UT). Shaded gray polygon represents the Rocky Mountains. Map presents the upper Whiterocks River watershed (yellow boundary), mapped rock glaciers (orange), the locations of the RG-1, RG-2, Stream, and Spring water samplers (pink circles), and the Chepeta SNOTEL site (green triangle). Background image from Esri.
This project centered on the collection of time series of water samples using automated samplers outfitted with a carousel of 24 bottles. The samplers were deployed with a solar-powered battery system, allowing them to run throughout the summer. To reduce the possibility of isotopic fractionation related to evaporation, sample bottles were modified following published methodology (von Freyberg et al., 2020). In each location, the samplers were deployed in a position higher than their intake to facilitate free draining of the intake hose between samples. The weighted strainer on the end of the water intake line was wrapped in 100 µm nylon mesh to prevent coarse material from clogging the pump. Each sampler was programmed to collect a 45 mL sample twice each day, at midnight and noon. For 3 d, these samples (6 samples in total) were composited in a single bottle, thus the 24 bottles in each sampler represented a maximum deployment duration of 72 d.
Two samplers were deployed at springs discharging from the base of rock glaciers that were the focus of previous investigations (Munroe, 2018). These features, “RG-1” and “RG-2”, are typical of cirque floor, tongue-shaped rock glaciers in the Uintas (Figs. 1 and 2). Each is approximately 600 m long, 100 m wide, and has steep frontal and side slopes standing up to 20 m tall. Fresh exposures on these slopes reveal that the rock glaciers consist of several meters of coarse, openwork boulders overlying a diamicton with a sand matrix. Internal ice is not exposed in either rock glacier, however data loggers reveal that the springs maintain a temperature of 0 ∘C throughout the summer, and rock glacier surface temperatures equilibrate at −5 ∘C or colder beneath winter snow cover (Munroe, 2018). Satellite InSAR (interferometric synthetic aperture radar) analysis indicates that these features move slowly during the winter and accelerate during the summer to velocities of ∼10 cm yr−1 (Brencher et al., 2021). Collectively, these observations suggest the presence of ice within the rock glacier interior. The spring sampled at RG-1 has a typical summer discharge of 15 L min−1. The discharge at RG-2 was not measured directly, but a water-level logger records diurnal fluctuations of 0.2 (early summer) to 0.02 m (late summer) of the lake into which the spring flows. Given the surface area of the lake (12 000 m2), these daily variations suggest a discharge in the order of 102 to 103 L min−1. In both cases, these estimates are approximations because much water likely drains belowground through the frost-shattered bedrock and glacial till that mantles the surrounding landscape.

Two additional water samplers were deployed at non-rock glacier locations. The “Spring” sampler collected groundwater discharging from a typical spring unrelated to a rock glacier, and the “Stream” water sampler was positioned slightly upstream along the main channel of the West Fork Whiterocks River, the primary stream in this drainage (Fig. 1). These samplers were configured and programmed in an identical manner to those deployed at the rock glacier springs.
To constrain the properties of precipitation in the study area, grab samples of snow were collected on the surfaces of RG-1 and RG-2 when the water samplers were deployed. Water draining from a melting snowbank on RG-2 was also collected. Rain was collected during the deployment period at the RG-2 and Spring locations using samplers designed to eliminate evaporation-related fractionation of isotope values (Gröning et al., 2012). Given the sampler design, the rain samples are a composite of all precipitation accumulating during each deployment period.
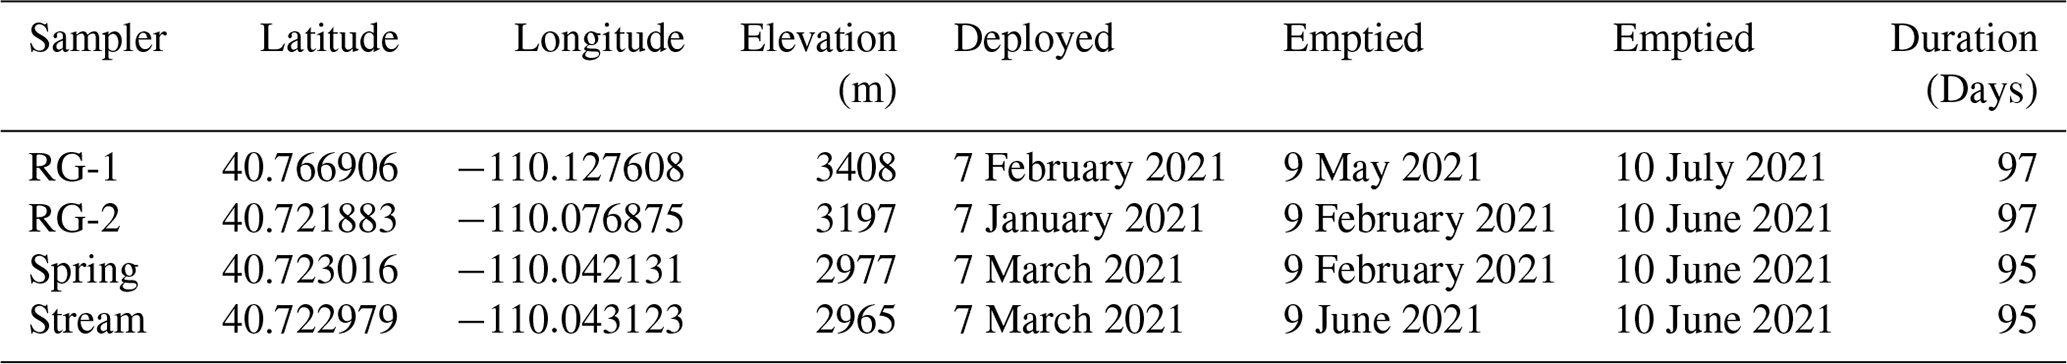
All samplers were installed at the beginning of July 2021 (Table 1), which was the earliest date at which the study area was accessible due to deep winter snow cover. At the Stream, Spring, and RG-2 samplers, a subsample was taken from the first bottle about a week later, with the remainder left inside the sampler. It was not possible to revisit the more distant RG-1 sampler at this time. This procedure provided a check on the potential role of evaporation fractionating the water samples as they waited inside the sampler. All bottles were emptied at the beginning of September, and the samplers were relaunched to run until mid-October when they were emptied again and deactivated for the winter. The two precipitation samplers were emptied when the water samplers were serviced. All samples for stable isotope analysis were filtered in the field to 0.2 µm and stored in 7 mL glass vials with Teflon-lined caps. Samples for inductively coupled plasma mass spectrometry (ICP-MS) analysis were stored in 15 mL centrifuge tubes. These samples were vacuum-filtered with Whatman Number 1 paper in the laboratory and acidified to pH 2 with trace-element grade HNO3. In a preliminary phase of this project, daily samples were also collected at RG-2 in the fall of 2020.
Table 1Locations, dates, and durations of water sampler deployments.
Stable isotope measurements were made with a Los Gatos 45-EP Triple Liquid Water Isotope Analyzer at Middlebury College. Samples were run against a bracketing set of five standards and calibrated with a cubic spline function. Each sample was analyzed 10 times, with the first 2 injections discarded to minimize cross-over. Standards were run as unknowns after every five samples as an internal check on the results. Accuracy of the instrument is 0.4 ‰ for δD and 0.1 ‰ for δ18O. The standard deviation of repeat injections of the samples in this study was 0.17 ‰ for δD and 0.04 ‰ for δ18O. Results were compared with the global meteoric water line (GMWL; Craig, 1961) as well as a local meteoric water line (LMWL) estimated from the Online Isotopes in Precipitation Calculator (OIPC; Bowen and Wilkinson, 2002; Bowen and Revenaugh, 2003). Values of d-excess were calculated as d-excess (Dansgaard, 1964).
Hydrochemical characterizations were made with a Thermo iCap ICP-MS at Middlebury College. Samples were run against a set of standards derived from NIST Standard Reference Material 1643f “Trace Elements in Water”. An in-house standard was used to determine the abundance of Si and Ti, which are not present in 1643f. The NIST standard and the in-house standards were run after every 10 unknowns and a linear correction was applied to compensate for instrument drift. Interpretation focused on elements that consistently exhibited concentrations >1 ppb.
In total, 141 water samples were analyzed, consisting of 134 samples from the 4 time series, 4 samples of rain, 2 samples of snow, and 1 sample of snowmelt. The time series are essentially complete with no gaps between early July and mid-October. The lone interruption is one bottle from the Stream sampler, representing 18–20 July, that was empty, apparently because the river level briefly dropped below the intake hose.
Overall values of δD in the time series range from −118.94 ‰ to −83.71 ‰. Values of δ18O range from −16.36 ‰ to −12.24 ‰, and δ17O from −9.13 ‰ to −6.39 ‰ (Table 2). The mean of δD is lowest in the Spring samples (−113.44 ‰) and highest at RG-1 (−91.24 ‰). The same pattern holds for mean values of δ18O and δ17O (Table 2). Values of d-excess are highest at the RG sites, and lowest (∼10 ‰) in the Stream (Table 2). Values of δD and δ18O for the subsamples from the first bottle in the Stream, Spring, and RG-2 samplers are quite similar to the remainder that was left in the collector through the summer (Fig. 3).
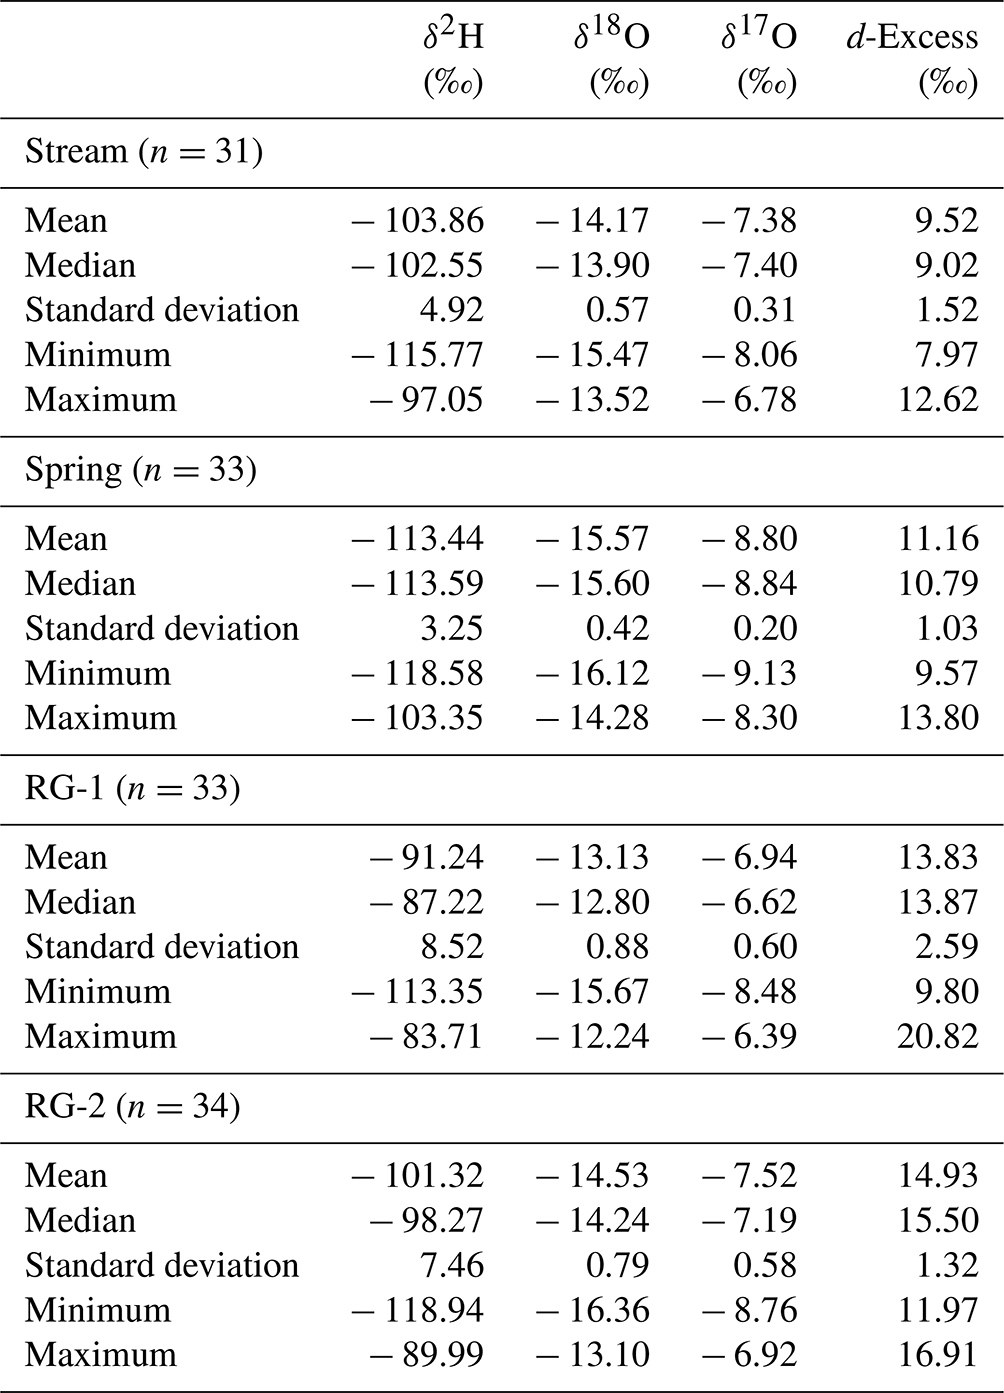
Figure 3Comparison of isotope values measured for samples from RG-2, the Stream, and the Spring samplers. Subsamples were removed from the first sample in early July and the remainder of the water was left inside the collector until early September. Analysis of the sample pairs confirms that potential evaporation-related fractionation was minimal.

Figure 4Dual isotope plot of δ18O and δD for the samples collected at RG-1, RG-2, the Stream, and the Spring. The global meteoric water line (GMWL), a local meteoric water line (LMWL) determined from the Online Isotopes in Precipitation Calculator (Bowen and Wilkinson, 2002; Bowen and Revenaugh, 2003), and a linear fit to the data are presented for reference.
Values of δD and δ18O are linearly and significantly (p<0.001) related with a slope of 8.8 and a Y intercept of 24.4 ‰ (Fig. 4). Lower values of δ18O plot closer to the GMWL; higher values of δ18O plot increasingly above the GMWL. Plotting the data from the individual samplers separately, with color-coding by month, reveals additional details (Fig. 5). Values for the Stream and Spring samplers plot along the GMWL through the summer. For the Stream, the lowest values are from July with higher values in late summer and fall. For the Spring, the lowest values are again in July, with the highest values in August; September and October values fall in between (Fig. 5). For the two rock glaciers, July values are low and closer to the GMWL, but values from late summer and the fall are plotted notably above the GMWL with d-excess up to 20 ‰. At RG-2, a similar pattern was noted in daily samples collected during September 2020 (Fig. 5). Figures 4 and 5 also illustrate that isotope values are significantly more depleted at RG-2 compared with RG-1.
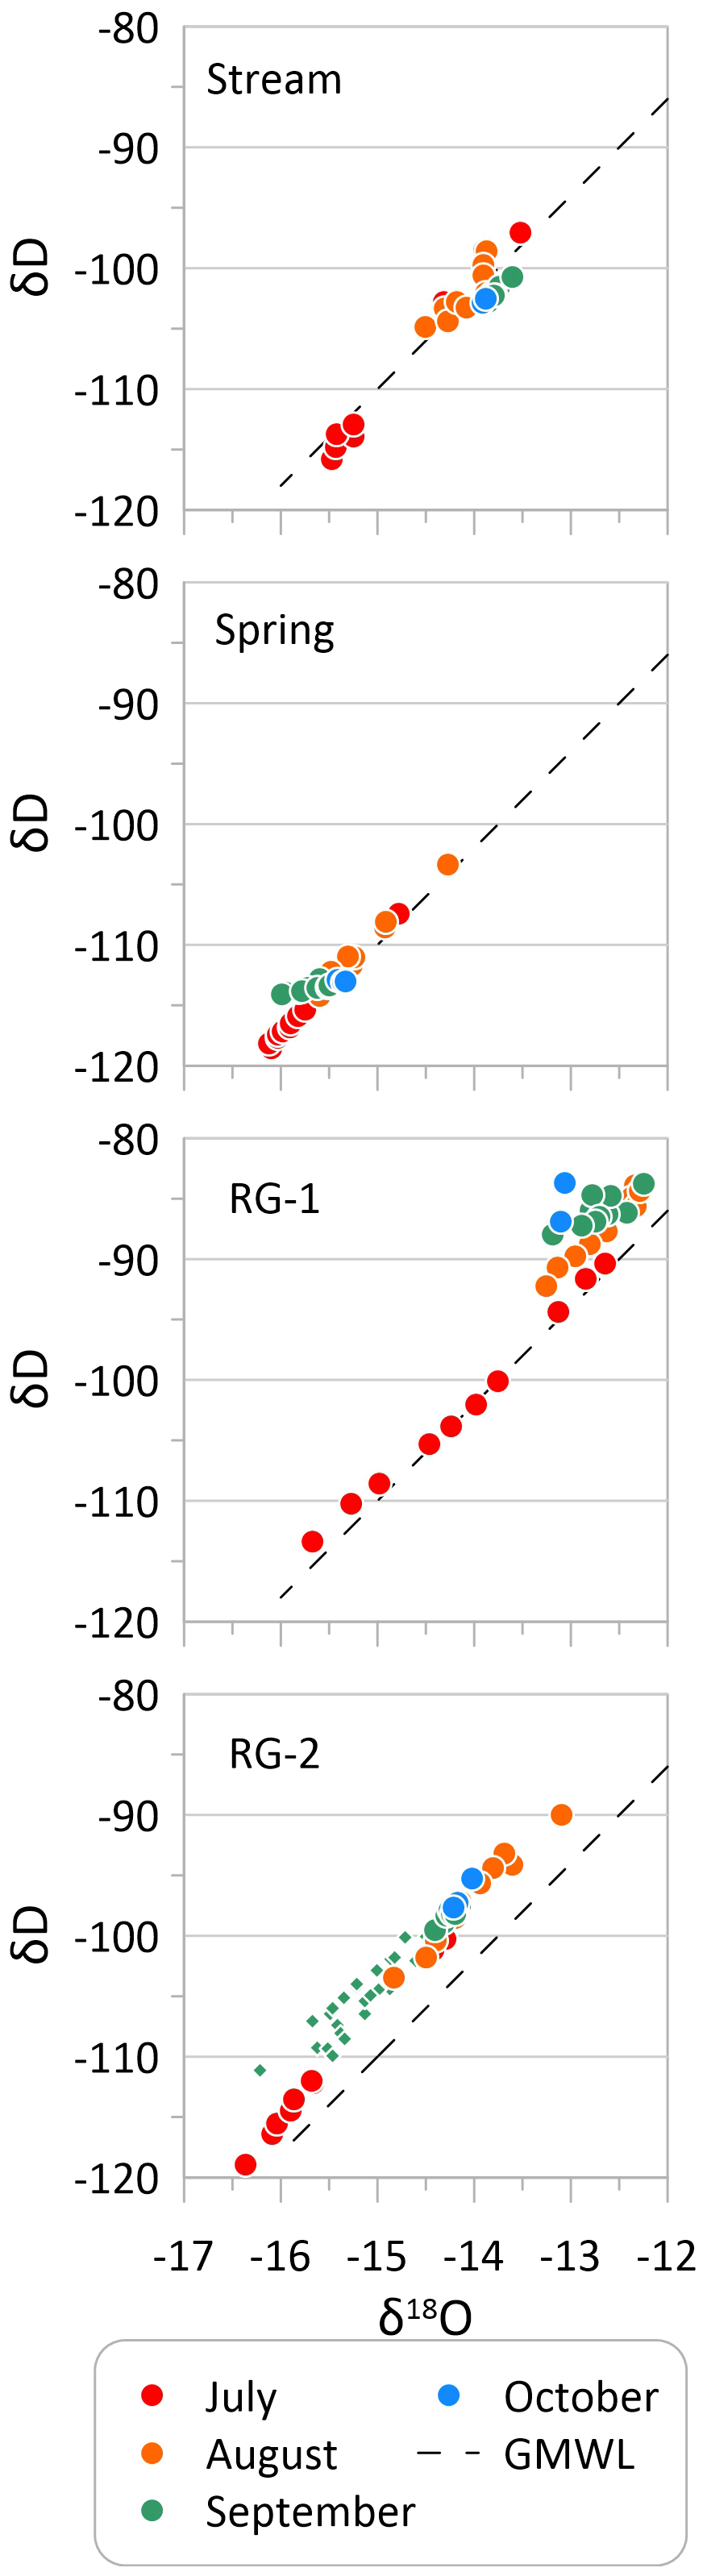
Figure 5Dual isotope plots for the 4 individual time series. Color-coding represents the month of sample collection. The tendency for samples at the Stream and Spring to remain on the waterline while samples from the rock glaciers deviate to higher values of d-excess in late summer and fall is clearly evident. Green diamonds for RG-2 present reconnaissance data from September 2020.
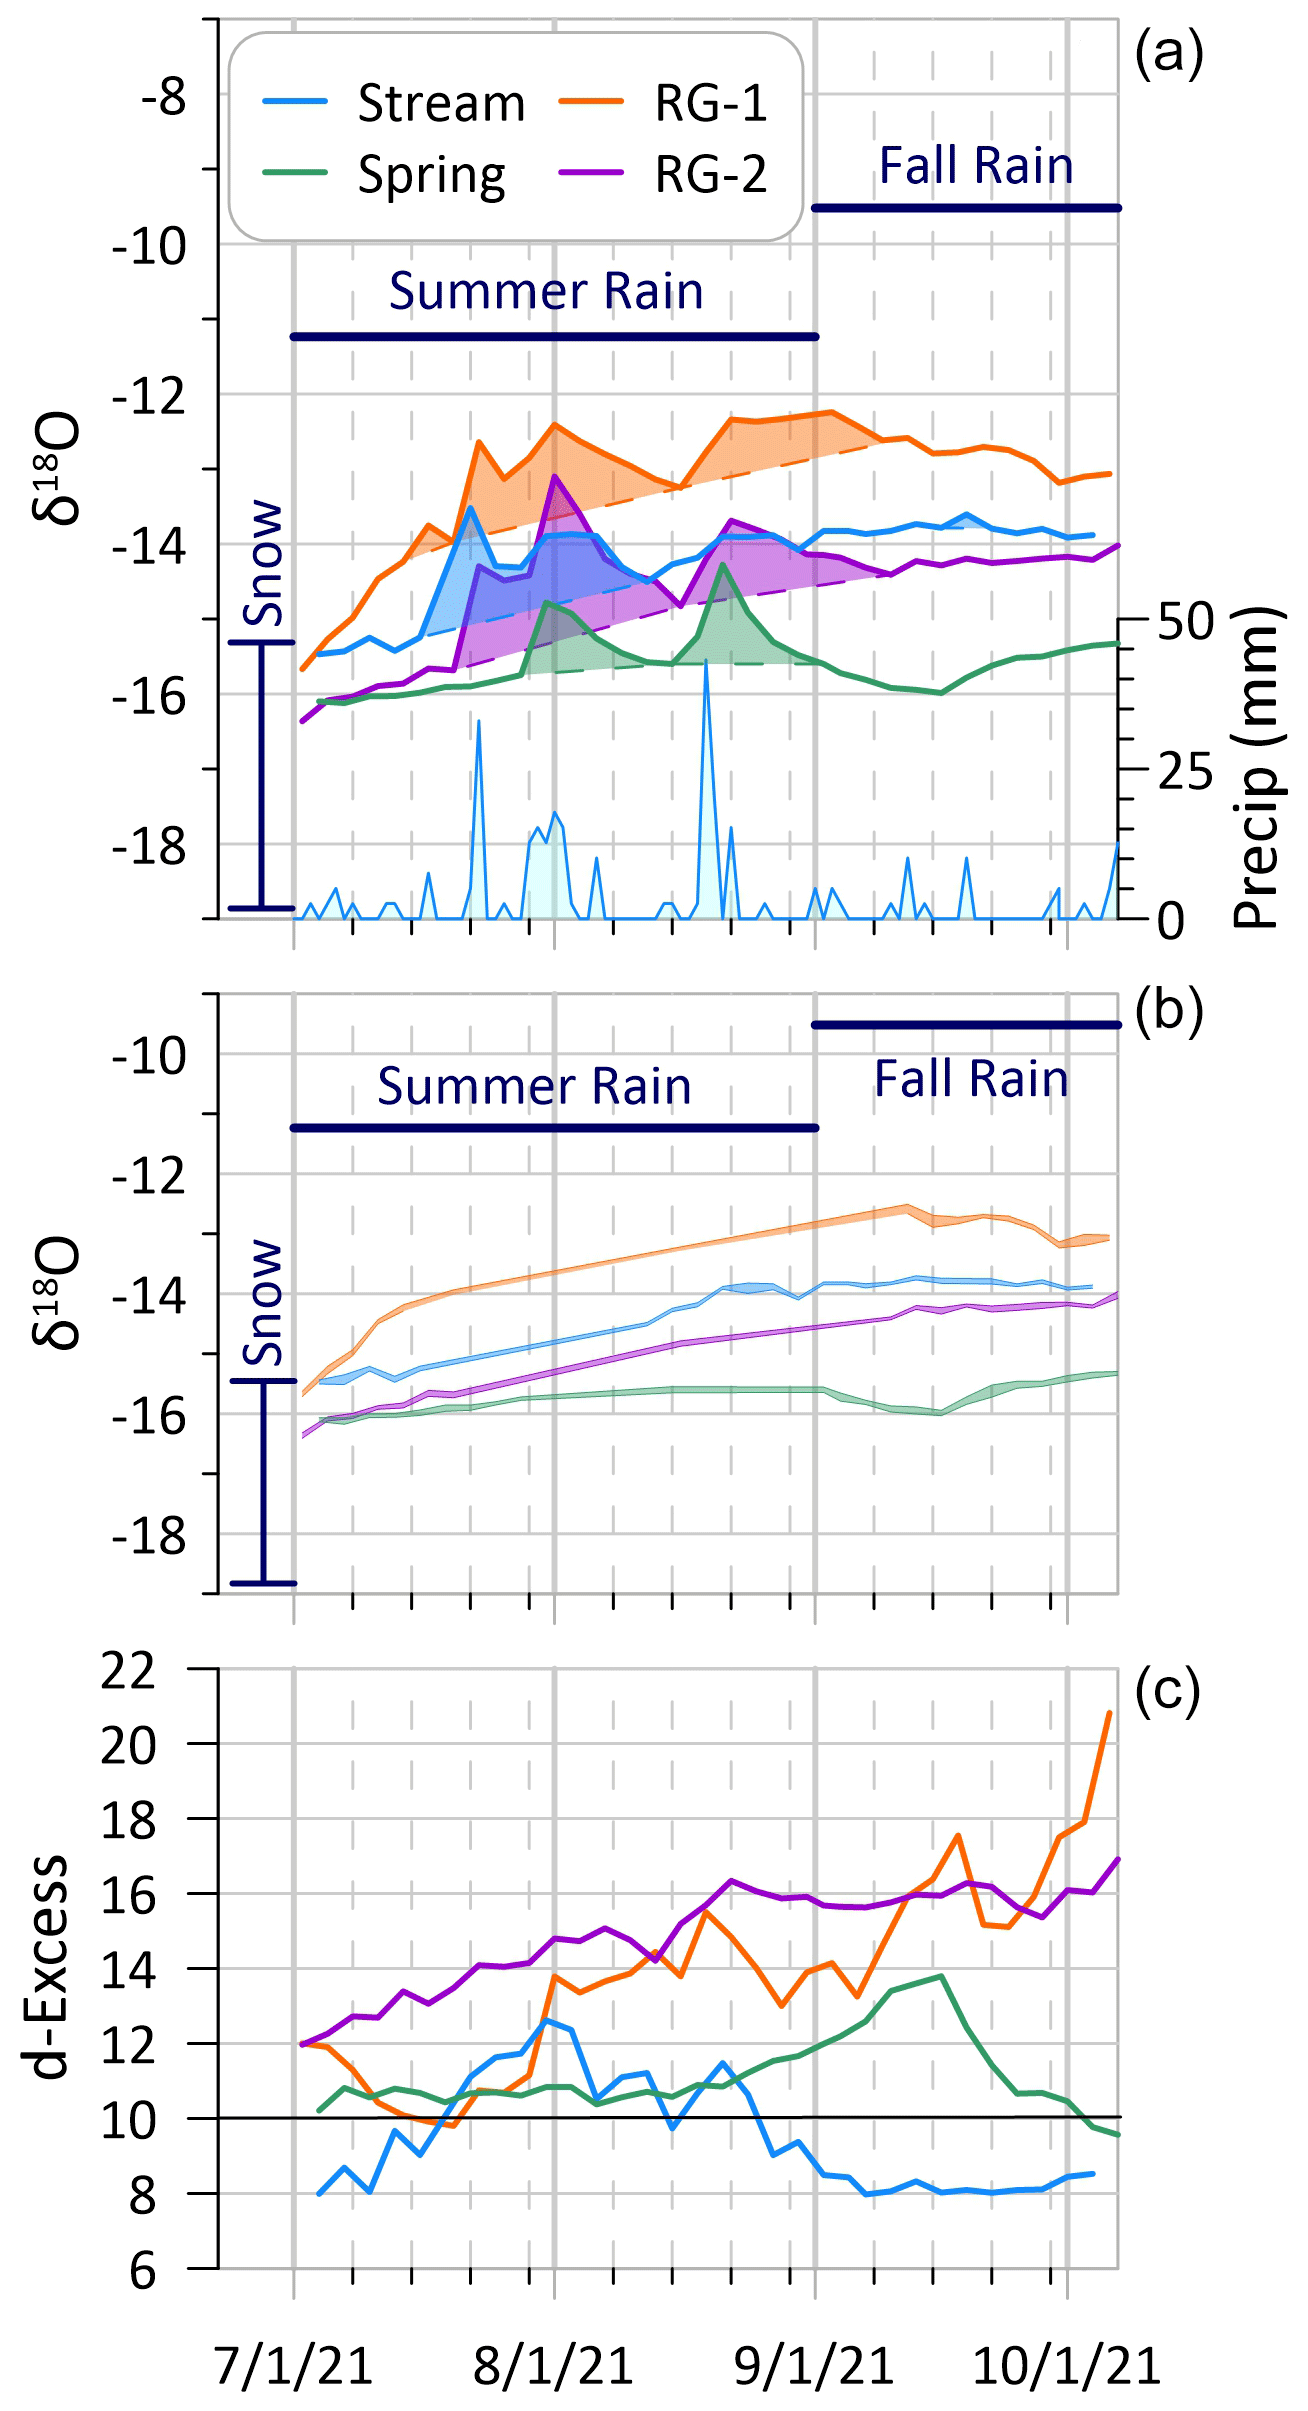
Figure 6Time series from the 4 sampling sites. (a) Values of δ18O presented along with average values for snow and rain, and daily precipitation recorded at the Chepeta SNOTEL site (Fig. 1). (b) Same as panel (a) with transient spikes in δ18O due to precipitation events removed. Line width represents ±1 standard deviation. (c) Times series of d-excess. The reference value of 10 ‰ is highlighted.
Plotting the data from the different samplers as time series reveals patterns in the evolution of isotope values during the sampling period (Fig. 6). Given the strong correspondence between values of δD and δ18O, only δ18O is presented for clarity. Values are low at the start of the sampling period (early July) and generally rise in all records through the summer and early fall (Fig. 6a). The Spring and RG-2 both start below −16 ‰; the Stream and RG-1 start slightly higher, near −15.5 ‰. All of the records exhibit transient spikes to less negative values that occur quickly and taper gradually back to background levels (Fig. 6a). These spikes align with pulses of precipitation recorded at the Chepeta SNOTEL (snowpack telemetry) site <10 km to the north, and at a similar elevation (Fig. 1). Thus, it is likely that they represent rainstorms that delivered water less depleted in δ18O relative to Standard Mean Ocean Water (SMOW), a response reported in other studies (Krainer and Mostler, 2002). After these pulses are removed from the data to highlight the background trends at each of the sites (Fig. 6b), the record from the Spring sampler is seen to be the most stable, with nearly all values between −16 ‰ and −16.5 ‰. The water at RG-2, which started off similar to the Spring, rises steadily to a maximum of −14 ‰ in early October. The Stream rises from −15.5 ‰ to −14 ‰ by the third week of August, and stabilizes through the end of the record. Finally, RG-1, which also starts at −15.5 ‰, rises rapidly in the first half of July, then more gradually until early September, when it peaks at −12.5 ‰ before dropping to −13 ‰.
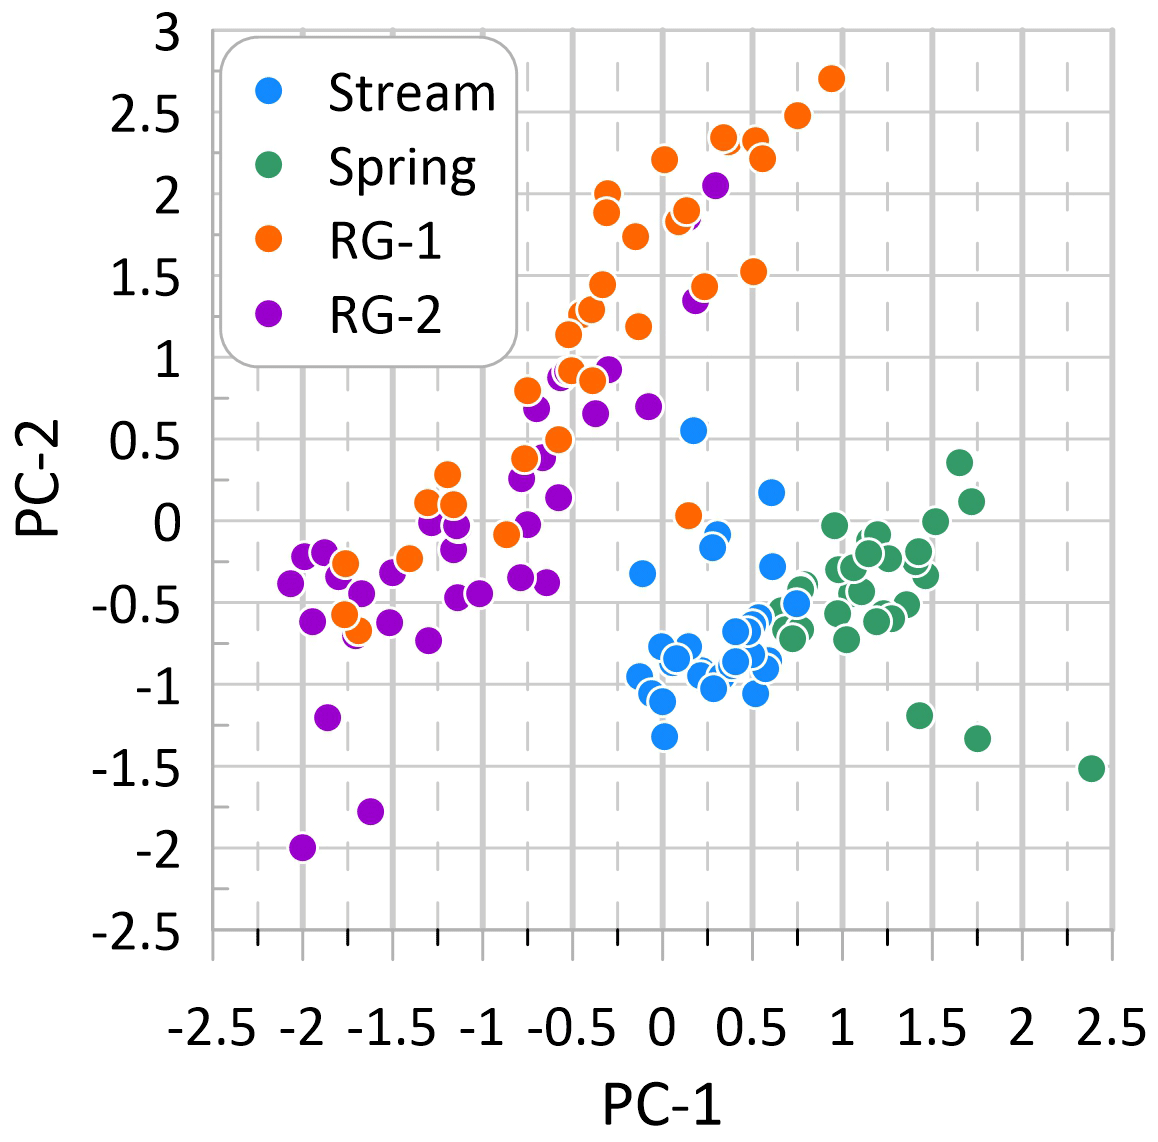
Figure 7Biplot of the first and second principal components determined for major elements in the water samples. The similarity of the rock glacier water samples is clear, as is their lack of overlap with the Stream and Spring samples.
Values of d-excess in the time series exhibit varying patterns (Fig. 6c). Values from the Stream initially rise, then fall through August and stabilize at 8 ‰ in the fall. The Spring samples are initially stable between 10 ‰ and 11 ‰, then rise in early September to a high of 14 ‰, before falling back to 10 ‰. The two rock glacier sites, in contrast, rise steadily from near 10 ‰, to ≥17 ‰ in early October (Fig. 6c).
Context for the isotope values from the water samplers is provided by the precipitation samples collected at the Spring and RG-2 sites, and grab samples of snow from RG-1 and RG-2 (Fig. 6). Values of δ18O in composited July and August precipitation at the Spring and RG-2 sites average −11.2 ‰, and fall precipitation averages −9.5 ‰. Values of δ18O in snow samples are lower, averaging −17 ‰ (with d-excess ∼10 ‰) with a range from −15.3 ‰ to −18.6 ‰. This wide range is not surprising given that the stable isotopic composition of snow can vary spatially across complex mountain terrain (Dietermann and Weiler, 2013) and can evolve through winter sublimation and the process of snowpack melting (Taylor et al., 2001; Unnikrishna et al., 2002; Earman et al., 2006; Lechler and Niemi, 2012). Nonetheless, these measurements are consistent with other reported snow samples from the Uintas (Munroe, 2021) and with values predicated by the OIPC (Bowen and Wilkinson, 2002; Bowen and Revenaugh, 2003). Thus, they are considered to provide a reasonable constraint on the isotopic composition of snow within the study area.
Hydrochemical analysis with ICP-MS reveals 12 elements that are consistently detectable in these samples: Ba, Ca, Fe, K, Mg, Mn, Na, Ni, Rb, Si, Sr, and Ti. Ca and Si are generally the most abundant cations, with mean abundance ∼1500 to 2000 ppb, followed by K, Na, and K with abundances averaging 500–800 ppb. Fe and Ba are generally present at abundances around 100 ppb; other elements are present at lower concentrations (Table 3). Principal component analysis of these elemental concentrations, conducted with a varimax rotation, places five elements (Ba, Ca, Na, Mg, Ni) on the first component (PC-1), with Ti, Rb, Si, K, Sr, and Mn on the second (PC-2). Together these two components explain 78 % of the variance. Highest values of PC-1 are found in the Spring samples, followed by the Stream and the two rock glaciers. In contrast, PC-2 is highest at the rock glacier sites and lower in the Stream and Spring. Plotting of PC-1 vs. PC-2 reveals a nearly complete separation between the rock glacier water and samples from the Stream and Spring (Fig. 7). When considered as time series, values of both components are generally stable at the Stream and Spring, but rise consistently through the summer and fall at RG-1 and RG-2 (Fig. 8).
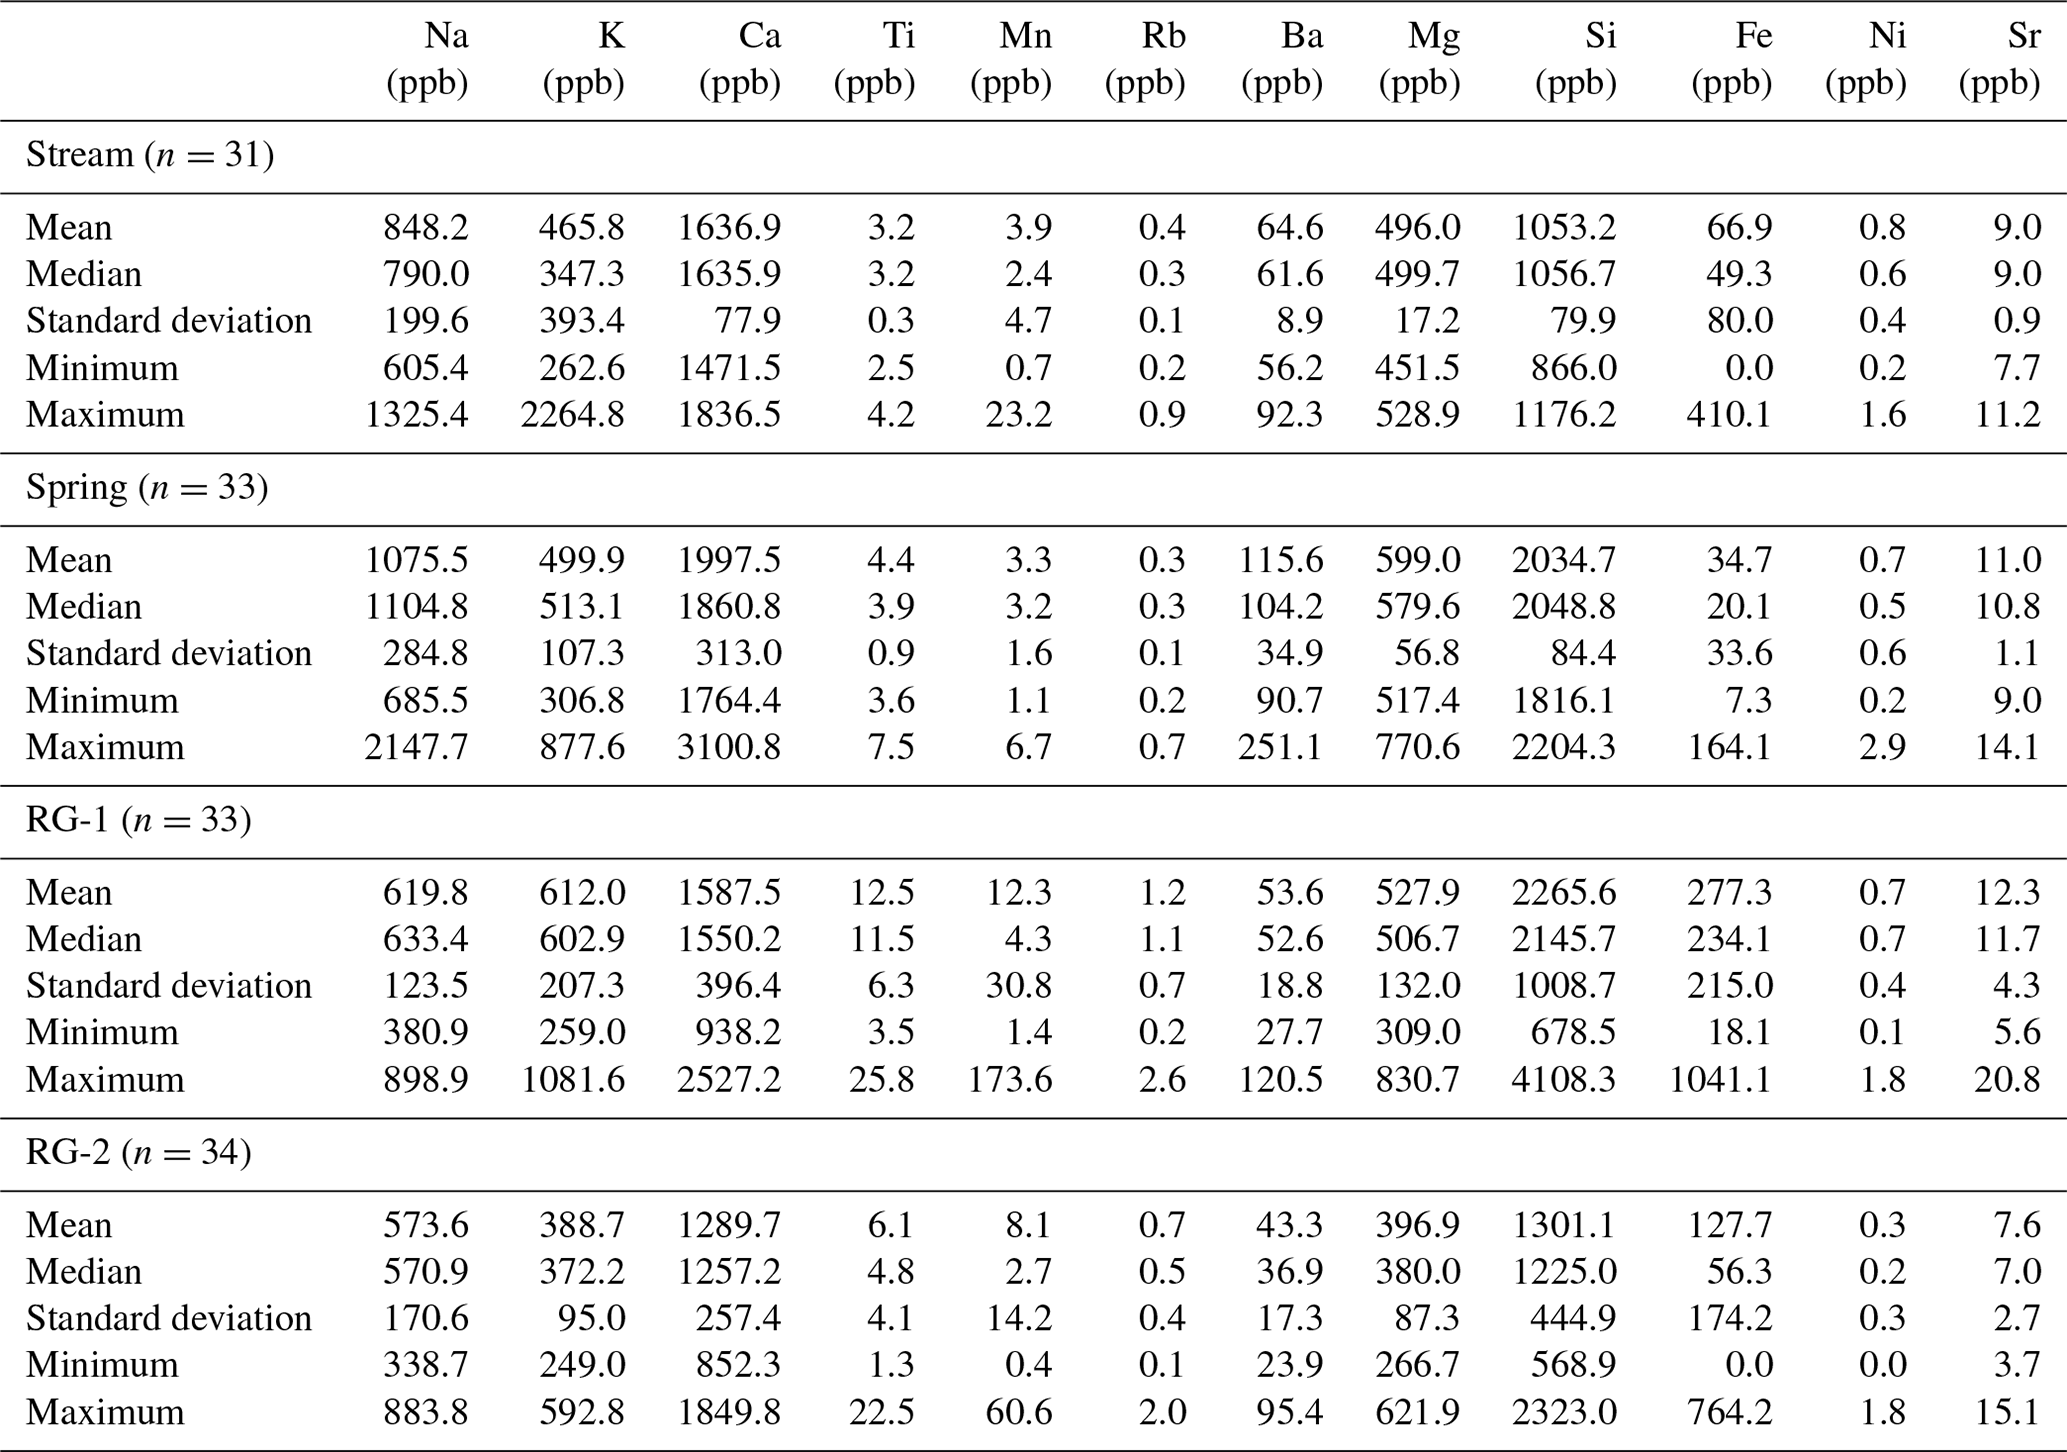
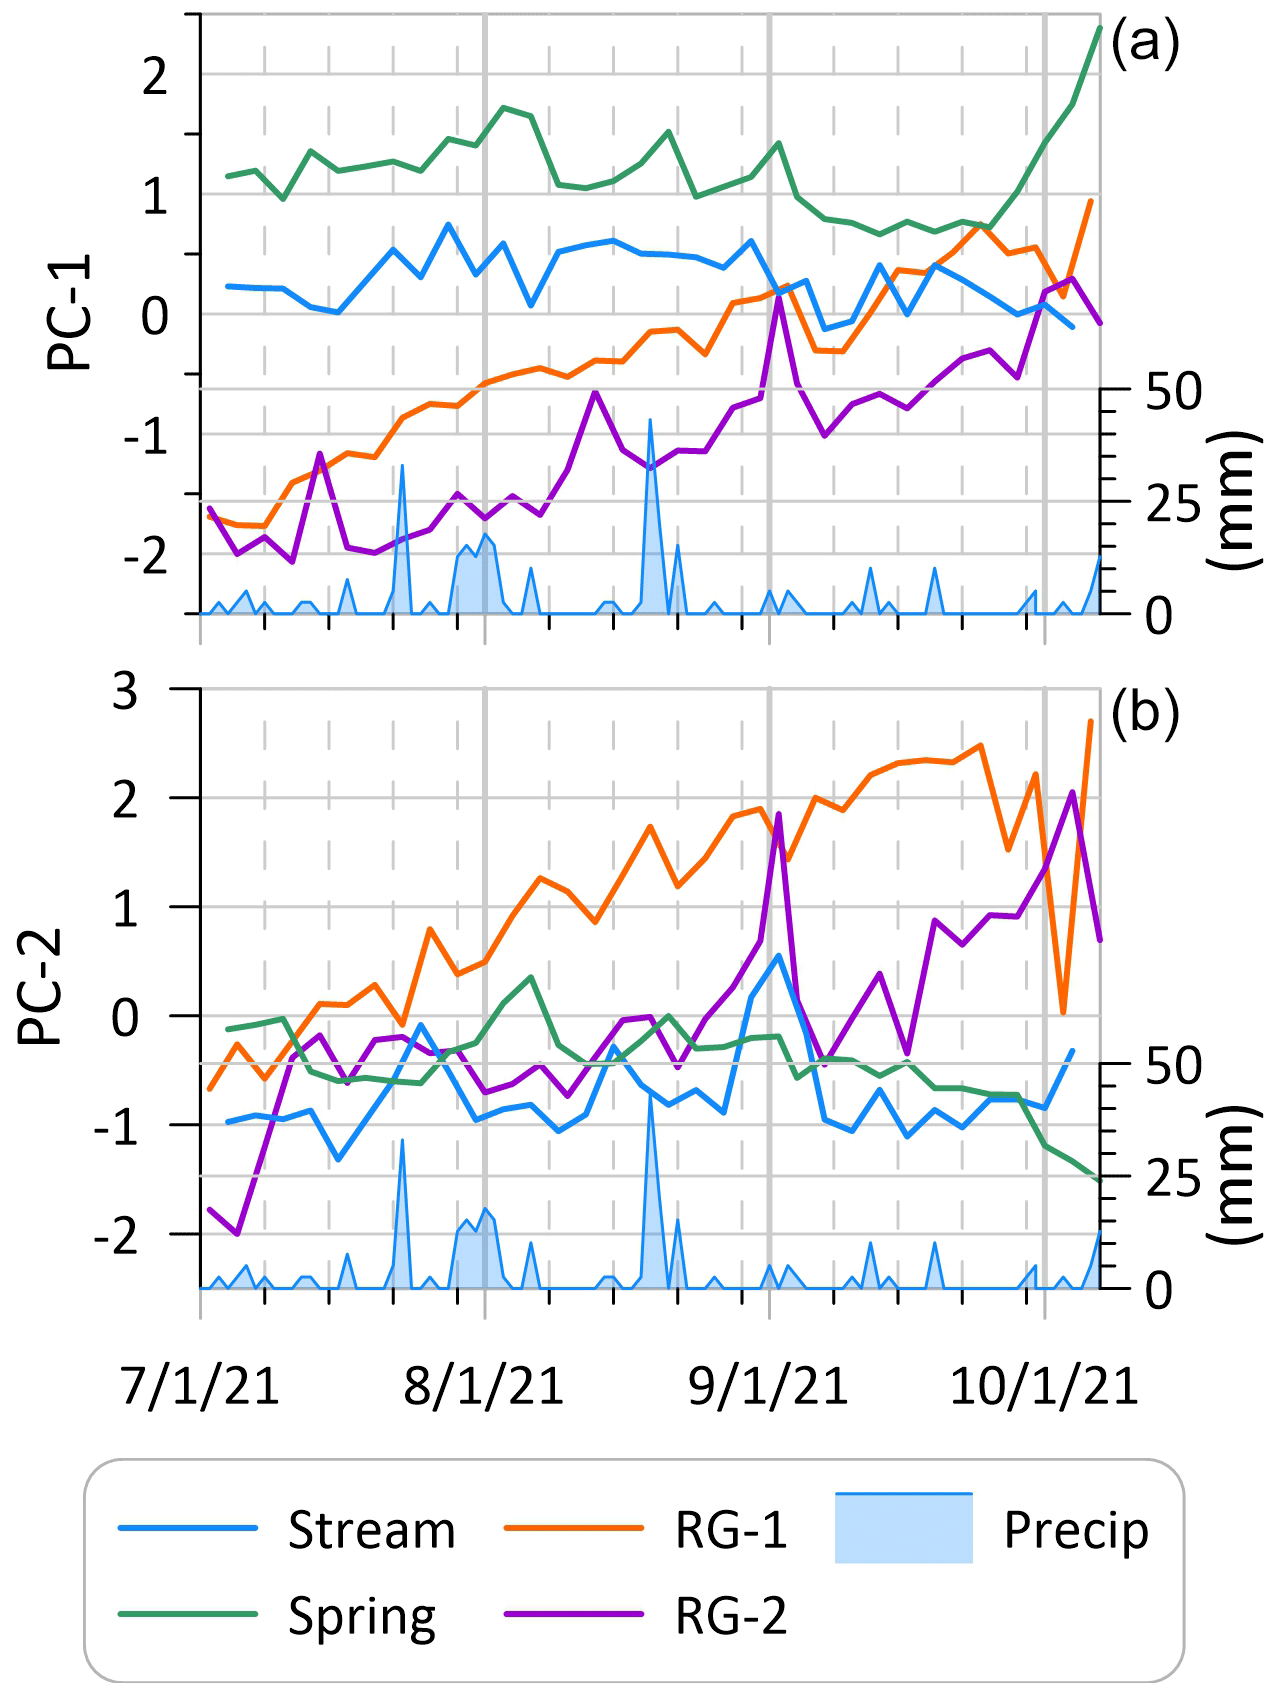
Figure 8Time series of the first and second principal components presented in Fig. 7. Values tend to be stable through the melt season at the Stream and Spring but rise notably at both the rock glacier sites.
The same 12 cations were generally detectable in the precipitation samples, with the exception of Fe, which was typically below the detection limit. Values of Na, K, Mn, Rb, Fe, Ni, and Sr were higher in snow samples relative to rain, with particularly high values of Na and K in the July snow sample from the RG-2 site (Fig. 9). In contrast, Ca, Ti, Ba, Mg, and Si were more abundant in rain samples. All elements were less abundant in rain than in the time series.
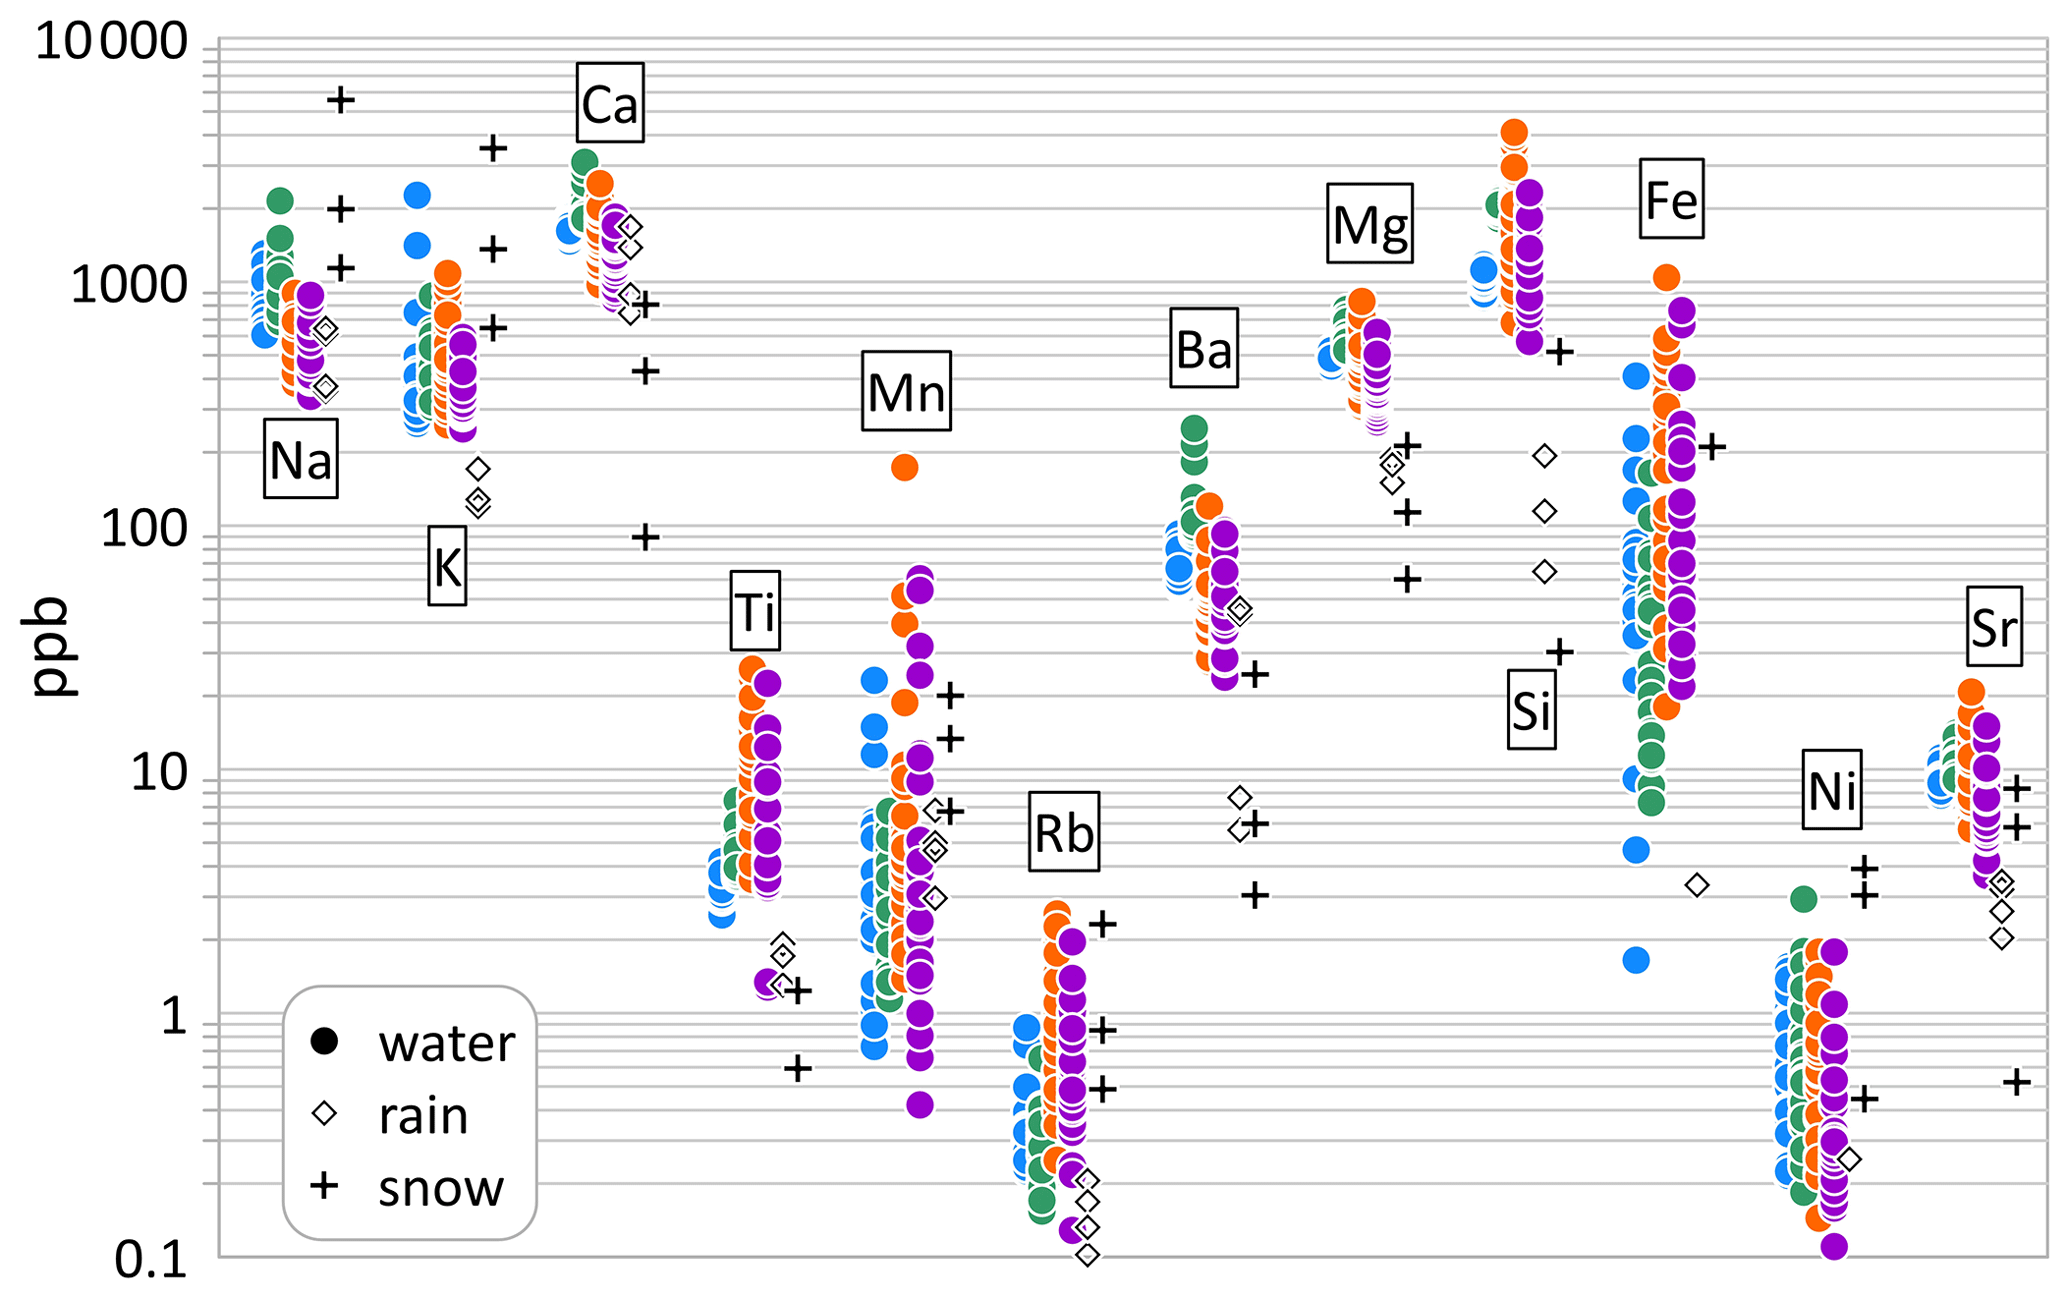
Figure 9Abundances of detectable elements in the time series of water samples, along with the rain and snow samples. Water samples are presented from left to right with the same color designations as previous figures: blue = Stream, green = Spring, orange = RG-1, and purple = RG-2. Note the logarithmic scale on the y axis.
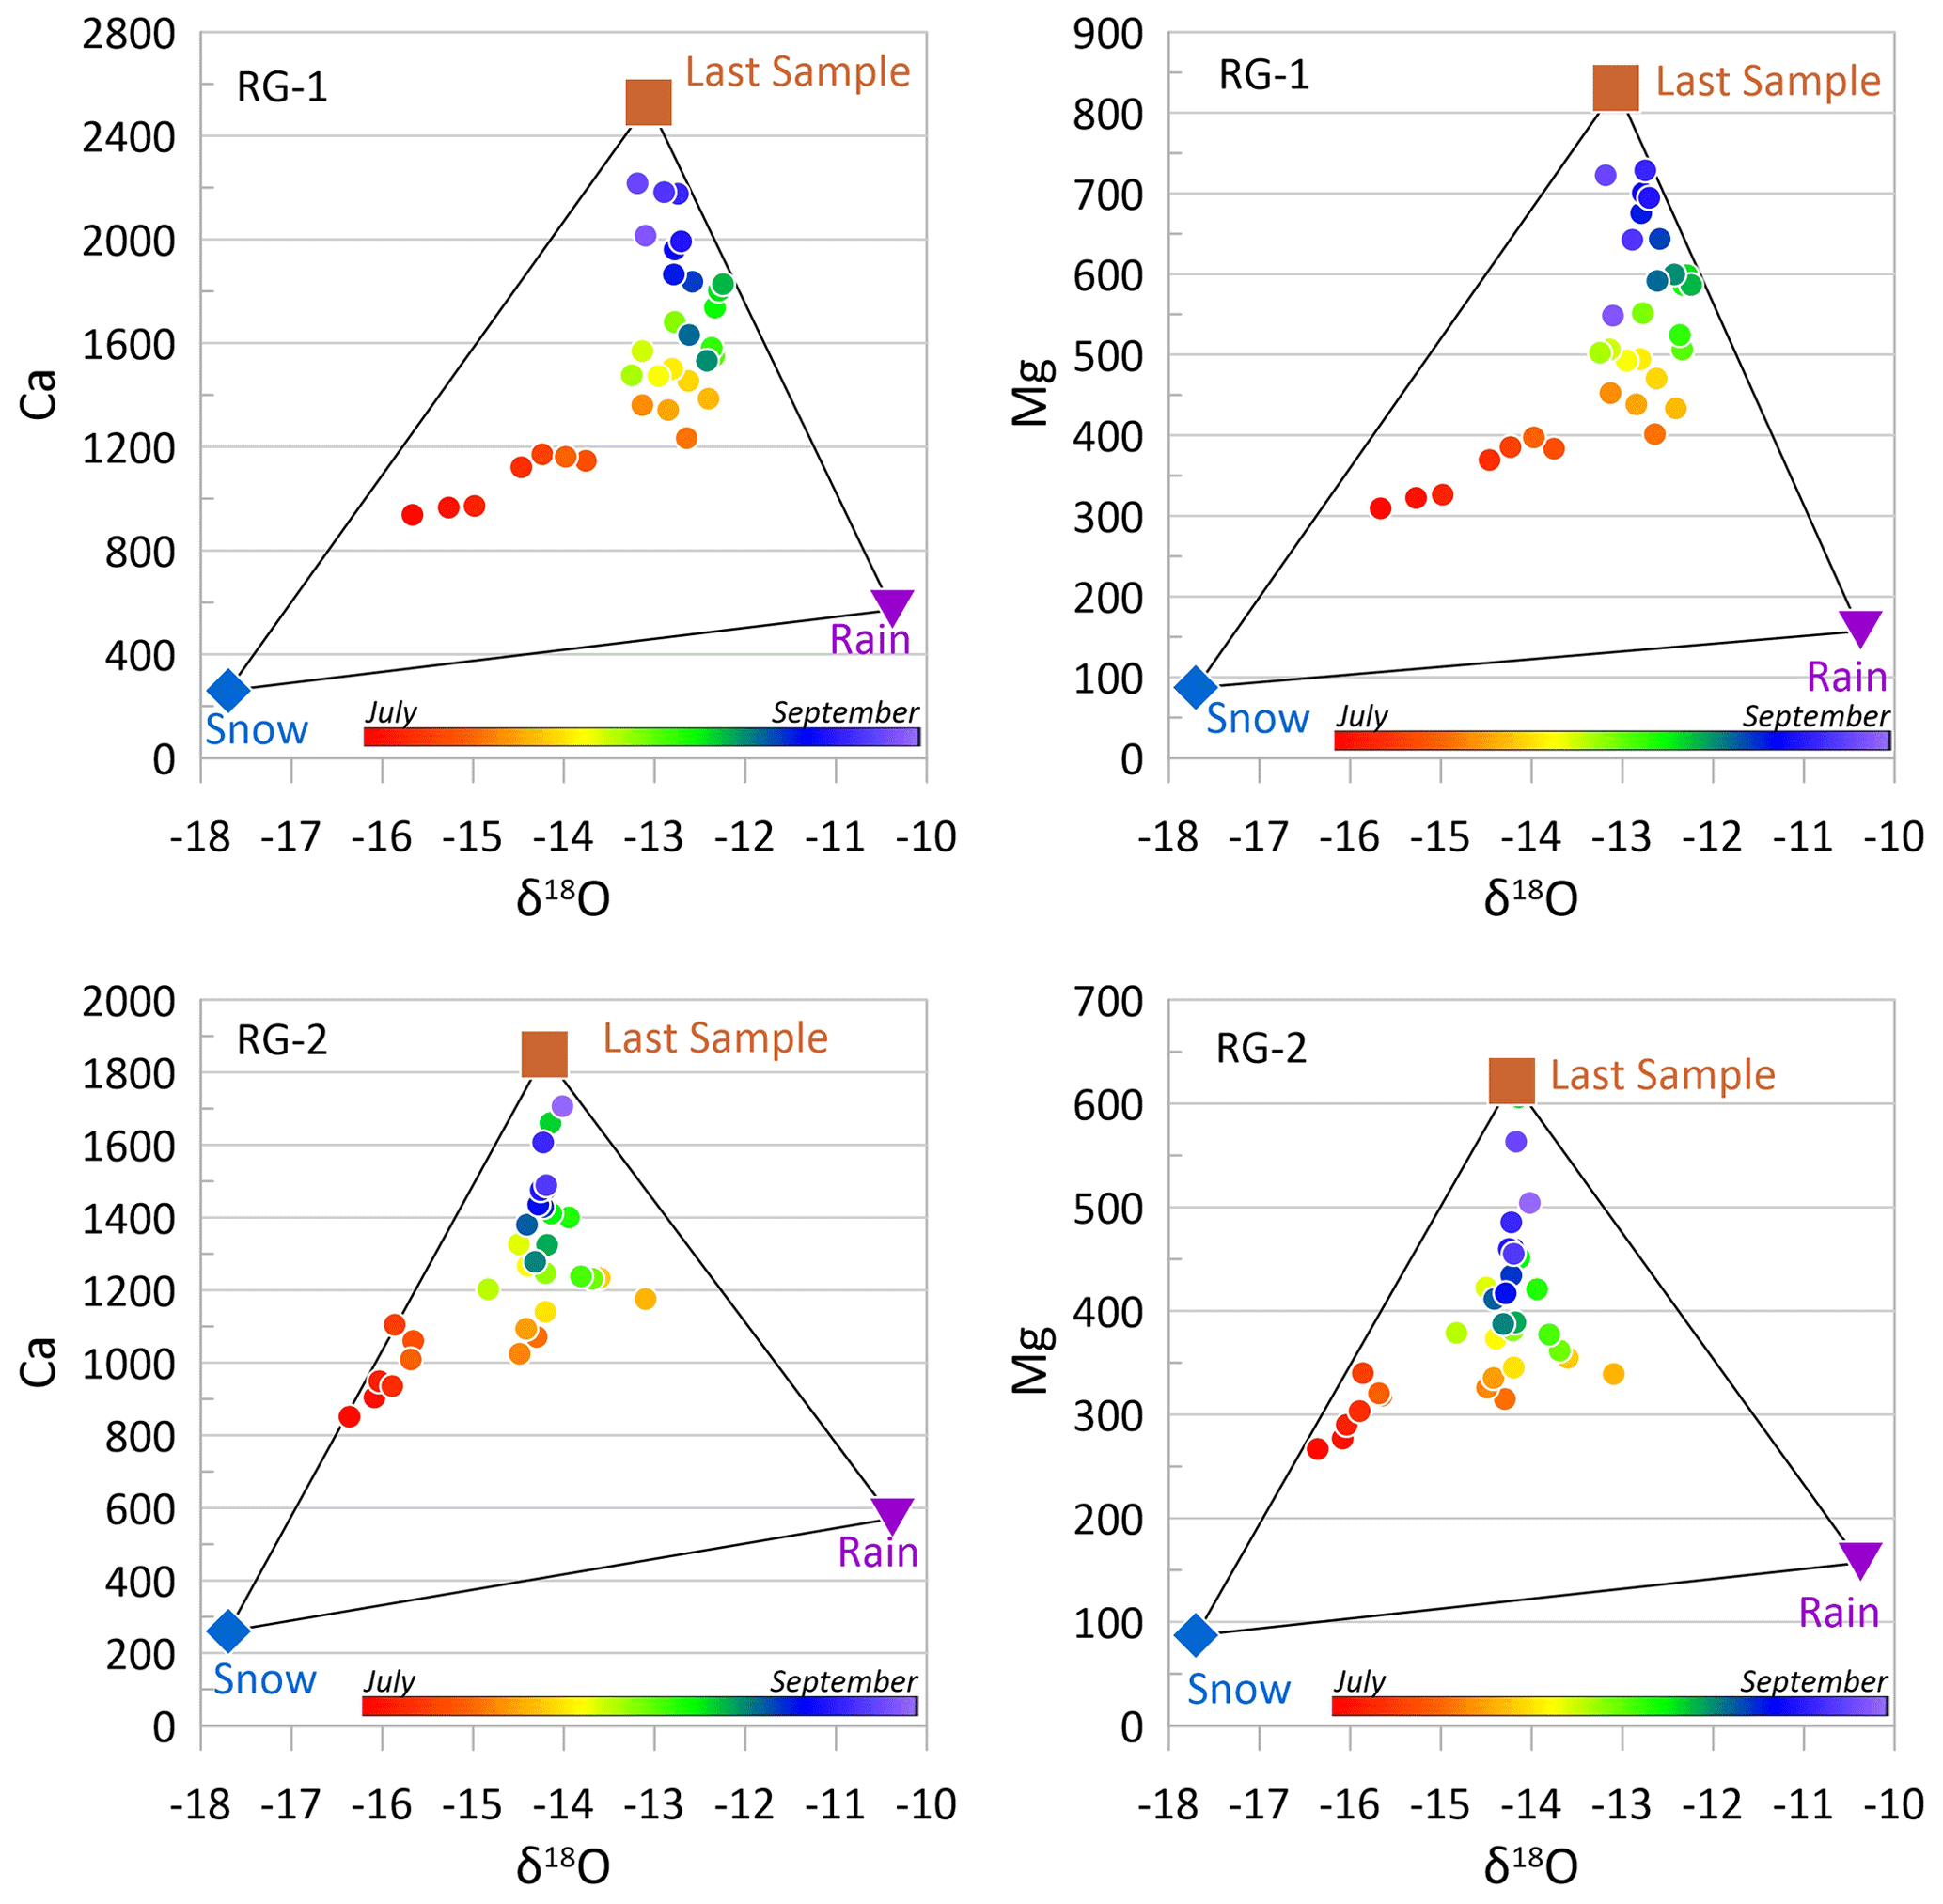
Figure 10Biplots of δ18O vs. Ca and Mg at RG-1 and RG-2. Circles represent water discharging from the rock glacier springs, with the rainbow pattern progressing from early July (red) through to early October (purple). The last sample collected at each rock glacier is plotted as the brown square, along with average values for snow and rain. Rock glacier water clearly evolves through the season from a composition dominated by snowmelt, to a mixture of rain and internal water, with decreasing rain influence over time.
5.1 Isotopes and hydrochemistry
The automated samplers utilized in this project were successful at collecting essentially uninterrupted sequences of water throughout their deployment. Modification of the samplers effectively reduced evaporation-related fractionation that could have skewed the results over the long duration deployments. As seen in Fig. 3, analysis of the subsample from the first sample bottle that was removed in early July yielded similar results to the water that remained inside the sampler until September. Values of δD and δ18O overlap within error for RG-2 and are very close for the Stream and Spring. There is a slight increase in δ18O of ∼0.2 ‰ over the course of the summer, which could indicate evaporation; however, this shift is far less than the changes observed in these sequences of samples from start to finish. Thus, the time series are interpreted without significant concern that values were altered by evaporation.
The sampling and analysis strategy in this project was designed to evaluate whether water draining from representative rock glaciers in the Uintas differs from streamwater and groundwater in a manner that is consistent with the presence of melting ice within the rock glacier. The summer of 2021 was a particularly appropriate time to attempt this because the snowpack during the preceding winter was notably below average. On 1 April 2021, the Chepeta SNOTEL (Fig. 1) was at 83 % of the 1991–2020 median of 380 mm snow water equivalent (SWE), but by 13 April, the average date of the annual peak, the SWE was just 52 % of average (188 mm). In contrast to other years in which we have conducted fieldwork at the RG-1 and RG-2 sites, the surfaces of the rock glaciers were notably snow-free when the samplers were deployed in early July. Inspection of high-resolution satellite imagery confirms that visible snow on the rock glacier surfaces disappeared by the end of June, and that essentially no snow was present in the West Fork Whiterocks Drainage after the start of July. Therefore, it is unlikely that the water collected at RG-1 and RG-2, particularly late summer and fall, was sourced from melting snow.
Analysis of stable isotopes reveals contrast between the water types that can be linked back to their sources and flowpaths. Groundwater from the Spring exhibits the most depleted δ18O, with values similar to the snow samples (Fig. 6). The snow samples span a relatively wide range of δ18O, but they are the most negative measured in this study, thus this correspondence suggests that the groundwater system is primarily recharged by snowmelt. The average annual maximum SWE at the Chepeta SNOTEL station of 380 mm equals half of the mean annual precipitation. The snowmelt pulse in the spring, therefore, is apparently the only precipitation event of the year that can overwhelm the moisture holding capacity of the soil and pass water into the groundwater system. The low δ18O values of the water discharging from the spring during the course of the summer, despite numerous rainstorms delivering isotopically less depleted water, emphasizes that the deeper groundwater system is snow-dominated and stable.
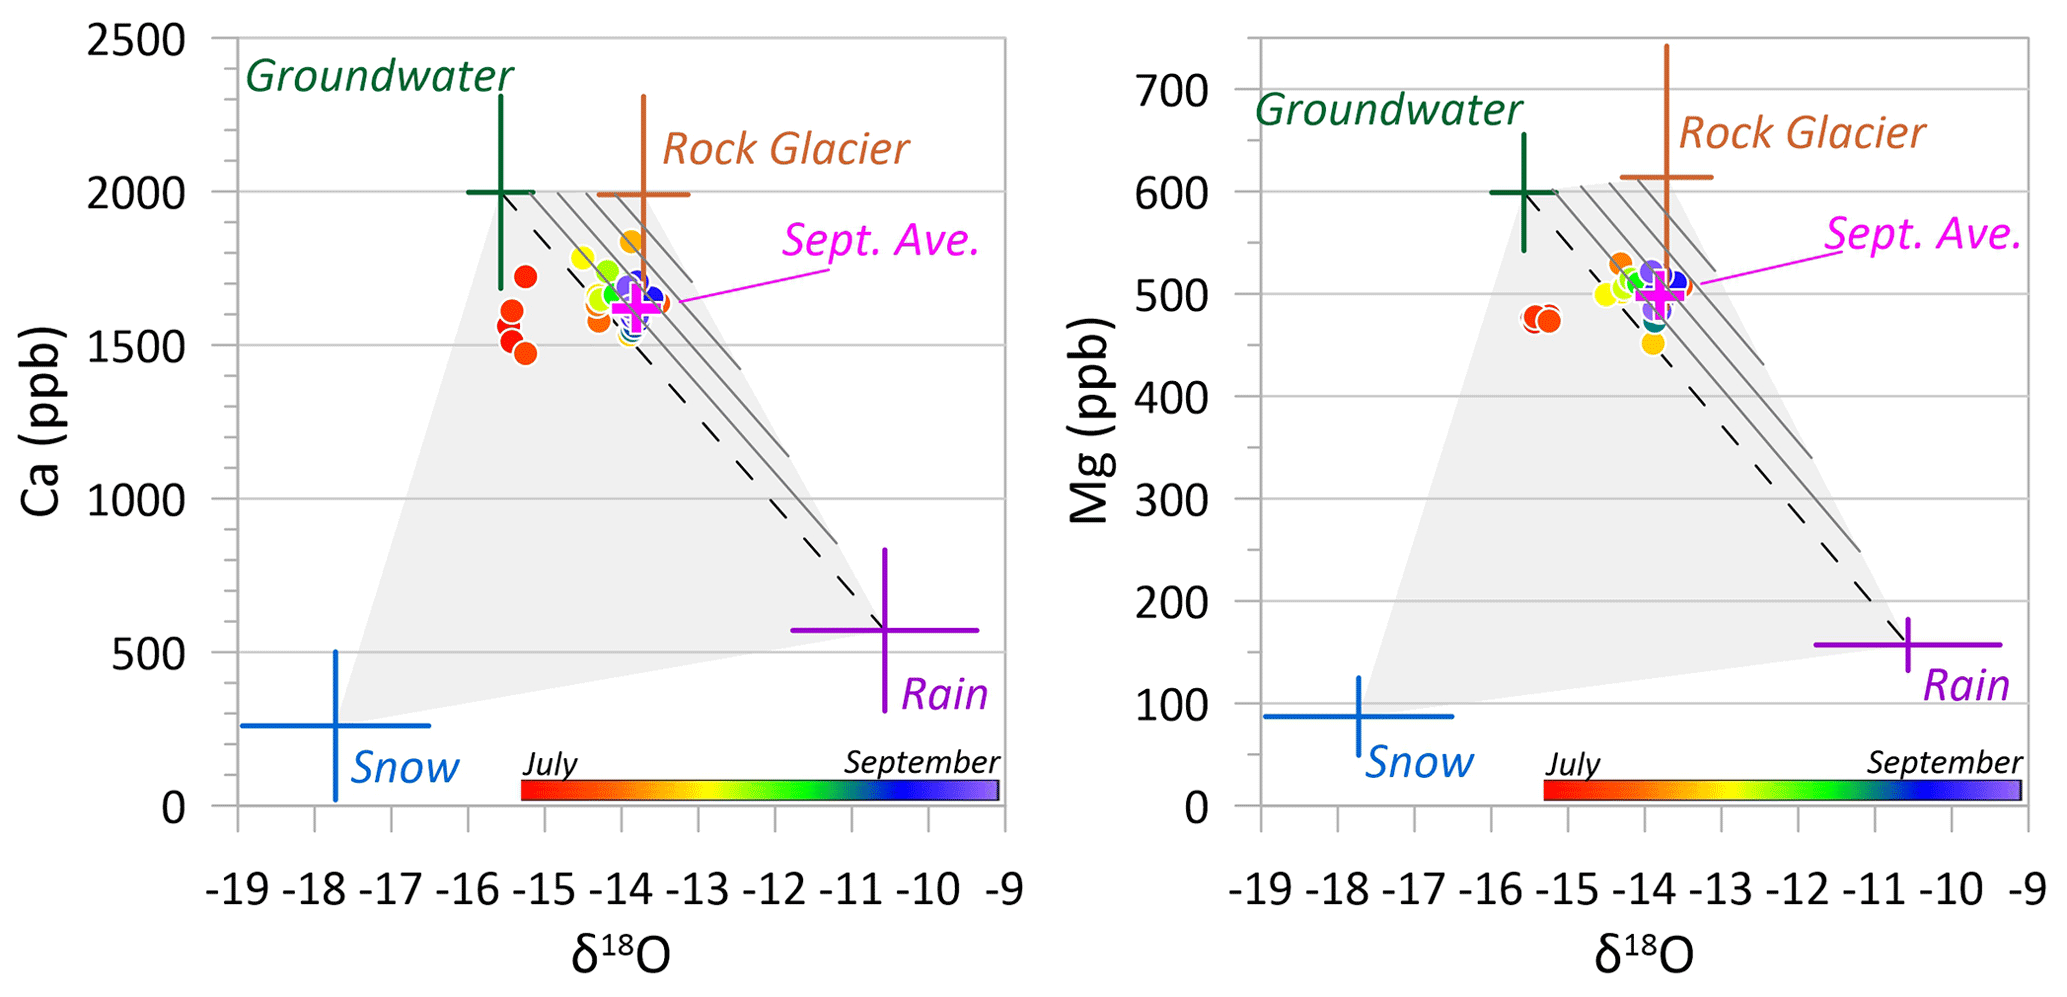
Figure 11Biplots of δ18O vs. Ca and Mg used to determine the contribution of rock glacier discharge to streamflow. Water in the stream is plotted with a rainbow pattern progressing from July (red) through to early October (purple). Crosses represent the end members of snow, rain, groundwater, and rock glacier water. July streamwater samples contain a mixture of snowmelt and groundwater, but in August and September, snowmelt is no longer detectable (samples to right of dashed line). Streamwater samples at this time contain non-trivial amounts of water derived from rock glaciers, with an average of 25 % in September (pink cross). Diagonal black lines denote the abundance of rock glacier water in increments of 20 % for emphasis.
Samples from RG-1 and RG-2 from July are plotted on the GMWL, with low values of δD and δ18O consistent with a large component of snowmelt (Fig. 5), which is isotopically depleted in this study and in values reported from elsewhere in the Uintas (Munroe, 2021). Even though visible snow was absent from the rock glacier surfaces at this time, this correspondence indicates that snow was still melting within the interstices between blocks on the rock glacier surface, a situation that was reported by previous work (Krainer et al., 2007). By the beginning of August, however, isotope values at both rock glacier springs depart from the GMWL and rise to higher values of d-excess (Fig. 5). This pattern is not seen in the Spring or the Stream time series, which remain on the GMWL from start to finish. Thus, late summer and fall water discharging from both rock glaciers is distinct from contemporary precipitation and groundwater. This pattern is particularly dramatic at RG-1, where all of the August–October samples cluster around a δ18O of −13 ‰ with d-excess values as high as 20 ‰. Previous work on rock glacier hydrology has reported high values of d-excess in late-summer rock glacier discharge, and interpreted them as a signal of melting internal rock glacier ice that has undergone numerous freeze–thaw cycles (Steig et al., 1998; Williams et al., 2006).
The time-series of PC values reinforce the uniqueness of the rock glacier water. Values for the Spring and for the Stream are notably stable through the melt season (Fig. 8). This consistency suggests that these systems are not directly impacted by short-term events like rainstorms, or even changes over seasonal timescales, presumably due to their well-mixed nature and large volumes. In contrast, the time series for the two rock glacier springs exhibit a dramatic rise. Values of PC-1 increase, starting at the beginning of July in both records; values of PC-2 start rising in July for RG-1 and in mid-August for RG-2. Concentrations for many elements increase by a factor of 3 or more from early July until October. This enrichment is consistent with movement of water through the fine matrix of crushed rock material in the rock glacier interior, where fresh mineral grains are available for rapid chemical weathering by cold water charged with carbonic acid (Krainer and Mostler, 2002; Williams et al., 2006). Melting of ice would both liberate meltwater and open flowpaths through this material. The pattern of rising dissolved load through the summer therefore provides additional support for the interpretation that the source of the water draining from the rock glaciers shifts after snowmelt is over.
The transition in source of the water draining from the rock glaciers is further illustrated by biplots of δ18O against Ca and Mg content (Fig. 10). Values for average snow, rain, and the last sample from each rock glacier define a triangle entirely enclosing samples collected from the rock glaciers. Water draining from the rock glaciers in July exhibits a clear snowmelt influence, but this diminishes in August as the water becomes a more even mixture of rain and rock glacier water. Through September into October, this balance shifts away from rain, eventually reaching a minimal rain contribution in the last water discharged before the system froze up for the winter. Even considering the inherent uncertainty imparted by the small number of precipitation samples, it is obvious that the rock glacier water composition evolves away from snow and rain over the course of the melt season (Fig. 10).
Williams et al. (2006) proposed a model for changing flowpaths and water sources over the course of the melt season that is relevant for interpreting the results presented here. In early summer, the interior of a rock glacier is frozen and water derived from snowmelt is discharged after draining through the blocky surface layer and running along the top of the frozen core (Krainer and Mostler, 2002). Later in the summer, snowmelt is finished and seasonal ice within the rock glacier begins to melt, opening flowpaths that bring meltwater into contact with fresh,
highly weatherable mineral grains. Finally, in late summer and the fall, older perennial ice within the rock glacier begins to melt (Williams et al., 2007), liberating water with high dissolved load and uniquely high values of d-excess due to reflecting a history of multiple freeze–thaw cycles. The isotopic and hydrochemical results presented here are consistent with this model, supporting the interpretation that water discharging from Uinta rock glaciers in late summer and fall is derived from the melting of perennial internal ice.

Figure 12True-color hillshade photomosaic of RG-2 produced by structure from motion (SfM) applied to a set of 243 images collected at an altitude of 120 m above the ground. White lines represent 10 m contours and the black arrow designates the downslope flow direction. The yellow oval highlights the prominent depression near the head of the rock glacier, which may reflect subsidence due to ice melt-out.
5.2 Implications for high mountain hydrology
The rock glaciers studied in this project are but two of eight mapped (Fig. 1) within the West Fork Whiterocks River watershed (Munroe, 2018), which also hosts extensive talus (Munroe and Laabs, 2009) that may contain non-trivial amounts of ice. It is reasonable to predict, therefore, that water derived from rock glaciers may comprise an important amount of the overall streamflow in the latter part of the summer and fall. Figure 11 presents biplots of δ18O vs. Ca and Mg content, two elements that are notably elevated in the late summer rock glacier water in the Uintas and elsewhere (Williams et al., 2006). Following Krainer and Mostler (2002), four endmember sources of water to the stream are groundwater, snow, rain, and rock glaciers. The groundwater endmember is constrained for the 2021 melt season by the 33 samples from the non-rock glacier spring. As noted above, the snow endmember is less well constrained, however these samples are nonetheless considered a valid representation of the snow lingering in the Whiterocks River watershed in the summer of 2021. Five samples (two from RG-1 and three from RG-2) collected from the rock glacier springs in October immediately before freeze-up represent the rock glacier meltwater endmember. Finally, two composite precipitation samples from RG-2 and two from the Spring site are available to represent rain falling over the course of the melt season. Close inspection reveals, however, that the concentration of Ca in the Spring sampler is higher than at RG-2, despite the distance of only 3 km between the two sites. The precipitation sampler at the Spring site is located close to a dirt road though, raising the possibility that dust produced by vehicle traffic raised the Ca content of the water collected at this site. Support for this interpretation is provided by 7 years of unpublished precipitation chemistry (n=79 samples) collected by the USDA-Ashley National Forest in the Uintas. Concentrations of Ca in this dataset average 645 ppb, similar to the value of 570 ppb in the rain from the precipitation sampler at RG-2 and notably less than the mean of 1535 ppb at the roadside Spring site. Thus, the precipitation samples from RG-2 alone are taken to represent the rain endmember in the stream system for the melt season of 2021.
With this approach, the four end members define a polygon entirely surrounding the streamwater samples (Fig. 11). As in the time-series from the individual rock glaciers (Fig. 5), a clear transition is notable. July streamwater samples exhibit δ18O values similar to snowmelt and groundwater. In contrast, late summer and fall samples plot far from the snowmelt end member and entirely within a triangle bounded by the groundwater, rock glacier water, and rain. Within this triangle, although the proportions vary somewhat between samples, individual streamwater samples from August and September can be visually separated as a mixture of ∼ 20 %–30 % rain, ∼25 % to 75 % groundwater, and up to 50 % rock glacier water. The overall mean of September streamwater samples can be defined as ∼25 % rain, ∼50 % groundwater, and ∼25 % rock glacier water. Water with a signature similar to that of springs discharging directly from rock glacier termini, therefore, generally makes up approximately one quarter of all the water flowing in the primary stream of this drainage after snowmelt has ended.
Given the detectable contribution of rock glacier meltwater to streamflow in this system, it is worth considering whether rock glacier ice is melting at an unsustainable rate. This possibility is hard to evaluate directly, given that mass balance techniques for ice glacier systems are difficult to apply to rock glaciers (Østrem and Brugman, 1966). Nonetheless, it is notable that a depression consistent with subsidence accompanying the melt-out of an ice core is present in the upper part of RG-2 (Fig. 12). A high-resolution topographic model constructed for this rock glacier using structure from motion (SfM) applied to images collected with an uncrewed aerial vehicle (UAV) reveals that this depression has an area of 19 350 m2 and a volume of 106 500 m3 (mean depth of 5.5 m). If this depression formed due to the loss of ice, this volume corresponds to ∼108 L of water. At rates of 102 to 103 L min−1 estimated for the modern flow, that equates to 70–700 d. This calculation is inherently general given the uncertainty around the age and timing of the depression, and the true rates of water discharge. Nonetheless, the presence of this depression and its dimensions suggests that ice within this rock glacier may have begun melting unsustainably in the past few decades in response to rising summer temperatures noted in Uinta climate records (Brencher et al., 2021). Future InSAR monitoring may help to constrain subsidence on this and other rock glaciers, yielding additional information about the response of these features to contemporary climate warming and likely changes in their future contributions to high-elevation hydrology.
Time series of samples collected during the summer of 2021 reveal that water draining from rock glaciers in the Uinta Mountains of Utah (USA) has a composition distinct from groundwater and from water in the primary stream of a representative 5000 ha drainage. Rock glacier water resembles snowmelt in the early summer, but transitions to higher values of d-excess and greatly elevated Ca and Mg content as the melt season progresses. This pattern is consistent with models describing a change in water source from snowmelt, to melting of seasonal ice, to melting of deeper perennial ice in the rock glacier interior in late summer and fall. Water derived from this internal ice appears to have been the source of ∼25 % of the streamflow in this study area during September of 2021. This result emphasizes the significant role that rock glaciers can play in the hydrology of high-elevation watersheds, particularly in melt seasons following a winter with below-average snowpack.
The stable isotope and hydrochemical data generated in this study are available in the Hydroshare data repository at http://www.hydroshare.org/resource/2db20d7810254489b14984ef282951e1 (Munroe, 2022).
JSM designed the project, conducted the fieldwork and laboratory analyses, interpreted the results, and drafted the figures. JSM prepared the manuscript with contributions from ALH.
The contact author has declared that none of the authors has any competing interests.
Publisher’s note: Copernicus Publications remains neutral with regard to jurisdictional claims in published maps and institutional affiliations.
The authors thank Quinn Brencher, Camryn Kluetmeier, Shane Lusk, Emmet Norris, Abby Santis, and Alex Takoudes for their assistance in the field and Eamon McMahon for help preparing the water samplers. Part of this research was carried out at the Jet Propulsion Laboratory, California Institute of Technology, under a contract with the National Aeronautics and Space Administration (80NM0018D0004). Fieldwork for this project took place in the ancestral homelands of the Ute tribe.
This research has been supported by the National Science Foundation (grant nos. HS-1935200 and MRI-1918436).
This paper was edited by Günter Blöschl and reviewed by two anonymous referees.
Adler, C., Huggel, C., Orlove, B., and Nolin, A.: Climate change in the mountain cryosphere: impacts and responses, Reg. Environ. Change, 19, 1225–1228, 2019.
Albrich, K., Rammer, W., and Seidl, R.: Climate change causes critical transitions and irreversible alterations of mountain forests, Glob. Change Biol., 26, 4013–4027, 2020.
Alexander, J. M., Chalmandrier, L., Lenoir, J., Burgess, T. I., Essl, F., Haider, S., Kueffer, C., McDougall, K., Milbau, A., and Nuñez, M. A.: Lags in the response of mountain plant communities to climate change, Glob. Change Biol., 24, 563–579, 2018.
Atwood, W. W.: Glaciation of the Uinta and Wasatch mountains, US Government Printing Office, 1909.
Azócar, G. F. and Brenning, A.: Hydrological and geomorphological significance of rock glaciers in the dry Andes, Chile (27–33∘ S), Permafrost. Periglac., 21, 42–53, 2010.
Beniston, M., Farinotti, D., Stoffel, M., Andreassen, L. M., Coppola, E., Eckert, N., Fantini, A., Giacona, F., Hauck, C., Huss, M., Huwald, H., Lehning, M., López-Moreno, J.-I., Magnusson, J., Marty, C., Morán-Tejéda, E., Morin, S., Naaim, M., Provenzale, A., Rabatel, A., Six, D., Stötter, J., Strasser, U., Terzago, S., and Vincent, C.: The European mountain cryosphere: a review of its current state, trends, and future challenges, The Cryosphere, 12, 759–794, https://doi.org/10.5194/tc-12-759-2018, 2018.
Biskaborn, B. K., Smith, S. L., Noetzli, J., Matthes, H., Vieira, G., Streletskiy, D. A., Schoeneich, P., Romanovsky, V. E., Lewkowicz, A. G., Abramov, A., Allard, M., Boike, J., Cable, W. L., Christiansen, H. H., Delaloye, R., Diekmann, B., Drozdov, D., Etzelmüller, B., Grosse, G., Guglielmin, M., Ingeman-Nielsen, T., Isaksen, K., Ishikawa, M., Johansson, M., Johannsson, H., Joo, A., Kaverin, D., Kholodov, A., Konstantinov, P., Kröger, T., Lambiel, C., Lanckman, J.-P., Luo, D., Malkova, G., Meiklejohn, I., Moskalenko, N., Oliva, M., Phillips, M., Ramos, M., Sannel, A. B. K., Sergeev, D., Seybold, C., Skryabin, P., Vasiliev, A., Wu, Q., Yoshikawa, K., Zheleznyak, M., and Lantuit, H.: Permafrost is warming at a global scale, Nat. Commun., 10, 264, https://doi.org/10.1038/s41467-018-08240-4, 2019.
Bonfils, C., Santer, B. D., Pierce, D. W., Hidalgo, H. G., Bala, G., Das, T., Barnett, T. P., Cayan, D. R., Doutriaux, C., and Wood, A. W.: Detection and attribution of temperature changes in the mountainous western United States, J. Climate, 21, 6404–6424, 2008.
Bowen, G. J. and Revenaugh, J.: Interpolating the isotopic composition of modern meteoric precipitation, Water Resour. Res., 39, https://doi.org/10.1029/2003WR002086, 2003.
Bowen, G. J. and Wilkinson, B.: Spatial distribution of δ18O in meteoric precipitation, Geology, 30, 315–318, 2002.
Brencher, G., Handwerger, A. L., and Munroe, J. S.: InSAR-based characterization of rock glacier movement in the Uinta Mountains, Utah, USA, The Cryosphere, 15, 4823–4844, https://doi.org/10.5194/tc-15-4823-2021, 2021.
Brighenti, S., Hotaling, S., Finn, D. S., Fountain, A. G., Hayashi, M., Herbst, D., Saros, J. E., Tronstad, L. M., and Millar, C. I.: Rock glaciers and related cold rocky landforms: Overlooked climate refugia for mountain biodiversity, Glob. Change Biol., 27, 1504–1517, 2021.
Buchli, T., Kos, A., Limpach, P., Merz, K., Zhou, X., and Springman, S. M.: Kinematic investigations on the Furggwanghorn rock glacier, Switzerland, Permafrost. Periglac., 29, 3–20, 2018.
Catalan, J., Ninot, J. M., and Aniz, M. M.: High mountain conservation in a changing world, Springer Nature, ISBN 978-3-319-55981-0, 2017.
Chakraborty, A.: Mountains as vulnerable places: a global synthesis of changing mountain systems in the Anthropocene, GeoJournal, 86, 585–604, 2021.
Craig, H.: Isotopic variations in meteoric waters, Science, 133, 1702–1703, 1961.
Dansgaard, W.: Stable isotopes in precipitation, Tellus, 16, 436–468, 1964.
Dehler, C. M., Porter, S. M., De Grey, L. D., Sprinkel, D. A., and Brehm, A.: The Neoproterozoic Uinta Mountain Group revisited; a synthesis of recent work on the Red Pine Shale and related undivided clastic strata, northeastern Utah, USA, SEPM Spec. P., 86, 151–166, 2007.
Dietermann, N. and Weiler, M.: Spatial distribution of stable water isotopes in alpine snow cover, Hydrol. Earth Syst. Sci., 17, 2657–2668, https://doi.org/10.5194/hess-17-2657-2013, 2013.
Earman, S., Campbell, A. R., Phillips, F. M., and Newman, B. D.: Isotopic exchange between snow and atmospheric water vapor: Estimation of the snowmelt component of groundwater recharge in the southwestern United States, J. Geophys. Res.-Atmos., 111, https://doi.org/10.1029/2005JD006470, 2006.
Egan, P. A. and Price, M. F.: Mountain ecosystem services and climate change: A global overview of potential threats and strategies for adaptation, ISBN 978-92-3-100225-0, 2017.
Geiger, S. T., Daniels, J. M., Miller, S. N., and Nicholas, J. W.: Influence of rock glaciers on stream hydrology in the La Sal Mountains, Utah, Arct. Antarct. Alp. Res., 46, 645–658, 2014.
Giardino, J. R. and Vitek, J. D.: The significance of rock glaciers in the glacial-periglacial landscape continuum, J. Quaternary. Sci., 3, 97–103, https://doi.org/10.1002/jqs.3390030111, 1988.
Giardino, J. R., Shroder, J. F., and Vitek, J. D.: Rock glaciers, Allen & Unwin, London, ISBN 9780045511396, 1987.
Gröning, M., Lutz, H. O., Roller-Lutz, Z., Kralik, M., Gourcy, L., and Pöltenstein, L.: A simple rain collector preventing water re-evaporation dedicated for δ18O and δ2H analysis of cumulative precipitation samples, J. Hydrol., 448, 195–200, 2012.
Halla, C., Blöthe, J. H., Tapia Baldis, C., Trombotto Liaudat, D., Hilbich, C., Hauck, C., and Schrott, L.: Ice content and interannual water storage changes of an active rock glacier in the dry Andes of Argentina, The Cryosphere, 15, 1187–1213, https://doi.org/10.5194/tc-15-1187-2021, 2021.
Hansen, W. R.: Neogene tectonics and geomorphology of the eastern Uinta Mountains in Utah, Colorado, and Wyoming, United States Geological Survey, Professional Paper, 75, http://pubs.er.usgs.gov/publication/pp1356 (last access: 25 January 2023), 1986.
Harrington, J. S., Mozil, A., Hayashi, M., and Bentley, L. R.: Groundwater flow and storage processes in an inactive rock glacier, Hydrol. Process., 32, 3070–3088, 2018.
Huss, M., Bookhagen, B., Huggel, C., Jacobsen, D., Bradley, R. S., Clague, J. J., Vuille, M., Buytaert, W., Cayan, D. R., and Greenwood, G.: Toward mountains without permanent snow and ice, Earth's Future, 5, 418–435, 2017.
Janke, J. R., Ng, S., and Bellisario, A.: An inventory and estimate of water stored in firn fields, glaciers, debris-covered glaciers, and rock glaciers in the Aconcagua River Basin, Chile, Geomorphology, 296, 142–152, 2017.
Johnson, G., Chang, H., and Fountain, A.: Active rock glaciers of the contiguous United States: geographic information system inventory and spatial distribution patterns, Earth Syst. Sci. Data, 13, 3979–3994, https://doi.org/10.5194/essd-13-3979-2021, 2021.
Jones, D. B., Harrison, S., Anderson, K., Selley, H. L., Wood, J. L., and Betts, R. A.: The distribution and hydrological significance of rock glaciers in the Nepalese Himalaya, Global Planet. Change, 160, 123–142, 2018.
Jones, D. B., Harrison, S., Anderson, K., and Whalley, W. B.: Rock glaciers and mountain hydrology: A review, Earth-Sci. Rev., 193, 66–90, https://doi.org/10.1016/j.earscirev.2019.04.001, 2019.
Kenner, R., Phillips, M., Limpach, P., Beutel, J., and Hiller, M.: Monitoring mass movements using georeferenced time-lapse photography: Ritigraben rock glacier, western Swiss Alps, Cold Reg. Sci. Technol., 145, 127–134, 2018.
Konrad, S. K., Humphrey, N. F., Steig, E. J., Clark, D. H., Potter, N., and Pfeffer, W. T.: Rock glacier dynamics and paleoclimatic implications, Geology, 27, 1131–1134, 1999.
Krainer, K. and Mostler, W.: Hydrology of active rock glaciers: examples from the Austrian Alps, Arct. Antarct. Alp. Res., 142–149, 2002.
Krainer, K., Mostler, W., and Spötl, C.: Discharge From Active Rock Glaciers, Austrian Alps: A Stable Isotope Approach, Austrian J. Earth Sc., 100, 102–112, 2007.
Krainer, K., Bressan, D., Dietre, B., Haas, J. N., Hajdas, I., Lang, K., Mair, V., Nickus, U., Reidl, D., Thies, H., and Tonidandel, D.: A 10,300-year-old permafrost core from the active rock glacier Lazaun, southern Ötztal Alps (South Tyrol, northern Italy), Quaternary Res., 83, 324–335, https://doi.org/10.1016/j.yqres.2014.12.005, 2015.
Lechler, A. R. and Niemi, N. A.: The influence of snow sublimation on the isotopic composition of spring and surface waters in the southwestern United States: Implications for stable isotope–based paleoaltimetry and hydrologic studies, Geol. Soc. Am. Bull., B30467-1, https://doi.org/10.1130/B30467.1, 2012.
Lehmann, B., Anderson, R. S., Bodin, X., Cusicanqui, D., Valla, P. G., and Carcaillet, J.: Alpine rock glacier activity over Holocene to modern timescales (western French Alps), Earth Surf. Dynam., 10, 605–633, https://doi.org/10.5194/esurf-10-605-2022, 2022.
McDowell, G., Huggel, C., Frey, H., Wang, F. M., Cramer, K., and Ricciardi, V.: Adaptation action and research in glaciated mountain systems: Are they enough to meet the challenge of climate change?, Global Environ. Chang., 54, 19–30, 2019.
Millar, C. I. and Westfall, R. D.: Distribution and climatic relationships of the American pika (Ochotona princeps) in the Sierra Nevada and western Great Basin, USA; periglacial landforms as refugia in warming climates, Arct. Antarct. Alp. Res., 42, 76–88, 2010.
Millar, C. I., Westfall, R. D., Evenden, A., Holmquist, J. G., Schmidt-Gengenbach, J., Franklin, R. S., Nachlinger, J., and Delany, D. L.: Potential climatic refugia in semi-arid, temperate mountains: Plant and arthropod assemblages associated with rock glaciers, talus slopes, and their forefield wetlands, Sierra Nevada, California, USA, Quaternary Int., 387, 106–121, https://doi.org/10.1016/j.quaint.2013.11.003, 2015.
Minder, J. R., Letcher, T. W., and Liu, C.: The character and causes of elevation-dependent warming in high-resolution simulations of Rocky Mountain climate change, J. Climate, 31, 2093–2113, 2018.
Munroe, J. S.: Investigating the spatial distribution of summit flats in the Uinta Mountains of northeastern Utah, USA, Geomorphology, 75, 437–449, 2006.
Munroe, J. S.: Distribution, evidence for internal ice, and possible hydrologic significance of rock glaciers in the Uinta Mountains, Utah, USA, Quaternary Res., 90, 1–16, 2018.
Munroe, J. S.: First investigation of perennial ice in Winter Wonderland Cave, Uinta Mountains, Utah, USA, The Cryosphere, 15, 863–881, https://doi.org/10.5194/tc-15-863-2021, 2021.
Munroe, J. S.: West Fork Whiterocks River, Utah: stable isotope and hydrochemical data for rock glacier water, streamwater, and groundwater, http://www.hydroshare.org/resource/2db20d7810254489b14984ef282951e1 (last access: 1 January 2023), 2022.
Munroe, J. S. and Laabs, B. J. C.: Glacial Geologic Map of the Uinta Mountains Area, Utah and Wyoming, 2009.
Østrem, G. and Brugman, M.: Glacier mass balance measurements, Department of Mines and Technical Surveys, Glaciology Section, 1966.
Palomo, I.: Climate change impacts on ecosystem services in high mountain areas: a literature review, Mt. Res. Dev., 37, 179–187, 2017.
Petersen, E. I., Levy, J. S., Holt, J. W., and Stuurman, C. M.: New insights into ice accumulation at Galena Creek Rock Glacier from radar imaging of its internal structure, J. Glaciol., 66, 1–10, 2020.
Rangecroft, S., Harrison, S., and Anderson, K.: Rock Glaciers as Water Stores in the Bolivian Andes: An Assessment of Their Hydrological Importance, Arct. Antarct. Alp. Res., 47, 89–98, https://doi.org/10.1657/AAAR0014-029, 2015.
Rödder, D., Schmitt, T., Gros, P., Ulrich, W., and Habel, J. C.: Climate change drives mountain butterflies towards the summits, Sci. Rep., 11, 1–12, 2021.
Rowan, A. V., Quincey, D. J., Gibson, M. J., Glasser, N. F., Westoby, M. J., Irvine-Fynn, T. D., Porter, P. R., and Hambrey, M. J.: The sustainability of water resources in High Mountain Asia in the context of recent and future glacier change, Geological Society, London, Spec. Pub., 462, 189–204, 2018.
Sakai, A. and Fujita, K.: Contrasting glacier responses to recent climate change in high-mountain Asia, Sci. Rep., 7, 1–8, 2017.
Sears, J., Graff, P., and Holden, G.: Tectonic evolution of lower Proterozoic rocks, Uinta Mountains, Utah and Colorado, Geol. Soc. Am. Bull., 93, 990–997, 1982.
Sommer, C., Malz, P., Seehaus, T. C., Lippl, S., Zemp, M., and Braun, M. H.: Rapid glacier retreat and downwasting throughout the European Alps in the early 21 st century, Nat. Commun., 11, 1–10, 2020.
Steig, E. J., Fitzpatrick, J. J., Potter, N., and Clark, D. H.: The geochemical record in rock glaciers, Geogr. Ann. A, 80, 277–286, 1998.
Stoffel, M. and Corona, C.: Future winters glimpsed in the Alps, Nat. Geosci., 11, 458–460, 2018.
Strozzi, T., Caduff, R., Jones, N., Barboux, C., Delaloye, R., Bodin, X., Kääb, A., Mätzler, E., and Schrott, L.: Monitoring rock glacier kinematics with satellite synthetic aperture radar, Remote Sens., 12, 559, https://doi.org/10.3390/rs12030559, 2020.
Taylor, S., Feng, X., Kirchner, J. W., Osterhuber, R., Klaue, B., and Renshaw, C. E.: Isotopic evolution of a seasonal snowpack and its melt, Water Resour. Res., 37, 759–769, 2001.
Thaler, T., Zischg, A., Keiler, M., and Fuchs, S.: Allocation of risk and benefit– distributional justices in mountain hazard management, Reg. Environ. Change, 18, 353–365, 2018.
Unnikrishna, P. V., McDonnell, J. J., and Kendall, C.: Isotope variations in a Sierra Nevada snowpack and their relation to meltwater, J. Hydrol., 260, 38–57, 2002.
von Freyberg, J., Knapp, J. L. A., Rücker, A., Studer, B., and Kirchner, J. W.: Technical note: Evaluation of a low-cost evaporation protection method for portable water samplers, Hydrol. Earth Syst. Sci., 24, 5821–5834, https://doi.org/10.5194/hess-24-5821-2020, 2020.
Wagner, T., Brodacz, A., Krainer, K., and Winkler, G.: Active rock glaciers as shallow groundwater reservoirs, Austrian Alps, Grundwasser, 25, 215–230, 2020.
Wagner, T., Kainz, S., Helfricht, K., Fischer, A., Avian, M., Krainer, K., and Winkler, G.: Assessment of liquid and solid water storage in rock glaciers versus glacier ice in the Austrian Alps, Sci. Total Environ., 800, 149593, https://doi.org/10.1016/j.scitotenv.2021.149593, 2021.
Wahrhaftig, C. and Cox, A.: Rock glaciers in the Alaska Range, Geol. Soc. Am. Bull., 70, 383–436, 1959.
Williams, M. W., Knauf, M., Caine, N., Liu, F., and Verplanck, P. L.: Geochemistry and source waters of rock glacier outflow, Colorado Front Range, Permafrost. Periglac., 17, 13–33, https://doi.org/10.1002/ppp.535, 2006.
Williams, M. W., Knauf, M., Cory, R., Caine, N., and Liu, F.: Nitrate content and potential microbial signature of rock glacier outflow, Colorado Front Range, Earth Surf. Proc. Land., 32, 1032–1047, https://doi.org/10.1002/esp.1455, 2007.
Xenarios, S., Gafurov, A., Schmidt-Vogt, D., Sehring, J., Manandhar, S., Hergarten, C., Shigaeva, J., and Foggin, M.: Climate change and adaptation of mountain societies in Central Asia: uncertainties, knowledge gaps, and data constraints, Reg. Environ. Change, 19, 1339–1352, 2019.