the Creative Commons Attribution 4.0 License.
the Creative Commons Attribution 4.0 License.
 | 14 Dec 2023
Recent ground thermo-hydrological changes in a southern Tibetan endorheic catchment and implications for lake level changes
Léo C. P. Martin
Sebastian Westermann
Michele Magni
Fanny Brun
Joel Fiddes
Yanbin Lei
Philip Kraaijenbrink
Tamara Mathys
Moritz Langer
Simon Allen
Climate change modifies the water and energy fluxes between the atmosphere and the surface in mountainous regions such as the Qinghai–Tibet Plateau (QTP), which has shown substantial hydrological changes over the last decades, including rapid lake level variations. The ground across the QTP hosts either permafrost or is seasonally frozen, and, in this environment, the ground thermal regime influences liquid water availability, evaporation and runoff. Consequently, climate-induced changes in the ground thermal regime may contribute to variations in lake levels, but the validity of this hypothesis has yet to be established.
This study focuses on the cryo-hydrology of the catchment of Lake Paiku (southern Tibet) for the 1980–2019 period. We process ERA5 data with downscaling and clustering tools (TopoSCALE, TopoSUB) to account for the spatial variability of the climate in our forcing data (Fiddes and Gruber, 2012, 2014). We use a distributed setup of the CryoGrid community model (version 1.0) to quantify thermo-hydrological changes in the ground during this period. Forcing data and simulation outputs are validated with data from a weather station, surface temperature loggers and observations of lake level variations. Our lake budget reconstruction shows that the main water input to the lake is direct precipitation (310 mm yr−1), followed by glacier runoff (280 mm yr−1) and land runoff (180 mm yr−1). However, altogether these components do not offset evaporation (860 mm yr−1).
Our results show that both seasonal frozen ground and permafrost have warmed (0.17 ∘C per decade 2 m deep), increasing the availability of liquid water in the ground and the duration of seasonal thaw. Correlations with annual values suggest that both phenomena promote evaporation and runoff. Yet, ground warming drives a strong increase in subsurface runoff so that the runoff(evaporation + runoff) ratio increases over time. This increase likely contributed to stabilizing the lake level decrease after 2010.
Summer evaporation is an important energy sink, and we find active-layer deepening only where evaporation is limited. The presence of permafrost is found to promote evaporation at the expense of runoff, consistently with recent studies suggesting that a shallow active layer maintains higher water contents close to the surface. However, this relationship seems to be climate dependent, and we show that a colder and wetter climate produces the opposite effect. Although the present study was performed at the catchment scale, we suggest that this ambivalent influence of permafrost may help to understand the contrasting lake level variations observed between the south and north of the QTP, opening new perspectives for future investigations.
- Article
(9562 KB) - Full-text XML
- BibTeX
- EndNote


Climate change is amplified in mountainous environments, with major consequences for ecosystems, landscapes, hydrology, human communities and infrastructure (IPCC, 2019). Station observations show that global warming is elevation dependent, with the strongest warming rates being observed at high elevations (Pepin et al., 2015; Wang et al., 2014). Over the Qinghai–Tibet Plateau (QTP), a significant increase in surface air temperatures has been recorded since the 1980s, particularly in the north of the plateau (Zhang et al., 2022). This has been accompanied by a decrease in wind speed, humidification of the air and a general increase in precipitation, although with a strong spatial variability (Bibi et al., 2018). Altogether, these changes have affected the surface energy balance of the plateau through a shift of the Bowen ratio towards more latent heat fluxes, limiting the sensible surface warming (K. Yang et al., 2014).
These changes in water and energy fluxes between the atmosphere and the surface have the potential to alter the hydrological cycle of the QTP, which is the headwater region for major Asian rivers. As such, increasing trends of evaporation over land have been measured (3.8 mm per decade since the 1960s) with strong spatial variability in both the absolute values and increase rates (G. Wang et al., 2020). Changes in the seasonality of river discharge (Cao et al., 2006) and groundwater discharge (Niu et al., 2011) were reported for the same period. Overall, glacier shrinkage has also been observed since the 1960s, with a persistent increase in glacier mass loss rates (Bhattacharya et al., 2021; Hugonnet et al., 2021).
The QTP also features more than 1000 lakes larger than 1 km2 (Zhang et al., 2017), most of them located in endorheic catchments. Lake volume changes are therefore attributable to climatic and hydrological changes occurring within the lake catchment, such as glacier melt, ground ice melt, precipitation, evaporation or runoff patterns. The majority of these lakes have experienced a pronounced increase in water levels since the 1990s (Lei et al., 2013, 2014), a trend that was suggested to be mainly driven by changes in precipitation and evaporation patterns (Yao et al., 2018) rather than by an increase in glacier mass loss and runoff (Brun et al., 2020; Zhang et al., 2021a). Nevertheless, lake level variations are not uniform across the QTP and exhibit important spatial variability. Whereas the northern and central QTP have recorded lake expansion, the southern parts of the plateau have experienced lake shrinkage (Qiao et al., 2019; G. Zhang et al., 2021a, 2020). Shrinking lakes have received less attention in the literature than rising lakes because they are fewer. For this reason, the drivers of this shrinkage are still unclear. Qiao et al. (2019) reported that recent lake shrinkage over the QTP could be driven by local precipitation decreases and/or evaporation increases (in relation to air temperature increases). G. Zhang et al. (2020) suggest that the divergent trends in lake level variations across the QTP could be linked to the contrasting evolution of moisture transport between the north and south of the plateau. On longer timescales, lake shrinkage over the QTP during the Holocene seems to be related to variations in the intensity of the Asian monsoon (Chen et al., 2013). Overall, such a complex pattern of rising and shrinking lakes challenges our understanding of the hydrological changes occurring in these High Asian watersheds.
In this regard, new insights into hydroclimatic changes over the QTP can emerge from the investigation of the coupled energy and water fluxes between the ground surface or subsurface and the atmospheric boundary layer. These fluxes are driven by the climate and have a major impact on cold-region hydrology (Pomeroy et al., 2007; Gao et al., 2021; Bring et al., 2016). Indeed, hydrological variables (precipitation, evaporation, runoff) affect the soil water content, which changes its thermal properties and the distribution between latent and sensible fluxes and thus substantially influences the ground thermal regime (Bring et al., 2016; Koren et al., 1999; Martin et al., 2019). In turn, the ground thermal regime modifies the relative proportion of frozen and liquid subsurface water, influencing infiltration possibilities and the amount of water available for evaporation and surface or subsurface runoff (Yi et al., 2006; Carey and Woo, 2001).
So far, climate-induced thermo-hydrological changes over the QTP have received limited attention. Large-scale modeling studies reported changes in the seasonal ground freezing cycles, characterized by a reduction in the frost depth and duration of the frozen period since the 1960s (Qin et al., 2018; C. Wang et al., 2020) and notable ground warming trends in summer and winter (Qin et al., 2021). Similar ground warming trends were reported in the regional modeling study by Qin et al. (2017), along with an increasing trend in evaporation and a decrease in the runoff coefficient over time. Plateau-scale surface energy balance modeling from G. Wang et al. (2020) reported that increasing trends in evapotranspiration could be mainly explained by variations in air temperature and net radiation at the surface.
Complementarily to seasonally frozen ground, permafrost is also a distinctive feature of climate–surface interactions in cold regions. Large-scale permafrost modeling suggests that it covers a significant part of the QTP, mainly as continuous permafrost in the north of the plateau and as discontinuous or sporadic permafrost in the south (Obu et al., 2019). Permafrost on the QTP usually has a low ice content due to limited precipitation and strong evaporation (Wu et al., 2005; Yang et al., 2010). Borehole temperature measurements show that it is a relatively warm type of permafrost (Biskaborn et al., 2019; Wu and Zhang, 2008), and its exposure to high solar radiations makes it sensitive to changes in surface conditions and climate change (Yang et al., 2010). Since the 1960s, climate change has driven permafrost warming across the plateau (Ran et al., 2018; Shaoling et al., 2000). Ran et al. (2018) report that most of the plateau exhibits a warming trend of the ground, comprised of between 0.26 and 0.74 ∘C per decade, and half of the plateau warms at a rate higher than 0.5 ∘C per decade. This warming is accompanied by upward migration (of around 100 m between the 1960s and 2000s) and shrinkage of permafrost-covered areas (24 % of the permafrost extent lost between the 1960s and the 2000s; Ran et al., 2018).
Permafrost grounds are characterized by a strong interplay between the ground thermal regime and the land hydrology. Seasonal thawing and freezing of the active layer are driven by the surface energy balance, which, in return, influences surface and subsurface runoff (Kurylyk et al., 2014; Walvoord and Kurylyk, 2016; Sjöberg et al., 2021) and evaporation (Gao et al., 2021). In this regard, both large-scale and regional modeling indicate that thawing permafrost enhances evapotranspiration (Qin et al., 2017; G. Wang et al., 2020). Qin et al. (2017) also report that the increase in evaporation is logically concomitant with a decrease in the runoff coefficient. Additionally, permafrost stores water as ground ice, and its thawing can trigger the release of liquid water in the watershed, contributing up to 15 % of the annual river streamflow (Cheng and Jin, 2013; Yang et al., 2019).
These hydrological changes are tied to various interdependent climate-driven physical processes happening at the ground surface and subsurface (e.g., surface energy balance, infiltration, water phase change, heat conduction). Because these processes exhibit a strong spatial variability in high-mountain environments, it is challenging to represent them accurately together on large spatial scales. Therefore, a deeper understanding of the impact of ground thermo-hydrological changes on the High Asia water cycle can be gained through small-scale physical modeling of these processes. Yet, for now, physics-based approaches at the catchment scale aiming to connect the ground thermo-hydrological regime and the observed hydrological changes on the QTP (such as lake level changes) remain scarce. They are, however, a powerful approach to tackle the following question: how much might climate-driven ground thermal changes affect the water cycle in high-mountain headwater regions? In this study, we use physical land surface modeling to quantify the ground thermo-hydrological changes in an endorheic Tibetan catchment over the last 40 years in response to climate change. We show the interplay in the water and energy fluxes occurring between the atmosphere, the surface and the subsurface and discuss their impact on the hydrology of the catchment and their implications regarding lake level variations.
The Paiku catchment is located in southwestern Tibet, China, close to the border with Nepal (28.8∘ N, 85.6∘ E; Fig. 1). Its southern edge lies 7 km from the Shishapangma peak (8027 m a.s.l.). The catchment is endorheic and spans over 78 km from north to south and 66 km from east to west and covers 2400 km2. The median elevation of the catchment is 4872 m a.s.l., ranging from 7272 m a.s.l. to its lowest point, with Lake Paiku at 4580 m a.s.l.. Geologically, the catchment is mainly located in the Tethys Himalaya, and thus, an important part of the formations underlying the catchment are metamorphized sedimentary series (Fig. B1 in the Appendix). The southern part of the catchment crosses the Southern Tibetan Detachment, and thus, the southern ridges of the massif belong to the High Himalayan metamorphic formations in the west and to the High Himalayan leucogranites of the Shishapangma massif in the east. The north and northeast ridges are formed by granite intrusions surrounded by metamorphic domes. The inner part of the catchment presents Plio-Quaternary formations such as alluvial fans close to the ridges and inclined alluvial plains in its inner parts (Aoya et al., 2005; Searle et al., 1997; Wünnemann et al., 2015).
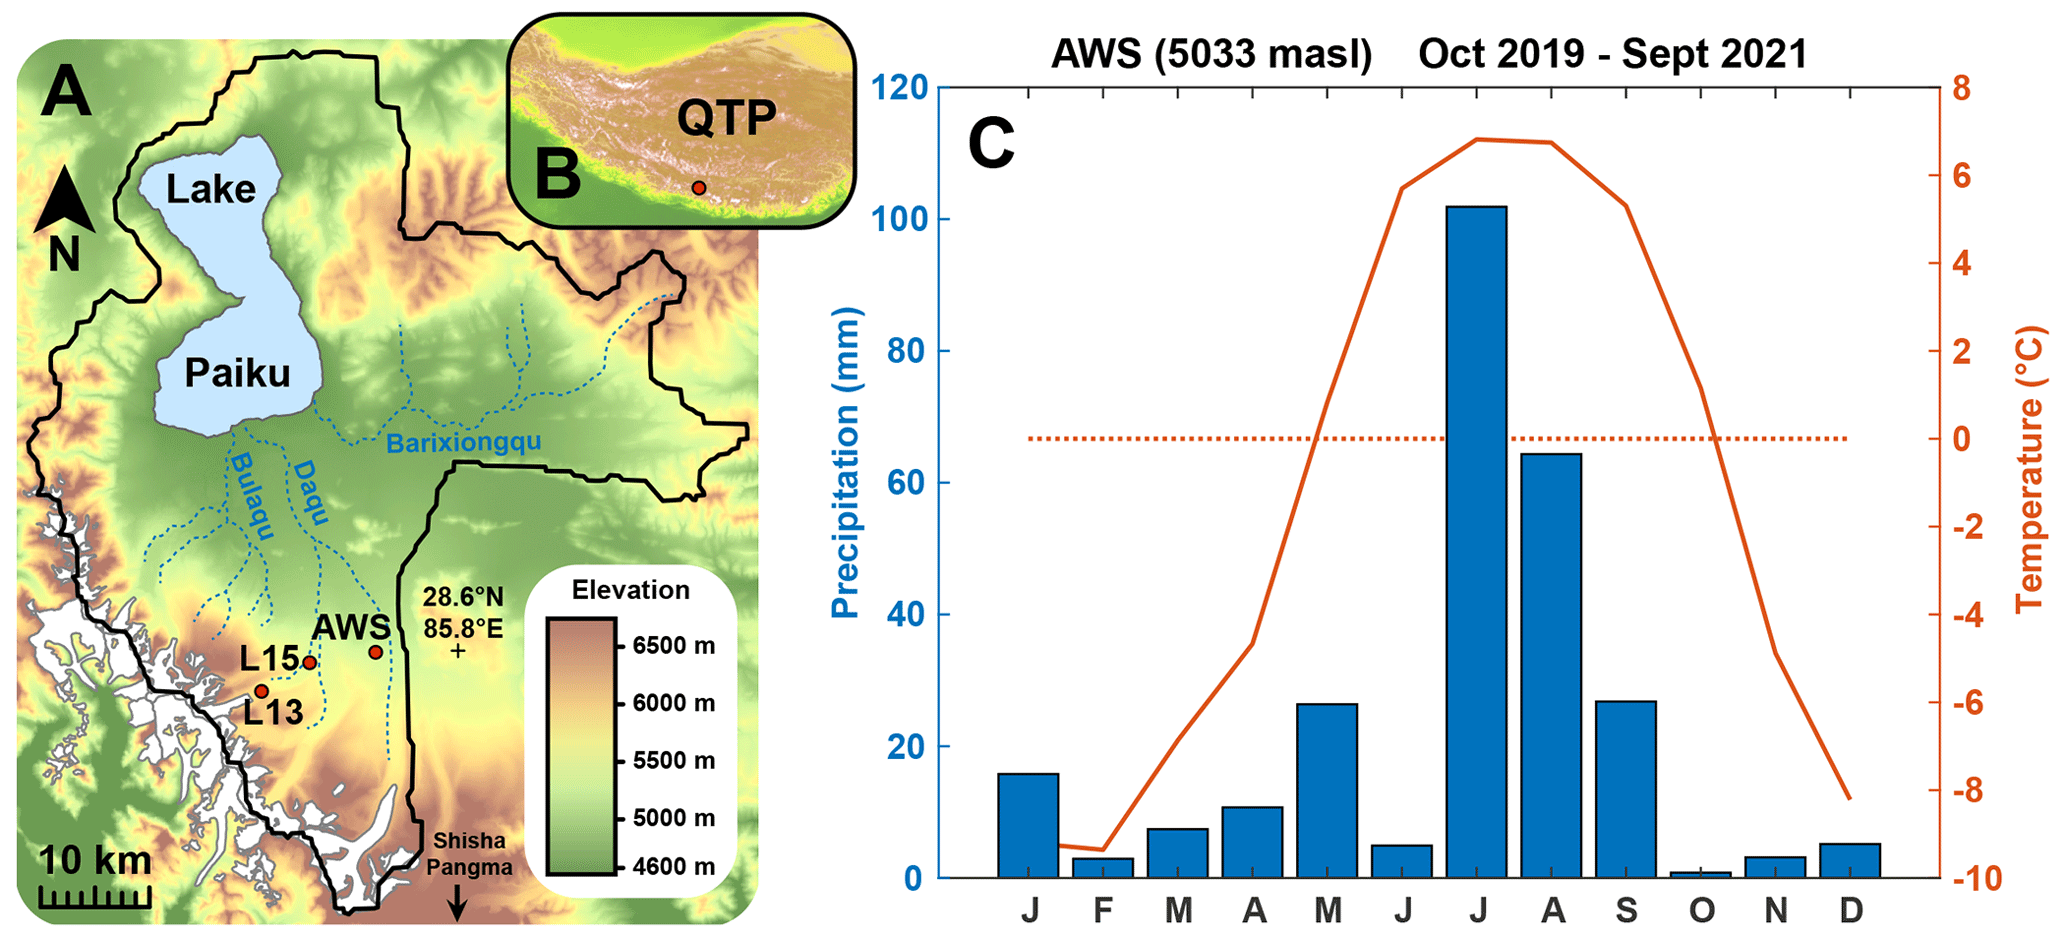
Figure 1The Paiku catchment. (A) Topographic and hydrologic map of the catchment with the glaciers in white, the ephemeral rivers in dark blue and the lake in light blue (elevation: SRTM data courtesy of the US Geological Survey). AWS: automatic weather station. L13 and L15 are surface temperature loggers (Sect. 3.1). (B) Localization of the catchment over the QTP. (C) Monthly temperature and precipitation recorded at the AWS between October 2019 and September 2021.
Automatic weather station (AWS) observations (5033 m a.s.l., October 2019–September 2021; Fig. 1) show that the climate in the catchment is characterized by a relatively small temperature amplitude during the year (around 20 ∘C, JJA being the warmest months and DJF being the coldest) and significant daily amplitude (up to 10 ∘C during the warm season). The mean annual temperature is −1.5 ∘C at the AWS, where night freezing can occur until the beginning of June and resume at the beginning of October. The catchment is dry (200–300 mm yr−1), and precipitation mostly falls as rain during the monsoon (JJAS).
Around 5 % of the catchment is covered by glaciers (RGI Consortium, 2017), which are concentrated in its southwestern part. They feed several proglacial lakes that can reach up to 6 km in length. Geodetic glacier mass budgets show that, similarly to other glaciers in the region, glaciers of the Paiku catchment have undergone sustained mass loss at least since the 1970s, with an average mass balance of −0.3 m water equivalent per year () until the beginning of the 2000s and around −0.4 thereafter (Bhattacharya et al., 2021). There are more than 10 rivers that drain the catchment towards the lake, and most of them only exhibit a seasonal activity during the monsoon months. The three main ones are (Fig. 1) Daqu (glacier-fed, 450 km2), Bulaqu (glacier-fed, 325 km2) and Barixiongqu (non-glacier-fed, 703 km2, Lei et al., 2018).
In the northwest of the catchment, Lake Paiku covers approx. 280 km2 (11.5 % of the catchment surface area) and spans over 27 km from north to south. It has a mean water depth of 41 m, with a maximum water depth of 73 m (Lei et al., 2018). It receives water from direct precipitation and from land and glacier runoff, which can be routed at the surface via the river systems or at the subsurface via the alluvial formations. Because it is hydrologically closed, the lake mainly loses water through evaporation. Previous studies reported lake level fluctuations over different timescales. It reached 4665 m a.s.l. (85 m higher than the present level) prior to 25 ka and at the onset of the Holocene (11.9–9.5 ka); afterwards, the lake shrank gradually (Wünnemann et al., 2015). More recently, the lake level decreased by 3.7 m between 1972 and 2015, losing 4.2 % of its surface and 8.5 % of its volume. Measurements have been performed since the end of the 1970s and allow us to accurately know the evolution of the lake level until today (Lei et al., 2021, 2018); they are used in this study to validate our hydrological results (Sect. 3.2.1, Figs. 5d and 6b). At the seasonal scale, the lake level cycle has an amplitude of ∼0.4 m. It is marked by a strong increase during the monsoon period (JJAS), supported by direct precipitation, glacier melt and land runoff. From October and until the next monsoon period, evaporation dominates the lake mass budget, and the level decreases rapidly until January and at a slower rate afterwards (Lei et al., 2021).
3.1 Field measurements
An AWS was set up in October 2019 in the south of the catchment at an elevation of 5033 m a.s.l. (Fig. 1). It is equipped with various sensors which record air temperature, pressure, relative humidity, wind speed, incoming and outgoing long- and shortwave radiation, and precipitation every 15 min. The meteorological record extends to September 2021 and covers a period of nearly 2 years. We used it to evaluate and correct the distributed downscaled climatic forcing on which we rely in our modeling framework (Sect. 3.2.2).
Two temperature loggers recorded the surface temperature in the vicinity of the AWS location. Logger 15 (L15) is located at 5055 m a.s.l., 6 km west of the AWS. Logger 13 (L13) is located at 5356 m a.s.l., 12 km west of the AWS (Fig. 1). Both loggers were buried 10 to 15 cm below the surface to avoid direct solar radiation on the sensors and recorded surface temperature at a 20 min time step from October 2017 to October 2018. These surface temperature records were used to evaluate the simulations (Sect. 3.2.4).
3.2 Catchment thermo-hydrological modeling
3.2.1 Conceptual hydrological model for the catchment
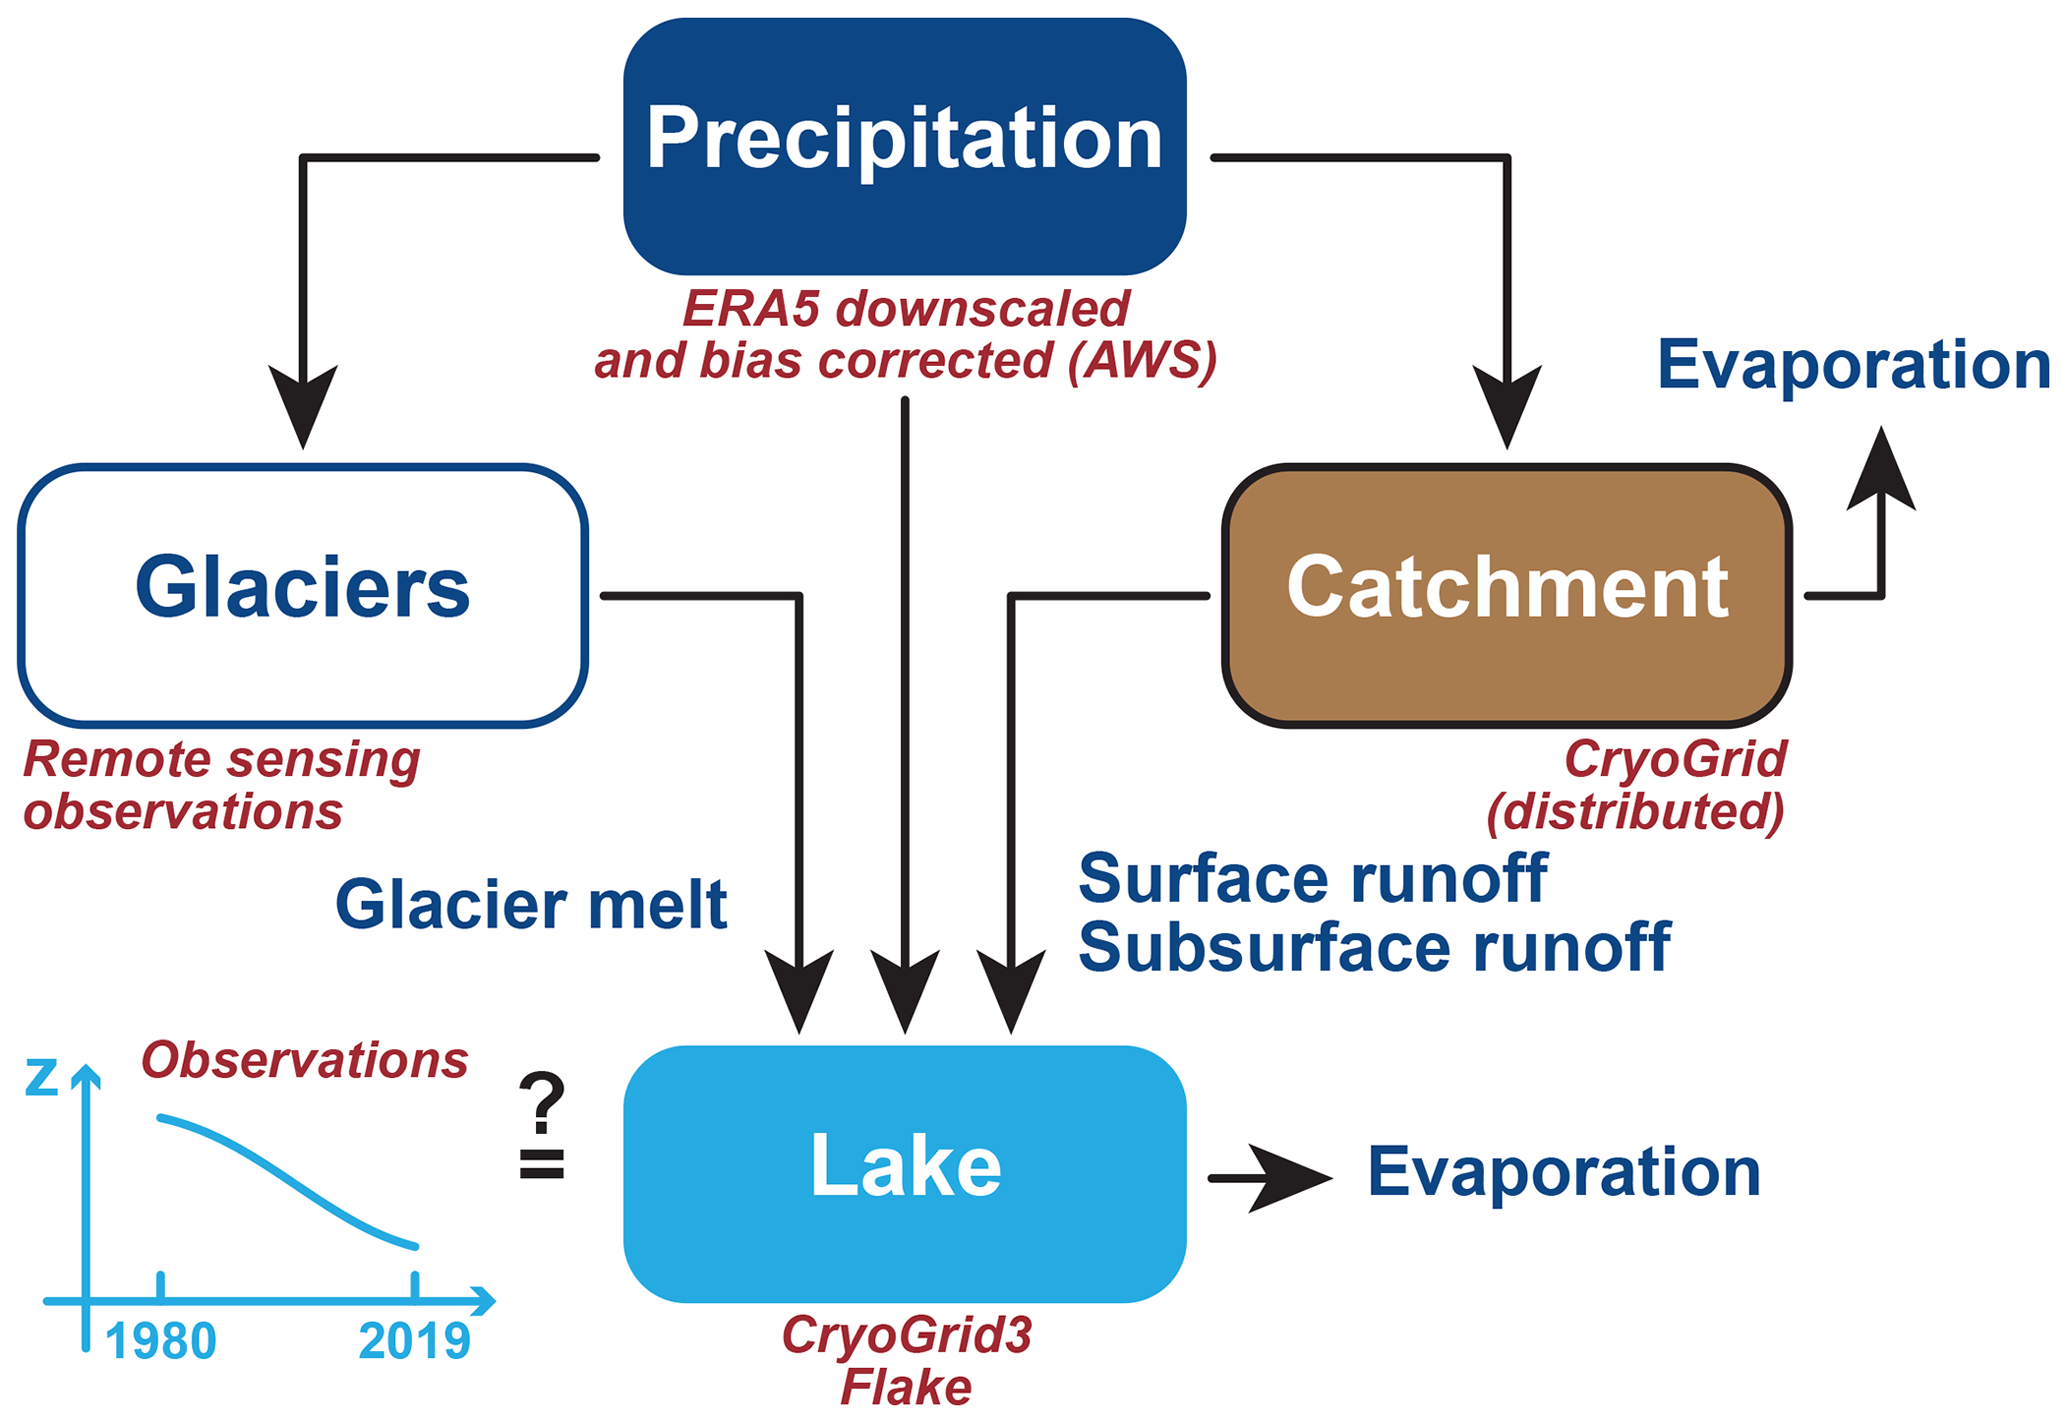
To understand the level variations of Lake Paiku over the last 40 years (1980–2019 period), we develop an approach at the catchment scale. Because the catchment is hydrologically closed, the lake receives water input via direct precipitation, land surface and subsurface runoff, and glacier runoff. Conversely, it loses mass via evaporation. Because the quantification of water flows between the lake and potential aquifers surrounding it is difficult (Rosenberry et al., 2015), our approach assumes that these flows are negligible. The present study requires quantification of the different terms of the hydrological balance. Under these assumptions, the hydrological balance of the lake is given by the following equation:
The production of forcing data for the catchment (including precipitation) is detailed in Sect. 3.2.2. The land hydrology processes are quantified using the CryoGrid community model (version 1.0) (Westermann et al., 2023), as described in Sect. 3.2.3. Distributed 1D simulations are used to quantify land evaporation and runoff. The routing of water in the catchment is not represented, and the runoff computed for a given simulation is directly accounted for as a water input for the lake. The evaporation from the lake is simulated using the CryoGrid3-Flake model (Langer et al., 2016), as described in Sect. 3.2.5. Glacier melt is not modeled but is estimated for the study period (1980–2019) from remote sensing observations. From these observations, glacier yield is calculated as described in Sect. 3.2.6. Our catchment-scale approach to represent the hydrological balance of the lake is summarized in Fig. 2. Based on this approach, we can evaluate the performance of our framework (Sect. 4.1.2) by comparing the simulated lake balance with the one derived from the detailed observations of lake level variations over the study period (Lei et al., 2018, 2021).
3.2.2 Forcing-data production and validation
In high-mountain environments, topography creates strong spatial variability in temperature and incoming radiation, which impact the surface energy balance (Klok and Oerlemans, 2002) and the ground thermo-hydrological regime (Magnin et al., 2017). Our approach requires forcing data that (i) capture this variability; (ii) include numerous variables such as air temperature, incoming long- and shortwave radiation, wind speed, specific humidity, rain, and snowfall; and (iii) cover the 40-year study period at a sub-daily time step. The TopoSCALE approach (Fiddes and Gruber, 2014) was developed for this purpose and allows us to downscale reanalysis products like ERA5 (Hersbach et al., 2020) at a high resolution (here ).
Additionally, because working at a 10−2 km2 spatial resolution over a 2400 km2 catchment would require more than 200 000 forcing files and simulations, we rely on the TopoSUB method (Fiddes and Gruber, 2012) to reduce computational costs. This method uses a SRTM30 digital elevation model to explore redundancies in physiographic parameters of the study area such as elevation, aspect, slope and sky-view factor and to identify groups of high-resolution pixels (100 m×100 m) sharing similar values for these parameters. From there, all the high-resolution pixels belonging to such a group are only described as a single TopoSUB point, for which climatic variables can be downscaled to create one single dataset of climatic time series. The degree of similarity required by TopoSUB to identify groups of high-resolution pixels with redundant physiographic parameters can be adjusted by choosing the final number of TopoSUB points (and thus climate datasets) that should be used to cover the area corresponding to one ERA5 pixel. The Paiku catchment intersects eight ERA5 pixels at 30 km resolution, and we chose to use 50 TopoSUB points within each ERA5 pixel to cover the spatial variability created by the topography in small-scale climate. Ultimately, 368 TopoSUB points are used to cover the catchment. The average level of redundancy (i.e., the average number of high-resolution pixels represented by a single TopoSUB point) is 723 ± 745 (1σ, median: 506, min: 1, max: 4347). Figure C1 shows the distribution of the TopoSUB points and a reconstruction of the topography of the catchment based on this approach. The period covered by the forcing datasets starts on 1 January 1980 and ends on 31 August 2020 (40 years and 8 months).
In the TopoSCALE statistical downscaling approach, we do not rely on the AWS data, and thus the downscaled ERA5 data can be biased, as is often the case over Asia (Jiang et al., 2021, 2020; Jiao et al., 2021; Orsolini et al., 2019). Comparison against the available AWS observations (Fig. D1) indeed highlights notable differences in variables such as air temperature and precipitation. From these differences, we derived monthly bias correction factors that we applied systematically to all 368 of the climate forcing datasets. The catchment averages for precipitation and air temperature are shown in Fig. 3. In this figure and across the rest of the study, we use p values to evaluate the significance of linear trends in the temporal evolution of certain variables (temperature, precipitation, evaporation etc.). This p value tests the null hypothesis which supposes that the value of the slope is equal to zero. The hypothesis is tested using Student's t test by comparing the distance between the estimated slope and 0 relative to the standard error of the slope. We did not report trends when this p value (probability of a null slope) was higher than 0.005.
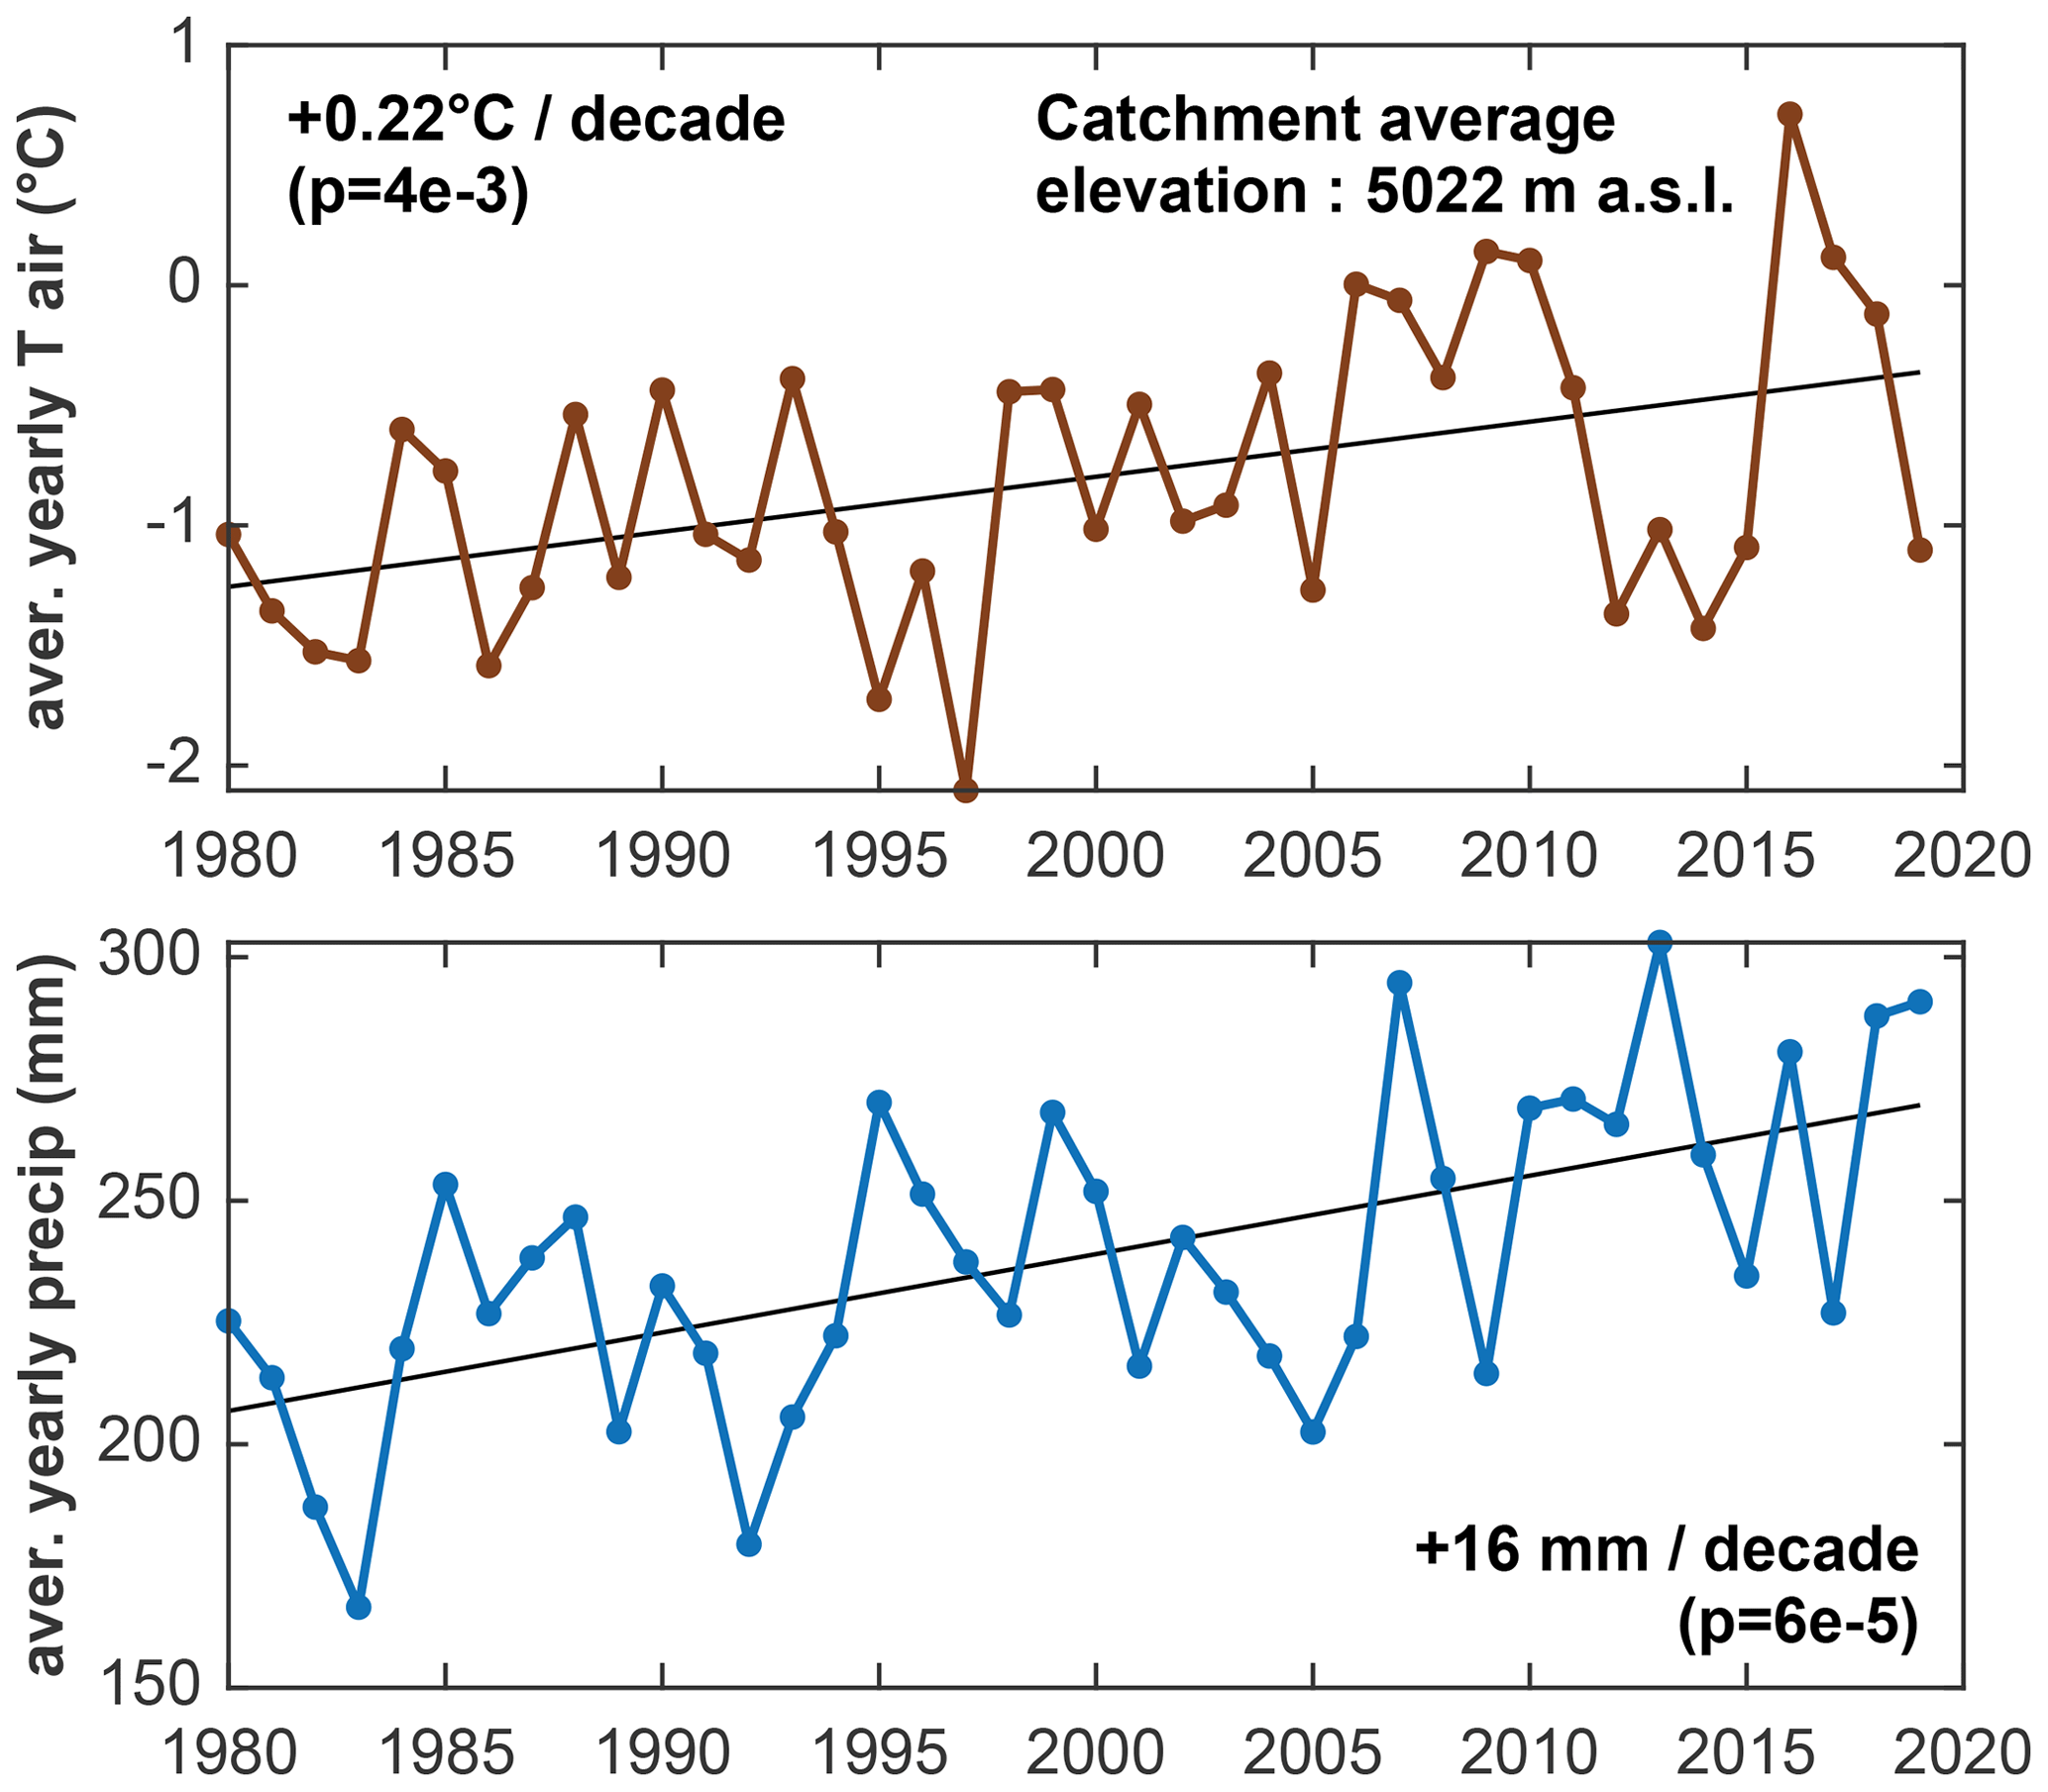
Figure 3Climate forcing data for the land and lake modeling. Annual catchment average air temperature (2 m above ground) and annual total precipitation for the study period. Note that the model is also forced by incoming short- and longwave radiation, humidity, wind speed, and air pressure. Details about the spatial and temporal resolutions of the distributed forcing data are presented in Sect. 3.2.2.
3.2.3 The CryoGrid community model (version 1.0)
To simulate the ground thermo-hydrological regime, we use the CryoGrid community model (Westermann et al., 2023). The CryoGrid community model (CG) is a land surface model designed for applications in cold regions where seasonal frozen ground or permafrost may occur. The model implements heat transfer in a 1D soil column, accounting for freeze–thaw processes of soil water using effective heat capacity (Nakano and Brown, 1972). To do so, soil-freezing curves are based on Dall'Amico et al. (2011), as detailed in Westermann et al. (2013). Vertical water movement in the soil column is based on Richards' equation (Richardson, 1922; Richards, 1931). The soil matric potential and hydraulic conductivity follow van Genuchten (1980) and Mualem (1976). Additionally, to represent the obstruction of connected porosity by ice formation, the hydraulic conductivity is reduced by a factor dependent on the local ice content, following Dall'Amico et al. (2011). The model features the snowpack module called CG Crocus described in Zweigel et al. (2021), which adapts the snow physics parameterizations from the CROCUS scheme (Vionnet et al., 2012) to the native snow module of CryoGrid3 (Westermann et al., 2016). At the surface, the model uses a surface energy balance module to calculate the ground surface temperature and water content. The turbulent fluxes of sensible and latent heat are calculated using a Monin–Obukhov approach (Monin and Obukhov, 1954). Evaporation is derived from the latent heat fluxes using the latent heat of evaporation and is adjusted to the available water in the soil. It occurs in the first grid cell only, but water can be drawn upwards due to matric potential differences. Because vegetation is very scarce in the catchment, we do not expect transpiration to have a strong imprint on evapotranspiration, and our calculations do not unravel evaporation from transpiration.
3.2.4 Model setup and validation
The setup of the CryoGrid community model for the land is presented in Fig. 4. To capture the high spatial variability of mountainous climate, our approach relies on the 368 climate forcing datasets to cover the catchment (see Sect. 3.2.2). This approach enables us to perform spatially distributed modeling. All 368 of the simulations are independent and use the same parameterization. In the absence of direct observations of the soil stratigraphy within the catchment, the soil column was designed to agree with field observations in the region (Yuan et al., 2020; Wang et al., 2009; Hu et al., 2020; Luo et al., 2020; S. Yang et al., 2014; Wang et al., 2008), to be consistent with similar modeling approaches across Tibet (Chen et al., 2018; Song et al., 2020) and to be consistent with input datasets (Shangguan et al., 2013, 2017). Thus, the soil stratigraphy is divided into three units: a top soil (0.3 m thick), a bottom soil (1.7 m thick) and a bedrock unit (extending beyond the depth of interest of the study). An overview of the parameters for each unit, their source and the way they are calculated is presented in Table A1 in the Appendix.
Regarding the processes implemented in the model (Sect. 3.2.3), infiltration according to Richards' equation only occurs in the top and bottom soil units. The bedrock unit has a static water content. Unraveling surface from subsurface flow is an ongoing challenge in catchment-scale hydrology (McDonnell, 2013), and this distinction is important in mountain terrains where these two flows can behave differently due to the complex topography (Seibert et al., 2003; Gao et al., 2014; Hu et al., 2020). For this study, we rely on a simple approach that is based on thresholds regarding the soil water content (porosity and field capacity). These kinds of approaches are thus based on soil properties and have often been used in hydrological modeling studies (Vörösmarty et al., 1989; Shaman et al., 2002; Kelleners et al., 2010; Kampf, 2011; Samuel et al., 2008). In detail, we compute surface and subsurface flow as follows.
On the one hand, surface runoff is computed relative to the saturation level of the soil column. When the entire soil column is saturated (WC = porosity), additional water input from precipitation or snow melt is directly counted as surface runoff. On the other hand, subsurface runoff is computed relative to the field capacity of the ground, which is an input parameter of the model. When the water content (WC) of a ground cell exceeds this field capacity (FC), the amount of water corresponding to WC minus FC is available to produce subsurface runoff. We use the lateral boundary condition LAT_WATER_RESERVOIR from the CryoGrid community model (Westermann et al., 2023) to account for this subsurface runoff. The speed at which this available water exits the soil column towards the lake is calculated with Darcy's law, using the hydrological conductivity of the ground and the mean slope of the catchment as hydraulic slope. Because the model couples thermal and hydrological fluxes, all of these changes in the soil water content can be driven by precipitation input and evaporation but also by water phase change in the ground, such as ice melt.
Because we do not have knowledge of the distributed thermal state with depth over the catchment at the beginning of the simulations, we assume that temperature profiles were in equilibrium with the climate of the 5 first years of modeling (1980–1984). To do so, we start our simulations with a 60-year spin-up of these first 5 years (12 repetitions), which is sufficient to establish a stable temperature profile over the first 9 to 80 m, depending on the simulations, extending beyond the hydrologically active part of the ground (the first 2 m).
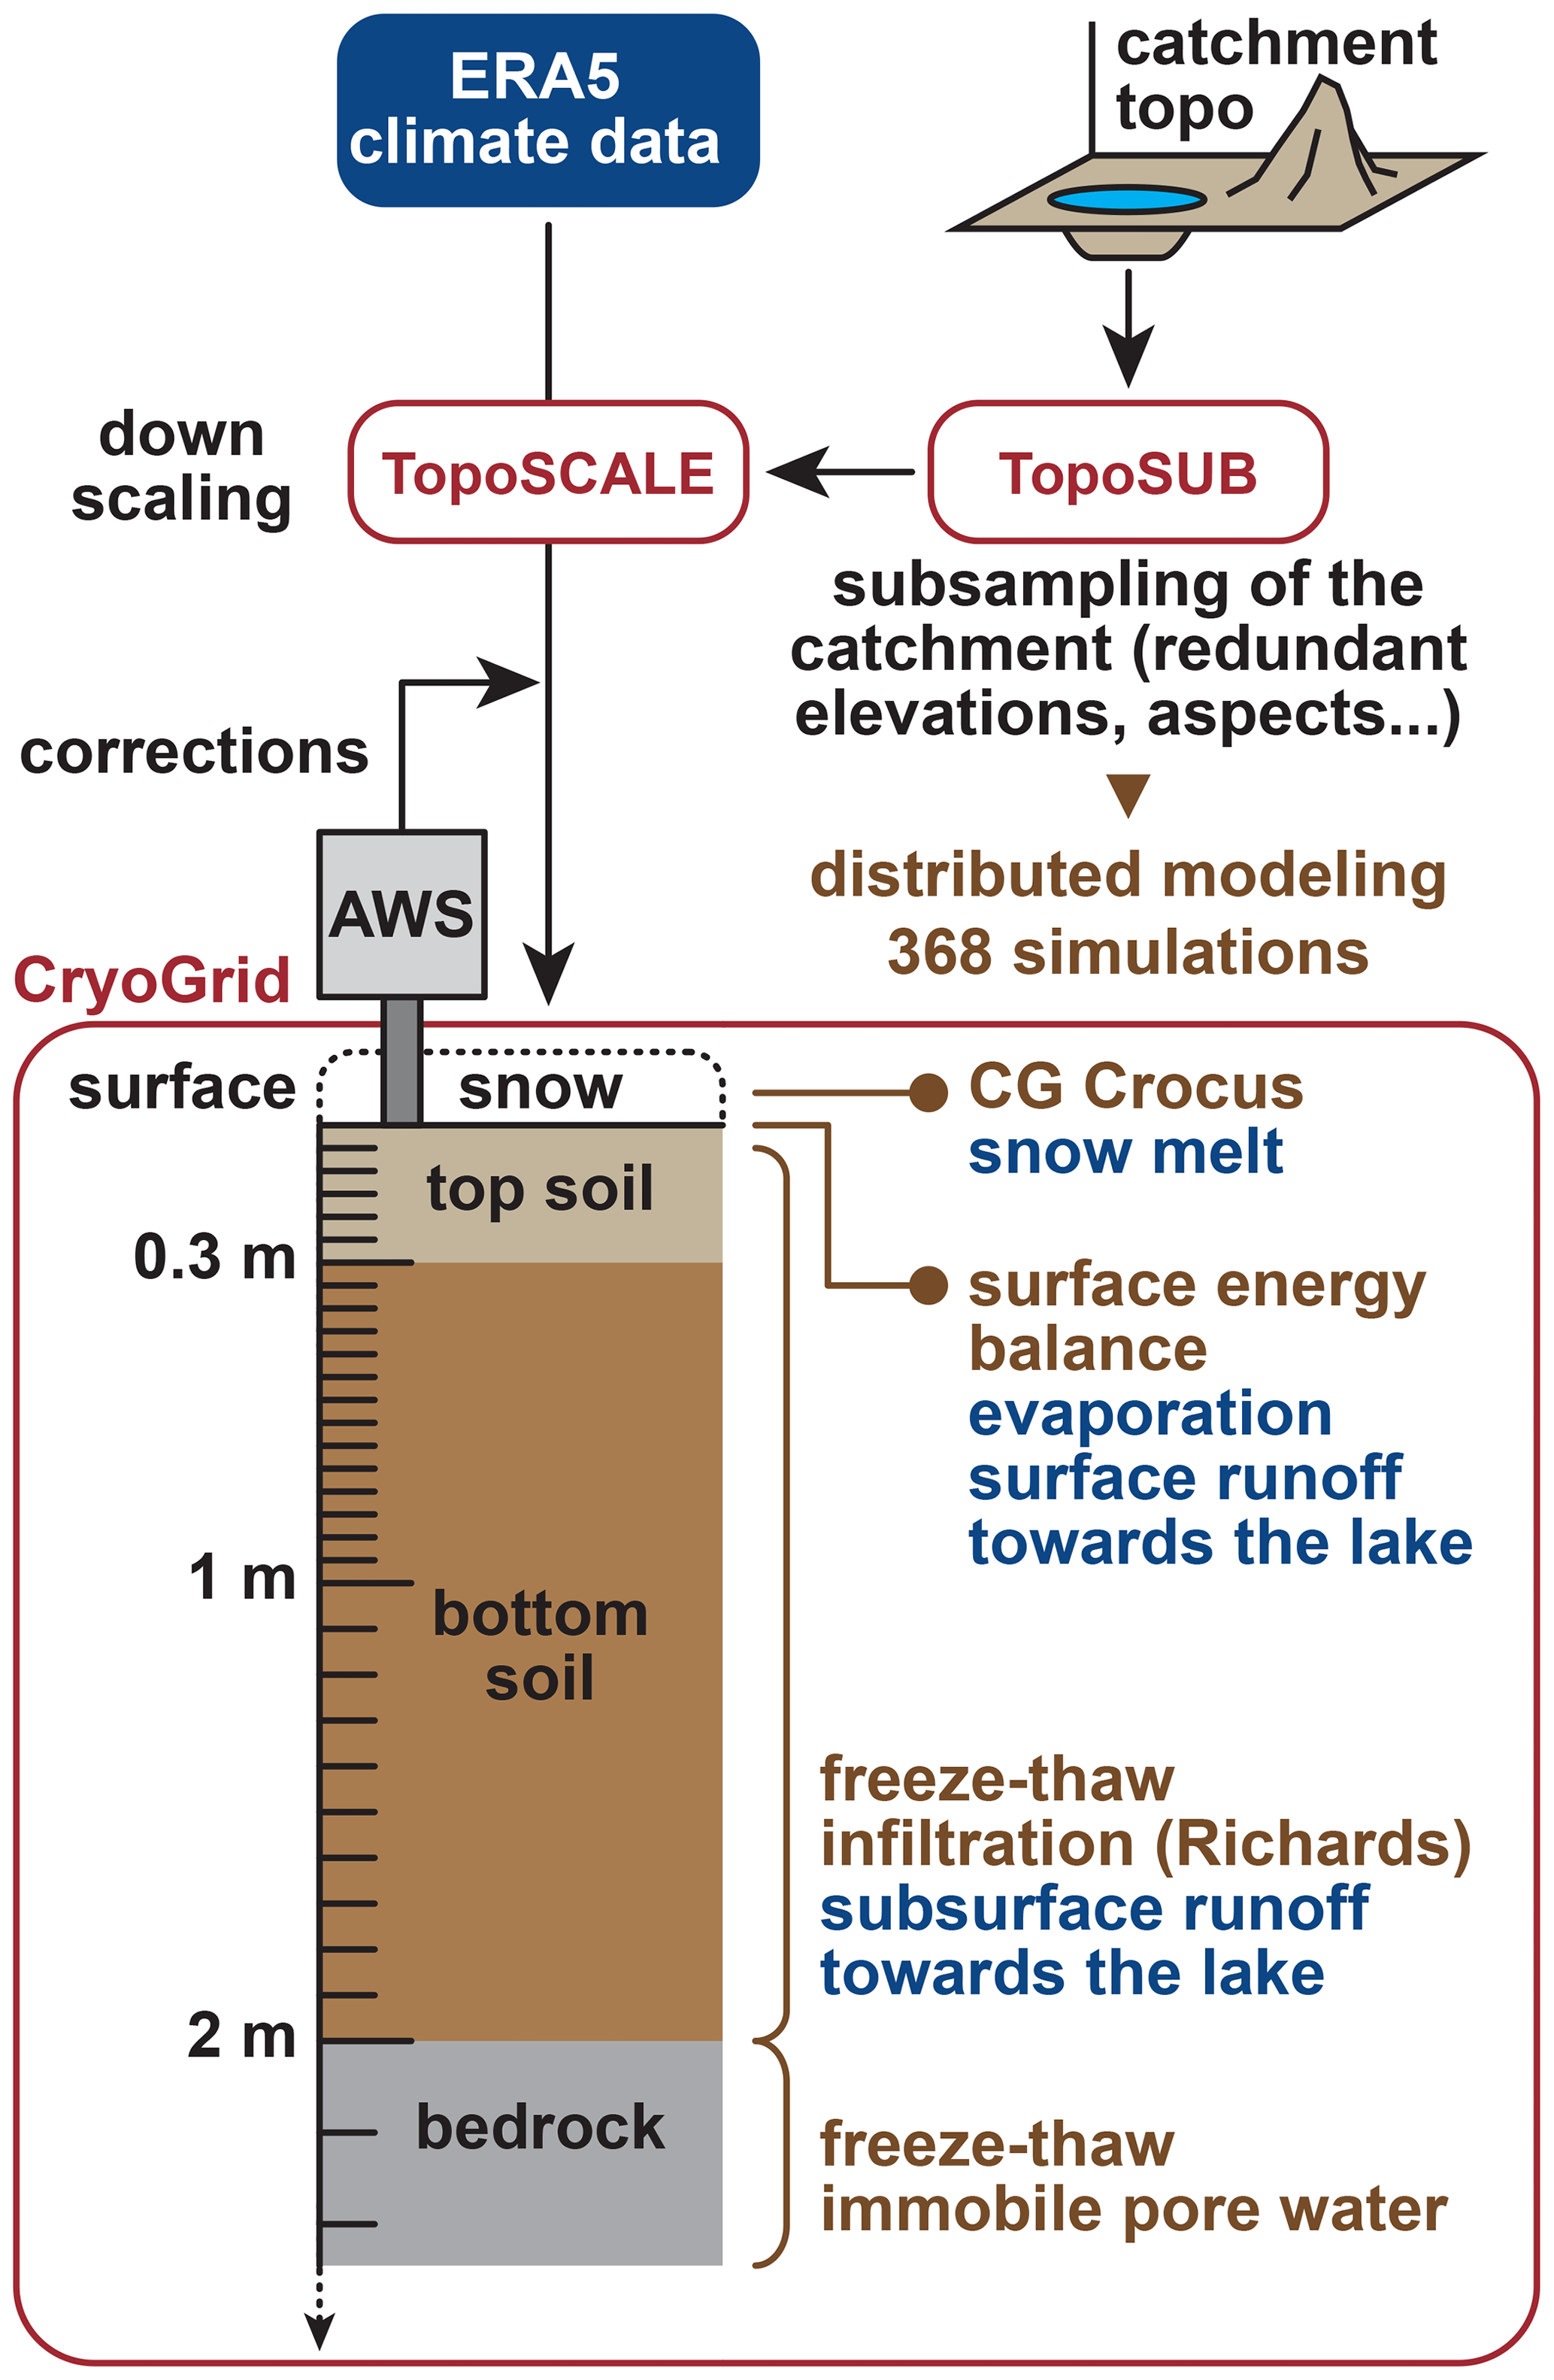
Figure 4Modeling framework for the land hydrology. ERA5 data are downscaled using the TopoSUB and TopoSCALE approaches (Fiddes and Gruber, 2014, 2012). The downscaled data are bias-corrected based on the AWS observations. Distributed 1D simulations are performed using the CryoGrid community model (Westermann et al., 2023). The vertical resolution is indicated with the tick marks on the depth axis.
To validate model simulations, the simulated ground surface temperatures (GSTs) are compared to the two temperature logger time series acquired in the vicinity of the AWS (Sect. 3.1). We used this comparison to calibrate the surface roughness used for the surface energy balance calculations in the model.
The following method is used to produce area-averaged evaporation and runoff (in mm, water equivalent) in a zone of interest. For a given TopoSUB point in this zone, the model produces hydrological values (in m3) using the area of a TopoSUB pixel on the catchment map. Then these values are multiplied by the number of pixels in the zone corresponding to this TopoSUB point in particular, and this is for all the relevant TopoSUB points covering the zone (e.g., evaporation in warm permafrost). Then the area of interest is calculated by counting the number of pixels in the zone of interest and multiplying this number by the area of a pixel. Then the total volume is divided by the total surface for the zone of interest to obtain the final value (in mm).
3.2.5 Lake modeling
The lake thermo-hydrological response to the climatic forcing data is simulated using the CryoGrid3-Flake model (Langer et al., 2016). The two models were coupled by Langer et al. (2016) to simulate the thermal regime of thermokarst lakes (including surficial water freezing and melting) and underlying ground. Here, we use the coupled models mainly to quantify evaporation at the lake surface. In the coupled model, the native surface energy balance module of CryoGrid3 (Westermann et al., 2016) was amended to account for processes tied to free water surface energy balance: (i) the dependence of the albedo of a water surface on solar angle (and thus time of the day) and wind speed (and wave formation), (ii) the dependence of the surface roughness length on wind speed (and wave formation), and (iii) the exponential decay of incoming radiation with depth in the water column. Similarly to the land simulations, the lake simulations were forced by the downscaled ERA5 data (with the TopoSUB and TopoSCALE methodology), with the corrections being derived from the AWS data (Sect. 3.2.2). The simulations were initiated with a 20-year spin-up of the 1980–1984 climate. The simulation results corresponding to the four ERA5 tiles covering the lake were then averaged using the respective spatial footprint of each tile on the lake.
3.2.6 Quantification of glacier mass change
Multiple studies quantified the volume change of the glaciers located within the Paiku catchment in the recent past (1970s to 2020). To our knowledge, there are no field-based measurements of glacier mass balance available in this catchment. As a consequence, we rely solely on geodetic mass balance studies (Brun et al., 2017; Maurer et al., 2019; King et al., 2019; Shean et al., 2020; Hugonnet et al., 2021). All these studies estimated glacier volume changes over periods of 20–30 years from satellite-derived DEMs. As a consequence, we can only estimate the average annual glacier mass balance and not the year-to-year variability. Glaciers occupy approximately 113 km2 in the Paiku catchment. They have shrunk over the past 50 years at a rate of 0.44 % yr−1 from an area of 132 km2 in 1975 to 122 km2 around 2000 and to their current extent (King et al., 2019; Bolch et al., 2019). The average mass balances for the period 1975–2000 and 2000–2020 are −3.9 ± 2.1×10¹⁰ and −5.4 ± 2.4×10¹⁰ kg yr−1, respectively (−4.6 ± 2.5×10⁷ and −6.4 ± 2.8×10⁷ m3 with a 850 kg m−3 density). These mass balances correspond to specific mass balances of −0.31 ± 0.17 m of water equivalent per year () and −0.47 ± 0.21 , respectively.
Regarding glacial runoff, it was estimated to be 320 ± 4 mm yr−1 for the 2001–2010 period by Biskop et al. (2016) using a temperature index approach for ice melt. For the 2000–2018 period, X. Zhang et al. (2020) derived a runoff value of 52 ± 12 mm yr−1 (1.24 ± 0.29×10⁸ m3 yr−1, which we scaled to the basin area). The value we derive of 39 ± 13 mm yr−1 is thus found to have good consistency with the latter one (Sect. 4.1.1).
4.1 Model validation and hydrological budget of Lake Paiku
4.1.1 Model validation
Simulated daily ground surface temperatures are in good agreement with the observed ones, showing a bias of −0.2 and 0.6 ∘C and an RMSE of 1.4 and 1.6 ∘C for loggers 15 and 13, respectively (Fig. 5a and c). Most of this RMSE is explained by a mismatch between the model and observations in the tails of the temperature distribution, whereas intermediate temperatures exhibit the best agreement with observations.
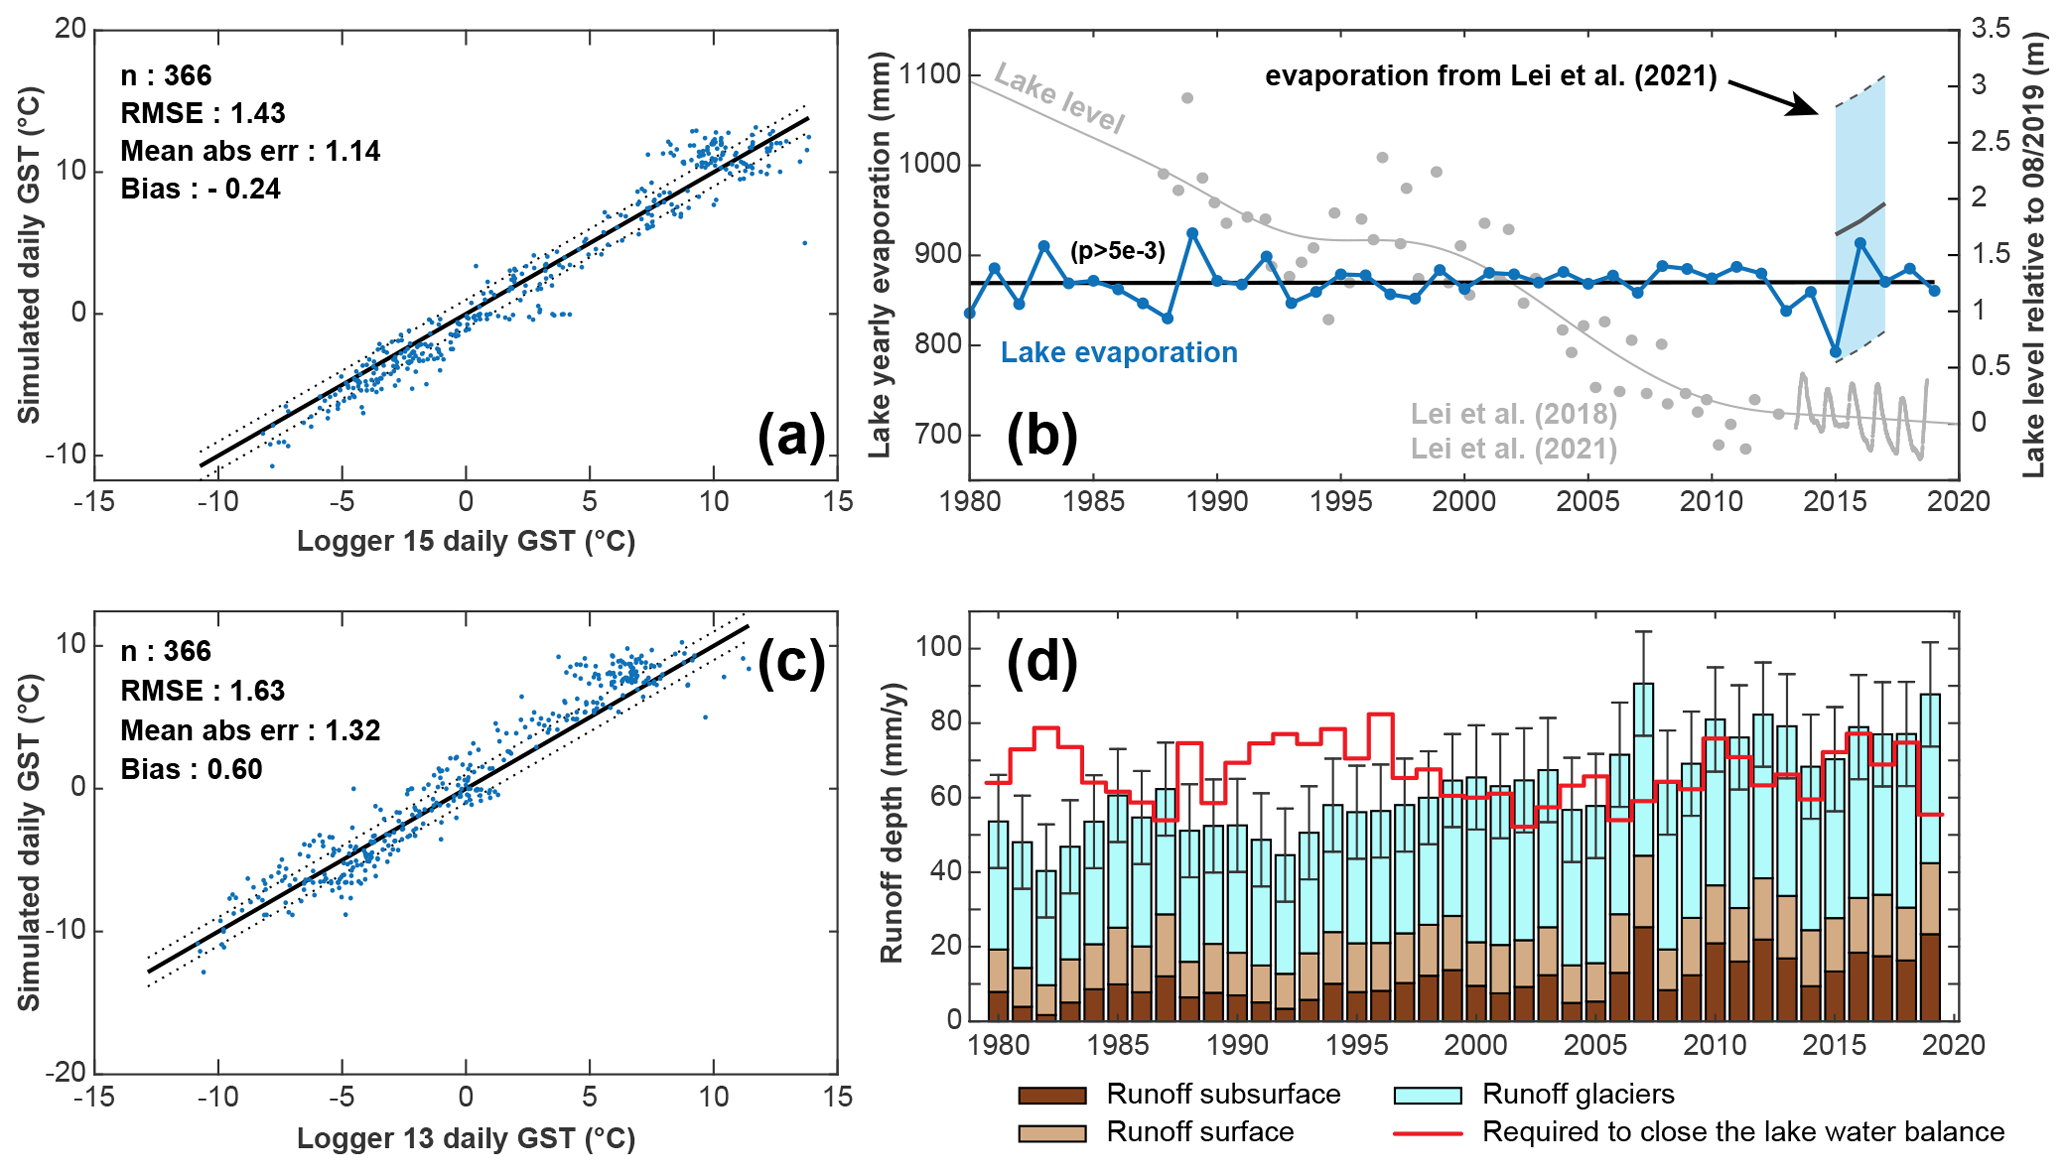
Figure 5Model validation. (a) and (c) Modeled mean daily ground surface temperatures compared to measured ground surface temperatures for logger 15 and logger 13 (location on Fig. 1). (b) Modeled annual lake evaporation (blue curve) and comparison with values calculated by Lei et al. (2021) in the light-blue zone. The gray curve shows the smoothed lake level relative to August 2019 based on observations from Lei et al. (2018) (gray points) and Lei et al. (2021) (oscillating gray line). (d) Comparison between the runoffs required to reproduce the observed lake variations (red curve, derived from lake level, lake area, forcing data and lake evaporation) and the sum of the glacier and land runoff we derive from remote sensing observations and modeling (Sect. 3.2). Error bars are associated with the glacier values and come from the geodetic results. Runoff values are expressed as heights scaled to the land surface of the Paiku catchment.
Annual lake evaporation mainly ranges between 800 and 900 mm yr−1 (Fig. 5b), with a mean value of 870 ± 23 mm (1σ). Lake evaporation does not exhibit a linear trend of increasing or decreasing and is mostly dominated by year-to-year variability. Though slightly lower, our evaporation results are in good agreement with the values from Lei et al. (2021), which are derived from local and regional meteorological observations and lake budget calculations (Fig. 5b). We used the simulated evaporation together with the lake level data and lake area data from Lei et al. (2018) and Lei et al. (2021) and the precipitation forcing datasets (3.2.2) to derive the total runoff (land + glacier) required as an input to the lake budget to reproduce the lake variations. This required runoff corresponds to the red line of Fig. 5d. The required runoff volumes are scaled to the land area of the catchment to be comparable with the other variables. Figure 5d also presents the runoff values derived from the land cryo-hydrological modeling and from the glacier remote sensing investigations. Annual volumes are expressed (in mm) over the land part of the catchment (excluding the lake). As presented in Sect. 3.2.6, glacier mass balance values are considered to be constant for the 1980–2000 period and the 2000–2019 period and are, respectively, equal to −4.6 ± 2.5×10⁷ and −6.4 ± 2.8×10⁷ m3 yr−1. The addition of annual precipitation to these values to quantify the total glacier runoff introduces year-to-year variability to the glacier runoff. At the catchment scale, the average glacier runoff over the 40 years is 39 ± 13 mm yr−1.
Over the 40 years, the average annual land runoff value (surface + subsurface) we model is 24 ± 8 mm. Summed together, the land and glacier runoff are in partial agreement with the runoff that is required to close the lake water balance. Annual values are compatible within error bars for 28 out of the 40 years of simulations. The glacier and land runoff are slightly too small to close the lake water balance during the first 20 years and slightly too large for the last 20 years of simulation. Over the whole period, the sum of the glaciers + land runoff produces 95 % of the required runoff. Land runoff is further described in Sect. 4.3, and lake results are described in the following section.
4.1.2 Hydrological budget of Lake Paiku
Our observations, climate data, simulations, geodetic data and the lake level data from Lei et al. (2018, 2021) enable us to quantify the different terms of the lake hydrological budget. We present these results in meters for lake level change based on the average slope of the volume = f (level) relationship (Fig. 6). As the unique output term, evaporation dominates the lake budget with an average annual value of 0.86 m (34.6 m per 40 years; Fig. 6a). Direct precipitation in the lake is the dominant input, with an average annual value of 0.31 m (12.3 m per 40 years), followed by glacier runoff (0.28 m yr−1, 11.3 m per 40 years) and land runoff (0.18 m yr−1, 7.0 m per 40 years). When compared with lake volume observations over the 40 years of the simulation, the simulated lake budget is 1.04 m too negative.
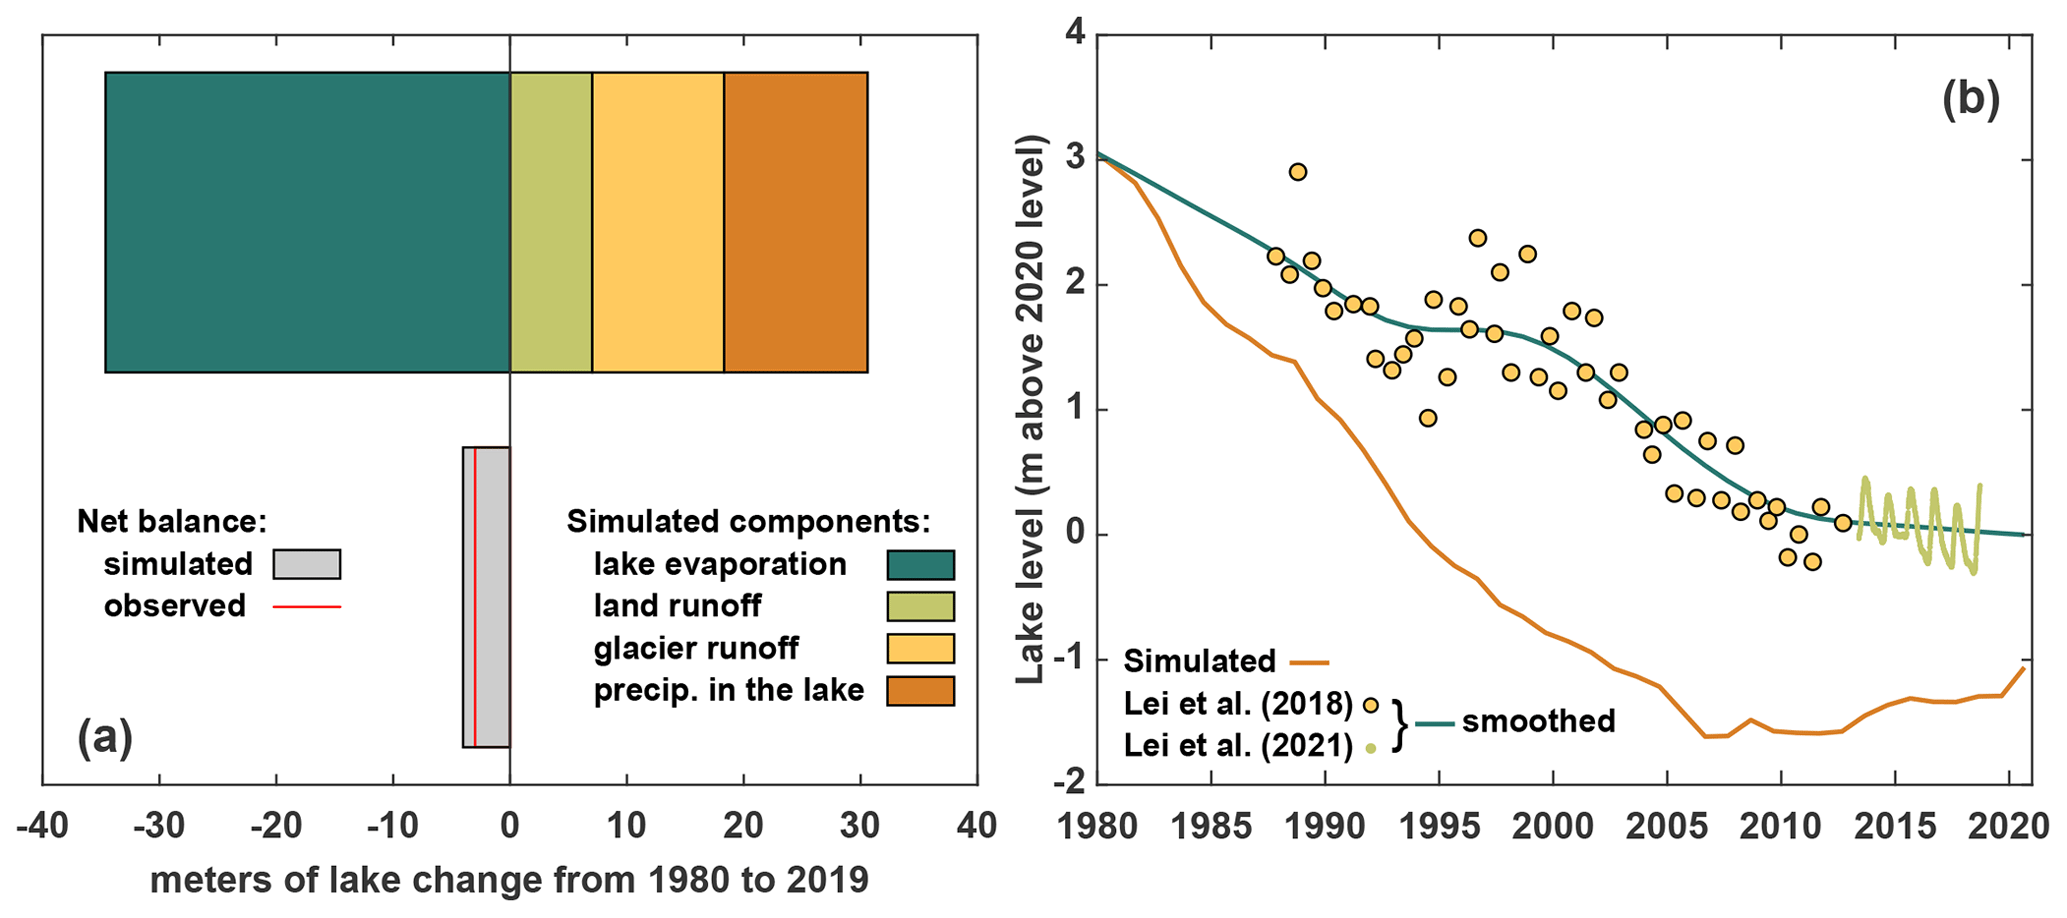
Figure 6Budget and level of Lake Paiku for the simulation period (1980–2019). (a) The different components of the hydrological budget of the lake according to our framework. Results are given in meters for lake change based on the average slope of the volume = f (level) relationship. (b) Lake level data. Points correspond to observations from Lei et al. (2018, 2021) that we smoothed (green curve, also based on observation points older than 1980). The simulated lake level appears in orange.
Based on our results, we also reconstructed lake level variations that we compare with the observed variations (Fig. 6b). Following our framework, our values are presented at an annual time step. They qualitatively reproduce the overall lake level decrease but tend to overestimate this decrease and show an increasing mismatch with the observations from 0 in 1980 to 2 m in 2005. This mismatch is later compensated for by an increasing lake level trend in our simulation from 2005 to 2019. At the end of the simulation period, the mismatch is 1.04 m, which is consistent with the budget values (Fig. 6a) and the fact that our approach provides 95 % of the required runoff to close the lake budget (Sect. 4.1.1). This pattern of a too-strong decrease followed by an increase is consistent with the comparison between simulated and required runoff presented in Fig. 5d.
4.2 Ground thermal results
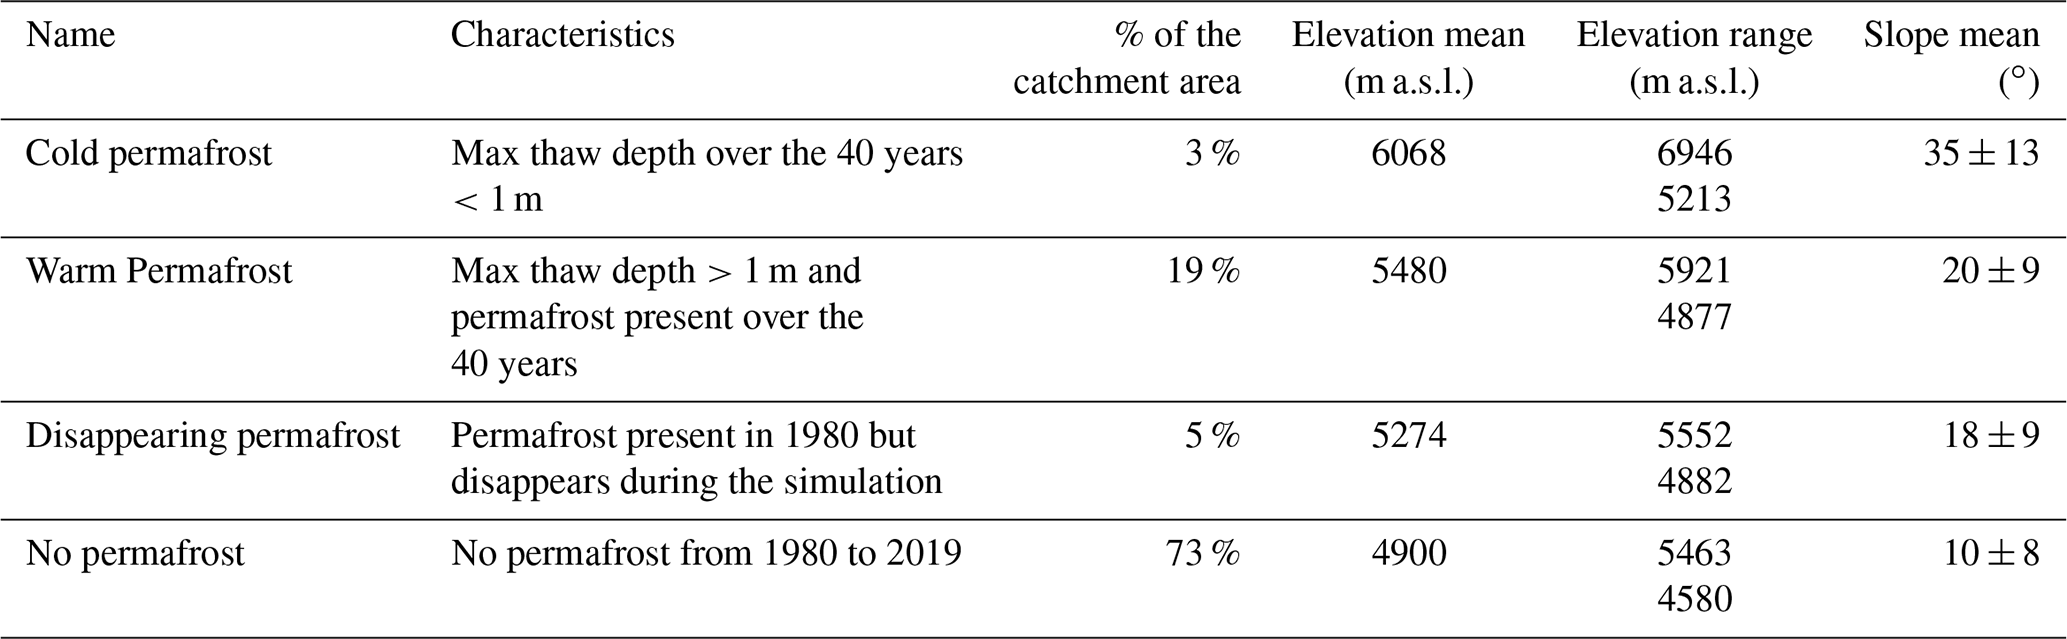
Based on our temperature results, we define four categories of ground thermal regimes (Fig. 7a). Cold permafrost refers to the areas of the catchment for which the deepest thaw depth did not exceed 1 m over the 40 years of simulation. For cold permafrost, frozen conditions dominate the first meters of the ground most of the year, and surficial thawing during summer can be interrupted by ground freezing from the surface to the top of the permafrost at night. Warm permafrost refers to the areas of the catchment that present permafrost for the whole duration of the simulation and which are not part of the cold permafrost. These areas are characterized by a distinct seasonal pattern of frozen ground in winter and an active layer in summer. Disappearing permafrost refers to the areas of the catchment that present permafrost at the beginning of the simulation and not at the end. No permafrost refers to the areas without permafrost at the onset of the simulation. The geographical characteristics of each ground category are presented in Table 1, and their distributions throughout the catchment are shown in Fig. 7a. These different ground categories are subsequently used to compare their cryo-hydrological behaviors during the simulation (consistent color code).
Table 1Cryological classification of the catchment based on the modeled ground temperatures.
At the catchment scale, the 2 m depth temperature (Fig. 7b) shows a pronounced warming trend of 0.17 ∘C per decade (). This trend is mainly supported by the no-permafrost areas, which underwent a slightly stronger warming trend of 0.2 ∘C per decade (). Areas with disappearing permafrost, warm permafrost and cold permafrost exhibit smaller trends around 0.1 ∘C per decade, with decreasing p values (respectively, 0.00001, 0.006 and 0.05 – i.e., non-significant for the last two).
From 1980 to 1989, permafrost covers 27 % of the catchment, and the mean active-layer thickness (ALT) is 1.36 ± 0.51 m (1σ, minimum: 0.11 m and maximum: 2.37 m; Fig. 7c). From 2010 to 2019, permafrost covers 22 % of the catchment. At the scale of the initial permafrost area, this change corresponds to a loss of 19 %. The mean ALT is 1.29 ± 0.49 m (1σ, minimum: 0.11 m and maximum: 2.55 m; Fig. 7d) for this period. Permafrost disappearance (gray zones in Fig. 7d) mainly happens for the low-lying permafrost in the south and at the center of the catchment. It occurs, for the most part, on the outer slopes of the permafrost regions and at the bottom of steep glacial valleys.
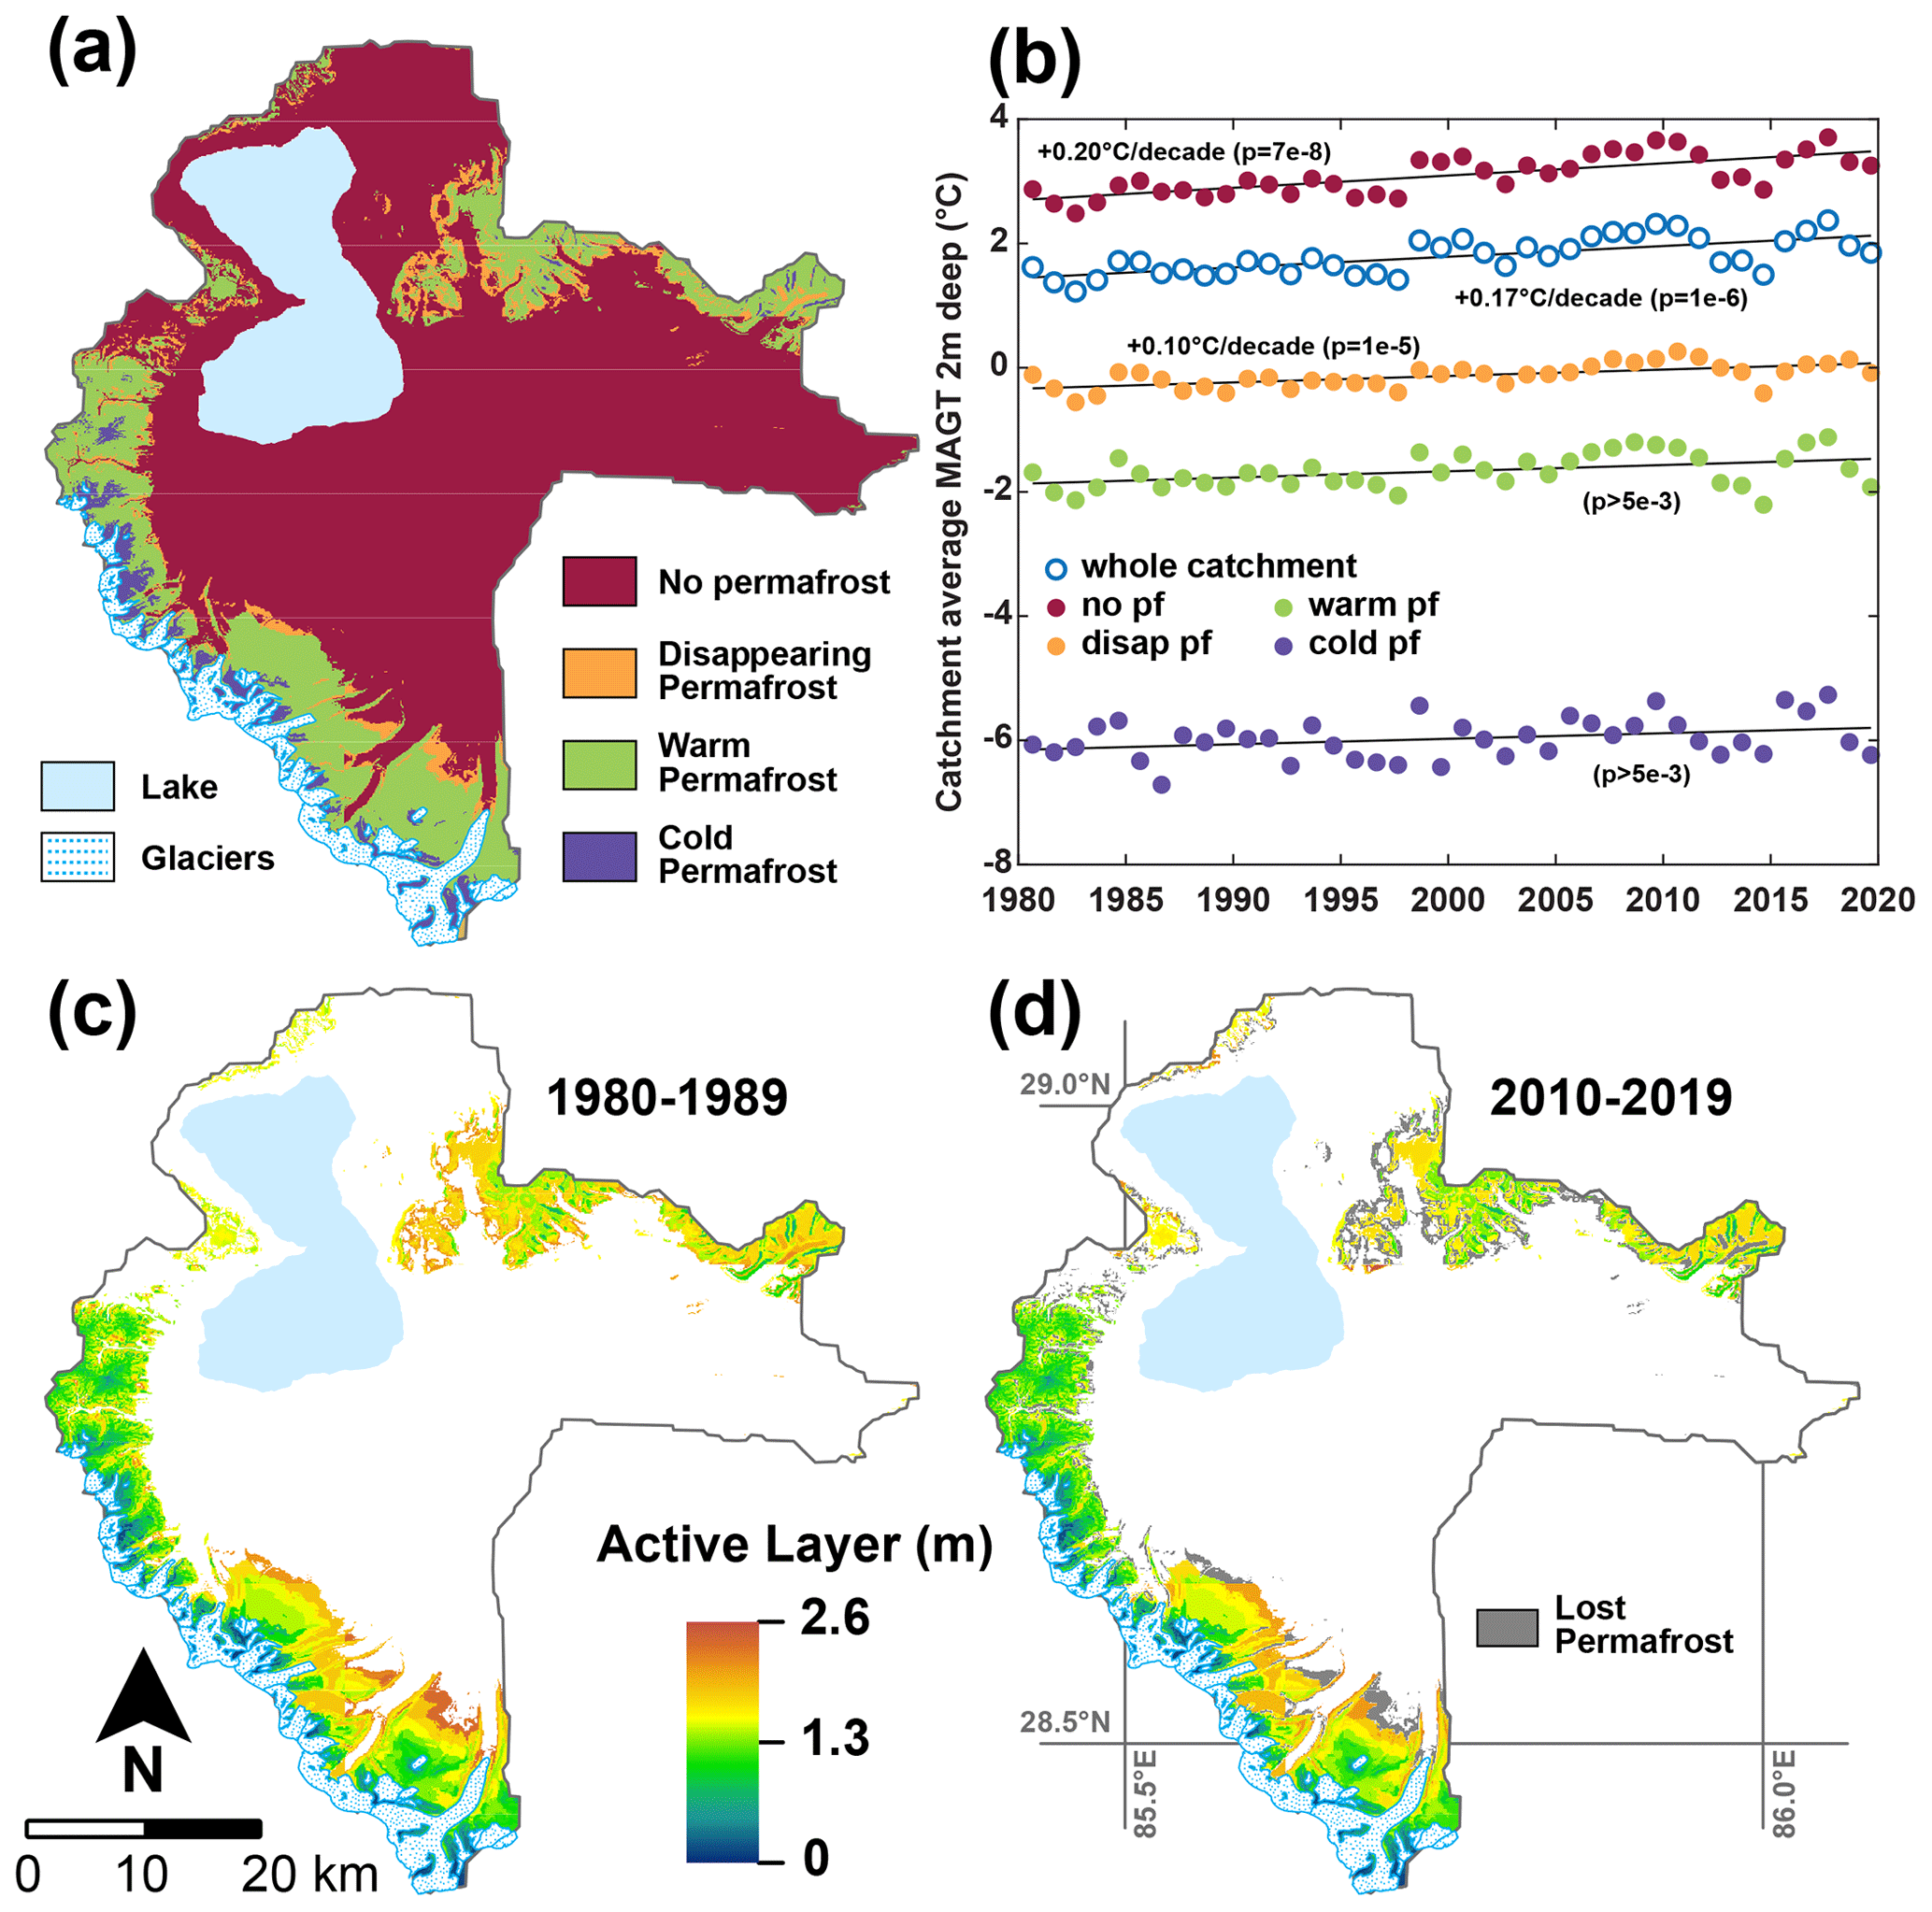
Figure 7(a) Different cryological states of the ground throughout the catchment for the 1980–2019 period (see Table 1). (b) Mean annual ground temperature (MAGT) 2 m deep, averaged for the whole catchment and for the different cryological states of the ground. (c) Average active-layer depth over the 1980–1989 period. (d) Average active-layer depth over the 2010–2019 period. Only locations presenting permafrost at the end of the simulation are assigned a color in the maps in (c) and (d). Locations where permafrost has disappeared are shown in gray on (d).
We also present the average duration of seasonal thaw at a depth of 70 cm averaged over the catchment (Fig. 8a). Because at this depth some areas might present 2 (or more) consecutive years without thawing (highest locations) or without freezing (lowest locations), these areas were excluded from the averaging. In the end, the averaged results account for 89 % of the catchment land area (i.e., excluding glaciers and Lake Paiku). The results show an increasing trend in the duration of the seasonal thaw of +4.6 d per decade (; blue line in Fig. 8a). When looking at the average start and stop days of the seasonal thaw (Fig. 8a, gray lines) in the Julian calendar (day 150 is 30 May and day 300 is 27 October), we note that this increase is mainly caused by a later ending date of the thaw season (Stop date in Fig. 8a; +6.1 d per decade, ) and not by an earlier starting date (non-significant trend).
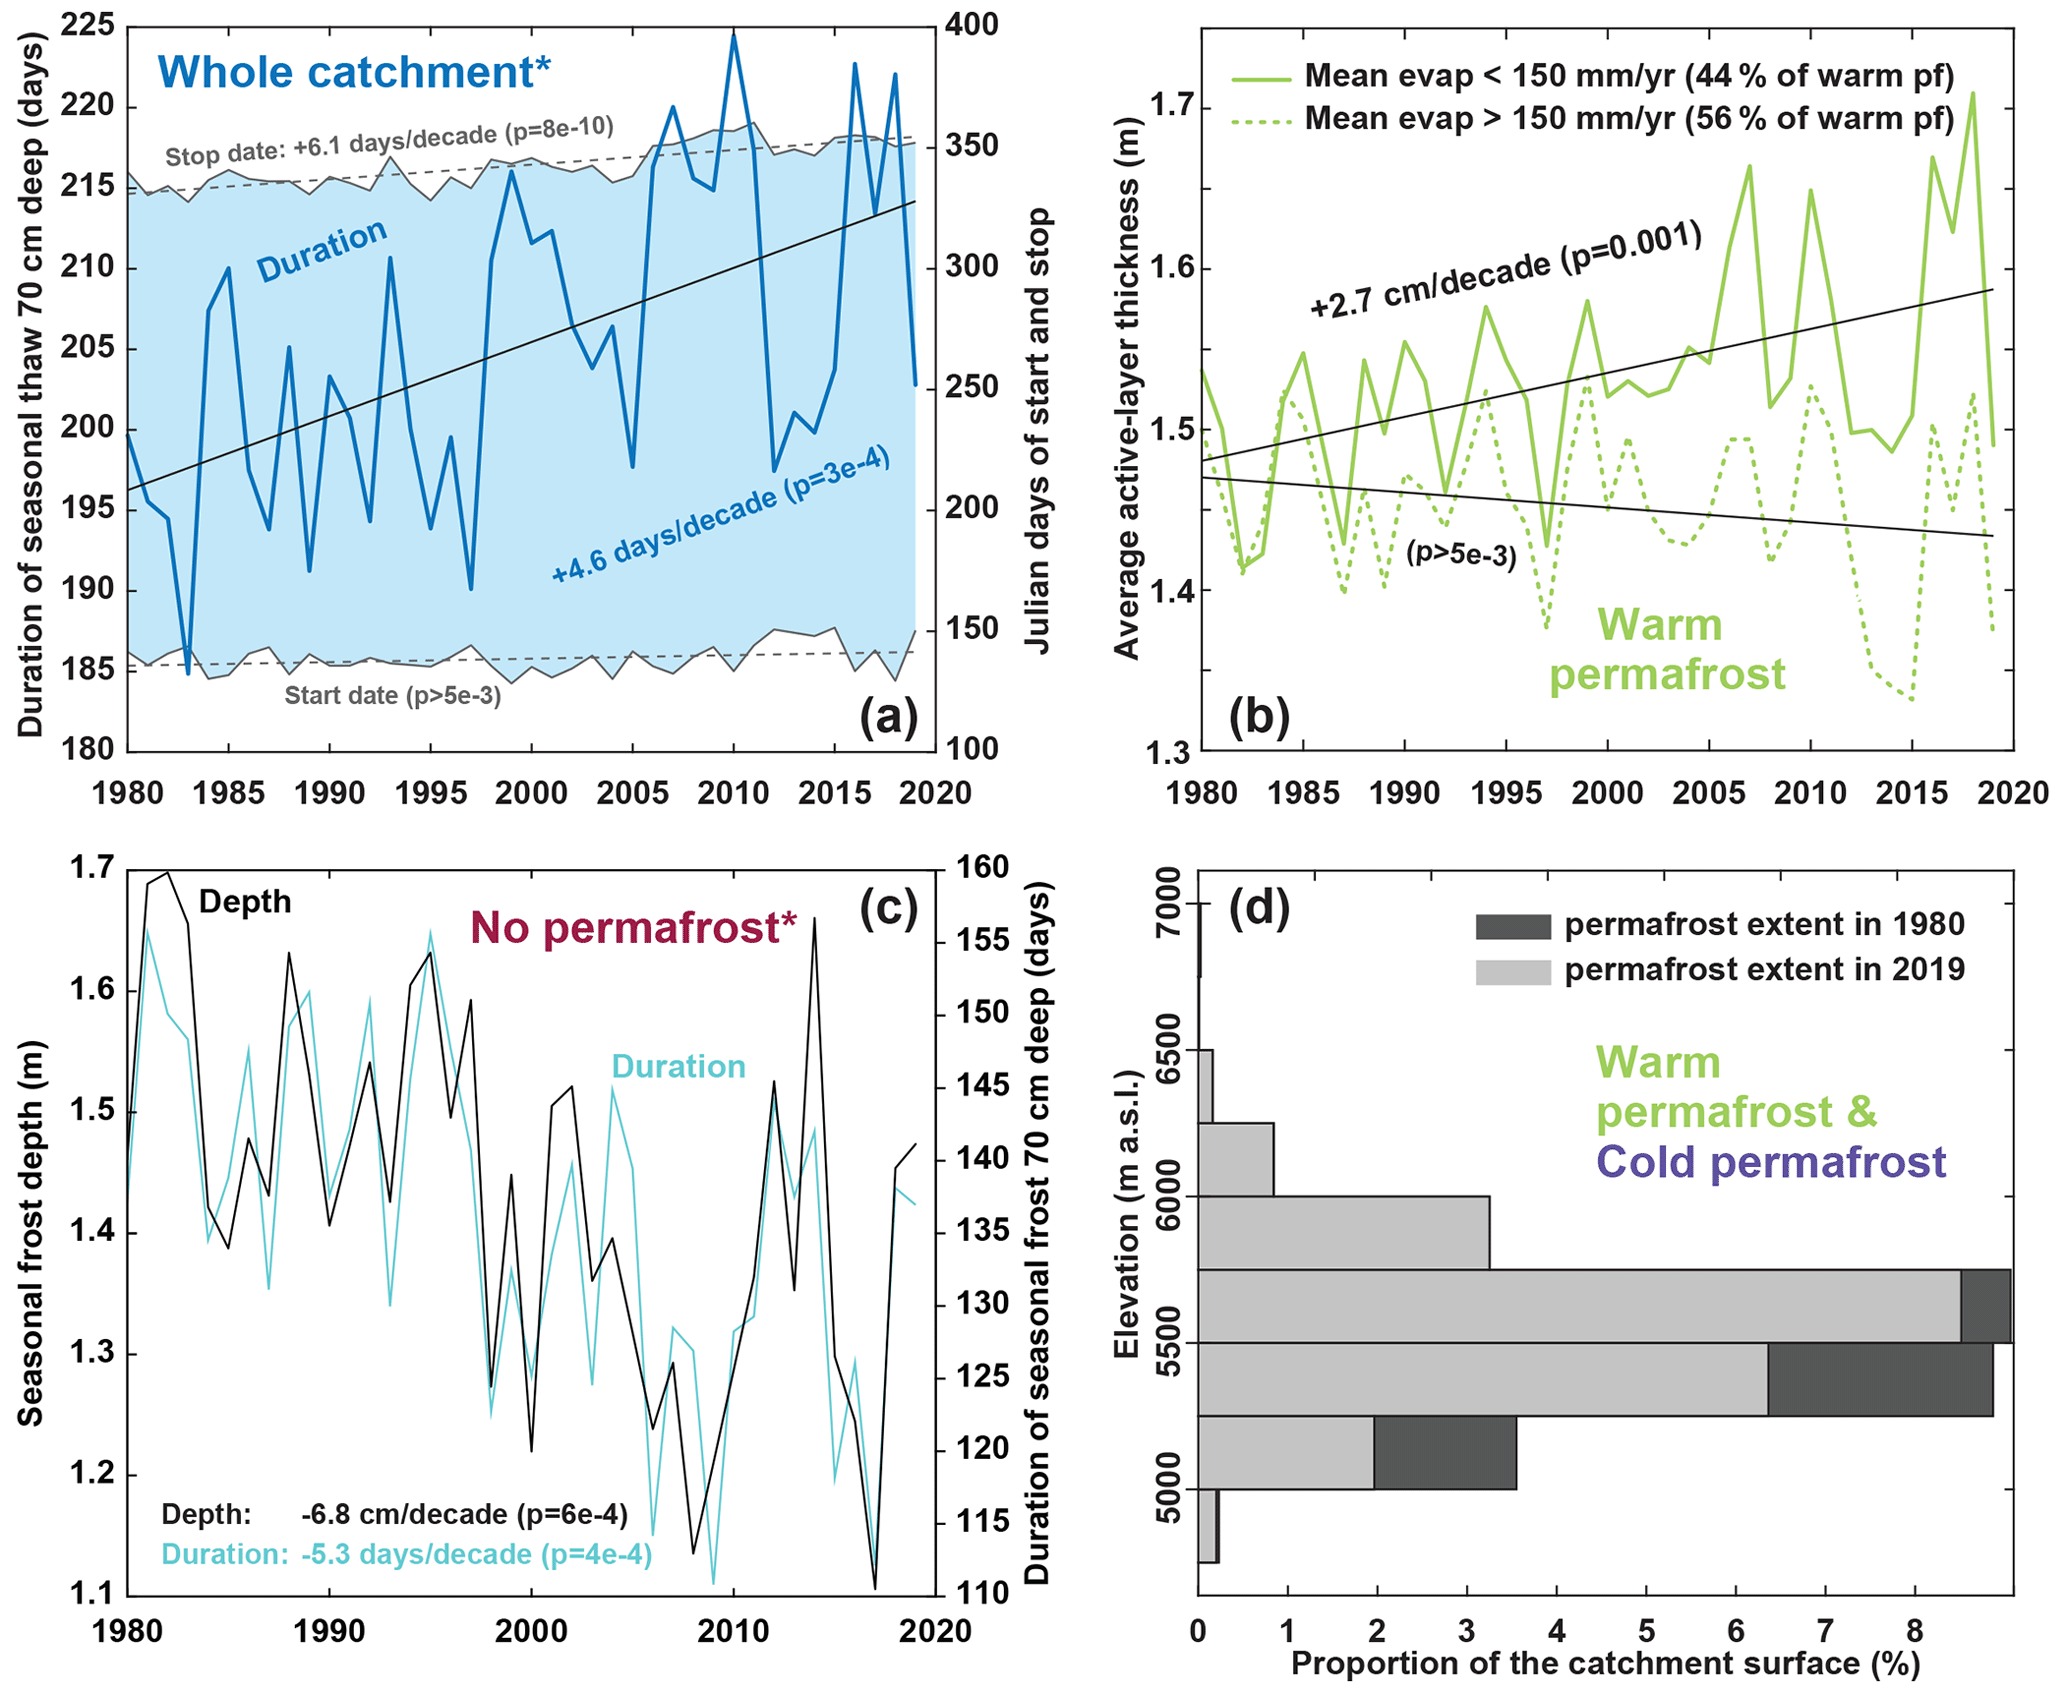
Figure 8(a) Duration of seasonal thaw 70 cm deep, averaged over the catchment. The asterisk indicates that the presented curves average 89 % of the surface of the catchment (Sect. 4.2). The gray curves and the light-blue area are associated with the right axis and indicate the average start and stop days of the seasonal thaw in the Julian calendar. Values higher than 365 indicate that freezing conditions came back after 31 December. (b) Active-layer thickness (ALT) evolution for warm permafrost. The solid line shows the ALT for simulations experiencing an annual evaporation lower than 150 mm when averaged over the 40 years. The dashed line shows the ALT for simulations with annual evaporation higher than 150 mm. (c) Temporal trends for seasonally frozen ground where there is no permafrost. The asterisk indicates that simulations were excluded if one of the simulated years did not present freezing conditions 70 cm deep (persistence of thawed conditions from one year to another). The presented curves thus average 88 % of the total permafrost-free areas of the catchment. (d) Altitudinal distribution of permafrost in 1980 and 2019. This distribution includes both cold and warm permafrost.
Within warm permafrost, we distinguished the ALT for locations experiencing an average evaporation lower or higher than 150 mm yr−1 during the simulations (Fig. 8b). Whereas locations with average evaporation below 150 mm yr−1 record an active-layer deepening trend of 2.7 cm per decade (p=0.001), this is not the case for locations with an average evaporation higher than 150 mm yr−1 (non-significative trend). This threshold value of 150 mm yr−1 is based on further investigations of the relationships between evaporation and ALT provided in Sect. 5.3.1.
In the permafrost-free areas of the catchment, seasonal frozen ground (Fig. 8c) reaches a depth of 1.43 ± 0.15 m on average and shows a decreasing trend of −6.8 cm per decade (). At 70 cm depth, the average duration of seasonally frozen ground is 136 ± 12 d, with a decreasing trend of −5.3 d per decade (). These values average 88 % of the no-permafrost areas since locations showing persistent thawed conditions at this depth from one year to another were excluded (i.e., minimal seasonal freezing depth lower than 70 cm over the 40 years).
When comparing permafrost spatial distribution between 1980 and 2019 (Fig. 8d), our results show that permafrost distribution above 5750 m a.s.l. was not modified during the simulation. Permafrost disappearance mainly occurred between 5000 and 5750 m a.s.l., with the largest loss reaching 2.5 % of the catchment area between 5250 and 5500 m a.s.l.
4.3 Hydrological results for the land
The mean annual evaporation (land area only) over the simulation time is 180 ± 19 mm (1σ; Fig. 9a). Evaporation shows an increasing trend over the 40 years of +1.01 mm per decade (). Average total runoff over the 40 years is 24 ± 8 mm yr−1 (Fig. 9b) and exhibits an increasing trend of +4.8 mm per decade (). Similarly, surface runoff (13 ± 3 mm yr−1) and subsurface runoff (11 ± 6 mm yr−1) show increasing trends of +1.3 and +3.5 mm per decade ( and ), respectively (Fig. 9b). The surface runoff presented in Fig. 9b includes the snow melt that did not infiltrate the ground. These linear trends we report are high compared to the absolute values of the variables, and their extrapolation backward in time would lead to null values in the recent past, which is unrealistic. This suggests a non-linear evolution of these variables over the 20th century.
We also present the catchment average of the runoff(runoff + evaporation) ratio (Fig. 9c), which is equivalent to runoff(rain + snow − snow sublimation) given the negligible contribution of soil storage variations. Hence, it is the proportion of the water input to the ground surface that is converted into runoff. This proportion is 11 % ± 2 % over the simulation time and shows an increasing trend of +1.23 % per decade (). Figure 9c also shows the average theoretical ratio to maintain a steady lake level (of 17.6 %). This ratio was obtained under the following hypotheses:
-
The climate forcing data are the same, and hence, the lake evaporation is the same.
-
The glacier contribution is (i) considered to be the same for the historical simulation and this scenario and (ii) is taken as the difference between the total land surface runoff and the red curve of required runoff in Fig. 5; therefore, it is independent of remotely sensed estimates.
-
Under these conditions, the runoff increase needed to maintain the lake level is only supplied by land runoff (surface and subsurface) by shifting the runoff(runoff + evaporation) ratio.
The ratio from the historical simulation starts significantly below the theoretical steady lake ratio (10.2 %<17.6 %; Fig. 9c) and increases progressively to 16.0 % in 2019.
Finally, Fig. 9d shows the annual proportion of the liquid / total water averaged for the whole catchment. The value was computed based on the daily water content (liquid and frozen) of the first 2 m of the soil column (the hydrologically active part of the column, Sect. 3.2.4) from which annual averages were derived and used to compute a catchment-scale average. The graph shows that the proportion of liquid water in the total water content increases at around +1.41 % per decade (), indicating that water spends more and more time in the ground in a liquid form, thus being increasingly available for hydrological processes such as evaporation or runoff.
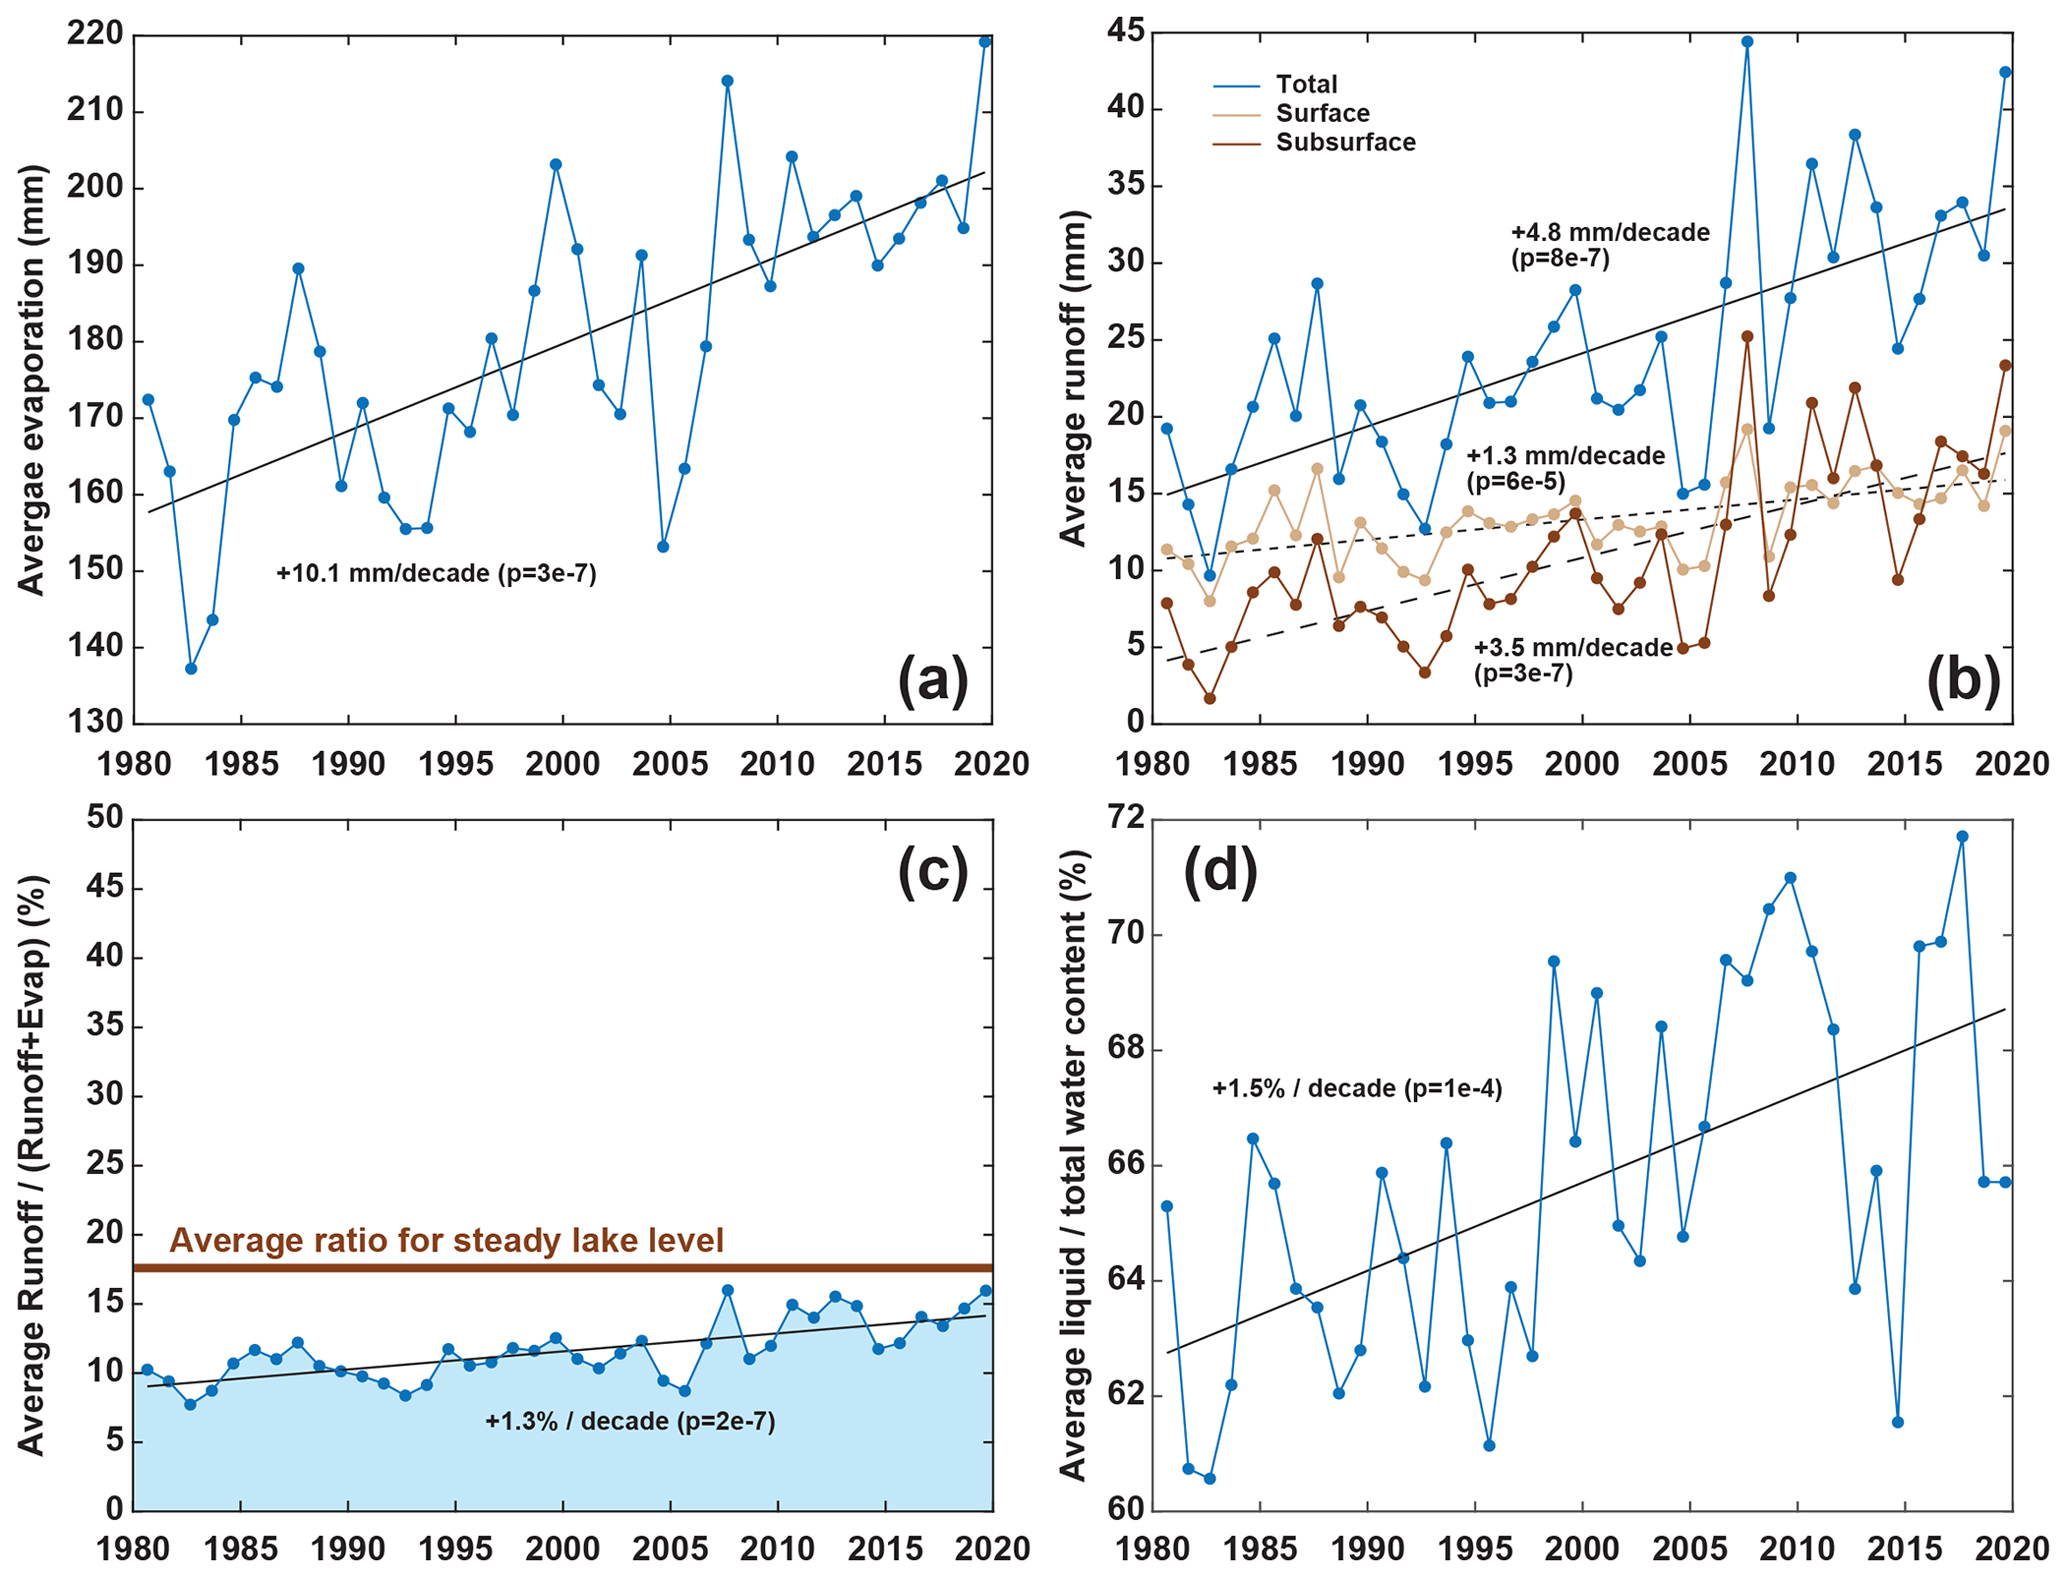
Figure 9Hydrological results. (a) Annual evaporation averaged over the whole catchment (land area only). (b) Annual runoff averaged over the whole catchment (land area only). The blue curve sums the surface and subsurface runoff. (c) Ratio between runoff and evaporation + runoff averaged over the whole catchment (land area only). The brown line indicates the theoretical average ratio needed to maintain a steady lake level when considering an identical glacier contribution to runoff (details in Sect. 4.3). (d) Annual mean of the (liquid water)(total water) ratio over the first 2 m of ground, averaged over the whole catchment (land area only).
4.4 Sensitivity of evaporation and runoff
We conducted a simple sensitivity test on the climatic conditions (i.e., not a full-scale sensitivity test). We ran the same 40 years of simulations (with thermal initialization) for a climate 1 ∘C cooler and 30 % wetter (more precipitation) than the historical scenario. We call this new scenario colder and wetter (to be compared with the historical scenario, i.e., the results of the present study presented in the rest of Sect. 4). Results of this experiment are presented in Fig. 10 and Table 2. Because of the difference in climate forcing, the colder and wetter scenario produced a greater amount of cold- and warm-permafrost areas than the historical scenario, as presented on Fig. 10a. Figure 10b shows the proportion of the precipitation reaching the surface (rain + snow − snow sublimation) that produces runoff compared to evaporation for the Paiku catchment. Figure 10c aggregates over the whole catchment the distribution of such precipitation input to the ground between runoff and evaporation for both scenarios. In between them, it also includes the distribution associated with the steady-lake-level scenario of Fig. 9c, which is based on the hypotheses listed as bullet points in Sect. 4.3 (climate forcing of the historical scenario, same glacier contribution, only land runoff increases).
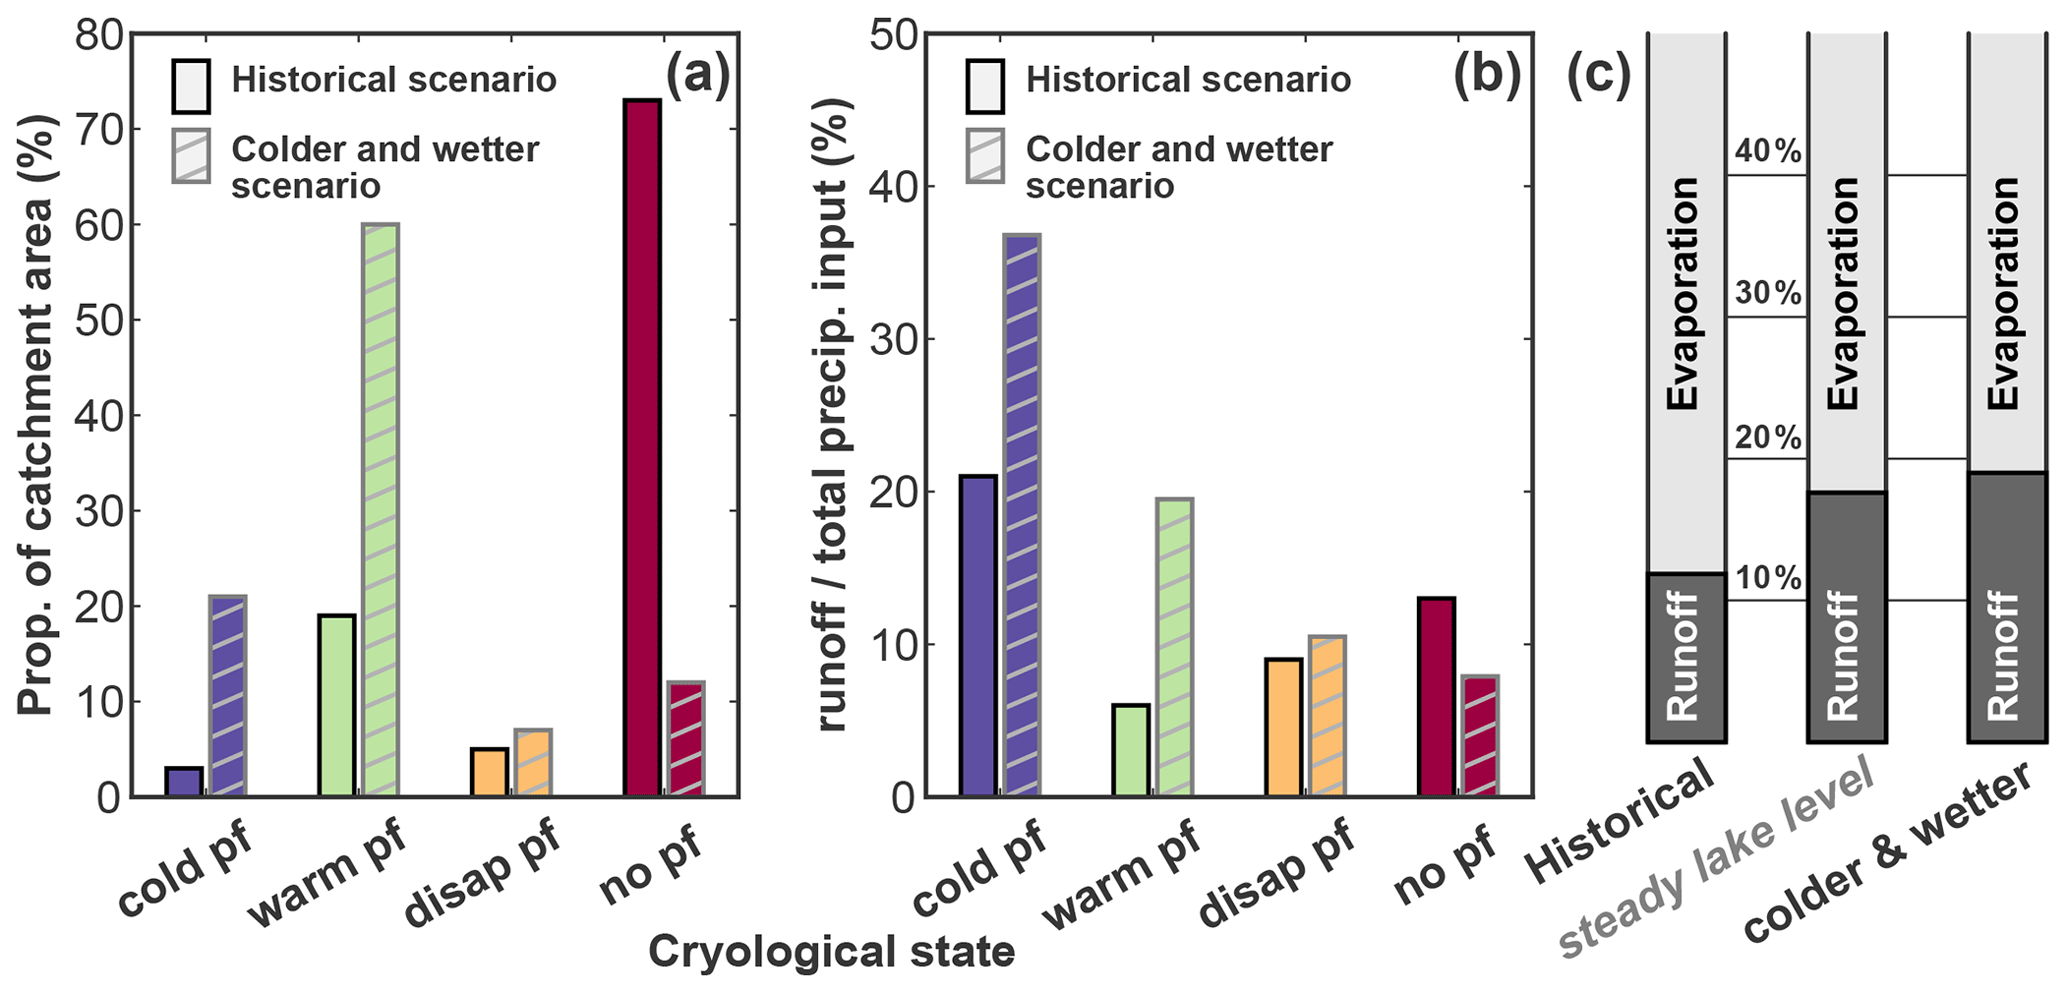
Figure 10Sensitivity of the distribution between runoff and evaporation to climate. (a) Distribution of the different cryological states of the ground for the historical scenario (presented in Sect. 4.1–4.3) and for an alternative scenario where the climate is 1 ∘C colder and brings 30 % more precipitation. (b) Runoff as a proportion of the precipitation input to the land (rainfall + snowfall − snow sublimation) for the different cryological states of the ground and for the two climatic scenarios. (c) Catchment-scale ratio between runoff and evaporation for (i) the historical scenario, (ii) for a steady lake level with the same glacier contribution (same as Fig. 9c), and (iii) for the colder and wetter scenario.
Table 2Distribution between runoff and evaporation for the two scenarios.
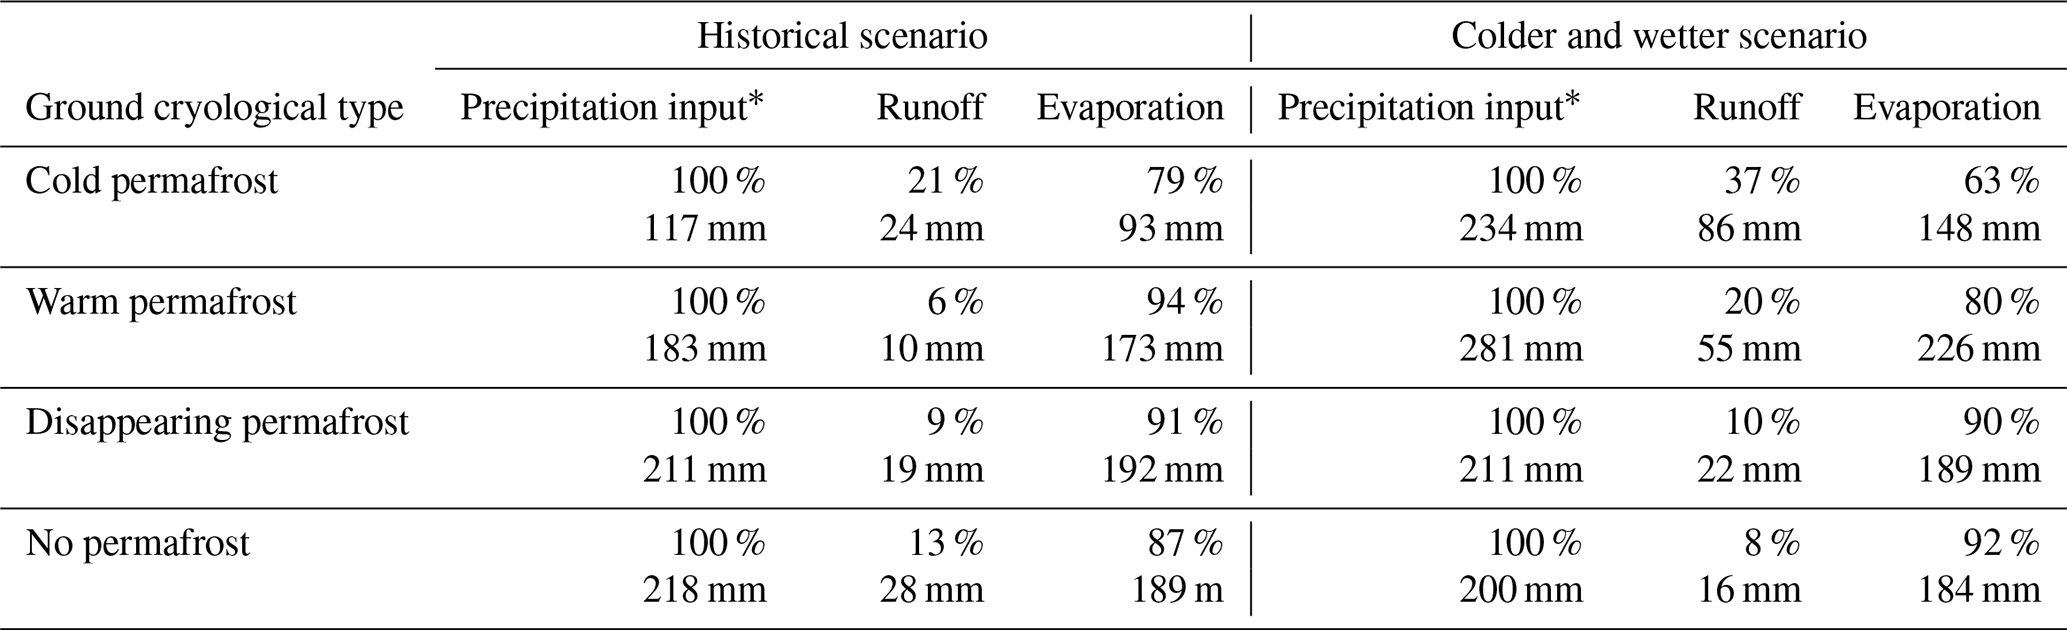
∗ Precipitation input is the input to the ground, counted as rainfall + snowfall − snow sublimation.
The historical scenario shows that cold-permafrost areas produce the highest proportion of runoff, which we attribute to the fact that the ground in these areas is, most of the time, frozen, turning a substantial part of the snow melt and rainfall into surface runoff. When considering grounds with a hydrologically active subsurface (warm permafrost, disappearing permafrost and no permafrost) in the historical scenario, the proportion of runoff increases slightly from warm permafrost to no permafrost. Such an evolution then corroborates the idea that the presence of permafrost tends to increase evaporation at the expense of runoff, as modeled by Sjöberg et al. (2021). Yet, for the colder and wetter scenario, runoff shows a regular decrease from cold to no permafrost, with a more pronounced trend than the historical scenario. Several factors can be at play in this transition and most likely involve (i) a different extent and altitudinal distribution for each cryological type of ground, (ii) an overall reduced intensity of evaporation due to cooler surface temperatures, (iii) a higher soil water content driven by higher precipitation and (iv) difference in the seasonal timings. Altogether, these processes substantially change the proportion of water that ends up as runoff water available for the lake, as highlighted by Fig. 10c.
5.1 Limitations and potential of the approach
5.1.1 Data usage within the conceptual framework and data scarcity
Our approach relies on a variety of data with regard to their scientific focus (glaciers, ground, lake, atmosphere), their type (in situ observations, remotely sensed data, reanalysis data), their characteristics (pointwise data, distributed data, constant or with various time resolutions) and the way they interact with our models (model parameters, forcing data, validation data, result data in the case of the glacier runoff). Such a diversity arises from our goal to quantify both the ground thermo-hydrological regime and the different terms of the lake budget. This variety also makes it challenging to consistently merge these data into a unique framework. For example, our quantification of the glacier mass change reconstruction is made of two constant values for the study period (1975–2000 and 2000–2020), which limits the relevance of the comparison between the observed lake level variations and the simulated ones.
Yet, the lake level variations are the only hydrological observations available to evaluate the robustness of the runoff we compute. Therefore, we had to combine lake level observations with our precipitation forcing data and lake evaporation quantifications in a simple mass conservation calculation to derive the land runoff to the lake required to reproduce the level variations (red curve in Fig. 5d). In this regard, the sum of the glacier and land runoff we derive over the 40 years corresponds to 95 % of the required runoff to the lake, indicating that the magnitude of our reconstruction is correct. Year-to-year comparison is less accurate, and we suggest that this is the consequence of the aforementioned limitations and also of our modeling strategy, as detailed below.
A main limitation regarding our usage of the data is related to the limited amount of available field observations required to provide robust model parameterizing, climate forcing and in-depth validation of the simulations, both hydrologically and thermally. Regarding climatic forcing data, our AWS measurement offers sound observations to evaluate and adjust the ERA5 data processed with TopoSUB and downscaled with TopoSCALE. Yet, a period of observations longer than 2 years would have enabled more robust corrections and could have allowed us to perform a more advanced statistical downscaling approach, e.g., quantile mapping (Themeßl et al., 2011). As such, the spatiotemporal domain of relevance of these corrections is insufficient to correct data for the whole catchment and for the 40 years of simulations. Overall, considering the strong bias we observe in the raw ERA5 data (Fig. D1), these corrections do represent an important first-order improvement.
Additionally, in the absence of borehole data that would allow us to anchor our parameters into observations, we rely on gridded values designed for hydrological and/or land surface modeling (Sect. 3.2.4 and Appendix A). Because these values might be less reliable than field observations, we chose to average them over the catchment to derive some more robust values. Altogether, this scarcity of field observations is likely to bring significant uncertainties to our analysis. Future efforts should focus on acquiring additional data or developing validation methods based on remotely sensed observations.
5.1.2 Modeling strategy
A limitation in our study is that lateral water flows between land simulation units is ignored. By giving access to the timing of water transport across the catchment, water routing would allow us to investigate temporal hydrological patterns at a monthly or seasonal scale. Because we work at annual and decadal timescales, this limitation has limited consequences for our results. The main consequence is to ignore potential storage effects on the land that would delay the arrival of runoff to the lake. We suggest that it is possible that this limitation partly explains the limited match between computed and required runoff at the annual timescale (Fig. 5). Yet, our subdivision of the catchment based on the different cryological states of the ground allows us to work with hydrological units that are smaller than the catchment and thus present shorter hydrological response times to precipitation.
Additionally, our approach regarding the modeling of runoff is relatively simple, i.e., partition between subsurface and surface runoff based on comparison between the soil water content and field capacity and porosity, respectively. More complex approaches split runoff into more sophisticated categories such as Horton overland flow, Dunne overland flow, subsurface storm flow, etc. (e.g., Savenije, 2010; Gao et al., 2014; Mirus and Loague, 2013). However, over the last decade, the relevance of this type of partitioning between different types of runoff has been questioned (McDonnell, 2013; Gao et al., 2023). In the frame of our study, we find it important to distinguish between surface and subsurface runoff because they generate flows with very contrasted speeds. From a general perspective, this significant difference in flow velocities impacts the hydrological system as a whole (e.g., river discharge, evaporation) and has various consequences throughout the catchment, such as for the water availability for vegetation, erosion and sediment transport.
In the particular case of a cryo-hydrological study, separating surface from subsurface runoff is particularly relevant because both flows do not react in the same way to ground temperature changes. As such, we see our approach as a middle way that allows us to make this distinction based on simple hydrological considerations. Yet, we acknowledge that the classification and quantification of the different types of runoff represent a valuable direction for future investigation of catchment-scale cryo-hydrology in Tibet. Another potential improvement in our modeling approach could be to unravel evaporation from transpiration. However, since vegetation is extremely scarce in the Paiku catchment, which is largely dominated by barren lands, we suggest that this would not significantly affect our results. However, this limitation should be explored in future field and modeling studies.
Conversely, our approach also conveys several important advantages regarding our goal to describe and quantify the ground thermo-hydrological regime of the catchment. The use of TopoSUB enables us to produce results at a resolution of 100 m×100 m over an area of nearly 2400 km2, with calculation costs 700 times lower than if each 100 m×100 m pixel was treated individually. Yet, thanks to the clustering method used to produce the forcing dataset (Sect. 3.2.2), the strong spatial variability of the physiography and its impact on the climate and incoming radiations are significant in the forcing data and have a major influence on the ground thermo-hydrological results, as exemplified by the strong spatial variability of ground temperatures (Fig. 7). Beyond elevation, other physiographic parameters such as aspect also influence the results. The mean values of 2 m deep temperature and evaporation over the 40 years for north-facing areas (averaged over the whole catchment and over the 40 years) are 1.3 ∘C and 163 mm, while they reach 2.9 ∘C and 197 mm for the south-facing ones. This strong dependence of modeled results on physiography highlights the necessity of taking this into account when modeling the thermo-hydrological regime of the ground in high-mountainous environments. Finally, our approach allows us to couple the physical processes governing both energy and water fluxes at the surface and subsurface and to highlight their interplay, as developed in Sect. 5.3.1.
5.2 Trends in the catchment and across the QTP
5.2.1 Lake hydrological budget and level variations
The total lake level change we simulate is a decrease of 4.11 m. This is qualitatively consistent with the overall observed trend. The mismatch with the observations is limited to a 1.04 m excess in the simulated level drop (Fig. 9a). Our reconstruction shows a decrease of 4.66 m from 1980 to 2007, which is an overestimation of the initial drop. Afterwards, while observations indicate a gradual slowdown of the lake level decrease, we simulate a stabilization followed by a slight increase (0.55 up between 2013 and 2019). The reason for the overall mismatch of 1.04 m can arise from bias (i) in the forcing data (and mainly in the precipitation) used for the land and lake simulations, (ii) in the glacier mass balance estimate, and/or (iii) in the quantification of hydrological processes for the land or for the lake (evaporation, runoff). On top of these potential biases, the difference in trends for the end of the simulation time can be influenced by (i) our estimates of glacier mass changes, which are made of two time averages (one for the 1980–2000 period and one for the 2000–2020 period) and therefore produce very smoothed glacier runoff values that cannot capture variations at the scale of a decade or less, and (ii) the absence of water routing that prevents us from accounting for delays in storage effects on the water supply from the land to the lake.
Additionally, our approach ignores potential water fluxes between the lake and a surrounding aquifer. This can be a possible reason for this mismatch. In the context of a decreasing lake level, an aquifer surrounding the lake can create an additional water inflow when the lake level passes below the piezometric level of the aquifer (Yechieli et al., 1995). We suggest that such an inflow could mitigate the lake level decrease and thus explain the missing water in our reconstruction (Fig. 6b). It could also explain the gradual stabilization of the lake level that our model does not reproduce. This flow is not part of our conceptual hydrological framework even though it likely exists in reality, especially since there is no permafrost near the lake (as we simulate it here), allowing for the existence of such an aquifer (Walvoord and Kurylyk, 2016). Groundwater has been identified as a potential contributor to lake level rise in other regions of the QTP (Lei et al., 2022). In the long run, lake–aquifer systems commonly follow oscillations of the net atmospheric flux of water (precipitation–evaporation) and of the runoff that forces its mass balance (Watras et al., 2014). During these oscillations, the lake can pump water from the aquifer or feed it, depending on the relative difference in the piezometric level between them (Almendinger, 1990; Liefert et al., 2018). Yet, this potential effect is difficult to account for, and its magnitude remains unclear. Therefore, the reasons for the mismatch between observed and simulated lake levels could also be connected to other aspects of our methodology, such as bias in the climatic forcing data and other shortcomings arising from the lack of field data, or hydrological processes, as developed in Sects. 5.1.1 and 5.1.2.
Our reconstruction of the lake budget is informative regarding the contributions of the different inputs and outputs. Regarding lake evaporation, our mean value of 870 ± 23 mm is close to the one modeled by Yang et al. (2016) with the Flake model for Lake Nam (832 ± 69 mm) for the period 1980–2014, but we do not report a significant increasing trend in our results. Yet for the same lake (Nam Co) and a similar period (1980–2016), Zhong et al. (2020) reported an average value of 1149 ± 71 mm (along with an increasing temporal trend) using the Penman formula (Penman, 1948), thus highlighting the potential dependence of the results on the methodology. In our results, direct precipitation to the lake represents 40 % of the inputs, followed by glacial runoff (35 %) and land runoff (25 %). Glaciers are therefore a particularly important contributor to the runoff towards the lake (60 % of the total runoff vs. 40 % for land runoff), which is in contrast to the results from Biskop et al. (2016), who calculated that the runoff input to Lake Paiku was dominated by land runoff (70 % vs. 30 % for the glacier contribution). Here again, these differences likely arise from important differences in input data and methodologies to quantify the different hydrological processes (evaporation, runoff, snow and glacier melt). Yao et al. (2018) reported that, at the QTP scale, the balance between precipitation and evaporation (over land and lake) was dominant over glacier melt for understanding both lake storage increases and decreases. Our reconstruction does not give us access to significant temporal variations of the glacier contribution, but the abovementioned proportions in the contributions to the lake (40 %, 35 % and 25 %) show that the glacier contribution does not dominate the input terms. At the catchment scale, these proportions can vary significantly depending on the glacier coverage. For Lake Selin, Zhou et al. (2015) reported that runoff towards the lake, evaporation from the lake and on-lake precipitation altogether explained 90 % of the lake storage variations for the 2003–2012 period. The catchment of Lake Selin has a very limited glacier coverage, corresponding to 0,63 % of its area (Lei et al., 2013), compared to the Paiku (5 %).
5.2.2 Permafrost and ground temperature trends
Our results indicate that permafrost coverage in the Paiku catchment evolved from 27 % to 22 % of the land area during the simulated period. Such a coverage corresponds to sporadic permafrost (10 %–50 % of the area) and is consistent with recent large-scale estimates of permafrost in the Northern Hemisphere (Obu et al., 2019) and across the QTP (Zou et al., 2017; Ran et al., 2018). This decrease corresponds to a 19 % shrinkage of the 1980 permafrost area, which is higher than the 9 % reported by Gao et al. (2018), a value determined by catchment-scale numerical modeling in the upper Heihe catchment (northeastern QTP) over a similar period. It is also slightly higher than the 13 % decrease modeled by Wang and Gao (2022) from 1971 to 2015 for the Qinghai Lake catchment using a similar approach. Yet, it is smaller than the 34 % loss modeled by Qin et al. (2017) from 1981 to 2015 for the Yellow River Source Region (YRSR, northeastern QTP).
Active-layer (AL) evolution is contrasting throughout the catchment, and a deepening signal is only visible for the locations with limited evaporation (<150 mm yr−1). Given the strong drive of summer climate in relation to ALT, this overall lack of a deepening trend highlights how evaporation can act as an energy intake at the surface (K. Yang et al., 2014), limiting the surface and subsurface heat fluxes and thus AL deepening. In this regard, our results fall in line with the conclusions of Fisher et al. (2016) when observing evapotranspiration and ALTs in boreal forests and also confirm the modeling experiments of Zhang et al. (2021b) on permafrost wetting in arid regions of the QTP. Besides, the lack of an overall deepening trend is consistent with observations from Luo et al. (2018) in the YRSR over the last decade and with the modeled AL from Zhang et al. (2019) at the scale of the QTP for the last 40 years. Where evaporation is limited, we report an AL-deepening trend of 2.7 cm per decade, which is smaller than the 4.8 cm per decade trend modeled by Song et al. (2020) for the YRSR for the same period and smaller than the 4.3 cm modeled by Gao et al. (2018) in the upper Heihe catchment. Yet, it is comparable to the 2 cm per decade value modeled by Wang and Gao (2022) for the Qinghai Lake catchment from 1971 to 2015. Connections between AL deepening and evaporation are discussed in Sect. 5.3.1.
In no-permafrost areas, our simulations show that the thickness of seasonally frozen ground shrinks at a rate of 6.8 cm per decade. This rate is faster than the rate of 3.1 cm per decade quantified by Qin et al. (2018) using the Stefan solution for the YRSR (1961–2016) and faster than the 3.2 cm per decade modeled by Gao et al. (2018, Heihe catchment). However, it is similar to the 6 cm per decade rate modeled by Wang and Gao (2022) in the Qinghai Lake catchment from 1971 to 2015 and smaller than the 12 cm per decade modeled by Qin et al. (2017) for the YRSR (1981–2015). All these values fall within the wide range of 3 to 29 cm per decade reported by C. Wang et al. (2020) when studying seasonally frozen ground over the whole QTP with in situ observations. Regarding timing, we report a decreasing trend of 5.3 d for frozen conditions (70 cm deep) per decade. which is consistent with the decrease of 6.7 d per decade reported by C. Wang et al. (2020) just below the surface.
Regarding the timing of seasonal ground thaw, our results highlight that the increase in the duration of the seasonal ground thaw (at 70 cm) is mostly driven by a progressive delay of the end date of the thaw period. This result contrasts with those from Song et al. (2020) for the same period in the YRSR; they also modeled an increase of the seasonal thaw (at a 2 cm depth), although this was driven by an advancing trend of the start date of the seasonal thaw.
Our warming trends at 4 m depth for permafrost areas is 0.1 ∘C per decade, which is substantially smaller than the 0.43 ∘C per decade observed at this depth between 1996 and 2006 in permafrost boreholes along the Qinghai–Tibetan Highway in the northeast of the QTP (Wu and Zhang, 2008). Zhang et al. (2019) reported a 0.13 ∘C warming per decade of the permafrost top during winter, which is consistent with the trend of 0.14 ∘C per decade we observe at 2 m depth (mean AL between 1.4 and 1.7 m in our simulations) for the months of December, January and February.
5.2.3 Evaporation and runoff trends
Our results are characterized by (i) an increase in both evaporation and runoff (Fig. 9a and b), mainly driven by an increase in precipitation (Fig. 3 bottom); (ii) a runoff(runoff + evaporation) ratio exhibiting an increasing trend as a result of ground warming and permafrost disappearance, both of which enable more subsurface runoff over time (Figs. 9c and 10d); and (iii) an increase in the proportion of liquid water in the ground compared to ice (Fig. 9d). Regarding all these points, our results show good consistency with the evolution reported by Gao et al. (2018) for the upper Heihe catchment (northeastern QTP) using a similar approach for a comparable period (1971–2013). The increasing trends in evaporation and runoff they report for the thawing season (dominant period for both processes) are comparable with the annual values we report: +10.0 mm per decade for evaporation (our study: +10.1 mm per decade) and +3.3 mm per decade for runoff (our study: +4.8 mm per decade). Similar evolutions are also reported by Wang and Gao (2022) for the Qinghai Lake catchment and by Qin et al. (2017) for the YRSR (1981–2015). These increases in runoff (especially surface runoff) are likely to have an influence on sediment transport. For instance, Li et al. (2021) showed that the current precipitation increase over High Mountain Asia is driving a runoff increase, which contributes to a significant rise in fluvial sediment fluxes. Regarding differences, Qin et al. (2017) modeled a stronger evaporation increase (14.3 mm per decade) linked to a decreasing runoff coefficient. Similarly to Li et al. (2019), we see that an important part of snow melt (49 %) infiltrates the ground and later contributes to runoff and evaporation.
5.3 Cryo-hydrological couplings at the catchment scale and implications for lake level variations
5.3.1 Interdependence of thermal and hydrological variables
Our simulation results enable us to explore the interplay between the fluxes of energy and water at the surface and subsurface. In this regard, we tested the correlation of evaporation with the proportions of liquid water and total water in the ground for cold and warm permafrost, as well as the correlation between evaporation and the duration of seasonal thaw at 70 cm depth (Fig. 11a and b). For permafrost areas (cold permafrost and warm permafrost), evaporation shows a strong correlation with the seasonal distribution between liquid and frozen water, similarly to previous modeling works for the region (Cuo et al., 2015). As such, this correlation suggests that the intensity of seasonal ground thaw plays a role in enabling higher or lower evaporative fluxes. This is likely due to cold surface temperatures strongly reducing water loss from the surface and because moisture delivery to the surface is inhibited when the ground is frozen. We suggest that this dependence is particularly important in the Paiku catchment because evaporation is strong (88 % of the precipitation input to the surface evaporates on average) and because frozen water is the dominant form of water in the ground in permafrost areas (Fig. 11a; the calculation includes the first 2 m below the surface).
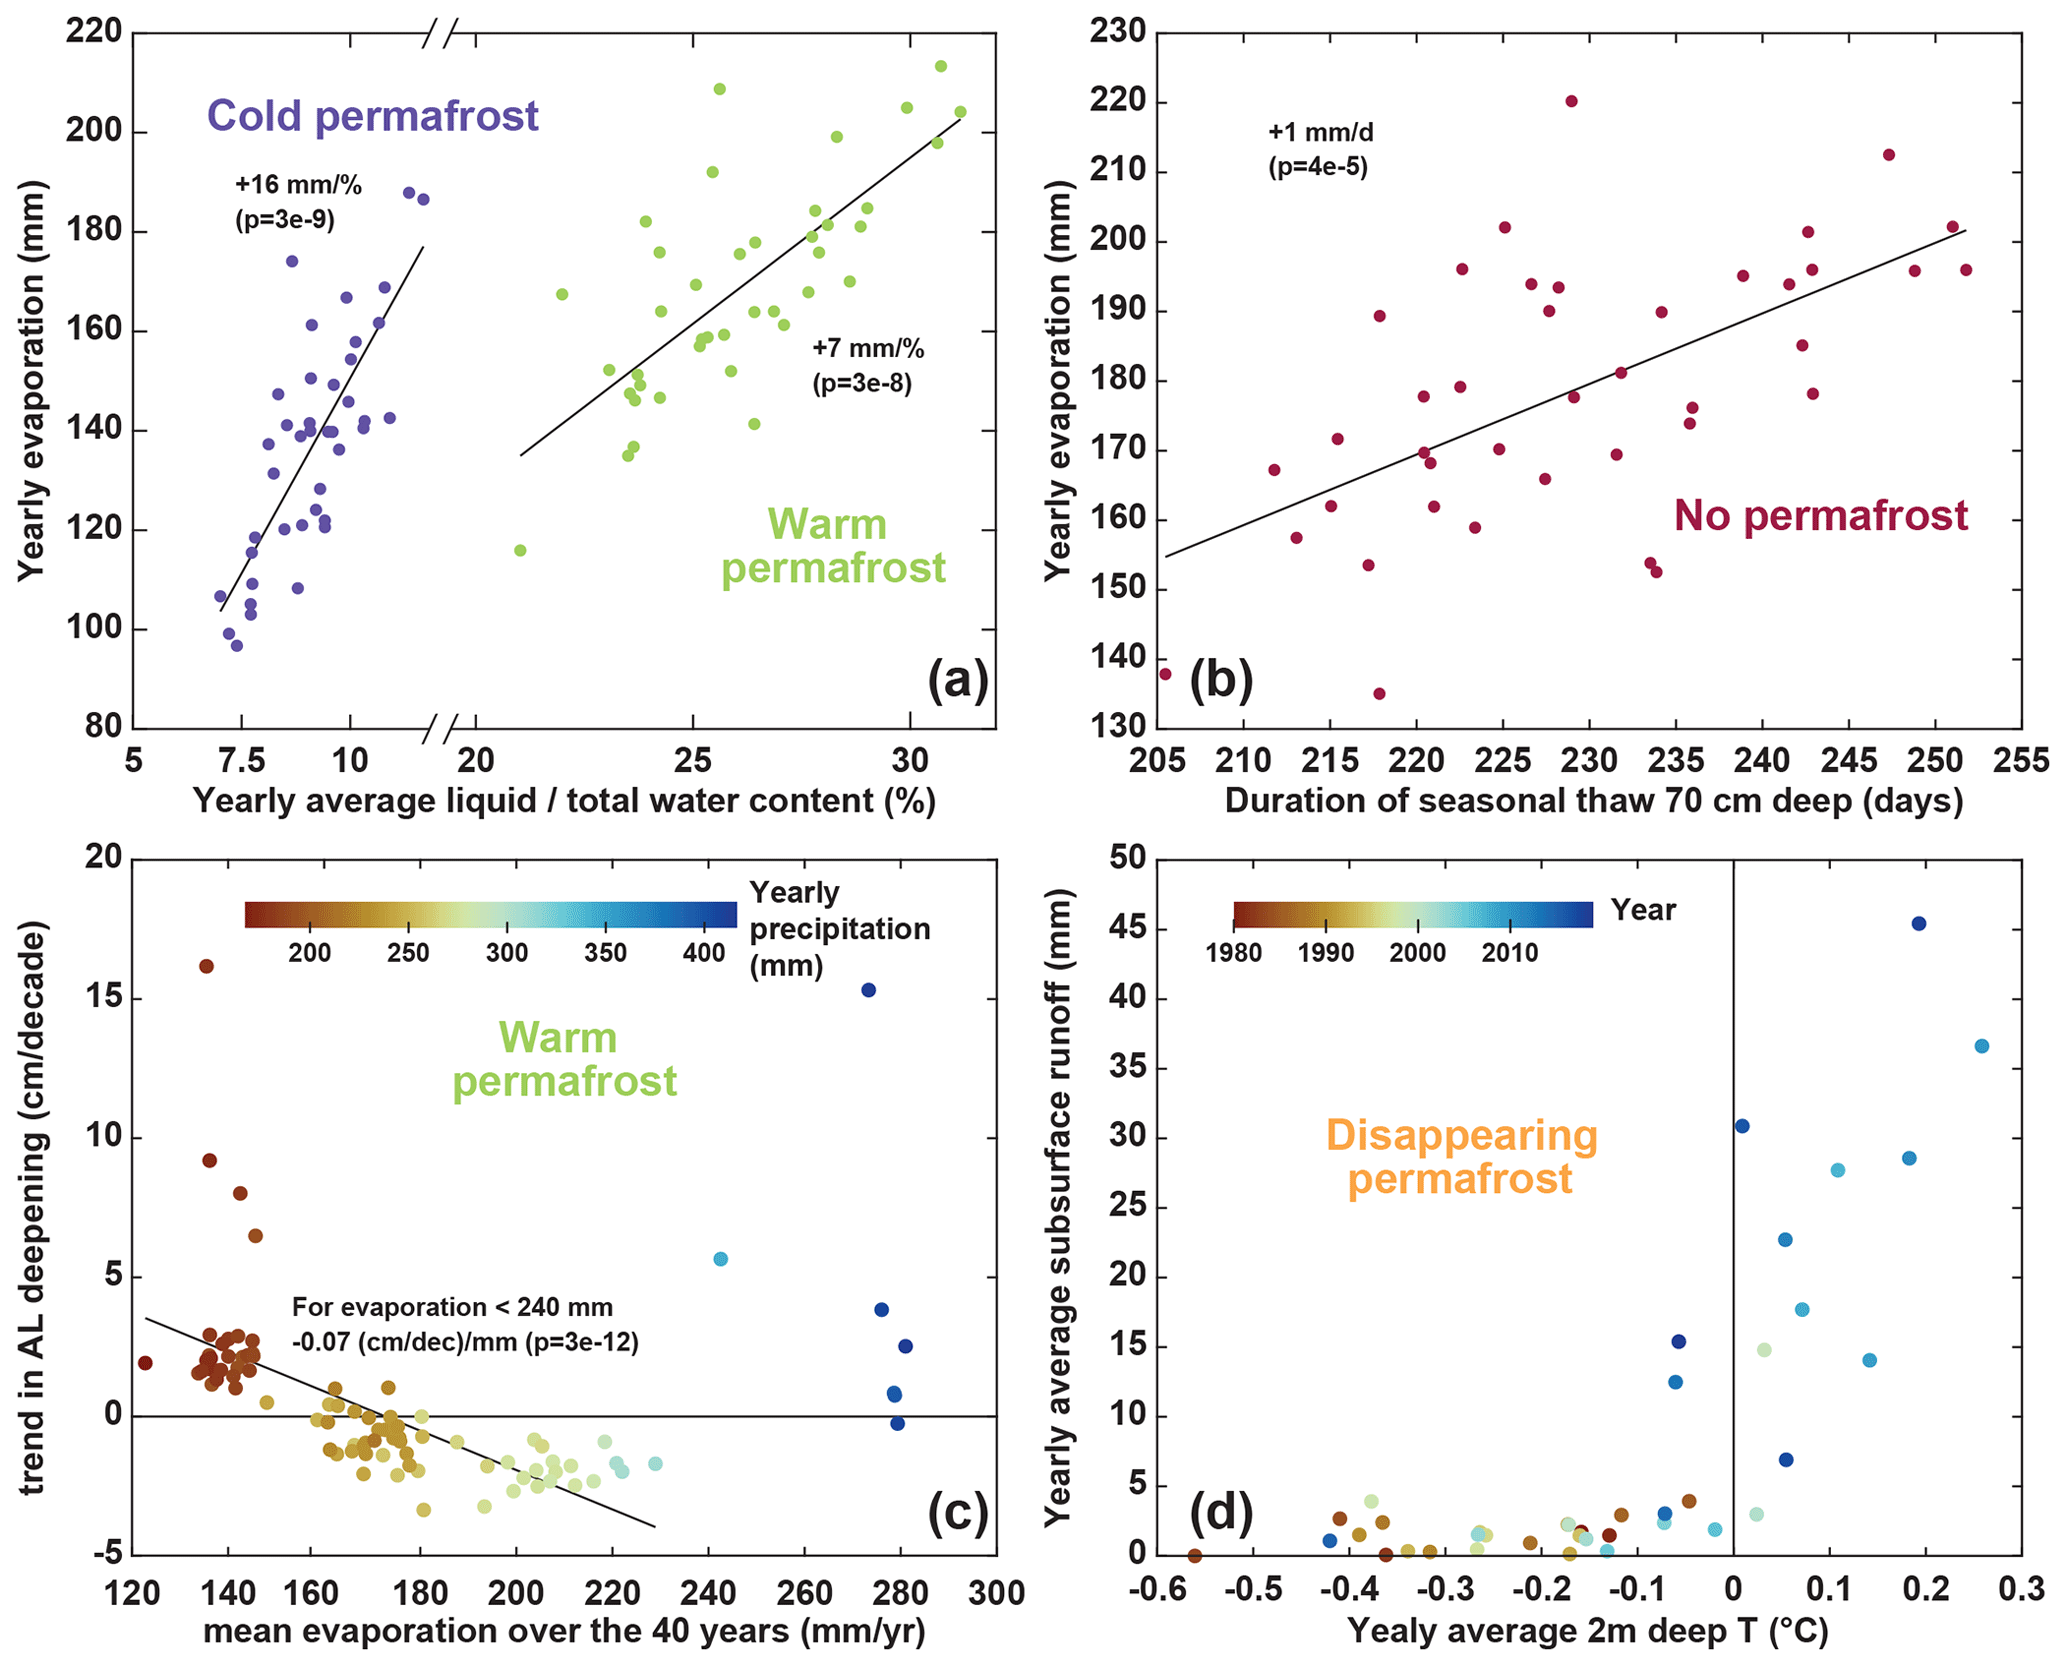
Figure 11Thermo-hydrological couplings. (a) Annual evaporation vs. annual mean of the liquidtotal water ratio over the first 2 m of ground, averaged for simulations corresponding to cold permafrost and warm permafrost (one dot per year for each permafrost category). (b) Annual evaporation vs. duration of seasonal thaw at a 70 cm depth averaged for simulations corresponding to locations without permafrost (one dot per year). (c) Active-layer deepening trend vs. mean evaporation over the 40 years for each simulation corresponding to warm permafrost (here, one dot corresponds to one TopoSUB point). The color of the dots shows the precipitations averaged over the 40 years for each simulation. The linear regression excludes simulations exhibiting annual evaporation higher than 240 mm. (d) Annual subsurface runoff vs. annual 2 m deep temperature averaged for simulations corresponding to locations with disappearing permafrost (one dot per year). The color of the dot indicates the year of the simulation.
Similarly, evaporation in no-permafrost areas shows a significant correlation with the duration of the seasonal thaw (Fig. 11b). We suggest that this result arises from the fact that frozen ground limits the evaporative fluxes, and thus, years during which the subsurface seasonal thaw is shorter are associated with reduced evaporative fluxes. We also tested the relationship between the linear trend of active-layer deepening and the mean evaporation (over the 40 years of simulation) for warm-permafrost areas (Fig. 11c). Thus, this graph does not present annual values, and one point corresponds to one of the 92 TopoSUB points classified as warm permafrost (values averaged over the 40 years). The graph highlights that TopoSUB points showing an active-layer (AL) deepening trend are associated with low evaporation and precipitation. From there, TopoSUB points with stronger evaporation show no deepening trend or even a shrinkage of the AL. This relationship is contradicted by the highest level of evaporation (>240 mm yr−1) observed for warm permafrost, for which AL deepening is observed again (dark-blue points of the graph). These TopoSUB points with the highest levels of evaporation also correspond to those receiving the largest amount of precipitation.
Runoff also shows a strong connection with the ground thermal regime (Fig. 11d). At the beginning of the simulation, years with an average 2 m deep temperature below 0 ∘C are associated with limited subsurface runoff (<5 mm yr−1). Over the years, as the ground warms up and permafrost disappears, subsurface runoff increases and can reach 20 to 45 mm yr−1. This result is consistent with the increased subsurface connectivity expected when permafrost thaws (Kurylyk et al., 2014; Gao et al., 2021), which has been both observed (Niu et al., 2016) and modeled (Lamontagne-Hallé et al., 2018; Huang et al., 2020; Gao et al., 2018). We suggest that these substantial changes in subsurface runoff, associated with changes in the ground temperature in Fig. 11d, support the hypothesis of a modification in the hydrological pathways as permafrost thaws.
Altogether, these results suggest a dependence of key variables quantifying the catchment hydrological balance (evaporation, runoff) on the seasonal characteristics and interannual trends of the ground thermal regime (temperature, liquid vs. frozen water content). Similarly to previous studies (Ding et al., 2020; Wang and Gao, 2022), we think these results advocate for the necessity of coupling thermal and hydrological modeling to improve our ability to understand and quantify changes in the hydrological balance of high-mountain catchments. To our best knowledge, along with Gao et al. (2022), our study represents to date the most complete effort to include the variety of coupled climatological, surface and subsurface processes characterizing the climate, hydrology and ground thermal regime of high-mountain catchments in Tibet at a small scale with a high spatial resolution.
5.3.2 Influence of the ground thermal regime on the distribution between runoff and evaporation
Our results indicate that evaporation is particularly strong in the Paiku catchment. Over the 40 years of simulation, 10 % of the total precipitation is converted into runoff, and the rest of the water is either directly returned to the atmosphere from the snowpack via snow sublimation or from the ground surface via evaporation. Comparatively, Gao et al. (2018) observed and modeled a ratio of around 35 % for the Heihe catchment; Qin et al. (2017) reported an average ratio of 33 % for the YRSR, and Li et al. (2014) reported a ratio of 83 % for the Qugaqie catchment (central QTP) but modeling hydrological fluxes only.
Our sensitivity test on evaporation and runoff for slightly different climates (Sect. 4.4) highlights the fact that the role of permafrost regarding the runoff–evaporation distribution is a complex question, as has already been discussed in the literature (e.g., Bring et al., 2016). Some studies have suggested that landscape-scale permafrost thaw would trigger more evaporation (Walvoord and Kurylyk, 2016). This phenomenon was modeled by Wang et al. (2018) in the upper Heihe River catchment, for which they reported that the thickening of the active layer increased the ground storage capacity and led to a decrease in runoff and an increase in evapotranspiration. G. Wang et al. (2020) also reported that permafrost thawing accelerated evapotranspiration (1961–2014).
Conversely, Zhang et al. (2003) and Carey and Woo (1999) reported that shallow frozen-ground conditions (such as a shallow active layer) maintain higher water contents close to the surface, promoting higher evaporation. Sjöberg et al. (2021) modeled this phenomenon with a fully coupled cryo-hydrological model including surface energy balance calculation. They modeled a slope with a simplified geometry in 2D for different permafrost coverages. They found that hillslopes with continuous permafrost have rates of evapotranspiration that are twice as high compared to hillslopes with no permafrost.
As such, the interplay between the runoff–evaporation distribution and the ground thermal regime in areas where permafrost coverage shows a spatiotemporal variability is difficult to apprehend (Fig. 10). This complexity is most likely to be due to a strong sensitivity to the drainage conditions (fast flows of steep mountain environments vs. slow flows of lowland catchments) and to the climate setting, both at the annual scale (arid regions vs. wet regions) and at the seasonal timescale (relative timing of temperature variations, rainfall, snowfall, snow melt and ground freeze–thaw).
Because it can both promote evaporation or runoff depending on the setting, the ground thermal regime of the catchment seems to have the possibility to create a positive feedback towards both lake level decreases or increases. Further studies should therefore focus on comparing the thermo-hydrological regime of different Tibetan catchments with contrasting lake level changes and permafrost coverage to test to which extent these differences can contribute to explaining the spatial patterns of lake level changes across the QTP.
5.4 Implications for lake level changes
At the scale of the Paiku catchment and with regard to lake level variations, the results we present highlight the following:
-
The sums of the direct precipitation in the lake, the land runoff and the glacier runoff are not enough to compensate for the lake evaporation over the study period, hence driving the observed lake level decrease.
-
Long-term hydrological trends in the catchment are led by trends in climate, and precipitation increase, jointly with glacier melt, provides enough water to drive a concomitant increase in runoff and evaporation.
-
Ground thermal changes increase the distribution of liquid vs. frozen water in the ground and the duration of seasonal thaw; correlations suggest that these modifications increase evaporation. The warming of the ground is also related to the increase in subsurface runoff towards the lake.
-
Ground warming and permafrost thawing promote subsurface runoff over time, contributing to an increase in the runoff / evaporation ratio of the catchment.
-
Over the 40 years we studied, the presence of permafrost seems to promote evaporation at the expense of runoff. Yet, this trend appears to be climate dependent, and the cryological state of the ground might shift the runoff–evaporation distribution in the other direction under colder and wetter climates.
At the scale of the QTP, these results have several implications. First, a better understanding of the recent and future lake level variations will come with better knowledge of spatial patterns and temporal trends in precipitation. Second, climate changes are modifying the ground thermal regime of Tibetan catchments. Ground warming may lead to active-layer deepening, permafrost disappearance and/or changes in the seasonal freeze–thaw cycles, affecting evaporation, runoff volumes and pathways and, overall, changing the hydrological functioning of Tibetan catchments (and the water flow provided to the lakes). Finally, the effect of permafrost on the distribution between evaporation and runoff seems to be dependent on the climate settings and the permafrost coverage of the catchment. Further studies should investigate this phenomenon and how it might contribute to explaining the contrasting lake level evolutions across the QTP.
Our study quantifies the different terms of the Lake Paiku budget over the past 40 years. Direct precipitation to the lake represents 40 % of the inputs, followed by glacial runoff (35 %) and land runoff (25 %). Glaciers are therefore a particularly important contributor to the runoff towards the lake.
We also confirm that the ground of the Paiku catchment presents different types of cryological states, from seasonally frozen ground to permafrost. Permafrost coverage shrinks from 27 % to 22 % of the land area of the catchment from the 1980s to the 2010s (19 % loss compared to the 1980 permafrost area). The whole catchment warms up at a rate of 0.17 ∘C per decade (2 m deep), with a substantial elevation-dependent variability. This warming is concomitant with an increase in the duration of the seasonal thaw, mainly supported by a progressive delay of the end date of the thaw period. Where permafrost is present, active-layer deepening is only observed where evaporation is relatively low (<150 mm yr−1).
Over the simulation period, we also report an increase in evaporation (+10.1 mm per decade) and in surface and subsurface runoff (+1.3 and +3.5 mm per decade, respectively). Together, this leads towards an increase in the runoff(runoff + evaporation) ratio of +1.2 % per decade. Our results also highlight the strong interdependence between the ground thermal and hydrological regimes and the necessity to jointly represent them to accurately quantify evaporation and runoff in this type of environment.
Over the last 40 years, the presence of permafrost seems to have promoted evaporation at the expense of runoff. Yet, this trend appears to be climate dependent, and the cryological state of the ground might shift the runoff–evaporation distribution in the other directions under colder and wetter climates. Further studies should investigate this phenomenon and how it might contribute to explaining the contrasting lake level evolutions across the QTP.
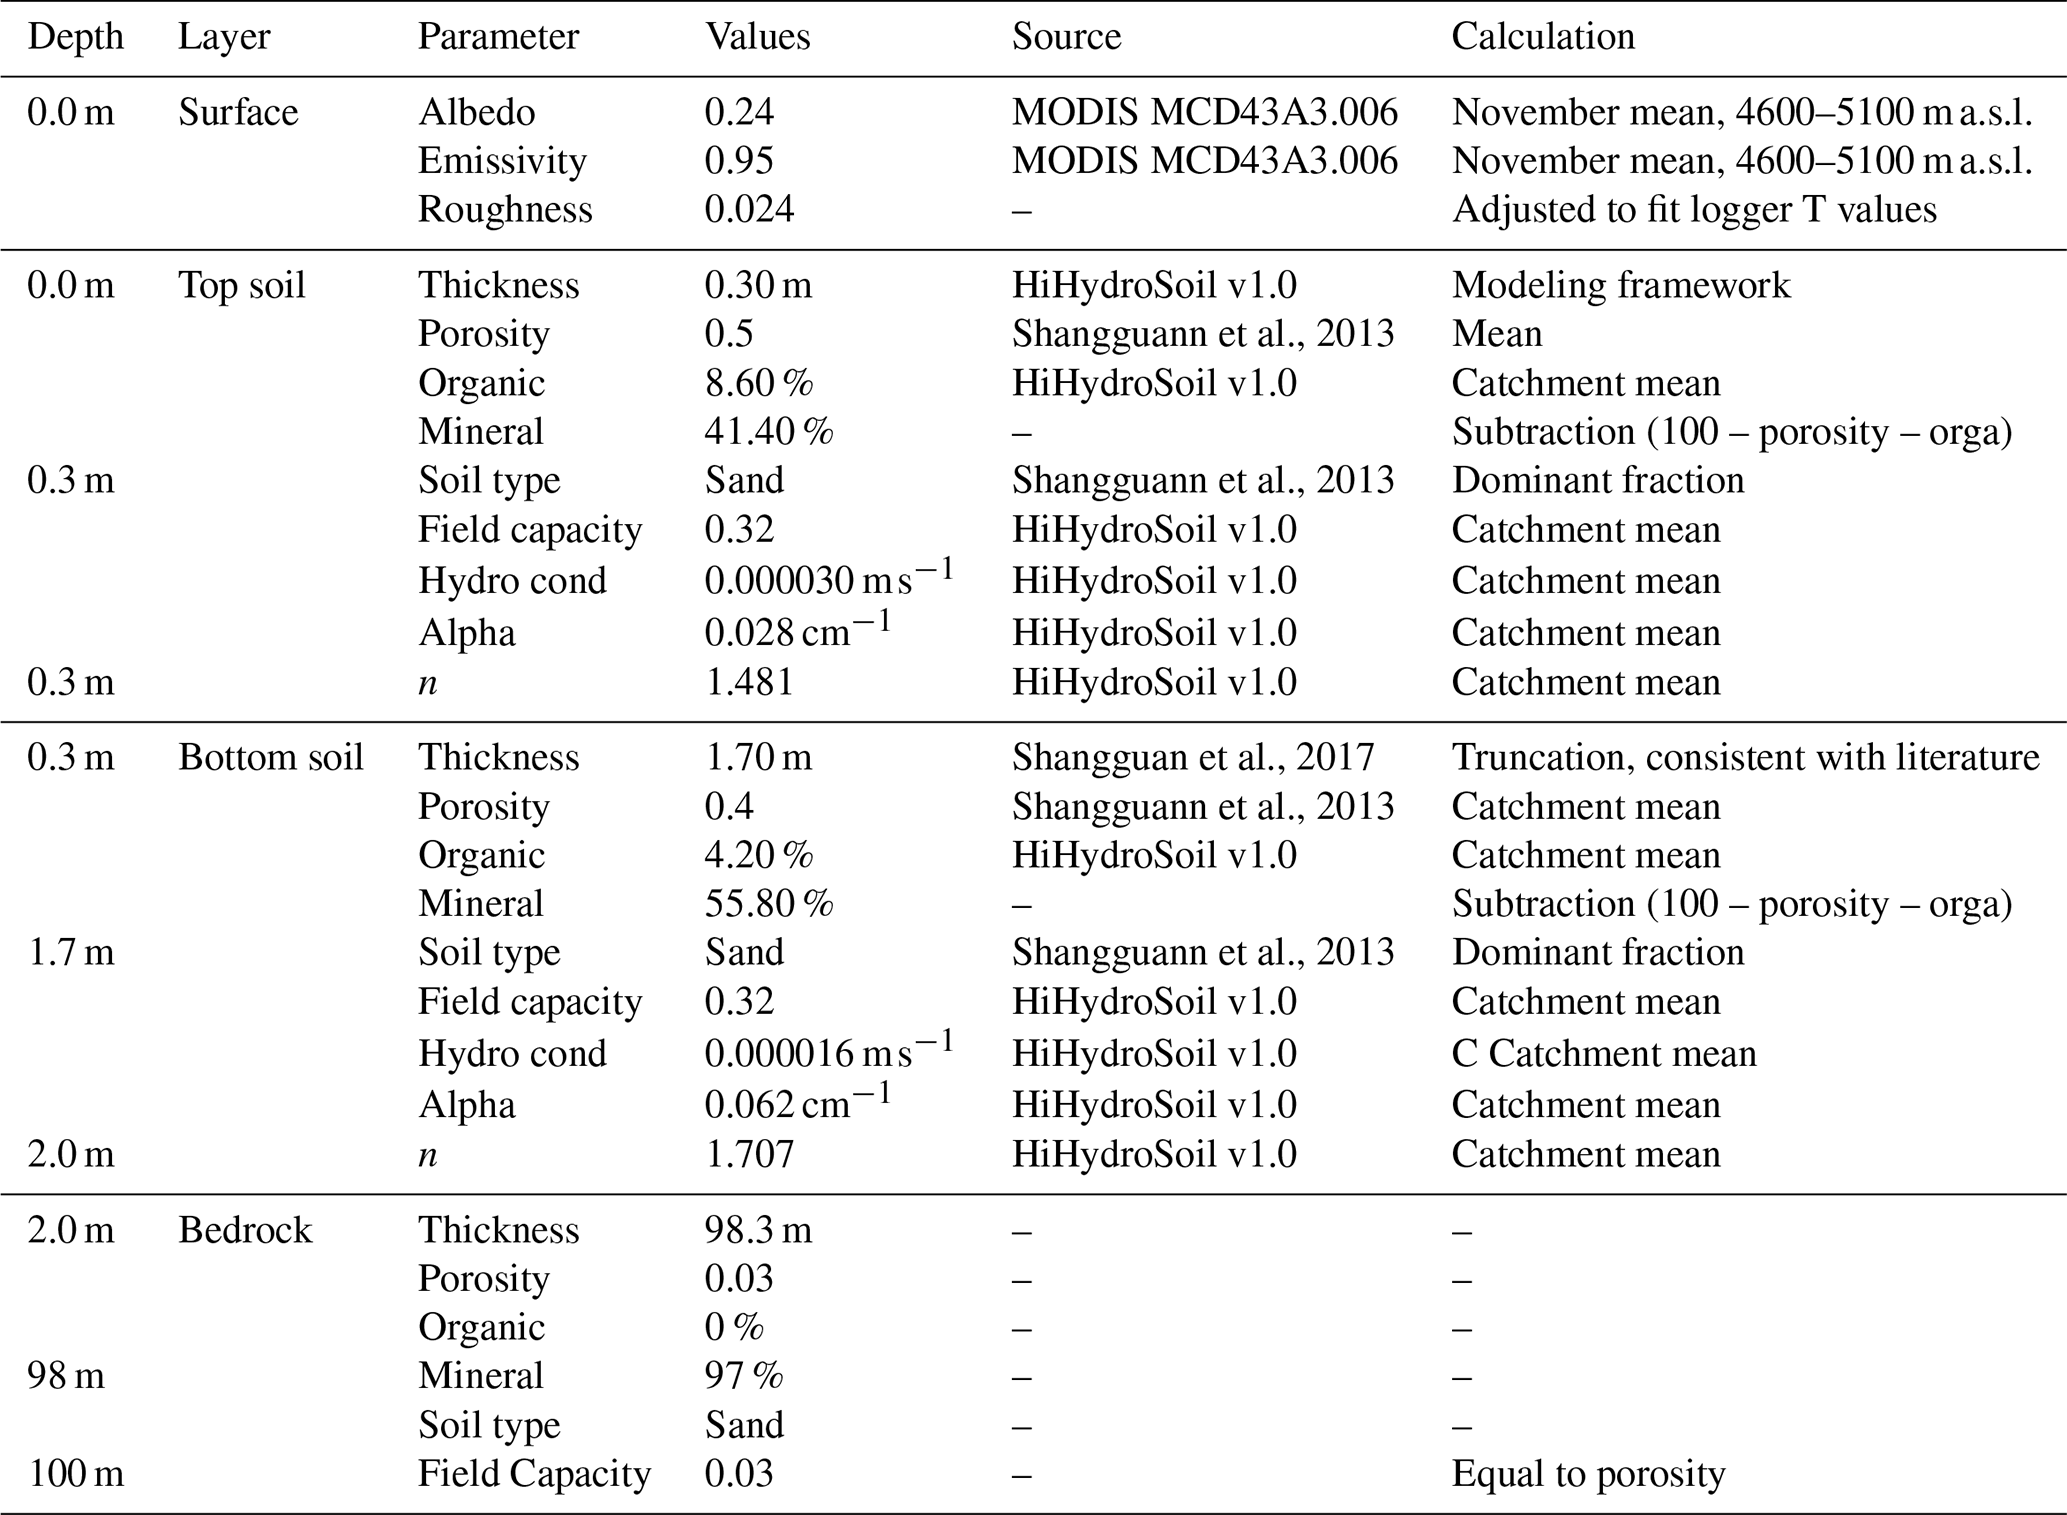
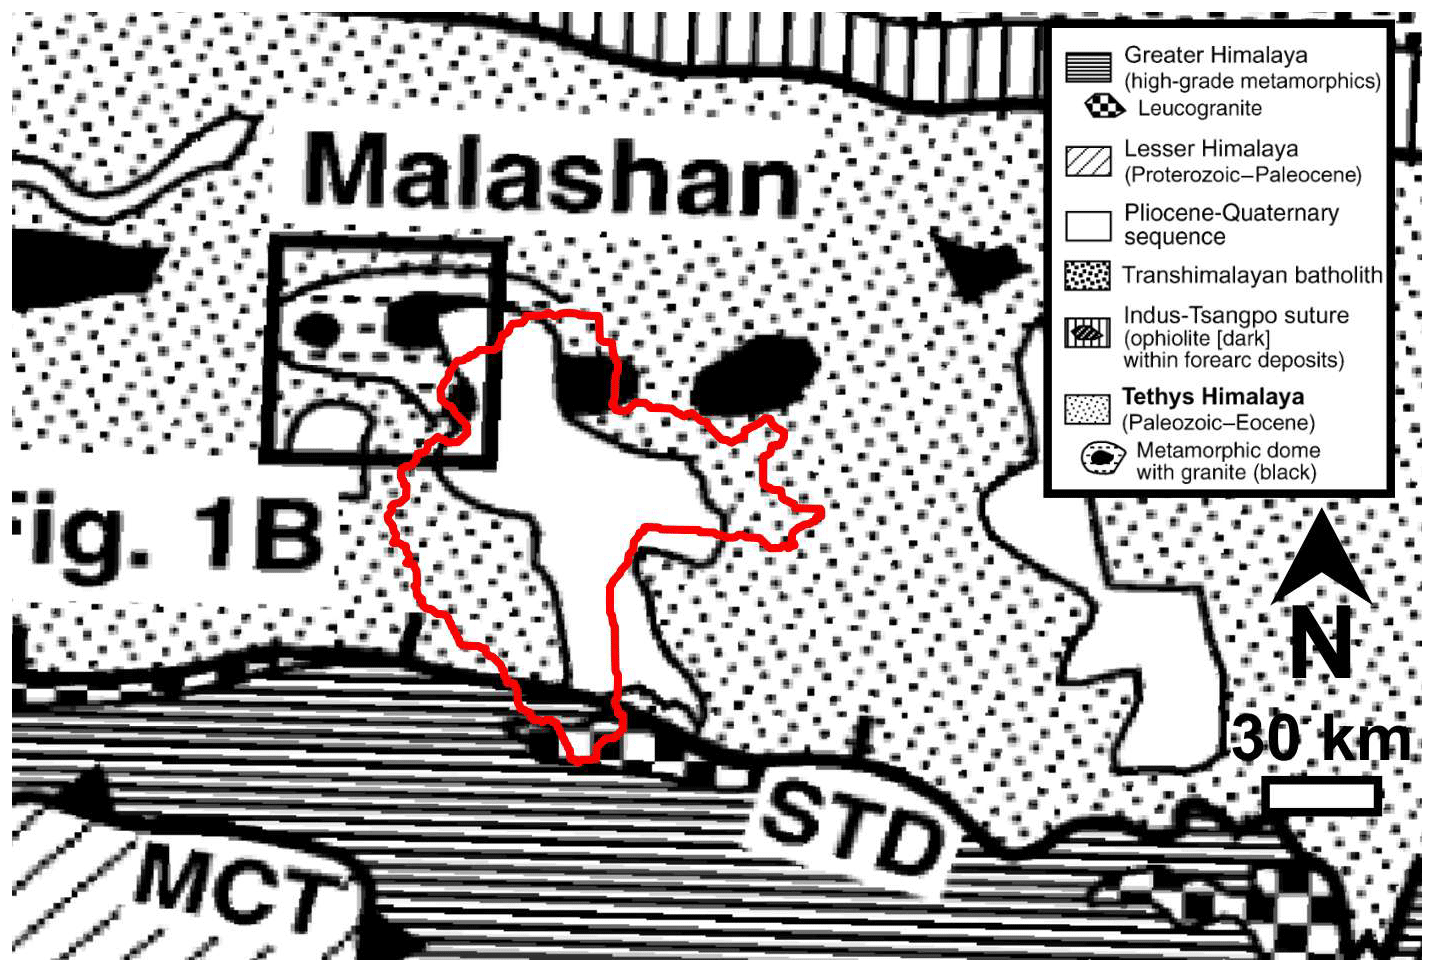
Figure B1Geology of the catchment. Modified from Aoya et al. (2005). The red contour indicates the limits of the Paiku catchment.
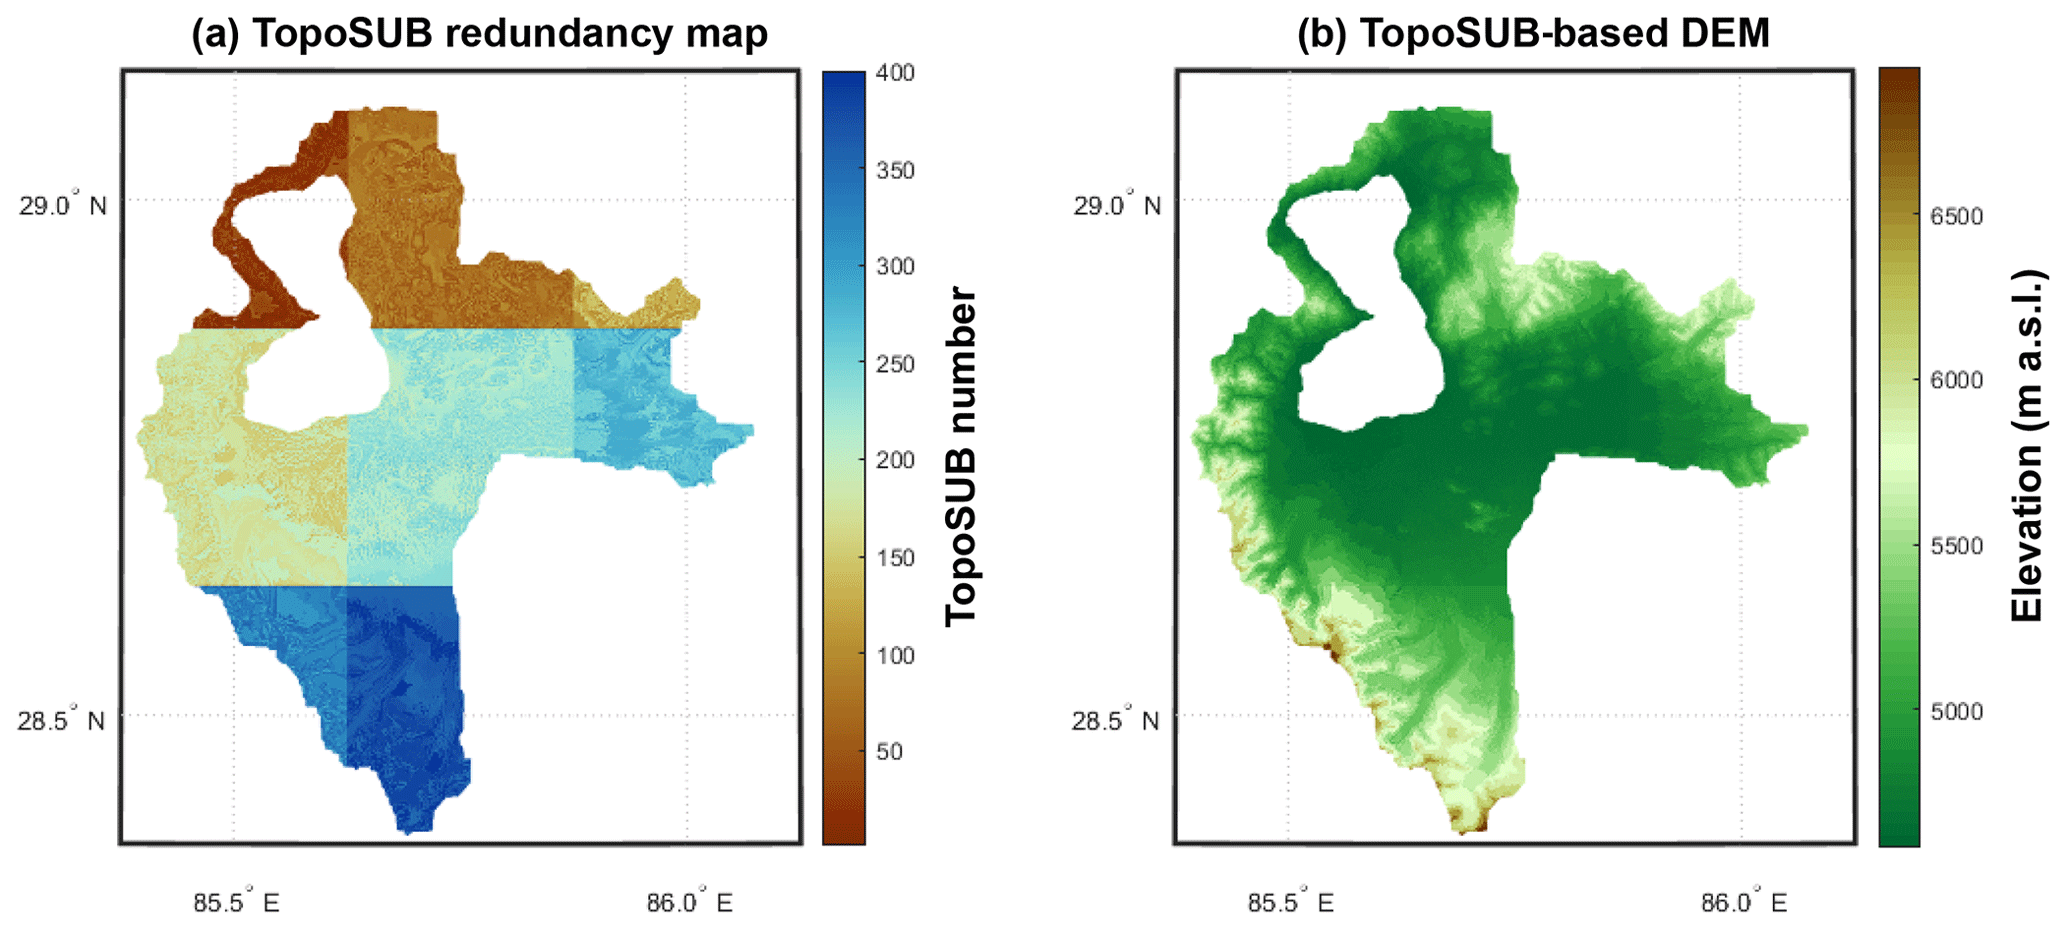
Figure C1Application of the TopoSUB clustering method (Fiddes and Gruber, 2012) in the Paiku catchment. (a) Number of the TopoSUB points. Strong color changes reflect the footprint of the eight ERA5 pixels that the catchment intersects. Small color changes within a given zone show the distribution of the 50 TopoSUB points covering each tile (Sect. 3.2.2). (b) Topographic map reconstructed using the TopoSUB approach.
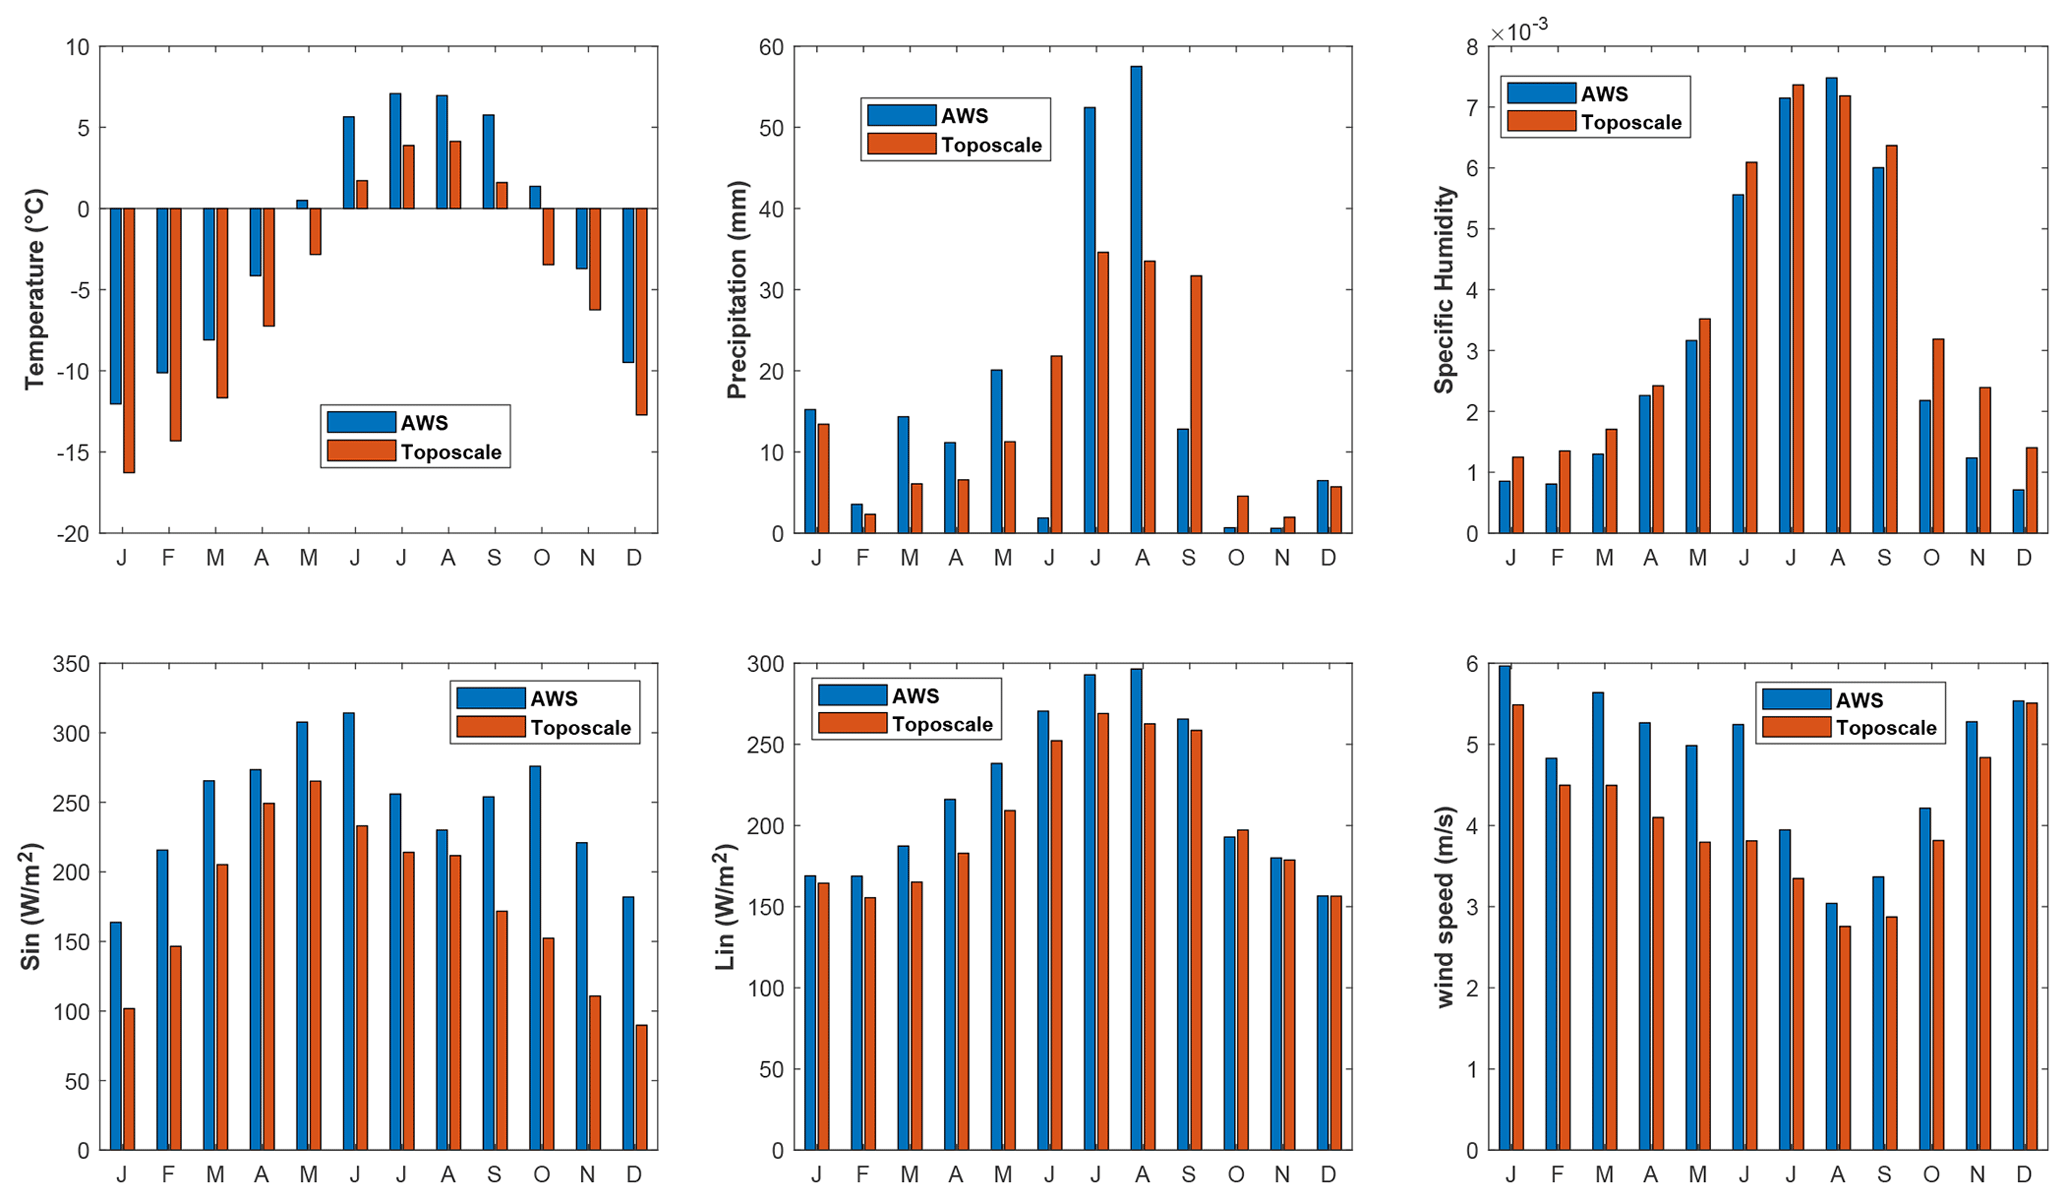
Figure D1Comparison between the AWS data and the model forcing data downscaled from ERA5 with the TopoSCALE and TopoSUB approaches. Based on the AWS data, a monthly correction factor is applied to the downscaled data so that monthly data match the observed period for each variable (methodological details in Sect. 3.2.2).
The CryoGrid community model (version 1.0) and related documentation are available at https://github.com/CryoGrid/CryoGridCommunity_source (CryoGrid, 2023).
Field data are available at Zenodo at https://doi.org/10.5281/zenodo.7484274 (Martin, 2022).
LCPM, WWI and SW designed the study. LCPM and MM conducted the numerical simulations. SW, ML and LCPM contributed to the model development. FB, WWI, YL and SA acquired field data. LCPM, FB, MM, PK, YL and TM analyzed and processed the data. JF provided downscaled forcing data for the model. All the authors contributed to the result interpretation and to paper preparation.
The contact author has declared that none of the authors has any competing interests.
Publisher's note: Copernicus Publications remains neutral with regard to jurisdictional claims made in the text, published maps, institutional affiliations, or any other geographical representation in this paper. While Copernicus Publications makes every effort to include appropriate place names, the final responsibility lies with the authors.
We are very grateful to the reviewers for their input, which significantly improved this paper.
This study was funded by the open program of the Dutch Research Council (NWO) (grant no. ALWOP.467) and by the Strategic Priority Research Program of the Chinese Academy of Sciences within the Pan-Third Pole Environment framework (grant agreement no. XDA20100300). The land surface and lake simulations were performed on the Utrecht Geosciences computer cluster. Sebastian Westermann acknowledges funding from the European Space Agency Permafrost_CCI (https://climate.esa.int/en/projects/permafrost/, last access: 6 December 2023). Leo Martin is funded by “Chaire de professeur junior” ENVDYN from the French Ministry of Research.
This paper was edited by Zhongbo Yu and reviewed by Hongkai Gao, Genxu Wang, Xuegao Chen, and two anonymous referees.
Almendinger, J. E.: Groundwater control of closed-basin lake levels under steady-state conditions, J. Hydrol., 112, 293–318, https://doi.org/10.1016/0022-1694(90)90020-X, 1990.
Aoya, M., Wallis, S. R., Terada, K., Lee, J., Kawakami, T., Wang, Y., and Heizler, M.: North-south extension in the Tibetan crust triggered by granite emplacement, Geology, 33, 853, https://doi.org/10.1130/G21806.1, 2005.
Bhattacharya, A., Bolch, T., Mukherjee, K., King, O., Menounos, B., Kapitsa, V., Neckel, N., Yang, W., and Yao, T.: High Mountain Asian glacier response to climate revealed by multi-temporal satellite observations since the 1960s, Nat. Commun., 12, 4133, https://doi.org/10.1038/s41467-021-24180-y, 2021.
Bibi, S., Wang, L., Li, X., Zhou, J., Chen, D., and Yao, T.: Climatic and associated cryospheric, biospheric, and hydrological changes on the Tibetan Plateau: a review, Int. J. Climatol., 38, e1–e17, https://doi.org/10.1002/joc.5411, 2018.
Biskaborn, B. K., Smith, S. L., Noetzli, J., Matthes, H., Vieira, G., Streletskiy, D. A., Schoeneich, P., Romanovsky, V. E., Lewkowicz, A. G., Abramov, A., Allard, M., Boike, J., Cable, W. L., Christiansen, H. H., Delaloye, R., Diekmann, B., Drozdov, D., Etzelmüller, B., Grosse, G., Guglielmin, M., Ingeman-Nielsen, T., Isaksen, K., Ishikawa, M., Johansson, M., Johannsson, H., Joo, A., Kaverin, D., Kholodov, A., Konstantinov, P., Kröger, T., Lambiel, C., Lanckman, J.-P., Luo, D., Malkova, G., Meiklejohn, I., Moskalenko, N., Oliva, M., Phillips, M., Ramos, M., Sannel, A. B. K., Sergeev, D., Seybold, C., Skryabin, P., Vasiliev, A., Wu, Q., Yoshikawa, K., Zheleznyak, M., and Lantuit, H.: Permafrost is warming at a global scale, Nat. Commun., 10, 264, https://doi.org/10.1038/s41467-018-08240-4, 2019.
Biskop, S., Maussion, F., Krause, P., and Fink, M.: Differences in the water-balance components of four lakes in the southern-central Tibetan Plateau, Hydrol. Earth Syst. Sci., 20, 209–225, https://doi.org/10.5194/hess-20-209-2016, 2016.
Bolch, T., Shea, J. M., Liu, S., Azam, F. M., Gao, Y., Gruber, S., Immerzeel, W. W., Kulkarni, A., Li, H., Tahir, A. A., Zhang, G., and Zhang, Y.: Status and Change of the Cryosphere in the Extended Hindu Kush Himalaya Region, in: The Hindu Kush Himalaya Assessment: Mountains, Climate Change, Sustainability and People, edited by: Wester, P., Mishra, A., Mukherji, A., and Shrestha, A. B., Springer International Publishing, Cham, 209–255, https://doi.org/10.1007/978-3-319-92288-1_7, 2019.
Bring, A., Fedorova, I., Dibike, Y., Hinzman, L., Mård, J., Mernild, S. H., Prowse, T., Semenova, O., Stuefer, S. L., and Woo, M. -K.: Arctic terrestrial hydrology: A synthesis of processes, regional effects, and research challenges, J. Geophys. Res.-Biogeo., 121, 621–649, https://doi.org/10.1002/2015JG003131, 2016.
Brun, F., Berthier, E., Wagnon, P., Kääb, A., and Treichler, D.: A spatially resolved estimate of High Mountain Asia glacier mass balances from 2000 to 2016, Nat. Geosci., 10, 668–673, https://doi.org/10.1038/ngeo2999, 2017.
Brun, F., Treichler, D., Shean, D., and Immerzeel, W. W.: Limited Contribution of Glacier Mass Loss to the Recent Increase in Tibetan Plateau Lake Volume, Front. Earth Sci., 8, 1–14, https://doi.org/10.3389/feart.2020.582060, 2020.
Cao, J., Qin, D., Kang, E., and Li, Y.: River discharge changes in the Qinghai-Tibet Plateau, Chinese Sci. Bull., 51, 594–600, https://doi.org/10.1007/s11434-006-0594-6, 2006.
Carey, S. K. and Woo, M.-K.: Hydrology of two slopes in subarctic Yukon, Canada, Hydrol. Process., 13, 2549–2562, https://doi.org/10.1002/(SICI)1099-1085(199911)13:16<2549::AID-HYP938>3.0.CO;2-H, 1999.
Carey, S. K. and Woo, M.: Spatial variability of hillslope water balance, wolf creek basin, subarctic yukon, Hydrol. Process., 15, 3113–3132, https://doi.org/10.1002/hyp.319, 2001.
Chen, R., Wang, G., Yang, Y., Liu, J., Han, C., Song, Y., Liu, Z., and Kang, E.: Effects of Cryospheric Change on Alpine Hydrology: Combining a Model With Observations in the Upper Reaches of the Hei River, China, J. Geophys. Res.-Atmos., 123, 3414–3442, https://doi.org/10.1002/2017JD027876, 2018.
Chen, Y., Zong, Y., Li, B., Li, S., and Aitchison, J. C.: Shrinking lakes in Tibet linked to the weakening Asian monsoon in the past 8.2 ka, Quaternary Res., 80, 189–198, https://doi.org/10.1016/j.yqres.2013.06.008, 2013.
Cheng, G. and Jin, H.: Permafrost and groundwater on the Qinghai-Tibet Plateau and in northeast China, Hydrogeol. J., 21, 5–23, https://doi.org/10.1007/s10040-012-0927-2, 2013.
CryoGrid: CryoGridCommunity_source, GitHub [code], https://github.com/CryoGrid/CryoGridCommunity_source (last access: 10 December 2023), 2023.
Cuo, L., Zhang, Y., Bohn, T. J., Zhao, L., Li, J., Liu, Q., and Zhou, B.: Frozen soil degradation and its effects on surface hydrology in the northern Tibetan Plateau, J. Geophys. Res.-Atmos., 120, 8276–8298, https://doi.org/10.1002/2015JD023193, 2015.
Dall'Amico, M., Endrizzi, S., Gruber, S., and Rigon, R.: A robust and energy-conserving model of freezing variably-saturated soil, The Cryosphere, 5, 469–484, https://doi.org/10.5194/tc-5-469-2011, 2011.
Ding, Y., Zhang, S., Chen, R., Han, T., Han, H., Wu, J., Li, X., Zhao, Q., Shangguan, D., Yang, Y., Liu, J., Wang, S., Qin, J., and Chang, Y.: Hydrological Basis and Discipline System of Cryohydrology: From a Perspective of Cryospheric Science, Front. Earth Sci., 8, 1–12, https://doi.org/10.3389/feart.2020.574707, 2020.
Fiddes, J. and Gruber, S.: TopoSUB: a tool for efficient large area numerical modelling in complex topography at sub-grid scales, Geosci. Model Dev., 5, 1245–1257, https://doi.org/10.5194/gmd-5-1245-2012, 2012.
Fiddes, J. and Gruber, S.: TopoSCALE v.1.0: downscaling gridded climate data in complex terrain, Geosci. Model Dev., 7, 387–405, https://doi.org/10.5194/gmd-7-387-2014, 2014.
Fisher, J. P., Estop-Aragonés, C., Thierry, A., Charman, D. J., Wolfe, S. A., Hartley, I. P., Murton, J. B., Williams, M., and Phoenix, G. K.: The influence of vegetation and soil characteristics on active-layer thickness of permafrost soils in boreal forest, Glob. Change Biol., 22, 3127–3140, https://doi.org/10.1111/gcb.13248, 2016.
Gao, B., Yang, D., Qin, Y., Wang, Y., Li, H., Zhang, Y., and Zhang, T.: Change in frozen soils and its effect on regional hydrology, upper Heihe basin, northeastern Qinghai–Tibetan Plateau, The Cryosphere, 12, 657–673, https://doi.org/10.5194/tc-12-657-2018, 2018.
Gao, H., Hrachowitz, M., Fenicia, F., Gharari, S., and Savenije, H. H. G.: Testing the realism of a topography-driven model (FLEX-Topo) in the nested catchments of the Upper Heihe, China, Hydrol. Earth Syst. Sci., 18, 1895–1915, https://doi.org/10.5194/hess-18-1895-2014, 2014.
Gao, H., Wang, J., Yang, Y., Pan, X., Ding, Y., and Duan, Z.: Permafrost Hydrology of the Qinghai-Tibet Plateau: A Review of Processes and Modeling, Front. Earth Sci., 8, 1–13, https://doi.org/10.3389/feart.2020.576838, 2021.
Gao, H., Han, C., Chen, R., Feng, Z., Wang, K., Fenicia, F., and Savenije, H.: Frozen soil hydrological modeling for a mountainous catchment northeast of the Qinghai–Tibet Plateau, Hydrol. Earth Syst. Sci., 26, 4187–4208, https://doi.org/10.5194/hess-26-4187-2022, 2022.
Gao, H., Fenicia, F., and Savenije, H. H. G.: HESS Opinions: Are soils overrated in hydrology?, Hydrol. Earth Syst. Sci., 27, 2607–2620, https://doi.org/10.5194/hess-27-2607-2023, 2023.
Hersbach, H., Bell, B., Berrisford, P., Hirahara, S., Horányi, A., Muñoz-Sabater, J., Nicolas, J., Peubey, C., Radu, R., Schepers, D., Simmons, A., Soci, C., Abdalla, S., Abellan, X., Balsamo, G., Bechtold, P., Biavati, G., Bidlot, J., Bonavita, M., Chiara, G., Dahlgren, P., Dee, D., Diamantakis, M., Dragani, R., Flemming, J., Forbes, R., Fuentes, M., Geer, A., Haimberger, L., Healy, S., Hogan, R. J., Hólm, E., Janisková, M., Keeley, S., Laloyaux, P., Lopez, P., Lupu, C., Radnoti, G., Rosnay, P., Rozum, I., Vamborg, F., Villaume, S., and Thépaut, J.: The ERA5 global reanalysis, Q. J. Roy. Meteor. Soc., 146, 1999–2049, https://doi.org/10.1002/qj.3803, 2020.
Hu, G.-R., Li, X.-Y., and Yang, X.-F.: The impact of micro-topography on the interplay of critical zone architecture and hydrological processes at the hillslope scale: Integrated geophysical and hydrological experiments on the Qinghai-Tibet Plateau, J. Hydrol., 583, 124618, https://doi.org/10.1016/j.jhydrol.2020.124618, 2020.
Huang, K., Dai, J., Wang, G., Chang, J., Lu, Y., Song, C., Hu, Z., Ahmed, N., and Ye, R.: The impact of land surface temperatures on suprapermafrost groundwater on the central Qinghai-Tibet Plateau, Hydrol. Process., 34, 1475–1488, https://doi.org/10.1002/hyp.13677, 2020.
Hugonnet, R., McNabb, R., Berthier, E., Menounos, B., Nuth, C., Girod, L., Farinotti, D., Huss, M., Dussaillant, I., Brun, F., and Kääb, A.: Accelerated global glacier mass loss in the early twenty-first century, Nature, 592, 726–731, https://doi.org/10.1038/s41586-021-03436-z, 2021.
IPCC: IPCC Special Report on the Ocean and Cryosphere in a Changing Climate, edited by: Pörtner, H.-O., Roberts, D. C., Masson-Delmotte, V., Zhai, P., Tignor, M., Poloczanska, E., Mintenbeck, K., Alegría, A., Nicolai, M., Okem, A., Petzold, J., Rama, B., and Weyer, N. M., Cambridge University Press, Cambridge, UK and New York, NY, USA, 755 pp., https://doi.org/10.1017/9781009157964, 2019.
Jiang, H., Yang, Y., Bai, Y., and Wang, H.: Evaluation of the Total, Direct, and Diffuse Solar Radiations From the ERA5 Reanalysis Data in China, IEEE Geosci. Remote S., 17, 47–51, https://doi.org/10.1109/LGRS.2019.2916410, 2020.
Jiang, Q., Li, W., Fan, Z., He, X., Sun, W., Chen, S., Wen, J., Gao, J., and Wang, J.: Evaluation of the ERA5 reanalysis precipitation dataset over Chinese Mainland, J. Hydrol., 595, 125660, https://doi.org/10.1016/j.jhydrol.2020.125660, 2021.
Jiao, D., Xu, N., Yang, F., and Xu, K.: Evaluation of spatial-temporal variation performance of ERA5 precipitation data in China, Sci. Rep.-UK, 11, 17956, https://doi.org/10.1038/s41598-021-97432-y, 2021.
Kampf, S. K.: Variability and persistence of hillslope initial conditions: A continuous perspective on subsurface flow response to rain events, J. Hydrol., 404, 176–185, https://doi.org/10.1016/j.jhydrol.2011.04.028, 2011.
Kelleners, T. J., Chandler, D. G., McNamara, J. P., Gribb, M. M., and Seyfried, M. S.: Modeling Runoff Generation in a Small Snow-Dominated Mountainous Catchment, Vadose Zone J., 9, 517–527, https://doi.org/10.2136/vzj2009.0033, 2010.
King, O., Bhattacharya, A., Bhambri, R., and Bolch, T.: Glacial lakes exacerbate Himalayan glacier mass loss, Sci. Rep.-UK, 9, 18145, https://doi.org/10.1038/s41598-019-53733-x, 2019.
Klok, E. J. and Oerlemans, J.: Model study of the spatial distribution of the energy and mass balance of Morteratschgletscher, Switzerland, J. Glaciol., 48, 505–518, https://doi.org/10.3189/172756502781831133, 2002.
Koren, V., Schaake, J., Mitchell, K., Duan, Q.-Y., Chen, F., and Baker, J. M.: A parameterization of snowpack and frozen ground intended for NCEP weather and climate models, J. Geophys. Res.-Atmos., 104, 19569–19585, https://doi.org/10.1029/1999JD900232, 1999.
Kurylyk, B. L., MacQuarrie, K. T. B., and McKenzie, J. M.: Climate change impacts on groundwater and soil temperatures in cold and temperate regions: Implications, mathematical theory, and emerging simulation tools, Earth-Sci. Rev., 138, 313–334, https://doi.org/10.1016/j.earscirev.2014.06.006, 2014.
Lamontagne-Hallé, P., McKenzie, J. M., Kurylyk, B. L., and Zipper, S. C.: Changing groundwater discharge dynamics in permafrost regions, Environ. Res. Lett., 13, 084017, https://doi.org/10.1088/1748-9326/aad404, 2018.
Langer, M., Westermann, S., Boike, J., Kirillin, G., Grosse, G., Peng, S., and Krinner, G.: Rapid degradation of permafrost underneath waterbodies in tundra landscapes-Toward a representation of thermokarst in land surface models, J. Geophys. Res.-Earth, 121, 2446–2470, https://doi.org/10.1002/2016JF003956, 2016.
Lei, Y., Yao, T., Bird, B. W., Yang, K., Zhai, J., and Sheng, Y.: Coherent lake growth on the central Tibetan Plateau since the 1970s: Characterization and attribution, J. Hydrol., 483, 61–67, https://doi.org/10.1016/j.jhydrol.2013.01.003, 2013.
Lei, Y., Yang, K., Wang, B., Sheng, Y., Bird, B. W., Zhang, G., and Tian, L.: Response of inland lake dynamics over the Tibetan Plateau to climate change, Climatic Change, 125, 281–290, https://doi.org/10.1007/s10584-014-1175-3, 2014.
Lei, Y., Yao, T., Yang, K., Bird, B. W., Tian, L., Zhang, X., Wang, W., Xiang, Y., Dai, Y., Lazhu, Zhou, J., and Wang, L.: An integrated investigation of lake storage and water level changes in the Paiku Co basin, central Himalayas, J. Hydrol., 562, 599–608, https://doi.org/10.1016/j.jhydrol.2018.05.040, 2018.
Lei, Y., Yao, T., Yang, K., Lazhu, Ma, Y., and Bird, B. W.: Contrasting hydrological and thermal intensities determine seasonal lake-level variations – a case study at Paiku Co on the southern Tibetan Plateau, Hydrol. Earth Syst. Sci., 25, 3163–3177, https://doi.org/10.5194/hess-25-3163-2021, 2021.
Lei, Y., Yang, K., Immerzeel, W. W., Song, P., Bird, B. W., He, J., Zhao, H., and Li, Z.: Critical Role of Groundwater Inflow in Sustaining Lake Water Balance on the Western Tibetan Plateau, Geophys. Res. Lett., 49, e2022GL099268, https://doi.org/10.1029/2022GL099268, 2022.
Li, B., Yu, Z., Liang, Z., and Acharya, K.: Hydrologic response of a high altitude glacierized basin in the central Tibetan Plateau, Global Planet. Change, 118, 69–84, https://doi.org/10.1016/j.gloplacha.2014.04.006, 2014.
Li, D., Lu, X., Overeem, I., Walling, D. E., Syvitski, J., Kettner, A. J., Bookhagen, B., Zhou, Y., and Zhang, T.: Exceptional increases in fluvial sediment fluxes in a warmer and wetter High Mountain Asia, Science, 374, 599–603, https://doi.org/10.1126/science.abi9649, 2021.
Li, H., Li, X., Yang, D., Wang, J., Gao, B., Pan, X., Zhang, Y., and Hao, X.: Tracing Snowmelt Paths in an Integrated Hydrological Model for Understanding Seasonal Snowmelt Contribution at Basin Scale, J. Geophys. Res.-Atmos., 124, 8874–8895, https://doi.org/10.1029/2019JD030760, 2019.
Liefert, D. T., Shuman, B. N., Parsekian, A. D., and Mercer, J. J.: Why Are Some Rocky Mountain Lakes Ephemeral?, Water Resour. Res., 54, 5245–5263, https://doi.org/10.1029/2017WR022261, 2018.
Luo, D., Jin, H., Wu, Q., Bense, V. F., He, R., Ma, Q., Gao, S., Jin, X., and Lü, L.: Thermal regime of warm-dry permafrost in relation to ground surface temperature in the Source Areas of the Yangtze and Yellow rivers on the Qinghai-Tibet Plateau, SW China, Sci. Total Environ., 618, 1033–1045, https://doi.org/10.1016/j.scitotenv.2017.09.083, 2018.
Luo, D., Jin, H., Bense, V. F., Jin, X., and Li, X.: Hydrothermal processes of near-surface warm permafrost in response to strong precipitation events in the Headwater Area of the Yellow River, Tibetan Plateau, Geoderma, 376, 114531, https://doi.org/10.1016/j.geoderma.2020.114531, 2020.
Magnin, F., Josnin, J.-Y., Ravanel, L., Pergaud, J., Pohl, B., and Deline, P.: Modelling rock wall permafrost degradation in the Mont Blanc massif from the LIA to the end of the 21st century, The Cryosphere, 11, 1813–1834, https://doi.org/10.5194/tc-11-1813-2017, 2017.
Martin, L.: Data from HESS-2022-241: “Recent ground thermo-hydrological changes in a Southern Tibetan endorheic catchment and implications for lake level changes” by Martin et al. Hydrology and Earth System Sciences, Zenodo [data set], https://doi.org/10.5281/zenodo.7484274, 2022.
Martin, L. C. P., Nitzbon, J., Aas, K. S. S., Etzelmüller, B., Kristiansen, H., and Westermann, S.: Stability Conditions of Peat Plateaus and Palsas in Northern Norway, J. Geophys. Res.-Earth, 124, 705–719, https://doi.org/10.1029/2018JF004945, 2019.
Maurer, J. M., Schaefer, J. M., Rupper, S., and Corley, A.: Acceleration of ice loss across the Himalayas over the past 40 years, Sci. Adv., 5, eaav7266, https://doi.org/10.1126/sciadv.aav7266, 2019.
McDonnell, J. J.: Are all runoff processes the same?, Hydrol. Process., 27, 4103–4111, https://doi.org/10.1002/hyp.10076, 2013.
Mirus, B. B. and Loague, K.: How runoff begins (and ends): Characterizing hydrologic response at the catchment scale, Water Resour. Res., 49, 2987–3006, https://doi.org/10.1002/wrcr.20218, 2013.
Monin, A. S. and Obukhov, A. M.: Basic laws of turbulent mixing in the surface layer of the atmosphere, Contrib. Geophys. Inst. Acad. Sci. USSR, 151, 163–187, 1954.
Mualem, Y.: A new model for predicting the hydraulic conductivity of unsaturated porous media, Water Resour. Res., 12, 513–522, https://doi.org/10.1029/WR012i003p00513, 1976.
Nakano, Y. and Brown, J.: Mathematical Modeling and Validation of the Thermal Regimes in Tundra Soils, Barrow, Alaska, Arctic Alpine Res., 4, 19, https://doi.org/10.2307/1550211, 1972.
Niu, L., Ye, B., Li, J., and Sheng, Y.: Effect of permafrost degradation on hydrological processes in typical basins with various permafrost coverage in Western China, Sci. China Earth Sci., 54, 615–624, https://doi.org/10.1007/s11430-010-4073-1, 2011.
Niu, L., Ye, B., Ding, Y., Li, J., Zhang, Y., Sheng, Y., and Yue, G.: Response of hydrological processes to permafrost degradation from 1980 to 2009 in the Upper Yellow River Basin, China, Hydrol. Res., 47, 1014–1024, https://doi.org/10.2166/nh.2016.096, 2016.
Obu, J., Westermann, S., Bartsch, A., Berdnikov, N., Christiansen, H. H., Dashtseren, A., Delaloye, R., Elberling, B., Etzelmüller, B., Kholodov, A., Khomutov, A., Kääb, A., Leibman, M. O., Lewkowicz, A. G., Panda, S. K., Romanovsky, V., Way, R. G., Westergaard-Nielsen, A., Wu, T., Yamkhin, J., and Zou, D.: Northern Hemisphere permafrost map based on TTOP modelling for 2000–2016 at 1 km2 scale, Earth-Sci. Rev., 193, 299–316, https://doi.org/10.1016/j.earscirev.2019.04.023, 2019.
Orsolini, Y., Wegmann, M., Dutra, E., Liu, B., Balsamo, G., Yang, K., de Rosnay, P., Zhu, C., Wang, W., Senan, R., and Arduini, G.: Evaluation of snow depth and snow cover over the Tibetan Plateau in global reanalyses using in situ and satellite remote sensing observations, The Cryosphere, 13, 2221–2239, https://doi.org/10.5194/tc-13-2221-2019, 2019.
Penman, H. L.: Natural evaporation from open water, bare soil and grass, P. Roy. Soc. Lond. A Mat., 193, 120–145, 1948.
Pepin, N., Bradley, R. S., Diaz, H. F., Baraer, M., Caceres, E. B., Forsythe, N., Fowler, H., Greenwood, G., Hashmi, M. Z., Liu, X. D., Miller, J. R., Ning, L., Ohmura, A., Palazzi, E., Rangwala, I., Schöner, W., Severskiy, I., Shahgedanova, M., Wang, M. B., Williamson, S. N., and Yang, D. Q.: Elevation-dependent warming in mountain regions of the world, Nat. Clim. Change, 5, 424–430, https://doi.org/10.1038/nclimate2563, 2015.
Pomeroy, J. W., Gray, D. M., Brown, T., Hedstrom, N. R., Quinton, W. L., Granger, R. J., and Carey, S. K.: The cold regions hydrological model: a platform for basing process representation and model structure on physical evidence, Hydrol. Process., 21, 2650–2667, https://doi.org/10.1002/hyp.6787, 2007.
Qiao, B., Zhu, L., and Yang, R.: Temporal-spatial differences in lake water storage changes and their links to climate change throughout the Tibetan Plateau, Remote Sens. Environ., 222, 232–243, https://doi.org/10.1016/j.rse.2018.12.037, 2019.
Qin, Y., Yang, D., Gao, B., Wang, T., Chen, J., Chen, Y., Wang, Y., and Zheng, G.: Impacts of climate warming on the frozen ground and eco-hydrology in the Yellow River source region, China, Sci. Total Environ., 605–606, 830–841, https://doi.org/10.1016/j.scitotenv.2017.06.188, 2017.
Qin, Y., Chen, J., Yang, D., and Wang, T.: Estimating Seasonally Frozen Ground Depth From Historical Climate Data and Site Measurements Using a Bayesian Model, Water Resour. Res., 54, 4361–4375, https://doi.org/10.1029/2017WR022185, 2018.
Qin, Y., Wu, T., Zhang, P., Liu, W., Xue, S., and Guo, Z.: Spatiotemporal freeze–thaw variations over the Qinghai- Tibet Plateau 1981–2017 from reanalysis, Int. J. Climatol., 41, 1438–1454, https://doi.org/10.1002/joc.6849, 2021.
Ran, Y., Li, X., and Cheng, G.: Climate warming over the past half century has led to thermal degradation of permafrost on the Qinghai–Tibet Plateau, The Cryosphere, 12, 595–608, https://doi.org/10.5194/tc-12-595-2018, 2018.
RGI Consortium: Randolph Glacier Inventory – A Dataset of Global Glacier Outlines, Version 6, 2017.
Richards, L. A.: Capillary Conduction of Liquids through Porous Mediums, Physics (College Park Md), 1, 318–333, https://doi.org/10.1063/1.1745010, 1931.
Richardson, L. F.: Weather Prediction by Numerical Process, Cambridge University Press, 1922.
Rosenberry, D. O., Lewandowski, J., Meinikmann, K., and Nützmann, G.: Groundwater – the disregarded component in lake water and nutrient budgets. Part 1: effects of groundwater on hydrology, Hydrol. Process., 29, 2895–2921, https://doi.org/10.1002/hyp.10403, 2015.
Samuel, J. M., Sivapalan, M., and Struthers, I.: Diagnostic analysis of water balance variability: A comparative modeling study of catchments in Perth, Newcastle, and Darwin, Australia, Water Resour. Res., 44, W06403, https://doi.org/10.1029/2007WR006694, 2008.
Savenije, H. H. G.: HESS Opinions “Topography driven conceptual modelling (FLEX-Topo)”, Hydrol. Earth Syst. Sci., 14, 2681–2692, https://doi.org/10.5194/hess-14-2681-2010, 2010.
Searle, M. P., Parrish, R. R., Hodges, K. V., Hurford, A., Ayres, M. W., and Whitehouse, M. J.: Shisha Pangma Leucogranite, South Tibetan Himalaya: Field Relations, Geochemistry, Age, Origin, and Emplacement, J. Geol., 105, 295–318, https://doi.org/10.1086/515924, 1997.
Seibert, J., Rodhe, A., and Bishop, K.: Simulating interactions between saturated and unsaturated storage in a conceptual runoff model, Hydrol. Process., 17, 379–390, https://doi.org/10.1002/hyp.1130, 2003.
Shaman, J., Stieglitz, M., Engel, V., Koster, R., and Stark, C.: Representation of subsurface storm flow and a more responsive water table in a TOPMODEL-based hydrology model, Water Resour. Res., 38, 31-1–31-16, https://doi.org/10.1029/2001wr000636, 2002.
Shangguan, W., Dai, Y., Liu, B., Zhu, A., Duan, Q., Wu, L., Ji, D., Ye, A., Yuan, H., Zhang, Q., Chen, D., Chen, M., Chu, J., Dou, Y., Guo, J., Li, H., Li, J., Liang, L., Liang, X., Liu, H., Liu, S., Miao, C., and Zhang, Y.: A China data set of soil properties for land surface modeling, J. Adv. Model. Earth Sy., 5, 212–224, https://doi.org/10.1002/jame.20026, 2013.
Shangguan, W., Hengl, T., Mendes de Jesus, J., Yuan, H., and Dai, Y.: Mapping the global depth to bedrock for land surface modeling, J. Adv. Model. Earth Sy., 9, 65–88, https://doi.org/10.1002/2016MS000686, 2017.
Shaoling, W., Huijun, J., Shuxun, L., and Lin, Z.: Permafrost degradation on the Qinghai-Tibet Plateau and its environmental impacts, Permafrost Periglac. Process., 11, 43–53, https://doi.org/10.1002/(SICI)1099-1530(200001/03)11:1<43::AID-PPP332>3.0.CO;2-H, 2000.
Shean, D. E., Bhushan, S., Montesano, P., Rounce, D. R., Arendt, A., and Osmanoglu, B.: A Systematic, Regional Assessment of High Mountain Asia Glacier Mass Balance, Front. Earth Sci., 7, 1–19, https://doi.org/10.3389/feart.2019.00363, 2020.
Sjöberg, Y., Jan, A., Painter, S. L., Coon, E. T., Carey, M. P., O'Donnell, J. A., and Koch, J. C.: Permafrost Promotes Shallow Groundwater Flow and Warmer Headwater Streams, Water Resour. Res., 57, 1–20, https://doi.org/10.1029/2020WR027463, 2021.
Song, L., Wang, L., Li, X., Zhou, J., Luo, D., Jin, H., Qi, J., Zeng, T., and Yin, Y.: Improving Permafrost Physics in a Distributed Cryosphere-Hydrology Model and Its Evaluations at the Upper Yellow River Basin, J. Geophys. Res.-Atmos., 125, 1–22, https://doi.org/10.1029/2020JD032916, 2020.
Themeßl, M. J., Gobiet, A., and Leuprecht, A.: Empirical-statistical downscaling and error correction of daily precipitation from regional climate models, Int. J. Climatol., 31, 1530–1544, https://doi.org/10.1002/joc.2168, 2011.
van Genuchten, M. Th.: A Closed-form Equation for Predicting the Hydraulic Conductivity of Unsaturated Soils, Soil Sci. Soc. Am. J., 44, 892–898, https://doi.org/10.2136/sssaj1980.03615995004400050002x, 1980.
Vionnet, V., Brun, E., Morin, S., Boone, A., Faroux, S., Le Moigne, P., Martin, E., and Willemet, J.-M.: The detailed snowpack scheme Crocus and its implementation in SURFEX v7.2, Geosci. Model Dev., 5, 773–791, https://doi.org/10.5194/gmd-5-773-2012, 2012.
Vörösmarty, C. J., Moore, B., Grace, A. L., Gildea, M. P., Melillo, J. M., Peterson, B. J., Rastetter, E. B., and Steudler, P. A.: Continental scale models of water balance and fluvial transport: An application to South America, Global Biogeochem. Cy., 3, 241–265, https://doi.org/10.1029/GB003i003p00241, 1989.
Walvoord, M. A. and Kurylyk, B. L.: Hydrologic Impacts of Thawing Permafrost – A Review, Vadose Zone J., 15, vzj2016.01.0010, https://doi.org/10.2136/vzj2016.01.0010, 2016.
Wang, C., Zhao, W., and Cui, Y.: Changes in the Seasonally Frozen Ground Over the Eastern Qinghai-Tibet Plateau in the Past 60 Years Characteristics of Seasonally Frozen, Front. Earth Sci., 8, 1–11, https://doi.org/10.3389/feart.2020.00270, 2020.
Wang, G., Li, Y., Hu, H., and Wang, Y.: Synergistic effect of vegetation and air temperature changes on soil water content in alpine frost meadow soil in the prmafrost region of Qinghai-Tibet, Hydrol. Process., 22, 3310–3320, https://doi.org/10.1002/hyp.6913, 2008.
Wang, G., Lin, S., Hu, Z., Lu, Y., Sun, X., and Huang, K.: Improving Actual Evapotranspiration Estimation Integrating Energy Consumption for Ice Phase Change Across the Tibetan Plateau, J. Geophys. Res.-Atmos., 125, 1–13, https://doi.org/10.1029/2019JD031799, 2020.
Wang, L., Yi, C., Xu, X., Schütt, B., Liu, K., and Zhou, L.: Soil properties in two soil profiles from terraces of the Nam Co Lake in Tibet, China, J. Mt. Sci., 6, 354–361, https://doi.org/10.1007/s11629-009-1017-3, 2009.
Wang, Q., Fan, X., and Wang, M.: Recent warming amplification over high elevation regions across the globe, Clim. Dynam., 43, 87–101, https://doi.org/10.1007/s00382-013-1889-3, 2014.
Wang, X. and Gao, B.: Frozen soil change and its impact on hydrological processes in the Qinghai Lake Basin, the Qinghai-Tibetan Plateau, China, J. Hydrol. Reg. Stud., 39, 100993, https://doi.org/10.1016/j.ejrh.2022.100993, 2022.
Wang, Y., Yang, H., Gao, B., Wang, T., Qin, Y., and Yang, D.: Frozen ground degradation may reduce future runoff in the headwaters of an inland river on the northeastern Tibetan Plateau, J. Hydrol., 564, 1153–1164, https://doi.org/10.1016/j.jhydrol.2018.07.078, 2018.
Watras, C. J., Read, J. S., Holman, K. D., Liu, Z., Song, Y.-Y., Watras, A. J., Morgan, S., and Stanley, E. H.: Decadal oscillation of lakes and aquifers in the upper Great Lakes region of North America: Hydroclimatic implications, Geophys. Res. Lett., 41, 456–462, https://doi.org/10.1002/2013GL058679, 2014.
Westermann, S., Schuler, T. V., Gisnås, K., and Etzelmüller, B.: Transient thermal modeling of permafrost conditions in Southern Norway, The Cryosphere, 7, 719–739, https://doi.org/10.5194/tc-7-719-2013, 2013.
Westermann, S., Langer, M., Boike, J., Heikenfeld, M., Peter, M., Etzelmüller, B., and Krinner, G.: Simulating the thermal regime and thaw processes of ice-rich permafrost ground with the land-surface model CryoGrid 3, Geosci. Model Dev., 9, 523–546, https://doi.org/10.5194/gmd-9-523-2016, 2016.
Westermann, S., Ingeman-Nielsen, T., Scheer, J., Aalstad, K., Aga, J., Chaudhary, N., Etzelmüller, B., Filhol, S., Kääb, A., Renette, C., Schmidt, L. S., Schuler, T. V., Zweigel, R. B., Martin, L., Morard, S., Ben-Asher, M., Angelopoulos, M., Boike, J., Groenke, B., Miesner, F., Nitzbon, J., Overduin, P., Stuenzi, S. M., and Langer, M.: The CryoGrid community model (version 1.0) – a multi-physics toolbox for climate-driven simulations in the terrestrial cryosphere, Geosci. Model Dev., 16, 2607–2647, https://doi.org/10.5194/gmd-16-2607-2023, 2023.
Wu, Q. and Zhang, T.: Recent permafrost warming on the Qinghai-Tibetan Plateau, J. Geophys. Res., 113, D13108, https://doi.org/10.1029/2007JD009539, 2008.
Wu, T., Li, S., Cheng, G., and Nan, Z.: Using ground-penetrating radar to detect permafrost degradation in the northern limit of permafrost on the Tibetan Plateau, Cold Reg. Sci. Technol., 41, 211–219, https://doi.org/10.1016/j.coldregions.2004.10.006, 2005
Wünnemann, B., Yan, D., and Ci, R.: Morphodynamics and lake level variations at Paiku Co, southern Tibetan Plateau, China, Geomorphology, 246, 489–501, https://doi.org/10.1016/j.geomorph.2015.07.007, 2015.
Yang, K., Wu, H., Qin, J., Lin, C., Tang, W., and Chen, Y.: Recent climate changes over the Tibetan Plateau and their impacts on energy and water cycle: A review, Global Planet. Change, 112, 79–91, https://doi.org/10.1016/j.gloplacha.2013.12.001, 2014.
Yang, K., Wang, J., Lei, Y., Chen, Y., Zhu, L., Ding, B., and Qin, J.: Quantifying evaporation and its decadal change for Lake Nam Co, central Tibetan Plateau, J. Geophys. Res.-Atmos., 121, 7578–7591, https://doi.org/10.1002/2015JD024523, 2016.
Yang, M., Nelson, F. E., Shiklomanov, N. I., Guo, D., and Wan, G.: Permafrost degradation and its environmental effects on the Tibetan Plateau: A review of recent research, Earth-Sci. Rev., 103, 31–44, https://doi.org/10.1016/j.earscirev.2010.07.002, 2010.
Yang, S., Zhang, H., Kong, M., Liu, Y., Liu, H., and Xu, R.: Study on surficial soil geochemistry in the high-elevation and -frigid mountainous region: A case of Qulong porphyry copper deposit in Tibet, J. Geochem. Explor., 139, 144–151, https://doi.org/10.1016/j.gexplo.2013.06.001, 2014.
Yang, Y., Wu, Q., Jin, H., Wang, Q., Huang, Y., Luo, D., Gao, S., and Jin, X.: Delineating the hydrological processes and hydraulic connectivities under permafrost degradation on Northeastern Qinghai-Tibet Plateau, China, J. Hydrol., 569, 359–372, https://doi.org/10.1016/j.jhydrol.2018.11.068, 2019.
Yao, F., Wang, J., Yang, K., Wang, C., Walter, B. A., and Crétaux, J.-F.: Lake storage variation on the endorheic Tibetan Plateau and its attribution to climate change since the new millennium, Environ. Res. Lett., 13, 064011, https://doi.org/10.1088/1748-9326/aab5d3, 2018.
Yechieli, Y., Ronen, D., Berkowitz, B., Dershowitz, W. S., and Hadad, A.: Aquifer Characteristics Derived From the Interaction Between Water Levels of a Terminal Lake (Dead Sea) and an Adjacent Aquifer, Water Resour. Res., 31, 893–902, https://doi.org/10.1029/94WR03154, 1995.
Yi, S., Arain, M. A., and Woo, M.-K.: Modifications of a land surface scheme for improved simulation of ground freeze-thaw in northern environments, Geophys. Res. Lett., 33, L13501, https://doi.org/10.1029/2006GL026340, 2006.
Yuan, Z., Jin, H., Wang, Q., Wu, Q., Li, G., Jin, X., and Ma, Q.: Profile distributions of soil organic carbon fractions in a permafrost region of the Qinghai–Tibet Plateau, Permafrost Periglac., 31, 538–547, https://doi.org/10.1002/ppp.2055, 2020.
Zhang, G., Yao, T., Piao, S., Bolch, T., Xie, H., Chen, D., Gao, Y., O'Reilly, C. M., Shum, C. K., Yang, K., Yi, S., Lei, Y., Wang, W., He, Y., Shang, K., Yang, X., and Zhang, H.: Extensive and drastically different alpine lake changes on Asia's high plateaus during the past four decades, Geophys. Res. Lett., 44, 252–260, https://doi.org/10.1002/2016GL072033, 2017.
Zhang, G., Nan, Z., Wu, X., Ji, H., and Zhao, S.: The Role of Winter Warming in Permafrost Change Over the Qinghai-Tibet Plateau, Geophys. Res. Lett., 46, 11261–11269, https://doi.org/10.1029/2019GL084292, 2019.
Zhang, G., Yao, T., Xie, H., Yang, K., Zhu, L., Shum, C. K., Bolch, T., Yi, S., Allen, S., Jiang, L., Chen, W., and Ke, C.: Response of Tibetan Plateau lakes to climate change: Trends, patterns, and mechanisms, Earth-Sci. Rev., 208, 103269, https://doi.org/10.1016/j.earscirev.2020.103269, 2020.
Zhang, G., Bolch, T., Chen, W., and Crétaux, J.-F.: Comprehensive estimation of lake volume changes on the Tibetan Plateau during 1976–2019 and basin-wide glacier contribution, Sci. Total Environ., 772, 145463, https://doi.org/10.1016/j.scitotenv.2021.145463, 2021a.
Zhang, G., Nan, Z., Zhao, L., Liang, Y., and Cheng, G.: Qinghai-Tibet Plateau wetting reduces permafrost thermal responses to climate warming, Earth Planet. Sc. Lett., 562, 116858, https://doi.org/10.1016/j.epsl.2021.116858, 2021b.
Zhang, H., Immerzeel, W. W., Zhang, F., de Kok, R. J., Chen, D., and Yan, W.: Snow cover persistence reverses the altitudinal patterns of warming above and below 5000 m on the Tibetan Plateau, Sci. Total Environ., 803, 149889, https://doi.org/10.1016/j.scitotenv.2021.149889, 2022.
Zhang, X., Wang, R., Yao, Z., and Liu, Z.: Variations in glacier volume and snow cover and their impact on lake storage in the Paiku Co Basin, in the Central Himalayas, Hydrol. Process., 34, 1920–1933, https://doi.org/10.1002/hyp.13703, 2020.
Zhang, Y., Ohata, T., and Kadota, T.: Land-surface hydrological processes in the permafrost region of the eastern Tibetan Plateau, J. Hydrol., 283, 41–56, https://doi.org/10.1016/S0022-1694(03)00240-3, 2003.
Zhong, X., Wang, L., Zhou, J., Li, X., Qi, J., Song, L., and Wang, Y.: Precipitation Dominates Long-Term Water Storage Changes in Nam Co Lake (Tibetan Plateau) Accompanied by Intensified Cryosphere Melts Revealed by a Basin-Wide Hydrological Modelling, Remote Sens.-Basel, 12, 1926, https://doi.org/10.3390/rs12121926, 2020.
Zhou, J., Wang, L., Zhang, Y., Guo, Y., Li, X., and Liu, W.: Exploring the water storage changes in the largest lake (Selin Co) over the Tibetan Plateau during 2003–2012 from a basin-wide hydrological modeling, Water Resour. Res., 51, 8060–8086, https://doi.org/10.1002/2014WR015846, 2015.
Zou, D., Zhao, L., Sheng, Y., Chen, J., Hu, G., Wu, T., Wu, J., Xie, C., Wu, X., Pang, Q., Wang, W., Du, E., Li, W., Liu, G., Li, J., Qin, Y., Qiao, Y., Wang, Z., Shi, J., and Cheng, G.: A new map of permafrost distribution on the Tibetan Plateau, The Cryosphere, 11, 2527–2542, https://doi.org/10.5194/tc-11-2527-2017, 2017.
Zweigel, R. B., Westermann, S., Nitzbon, J., Langer, M., Boike, J., Etzelmüller, B., and Vikhamar Schuler, T.: Simulating Snow Redistribution and its Effect on Ground Surface Temperature at a High-Arctic Site on Svalbard, J. Geophys. Res.-Earth, 126, 1–21, https://doi.org/10.1029/2020JF005673, 2021.
- Abstract
- Introduction
- Study area: the Paiku catchment
- Material and methods
- Results
- Discussion
- Conclusion
- Appendix A: Model parameters
- Appendix B: Geological map of the catchment
- Appendix C: TopoSUB subsampling of the catchment
- Appendix D: Evaluation of forcing data
- Code availability
- Data availability
- Author contributions
- Competing interests
- Disclaimer
- Acknowledgements
- Financial support
- Review statement
- References