the Creative Commons Attribution 4.0 License.
the Creative Commons Attribution 4.0 License.
 | 03 Nov 2023
Statistical characteristics of raindrop size distribution during rainy seasons in complicated mountain terrain
Wenqian Mao
Wenyu Zhang
Menggang Kou
In order to improve our understanding of the characteristics of raindrop size distribution (DSD) over complex mountainous terrain, the differences in DSD over the southern slopes, northern slopes, and interior of the Qilian Mountains were analyzed using 6 months of observations. For all rainfall events, the number concentrations of small and large raindrops in the interior and on the southern slopes were greater than on the northern slopes, but midsize raindrops were less. The DSD spectrum of the interior was more variable and differed significantly from that of the northern slopes. The differences in the normalized intercept parameters of the DSD for stratiform and convective rainfall were 8.3 % and 10.4 %, respectively, and those of the mass-weighted mean diameters were 10.0 % and 23.4 %, respectively, while the standard deviations of DSD parameters at interior sites were larger. The differences in the coefficient and exponent of the Z–R relationship were 2.5 % and 10.7 %, respectively, with an increasing value of the coefficient from the southern to the northern slopes for stratiform rainfall but the opposite for convective rainfall. In addition, the DSD characteristics and Z–R relationships were more similar at the ipsilateral sites and had smaller differences between the southern slopes and interior of the mountains.
- Article
(6087 KB) - Full-text XML
- BibTeX
- EndNote


Raindrop size distribution (DSD), the number of raindrops per drop size per unit volume, is an important parameter to statistically describe the microstructure of precipitation (Bringi et al., 2003; Y. Ma et al., 2019). The measurement of DSD can provide some fundamental information such as raindrop size (D), liquid water content (W), rain rate (R), radar reflectivity factor (Z), and so on, which makes an essential contribution to improving quantitative precipitation estimation (QPE) using weather radar and satellite observations (Adirosi et al., 2018; Jash et al., 2019). The parameterization of DSD can obtain the distribution model parameters of DSD in different rain types, which is significant in advancing microphysics parameterization in numerical weather prediction (NWP) models (Wainwright et al., 2014; McFarquhar et al., 2015; Zhao et al., 2019). In addition, understanding the DSD is crucial in many applied fields concerning hydrology, agriculture, soil erosion, and microwave communication (Rincon and Lang, 2002; Smith et al., 2009; Angulo-Martínez and Barros, 2015; Lim et al., 2015; Yang et al., 2016; Giannetti et al., 2017).
Numerous studies have been carried out on the statistical characteristics of DSD in different regions (Campos et al., 2006; Seela et al., 2017; Dolan et al., 2018; Protat et al., 2019; Le Loh et al., 2019; Jash et al., 2019). It has been shown that the number concentration and size of raindrops increase with rain rate, and so the DSD becomes higher and wider. The characteristics in different rain types demonstrate that the mass-weighted mean diameter (i.e., Dm) and normalized intercept parameter (i.e., Nw) of convective rainfall are larger than those of stratiform rainfall. Furthermore, these studies also reveal that there are more differences in the characteristics of DSD. Dolan et al. (2018) divided global DSD characteristics into six types by using 12 datasets across three latitudes and found that the centralized regions and DSD parameters of the six types varied with location. The average number of raindrops in central Korea was usually greater than that in the southeast under three rainfall systems, especially drops in the 0.31–0.81 mm diameter range (Le Loh et al., 2019). According to DSD measurements in the Tibetan Plateau region, eastern areas have a higher raindrop number concentration in the diameter range of 0.437–1.625 mm and greater variation in terms of diameter than in central areas (Wang et al., 2020). Compared to eastern China and northern China, the DSD in southern China shows a higher number concentration of relatively small-sized drops (Zhang et al., 2019). Comparison of the Z–R relationship (defined as Z=ARb) indicates that the coefficient decreases with increasing R in the southern Tibetan Plateau, which is opposite to the case in southern China (Wu and Liu, 2017). For the DSD parameters of stratiform and convective rainfall, there are various changes between the lower and middle reaches of the Yangtze River (Fu et al., 2020).
As reported in the above studies, DSD characteristics vary significantly with factors such as geographical location, climatic region, and rain types. Pu et al. (2020) analyzed the DSD characteristics of five sites in Nanjing City and found the Nw of DSD to be largest at sites near industrial areas, but the Dm of DSD was largest at sites near the city's center. In other words, even at the smaller scale, there are still differences in the microphysical characteristics reflected by the DSD, which is due to the influence of the surrounding environment. How, then, do the characteristics of DSD vary from location to location over the complicated mountain terrain? Narayana Rao et al. (2006), by comparing the DSD parameters at different altitudes, suggested that the obvious variation in DSD with altitude is related to the processes of evaporation and breakup. Using aircraft observations, Geoffroy et al. (2014) concluded that the total concentration of raindrops decreased while the average drop size increased with decreasing altitude. Han et al. (2023) found the rain rate between mm h−1 in relation to the total precipitation increases with altitude by using the disdrometer data from 2434 to 4202 m in the northeastern Tibetan Plateau. With more attention on mountain research, the concerning questions are growing. For example, how large might the differences in DSD be at different altitudes in mountainous regions? And how significant might the effects be of these differences?
The Qilian Mountains, a series of marginal mountains in the northeastern part of the Tibetan Plateau, are a vitally important ecological protection barrier in the northwestern arid areas of the region that block the connection between deserts and wilderness (Fig. 1a). The mountains form several inland rivers that are important water sources for the arid areas of the northwest and have therefore made a considerable contribution to regional economic development (Gou et al., 2005; Tian et al., 2014; Qin et al., 2016). In this study, we chose the Qilian Mountains as the research object and selected six sites with different backgrounds representing the southern slopes, northern slopes, and interior of the mountains. To thoroughly investigate the discrepancies in this complex mountain terrain, the DSD characteristics and Z–R relationships were comprehensively analyzed according to different rain types based on continuous disdrometer observations in the rainy season. The primary goal was to obtain a deeper understanding of the characteristic differences of DSD over the Qilian Mountains and to refine the accuracy of QPE by comparing with standard Z–R relationships in models, which could then be used as a research foundation for developing cloud water resources in mountainous areas.
2.1 Sites and instruments
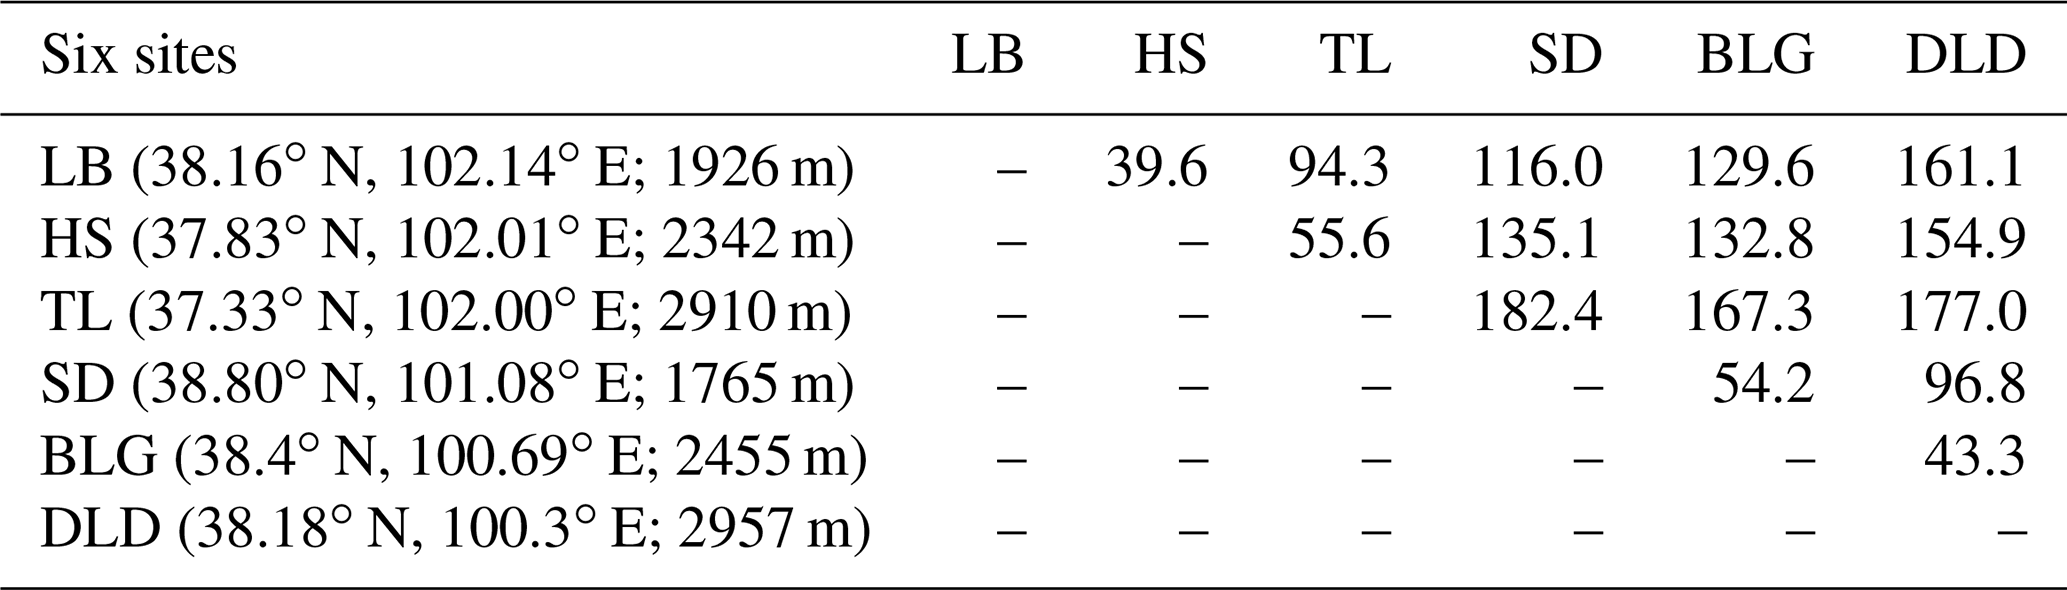
The eastern and middle sections of the Qilian Mountains were chosen as the main study area, taking into account that several important inland rivers originate from these areas (Li et al., 2019). Six disdrometers were deployed on the southern slopes, northern slopes, and interior (close to the ridge) of the Qilian Mountains, with three sites in the eastern section (called Taola (TL, 2910 m), Huangchengshuiguan (HS, 2342 m), and Liuba (LB, 1926 m), from south to north) and another three sites in the middle section (called Daladong (DLD, 2957 m), Boligou (BLG, 2455 m), and Shandan (SD, 1765 m), from south to north). The background of the Qilian Mountains is shown on the satellite map in Fig. 1a, and the six sites are marked on the topographical map, also in Fig. 1b. The distances between the six sites are listed in Table 1. The sites in the south, north, and interior are basically parallel to the orientation of the mountains, and the sections formed by the sites in the east and interior are basically perpendicular to it. On the basis of a historical weather review and rain gauge observations, the rainy season at the six sites is concentrated in May to October, with more precipitation in July, August, and September.
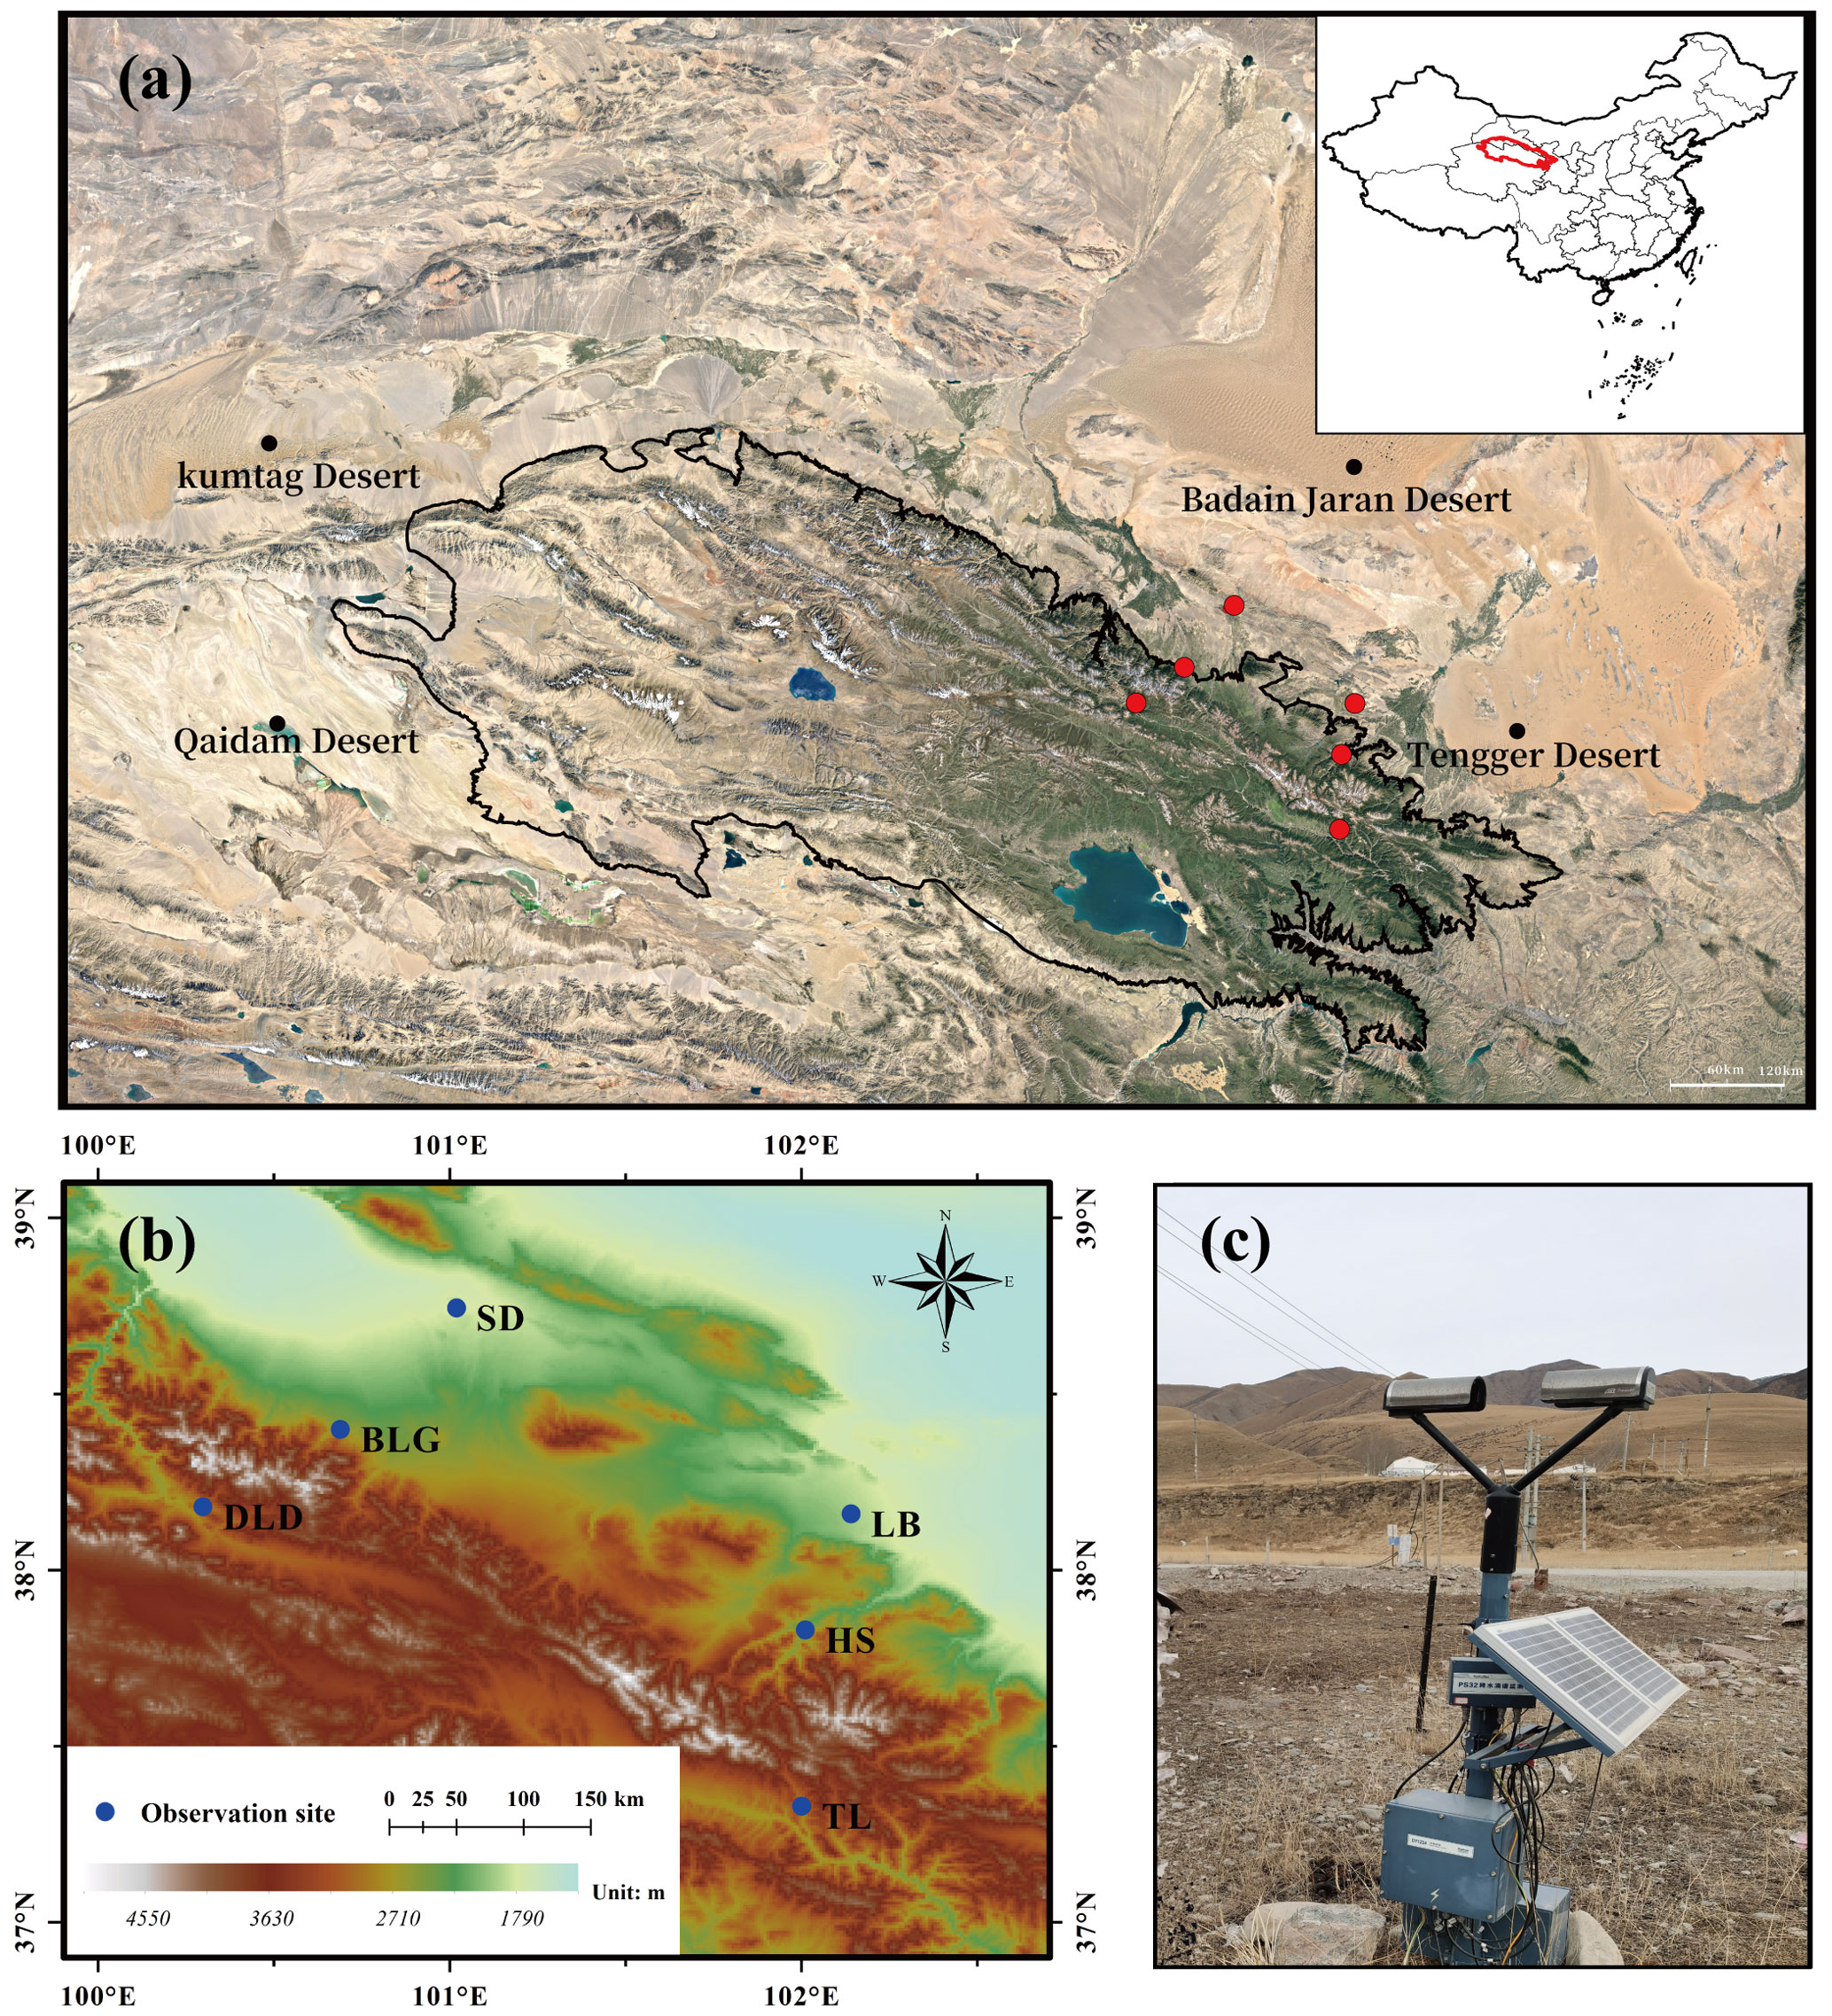
Figure 1(a) Geographical overview of the Qilian Mountains. (b) The disdrometer sites (circles). (c) The observation device at TL site. Source: Google Earth © Google Earth 2019.
Table 1Site details (latitude, longitude, sea level height) and distances (km) between pairs of sites.
This study used an optical, laser-based device to measure the DSD, called a DSG4 disdrometer (Fig. 1c), which meets the functional specification requirements for disdrometers issued by the China Meteorological Administration. This disdrometer has an HSC-OTT Parsivel2 sensor as the observation part, manufactured by OTT Messtechnik (Germany) and Huatron (China). When raindrops pass through the horizontal flat laser beam generated by the transmitting part of the instrument, it causes signal attenuation in the laser observation area. The raindrop size is determined by the degree of signal attenuation, and the falling speed is recorded by the transit time. The sampling time is 60 s, and the velocity and drop sizes are divided into 32 non-equally spaced bins, varying from 0.05 to 20.8 m s−1 for velocity and 0.062 to 24.5 mm for drop diameter.
2.2 Quality control of the data
It was necessary to quality control the data because of potential instrument errors. Every minute of DSD data collected by the six DSG4 disdrometers from May to October 2020 was carefully processed. Specifically, the following criteria were employed in choosing data for analysis (Jaffrain and Berne, 2011; Guyot et al., 2019; Pu et al., 2020): (1) the first two size bins were ignored because of a low signal-to-noise ratio, (2) samples with 1 min total of raindrop numbers less than 10 or a rain rate at the moment of discontinuous observation less than 0.1 mm h−1 were regarded as noise (corresponds to the second sample in Table 2), (3) raindrops with diameters more than 8 mm were eliminated, (4) raindrops with a falling terminal velocity V(Di) that deviated from the empirical terminal velocity Vemp(Di) by more than 40 % were removed (Kruger and Krajewski, 2002), and (5) samples with less than five bins after the correction of falling terminal velocity were deleted because their DSDs could not be determined with too few bins. The fourth criterion can be expressed by the following formula:
where (Di is the mean volume-equivalent diameter of the ith size category), as derived from the formula given in Atlas et al. (1973).
The sample statistics of key steps following data quality control are shown in Table 2. The numbers of 1 min DSD spectra selected from the six sites (LB, HS, TL, SD, BLG, DLD) after data quality control, covering the rainy season (May–October) in the Qilian Mountains region in 2020, were 11 103, 17 619, 14 814, 10 736, 18 861, and 13 230, respectively, which accounted for 87.9 %, 85.8 %, 84.5 %, 91.2 %, 80.6 %, and 86.5 % of the total number of samples.
Table 2Sample statistics of data quality control at six sites.

2.3 Integral parameters of rainfall
The basic observations obtained by the disdrometer were the counts of raindrops at each diameter and velocity. Also, the diameters given by the disdrometers were the middle value of two adjacent bins, which we take as the corresponding endpoint bin values. The velocities were the weighted-average velocity class over the corresponding disdrometer. The raindrop number concentration N(Di) (m−3 mm−1) in the ith size bin per unit volume per unit size interval for diameter was calculated with the following equation:
where ni,j denotes the counts of raindrops measured by the disdrometer within size bin i and velocity bin j during the sampling time Δt; A and Δt are the sampling area (0.0054 m2) and sampling time (60 s), respectively; Vj (m s−1) is the mid-value falling speed for velocity bin j; and ΔDi is the diameter spread for the ith diameter bin.
Some integral rainfall parameters, such as the total number concentration Nt (m−3), rain rate R (mm h−1), radar reflectivity factor Z (mm6 m−3), and liquid water content W (g cm−3), can be derived with the following equations:
where ρw is the water density (1.0 g cm−3), and V(Di) is the falling speed from the disdrometer. In this study, when calculating the rain rate, we use Vemp(Di) to replace V(Di) because of measurement error, particularly at larger bins and faster falling speeds, which is inspired by Tokay et al. (2014) and Zhang et al. (2019).
The characteristics of DSD can be described by a three-parameter gamma distribution in the form introduced by Ulbrich (1983). Also, it has better fitting capability than the M–P distribution in terms of the broader variation of DSD fluctuations, including the middle rain drops, especially on small and large rain scales. The three-parameter gamma distribution can be expressed by the following formula:
where N(D) is the raindrop number concentration; D is the raindrop bins with units of millimeters; and N0, μ and Λ are the intercept, shape, and slope parameter from the three parameters of the gamma model, which can be derived from gamma moments or the least-squares method, respectively. When μ=0, it degenerates into the M–P DSD model.
Although, the gamma distribution is commonly accepted, the normalized gamma distribution has also been widely adopted, with its independent parameters and clear physical meaning, as follows (Dolan et al., 2018; Y. Ma et al., 2019):
where μ is the shape parameter, which is dimensionless; Dm (mm) is the mass-weighted mean diameter; and Nw (m−3 mm−1) is the normalized intercept parameter computed from Dm. The form is as follows:
3.1 Characteristics of DSD
Figure 2a shows the mean DSDs for the six sites during the rainy season in the Qilian Mountains. The maximum concentration of raindrops was around 0.562 mm in diameter, and the maximum number concentration values of the sites were ordered as follows: BLG > TL > DLD > HS > SD > LB. As the diameter increased, the number concentration decreased, and the concentration values followed the order LB > SD > DLD > TL > BLG > HS at around 2 mm in diameter. When the diameter was larger than 4 mm, the concentration at TL, BLG, and HS was relatively high. In this study, the data were roughly divided into small raindrops (less than 1 mm in diameter), midsize raindrops (1–3 mm), and large raindrops (greater than 3 mm) to easily describe the differences in DSDs (Y. Ma et al., 2019; Pu et al., 2020). To highlight the DSD differences caused by the background environment, Fig. 2b shows the mean DSDs normalized by the Nw and Dm results for the sites. Compared with Fig. 2a, the raindrop characteristics were more consistent across sizes, while the differences between the sites were more pronounced, especially in the midsize and large raindrops, which truly reflected the DSD differences caused by the location. Combining the characteristics of the geographical environments of the six sites, we can analyze some differences in DSD characteristics in the Qilian Mountains. For small raindrops, the number concentrations at the interior and southern-slope sites were greater than at northern-slope sites; for midsize raindrops, the number concentrations decreased sequentially at the northern-slope, southern-slope, and interior sites; and for large raindrops, the number concentrations at the interior sites were larger. In addition, the number concentrations of raindrops in the middle section of this mountainous area were slightly greater than those in the eastern section.

Figure 2The (a) mean and (b) normalized mean DSDs at six sites in the Qilian Mountains region in the rainy season.
3.2 Distribution of DSD parameters
In order to study the differences in DSDs, we selected six integral rainfall parameters for discussion – namely, the normalized intercept parameter (Nw), mass-weighted mean diameter (Dm), shape parameter (μ), total number concentration (Nt), rain rate (R), and radar reflectivity factor (Z). Figure 3 and Table 3 show the distributions and statistics of these six DSD parameters (the distribution of each was normalized using the uniform method). On average, Dm was more concentrated on smaller values at HS and BLG, which showed smaller mean values than TL and DLD but significantly more values greater than 1 mm at LB and SD; log10Nw was more centralized on larger values at TL and DLD, with relatively smaller values at LB and SD; and the distribution patterns for μ and log10Nt were similar to those for log10Nw. The density curves of R and Z were similar, but there were differences among the six sites, which are analyzed in detail later in the paper. It is noteworthy that the frequency of samples with R around 0.6–1.0 mm h−1 was highest, and samples with R less than 1 mm h−1 accounted for more than half of the total rainfall.

Figure 3Probability density distribution of integral DSD parameters at six sites (LB, HS, TL, SD, BLG, DLD): (a) normalized intercept parameter log10Nw (Nw in m−3 mm−1), (b) mass-weighted mean diameter Dm (mm), (c) shape parameter μ, (d) total number concentration log10Nt (Nt in m−3), (e) rain rate log10R (R in mm h−1), and (f) radar reflectivity factor Z (dBZ).
Table 3Statistical values of several integral DSD parameters for all observations at six sites (LB, HS, TL, SD, BLG, DLD).

Note: ME is mean, SD is standard deviation, and SK is skewness.
3.3 DSD characteristics in different rain rate classes
To further understand the characteristics of DSDs at the six sites, the samples were divided into six classes according to the associated rain rates (R): C1, R<0.5; C2, ; C3, ; C4, ; C5, ; C6, R≥10 mm h−1. This classification was based on two considerations: firstly, the number of observation samples for different rainfall rates roughly conformed to a normal distribution; and secondly, the mean maximum diameter interval of different rainfall rates gradually increased (Li et al., 2019). Of course, other classification studies were referenced, and the fact that the rain rate in this area is smaller than that in southern China was taken into account (Y. Ma et al., 2019; Zeng et al., 2021). Figure 4 shows the mean DSDs of each rainfall rate class for the six sites. Table 4 lists the number of samples and statistical values of the DSD parameters for the six classes. Clearly, as the rainfall rate increased, the number concentration of almost all raindrop sizes and the width of DSD shapes increased, and thus the tail of the DSD shape moved gradually towards a larger diameter, similarly to previous findings, such as those of Y. Ma et al. (2019) and Pu et al. (2020). Taking a number concentration of 0.01 m−3 mm−1, the mean maximum diameters of DSD in each class were ordered as follows: 2.3–2.5, 3.2–3.4, 3.9–4.5, 4.3–5.0, 5.0–5.6, and 6.0–7.0 mm (the sixth-class diameter range is not fully shown in the figure). In class C1, the number concentrations were relatively similar at different sites; starting from class C2, the differences in number concentration increased when the diameter was greater than 2 mm for the six sites; and the differences in number concentration were gradually reflected in each raindrop size bin as the rainfall rate class increased. Observationally, the DSDs of BLG, HS, and TL had larger number concentrations in different rainfall rate classes, and the DSD parameters and standard deviations (SDs) were larger, especially for BLG.
Table 4Statistical values of several integral DSD parameters for six rain rate classes at six sites.
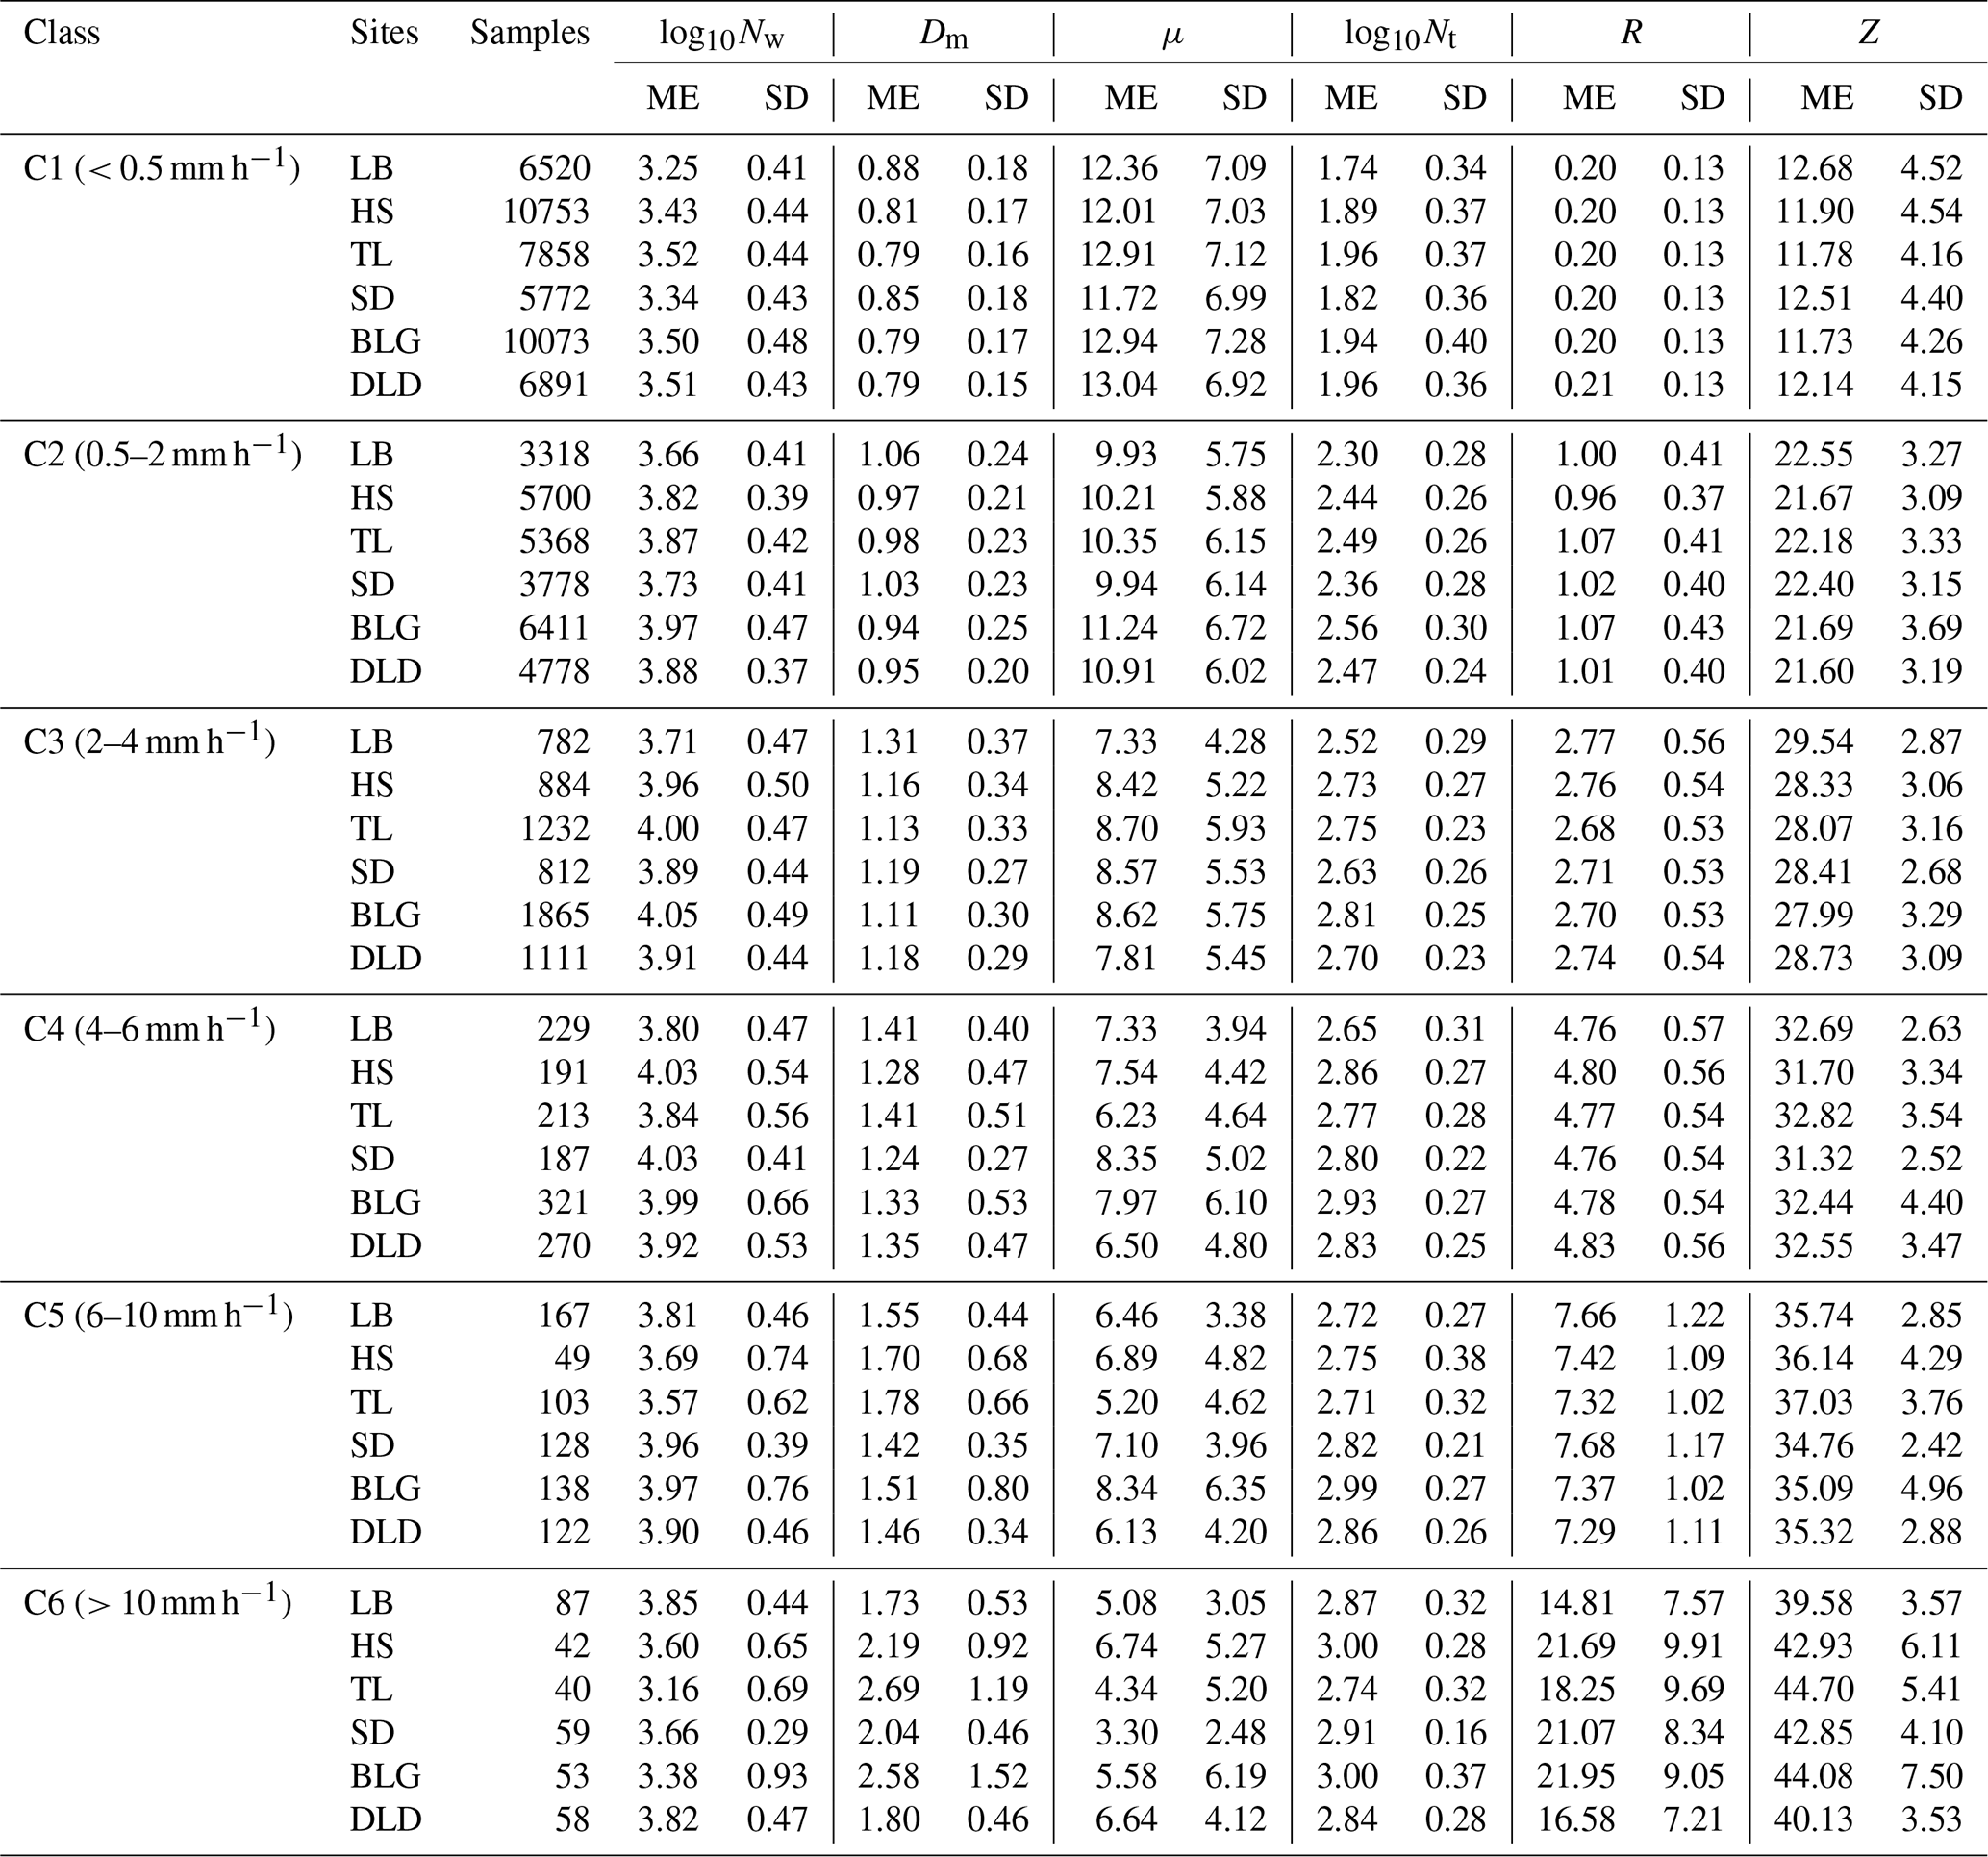
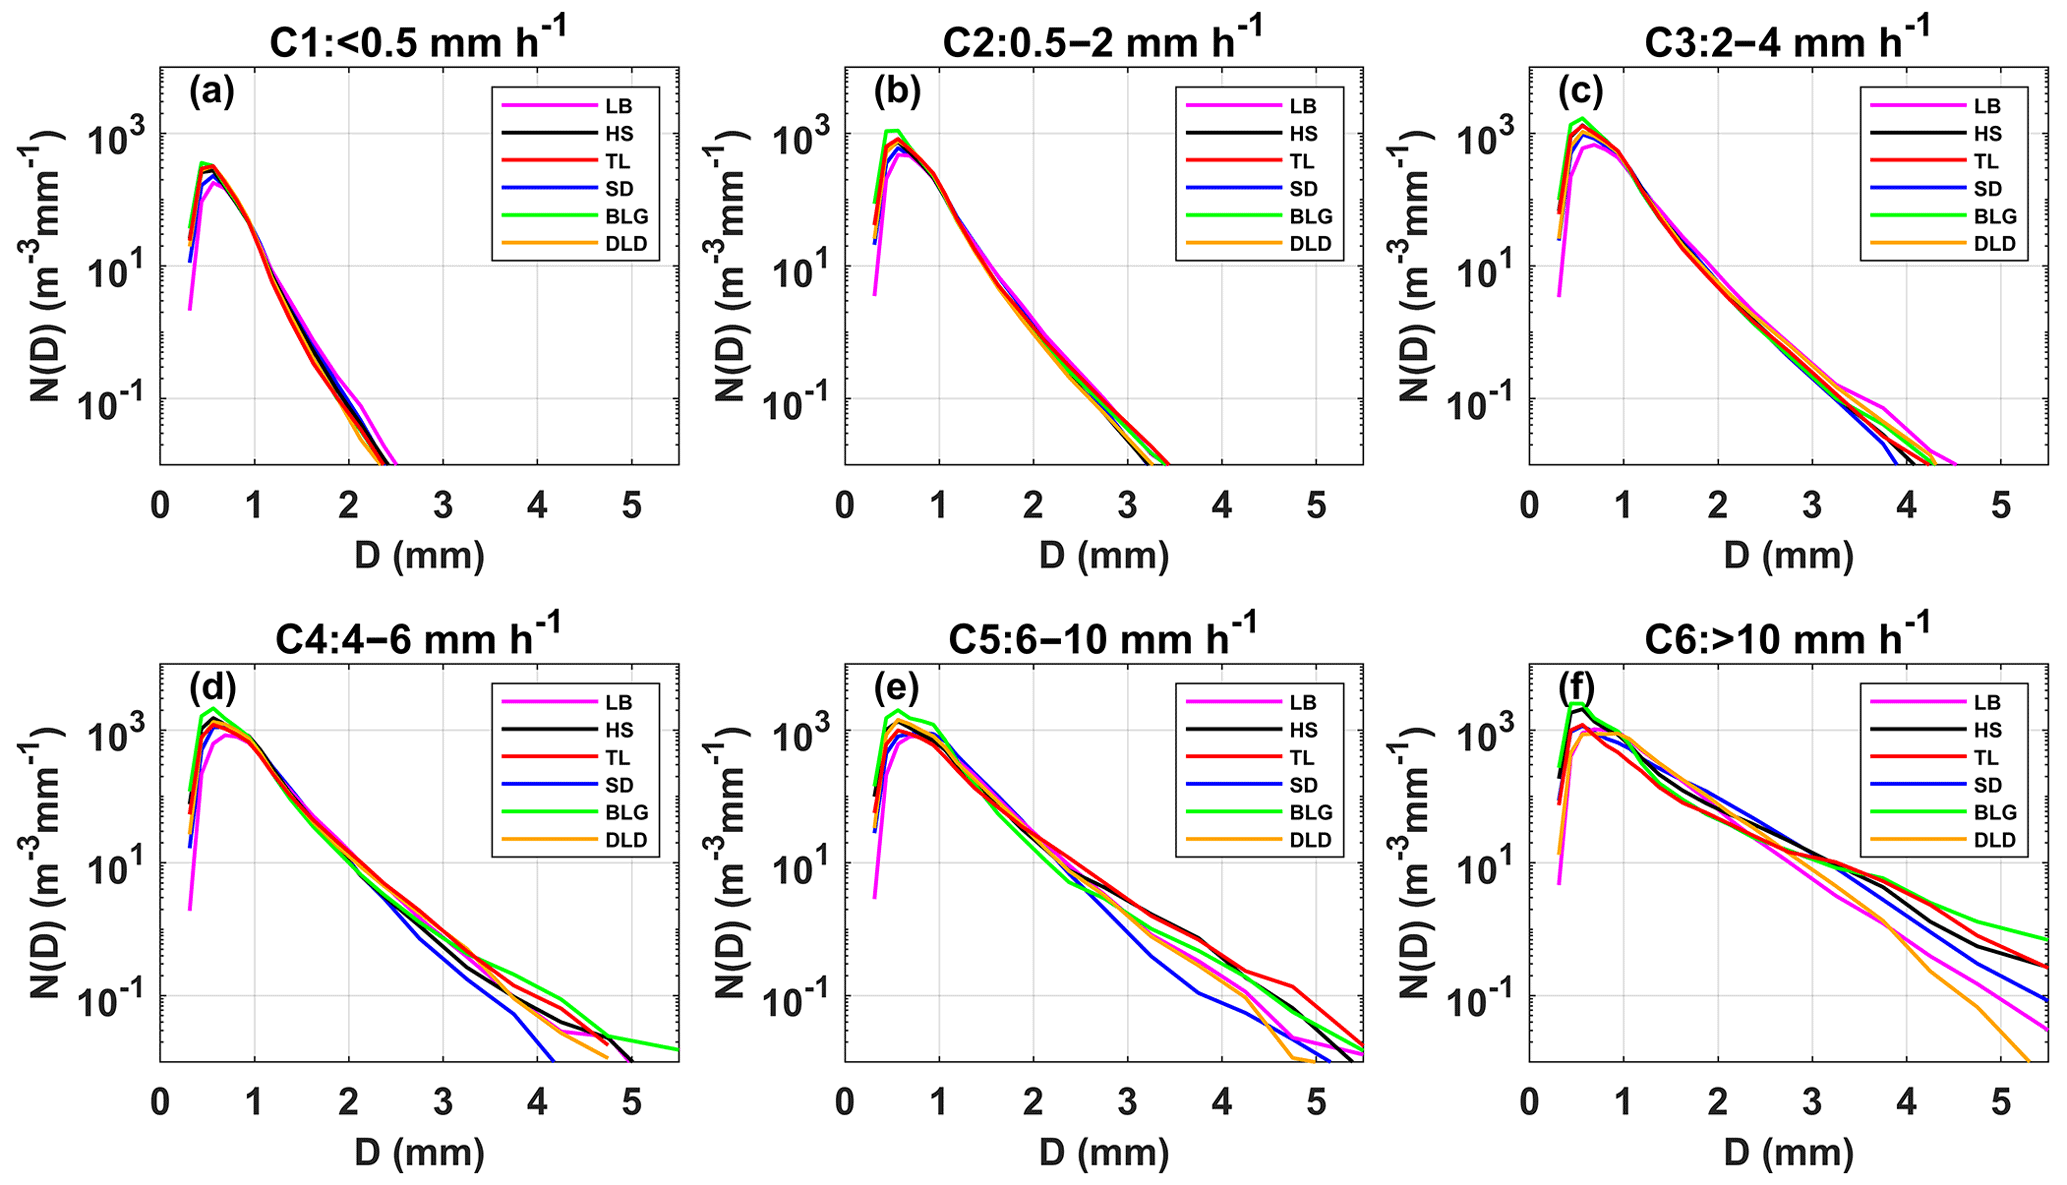
Figure 5 shows box-and-whisker plots of the normalized intercept parameter log10Nw and the mass-weighted mean diameter Dm for six sites in each rain rate class. The middle line in the box indicates the median. The left and right lines indicate the 25th and 75th percentiles. The left and right ends of the whiskers indicate the most extreme data points between the 5th and 95th percentiles, except outliers. The median Dm gradually increased with a larger value range as the rain rate class increased, particularly for HS and BLG in classes C5 and C6. The median log10Nw increased in classes C1 to C3 and then tended to decrease in classes C5 to C6, for which the reduction was obvious at sites with a larger value range, such as HS and BLG. Y. Ma et al. (2019) also obtained similar conclusions that Dm values increase with the increased rainfall intensity, while the log10Nw is not as clear. The indication was that the increase in rain rate was mainly due to the growth in raindrop size. Also, the change in number concentration may have been caused by the imbalance between the loss of number concentration at small raindrop sizes and the addition at large raindrop sizes, which in a sense implies a relationship between the collision–coalescence and breakup of raindrops. It is worth noting that the microphysical processes were quite different among the sites, being greatly influenced by the surrounding environment. Because HS and BLG were located in the interior of the mountains and close to the ridge, their dynamics and thermodynamics, as well as their underlying surfaces, were thus different from those of other sites.

Figure 5Variation of the normalized intercept parameter log10Nw (a) and the mass-weighted mean diameter Dm (b) for different rain rate classes at six sites. The three lines in the boxes are the 25th, 50th, and 75th percentiles, from left to right. The whiskers at the left and right ends are the 5th and 95th percentiles, respectively. The colors represent the six sites, as in other figures.
Figure 6 displays the contribution of different rain rate classes to the total rainfall at different sites. It is clear that C2 contributed the most to the total rainfall of all sites, followed by C3, and the sum of the two classes' contributions could reach 60 % of the total rainfall. Compared with the interior and southern-slope sites, C2 and C3 contributed slightly less to sites LB and SD (i.e., the northern slopes), while C5 and C6 contributed relatively more to sites LB and SD, indicating that there is a greater probability of heavy-precipitation events on the northern slopes. The DSD parameters in Table 3 provide a more detailed representation of the rainfall differences between the three geographical sections of the Qilian Mountains, i.e., the interior, southern slopes, and northern slopes. Meanwhile, it also reflects the characteristics of rainfall in the eastern and interior sections – for example, the eastern section had larger Z and Dm and smaller log10Nw and log10Nt compared to the interior. It is possible that there is a certain spatial connection between precipitation at the sites, related to factors such as the source of precipitation vapor, weather system, and so on.

Figure 6Proportion of rainfall with different rain rate classes to rain amount at six sites.
3.4 DSD properties for different rain types
Previous studies on DSD have shown that there are significant differences in the DSD of convective and stratiform rainfall in the same climatic region, which has a substantial impact on the parameterization of NWP and remote sensing observations (Bringi et al., 2003; Penide et al., 2013). Due to the different physical mechanisms of convective and stratiform rainfall, it is possible to discuss the differences in the microphysical structures of rainfall types through their DSDs. Studies have employed many different classification methods for rainfall types; for example, Testud et al. (2001) used the rain rate, Chen et al. (2013) combined the rain rate and its SD, and the findings of Das and Maitra (2018) were based on the rain rate and radar reflectivity factor. Among these, the method of Chen et al. (2013) has commonly been used to establish samples of convective and stratiform rainfall but mainly in semi-humid or humid regions with relatively high rain rate and rainfall. However, the Qilian Mountains are located in the semi-arid regions of China and far from the sea, where the average rainfall intensity and amount are quite different from in semi-humid regions. Therefore, this paper proposes a new classification method for precipitation that is applicable to the arid and semi-arid regions of northwestern China based on the classification ideas of Chen et al. (2013) and Das et al. (2018).
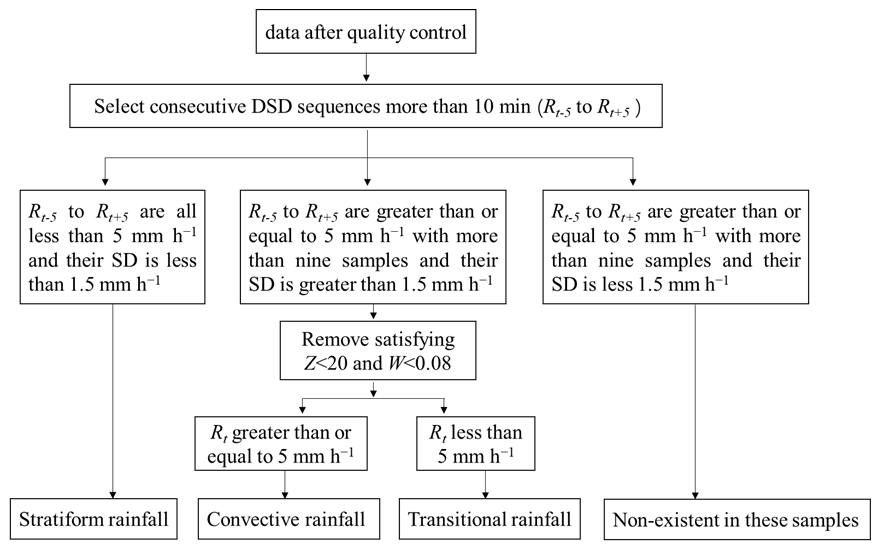
Firstly, the sequences of DSD with continuous 1 min samples for more than 10 min are determined, and Rt is defined as the rain rate at time t. In the first case, the R of samples from Rt−5 to Rt+5 is less than 5 mm h−1, and their SD is less than 1.5 mm h−1; in the second case, the R of samples from Rt−5 to Rt+5 is greater than or equal to 5 mm h−1 with more than nine samples, and their SD is greater than 1.5 mm h−1; and in the third case, the situation is the same as the second case, but their SD is less 1.5 mm h−1. Secondly, samples satisfying Z< 20 and W< 0.08 in the second case are removed (Thurai et al., 2016; Das and Maitra, 2018), and then, samples with Rt greater than or equal to 5 mm h−1 in the second case are regarded as convective rainfall, and samples with Rt less than 5 mm h−1 in the second case are regarded as transitional rainfall (the rainfall stage in which convective precipitation develops and declines). Samples in the first case are regarded as stratiform rainfall. Through experiments, the third case does not exist. The main calculation process is shown in Fig. 7.
The log10Nw and Dm of different rainfall types were different, and these were taken as the main research objects. Figure 8 shows the variation of log10Nw with Dm at different sites. The blue, red, and yellow scatter points represent stratiform, convective, and transitional rainfall, respectively. Obviously, there are fairly clear boundaries between the scatter points for the different precipitation type events, and the same dividing line can be used to distinguish between the different rainfall types at different sites. The solid green lines were drawn based on visual examination of the data, with a slope of approximately −1.60 and an intercept of 6.008 to represent the split between stratiform, transitional, and convective rainfall in all subplots. The dashed green line can distinguish transitional rainfall (transitional and stratiform rainfall have an overlap area) with a slope of approximately −3.338 and intercept of 6.847. Note that the dividing line between stratiform and convective rainfall has the same slope as that obtained by Bringi et al. (2003) (solid green line with a slope of −1.6 and intercept of 6.3), who fitted composite results based on disdrometer data and from radar retrievals covering many climate conditions from near the Equator to the Plateau. The log10Nw and Dm from the figures for stratiform, convective, and transitional rainfall are, respectively, concentrated in the ranges of 3.1–3.9 and 0.75–1.1 mm, 3.8–4.2 and 1.4–1.6 mm, and 3.6–4.0 and 1.05–1.2 mm. Compared to the maritime-like cluster and continental-like cluster of convective rainfall proposed by Bringi et al. (2003), the convective events in the Qilian Mountains do not belong to continental-like clusters or maritime-like clusters, while the averages of Dm are slightly less than the continental-like cluster, and the averages of log10Nw are greater than the continental-like cluster. There are isolated convective events in the maritime-like cluster, but it is difficult to be consistent with the features of the geographical location of the Qilian Mountains.
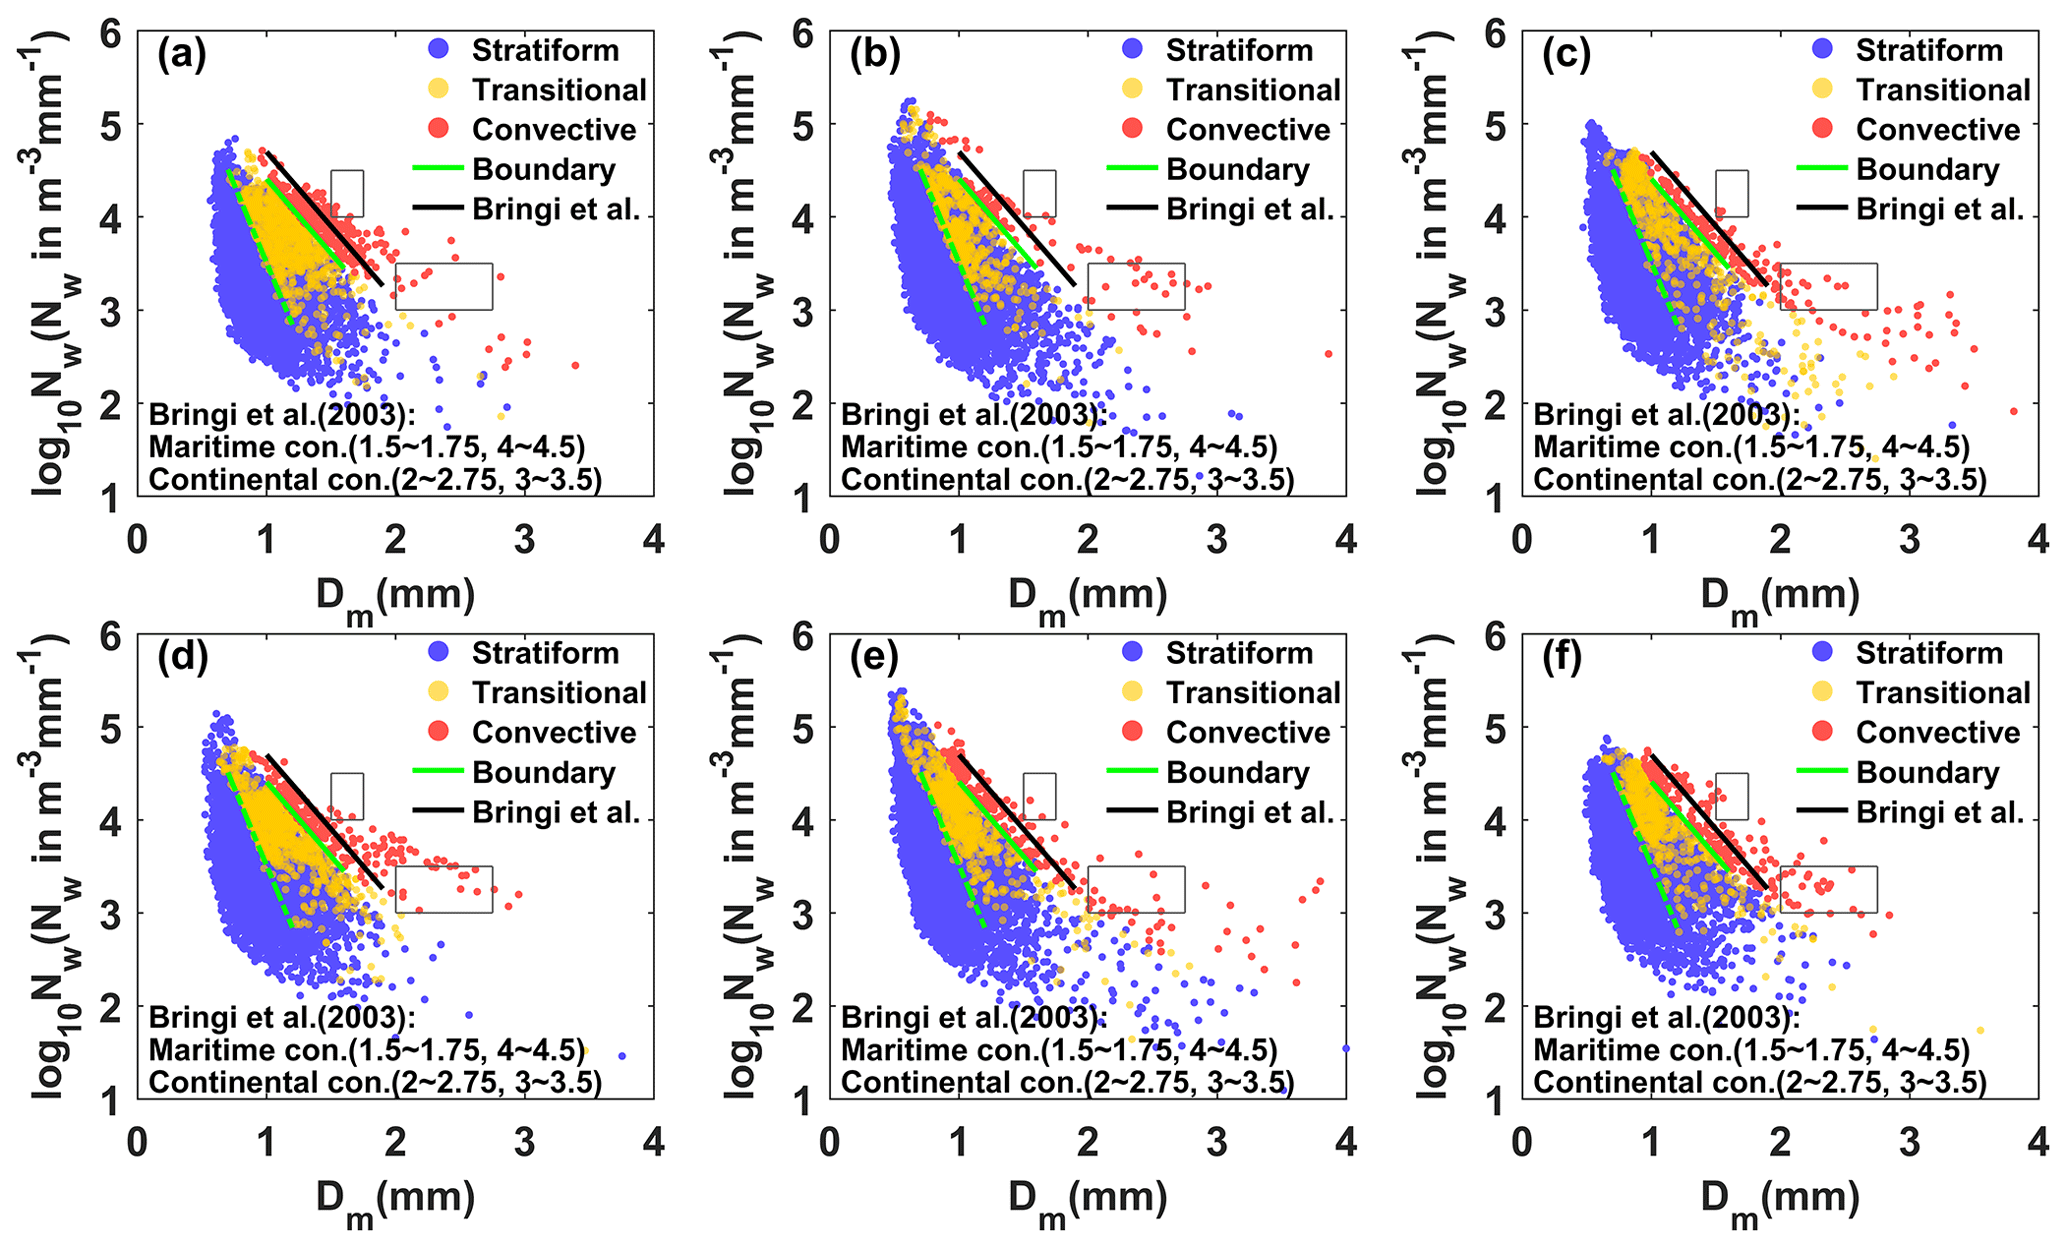
Figure 8Scatter plot of log10Nw versus Dm for different rain types at (a) LB, (b) HS, (c) TL, (d) SD, (e) BLG, and (f) DLD. The stratiform cases, convective cases, and transitional cases are represented by blue, red, and yellow scatter points, respectively. The dashed green lines are the log10Nw–Dm relationship for stratiform versus convective cases and stratiform versus transitional cases. The dashed black lines are the log10Nw–Dm relationship for stratiform versus convective cases and stratiform versus transitional cases from Bringi et al. (2003). The dotted green lines are the area of overlap between stratiform and transitional cases.
Figure 9 shows the mean DSDs for stratiform, convective, and transitional rainfall at the six sites. The ranges of number concentrations and corresponding raindrop diameters for the three types were significantly different, matching the basic characteristics of DSD. The mean DSDs of stratiform rainfall differed slightly among the sites; convective rainfall had big differences among the sites; and transitional rainfall presented more differences, beginning at larger than 2.2 mm in diameter, which were the expected results. Stratiform rainfall usually has a large horizontal extent and an homogeneous cloud distribution, which makes the DSD characteristics basically the same under the influence of the same cloud system in mountainous areas. However, convective rainfall is related to local thermal and dynamical factors, which could lead to differences in DSD at different sites when considering the complex topography and diverse underlying surfaces in mountainous areas. For example, for convective rainfall, there was a significant increase in the number concentration of raindrops larger than 2.2 mm in diameter at BLG, HS, and TL, indicating that these sites are conducive to the development of convective precipitation. Also, the number concentrations of small raindrops at BLG and HS were higher than at TL (the southern slope), which may be due to the higher altitude of the interior sites reducing the falling distance of raindrops after exiting the cloud and decreasing the impact of collision on the raindrop evolution. In other words, even for the same rainfall type, the microphysics of rainfall at different sites is still different, depending on the topography and position of the observation point relative to the cloud base.

Figure 9Distribution of mean measured DSD for (a) stratiform rainfall, (b) convective rainfall, and (c) transitional rainfall at six sites.
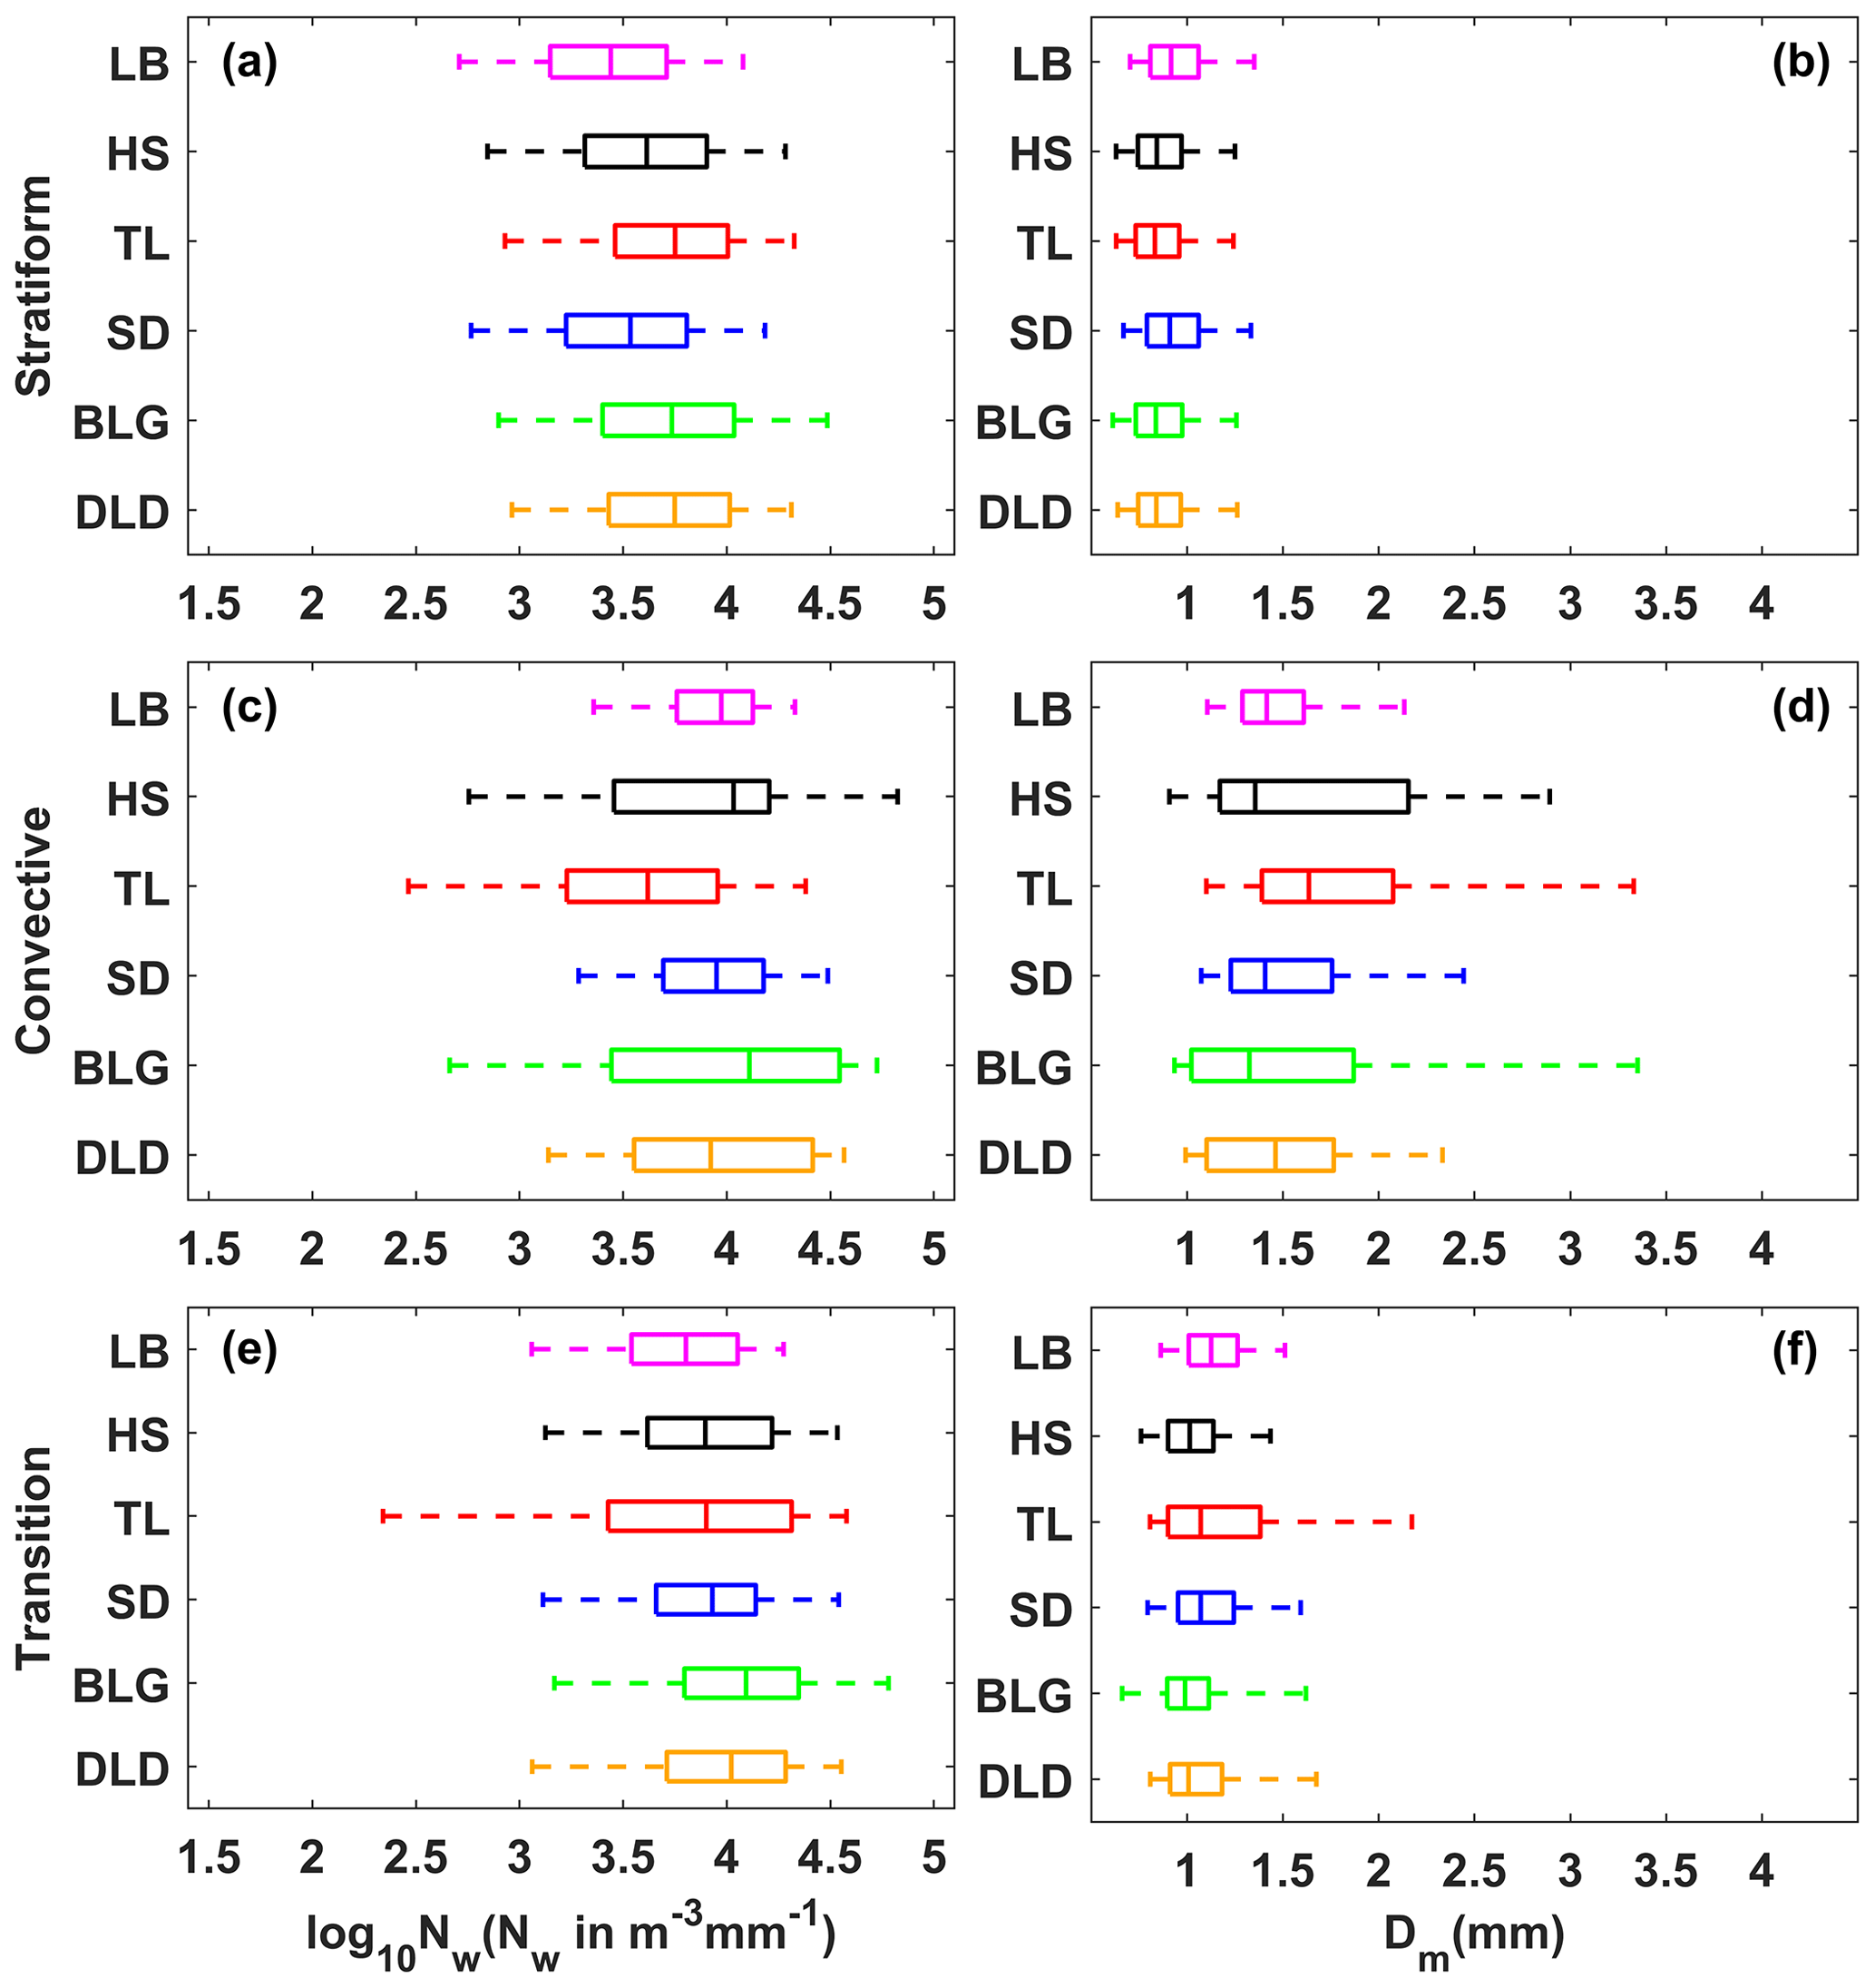
Figure 10 shows box-and-whisker plots of log10Nw and Dm for different rain types. The log10Nw and Dm of stratiform rainfall were smaller than those of convective rainfall but larger than those of transitional rainfall. Sites with a large log10Nw value range had larger value ranges for Dm, and sites with a large median log10Nw had a smaller median Dm, especially at sites HS and BLG, for convective rainfall. Based on the mean values of the six sites in Table 5, the DSD characteristics in the Qilian Mountains consist of a larger Nw and smaller Dm (compared the results of studies in other regions; see the Discussion section for details) due to the melting of tiny, compact graupel and rimed ice particles (relative to large, low-density snowflakes). Compared with transitional rainfall, the Dm of convective rainfall was obviously larger, indicating that the increase in rain rate in this area is mainly due to the growth in raindrop size. Moreover, on the northern slopes, one should consider the increase in number concentration because the log10Nw of convective rainfall also increased. Note that the number of convective samples on the northern slopes was higher than that of other sites, which corresponds to the speculation regarding the contribution of different rain rate classes. On average, for stratiform rainfall, the dispersion degrees of log10Nw and Dm at different sites were 8.3 % and 10.0 %, respectively, and for convective rainfall, it was 10.4 % and 23.4 %. The SDs of DSD parameters at sites HS and BLG were relatively large.
Table 5Statistics of several integral DSD parameters for six sites with stratiform rainfall, convective rainfall, and transitional rainfall.

3.5 Implications for radar rainfall estimation with DSD
The sixth moment of raindrop diameter is proportional to the radar reflectivity factor, and the 3.76th moment is approximately the rain rate (they can be calculated by Eqs. 4 and 5). Generally, the theoretical basis of QPE for single-polarization radar (ground-based or space-based) is the power relationship between the radar reflectivity and rainfall rate (Z=ARb). This makes the coefficients A and exponents b of the power relationship heavily dependent on the variation in DSD. Therefore, it is necessary to obtain the A and b of different sites according to different rainfall types.
Figure 11 shows the Z–R scatter plots for different sites and the fitted power-law relationships for different rainfall types. The blue and red scatter points represent stratiform and convective rainfall, respectively. The solid purple, red, and black lines indicate the Z–R relationships for stratiform, convective, and total rainfall, respectively. It shows that the Z–R scatter points for HS and BLG were relatively scattered around the 5 mm h−1 rain rate. Besides, the Z–R relationship of total rainfall underestimated the stratiform rainfall at low R values and the convective rainfall at high R values. Based on the average Z–R relationship using a least-squares method, the dispersion degree of A and b at different sites was 42.5 % and 10.7 %, respectively, which reveals that there are large differences in mountain areas.

Figure 11Scatter plots of Z (mm6 m−3) versus R (mm h−1) for three rain types at (a) LB, (b) HS, (c) TL, (d) SD, (e) BLG, and (f) DLD. The blue, red, and yellow scatter points represent stratiform, convective, and transitional cases, respectively. The purple, red, and black lines denote the Z–R relations. The blue, red, and black formula denote stratiform, convective, and total Z–R relationships. The dashed gray line indicates that r is 5 mm h−1.
In order to compare the six sites' Z–R relationships with some standard Z–R relationships, the results for Z=300R1.4 for convective rainfall commonly used in radar and Z=200R1.6 (i.e., M48) for stratiform rainfall commonly used in midlatitude areas are provided in Fig. 12. Overall, convective rainfall had smaller values of A and larger values of b than stratiform rainfall (excluding DLD). The A values of convective rainfall were smaller than the commonly used Z–R relationship, with large differences, but the b values were greater. The distribution of A and b for stratiform rainfall was relatively concentrated, with A and b ranging from 186 to 238 and from 1.3 to 1.35, respectively. The A values of stratiform rainfall were close to those of M48, and the b values were close to and smaller than the Z–R of global stratiform rainfall. Site DLD had a similar Z–R for stratiform rainfall as M48, while its convective rainfall was different from other sites, with a larger A value (twice as large as other sites) and smaller b value, which probably relates to its own local climatic influences formed in a narrow valley with higher peaks on either side relative to TL site that would cause more precipitation. In addition, it is clear that the A value of stratiform rainfall increased from the southern slopes to the northern slopes, while the opposite was the case for convective rainfall. Also, the Z–R relationships of the same section are more consistent, such as those of the interior or the northern slopes, which have distinct geographic characteristics.
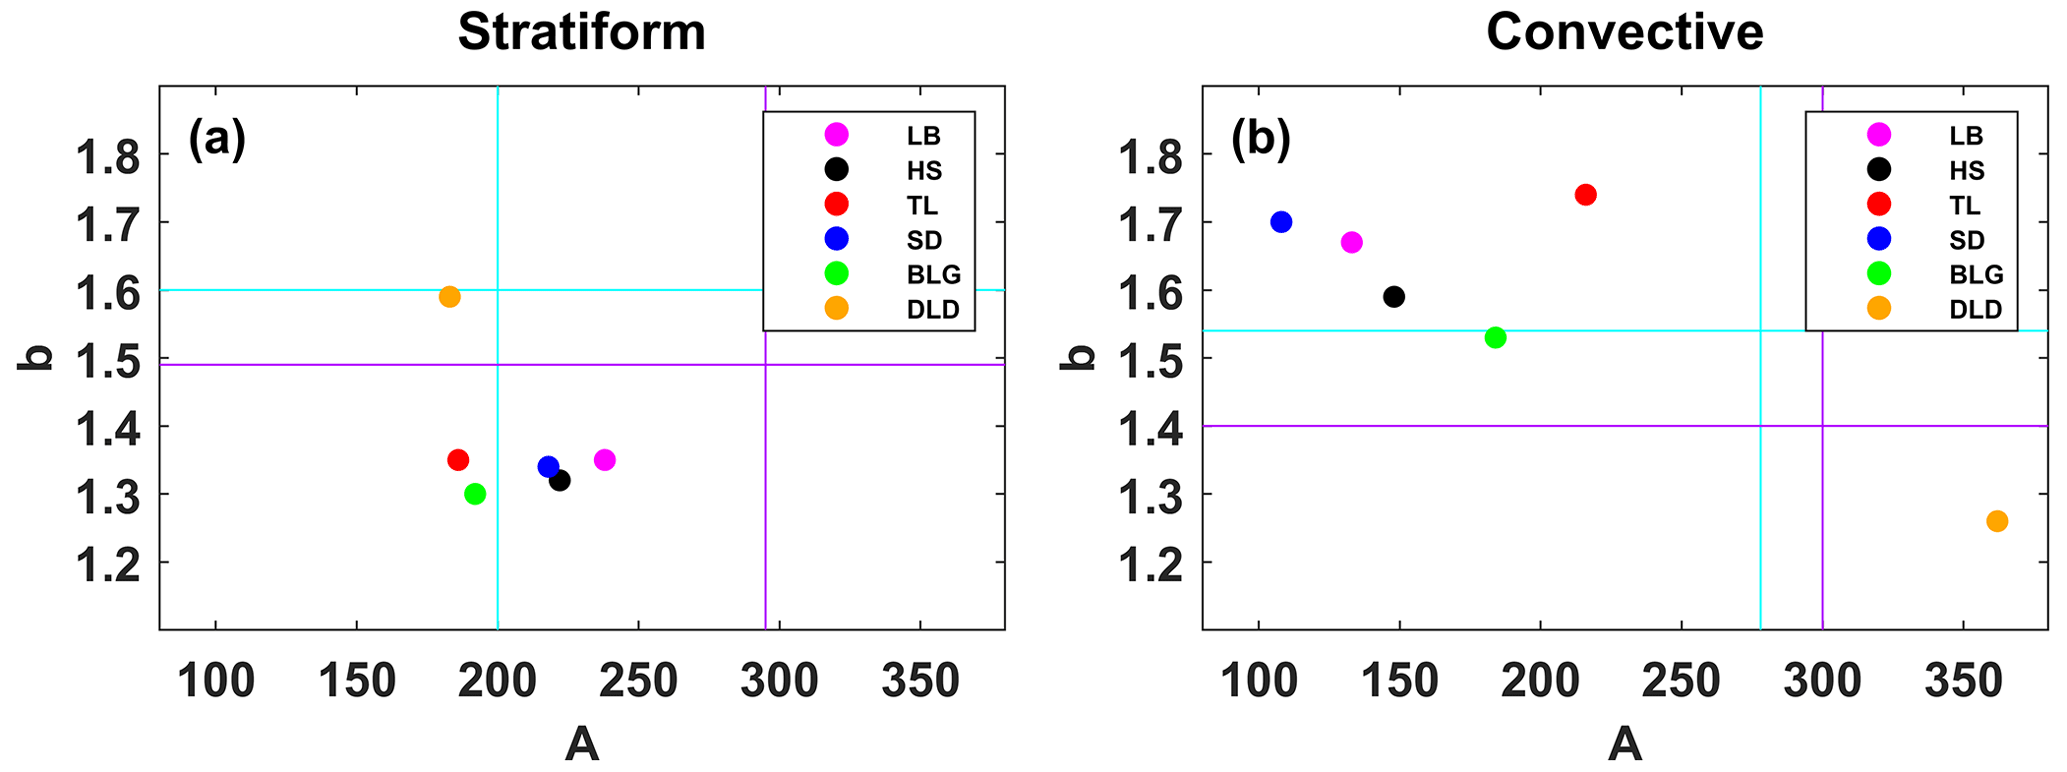
Figure 12The A and b values of the Z–R relationships for (a) stratiform rainfall and (b) convective rainfall at six sites. The purple lines in (a) and cyan lines in (b) correspond to the global Z–R model (Z=295R1.49 for continental stratiform rainfall and Z=278R1.54 for convective rainfall) (Ghada et al., 2018). The cyan lines in (a) represent the midlatitude stratiform rainfall Z–R model (Z=200R1.60, Marshall, 1948), and the purple lines in (b) represent the convective rainfall Z–R model (Z=300R1.40) applied to operational weather radar (Fulton et al., 1998).
The paper analyzes the statistical characteristics of DSD at different sites in the Qilian Mountains during the rainy season, which not only contain rainfall classes using the ideal velocity value in the calculation formula of R and rainfall types but more importantly reflect the differences between different sites. The results from different aspects can be mutually confirmed and have a good representation of the spatial distribution, serving as a strong factual basis for discussion of the microphysical structure of precipitation. For example, with the rain rate class rising, the number concentration of all size bins was increased, and the width of DSDs became wider, which manifested as convective rainfall having a larger rain rate. In spatial terms, the characteristics of precipitation in the interior of the mountains and on the southern slopes were closer, whether considering the overall DSD distribution or the distributions of DSD parameters. However, there were obvious variabilities at the interior sites for DSD parameters due to the influences of local dynamics and thermal effects. On the other hand, these characteristics also exhibited some differences between the interior and eastern sections of the Qilian Mountains, especially in the discussion of DSD parameters for rainfall classes and rainfall types (see Figs. 5 and 10). This spatial variation in DSD suggests that microphysical processes involved in the DSD are influenced by complex topography (altitude, mountain alignment) and are potentially related to the source of water vapor, development of precipitation process, and anthropogenic factors.
Compared to previous studies that focused on eastern (3.48 for log10Nw and 1.23 mm for Dm; Pu et al., 2020), southern (3.86 for log10Nw and 1.47 mm for Dm; Zhang et al., 2019), northern (3.60 for log10Nw and 1.15 mm for Dm; Y. Ma et al., 2019), and central (3.48 for log10Nw and 1.54 mm for Dm; Fu et al., 2020) China, as well the Tibetan Plateau (3.47 for log10Nw and 1.05 mm for Dm; Wang et al., 2020), the Qilian Mountains region has its own unique DSD characteristics and Z–R relationship during the rainy season, including a smaller raindrop diameter with a higher number concentration (3.69 for log10Nw and 0.94 mm for Dm). Moreover, the division of rainfall rate classes in the Qilian Mountains more adequately reflects the DSD characteristics in each class, unlike when using the classification method of other sites with larger rainfall rates. More importantly, the proposed classification of stratiform and convective rainfall can clearly distinguish between the distribution of log10Nw versus Dm in different rainfall types, for which the dividing line (slope of −1.6 and intercept of 6.008) between stratiform and convective rainfall has the same slope as the line (slope of −1.6 and intercept of 6.3) given by Bringi et al. (2003). Furthermore, according to this method, it can be proven that convective events do not belong to the continental-like cluster or maritime-like cluster, conforming to the unique precipitation characteristics of the Qilian Mountains.
As mentioned above, the characteristics of DSD mainly describe diameters larger than 0.2 mm, which is limited by the observation instruments being unable to detect small drops with diameters less than 0.2 mm. Therefore, it is not a complete DSD, and the number concentration of small drops with diameters less than 0.5 mm is underestimated. Recent studies have been devoted to improving DSD observations in order to overcome the limitations of disdrometers. A study by Thurai et al. (2017) obtained a more complete DSD by splicing 2DVD and MPS (Meteorological Particle Spectrometer) measurements to observe DSDs and developed a technology to reconstruct the drizzle-mode DSD (Raupach et al., 2019), as a result of which a good presentation of the DSD of small raindrops was provided, and important applications were highlighted.
Based on 6 months of DSD data observed over the southern slopes, northern slopes, and interior of the Qilian Mountains, the characteristics and differences of DSD were studied, and the Z–R relationships of six sites were discussed. The main conclusions can be summarized as follows:
-
For all rainfall events, the number concentrations of small and large raindrops in the interior and on the southern slopes were greater than those on the northern slopes, while midsize raindrops were less. The DSD of the interior of the mountains showed great variability, mainly in terms of the log10Nw and Dm (DSD parameters), which was quite different to the case for the northern slopes.
-
The rainfall rates were divided into six categories based on the DSD characteristics: C1, R< 0.5; C2, 2; C3, 4; C4, 6; C5, 10; and C6, > 10 mm h−1. As the rainfall rate increased, the differences in number concentration of each raindrop size became significantly larger, especially at the interior sites. Besides, classes C5 and C6 made a relatively large contribution to the northern slopes, with a greater probability of heavy-precipitation events.
-
The dispersion degree of log10Nw and Dm at the six sites was 8.3 % and 10.0 % for stratiform rainfall and 10.4 % and 23.4 % for convective rainfall, respectively. It is easier to increase the number concentration of large raindrops in the interior area of the mountains during convective rainfall. Meanwhile, there is a greater increase in the number concentration of raindrops over the northern slopes during convective rainfall.
-
The dispersion degree of coefficient A and exponent b in the Z–R relationship for the six sites were 42.5 % and 10.7 %, respectively. Overall, the Z–R relationships of the ipsilateral sites were more consistent, and the A value of stratiform rainfall increased from the southern slopes to the northern slopes, while the opposite was true for convective rainfall. The Z–R relationships in stratiform rainfall were similar and generally underestimated by the Z=200R1.6 model used for midlatitude stratiform rainfall, and the Z–R relationships for convective precipitation varied greatly at different sites, being overestimated by Z=300R1.4 at lower rain rates values and underestimated at higher rain rates values.
This study reveals the microphysical variability of precipitation over the complex topography of the arid and semi-arid regions of northwestern China, which not only improves local numerical simulations but also provides a basis for further understanding the differences in DSD characteristics formed at the mesoscale due to topographic factors, the water vapor distribution, etc. This study holds importance as a basis for the future implementation of weather modification techniques, which is of great significance in solving the shortage of water resources in the arid and semi-arid regions.
Disdrometer data used in this study can be made available by contacting the authors.
WM conducted the detailed analysis; WZ provided financial support and conceived the idea; MK collated the observation data; all the authors contributed to the writing and revisions.
The contact author has declared that none of the authors has any competing interests.
Publisher's note: Copernicus Publications remains neutral with regard to jurisdictional claims made in the text, published maps, institutional affiliations, or any other geographical representation in this paper. While Copernicus Publications makes every effort to include appropriate place names, the final responsibility lies with the authors.
Thanks are expressed to Asi Zhang for her help in discussing some questions. The authors also thank the reviewers and editors for their helpful suggestions for this study.
This research has been supported by the PhD research startup foundation of Gansu Agricultural University (grant no. GAU-KYQD-2022-38), the Weather Modification Ability Construction Project of Northwest China under (grant no. ZQC-R18208), and the Second Tibetan Plateau Comprehensive Scientific Expedition (grant no. 2019QZKK0104).
This paper was edited by Matjaz Mikos and reviewed by four anonymous referees.
Adirosi, E., Roberto, N., Montopoli, M., Gorgucci, E., and Baldini, L.: Influence of disdrometer type on weather radar algorithms from measured DSD: Application to Italian climatology, Atmosphere, 9, 360, https://doi.org/10.3390/atmos9090360, 2018.
Angulo-Martínez, M. and Barros, A. P.: Measurement uncertainty in rainfall kinetic energy and intensity relationships for soil erosion studies: An evaluation using PARSIVEL disdrometers in the Southern Appalachian Mountains, Geomorphology, 228, 28–40, 2015.
Atlas, D., Srivastava, R. C., and Sekhon, R. S.: Doppler radar characteristics of precipitation at vertical incidence, Rev. Geophys., 11, 1–35, 1973.
Bringi, V., Chandrasekar, V., Hubbert, J., Gorgucci, E., Randeu, W. L., and Schoenhuber, M.: Raindrop size distribution in different climatic regimes from disdrometer and dual-polarized radar analysis, J. Atmos. Sci., 60, 354–365, 2003.
Campos, E. F., Zawadzki, I., Petitdidier, M., and Fernandez, W.: Measurement of raindrop size distributions in tropical rain at Costa Rica, J. Hydrol., 328, 98–109, 2006.
Chen, B., Yang, J., and Pu, J.: Statistical characteristics of raindrop size distribution in the Meiyu season observed in eastern China, J. Meteorol. Soc. Jpn. Ser. II, 91, 215–227, 2013.
Dolan, B., Fuchs, B., Rutledge, S. A., Barnes, E. A., and Thompson, E. J.: Primary modes of global drop size distributions, J. Atmos. Sci., 75, 1453–1476, 2018.
Das, S. and Maitra, A.: Characterization of tropical precipitation using drop size distribution and rain rate-radar reflectivity relation, Theor. Appl. Climatol., 132, 275–286, 2018.
Fu, Z., Dong, X., Zhou, L., Cui, W., Wang, J., Wan, R., Leng, L., and Xi, B.: Statistical characteristics of raindrop size distributions and parameters in Central China during the Meiyu seasons, J. Geophys. Res.-Atmos., 125, e2019JD031954, https://doi.org/10.1029/2019JD031954, 2020.
Fulton, R. A., Breidenbach, J. P., Seo, D. J., Miller, D. A., and O'Bannon, T.: The WSR-88D rainfall algorithm, Weather Forecast., 13, 377–395, 1998.
Geoffroy, O., Siebesma, A. P., and Burnet, F.: Characteristics of the raindrop distributions in RICO shallow cumulus, Atmos. Chem. Phys., 14, 10897–10909, https://doi.org/10.5194/acp-14-10897-2014, 2014.
Ghada, W., Buras, A., Lüpke, M., Schunk, C., and Menzel, A.: Rain microstructure parameters vary with large-scale weather conditions in Lausanne, Switzerland, Remote Sens., 10, 811, https://doi.org/10.3390/rs10060811, 2018.
Giannetti, F., Reggiannini, R., Moretti, M., Adirosi, E., Baldini, L., Facheris, L., Antonini, A., Melani, S., Bacci, G., Petrolino, A., and Vaccaro, A.: Real-time rain rate evaluation via satellite downlink signal attenuation measurement, Sensors, 17, 1864, https://doi.org/10.3390/s17081864, 2017.
Gou, X., Chen, F., Yang, M., Li, J., Peng, J., and Jin, L.: Climatic response of thick leaf spruce (Picea crassifolia) tree-ring width at different elevations over Qilian Mountains, northwestern China, J. Arid Environ., 61, 513–524, 2005.
Guyot, A., Pudashine, J., Protat, A., Uijlenhoet, R., Pauwels, V. R. N., Seed, A., and Walker, J. P.: Effect of disdrometer type on rain drop size distribution characterisation: a new dataset for south-eastern Australia, Hydrol. Earth Syst. Sci., 23, 4737–4761, https://doi.org/10.5194/hess-23-4737-2019, 2019.
Han, H., Zhang, Y., Tian, J., and Kang, X.: Raindrop Size Distribution Measurements at High Altitudes in the Northeastern Tibetan Plateau during Summer, Adv. Atmos. Sci. 40, 1244–1256, 2023.
Jash, D., Resmi, E. A., Unnikrishnan, C. K., Sumesh, R. K., Sreekanth, T. S., Sukumar, N., and Ramachandran, K. K.: Variation in rain drop size distribution and rain integral parameters during southwest monsoon over a tropical station: An inter-comparison of disdrometer and Micro Rain Radar, Atmos. Res., 217, 24–36, 2019.
Jaffrain, J. and Berne, A.: Experimental quantification of the sampling uncertainty associated with measurements from PARSIVEL disdrometers, J. Hydrometeorol., 12, 352–370, 2011.
Kruger, A. and Krajewski, W. F.: Two-dimensional video disdrometer: A description, J. Atmos. Ocean. Tech., 19, 602–617, 2002.
Le Loh, J., Lee, D. I., and You, C. H.: Inter-comparison of DSDs between Jincheon and Miryang at South Korea, Atmos. Res., 227, 52–65, 2019.
Li, Z., Yuan, R., Feng, Q., Zhang, B., Lv, Y., Li, Y., Wei, W., Chen, W., Ning, T., Gui, J., and Shi, Y.: Climate background, relative rate, and runoff effect of multiphase water transformation in Qilian Mountains, the third pole region, Sci. Total Environ., 663, 315–328, 2019.
Lim, Y. S., Kim, J. K., Kim, J. W., Park, B. I., and Kim, M. S.: Analysis of the relationship between the kinetic energy and intensity of rainfall in Daejeon, Korea, Quatern. Int., 384, 107–117, 2015.
Ma, L., Zhao, L., Yang, D., Xiao, Y., Zhang, L. and Qiao, Y.: Analysis of Raindrop Size Distribution Characteristics in Permafrost Regions of the Qinghai–Tibet Plateau Based on New Quality Control Scheme, Water, 11, 2265, https://doi.org/10.3390/w11112265, 2019.
Ma, Y., Ni, G., Chandra, C. V., Tian, F., and Chen, H.: Statistical characteristics of raindrop size distribution during rainy seasons in the Beijing urban area and implications for radar rainfall estimation, Hydrol. Earth Syst. Sci., 23, 4153–4170, https://doi.org/10.5194/hess-23-4153-2019, 2019.
Marshall, J. S.: The distribution of raindrops with size, J. Meteorol., 5, 165–166, 1948.
McFarquhar, G. M., Hsieh, T. L., Freer, M., Mascio, J., and Jewett, B. F.: The characterization of ice hydrometeor gamma size distributions as volumes in N0–λ–μ phase space: Implications for microphysical process modeling, J. Atmos. Sci., 72, 892–909, 2015.
Narayana Rao, T., Kirankumar, N. V. P., Radhakrishna, B., and Narayana Rao, D.: On the variability of the shape-slope parameter relations of the gamma raindrop size distribution model, Geophys. Res. Lett., 33, L22809, https://doi.org/10.1029/2006GL028440, 2006.
Protat, A., Klepp, C., Louf, V., Petersen, W. A., Alexander, S. P., Barros, A., Leinonen, J., and Mace, G. G.: The latitudinal variability of oceanic rainfall properties and its implication for satellite retrievals: 1. Drop size distribution properties, J. Geophys. Res.-Atmos., 124, 13291–13311, 2019.
Pu, K., Liu, X., Wu, Y., Hu, S., Liu, L., and Gao, T.: A comparison study of raindrop size distribution among five sites at the urban scale during the East Asian rainy season, J. Hydrol., 590, 125500, https://doi.org/10.1016/j.jhydrol.2020.125500, 2020.
Penide, G., Protat, A., Kumar, V. V., and May, P. T.: Comparison of two convective/stratiform precipitation classification techniques: Radar reflectivity texture versus drop size distribution–based approach, J. Atmos. Ocean. Tech., 30, 2788–2797, 2013.
Qin, Y., Lei, H., Yang, D., Gao, B., Wang, Y., Cong, Z., and Fan, W.: Long-term change in the depth of seasonally frozen ground and its ecohydrological impacts in the Qilian Mountains, northeastern Tibetan Plateau, J. Hydrol., 542, 204–221, 2016.
Rincon, R. F. and Lang, R. H.: Microwave link dual-wavelength measurements of path-average attenuation for the estimation of drop size distributions and rainfall, IEEE T. Geosci. Remote, 40, 760–770, 2002.
Raupach, T. H., Thurai, M., Bringi, V. N., and Berne, A.: Reconstructing the drizzle mode of the raindrop size distribution using double-moment normalization, J. Appl. Meteorol. Clim., 58, 145–164, 2019.
Seela, B. K., Janapati, J., Lin, P. L., Reddy, K. K., Shirooka, R., and Wang, P. K.: A comparison study of summer season raindrop size distribution between Palau and Taiwan, two islands in western Pacific, J. Geophys. Res.-Atmos., 122, 11787–711805, 2017.
Smith, J. A., Hui, E., Steiner, M., Baeck, M. L., Krajewski, W. F. and Ntelekos, A. A.: Variability of rainfall rate and raindrop size distributions in heavy rain, Water Resour. Res., 45, W04430, https://doi.org/10.1029/2008WR006840, 2009.
Thurai, M., Gatlin, P. N., and Bringi, V. N.: Separating stratiform and convective rain types based on the drop size distribution characteristics using 2D video disdrometer data, Atmos. Res., 169, 416–423, 2016.
Thurai, M., Gatlin, P., Bringi, V. N., Petersen, W., Kennedy, P., Notaroš, B., and Carey, L.: Toward completing the raindrop size spectrum: Case studies involving 2D-video disdrometer, droplet spectrometer, and polarimetric radar measurements, J. Appl. Meteorol. Clim., 56, 877–896, 2017.
Testud, J., Oury, S., Black, R. A., Amayenc, P., and Dou, X.: The concept of “normalized” distribution to describe raindrop spectra: A tool for cloud physics and cloud remote sensing, J. Appl. Meteorol. Clim., 40, 1118–1140, 2001.
Tian, H., Yang, T., and Liu, Q.: Climate change and glacier area shrinkage in the Qilian mountains, China, from 1956 to 2010, Ann. Glaciol., 55, 187–197, 2014.
Tokay, A., Wolff, D. B., and Petersen, W. A.: Evaluation of the New Version of the Laser-Optical Disdrometer, OTT Parsivel2, J. Atmos. Ocean. Tech., 31, 1276–1288, 2014.
Ulbrich, C. W.: Natural variations in the analytical form of the raindrop size distribution, J. Clim. Appl. Meteorol., 22, 1764–1775, 1983.
Wainwright, C. E., Dawson, D. T., Xue, M., and Zhang, G.: Diagnosing the intercept parameters of the exponential drop size distributions in a single-moment microphysics scheme and impact on supercell storm simulations, J. Appl. Meteorol. Clim., 53, 2072–2090, 2014.
Wang, Y., Zheng, J., Cheng, Z., and Wang, B.: Characteristics of Raindrop Size Distribution on the Eastern Slope of the Tibetan Plateau in Summer, Atmosphere, 11, 562, https://doi.org/10.3390/atmos11060562, 2020.
Wu, Y. and Liu, L.: Statistical characteristics of raindrop size distribution in the Tibetan Plateau and southern China, Adv. Atmos. Sci., 34, 727–736, 2017.
Yang, L., Smith, J., Baeck, M. L., Smith, B., Tian, F., and Niyogi, D.: Structure and evolution of flash flood producing storms in a small urban watershed, J. Geophys. Res.-Atmos., 121, 3139–3152, 2016.
Zhang, A., Hu, J., Chen, S., Hu, D., Liang, Z., Huang, C., Xiao, L., Min, C., and Li, H.: Statistical characteristics of raindrop size distribution in the monsoon season observed in southern China, Remote Sens., 11, 432, https://doi.org/10.3390/rs11040432, 2019.
Zhao, P., Li, Y., Guo, X., Xu, X., Liu, Y., Tang, S., Xiao, W., Shi, C., Ma, Y., Yu, X., Liu, H., Jia, L., Chen, Y., Liu, Y., Li J., Luo, D., Cao, Y., Zheng, X., Chen, J., Xiao, A., Yuan, F., Chen, D., Pang, Y., Hu, Z., Zhang, S., Dong, L., Hu, J., Han, S., and Zhou, X.: The Tibetan Plateau surface-atmosphere coupling system and its weather and climate effects: The Third Tibetan Plateau Atmospheric Science Experiment, J. Meteorol. Res.-Prc., 33, 375–399, 2019.
Zeng, Y., Yang, L., Tong, Z., Jiang, Y., Zhang, Z., Zhang, J., Zhou, Y., Li, J., Liu, F., and Liu, J.: Statistical Characteristics of Raindrop Size Distribution during Rainy Seasons in Northwest China, Adv. Meteorol., 2021, 1–12, 2021.