the Creative Commons Attribution 4.0 License.
the Creative Commons Attribution 4.0 License.
 | 17 Jan 2023
A comprehensive open-source course for teaching applied hydrological modelling in Central Asia
Beatrice Sabine Marti
Aidar Zhumabaev
Tobias Siegfried
Numerical modelling is often used for climate impact studies in water resources management. It is, however, not yet highly accessible to many students of hydrology in Central Asia. One big hurdle for new learners is the scripting requirement for the preparation of relevant data prior to the actual modelling. We present a robust, open-source workflow and comprehensive teaching material that aim at bridging the gap between theoretical hydrological modelling know-how and applied modelling for climate impact studies in Central Asia. The teaching material has been refined over 2 consecutive years and is being taken up by several professors teaching hydrological modelling in Central Asia.
- Article
(4629 KB) - Full-text XML
- BibTeX
- EndNote


As sustainable water resources management will be ever more demanding in a changing world, the general need to strengthen the education of future water resources specialists does not subside (Vincent-Lancrin, 2009). Teaching future leaders in water resources management about hydrological modelling strengthens their capacity to find answers to the present and future challenges in using hydrological models effectively for decision making (Seibert and Vis, 2012; Wagener et al., 2012).
The Central Asian water sector is especially vulnerable to suffering from climate change impacts, and there is not yet sufficient local capacity to adequately deal with the present and upcoming challenges (Abdullaev and Rakhmatullaev, 2016b). Much of the hydrological modelling work is currently done by foreign experts with sometimes questionable quality and limited transfer to local experts (Abdullaev and Rakhmatullaev, 2016a). Traditionally, Central Asian National Meteorological and Hydrological Services (CA NMHS) (organisations responsible for seasonal forecasts of water availability, among other tasks) rely on time series of station data for their predictions (Unger-Shayesteh et al., 2013), but the use of numerical models to support forecasts is increasingly researched (Gerlitz et al., 2020). Further, the collection and processing of hydrology-relevant data is the basis for robust modelling, and capacities are being built up in Central Asia (Abdullaev and Rakhmatullaev, 2014). Thereby, the focus is not only on station data but also on remote sensing and re-analysis products. Modelling efforts might thus support the closing of knowledge gaps in linking observed runoff changes to climatic and cryospheric changes in many headwater basins in Central Asia (Unger-Shayesteh et al., 2013).
Considerable efforts are put into the preparation of teaching resources by hydrologists worldwide, and sharing platforms have been established to facilitate teaching. Examples are HydroShare (CUAHSI, 2022) and MOCHA (Wagener et al., 2012). Also worth mentioning is the Open Global Glacier Model Edu site, which provides ample resources for teaching glacier dynamics modelling (OGGM Consortium, 2022) or airGR (Coron et al., 2017), an open-source conceptual hydrological model which comes with elaborate online teaching functionality. In recent years, numerical modelling exercises are increasingly shared in the teaching community (e.g. Knoben and Spieler, 2022; Seibert and Vis, 2012). However, the focus lies on general hydrology or US hydrology, and comprehensive material on Central Asian hydrology is not readily available.
The aims of this paper are as follows: (1) to present a reproducible workflow for hydrological modelling for climate impact studies in Central Asia, and (2) to provide open-source materials for teaching this workflow to students of hydrology and water resources management. The workflow and materials have been developed for a 2-week block course on applied hydrological modelling at the German–Kazakh University (DKU) in Almaty.
Course participants understand the most important hydrological processes at the regional scale that are relevant in Central Asia and how future changes in climate and land use may impact their societies. They understand the differences between empirical, conceptual, and physical hydrological models; the data requirements and properties of these model types; and the advantages and disadvantages of these model types. They know how such models are applied in the region by the CA NMHS for the reduction of risks from hydrological extremes and for improved water resources management for reservoir operations and irrigation scheduling. Course participants further know where to find high-quality, publicly available data and can use open-source software effectively for catchment characterisation. They can use software to implement a hydrological model of a catchment, and they apply state-of-the art procedures to calibrate and validate a hydrological model. Last but not least, course participants can use hydrological models to simulate the impact of climate change on the discharge of a basin and present it to a scientific community.
The master's-level course requires basic understanding of mathematics and computer skills. Prior knowledge of hydrology and of the statistical programming languages R and QGIS are an advantage. Participation in the course requires a personal computer not older than about 5 years running Windows 10 or 11. All data to reproduce the examples in the online course book are available online (see the “Code and data availability” section). However, the bulk download requires approximately 36 GB of free storage space. If storage space is an issue, it is recommended that one download only the data required for selected examples or exercises.
To ensure free access to the course material for all interested people, open-source and/or open-access software has been used in this course where possible. The required software includes the statistical programming language R version 4.2.1 (R Core Team, 2022), which is accessed through the graphical user interface RStudio (version 2022.07.1) (RStudio Team, 2022), and QGIS 3.24 (QGIS Development Team, 2022), with utilities of SAGA (Conrad et al., 2015) and GRASS (GRASS Development Team, 2022). If suitable software was not available, open-source, free, publicly available software was chosen, i.e. the hydraulic hydrological modelling software RS MINERVE (version 2.9.1.0) (Roquier et al., 2021). RS MINERVE implements the models HBV (Bergström, 1976) and GSM (Schaefli et al., 2005), among others. RS Minerve runs on Windows OS only.
The course book is written using the Quarto authoring system (Quarto Development Team, 2022) and includes numerous code examples that facilitate the uptake of scripting skills for hydrological modelling. It is hosted publicly on GitHub and is rendered via GitHub pages (https://github.com/hydrosolutions/caham_book, last access: 16 January 2023). Readers can post issues directly on the GitHub Issues tracker. Apart from facilitated editing, the browser-based rendering has the advantage of automatic translation options available in many internet browsers nowadays.
The R package riversCentralAsia (Marti and Siegfried, 2022) was developed to support data-processing tasks.
Moodle (Moodle project, 2022) was available from DKU for course administration and for depositing course material and video recordings of the lectures for the students. Lectures took place online via Zoom (Zoom Video Communications, Inc., 2022).
All data used in the course can either be downloaded through public links in the course book or from public sources. Discharge monitoring locations and discharge time series at decadal (10 d) or monthly intervals for Kazakh, Kyrgyz, Tajik, and Uzbek river basins are available from Hydrological Yearbook data (Uzbekhydromet, 2022).
Glacier outlines from the Randolph Glacier Inventory v6.0 (RGI) (RGI Consortium, 2017) were used to estimate glaciated areas of basins and glacier volumes. Glacier thinning rates (Hugonnet et al., 2021) and glacier ablation rates (Miles et al., 2021) were used to manually calibrate the GSM model for glacier discharge. Estimates of the daily snow water equivalent (SWE) between 2000 and 2011 from the High Mountain Snow Reanalysis product (Liu et al., 2021b) were used for model calibration.
The NASA SRTM digital elevation model 1 arcsec (30 m) global product is used as a DEM (NASA JPL, 2013). Land cover information can be obtained from the Copernicus Global Land Service: Land Cover 100 m: collection 3: epoch 2019: Globe data (Buchhorn et al., 2020). For basin characterisation, we use the CHELSA v2.1 climatologies (Karger et al., 2017) available for the periods 1981–2010, 2011–2040, 2041–2070, and 2071–2100. As the monitoring network in the Central Asia high mountain region is sparse (Unger-Shayesteh et al., 2013), bias-corrected re-analysis data are often used to drive hydrological models (e.g. Siegfried et al., 2012; Didovets et al., 2021; Khanal et al., 2021). The course uses the CHELSA v2.1 data set (Karger et al., 2017, 2021b) at a high resolution, which contains daily precipitation and temperature time series at 1 km grid resolution globally between January 1979 and December 2011. CHELSA v2.1 time series are derived from the ERA5 re-analysis collection but perform better in mountainous regions because they are corrected for elevation biases (Beck et al., 2020). Future climate projections are downloaded for four shared socio-economic development pathways (SSP) (Riahi et al., 2017), namely SSP1, SSP2, SSP3, and SSP5, for the four global circulation models (GCM) with the highest priorities according to the ISIMIP3b protocol (ISIMIP3 consortium, 2022) in the Coupled Model Inter-comparison Project (CMIP) phase 6, namely GFDL-ESM4 (Krasting et al., 2018), IPSL-CM6A-LR (Boucher et al., 2018), MRI-ESM2.0 (Yukimoto et al., 2019), and UKESM1.0-LL (Tang et al., 2019). The GCM model results are downscaled to the CHELSA v2.1 data using quantile mapping (Gudmundsson, 2016). Four climate change scenarios, represented by four GCM models each, are thus available for model forcing.
In a fast-evolving world, novel data sets describing weather or snow conditions, for example, or more powerful software solutions become available at ever higher quality and frequency, requiring an adaptation of previously established workflows. The present modelling workflow for climate impact studies in Central Asian headwater basins (see Fig. 1) was developed in 2021 and was updated in 2022.
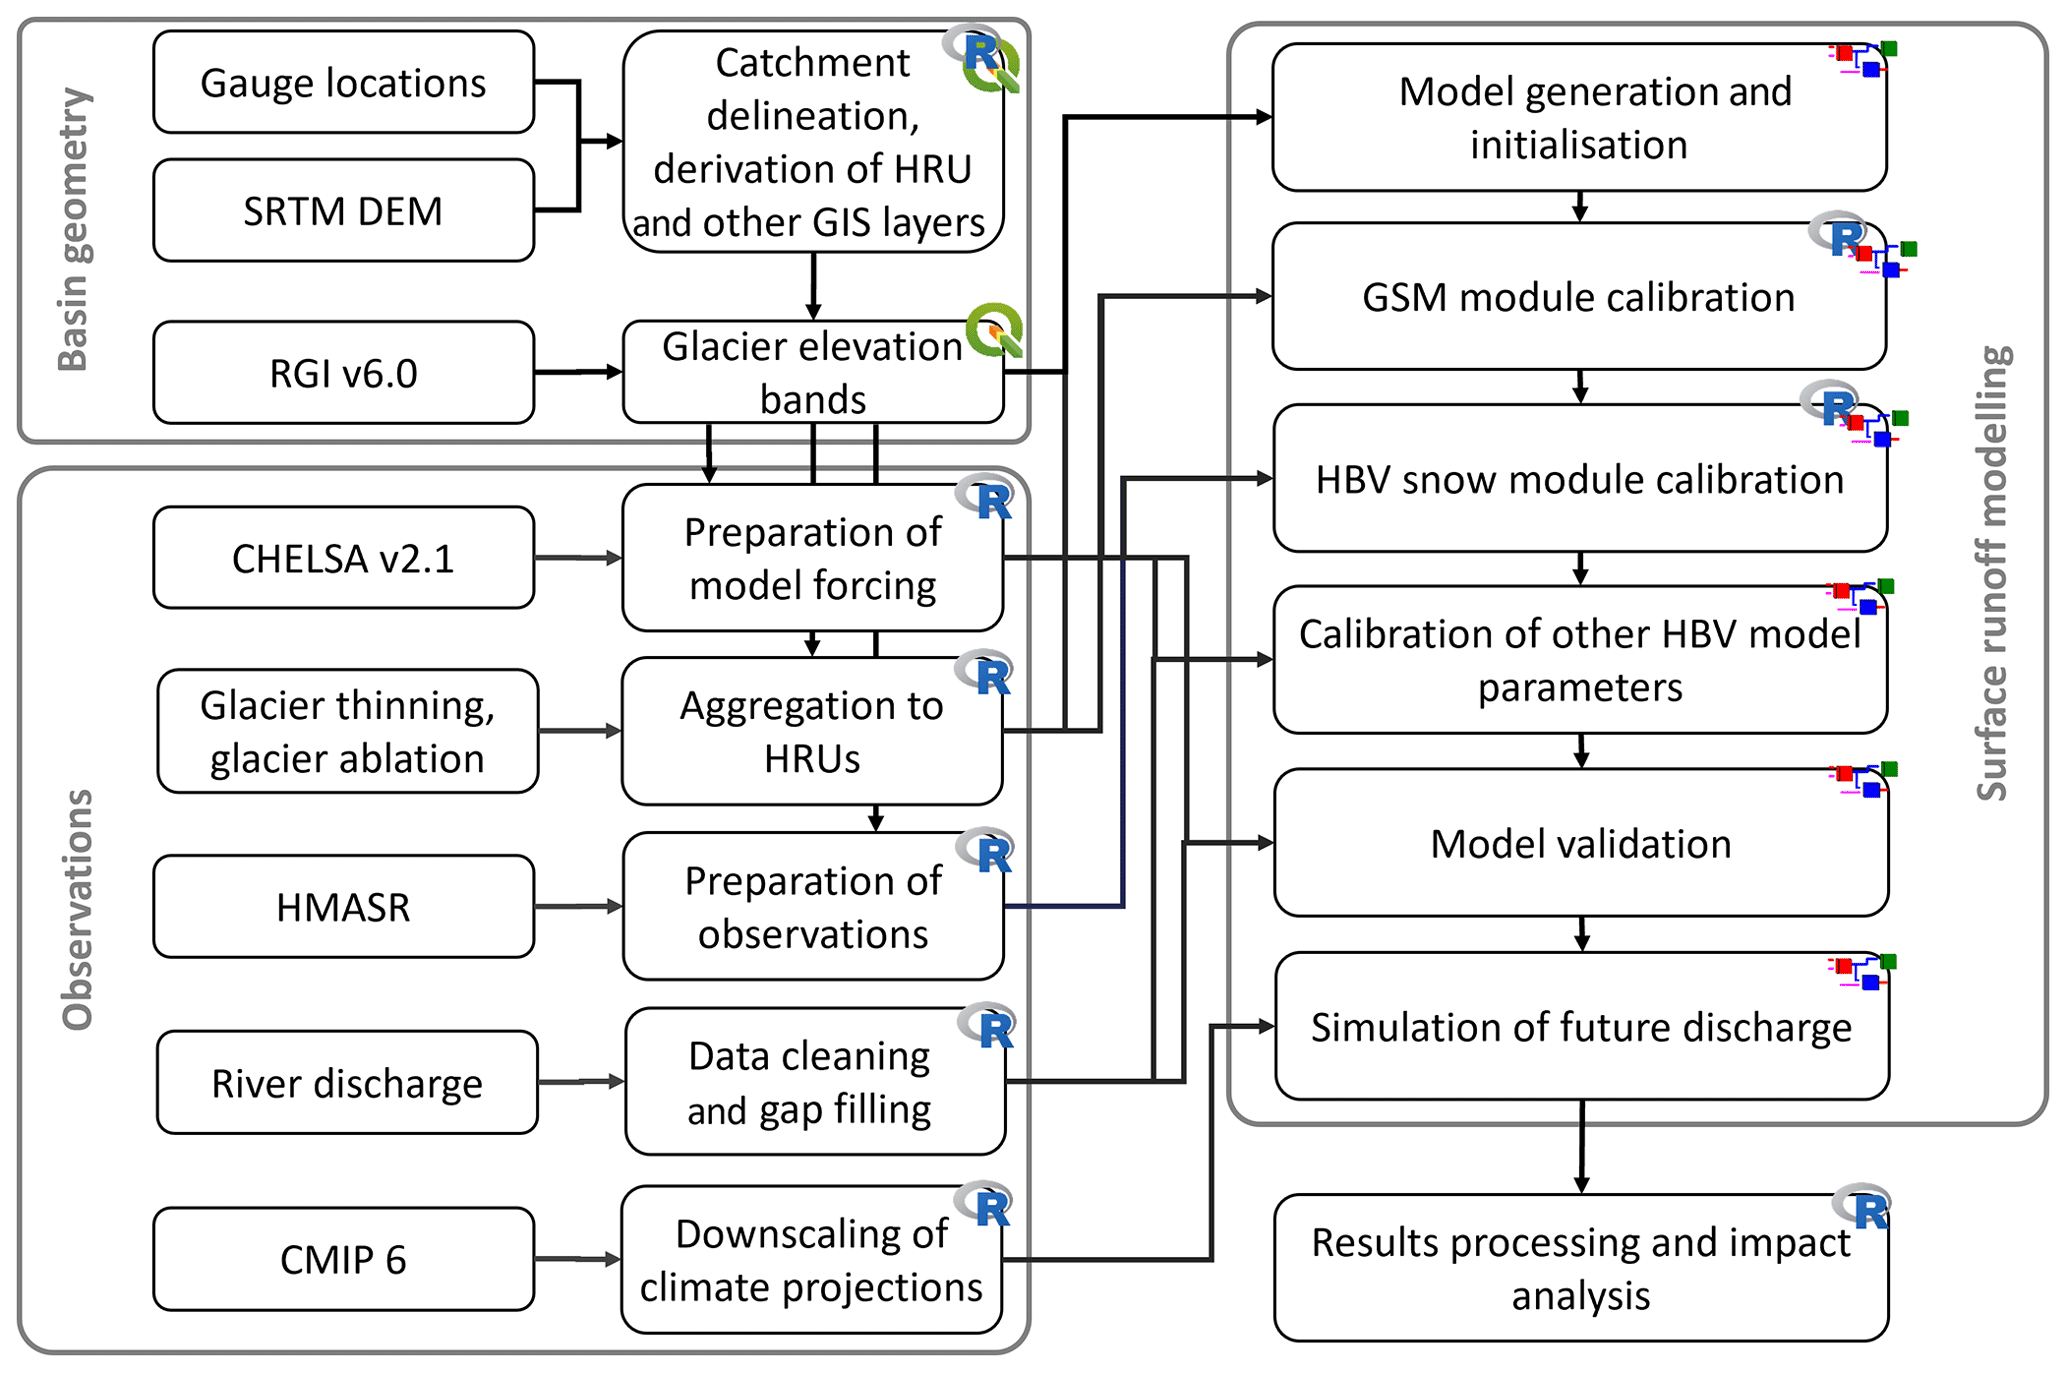
Figure 1Model chain for CMIP 6 climate impact analysis. The data sources and data preparation and modelling steps are described in Sect. 6.
6.1 Data pre-processing
One of the biggest hurdles to hydrological modelling is choosing and processing of the required data. This course therefore deliberately starts with the data preparation process and not directly with the hydrological modelling.
6.1.1 Discharge
The first step of the modelling process involves the review of the discharge data. Data gaps are filled with the long-term norm discharge of the respective time period. Basic discharge characteristics (average annual discharge, mean specific discharge) are computed. The R package riversCentralAsia has a number of functions to facilitate discharge characterisation (for example, the aggregation of time series data to warm and cold seasons and to hydrological years or automated plots of deviations from norm discharge). Discharge data are formatted and printed in an RS MINERVE-readable format.
6.1.2 Geospatial data
RS MINERVE features a GIS environment which can be used for semi-automated model generation. This feature speeds up the model implementation for regional models with a large number of hydrological response units (HRU). This feature requires the preparation of consistent GIS layers for HRU, river segments, and river junctions (Roquier et al., 2022). This section describes how geospatial data, namely digital elevation models (DEMs) and gauge location, are processed to derive the GIS layers for semi-automated model generation.
The DEM (NASA JPL, 2013) is run through the GRASS GIS (GRASS Development Team, 2022) “r.fill.dir” sink-filling algorithm (Jenson and Domingue, 1988) implemented in QGIS (QGIS Development Team, 2022). Using the geo-location of the discharge gauge (obtained from Uzbekhydromet, 2022, and manually validated) the catchment boundary is determined using the r.watershed and the r.water.outlet algorithms, and the resulting raster layer of the catchment area is converted to a polygon (step-by-step instructions are available in the course book under the section “Geospatial data”, “Catchment delineation”).
Hydrological response units (HRUs) are often used in semi-distributed conceptual hydrological models (Pilz et al., 2017). HRUs represent zones of similar run-off formation processes (Flügel, 1995). Depending on which hydrological processes are dominant, HRUs are derived based on basin geology, land use, topography, or a combination of the aforementioned. In mountainous areas in Central Asia, river discharge is dominated by snow melt and overland flow processes and a derivation of HRUs based on landscape topography, i.e. elevation was chosen. The derivation of elevation-based HRUs is done with the Reclassify by Table algorithm applied to the sink-filled DEM in QGIS. Elevation intervals of 200 m are chosen. The resulting raster is subsequently polygonised to obtain a vector layer. The fields of the resulting HRU layer have to be adapted to contain consistent entries for import to RS MINERVE.
If glaciers are present in the basin, the glacier area is intersected with the HRUs area because glacier discharge will be implemented as GSM model objects for each glaciated elevation band in RS MINERVE. To reduce the number of model objects, glacier volume and area are aggregated per elevation band in the HRU layer.
The SAGA GIS (Conrad et al., 2015) algorithm Channel Network and Drainage Basins implemented in QGIS is used to derive the GIS layers for river sections and junctions required for semi-automated model generation in RS MINERVE. The algorithm uses the parameter “River Network Level” to determine the resolution of the resulting river network. Iterative manual adjustment of the parameter leads to the desired resolution of the river network. Manual post-processing of the resulting river and junction layers is necessary to remove springs (in the junction layer) and to edit the attribute table for import to RS MINERVE.
For teaching in the short block course, basins are simplified to one junction (the outflow junction) to which all HRU connect. River routing is not covered. The course book, however, does cover the implementation of hydrological models with sub-basins in the examples. The derivation of the sub-basins layer is done using the SAGA algorithms Flow Accumulation, Channel Network, and Watershed Basins. The Channel Network cutoff value is a parameter determining the level of detail in the sub-basin layer. Iterative adjustment of the parameters may be necessary to achieve satisfactory sub-basins which are consistent with the junctions and river layer. The resulting sub-basins layer has to be intersected with the HRU layer to obtain HRUs for each sub-basin.
A QGIS model which is compatible with QGIS version 3.24 and which is available in the student case study pack has been implemented. The derivation of HRUs can, however, also be done using the function gen_basinElevationBands of the riversCentralAsia package (Marti and Siegfried, 2022).
6.1.3 Climate data
Daily average temperature and precipitation for each HRU are extracted from the CHELSA v2.1 time series (Karger et al., 2021a) and reformatted for import to an RS MINERVE database using the function gen_HRU_Climate_CSV_RSMinerve of the R package riversCentralAsia. The CHELSA v2.1 data set between 1 January 1979 and 31 December 2011 serves as observation data.
Projected climate data of SSP1, SSP2, SSP3, and SSP5 (Riahi et al., 2017) and four GCM projections for temperature and precipitation (Krasting et al., 2018; Boucher et al., 2018; Yukimoto et al., 2019; Tang et al., 2019) are pre-processed and also extracted for each HRU. Climate projections are downscaled to the basin using quantile mapping (Gudmundsson, 2016), whereby the CHELSA v2.1 time series serve as reference observation data. Also, climate projections are written to RS MINERVE readable files.
6.2 Hydrological modelling
Having covered all the data pre-processing steps, the semi-automatic model generation in RS MINERVE is used to implement the hydrological model. Detailed step-by-step instructions are given in the course book (Siegfried and Marti, 2022b). The non-glaciated HRUs are assigned HBV (Bergström, 1976) model objects, and the glaciated HRUs are assigned GSM Schaefli et al. (2005) model objects. Evaporation is calculated by RS MINERVE using the Turc method (Roquier et al., 2022).
Because the historical observation period between 1979 and 2011 is relatively short, initial conditions are estimated using a model spin-up of the observation period. For subsequent simulations, a spin-up period of 1 year is implemented to reduce the impact of possibly sub-optimal initial conditions. The calibration period is set to the years 2000 to 2011 to take advantage of the availability of glacier elevation change (Hugonnet et al., 2021), glacier ablation (Miles et al., 2021) and SWE data from the HMASR data set (Liu et al., 2021a). The validation period is set to 1980 to 2000.
The calibration process is started with one parameter set for the entire model. That means that we do not initially allow for different parameter values in the HRU. If acceptable model performance cannot be achieved in this way, a zonation is applied, allowing, for example, for larger groundwater storage in the HRUs in the valley bottoms or for lower snow melt rates at very high elevations. Care is taken to avoid over-parameterisation. RS MINERVE allows a very flexible composition of the objective function: multiple model performance indicators are available which can be linearly combined with user-selected weights (Roquier et al., 2022). In the suggested workflow, the calibration process is started with an equal weight of the general performance indices Nash efficiency and root-mean-squared error. Should it become apparent in subsequent calibration cycles that, for example, minimum flows are not well represented, the optimisation function is adapted to better-suited indices like, for example, in the case of low flows, the logarithmic Nash efficiency.
The parameters of GSM model objects are calibrated manually by comparing simulated changes in glacier thickness to observed changes in glacier thickness by Hugonnet et al. (2021), aggregated per elevation band. We further compare simulated glacier discharge rates with RS MINERVE to simulated glacier ablation rates provided by Miles et al. (2021). As the GSM model implemented in RS MINERVE assumes an infinite glacier reservoir to melt from, the modeller has to manually set glacier melt to zero when the glacier volume becomes zero, i.e. when the glacier has melted. For simple, linear models, this can be done as a post-processing step. In more complex models, the hydrological model has to be stopped at regular time intervals to turn off glacier melt if necessary.
The parameters of the snow modules of the HBV model objects are calibrated using the HMASR SWE product (Liu et al., 2021a). As RS MINERVE currently does not support automated calibration for SWE, manual calibration is done.
Calibration subsequently proceeds from the soil humidity reservoir to the upper soil reservoir and finally to the lower soil reservoir. Only discharge at the outlet point is available to constrain parameters of these three HBV reservoirs in all HRUs.
The validation period is used to verify the ability of the hydrological model to simulate discharge produced with hitherto unseen forcing. Resulting parameters are compared to the literature.
6.3 Scenario analysis
The calibrated model is now used to perform simulations of river discharge under the 16 climate change scenarios (4 GCM, 4 SSP). Simulation results are aggregated to 20-year-average hydrographs of today (2000–2020), the middle of the century (2040-2060), and the end of the century (2080–2100) for each SSP.
The learning goals are structured into theoretical components where students learn the basic concepts required for modelling and applied components where students learn hands-on how to implement a hydrological model. Students thereby follow the above-described modelling workflow, which is described in higher detail also in the course book (Siegfried and Marti, 2022b).
7.1 Modus operandi
Due to travel restrictions, the course was planned as an intensive 8 d online block course for master's students of integrated water resources management at the German–Kazakh University (DKU) in Almaty. The course was taught remotely in spring 2021 and 2022 as an elective module at DKU for groups of approximately 12 students each. Two training-of-trainer courses were conducted in Spring 2022 for course transfer. A total of 25 academic staff from 19 Central Asian higher education institutions attended the training.
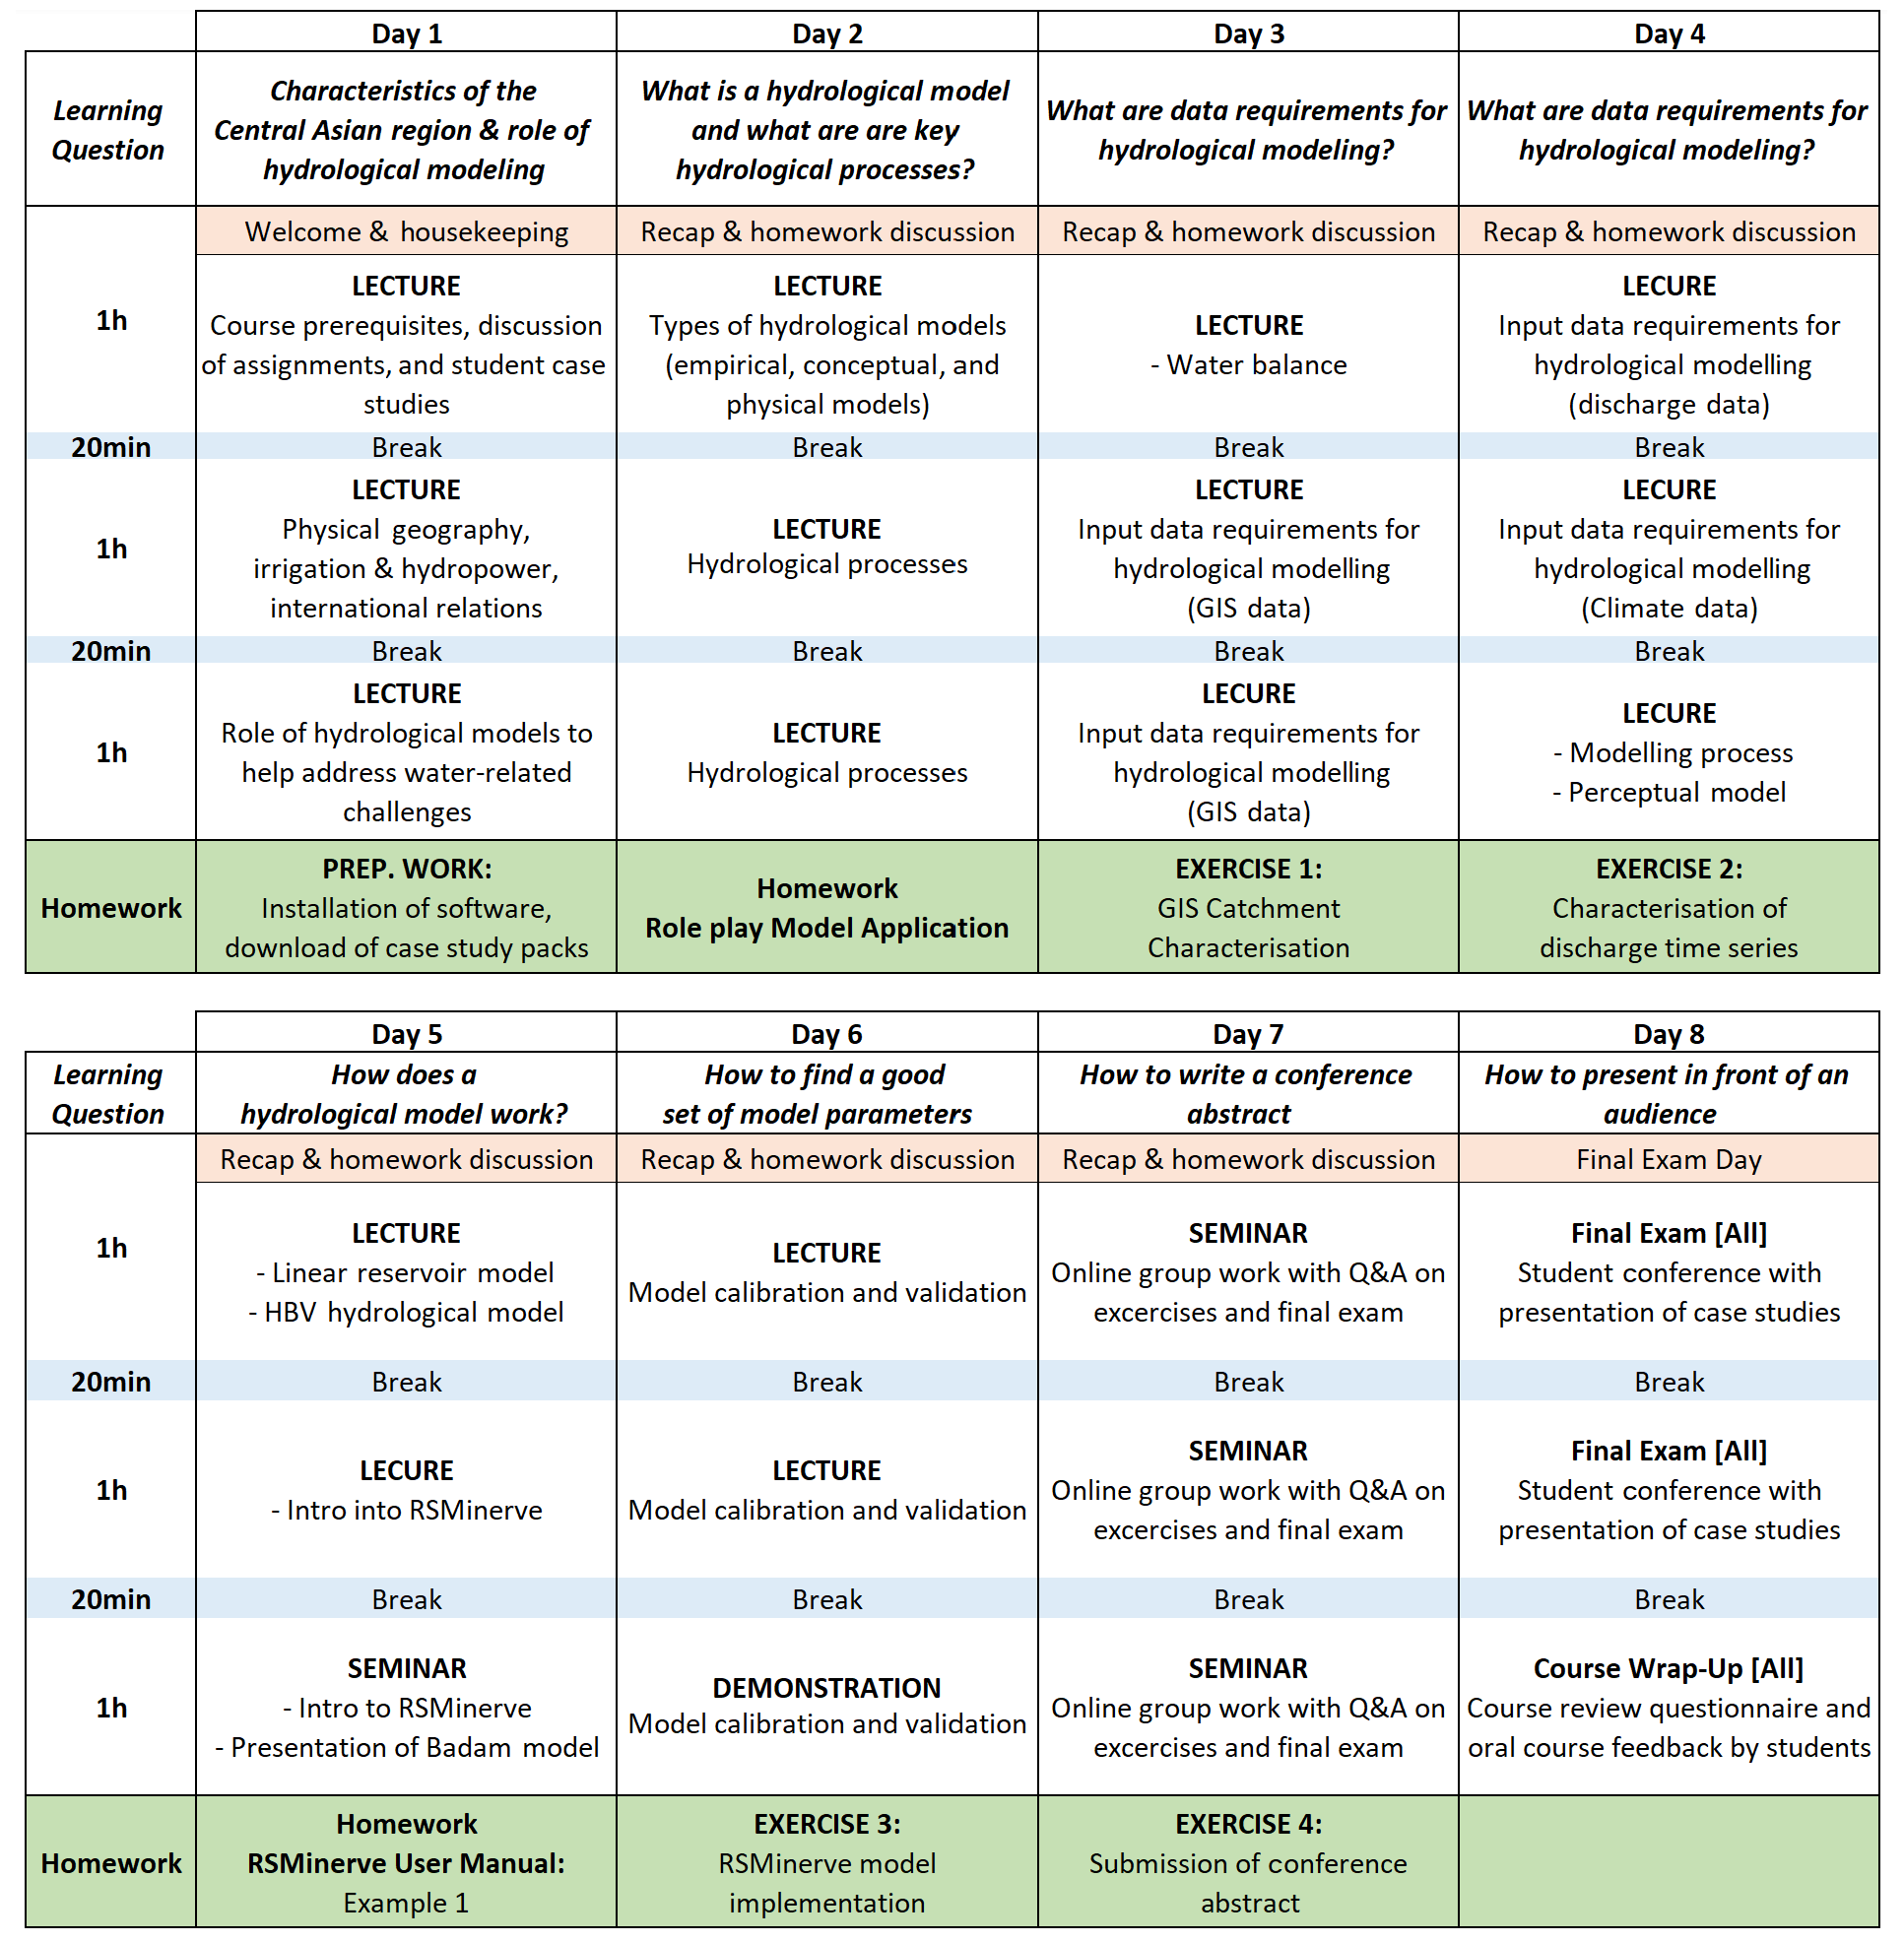
The course will continue to be taught at DKU by a local scientific expert who participated in the students' course twice. The course schedule consists of three lessons of 1 h each, consisting of daily lectures, exercise discussions, and case study presentations. The students have been asked to do daily homework, including four graded exercises which, together with the individual course participation and a final exam, form the final grade for the course. Figure 2 shows the course schedule for the 8 d block teaching. In the first teaching round, a seminar with representatives from the private industry and the Central Asian Hydromets were invited to present the use of hydrological modelling in their work. This seminar was very well received. A regional holiday did unfortunately not allow for such a seminar in the second course, and it is not visible in the schedule in Fig. 2. The individual course modules are described in more detail in the following sections.
7.2 Data management
The data required for students to achieve the course requirements are made available online in a Dropbox repository (Siegfried and Marti, 2022a). Students have access to data to reproduce the examples provided in the course book and for modelling a case study basin. The below section describes how the data are organised.
7.2.1 Student case study packs
Students work in groups of two on one of eight case study basins in Central Asia (Chon Kemin, Ala Archa, Nauvalisoy, Pskem, Chatkal, Isfayramsoy, Sokh, and Gunt from north to south in Fig. 3) for which data and code snippets have been prepared.
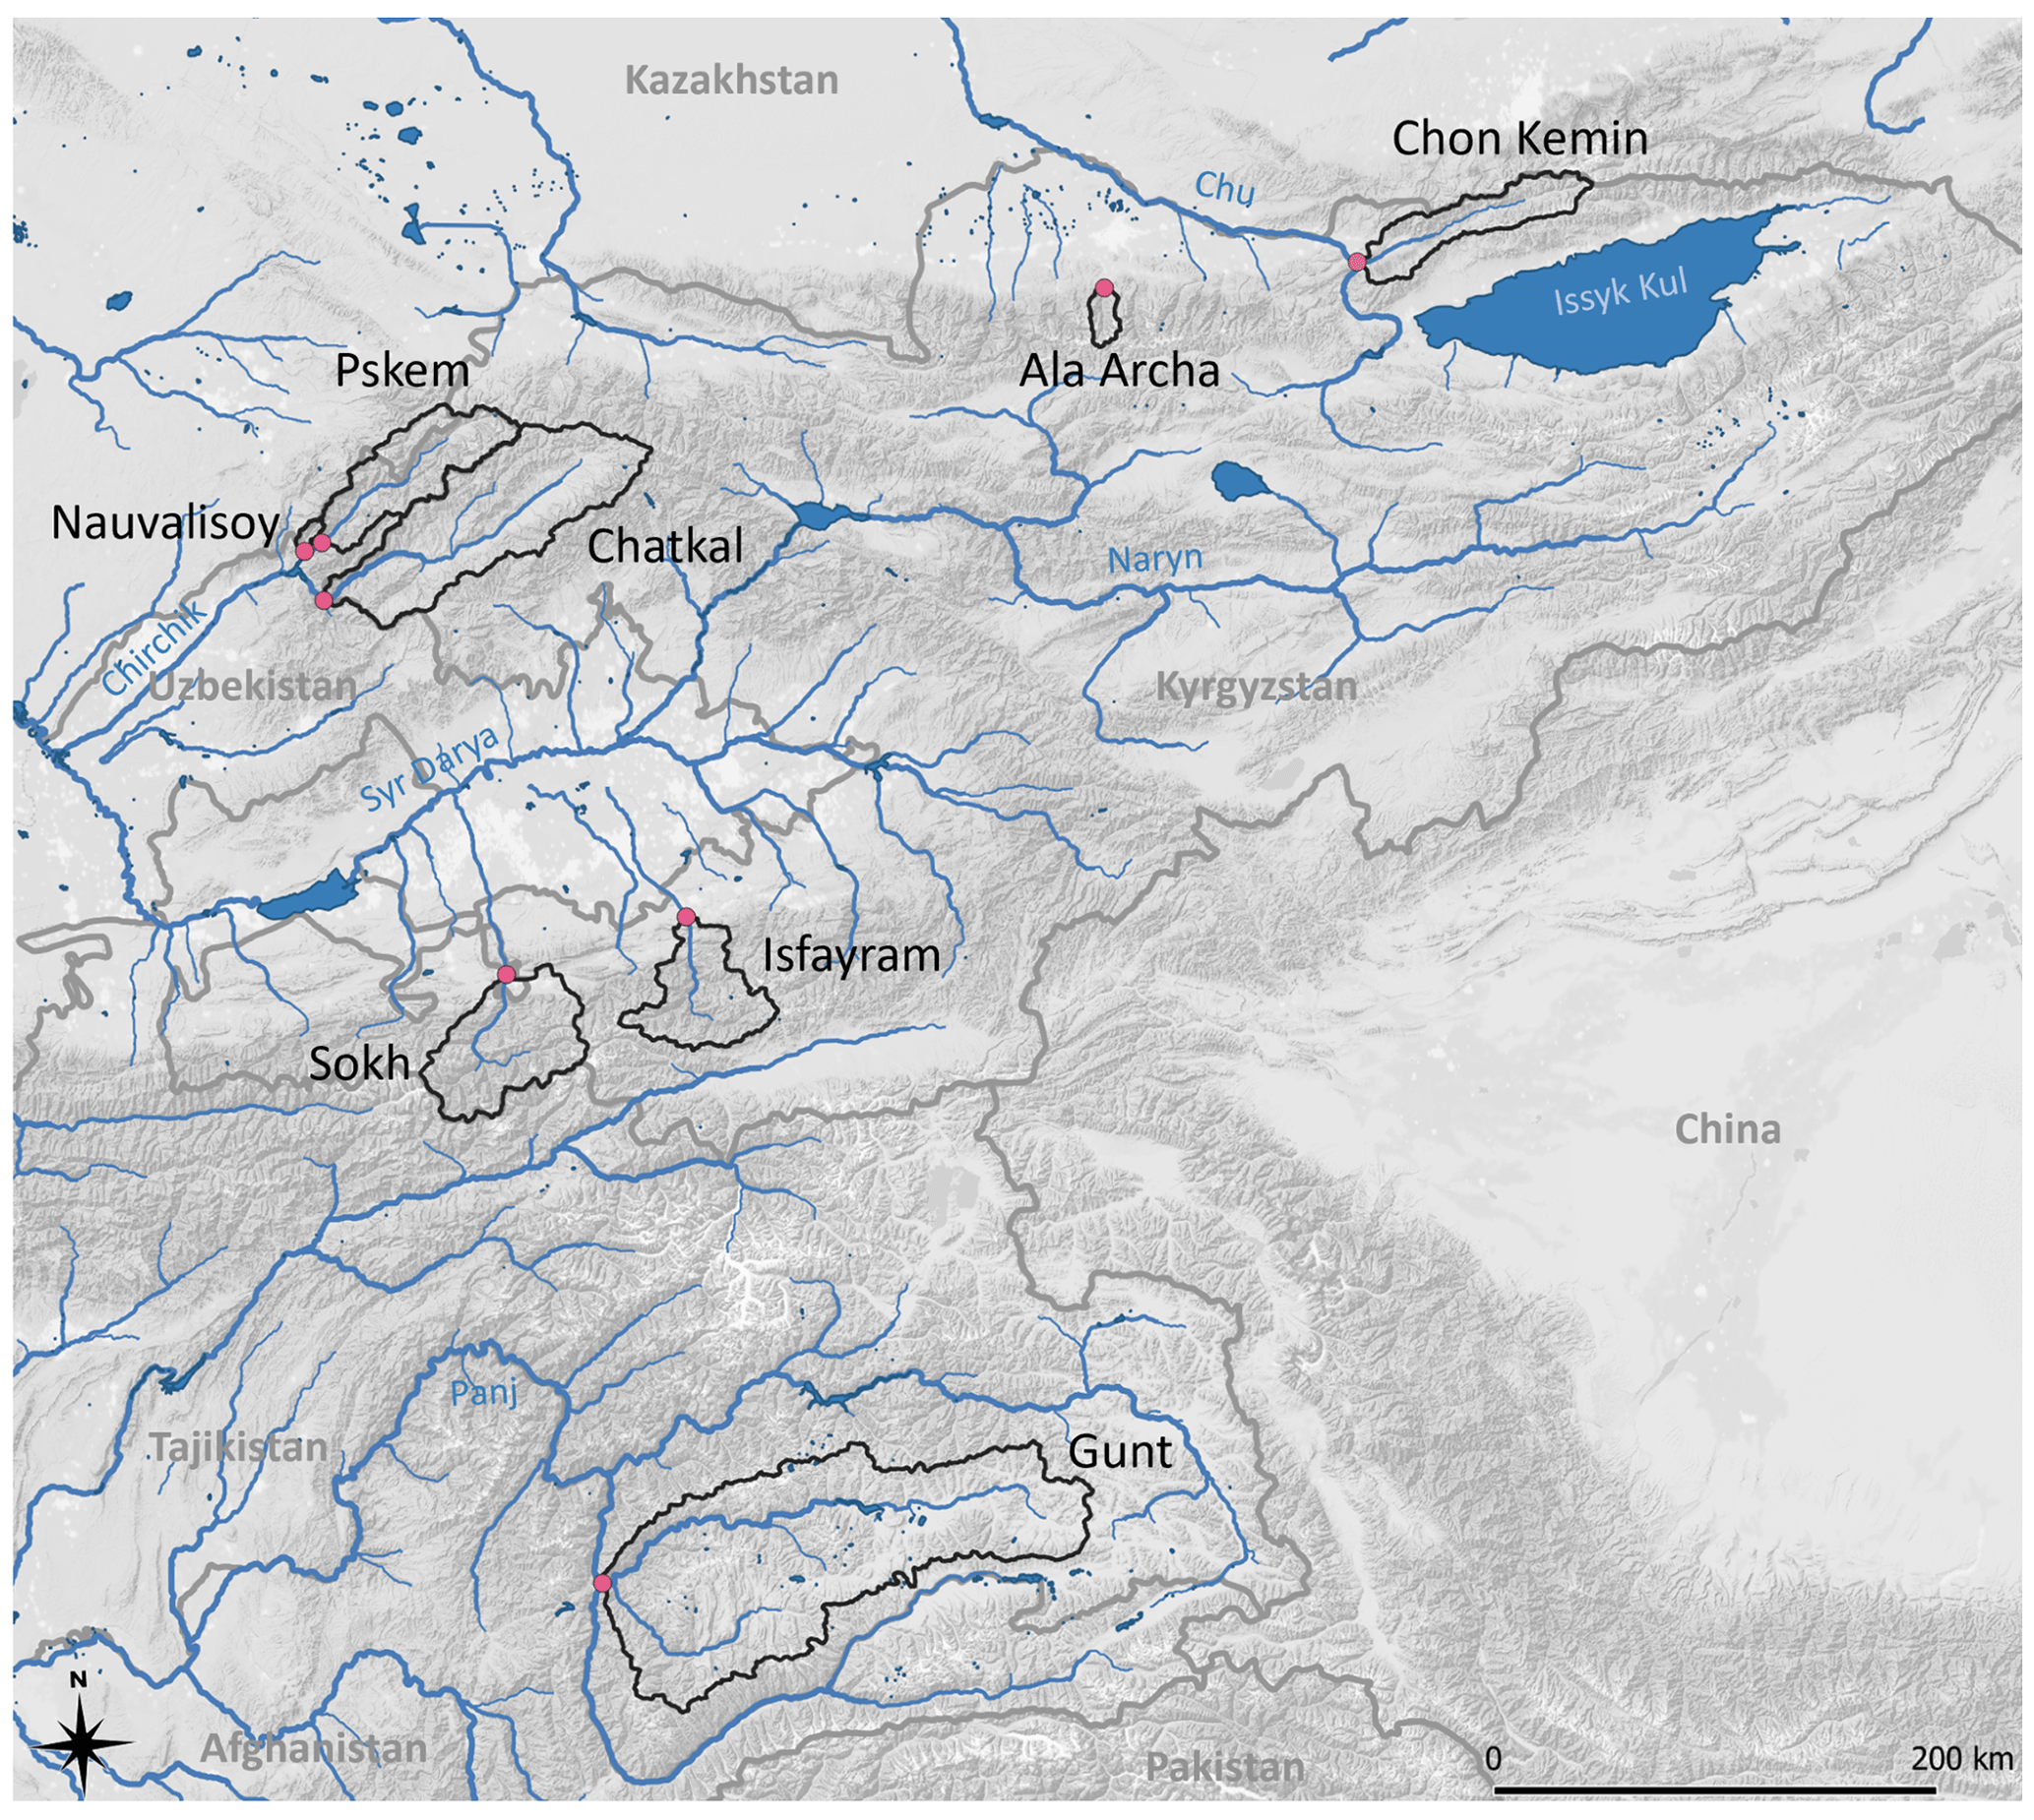
Figure 3Overview over the student case study basins. Background image: Stamen terrain background via QGIS quick map services. Map tiles by Stamen Design, under CC BY 3.0 using data by OpenStreetMap (© OpenStreetMap contributors 2022. Distributed under the Open Data Commons Open Database License (ODbL) v1.0.). River network and surface water bodies from GRDC (2020).
The data available for students include CHELSA v2.1 climatologies for Central Asia (temperature T; Karger et al., 2017 and precipitation P; Beck et al., 2020), as well as potential evaporation Epot (Trabucco and Zomer, 2019) and the aridity index . Students further receive a code folder with scripts for the preparation of climate files and for the discharge characterisation. In the folder “GaugeData”, students find the measured discharge in the tabular format as comma-separated values. These files can be read to R using the R package riversCentralAsia (Marti and Siegfried, 2022). The “GIS” folder includes a DEM which is already re-sampled to 100 m grid resolution and which was run through a sink-filling algorithm (Wang and Liu, 2006). The folder further contains a shapefile with point information about the gauge station at the outlet of the catchment and a shapefile with the boundaries of the catchment. To make sure students with no prior experience in R scripting also achieve the goal of setting up a hydrological model, necessary input layers for automatic model generation are made available as well. These include a layer with hydrological response units, a junctions layer, and a river layer.
Glacier outlines (RGI Consortium, 2017) are provided in the “Glaciers” folder. Further, there is land cover information available (Buchhorn et al., 2020) in the “Landuse” folder. Because the download and processing of the climate input data requires fast internet, considerable free storage space, and computing power, climate inputs were pre-produced for the students and are available in the folder RS_MINERVE. The data include a file labelled hist_obs, referring to the historical observation period, 4 hist_sim files for each general circulation model (GCM) showing the GCM simulation results for the historical period, and 16 fut_sim files which contain forcing for four GCM and four shared socio-economic pathways.
7.2.2 Examples from the book
In order to reproduce examples from the course book, students are encouraged to download the required data from links provided in the course book. Data from the Gunt river in the Amu Darya basin and the Atbashy and Chirchiq rivers in the Syr Darya basin are available with the same naming conventions as in the student case study sets. Further data covering the entire Central Asian region are available in the folder “central_asia_domain” and contain a map of the irrigated area (Ragettli et al., 2018) under agriculture, historical (Karger et al., 2017, 2021b), and future climatologies (Krasting et al., 2018; Boucher et al., 2018; Yukimoto et al., 2019; Tang et al., 2019) in the “climatology” folder; a land cover map (Buchhorn et al., 2020) in the “copernicus_land_cover” folder; a geopackage layer of available geolocations of the most important discharge-monitoring locations in Central Asia, obtained from Uzbekhydromet (2022) and manually validated, in the “gauges_basins” folder; and glacier-related data such as glacier outlines of regions 13 (covering most of the river basins draining into Central Asia) of the Randolf Glacier Inventory (RGI) version 6 (RGI Consortium, 2017), glacier thickness by Farinotti et al. (2019) for RGI region 13, per-glacier elevation change rates by Hugonnet et al. (2021), and glacier balance and imbalance ablation rates by Miles et al. (2021) in the “glaciers” folder.
7.3 Housekeeping
The course starts with an introduction of lecturers and course participants, whereby the participants state their background and their previous experiences with hydrological modelling, R, or QGIS. The main tutor then explains the course schedule and modus operandi during lectures. Further, the learning resources and software are introduced. The course material includes data, an R package with functions supporting the processing of the data, a course book, lecture slides, and video tutorials. As the student groups were small, a highly interactive teaching style could be applied where course participants were encouraged to actively participate in the lectures. The students form groups of two and select a case study basin on which they will work during the block course. Data and code snippets have been prepared by the teachers for each case study basin to make sure that students have the necessary data for modelling available, even if they should fail a preparatory exercise.
Every day starts with a recap session where students summarise what they learnt the previous day. Further, the homework and exercises are discussed, and general questions are answered.
7.4 Day 1: hydrological characteristics of the Central Asian region and role of hydrological modelling
After the introduction to the course, participants get a lecture on the physical geography of Central Asia, the irrigation and hydropower sectors, and the implications of water resources on international relations. In a second lecture block, participants learn about the role of hydrological models in helping to address water challenges.
As homework, course participants are asked to install the required software and to familiarise themselves with the software.
7.5 Day 2: what is a hydrological model and what are key hydrological processes?
After the recap on day 2, course participants get an overview of the types of hydrological models (empirical, conceptual, and physical) and how they can be used to address water challenges. In the second and third course block, students learn about the most important hydrological processes, watershed delineation, and water balance, as well as an overview of the dominant processes in the cryosphere.
As homework, course participants are asked to slip into the role of water professionals (three profiles are provided). They describe in their own words the water challenges they are tasked to address and what information they require from a hydrological model. They then determine the type of hydrological model and model input data they require to inform their work. The homework is discussed in plenum the following day. Through this thinking exercise, students deepen their understanding about hydrological models and their applications.
7.6 Days 3 and 4: what are data requirements for hydrological modelling?
The third module dives into the data preparation part of the model chain (see Fig. 1). This part covers the processing of geospatial data (GIS layers), including the delineation of a basin and the derivation of the river network based on the DEM that can be used for automated model generation in RS MINERVE.
As homework, course participants work on their first graded exercise: the basin characterisation using GIS data. Using data provided in the student case study sets, students extract basin characteristics and interpret their results in a short report. Step-by-step instruction videos, embedded in the online course book, are available to support first-time GIS users in this exercise. The videos are also available in a dedicated YouTube repository (Zhumabaev and Siegfried, 2022a).
The module continues on day 4 of the course with lectures on discharge characterisation, climate data, and the modelling process. The presentation on discharge covers traditional hydrology like how to deal with data gaps and how to calculate basic discharge statistics but also an outlook in the opportunities and difficulties introduced by automated discharge loggers. Students subsequently learn about data sources for climate forcing. The course participants learn how to extract time series of CHELSA climate data for all hydrological response units.
In the third lecture of this intensive course day, students are introduced to a general modelling process, from conceptual model to model validation, as described, for example, in Beven (2012). A key focus thereby is how model performance can be judged. Thus, students are introduced to model performance indices. Students further learn about perceptual models of a basin following Wagener et al. (2007) and Gnann et al. (2021) and manually draw a perceptual model of their case study basin. This small in-class exercise builds on the basin characterisation exercise (the previous homework) and helps the students to reflect on the hydrological processes they expect to be dominant in their basins.
As homework, course participants analyse the discharge time series of their chosen catchment and write up a short report for their second graded exercise. Students can copy code snippets from the course book or use a prepared R script available in the student case study pack for producing a selection of figures to characterise discharge. The interpretation of the figures has to be done by the students themselves.
7.7 Day 5: how does a hydrological model work?
Typically, the recap and discussion of the homework takes up a considerable amount of time on day 5. The lectures therefore are abbreviated. Students are introduced to the linear reservoir model and learn to differentiate between model states, variables, and parameters. Then the HBV model (Bergström, 1976), as implemented in RS MINERVE (Roquier et al., 2022), is introduced. Subsequently, the software RS MINERVE is introduced in an online demonstration, and a case study, the Badam reservoir system in South Kazakhstan, is presented. This case study demonstrates an advanced hydrological–hydraulic model of a natural river system that has been altered by different man-made reservoirs and inter-basin water transfers.
As homework, students go through the exercises in the RS MINERVE manual to familiarise themselves with the software.
7.8 Day 6: how to find a good set of model parameters
Students learn about model calibration. Linear regression is introduced, and model goodness of fit is discussed. Objective functions and global optimisation, as well as strategies to avoid over-parameterisation, are introduced. Further, students learn how to divide their available time series into warm-up, calibration, validation, and baseline periods. The content is summarised in a calibration strategy.
As homework, students are asked to use the readily available GIS layers for automated model implementation in RS MINERVE. A tutorial video is available that demonstrates how to do this.
7.9 Day 7: model calibration and how to write a scientific abstract
Students have time to collaborate online and to manually calibrate the hydrological model for their case study site. Tutors are also online and provide support where needed. Students further have time to finalise their presentations for the last day of the course. To support their work, they receive presentation guide lines and a short demo presentation of a model of the Gunt river basin.
As third graded exercise, students have to hand in a calibrated model of their case study basin.
As homework, students write an abstract for the student conference which takes place on the last day of the course. They have to comply to abstract submission guidelines of the Silk Road of Knowledge conference. The abstract is the fourth graded exercise.
7.10 Day 8: student conference and course wrap-up
Student groups take turns to present their hydrological modelling work of the past days in a pseudo-conference setting. Their presentations are graded. After the student conference, the students are asked to give feedback on the course face to face and in an anonymous Google form.
The proposed workflow has been extensively tested and applied to further basins in Central Asia within the frame of master's thesis projects at ETH Zurich and DKU and also within the frame of the Hydro4U project (Hydro4U consortium, 2022). It provides a solid basis for hydrological modelling for climate change impact studies. As new data become available or new model goals emerge (e.g. operational forecast), the above workflow needs to be adapted.
Students' backgrounds at DKU were diverse, with limited prior knowledge in scripting or numerical modelling. They found the course highly relevant to their field and interesting but also very challenging. Students rated the overall quality of the course exceptionally high, with 4.9 out of 5 points. The worst grade (4.2 out of 5) was given to the homework tasks, which were perceived as too difficult. This was reflected also in the rather poor quality of the homework handed in.
Online teaching posed several challenges, like the poor internet connection of some students. In particular, our Afghan students in the 2021 course suffered from frequent interruptions. Further, the installation of the software involved considerable off-hour tutoring need by some students. The use of university computers in the case where in-person teaching is possible or the use of RStudio cloud services could reduce the software installation hurdle.
The excellent reception of the modelling course led to two week-long training-of-trainers seminars for 25 academic staff from 19 different organisations throughout the region. The course was also well received by trainers, and several plan to include at least part of the course material in their teaching programme. As a spin-off of the training-of-trainers seminar, professors from the Kazakh National University, the Eurasian University in Kazakhstan, the Uzbek National University, and the German–Kazakh University continue to work together over the summer by regularly meeting online for the discussion of relevant topics.
Authors and trainers agree that a block course is not sufficient for students to learn to master the tools required for hydrological modelling. Separate courses on the use of QGIS and R should be taken before the start of the hydrological modelling course. Also, more time should be allowed for students to grasp the lecture content through further exercises. The course material should optimally be taught in a semester course.
Future hydrologists need to learn software and scripting tools, as well as numerical hydrological modelling in addition to traditional hydrology, as they are excessively used today in science but also in applied modelling. The presented course material and modelling workflow are open source, readily available, and tailored for climate impact studies in Central Asia. The robustness and efficacy of the workflow has been demonstrated in consulting tasks.
The open-source course book described in this article is available via Zenodo https://doi.org/10.5281/zenodo.6349983 (Siegfried and Marti, 2022b); the latest version is available via GitHub https://hydrosolutions.github.io/caham_book/ (last access: 16 January 2023) (Siegfried and Marti, 2022b). The link to the course book includes the link to the students' case study packs, which are available for download from Zenodo: https://doi.org/10.5281/zenodo.7500866 (Siegfried and Marti, 2022a). All examples from the course book can be reproduced with the full CAHAM data package available from here: https://doi.org/10.5281/zenodo.7500866 (Siegfried and Marti, 2022a) (attention, approx. 36 GB size!). The R package extensively used in the course book is available for installation via GitHub: https://github.com/hydrosolutions/riversCentralAsia (last access: 16 January 2023). The version used for the preparation of the material presented here is available from Zenodo: https://doi.org/10.5281/zenodo.4667421 (Marti and Siegfried, 2022). Lecture slides are available from Zenodo: https://doi.org/10.5281/zenodo.7500924 (Siegfried and Marti, 2023).
Tutorial videos with step-by-step instructions are available on YouTube: http://bit.ly/3CQ2OsY (Zhumabaev and Siegfried, 2022b). A video abstract for this article is available under https://doi.org/10.5446/60348 (Marti, 2023).
TS designed the teaching course, prepared most of the teaching material, and performed most of the teaching and exercise tutoring. BSM contributed to the course exercises, sections on cryosphere data, and hydrological modelling and took over said sections of the teaching. AZ recorded tutorial videos, supported students in exercises, and presented his case study: the hydrological–hydraulic model of the Badam reservoir system.
The contact author has declared that none of the authors has any competing interests.
Publisher's note: Copernicus Publications remains neutral with regard to jurisdictional claims in published maps and institutional affiliations.
The generous support by the Blue Peace Central Asia Programme at the Swiss Agency for Development and Cooperation is acknowledged. We especially thank Stéphanie Piers de Raveschoot, André Wehrli, Dimka Stantchev, and Lisa Gampp there. At the German–Kazakh University, Larissa Kogutenko is acknowledged for her amazing administrative and in-course support. We would further like to thank the authors of the open-source software and data used in this article for making their work accessible.
This research has been supported by the Direktion für Entwicklung und Zusammenarbeit (grant no. 7F-09162.01.00).
This paper was edited by Fuqiang Tian and reviewed by Hongyi Li and one anonymous referee.
Abdullaev, I. and Rakhmatullaev, S.: Data Management for Integrated Water Resources Management in Central Asia, J. Hydroinform., 16, 1425–1440, https://doi.org/10.2166/hydro.2014.097, 2014. a
Abdullaev, I. and Rakhmatullaev, S.: River Basin Management in Central Asia: Evidence from Isfara Basin, Fergana Valley, Environ. Earth Sci., 75, 677, https://doi.org/10.1007/s12665-016-5270-9, 2016a. a
Abdullaev, I. and Rakhmatullaev, S.: Setting up the Agenda for Water Reforms in Central Asia: Does the Nexus Approach Help?, Environ. Earth Sci., 75, 870, https://doi.org/10.1007/s12665-016-5409-8, 2016b. a
Beck, H. E., Wood, E. F., McVicar, T. R., Zambrano-Bigiarini, M., Alvarez-Garreton, C., Baez-Villanueva, O. M., Sheffield, J., and Karger, D. N.: Bias Correction of Global High-Resolution Precipitation Climatologies Using Streamflow Observations from 9372 Catchments, J. Climate, 33, 1299–1315, https://doi.org/10.1175/JCLI-D-19-0332.1, 2020. a, b
Bergström, S.: Development and Application of a Conceptual Runoff Model for Scandinavian Catchments, SMHI Report No. Rho 7, Lund Institute of Technology/University of Lund, https://www.researchgate.net/publication/255274162_Development_and_Application_of_a_Conceptual_Runoff_Model_for_Scandinavian_Catchments (last access: 17 January 2023), 1976. a, b, c
Beven, K.: Rainfall‐Runoff Modelling, John Wiley & Sons, Ltd, https://doi.org/10.1002/9781119951001, 2012. a
Boucher, O., Denvil, S., Levavasseur, G., Cozic, A., Caubel, A., Foujols, M.-A., Meurdesoif, Y., Bony, S., Flavoni, S., Idelkadi, A., Mellul, L., Musat, I., and Saint-Lu, M.: IPSL IPSL-CM6A-LR Model Output Prepared for CMIP6 CFMIP, ESGF, https://doi.org/10.22033/ESGF/CMIP6.1522, 2018. a, b, c
Buchhorn, M., Smets, B., Bertels, L., De Roo, B., Lesiv, M., Tsendbazar, N.-E., Herold, M., and Fritz, S.: Land Cover 100 m: Collection 3: Epoch 2019: Globe 2020, Zenodo [data set], https://doi.org/10.5281/zenodo.3939050, 2020. a, b, c
Conrad, O., Bechtel, B., Bock, M., Dietrich, H., Fischer, E., Gerlitz, L., Wehberg, J., Wichmann, V., and Böhner, J.: System for Automated Geoscientific Analyses (SAGA) v. 2.1.4, Geosci. Model Dev., 8, 1991–2007, https://doi.org/10.5194/gmd-8-1991-2015, 2015. a, b
Coron, L., Thirel, G., Delaigue, O., Perrin, C., and Andréassian, V.: The Suite of Lumped GR Hydrological Models in an R Package, Environ. Model. Softw., 94, 166–171, https://doi.org/10.1016/j.envsoft.2017.05.002, 2017. a
CUAHSI: hydroshare.org, https://www.hydroshare.org/, last access: 22 August 2022. a
Didovets, I., Lobanova, A., Krysanova, V., Menz, C., Babagalieva, Z., Nurbatsina, A., Gavrilenko, N., Khamidov, V., Umirbekov, A., Qodirov, S., Muhyyew, D., and Hattermann, F. F.: Central Asian Rivers under Climate Change: Impacts Assessment in Eight Representative Catchments, J. Hydrol.: Reg. Stud., 34, 100779, https://doi.org/10.1016/j.ejrh.2021.100779, 2021. a
Farinotti, D., Huss, M., Fürst, J. J., Landmann, J., Machguth, H., Maussion, F., and Pandit, A.: A Consensus Estimate for the Ice Thickness Distribution of All Glaciers on Earth – Dataset, ETH Zurich, https://doi.org/10.3929/ethz-b-000315707, 2019. a
Flügel, W.-A.: Delineating hydrological response units by geographical information system analyses for regional hydrological modelling using PRMS/MMS in the drainage basin of the River Bröl, Germany, Hydrol. Process., 9, 423–436, https://doi.org/10.1002/hyp.3360090313, 1995. a
Gerlitz, L., Vorogushyn, S., and Gafurov, A.: Climate Informed Seasonal Forecast of Water Availability in Central Asia: State-of-the-art and Decision Making Context, Water Secur., 10, 100061, https://doi.org/10.1016/j.wasec.2020.100061, 2020. a
Gnann, S. J., McMillan, H. K., Woods, R. A., and Howden, N. J. K.: Including Regional Knowledge Improves Baseflow Signature Predictions in Large Sample Hydrology, Water Resour. Res., 57, e2020WR028354, https://doi.org/10.1029/2020WR028354, 2021. a
GRASS Development Team: Geographic Resources Analysis Support System (GRASS GIS) Software, Version 8.2.1dev, Open Source Geospatial Foundation, http://grass.osgeo.org (last access: 16 January 2023), 2022. a, b
GRDC – Global Runoff Data Centre: WMO Basins and Sub-Basins, https://www.bafg.de/GRDC/EN/02_srvcs/22_gslrs/gislayers_node.html (last access: 16 January 2023), 2020. a
Gudmundsson, L.: Qmap: Statistical Transformations for Post-Processing Climate Model Output, CRAN, https://CRAN.R-project.org/package=qmap (last access: 16 January 2023), 2016. a, b
Hugonnet, R., McNabb, R., Berthier, E., Menounos, B., Nuth, C., Girod, L., Farinotti, D., Huss, M., Dussaillant, I., Brun, F., and Kääb, A.: Accelerated Global Glacier Mass Loss in the Early Twenty-First Century, Nature, 592, 726–731, https://doi.org/10.1038/s41586-021-03436-z, 2021. a, b, c, d
Hydro4U consortium: Hydro4U, https://hydro4u.eu/, lat access: 1 September 2022. a
ISIMIP3 consortium: ISIMIP3b simulation protocol, https://protocol.isimip.org/, lat access: 30 August 2022. a
Jenson, S. K. and Domingue, J. O.: Extracting Topographic Structure from Digital Elevation Data for Geographic Information-System Analysis, Photogram. Eng. Remote Sens., 54, 1593–1600, 1988. a
Karger, D. N., Conrad, O., Böhner, J., Kawohl, T., Kreft, H., Soria-Auza, R. W., Zimmermann, N. E., Linder, H. P., and Kessler, M.: Climatologies at High Resolution for the Earth's Land Surface Areas, Scient. Data, 4, 170122, https://doi.org/10.1038/sdata.2017.122, 2017. a, b, c, d
Karger, D. N., Conrad, O., Böhner, J., Kawohl, T., Kreft, H., Soria-Auza, R. W., Zimmermann, N. E., Linder, H. P., and Kessler, M.: Climatologies at High Resolution for the Earth's Land Surface Areas, EnviDat, https://doi.org/10.16904/envidat.228.v2.1, 2021a. a
Karger, D. N., Wilson, A. M., Mahony, C., Zimmermann, N. E., and Jetz, W.: Global Daily 1 Km Land Surface Precipitation Based on Cloud Cover-Informed Downscaling, Scient. Data, 8, 307, https://doi.org/10.1038/s41597-021-01084-6, 2021b. a, b
Khanal, S., Lutz, A., Kraaijenbrink, P. D. A., van den Hurk, B., Yao, T., and Immerzeel, W. W.: Variable 21st Century Climate Change Response for Rivers in High Mountain Asia at Seasonal to Decadal Time Scales, Water Resour. Res., 57, e2020WR029266, https://doi.org/10.1029/2020WR029266, 2021. a
Knoben, W. J. M. and Spieler, D.: Teaching Hydrological Modelling: Illustrating Model Structure Uncertainty with a Ready-to-Use Computational Exercise, Hydrol. Earth Syst. Sci., 26, 3299–3314, https://doi.org/10.5194/hess-26-3299-2022, 2022. a
Krasting, J. P., John, J. G., Blanton, C., McHugh, C., Nikonov, S., Radhakrishnan, A., Rand, K., Zadeh, N. T., Balaji, V., Durachta, J., Dupuis, C., Menzel, R., Robinson, T., Underwood, S., Vahlenkamp, H., Dunne, K. A., Gauthier, P. P., Ginoux, P., Griffies, S. M., Hallberg, R., Harrison, M., Hurlin, W., Malyshev, S., Naik, V., Paulot, F., Paynter, D. J., Ploshay, J., Reichl, B. G., Schwarzkopf, D. M., Seman, C. J., Silvers, L., Wyman, B., Zeng, Y., Adcroft, A., Dunne, J. P., Dussin, R., Guo, H., He, J., Held, I. M., Horowitz, L. W., Lin, P., Milly, P., Shevliakova, E., Stock, C., Winton, M., Wittenberg, A. T., Xie, Y., and Zhao, M.: NOAA-GFDL GFDL-ESM4 Model Output Prepared for CMIP6 CMIP, ESGF, https://doi.org/10.22033/ESGF/CMIP6.1407, 2018. a, b, c
Liu, Y., Fang, Y., and Margulis, S. A.: High Mountain Asia UCLA Daily Snow Reanalysis, NSIDC, https://doi.org/10.5067/HNAUGJQXSCVU, 2021a. a, b
Liu, Y., Fang, Y., and Margulis, S. A.: Spatiotemporal Distribution of Seasonal Snow Water Equivalent in High Mountain Asia from an 18-Year Landsat–MODIS Era Snow Reanalysis Dataset, The Cryosphere, 15, 526–5280, https://doi.org/10.5194/tc-15-5261-2021, 2021b. a
Marti, B. and Siegfried, T.: riversCentralAsia: An R package for hydrological modelling, Zenodo [code], https://doi.org/10.5281/zenodo.4667421, 2022. a, b, c, d
Marti, B. S.: Video abstract for a comprehensive open-source course for teaching applied hydrological modelling in Central Asia. Copernicus Publications, TIB AV-PORTAL [video abstract], https://doi.org/10.5446/60348, 2023. a
Miles, E., McCarthy, M., Dehecq, A., Kneib, M., Fugger, S., and Pellicciotti, F.: Health and Sustainability of Glaciers in High Mountain Asia, Nat. Commun., 12, 10, https://doi.org/10.1038/s41467-021-23073-4, 2021. a, b, c, d
Moodle project: Moodle 4.0, https://moodle.org/, last access: 24 August 2022. a
NASA JPL: NASA Shuttle Radar Topography Mission Global 1 Arc Second [Data Set], Tech. rep., NASA EOSDIS Land Processes DAAC, https://doi.org/10.5067/MEaSUREs/SRTM/SRTMGL1.003, 2013. a, b
OGGM Consortium: Open Global Glacier Model Edu, https://edu.oggm.org/en/latest/, last access: 23 August 2022. a
Pilz, T., Francke, T., and Bronstert, A.: lumpR 2.0.0: An R Package Facilitating Landscape Discretisation for Hillslope-Based Hydrological Models, Geosci. Model Dev., 10, 3001–3023, https://doi.org/10.5194/gmd-10-3001-2017, 2017. a
QGIS Development Team: QGIS Geographic Information System, http://qgis.osgeo.org (last access: 16 January 2023), 2022. a, b
Quarto Development Team: Quarto, https://quarto.org/, last access: 1 September 2022. a
Ragettli, S., Herberz, T., and Siegfried, T.: An Unsupervised Classification Algorithm for Multi-Temporal Irrigated Area Mapping in Central Asia, Remote Sensing, 10, 1823, https://doi.org/10.3390/rs10111823, 2018. a
R Core Team: R: A Language and Environment for Statistical Computing, https://www.R-project.org/ (last access: 16 January 2023), 2022. a
RGI Consortium: Randolph Glacier Inventory – A Dataset of Global Glacier Outlines: Version 6.0, https://doi.org/10.7265/N5-RGI-60, 2017. a, b, c
Riahi, K., van Vuuren, D. P., Kriegler, E., Edmonds, J., O'Neill, B. C., Fujimori, S., Bauer, N., Calvin, K., Dellink, R., Fricko, O., Lutz, W., Popp, A., Cuaresma, J. C., Kc, S., Leimbach, M., Jiang, L., Kram, T., Rao, S., Emmerling, J., Ebi, K., Hasegawa, T., Havlik, P., Humpenöder, F., Da Silva, L. A., Smith, S., Stehfest, E., Bosetti, V., Eom, J., Gernaat, D., Masui, T., Rogelj, J., Strefler, J., Drouet, L., Krey, V., Luderer, G., Harmsen, M., Takahashi, K., Baumstark, L., Doelman, J. C., Kainuma, M., Klimont, Z., Marangoni, G., Lotze-Campen, H., Obersteiner, M., Tabeau, A., and Tavoni, M.: The Shared Socioeconomic Pathways and Their Energy, Land Use, and Greenhouse Gas Emissions Implications: An Overview, Global Environ. Change, 42, 153–168, https://doi.org/10.1016/j.gloenvcha.2016.05.009, 2017. a, b
Roquier, B., Fluixa Sanmartin, J., Brauchli, T., Baracchini, T., Garcia Hernandez, J., Foehn, A., Paredes Arquiola, J., and De Cesare, G.: RS Minerve, crealp, https://crealp.ch/rs-minerve/ (last access: 16 January 2023), 2021. a
Roquier, B., Fluixa Sanmartin, J., Brauchli, T., Baracchini, T., Garcia Hernandez, J., Foehn, A., Paredes Arquiola, J., and De Cesare, G.: RS Minerve Manuals, GitHub, https://crealp.github.io/rsminerve-releases/ (last access: 16 January 2023), 2022. a, b, c, d
RStudio Team: RStudio: Integrated Development for R, https://www.rstudio.com/ (last access: 16 January 2023), 2022. a
Schaefli, B., Hingray, B., Niggli, M., and Musy, A.: A conceptual glacio-hydrological model for high mountainous catchments, Hydrol. Earth Syst. Sci., 9, 95–109, https://doi.org/10.5194/hess-9-95-2005, 2005. a, b
Seibert, J. and Vis, M. J. P.: Teaching hydrological modeling with a user-friendly catchment-runoff-model software package, Hydrol. Earth Syst. Sci., 16, 3315–3325, https://doi.org/10.5194/hess-16-3315-2012, 2012. a, b
Siegfried, T. and Marti, B.: Accompanying data for the open-source book Modeling of Hydrological Systems in Semi-Arid Central Asia, Zenodo [data set], https://doi.org/10.5281/zenodo.7500866, 2022a. a, b, c
Siegfried, T. and Marti, B.: Hydrological Modelling in Semi-Arid Central Asia, hydrosolutions GmbH, Zurich, Zenodo [code], https://doi.org/10.5281/zenodo.6349983, 2022b. a, b, c, d
Siegfried, T. and Marti, B.: Slides used for teaching “Modeling of Hydrological Systems in Semi-Arid Central Asia” in spring 2022, Zenodo [data set], https://doi.org/10.5281/zenodo.7500924, 2023. a
Siegfried, T., Bernauer, T., Guiennet, R., Sellars, S., Robertson, A. W., Mankin, J., Bauer-Gottwein, P., and Yakovlev, A.: Will Climate Change Exacerbate Water Stress in Central Asia?, Climatic Change, 112, 881–899, https://doi.org/10.1007/s10584-011-0253-z, 2012. a
Tang, Y., Rumbold, S., Ellis, R., Kelley, D., Mulcahy, J., Sellar, A., Walton, J., and Jones, C.: MOHC UKESM1.0-LL Model Output Prepared for CMIP6 CMIP Esm-piControl, ESGF, https://doi.org/10.22033/ESGF/CMIP6.5953, 2019. a, b, c
Trabucco, A. and Zomer, R.: Global Aridity Index and Potential Evapotranspiration (ET0) Climate Database V2, figshare [data set], https://doi.org/10.6084/m9.figshare.7504448.v3, 2019. a
Unger-Shayesteh, K., Vorogushyn, S., Farinotti, D., Gafurov, A., Duethmann, D., Mandychev, A., and Merz, B.: What Do We Know about Past Changes in the Water Cycle of Central Asian Headwaters? A Review | Elsevier Enhanced Reader, Global Planet. Change, 110, 4–25, https://doi.org/10.1016/j.gloplacha.2013.02.004, 2013. a, b, c
Uzbekhydromet: Hydrological Yearbook data, https://hydromet.uz/ (last access: 16 January 2023), 2022. a, b, c
Vincent-Lancrin, S.: The Role of Education in Capacity Development, in: Capacity Development for Improved Water Management, 1st Edn., edited by: Blokland, M. W., Alaerts, G., Kaspersma, J., and Hare, M., CRC Press, London, p. 24, ISBN 978-0-203-84930-9, 2009. a
Wagener, T., Sivapalan, M., Troch, P., and Woods, R.: Catchment Classification and Hydrologic Similarity, Geogr. Compass, 1, 901–931, https://doi.org/10.1111/j.1749-8198.2007.00039.x, 2007. a
Wagener, T., Kelleher, C., Weiler, M., McGlynn, B., Gooseff, M., Marshall, L., Meixner, T., McGuire, K., Gregg, S., Sharma, P., and Zappe, S.: It Takes a Community to Raise a Hydrologist: The Modular Curriculum for Hydrologic Advancement (MOCHA), Hydrol. Earth Syst. Sci., 16, 3405–3418, https://doi.org/10.5194/hess-16-3405-2012, 2012. a, b
Wang, L. and Liu, H.: An Efficient Method for Identifying and Filling Surface Depressions in Digital Elevation Models for Hydrologic Analysis and Modelling, Int. J. Geogr. Inform. Sci., 20, 193–213, https://doi.org/10.1080/13658810500433453, 2006. a
Yukimoto, S., Koshiro, T., Kawai, H., Oshima, N., Yoshida, K., Urakawa, S., Tsujino, H., Deushi, M., Tanaka, T., Hosaka, M., Yoshimura, H., Shindo, E., Mizuta, R., Ishii, M., Obata, A., and Adachi, Y.: MRI MRI-ESM2.0 Model Output Prepared for CMIP6 CMIP Historical, ESGF, https://doi.org/10.22033/ESGF/CMIP6.6842, 2019. a, b, c
Zhumabaev, A. and Siegfried, T.: Learning videos for the course: Modeling of Hydrological Systems in Semi-Arid Central Asia, https://bit.ly/3B2Emnr (last access: 16 January 2023), 2022a. a
Zumabaev, A. and Siegfried, T.: CAHAM Book Exercise 1, You Tube Channel http://bit.ly/3CQ2OsY (last access: 16 January 2023), 2022b. a
Zoom Video Communications, Inc.: Zoom, https://zoom.us/, last access: 25 August 2022. a