the Creative Commons Attribution 4.0 License.
the Creative Commons Attribution 4.0 License.
 | 21 Jul 2023
Impacts of soil management and climate on saturated and near-saturated hydraulic conductivity: analyses of the Open Tension-disk Infiltrometer Meta-database (OTIM)
Guillaume Blanchy
Lukas Albrecht
Gilberto Bragato
Sarah Garré
Nicholas Jarvis
John Koestel
Saturated and near-saturated soil hydraulic conductivities Kh (mm h−1) determine the partitioning of precipitation into surface runoff and infiltration and are fundamental to soils' susceptibility to preferential flow. Recent studies found indications that climate factors influence Kh, which is highly relevant in the face of climate change. In this study, we investigated relationships between pedoclimatic factors and Kh and also evaluated effects of land use and soil management. To this end, we collated the Open Tension-disk Infiltrometer Meta-database (OTIM), which contains 1297 individual data entries from 172 different publication sources. We analysed a spectrum of saturated and near-saturated hydraulic conductivities at matric potentials between 0 and 100 mm. We found that methodological details like the direction of the wetting sequence or the choice of method for calculating infiltration rates to hydraulic conductivities had a large impact on the results. We therefore restricted ourselves to a subset of 466 of the 1297 data entries with similar methodological approaches. Correlations between Ks and Kh at higher supply tensions decreased especially close to saturation, indicating a different flow mechanism at and very close to saturation than towards the dry end of the investigated tension range. Climate factors were better correlated with topsoil near-saturated hydraulic conductivities at supply tensions ≥ 30 mm than soil texture, bulk density and organic carbon content. We find it most likely that the climate variables are proxies for soil macropore networks created by the respective biological activity, pedogenesis and climate-specific land use and management choices. Due to incomplete documentation in the source publications of OTIM, we were able to investigate only a few land use types and agricultural management practices. Land use, tillage system and soil compaction significantly influenced Kh, with effect sizes appearing comparable to the ones of soil texture and soil organic carbon. The data in OTIM show that experimental bias is present, introduced by the choice of measurement time relative to soil tillage, experimental design or data evaluation procedures. The establishment of best-practice rules for tension-disk infiltrometer measurements would therefore be helpful. Future studies are needed to investigate how climate shapes soil macropore networks and how land use and management can be adapted to improve soil hydraulic properties. Both tasks require large numbers of new measurement data with improved documentation on soil biology and land use and management history.
- Article
(6518 KB) - Full-text XML
- BibTeX
- EndNote


Climate models predict more frequent extreme weather events such as high-intensity rainfall with the onset of global warming. To prevent water runoff and erosion, soils need sometimes to be able to conduct large amounts of water in a short time. It is generally accepted that one key soil property is the saturated hydraulic conductivity Ks (mm h−1), as it determines the partitioning of precipitation into surface runoff and infiltration. A large Ks reduces erosion risks and allows water to infiltrate into deeper soil layers, where it may replenish an important reservoir of plant-available water or contribute to groundwater recharge. The hydraulic conductivity of a soil decreases with decreasing water content, i.e. with decreasing water saturation. The hydraulic conductivity in the so-called near-saturated range (between 0 and 100 mm matric tensions) is likewise important. For rainfall intensities smaller than but close to Ks, soils with a larger near-saturated hydraulic conductivity Kh (mm h−1) will remain less water-saturated because they are able to conduct the precipitation water within smaller macropores. Therefore, they are less susceptible to preferential flow (Larsbo et al., 2014) by which agrochemicals and other solutes quickly leach towards the groundwater. Moreover, a large Kh also indicates a well-aerated soil, which drains more quickly and helps air to escape the soil in the case of heavy rainfall. This further reduces the risk of surface runoff and erosion as entrapped air strongly decreases soil hydraulic conductivity.
Saturated hydraulic conductivity is measured either in the laboratory on small cylinders, usually with diameters < 7 cm (Klute and Dirksen, 1986), or is acquired from field measurements using either single- or double-ring infiltrometer methods (Angulo-Jaramillo et al., 2000). In addition, near-saturated hydraulic conductivities can be measured using a tension-disk infiltrometer. The method is designed as a field method but has occasionally been applied in the laboratory. Using a tension-disk infiltrometer, hydraulic conductivities at supply tensions between ca. 0.5 and ca. 60 to 150 mm can be obtained, depending on the specifications of the infiltrometer. All measurement techniques for saturated and near-saturated hydraulic conductivity are laborious, time-consuming and constrained to a relatively small soil volume.
It is necessary to develop pedotransfer functions to estimate soil hydraulic conductivities for large-scale modelling applications, as we cannot measure everywhere (Bouma, 1989; Van Looy et al., 2017; Wösten et al., 2001). The development of a pedotransfer function requires a database from which it can be derived. For example, the well-known pedotransfer function ROSETTA (Schaap et al., 2001) is based on the open UNSODA database (Nemes et al., 2001). The equations published in Tóth et al. (2015) are derived from the proprietary EU-HYDI database (Weynants et al., 2013). The pedotransfer functions of Jarvis et al. (2013) are based on an unpublished meta-database containing tension-disk infiltrometer data. Collecting published measurements of saturated and near-saturated hydraulic conductivity measurements into meta-databases and pairing them with other existing databases is essential for developing pedotransfer functions. A notable example is the SWIG database (Rahmati et al., 2018) that collates more than 5000 data sets from soil infiltration measurements covering the entire globe. Another big effort in collecting information on saturated hydraulic conductivity is the newly published SoilKsatDB (Gupta et al., 2021a), which combines saturated hydraulic conductivity data from several large databases, amongst others UNSODA and SWIG, with additional measurements published in independent scientific studies. However, none of the databases cited above provides open-access infiltration measurements at tensions near saturation (h > 0 mm), which limits their use to the estimation of saturated hydraulic conductivity.
While reasonably good estimations of Ks from easy-to-measure or readily available site properties appear to be possible for peat soils (Morris et al., 2022), pedotransfer functions for Ks of mineral soils exhibit poor predictive performance, with coefficients of determination R2 not exceeding 0.25 (Weynants et al., 2009; Jorda et al., 2015). Early approaches, like HYPRES (Wösten et al., 1999) and ROSETTA, focused solely on soil properties like texture, bulk density and organic carbon content as predictors of Ks. At the time, it was not sufficiently recognized that soil Ks is mostly determined by the morphology of macropore networks, especially in finer-textured soils (Vereecken et al., 2010; Koestel et al., 2018; Schlüter et al., 2020). A pedotransfer function for Ks therefore ideally requires a database that contains direct information on the macropore network itself. However, since such measures are even more cumbersome and time-consuming to obtain (e.g. by X-ray tomography) than measuring hydraulic conductivity itself, it is more reasonable and makes more sense to use proxies from which the macrostructure in a soil can be inferred. Ideal candidates would be root growth and the activity of soil macrofauna, which both strongly determine the development of macropore networks in soil (Meurer et al., 2020). However, they are difficult to measure. Proxies that are more promising are land use and farming practices, such as tillage or soil compaction due to trafficking. Plant growth and soil macrofauna in turn are influenced by the local climate. The climate also sets boundaries for the land use and the associated soil management practices and thus provides feedback on root growth and macrofaunal activity. Wetting and drying cycles and thus the formation and closure of cracks are also regulated by the climate, as are splash erosion and soil crusting. It is therefore not surprising that climate variables typically are correlated with saturated and near-saturated hydraulic conductivities (Jarvis et al., 2013; Jorda et al., 2015; Hirmas et al., 2018; Gupta et al., 2021b). Jorda et al. (2015) found that land use itself was the most important predictor of saturated hydraulic conductivity.
The time of measurement of the hydraulic conductivity (or soil sampling) also has a crucial impact. In an agricultural soil, the hydraulic properties of a freshly prepared seedbed differ from those measured later at harvest. Several studies have demonstrated the evolution of hydraulic conductivity with time (Messing and Jarvis, 1990, 1993; Bodner et al., 2013; Sandin et al., 2017). Soil management options (such as tillage or the use of cover crops) actively influence the soil-saturated and near-saturated hydraulic conductivity. Information on their impact is therefore especially important but so far has hardly been investigated in meta-studies.
In this study, we focused on quantifying the effect of soil management practices on soil-saturated and near-saturated hydraulic conductivity, Kh. We also investigated relationships between Kh and other potentially important influencing factors like soil properties, local climate and details of the measurement methods. In this process, we expanded and published the previously unpublished meta-database of tension-disk infiltration measurements that was first reported by Jarvis et al. (2013). We refer to this database as OTIM in the following (Open Tension-disk Infiltrometer Meta-Database). It complements the currently available public databases on hydraulic conductivities, which are strongly based on laboratory measurements or ring infiltrometer methods.
2.1 Meta-database, OTIM
2.1.1 Data collection
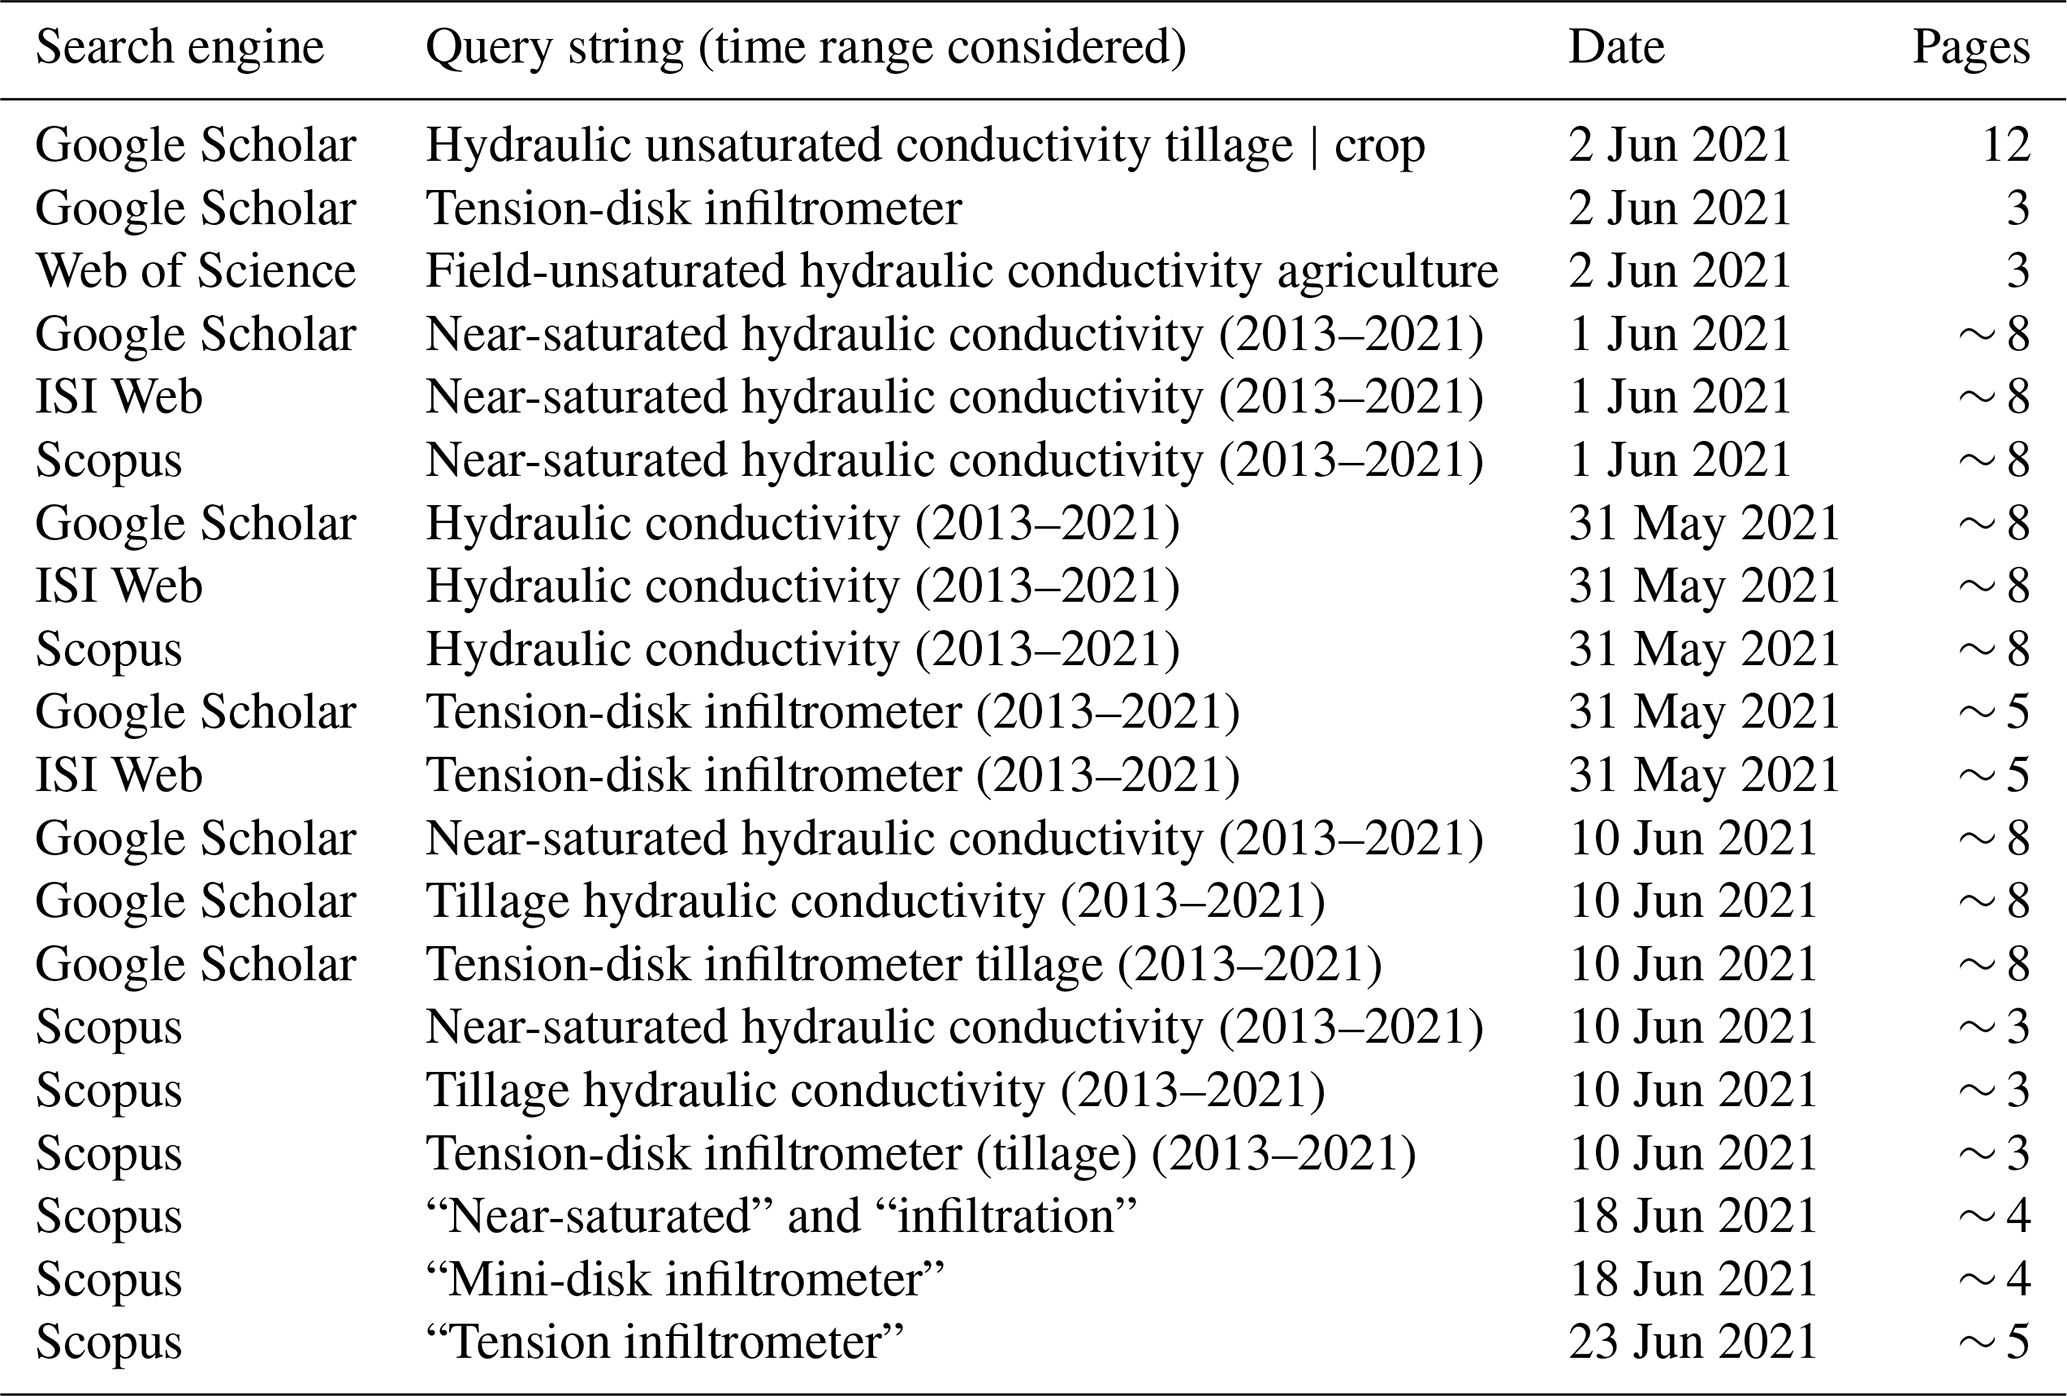
The first version of OTIM was compiled for the study by Jarvis et al. (2013). The original database contained 753 tension-disk infiltrometer data entries collated from 124 source publications covering 144 different locations around the globe. We have extended this database by 544 new tension-disk infiltrometer data entries from 48 additional studies that were published after 2012. The search for publications was carried out between 31 May 2021 and 23 June 2021 using the queries and search engines detailed in Table A1.
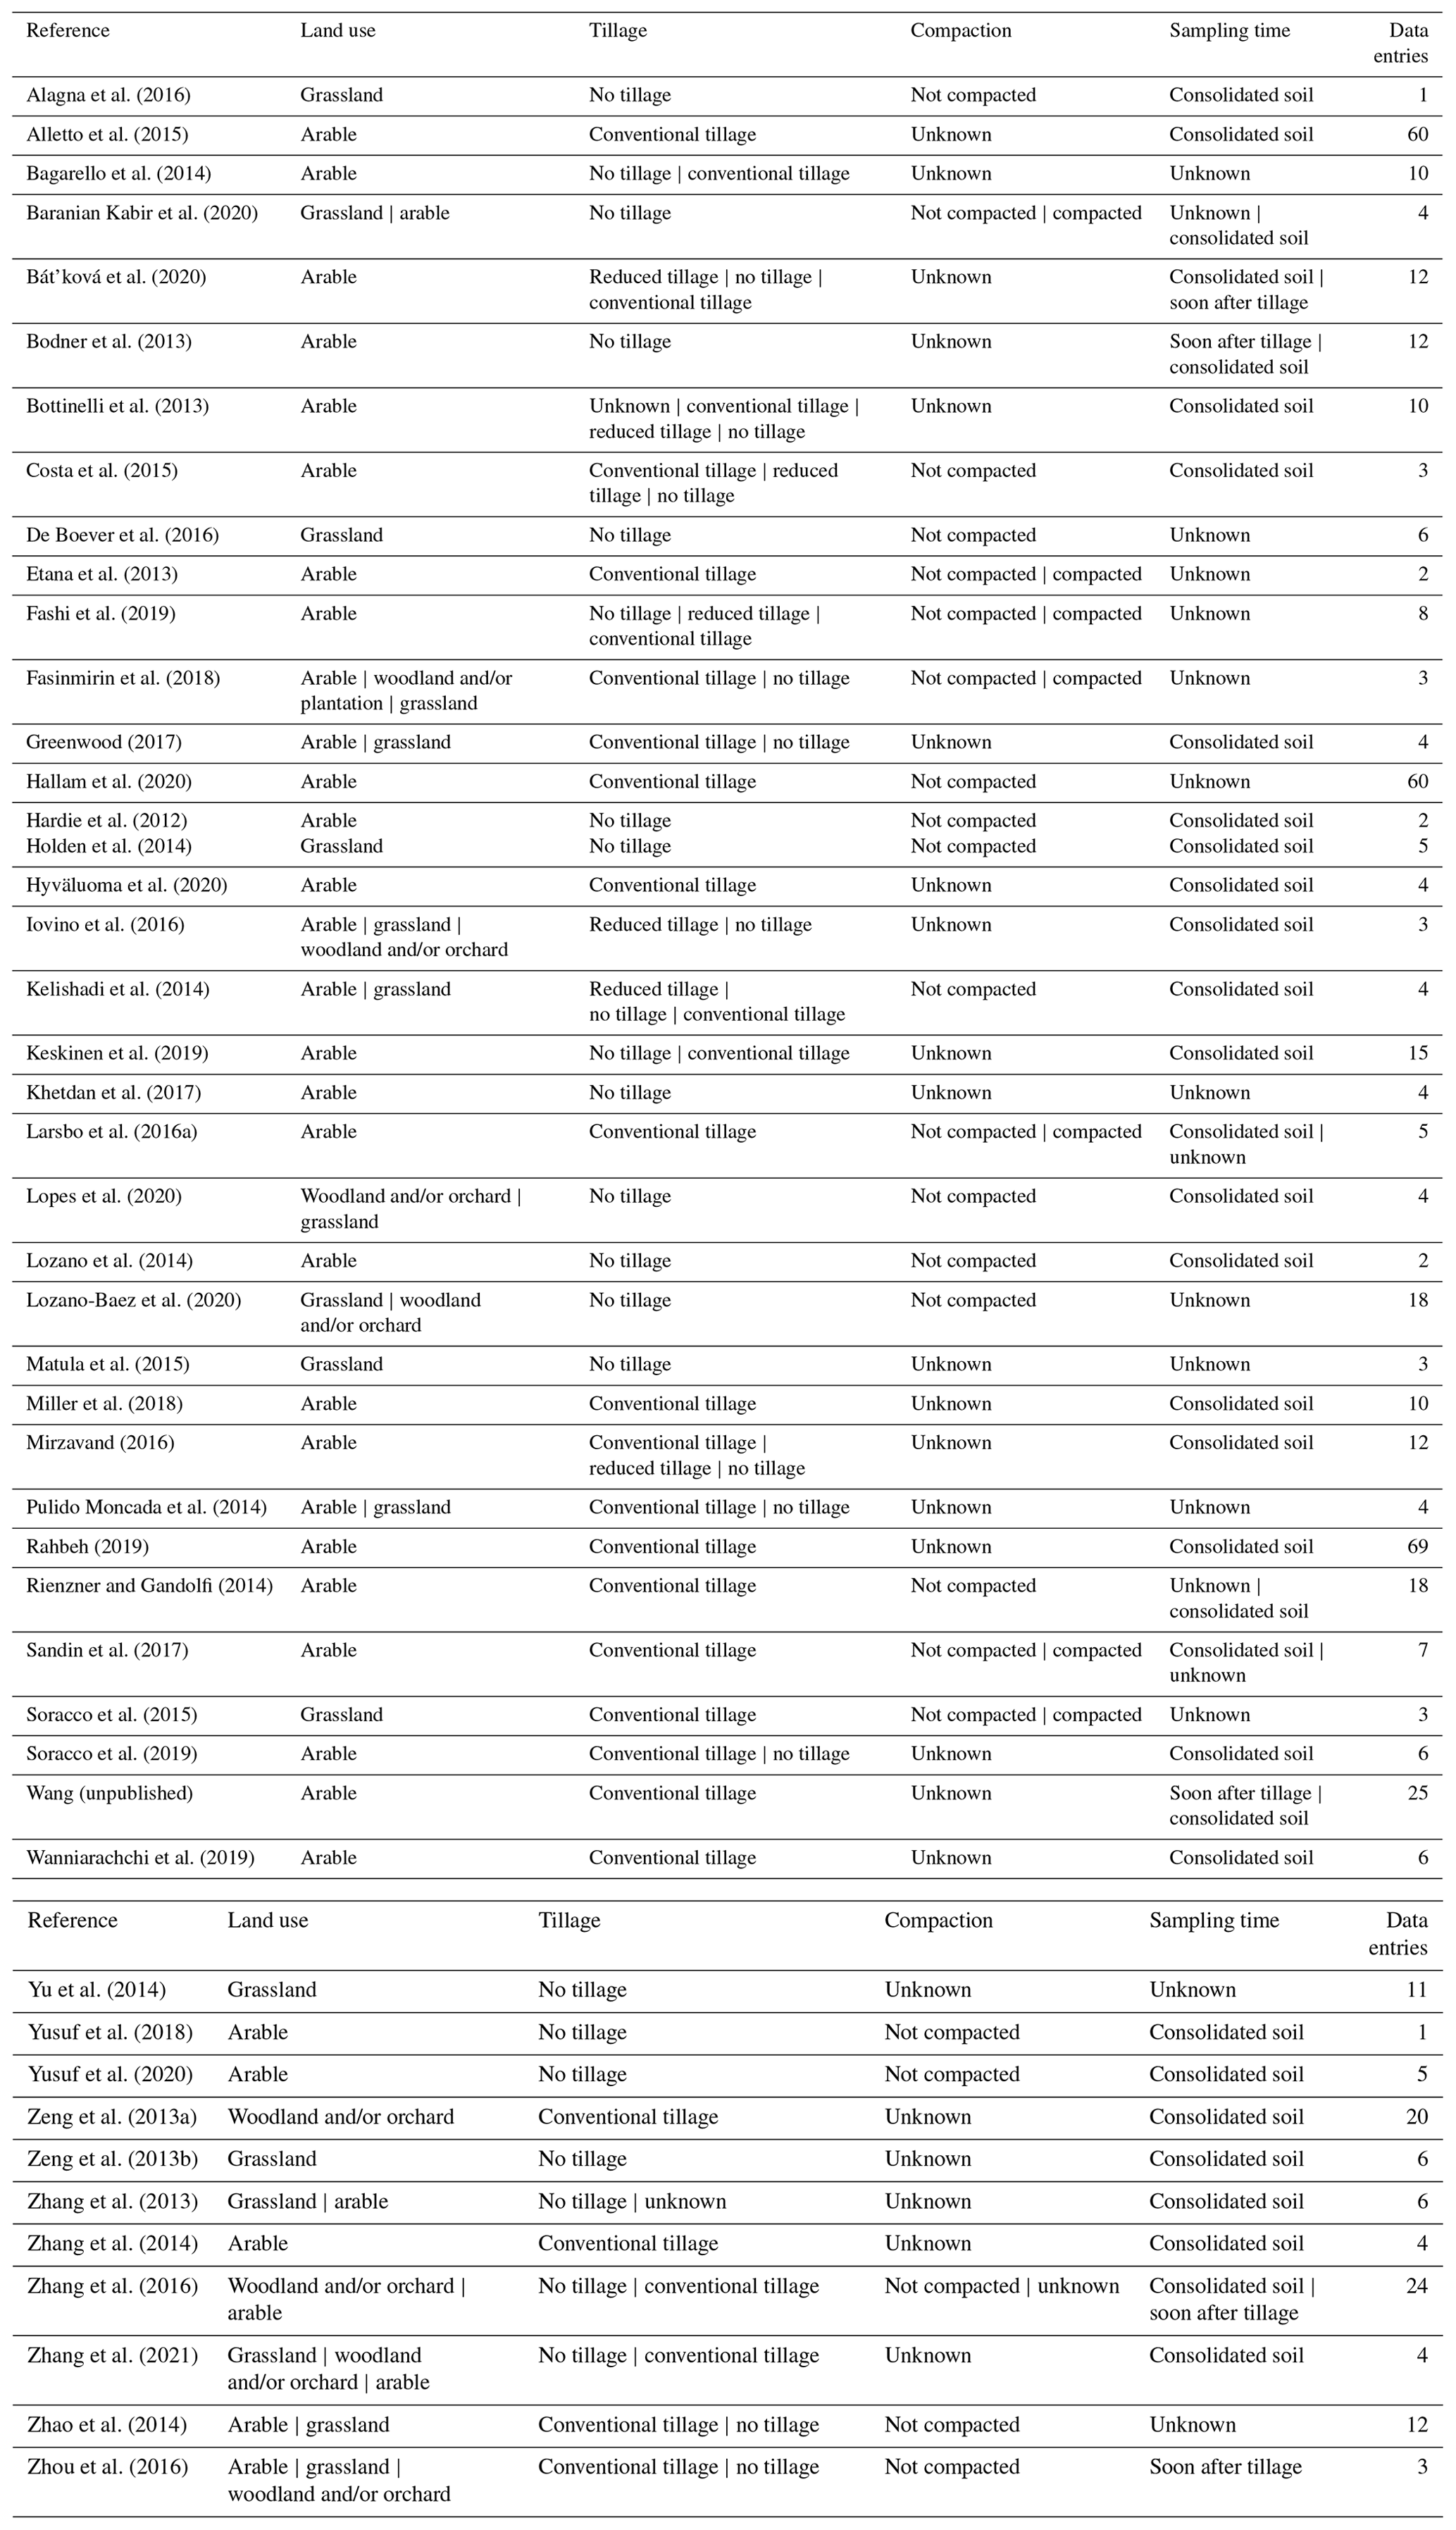
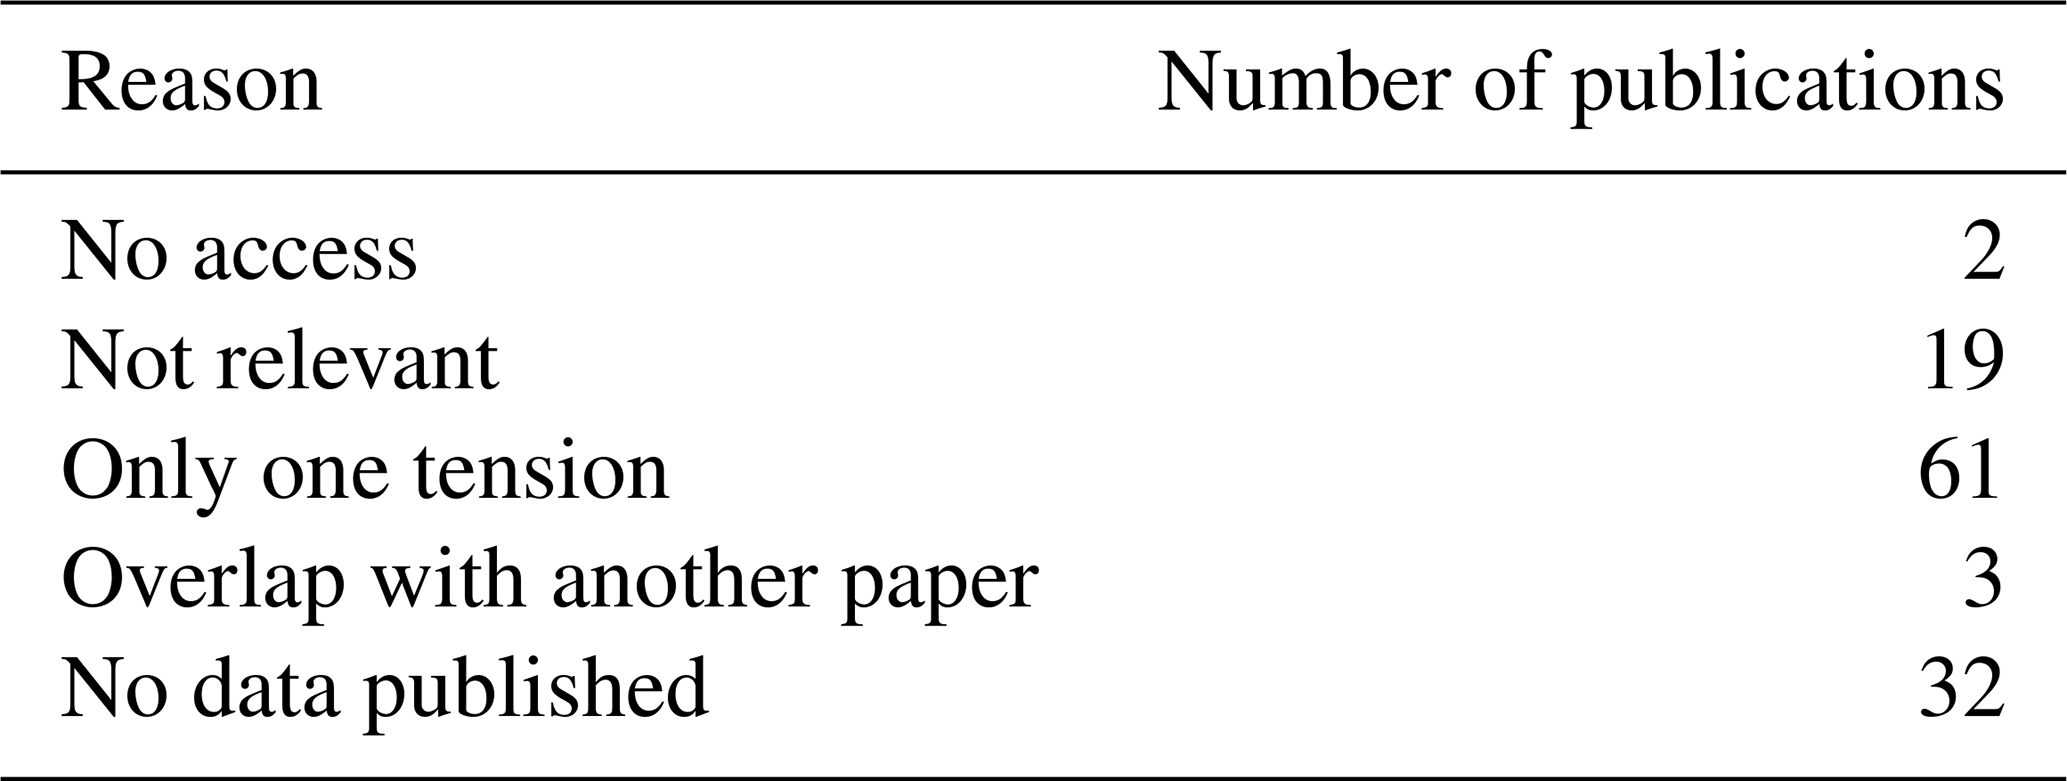
We found 115 publications containing tension-disk infiltrometer measurements published in 2013 or later. We retained the data for further analysis when (i) Kh or the infiltration rate was measured at more than two tensions larger or equal to 5 mm and (ii) sufficient meta-data on soil and site properties (at least soil texture) and soil management practices (at least land use and tillage) were available. If a publication only reported infiltration rates, we calculated hydraulic conductivity using the method of Ankeny et al. (1991). Only 45 of the 115 publications fulfilled the above-mentioned criteria. Table A2 summarizes how many papers were rejected and for which reasons. For 27 of the 45 retained studies, we digitized the published Kh values from figures using WebPlotDigitizer (open-source web-based software created by Ankit Rohatgi, https://automeris.io/WebPlotDigitizer/, last access: 14 July 2023). For cases in which Kh measurements were mentioned in a publication but the results were not reported, we contacted the corresponding authors. We received the data in this fashion for three of these publications (Alletto et al., 2015; Larsbo et al., 2016a; Meshgi and Chui, 2014). The new studies containing data were added to the OTIM database and are summarized in Table 1.
In addition to adding data from new publications to OTIM, we revisited the studies contained in the original version of the database and collected additional information on soil management practices associated with the measured data. For each soil management option, OTIM contains two columns. In the first column, the information as given in the source publication is stored. The second column summarizes this information into a few classes, which were subsequently used in the meta-analysis. In this study, we investigated effects of land use, tillage system, soil compaction and day of measurement relative to the latest tillage operation on the field. A compaction class was assigned to a data entry only if the plot had been described as “compacted” or “not compacted” in the source publication. Compacted data entries corresponded, for example, to infiltration measurements in wheel tracks or to plots of a compaction experiment. The day of measurement relative to tillage was also included, with the data labelled “freshly tilled” when the authors in the source publication stated that the measurements had taken place soon after tillage. Otherwise, it was assumed that the soil already had time to consolidate before the infiltration measurements were carried out. All soil texture data were mapped onto the USDA classification system using the method proposed in Nemes et al. (2001).
2.1.2 Climate data and soil classification
The climatic data entries provided in the database were created using the bioclimatic raster data (BioClim) provided by WorldClim (https://worldclim.org, last access: 14 July 2023). The data were averaged across the years 1970 to 2000 and had a 30 arcsec resolution (∼ 1 km2; Fick and Hijmans, 2017). The available climate variables were mean annual temperature, mean annual precipitation, the mean temperature and mean precipitation of the warmest, coldest, wettest and driest quarters and months, respectively, the isothermality, the mean diurnal and annual temperature range, the seasonality for temperature and precipitation. In addition to the bioclimatic data in WorldClim, we included the aridity index (here defined as the annual precipitation divided by the potential evapotranspiration) and the average annual potential evapotranspiration (ET0). Both were inferred from the Global Aridity Index and Potential Evapotranspiration Climate Database v2 that is based on the WorldClim database (Trabucco and Zomer, 2019). The World Reference Base (WRB) soil type was also extracted from the source publications. When this was not reported, the SoilGrids database by ISRIC (Poggio et al., 2021) was used to infer it. The map contained information about the main soil type regarding the WRB classes (IUSS Working Group WRB, 2015). The most probable soil type was chosen for each location. For all the discussed climate and soil maps, the Python package rasterio (v1.2.10) was used to collect the variables from the corresponding raster cell at the location coordinates given in the source publications.
2.1.3 Model fit to infer Kh at unmeasured near-saturated tensions
Tension-disk infiltrometers measure infiltration rates at a specific supply tension (Angulo-Jaramillo et al., 2000). They consist of a ceramic disk to which a water reservoir and a bubbling tower are attached. The ceramic disk is saturated and hydraulically connected to the soil by inserting a layer of fine sand between the disk and the soil surface. The supply tension at the bottom of the ceramic disk is adjusted by the bubbling tower. The measured unconfined (i.e. three-dimensional) infiltration rates are then commonly converted to hydraulic conductivities with the aid of the Wooding equation (Wooding, 1968). Note that unconfined tension-disk infiltrometers cannot provide measurements at a tension of zero, i.e. Ks. Even if many publications report Ks values obtained from tension-disk infiltrometers, these measurements must have been conducted at tensions slightly larger than zero, as water would otherwise have freely leaked out of the tension disk. For this reason, we set the tensions for Ks measurements to 1 mm but still refer to these data as saturated hydraulic conductivity. Note that we discuss matric potentials in terms of tensions (negative pressures) throughout this paper. For convenience, we denote Kh at a specific tension by replacing the subscript “h” with the tension value in millimetres. For example, K100 denotes Kh at a supply tension of 100 mm.
Following Jarvis et al. (2013), we interpolated Kh for tensions between the ones measured in the source publications. We achieved this by fitting a log–log linear model with a kink at a tension hmin, which denotes the tension at which the largest effective pores in the soil are water-filled (see Fig. 1). Therefore, Kh≡Ks for all tensions h≤hmin. If Ks was not measured but instead a Kh value at h≤ 5 mm was available, Ks was set to the available Kh value (Fig. 1, orange line). In cases where more than one Kh value was measured at a tension smaller than or equal to 5 mm (including h = 0 mm, i.e. Ks), we averaged them and fixed Ks and Kh for h≤hmin to the average (Fig. 1, green line). Kh values at h > 5 mm were used to fit the log–log linear relationship. The tension at which the fitted log–log slope intersected with Ks is defined as hmin. We used the fitted model to estimate all Kh values for tensions for 100 mm at 10 mm intervals. The Kh values were only interpolated between the tensions that were measured in the source publication. The only exceptions to this rule were made in the case where a Kh value for a tension of 80 or 90 mm was provided together with at least one other Kh value measured at a smaller tension. Then, the missing Kh values were extrapolated up to a tension of 100 mm. Figure 1 shows examples of model fits. Only entries with an R2 greater than or equal to 0.9 were retained in the analysis.
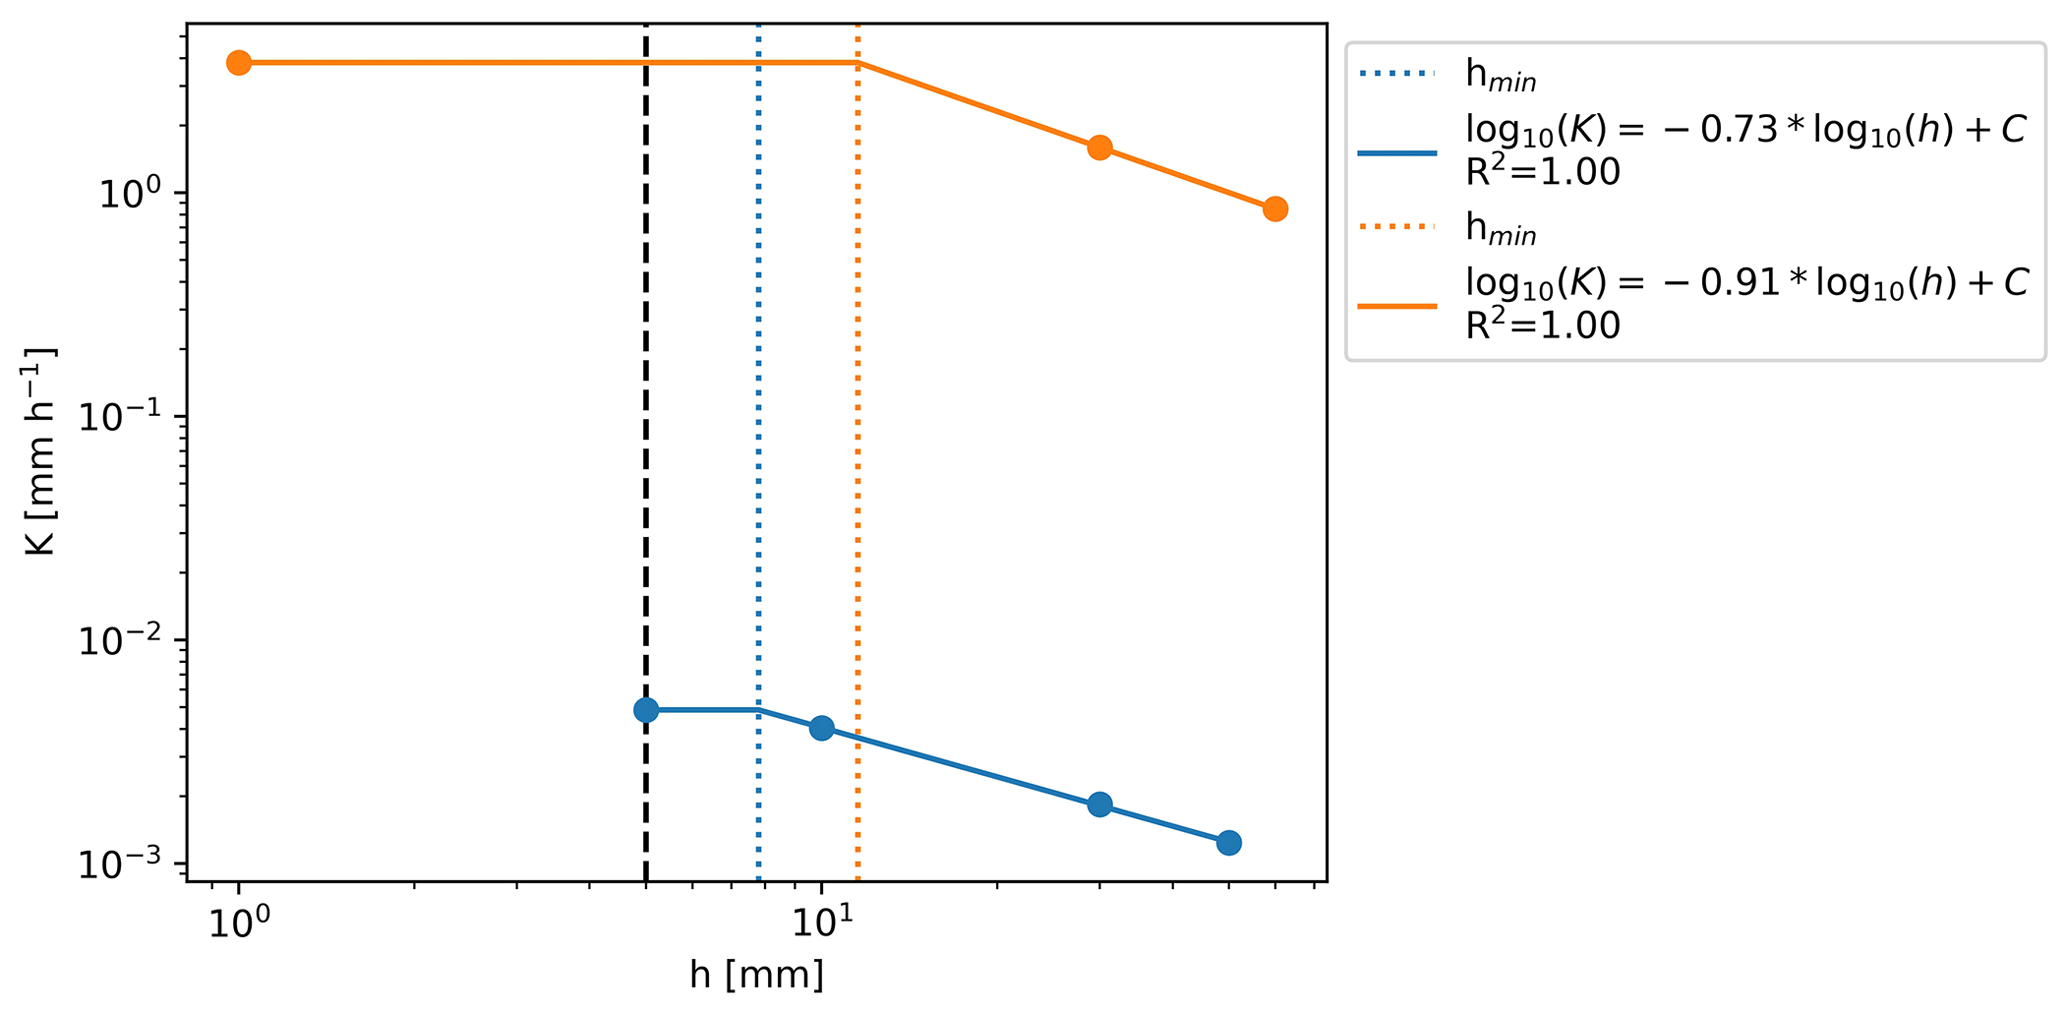
Figure 1Two examples of the linear fit in log–log space. The colours denote two differently measured tension series. The filled circles correspond to measured Kh, while the lines indicate the interpolation carried out by the model. The bold black dashed line marks a supply tension of 5 mm. Kh values at tensions between 0 and 5 mm were assumed to be identical to Ks. Reported Ks values were assigned a tension of 1 mm for illustration purposes. The equations for the linear part of the fit are shown in the legend. C represents the intercept with the y axis of the linear fit in log space and hmin corresponds to the supply tension at which the largest pores in the soil are water-filled.

Figure 2Map of the study locations collected in OTIM. The values are shown for the filtered entries (“focus”) and in parentheses for all the entries available in the database (“focus” and “extra”).
2.2 Data availability and spatial coverage
Although 92 % of the OTIM data are from topsoils, OTIM also contains some data points measured at greater soil depths. In the following meta-analysis, only measurements from the topsoil were included to prevent bias, and all data sets measured at soil depths below 200 mm were removed. Last but not least, we found that the relationship between supply tension and Kh was distorted if data entries were included that did not cover the complete tension range from h = 0 to 100 mm. Possible reasons for the difficulties in matching Kh data from tension series with different lengths are discussed at the beginning of the Results and Discussion sections. Otherwise, we focused on data entries that included Kh values for the complete tension range in the exploratory data analysis and the meta-analyses. The available data sets after these filtering steps correspond to the ones indicated in blue (and termed “focus”) in the following figures.
Most tension-disk infiltrometer studies were conducted in Europe, North America and south-eastern Australia (Fig. 2). Clearly, fewer studies have been carried out in Asia, South America and Africa. The lack of data sets from Russia, Mesoamerica, the Arctic regions and the tropics is remarkable. This geographical bias is aggravated if only measurements of the topsoil are considered that allow inferences of Kh for the complete range of tensions ( 100 mm) with a sufficiently good coefficient of determination. Then, almost all the data entries collected in southern South America and south-eastern Australia were omitted as well. Overall, the data in OTIM mostly stem from temperate climate regions.
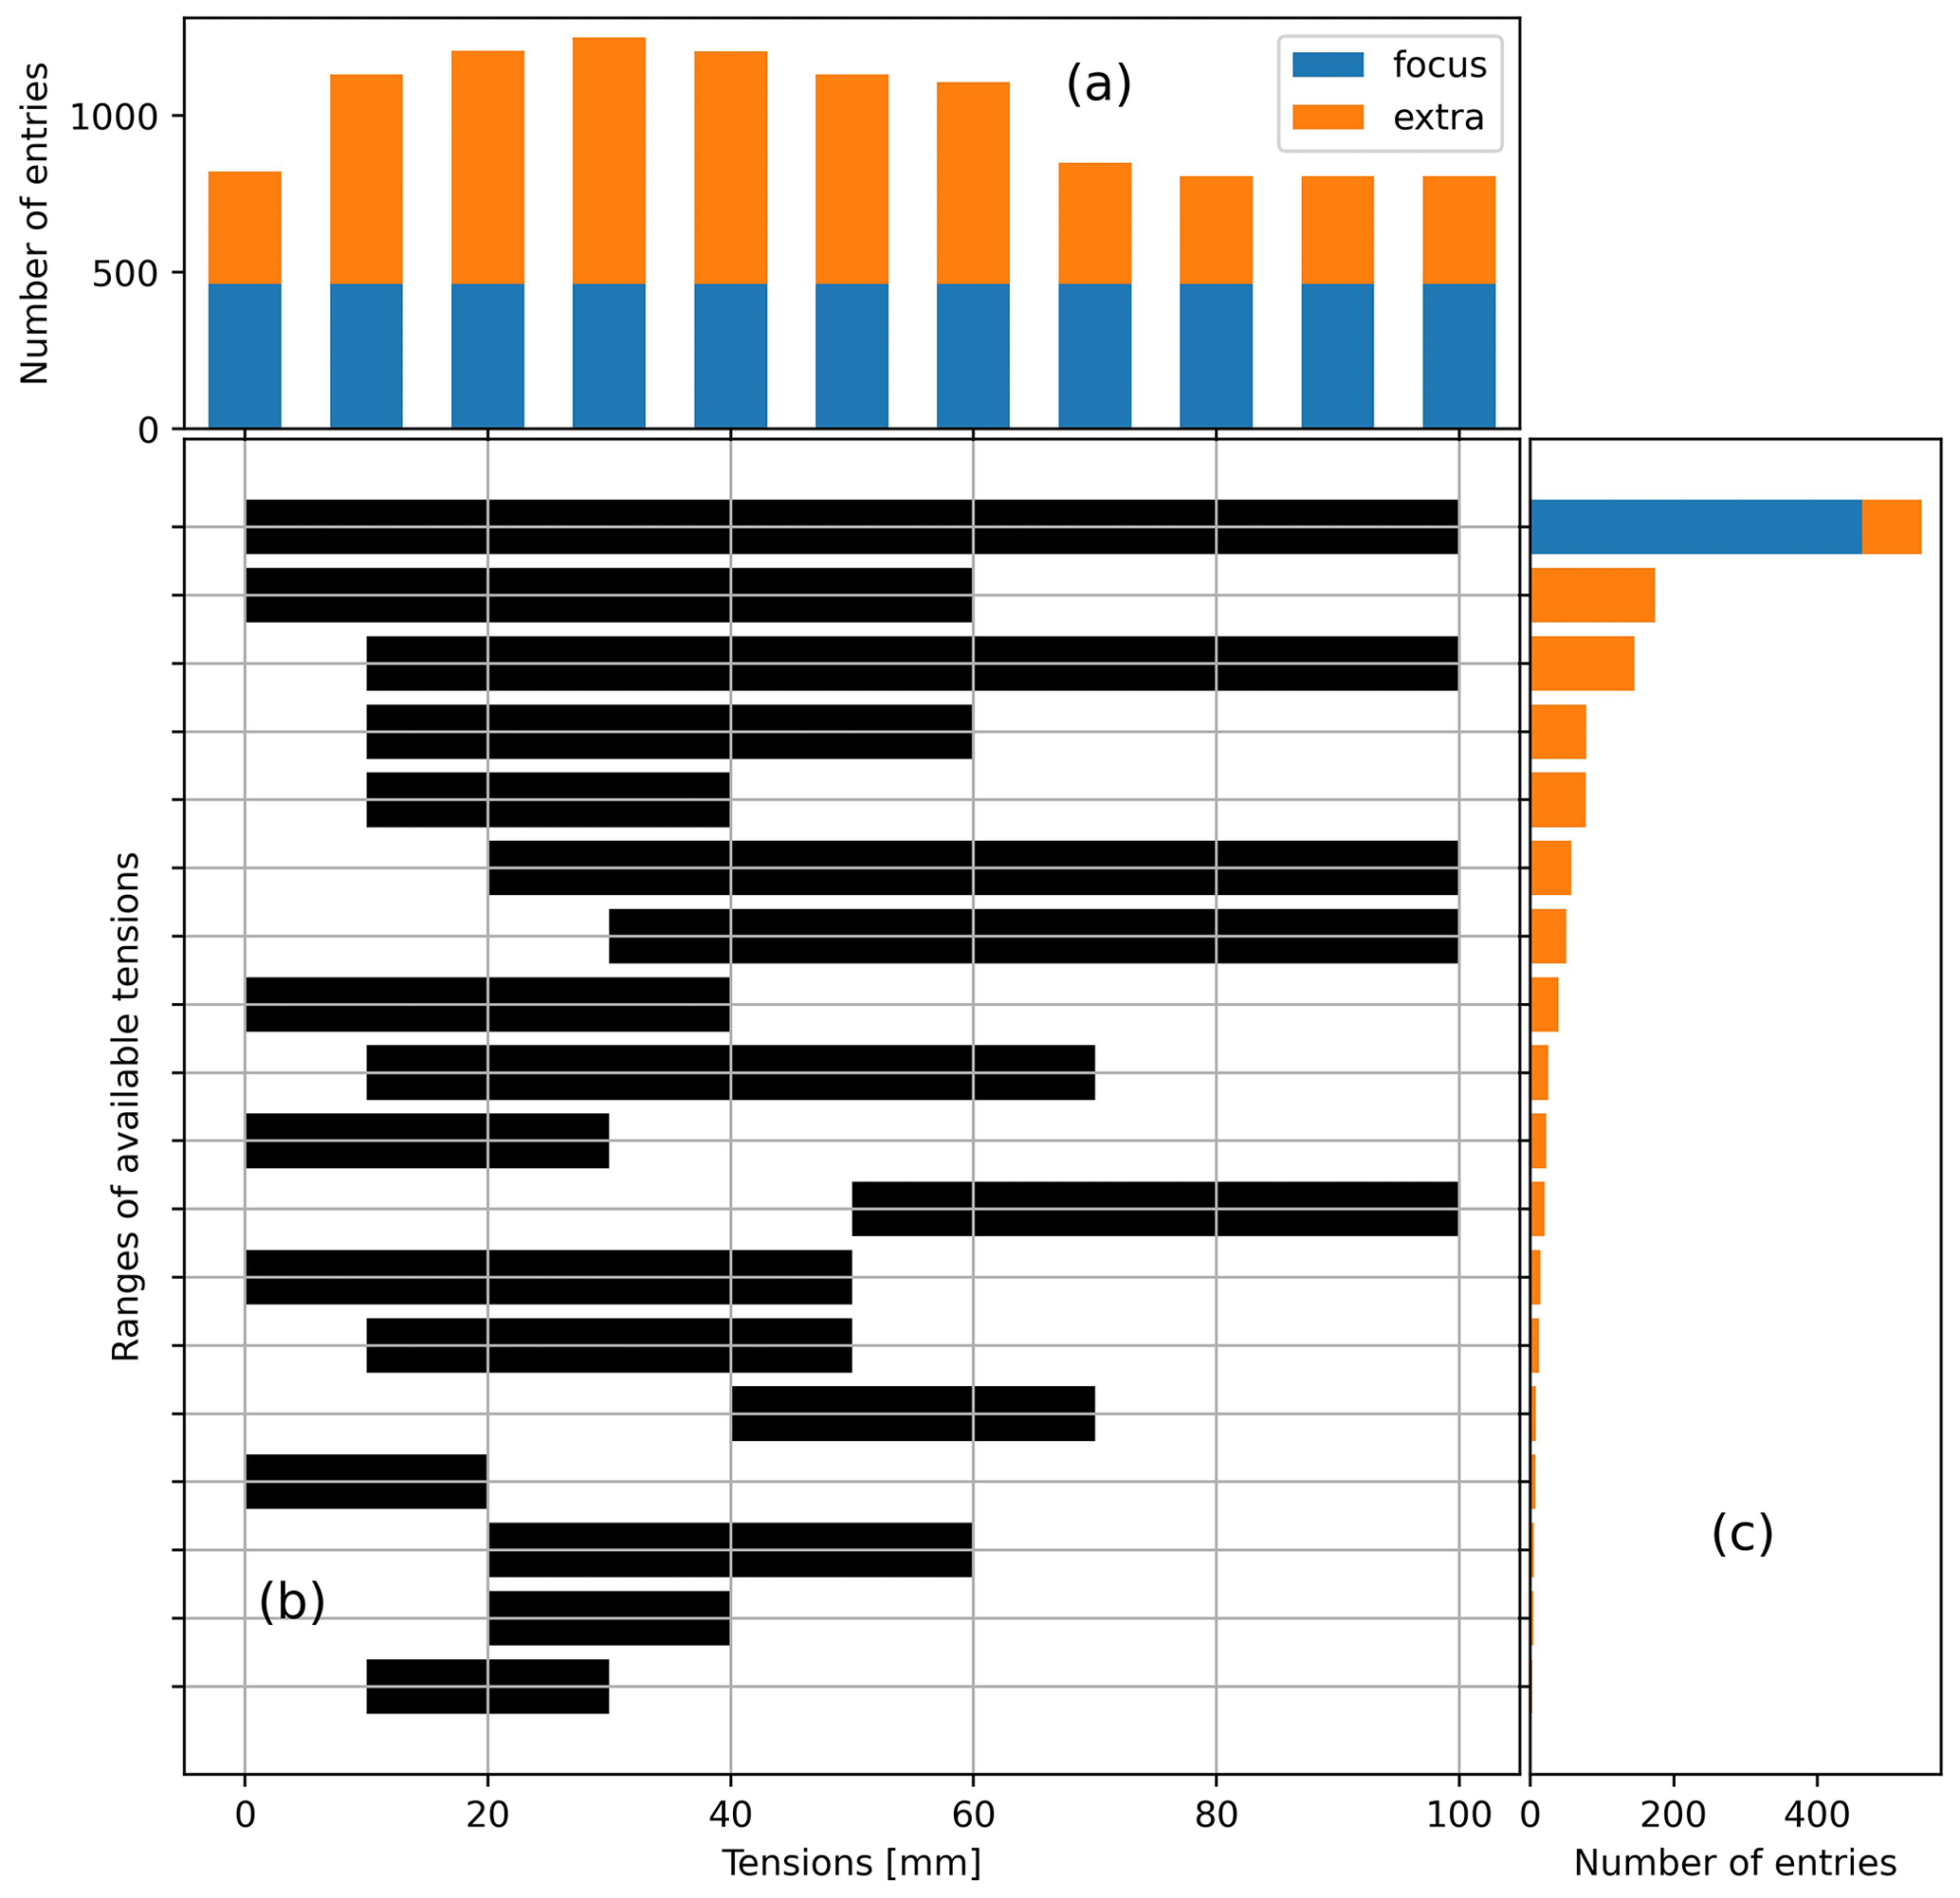
Figure 3(a) Number of available Kh values per supply tension, (b) available tension series with the black bar indicating the span between Tmin and Tmax and (c) their respective frequency in the database. The values are shown for the filtered entries (focus) and for all the entries available in the database (focus and extra).
Table 2Number of entries and gaps for each feature along with units and ranges (if continuous) or choices (if categorical). The values are shown for the filtered entries (“focus”) and in parentheses for all the entries available in the database (“focus” and “extra”). CV stands for coefficient of variation.
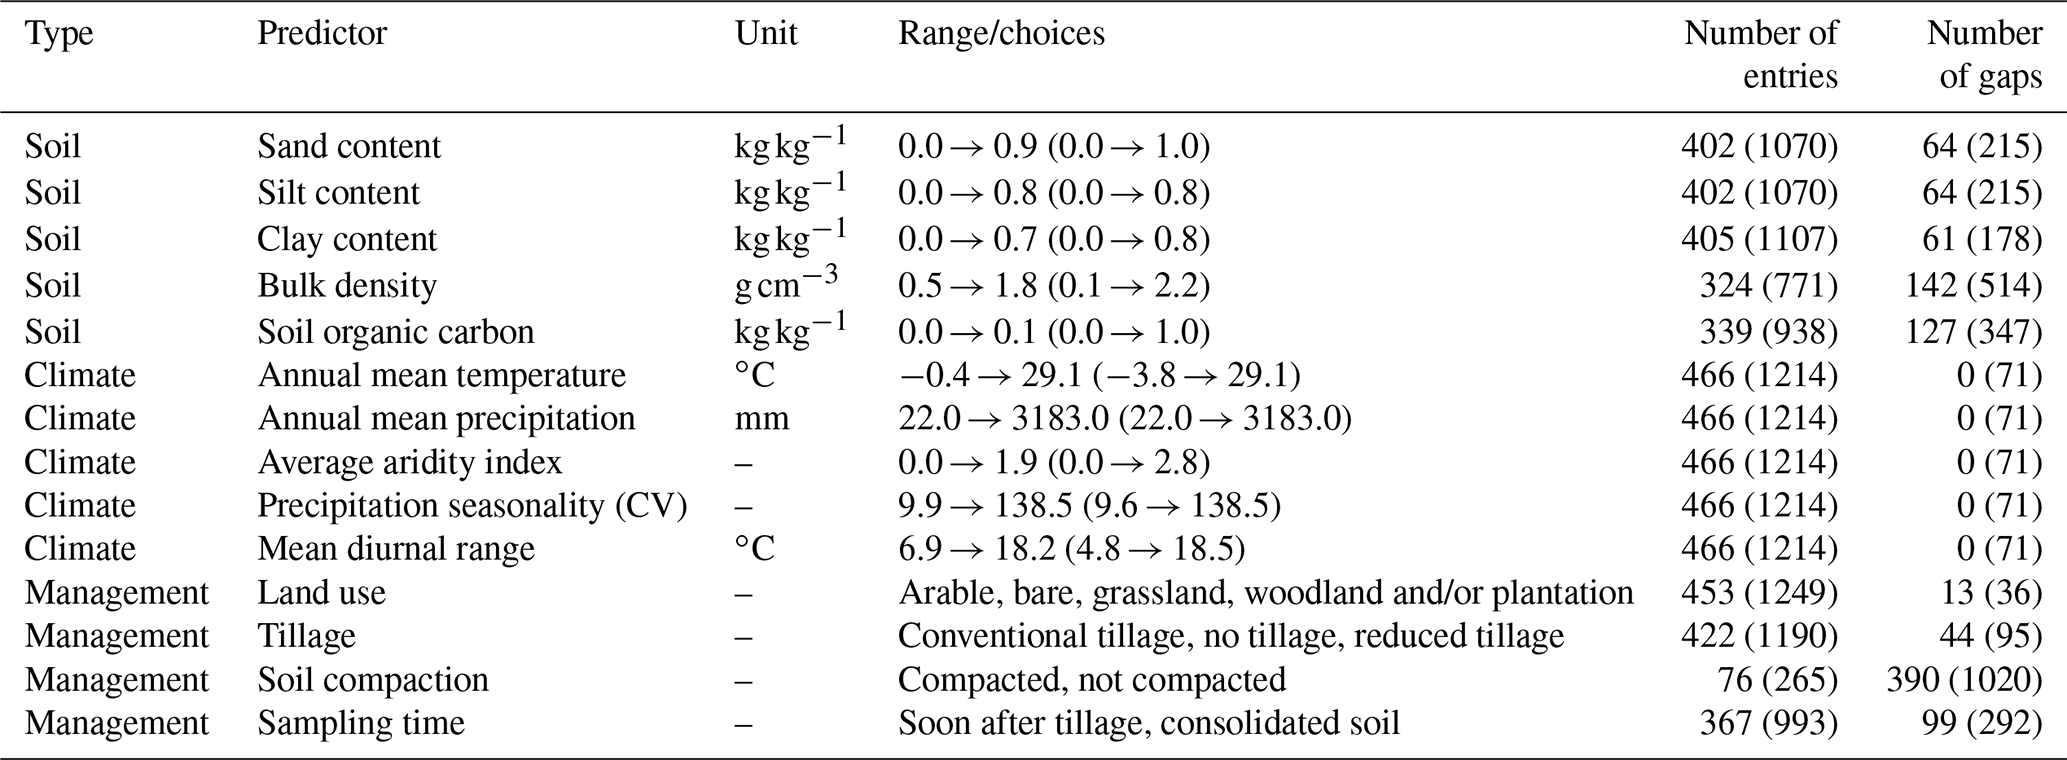
Figure 3 depicts the number of Kh values available for 100 mm. These figures represent the hydraulic conductivities derived from the log–log linear model presented above, not the raw data measured and reported in the source publications. A large number of entries spans the full range of tensions of interest (0 to 100 mm), whereas a smaller number of entries only has data up to a tension of 60 mm. Often, but not always, such data series were obtained with the widely available mini-disk infiltrometer distributed by the Meter group (formerly by Decagon), which is limited to tensions h≤ 70 mm. An overview of the meta-data included in OTIM is given in Table 2. Data gaps are present, especially for bulk density and for information on the soil management at the study site, apart from tillage operations. Note that the annual mean temperature and precipitation are only two examples representing the climatic variables enumerated in Sect. 2.3. There are very few missing values for the climate data, since they were estimated from the coordinates of the study sites. The same holds for the elevation data and information on the WRB soil type.
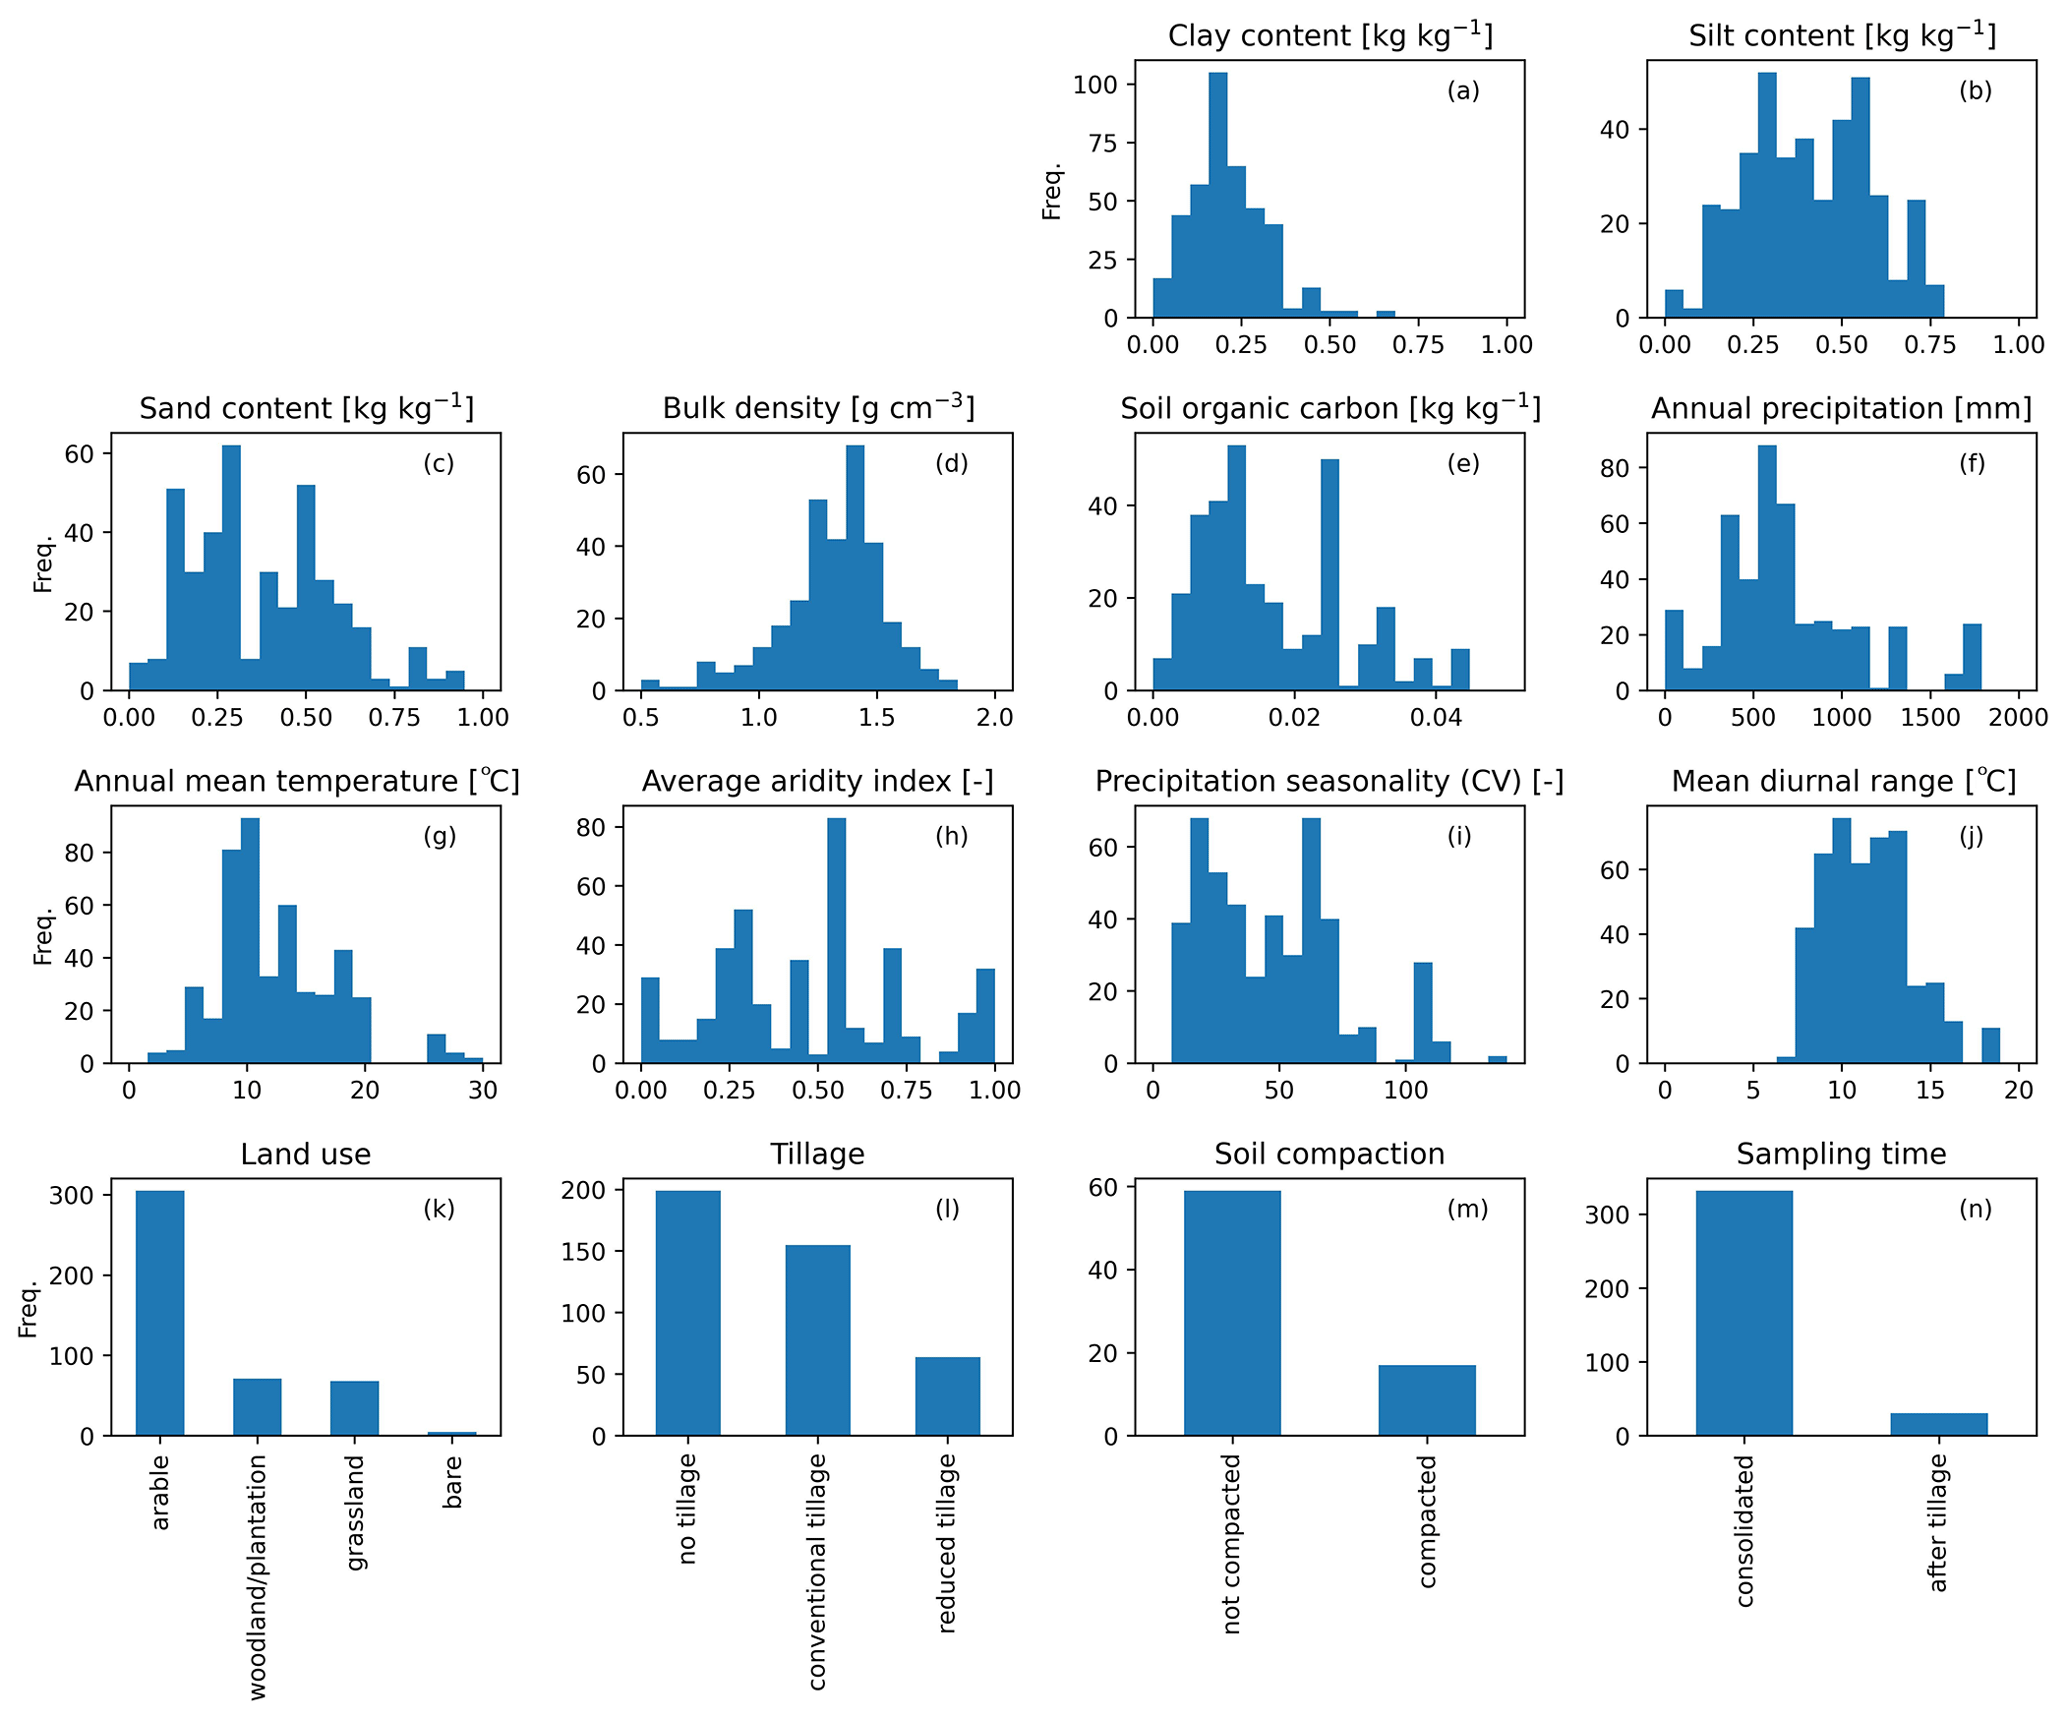
The meta-data for the data sets used in the exploratory data analysis are summarized in Fig. 4. OTIM contains predominantly data from arable fields. The distributions of the climate variables confirm that the data in OTIM were also mostly acquired in temperate climates, with a bias towards the somewhat drier climates that are most typical for arable land. The soil texture, bulk density and organic carbon content data also appear to be reasonably representative of soils in this climate zone.
2.3 Exploratory data analysis
Some source publications only provided a few data entries for Kh, sometimes only comparing two different treatments, while other source studies contain data for a larger number of treatments and/or sites. In some publications, data for all individual tension-disk measurements are available even if replicates were measured. In others, only averages of the replicated measurements are reported, while still others yield average Kh values for individually replicated treatment blocks. This makes appropriate data weighting complicated but also extremely important when analysing the meta-data set. It also introduces uncertainty, because it is not always clear whether the replicated averages were calculated using the geometric or arithmetic mean. Considering that hydraulic conductivities at or near saturation are known to be log-normally distributed, the former would be best. In the following, we assumed that geometric averaging was used when replicated values were reported in source publications. In the following, we calculated data weights as
where ωi is the weight for data entry i, nr,i is the number of replicates from which the values of i were averaged, and Ni is the total number of measurements included in the publication from which data entry i was obtained. With this approach, we up-weighted data entries according to the number of replicate measurements from which they were averaged and down-weighted the impact of studies that published larger numbers of data.
We used weighted Spearman rank correlation coefficients to investigate relationships between continuous variables. We considered correlations to be significant if they exhibited p values of less than 0.05. The latter were determined numerically by running randomization tests with 200 repetitions.
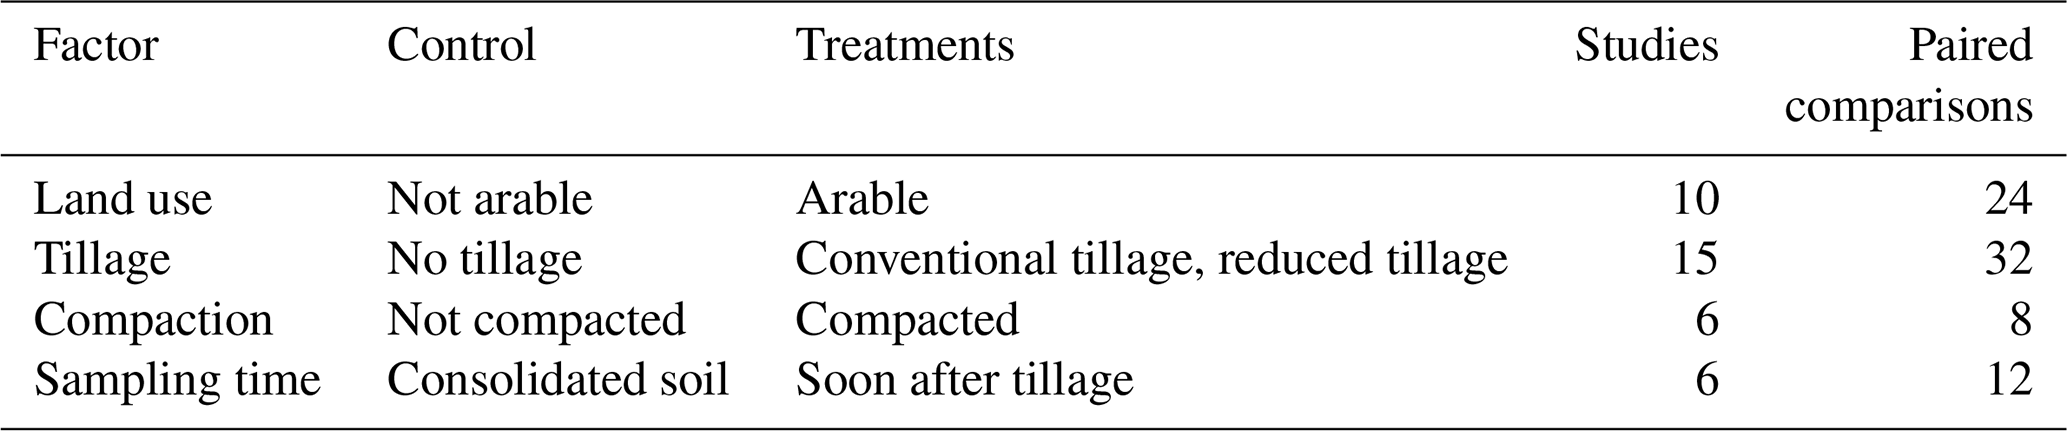
Table 3Number of studies and paired comparisons with their respective control and treatment values used for the meta-analysis exemplary for the K100 values.
2.4 Meta-analysis
Data entries in OTIM with specific land use or management were very unevenly distributed. For example, the large majority of data were measured on sites with land use “arable” (see Fig. 4a). Such uneven distributions may lead to bias when averaged over all entries of a specific feature in exploratory data analyses. We therefore investigated the effects of land use and management as well as soil compaction and time of measurement on Kh with the aid of pairwise comparisons published within individual studies and calculated effect sizes (ESs) for each investigated class.
To reduce bias arising from the varying number of data entries published within individual studies, we grouped all entries according to the factors land use, tillage, compaction and sampling time. Here we only considered binary pairs, which are arable or not arable in the case of land use and tilled or not tilled, compacted or not compacted and “measured soon after tillage” or “measured on consolidated soil” for the other three factors. In addition, we checked whether different entries within individual studies stemmed from the same site or a very similar site. We did this by comparing the respective USDA texture classes and a climate variable, i.e. the aridity class. All data entries within each individual study that exhibited identical land use, soil management, soil compaction, sampling time, texture and aridity were averaged, and the number of corresponding replicates was summed.
For each binarized factor (e.g. tillage), a control value was chosen (e.g. zero tillage). All values different from the control were represented by the treatment (e.g. conventional tillage and reduced tillage). Within individual studies, pairs among the averaged entries were formed for each combination of a control value and a treatment value. These pairs were used to compute the effect size. Following Basche and DeLonge (2019), we defined the effect sizes as log10 of the ratio of Kh,t of the treatment divided by Kh,c of the control:
where the subscript l indicates the lth pair for which the effect size was computed and the indices “t” and “c” stand for the treatment and control, respectively. The average ES for each of the four investigated factors was calculated as the weighted mean of the individual ESl using the weight
where the subscript l indicates again the lth pair for which the effect size was computed and νc and νt denote the number of (summed) replicates for the control and treatment, respectively. In addition, we calculated the weighted standard error
where is the mean effect size. Table 3 summarizes the evaluated factors, the number of pairs involved and the number of different studies from which the pairs were obtained.
To estimate the robustness of the effect size, we carried out a sensitivity analysis using the jackknife technique, similarly to Basche and DeLonge (2019). This method aims to show the sensitivity of the averaged effect size to data from specific studies. For each factor, a given number of studies was randomly picked and removed from the data set. The averaged effect size and its standard error were computed with the rest of the data set. The process started by removing one study, after which up to nine more studies were removed. This random selection was repeated 50 times to rule out bias. The average of the means and standard errors for the 50 realizations was computed and plotted. Observed effect sizes were judged to be trustworthy if they did not change after removal of studies to calculate them. We constrained the sensitivity analyses in our study to the effect sizes for Ks and K100.
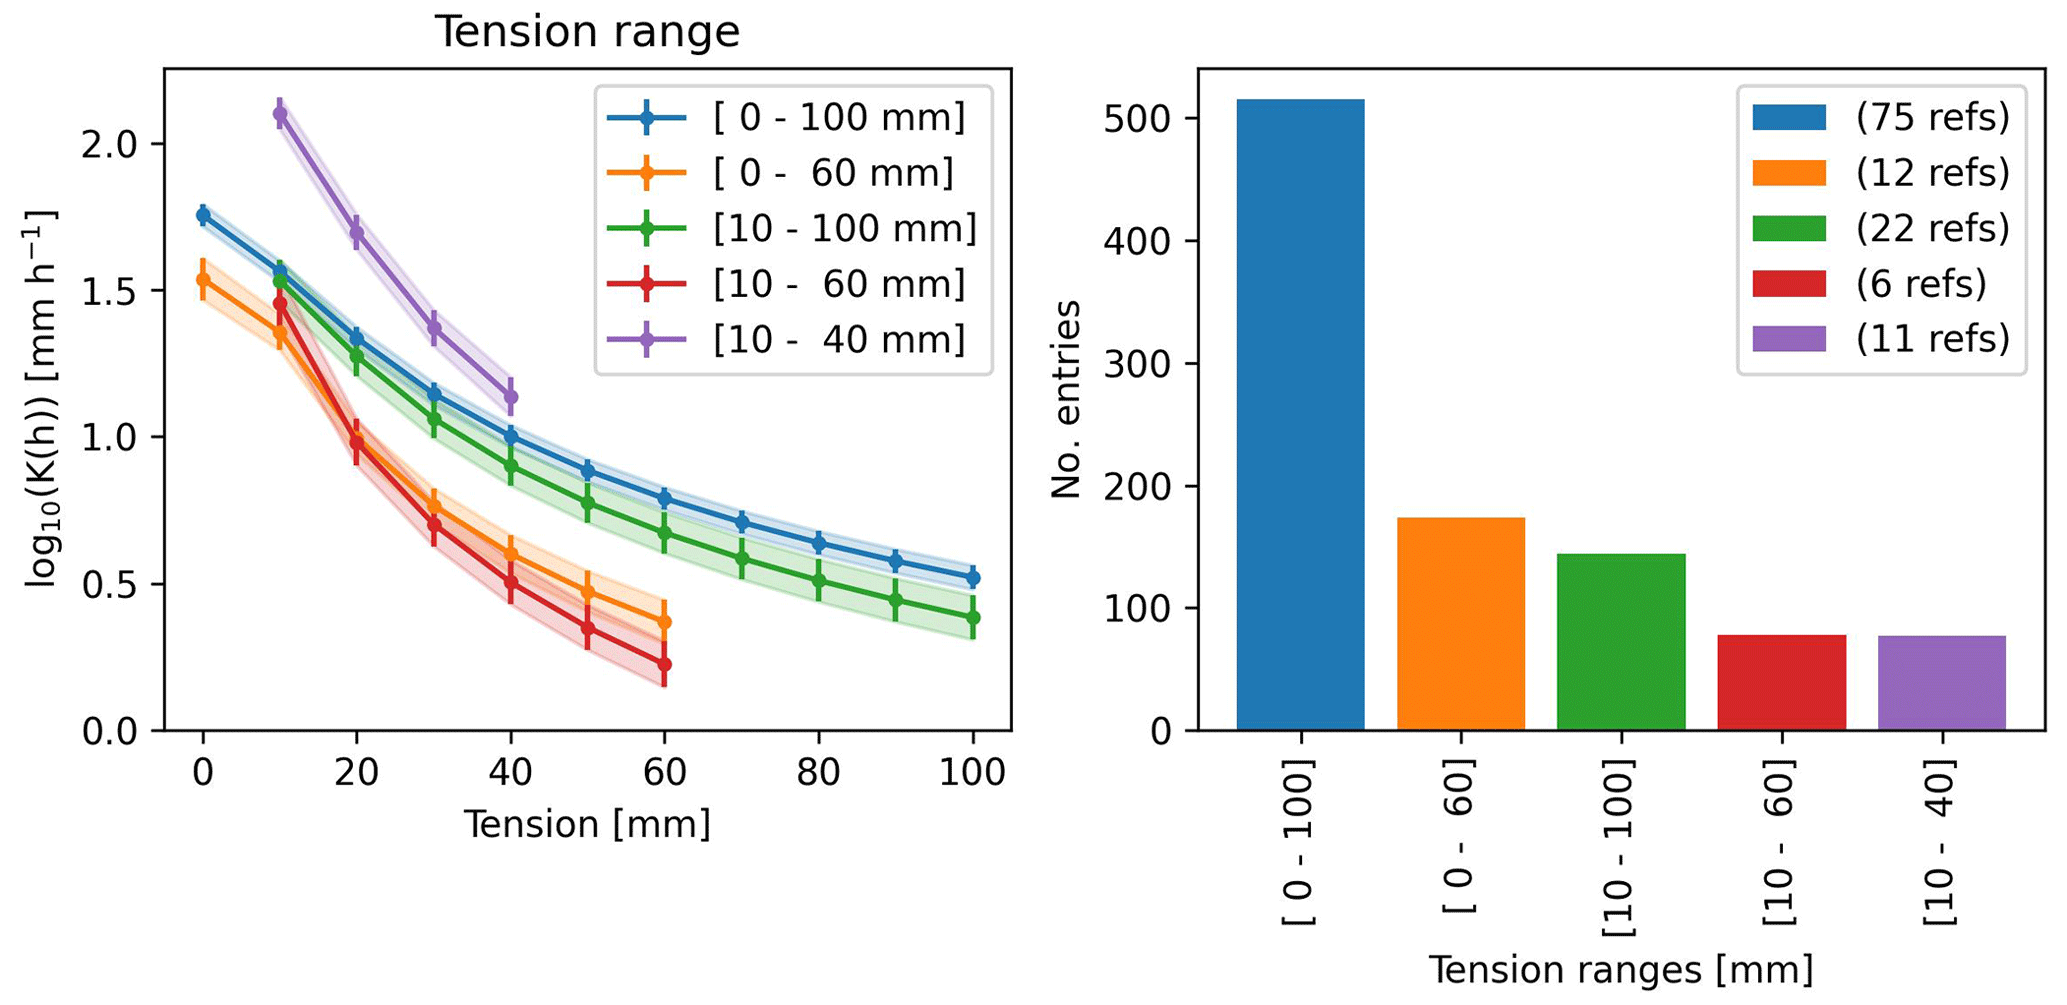
Figure 5Evolution of the weighted mean Kh with tension available in OTIM, sorted by the tension range the data were spanning. The number of publications from which the data originated is shown in parentheses in the legend. The shaded areas and the error bars represent the weighted standard error of the mean.
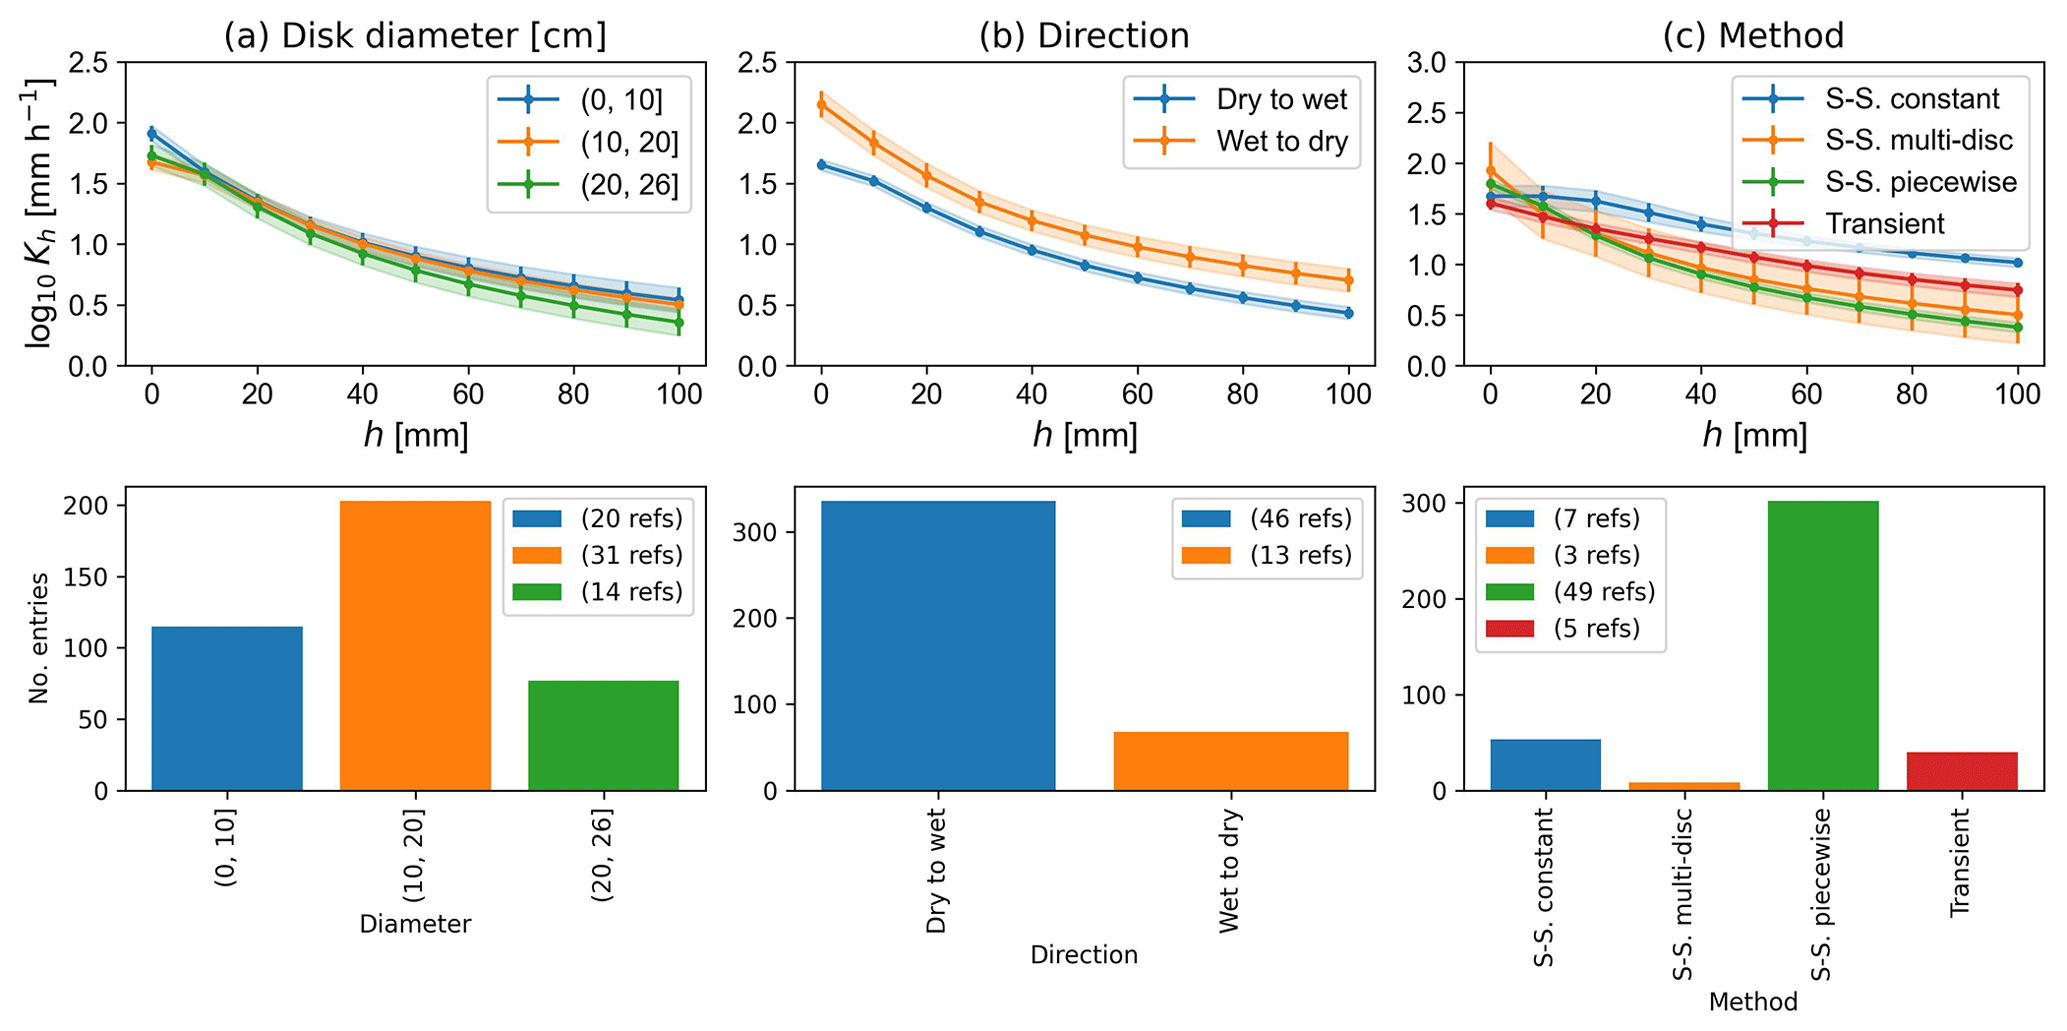
Figure 6Evolution of the weighted mean Kh as a function of applied tension for the (a) disk diameter, (b) direction and (c) method of fitting. “S.-S.” stands for “steady-state”. More specifically, the method “S.-S. constant” is outlined in Logsdon and Jaynes (1993), “`S.-S. multi-disc” in Smettem and Clothier (1989), “S.-S. piece-wise” in Reynolds and Elrick (1991) or Ankeny et al. (1991) and “Transient” in Zhang (1997) or Vandervaere et al. (2000). The shaded areas and the error bars represent the weighted standard error of the mean. The bar plots in each subplot indicate how many data points of each class were in the data set.
3.1 Differences between data entries with different tension ranges
If all data are considered (focus and extra), Fig. 3 illustrates that approximately 40 % of the data in OTIM provided Kh for every h with 100 mm. For another 40 %, Kh was only measured in the wet range, i.e. at tensions below 70 mm. The remaining Kh data were only acquired in the dry range. Here, we counted all data entries for which Ks was not measured and could not be estimated. Figure 5 shows how data from entries with complete, dry and wet ranges differed. The Kh for the wet range receded more quickly with increasing tension than series that also included measurement in the dry range. A large portion of these data sets was obtained with the mini-disk infiltrometer. However, a closer inspection of the impact of the disk diameters used to acquire the respective Kh did not confirm suspicions that the bias was related to the use of this special type of infiltrometer (see Fig. 6a). Instead, the observed differences between the Kh curves could have been introduced by co-correlations with soil texture or climate. Another explanation may be experimenter bias, since individual research groups tend to use specific tension ranges for more than one study. In this study, however, we focused solely on data entries for which we were able to reconstruct Kh for all h between 0 and 100 mm supply tension in the following exploratory data analyses and meta-analyses. This greatly facilitated the data interpretation.
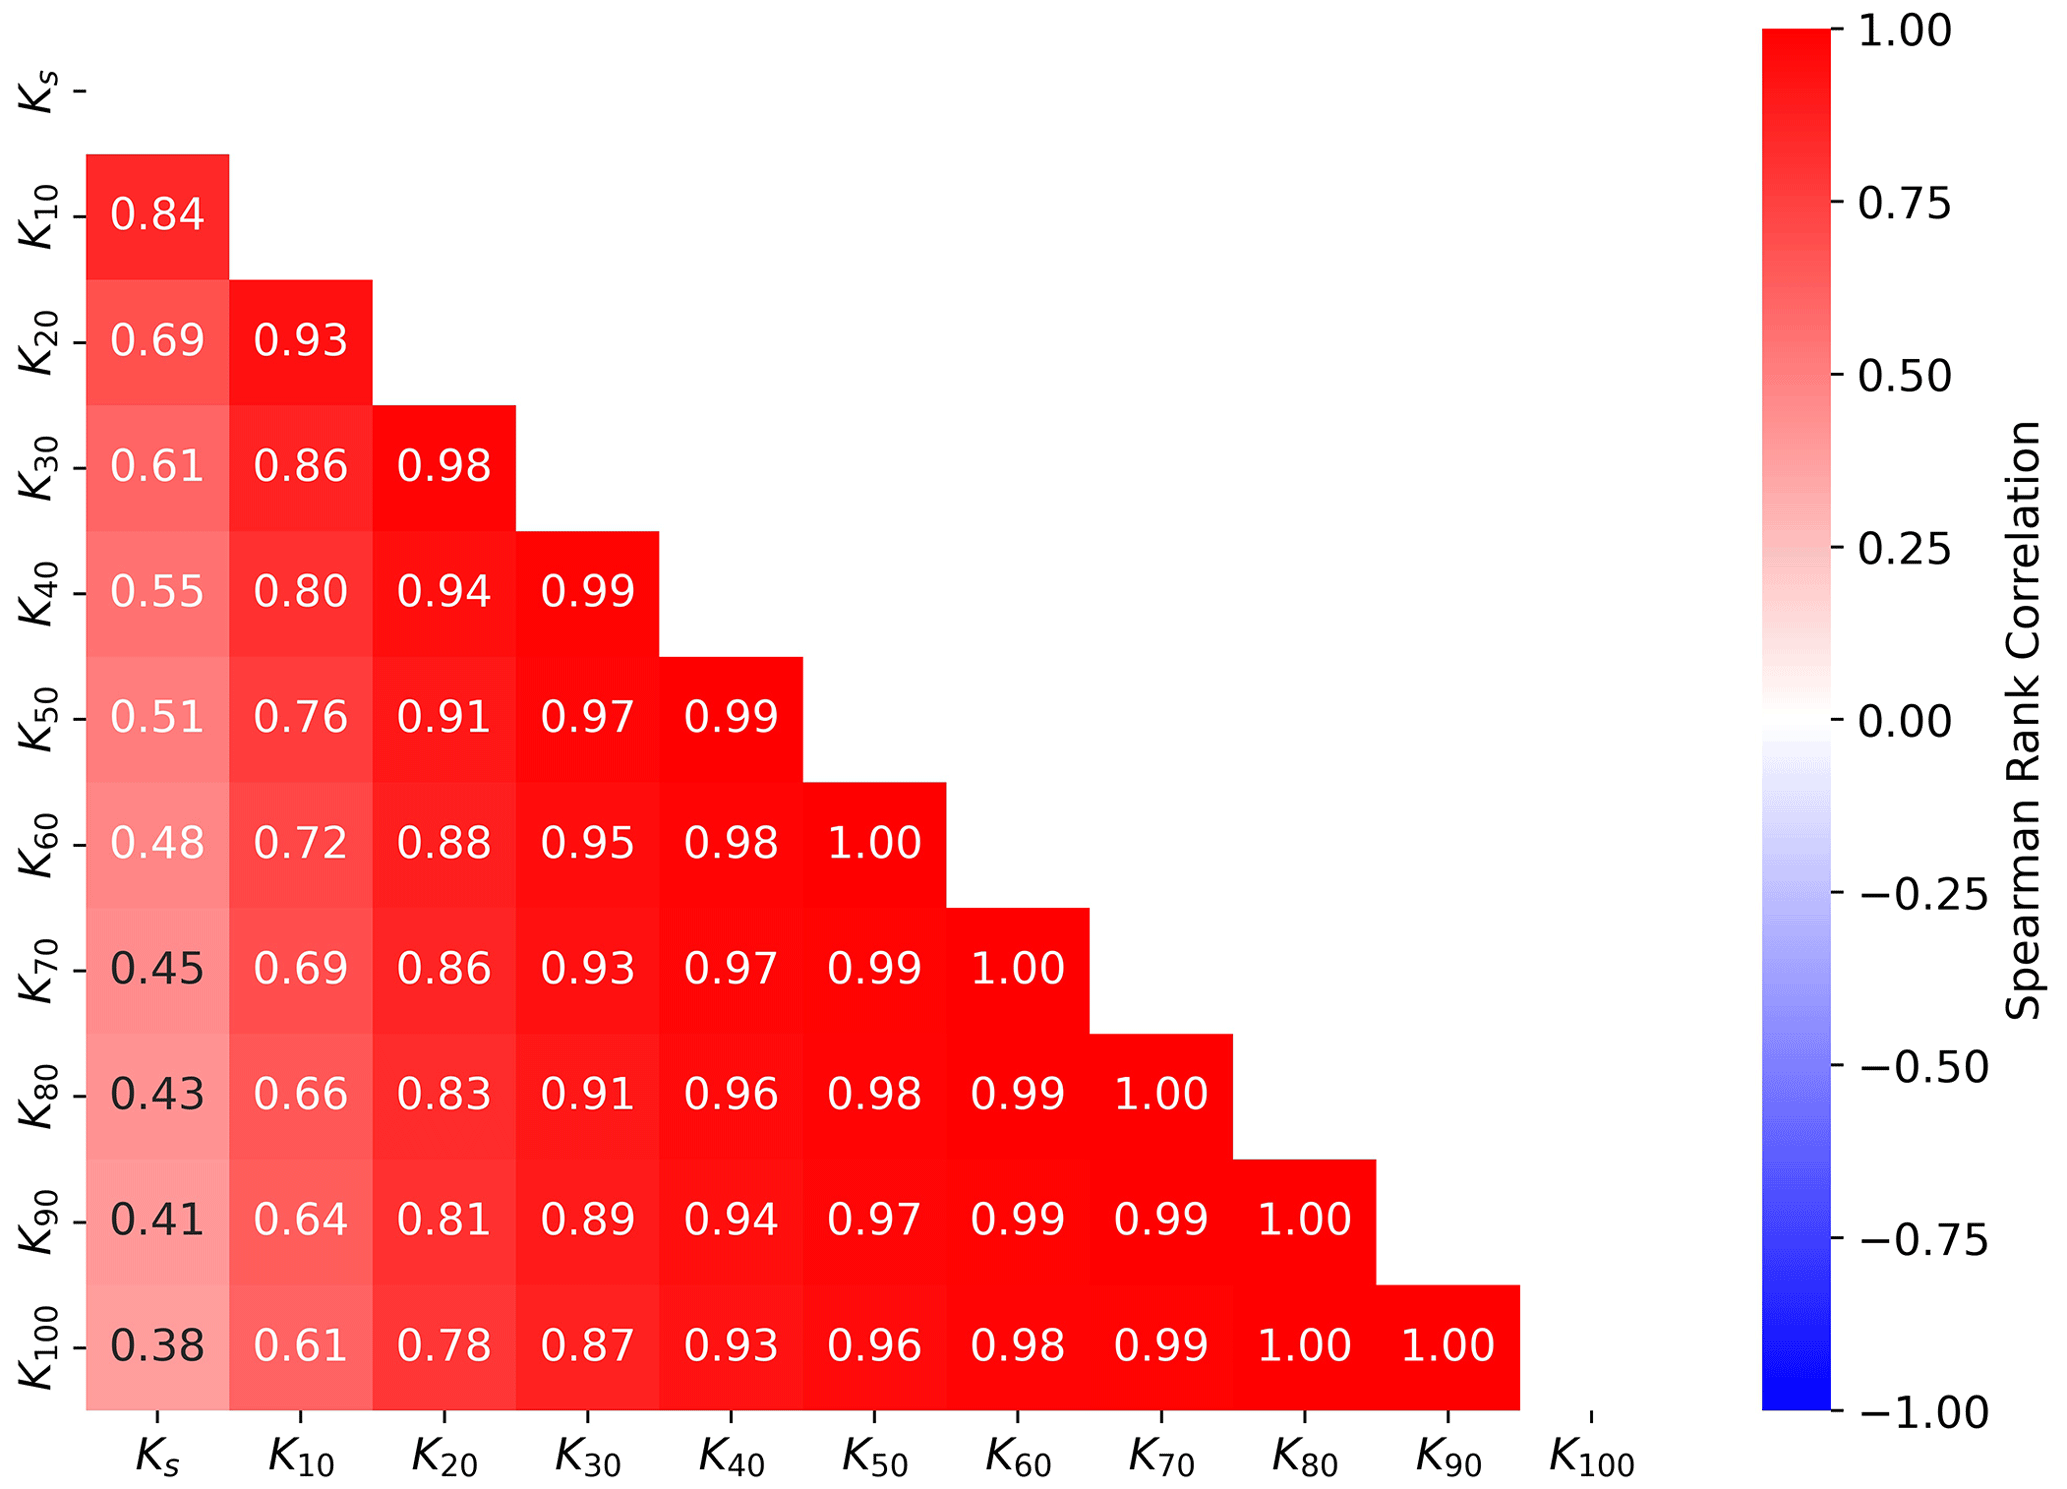
Figure 7Weighted Spearman rank correlation coefficients between Kh at different tensions. Correlation coefficients are shown up to p values of 0.001.
3.2 Statistical relationships between Kh and the methods used
Figure 6a confirms that the diameter of the tension disk did not have a systematic impact on the results. The majority of the data were collected starting under dry conditions (large tensions) and subsequently measured under increasingly wet conditions (smaller tensions). Figure 6b illustrates that beginning the experiment under wet conditions is associated with larger hydraulic conductivities at identical supply tensions. This is well known and is referred to as hysteresis, which is due to ink-bottle effects, impacts of water repellency, air entrapment and swelling of clay particles (Hillel, 2003). Figure 6c shows that the large majority of studies used the “steady-state piecewise” method to solve the Wooding equation and convert the measured infiltration rates to hydraulic conductivities. This method leads to smaller Kh for larger tensions than the other methods. The “transient” and “steady-state constant” methods yielded a larger Kh in the unsaturated range. For the latter method, it is known that it overestimates unsaturated Kh (Jarvis et al., 2013). We tested whether excluding data from transient and steady-state-constant methods changed the results of the meta-analyses but found that they only changed to a minor degree. Data from all the methods were therefore included in the following. Note that the transient method was mostly applied in conjunction with mini-disk infiltrometers, but the respective data are not included in Fig. 6 since they do not span the entire suction range.
3.3 Correlation between Kh at different tensions
The fact that correlations between Kh estimated at supply tensions between 40 and 100 mm were relatively stable (Fig. 7) indicates that the respective flow paths and/or mechanisms remained very similar in this tension range. However, these correlations weakened at tensions between 10 and 20 mm, giving rise to the existence of a threshold above which water flow in the largest macropores becomes the dominant flow mechanism. The poor correlation between Ks and Kh at larger supply tensions is in line with findings that Ks is not well suited for inferring soil-unsaturated hydraulic conductivities (Schaap and Leij, 2000).
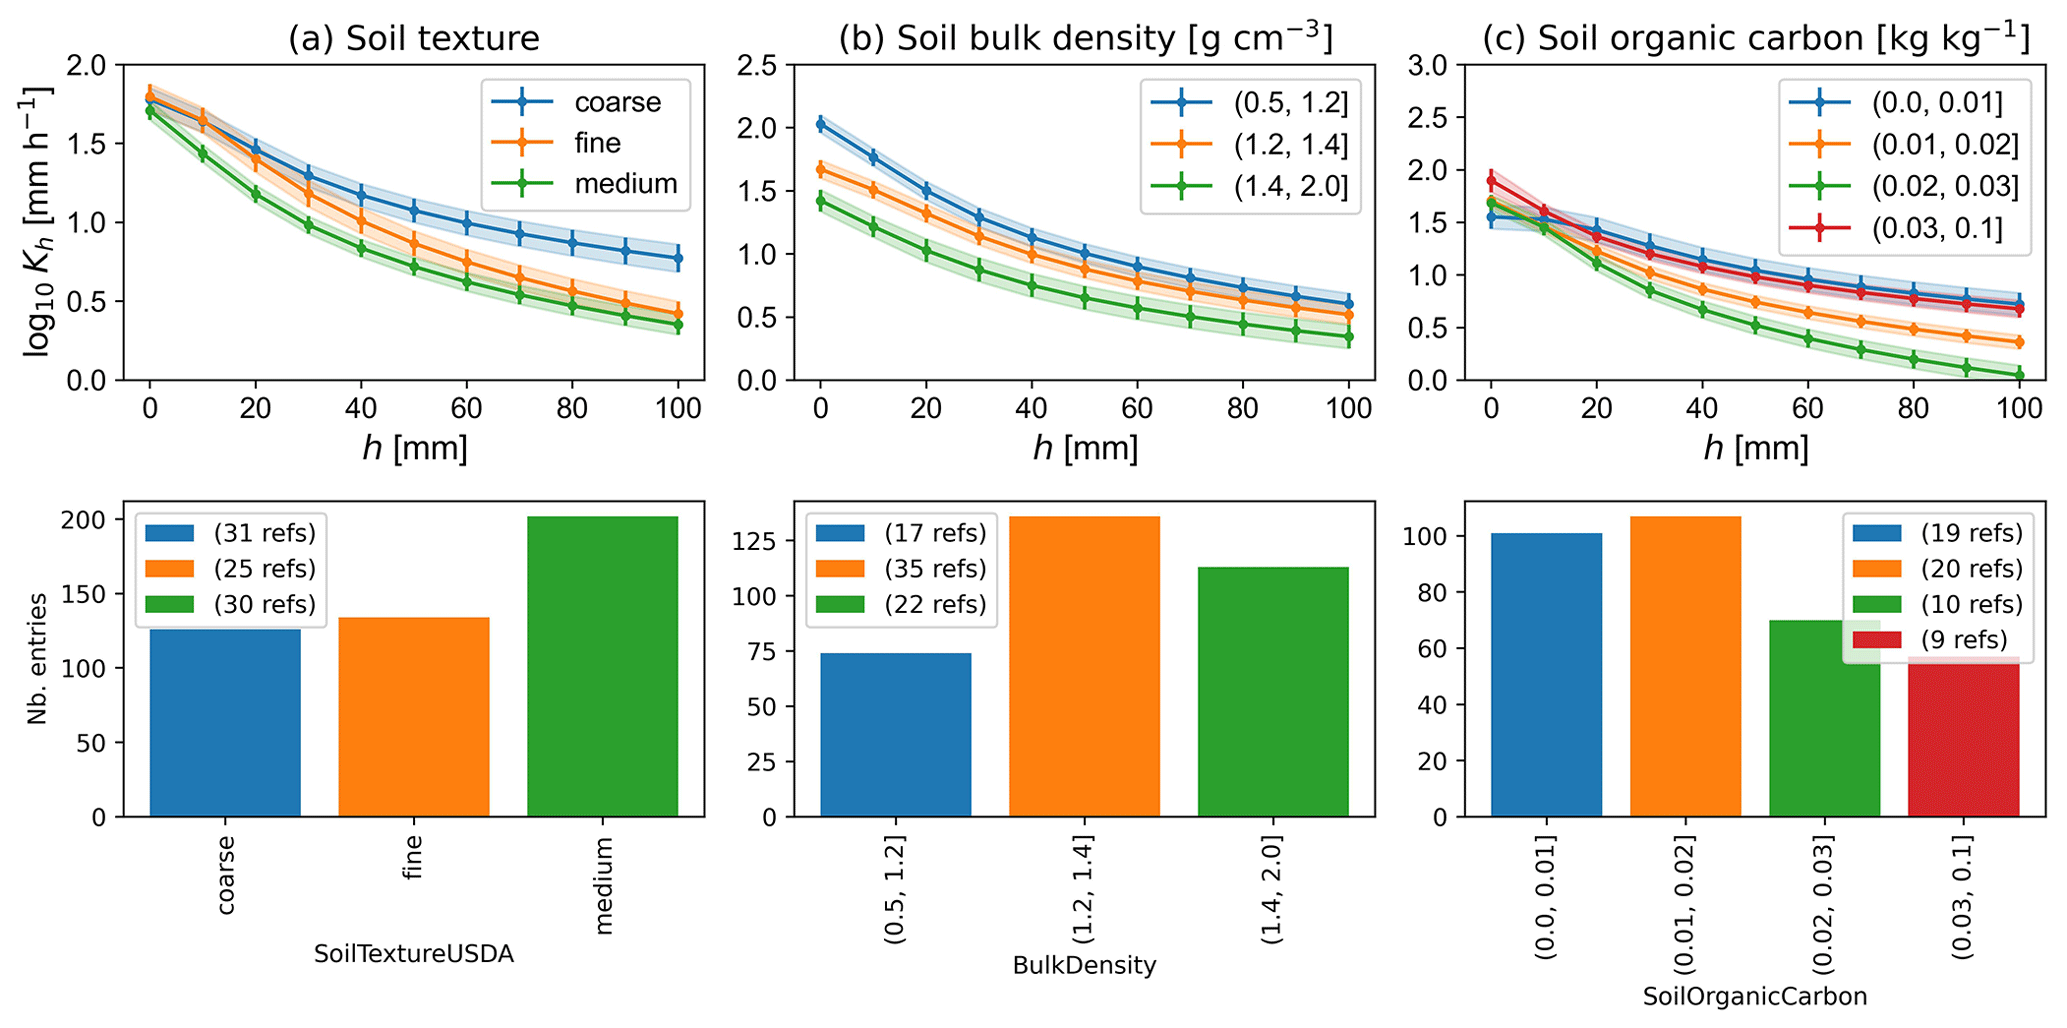
Figure 8Evolution of the weighted mean Kh as a function of applied tension for (a) soil texture, (b) soil bulk density and (c) soil organic carbon. The shaded areas and the error bars represent the weighted standard error of the mean. The soil textures were classified using USDA texture classes as follows: fine (clay, clay loam, silty clay, silty clay loam), medium (silt loam, loam) and coarse (loamy sand, sand, sandy clay, sandy clay loam, sandy loam). The bar plots in each subplot indicate how many data points of each class were in the data set.
3.4 Statistical relationships between Kh and soil properties
Soils with coarse texture exhibited larger Kh in the unsaturated range, which is caused by the large and abundant primary pores in between individual sand grains (Fig. 8a). At saturation, the average hydraulic conductivity of all three texture classes was similar. This is explained by the presence of large structural pores in the medium- and fine-textured soils. Medium-textured soils had the lowest Kh in the investigated range of tensions, which may be due to a denser soil matrix in loamy soils and a lower structural stability of silty soils. Larger bulk densities decreased Kh across the whole range of investigated tensions, which reflects the reduced porosity with increasing bulk density (Fig. 8b).
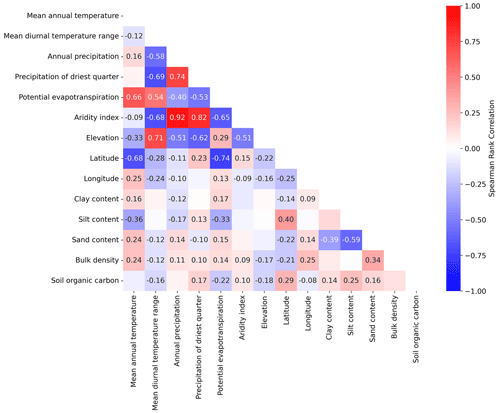
Figure 9Weighted Spearman rank correlation coefficients between climate variables, elevation above sea level and soil properties. Correlation coefficients are shown up to p values of 0.001.
The hydraulic conductivity in the saturated and near-saturated ranges is especially affected by soil compaction, which predominantly reduces the abundance and connectivity of macropores (Pagliai et al., 2004; Whalley et al., 1995). Large bulk densities are also known to reduce burrowing activities of the soil macrofauna (Capowiez et al., 2021) and root growth (Lipiec and Hatano, 2003), also leading to less abundant and less connected large macropores. An increase in the soil organic carbon (SOC) content was connected to smaller Kh at the dry end of the investigated tension range if soils with organic carbon contents of more than 0.03 kg kg−1 were excluded (Fig. 8c). This decrease may be explained by water repellency, which is generally positively correlated with organic carbon content. A similar observation was already reported in Jarvis et al. (2013). Note that no major correlations of SOC with soil texture were observed in the investigated data set (Fig. 9). For soils with organic carbon contents larger than 0.03 kg kg−1, Kh increased once again. This may indicate that, above this threshold, better-developed macropore networks associated with large SOC contents (e.g. Larsbo et al., 2016b) outweighed any effects of water repellency.
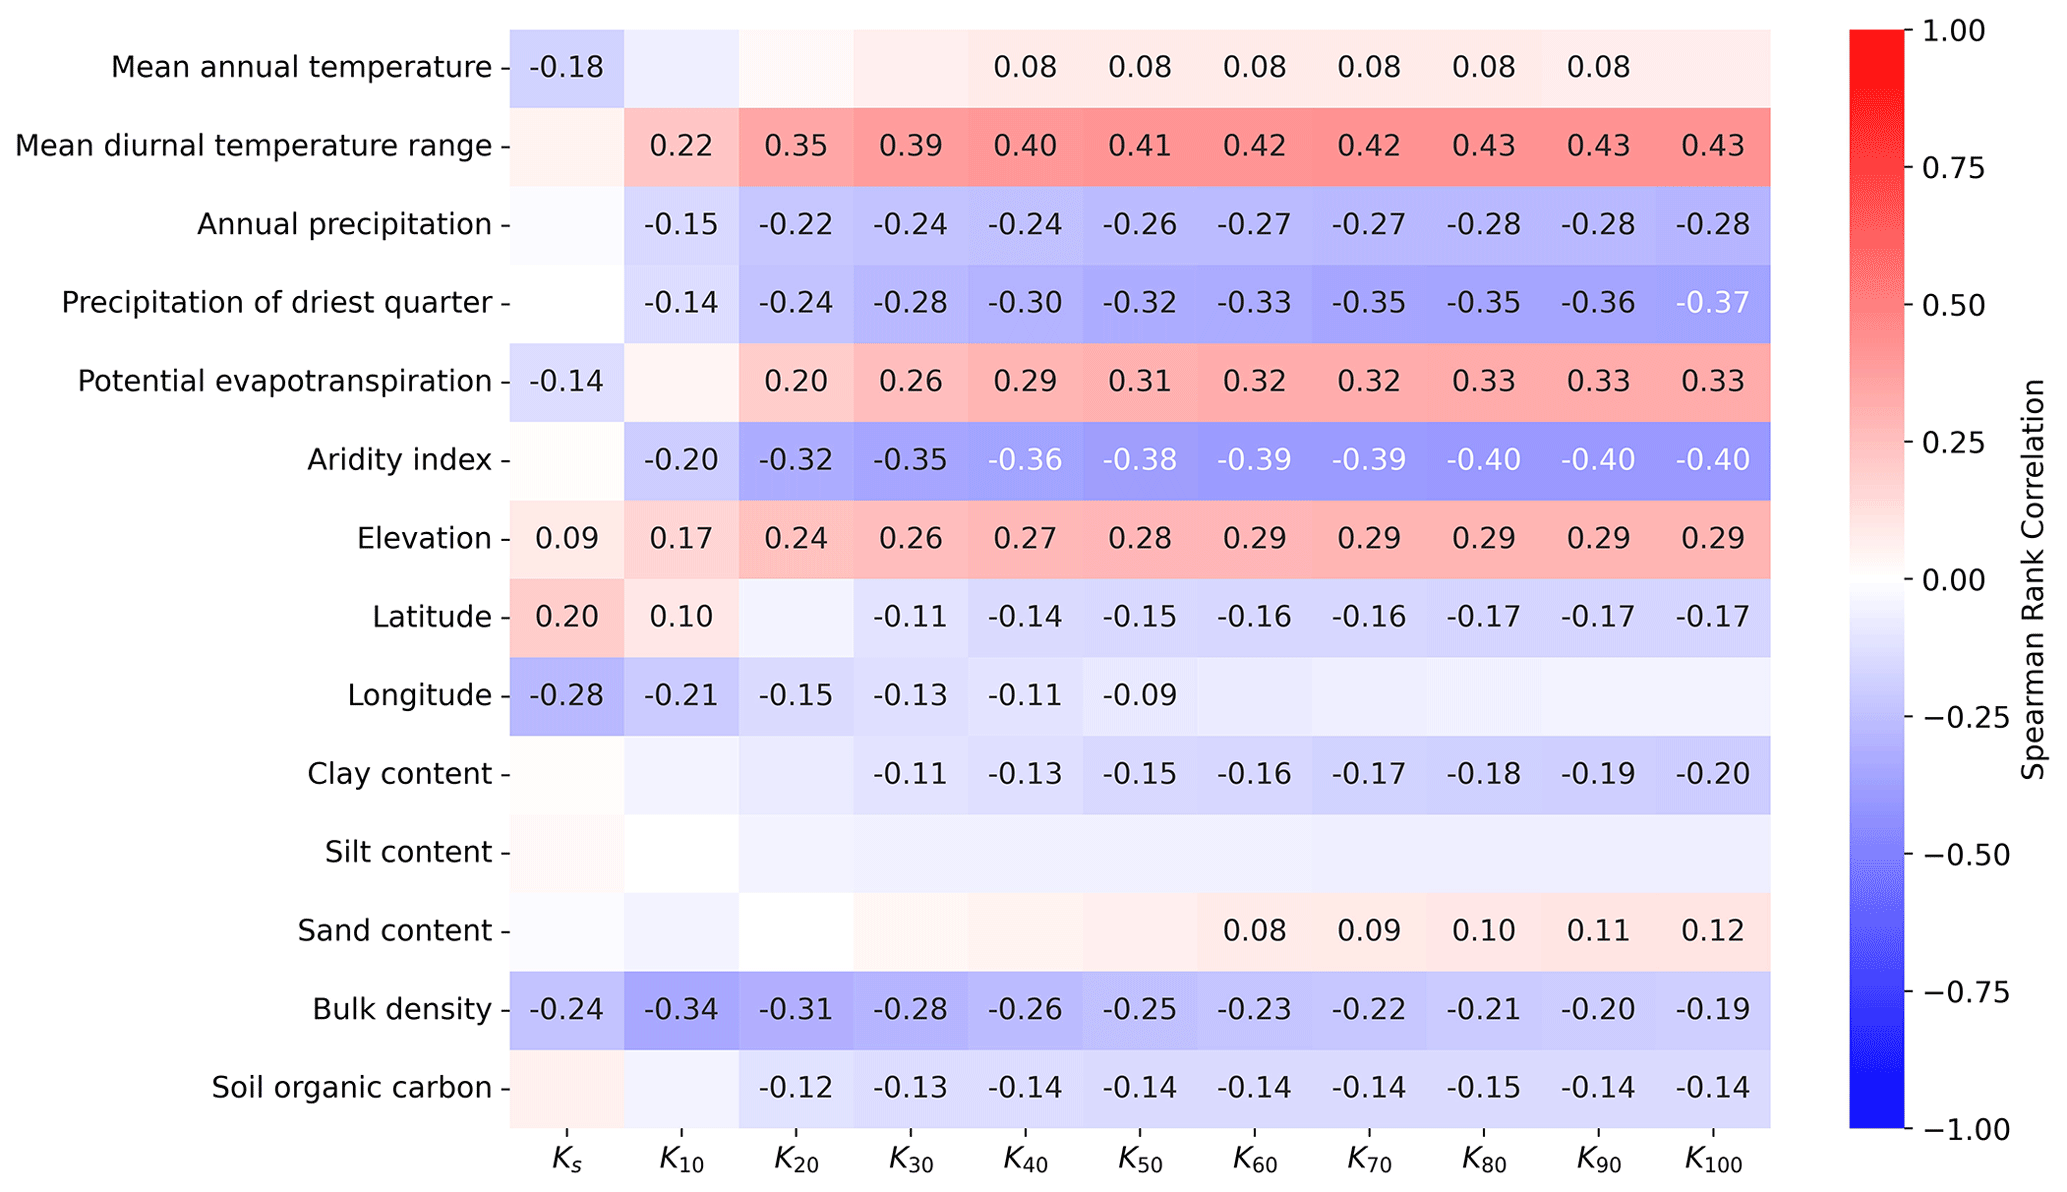
Figure 10Weighted Spearman rank correlation coefficients between Kh at different tensions, climatic features and soil properties. Correlation coefficients are shown up to p values of 0.001.
3.5 Statistical relationships between Kh and climate variables
One important observation made in recent years was that saturated and near-saturated hydraulic conductivities correlated strongly with climate variables (Jarvis et al., 2013; Jorda et al., 2015; Hirmas et al., 2018). Figure 10 gives an overview of weighted Spearman rank correlations between Kh and 6 of the 20 climate variables included in OTIM that exhibited the strongest correlations with Kh. The elevations of the sampling site above sea level together with its latitude and longitude, soil texture, bulk density and soil organic carbon content are also shown for comparison. It is striking that the soil properties were less well correlated with Kh than some of the climate variables. Of the three USDA texture fractions, the clay content was negatively correlated, the sand content was positively correlated with Kh in the drier investigated tension range, and no significant correlations were found for the silt fraction (Fig. 10). Only the bulk density exhibited correlation coefficients as large as the climate variables.
The largest absolute values of the weighted rank correlations were observed for the mean diurnal range of temperature and the aridity index. Both reach a maximum at the dry end of the considered tension range, i.e. for K100, with correlation coefficients of 0.43 and −0.4, respectively. Figure 9 reveals that both of these best-correlated climate variables were accidently correlated with choices in experimental design and data evaluation made by the investigators in the respective source studies, which will amplify these observed correlations with Kh. However, if a smaller data set is considered in which such methodological bias and potential bias due to differences in land use were eliminated, the correlations persist (Fig. B1). We therefore infer that the observed effect of climate on Kh is real.
The annual mean diurnal temperature range and the aridity index were strongly correlated with each other, with a weighted correlation coefficient of −0.68 (Fig. 9). Strong correlations with at least one of these two variables with absolute values > 0.6 were also found for most of the investigated climate variables. It is difficult to separate the climate effects due to these strong inter-correlations. Nevertheless, it is striking that the mean annual diurnal temperature ranges are much better correlated with K100 than the mean annual temperature itself (Fig. 10). In addition, the mean annual precipitation in the driest quarter of the year and the precipitation in the driest quarter of the year exhibited stronger correlations than the mean annual precipitation. It appears that temperature and precipitation fluctuations are more strongly coupled to near-saturated hydraulic conductivities than the absolute temperatures or precipitation amounts.
Among possible reasons for the observed correlations may be increased splash erosion during heavy rainfalls that are common in regions with large precipitation seasonality, more soil compaction in wetter climates due to trafficking, a larger vertical burrowing activity of soil fauna in climates with large diurnal temperature ranges, more vertically oriented root systems in arid climates, or climate-specific choices in land use and soil management. The data in OTIM cannot provide an answer to these questions. Investigations of such relationships should be the focus of future studies.
Another site factor that is positively correlated with Kh is the elevation above sea level (Fig. 10). Notably, elevation above sea level was also found to be an important predictor for Ks in Gupta et al. (2021b), which suggests that there are indeed pedogenetic reasons behind the observed correlation. In the case of infiltrometer measurements, the decreased atmospheric pressure with height on the supply tension can be neglected. The supply tension is always equivalent to the weight of the water column adjusted in the bubbling tower. The weight of the water column will be smaller due to the general decrease in earth's gravitational constant with height due to a larger centrifugal force. However, the weight of the water column would only be reduced by approximately 1 or 2 %. Also, indirect influences of larger heights on the infiltration rate cannot explain the observed correlation. A lower temperature would make the water column denser. However, the effect would be less than 1 % in the relevant temperature range. In contrast, a lower temperature would increase the viscosity of water to a much larger degree, e.g. by up to approximately 30 % between temperatures of 10 and 20 ∘C. The temperature effect should thus lead to a negative correlation between elevation and Kh, which is the opposite of what was observed. Bias in the Kh measurements due to such physical effects can thus be ruled out. Elevation may instead be a proxy for well-drained soils, as stagnant soil water and high groundwater tables are less likely with height above sea level. This may favour soil life and better-developed root systems and decrease risks of compaction when the soil is trafficked.
The observed correlations of Kh with latitude and longitude probably reflect co-correlations with climate variables together with experimenter bias, since it appears likely that approaches in setting up tension-disk infiltrometers systematically vary between continents, e.g. America and Europe.
Bulk density was the only soil property that exhibited a (negative) correlation strength of > 0.3 with any Kh (Fig. 10). The underlying reasons were discussed above. Notably, the strongest correlations were found at and very close to saturation, probably due to the detrimental effect of soil compaction on macroporosity and macropore connectivity. The more compaction, the less macroporosity and the higher the bulk density, which in turn decreases root growth and bioturbation (Capowiez et al., 2021; Lipiec and Hatano, 2003). The only pedoclimatic factor with a relatively large correlation strength (−0.24) with the saturated hydraulic conductivity was the bulk density (Fig. 10).
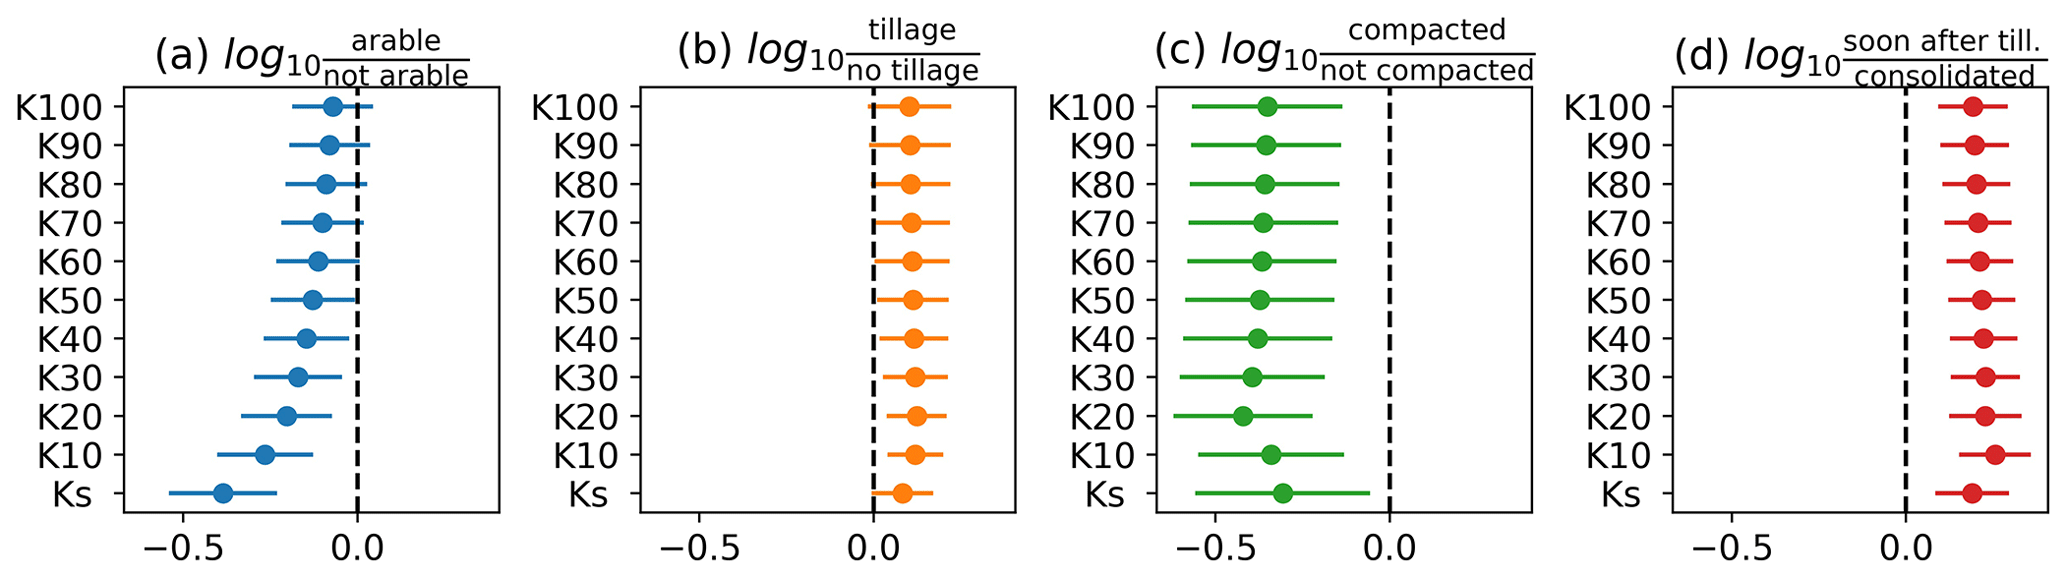
Figure 11Weighted mean log10 response ratio (effect size) of Kh from K100 to Ks for different management practices where the controls were “not arable”, “no tillage”, “no compaction” and “consolidated soil”, respectively. A positive effect size means that the value of the treatment is greater than the control. The dashed line shows “no effect” (no difference between the treatment and the control). Error bars represent the weighted standard error of the mean.
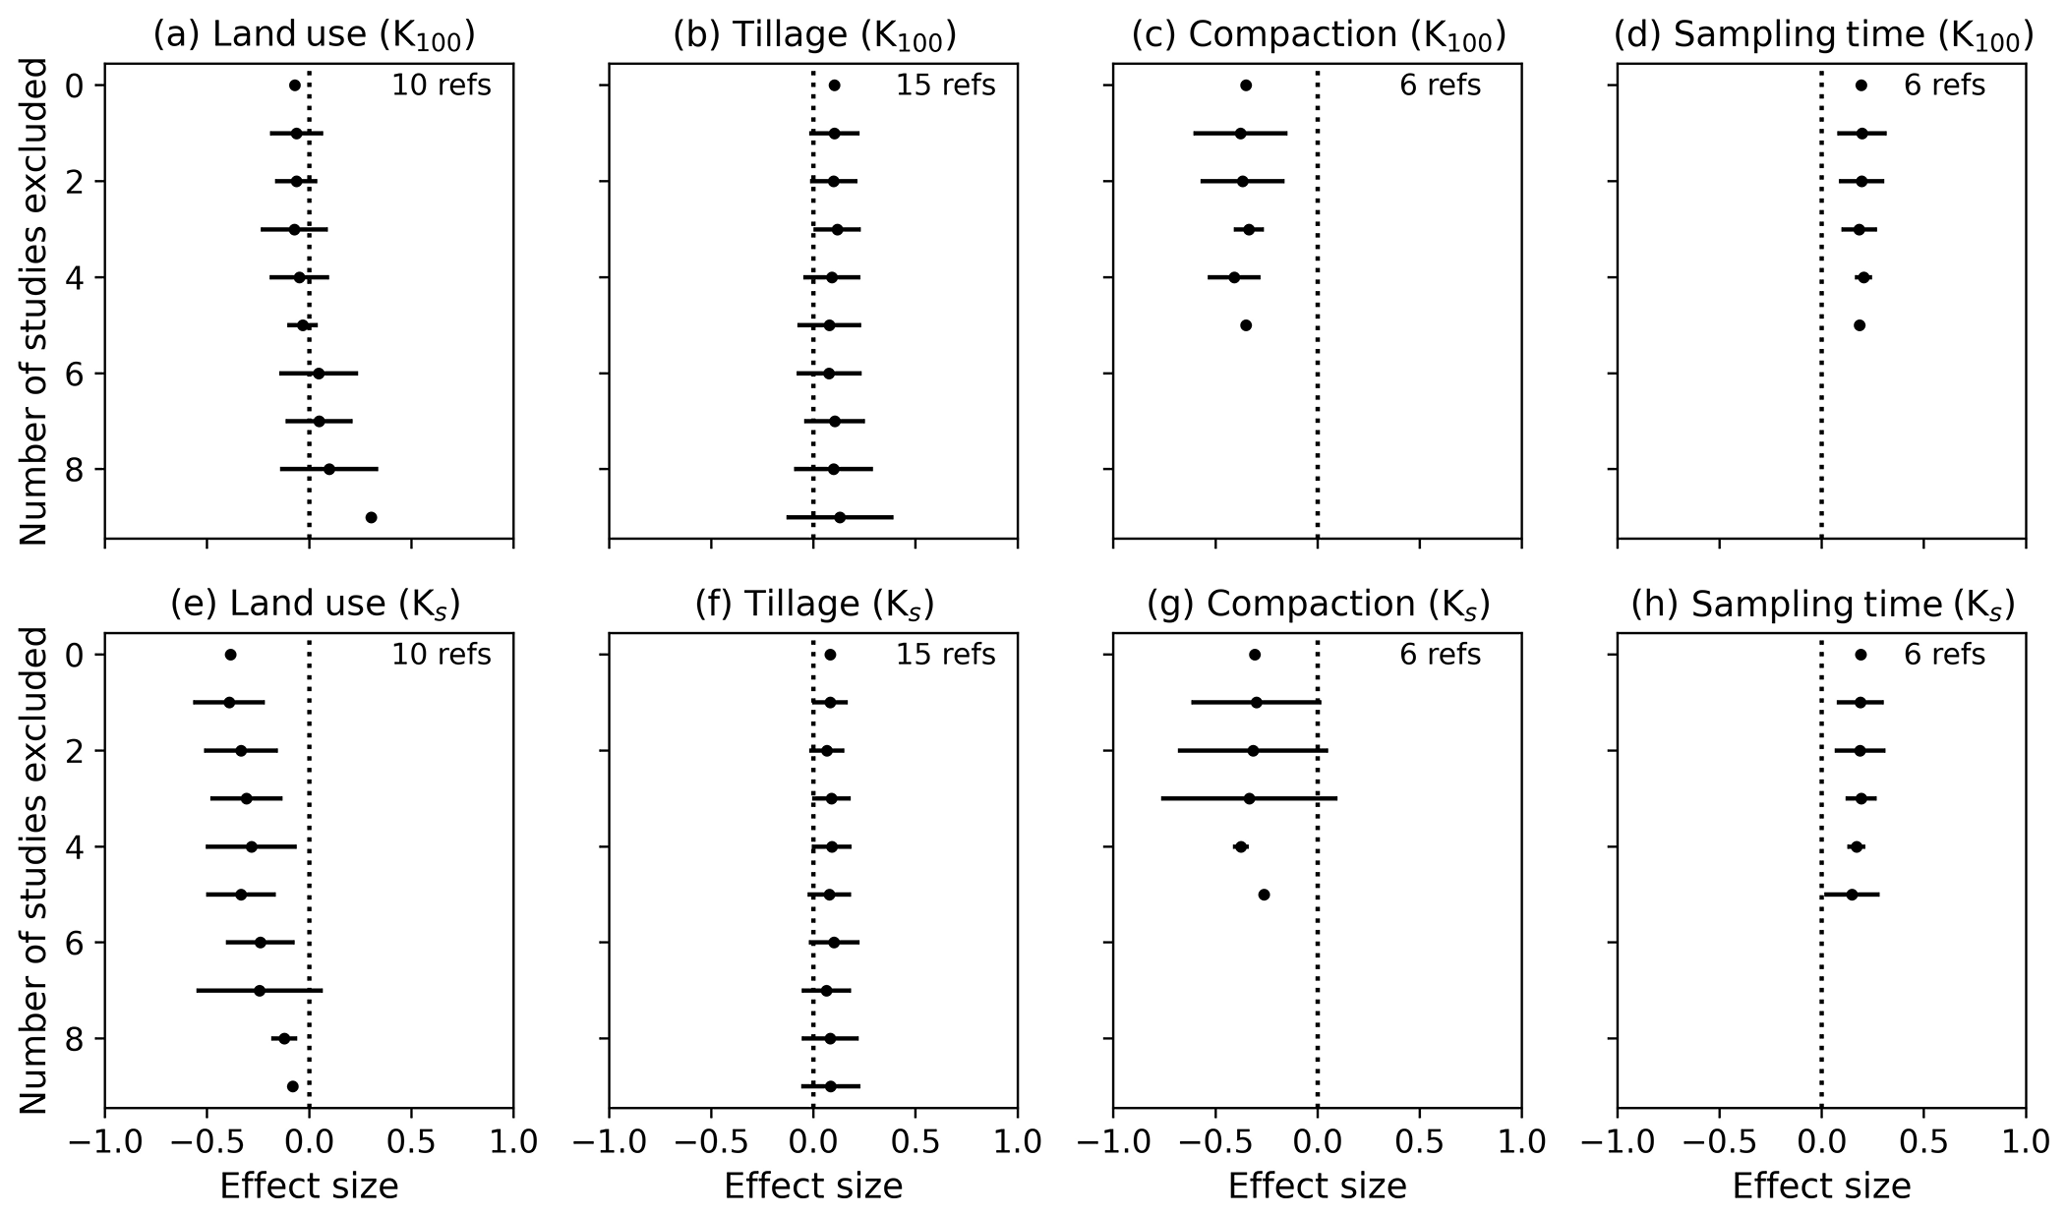
Figure 12Sensitivity analysis of the weighted effect size of K at 100 mm tension and Ks for the management practice investigated using the jackknife technique. The error bars represent the standard error.
3.6 Effects of land use, tillage, compaction and sampling time
The average log10 response ratios shown in Fig. 11 illustrate the effects of land use and soil management on Kh for 100 mm. Note that a value of ± 0.3 in the log10 response ratio corresponds to a factor of 2. Hence, Ks for uncompacted soil was found to be approximately twice as large as for compacted soil (see Fig. 11c). Arable land exhibited a clearly smaller Ks than grasslands and forests, which is in line with observations made by Basche and DeLonge (2019). This difference became smaller with higher tensions (Fig. 11a). The large difference in Kh close to saturation was likely related to traffic compaction and tillage operations that were applied to the majority of the investigated arable soils, which led to the destruction of connected biopores and hence a reduced Ks. On the other hand, tillage breaks up intact soil into individual soil aggregates, which creates, at least initially, a well-connected network of inter-aggregate pores that increase Kh in the near-saturated range (Sandin et al., 2017; Schlüter et al., 2020). This effect of tillage can explain why near-saturated Kh under conventional and reduced tillage was larger than under no tillage (Fig. 11b). However, in this case, even Ks was larger in the tilled fields. It is likely that Ks was reduced in the no-tillage treatments due to traffic compaction on the fields and a lack of soil loosening by tillage as compared to conventionally tilled treatments. Note however that we only investigated topsoils in this study. It is not clear how different tillage types affect Kh in the subsoil. The impact of soil compaction on Kh was clearly negative in the entire investigated range of tensions (Fig. 11c), which is explained by the reduction in porosity and especially the macroporosity during compaction (see also Fig. 8b). In contrast, if the Kh measurements were carried out shortly after tillage operations, Kh was increased for all investigated tensions, especially very close to saturation (Fig. 11d). This confirms that tillage initially increases Ks but that subsequent soil consolidation preferentially disconnects the largest macropores. As a consequence, Kh at and very close to saturation is reduced more strongly than Kh for higher tensions (see Fig. 11a).
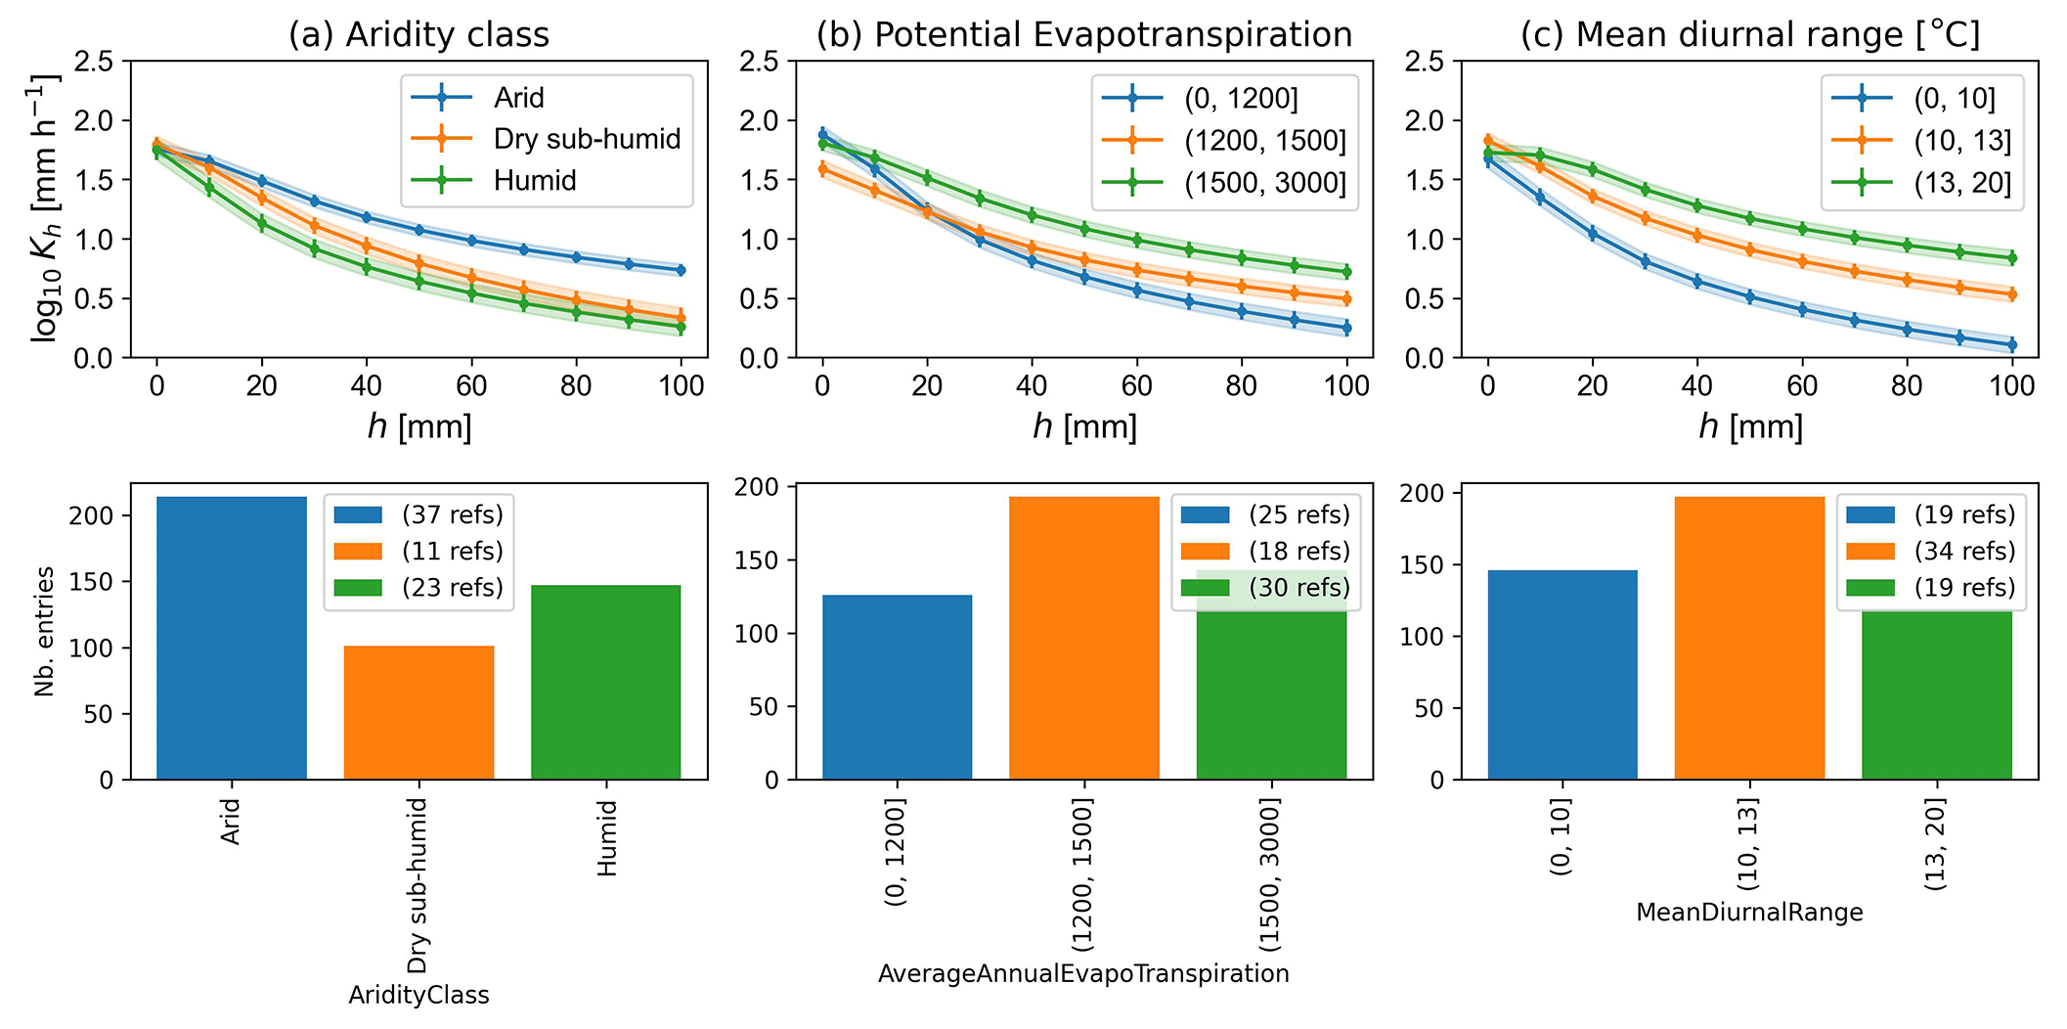
Figure 13Evolution of the weighted mean Kh as a function of applied tension for the (a) aridity class, (b) potential annual evapotranspiration and (c) mean annual diurnal temperature range. The shaded areas and the error bars represent the weighted standard error of the mean.
Figure 12 shows the results of the sensitivity analyses for the effect sizes depicted in Fig. 11. The effect of land use for K100 turned out to be most sensitive to the removal of studies (Fig. 12a). The direction of the effect even changed after the removal of six studies, indicating that higher K100 values for arable compared to non-arable fields were not just occasional observations but occurred more frequently. More studies would be needed to properly characterize the effect of land use on K100. The remaining sensitivity analyses for all the other factors showed that removal of studies did not change or destabilize the results for both K100 and Ks.
3.7 Comparison of the effect size of land use, management and sampling time with the effect of climate and soil properties
Effect sizes could only be computed for land use and management, compaction and sampling time. It is therefore difficult to relate the impact of these factors to the ones of measurement method, climate variables and soil properties. Comparisons between Figs. 6, 8 and 13, on the one hand, with Fig. 11 provide some insight. Land-use- and management-related effects together with sampling time (Fig. 11) seem to have a similar effect on Kh to the soil properties (Fig. 8) and the measurement method (Fig. 6). Climate variables seem to have a larger impact on Kh at the dry end of the investigated tension range but a smaller one close to saturation (Fig. 13).
Our results suggest that climate change will influence soil hydraulic properties near saturation. This may complicate model predictions of water balance in a future climate, particularly the risks of surface runoff, soil erosion and waterlogging. Climatic factors are more strongly correlated with near-saturated hydraulic conductivities than soil texture, bulk density and organic carbon content. At and very close to soil saturation, the correlations between hydraulic conductivity and climate variables vanished. Instead, the soil bulk density showed the largest correlation, in line with the fact that more compact soils tend to lack a well-connected macropore system. Hypotheses as to why climate variables are correlated with the hydraulic conductivity were discussed but need to be investigated in future studies. Most probably, the impacts of climate are linked to macropore networks associated with biological activity, pedogenesis and land use. Only a few land-use- and soil-management-related factors could be investigated in our study. They were all found to significantly influence Kh, with an effect on sizes similar to those of soil properties like texture and organic carbon content. Also, experimenter bias as introduced by the choice of measurement time relative to soil tillage, experimental design or data evaluation appeared to be as important for the saturated and near-saturated hydraulic conductivities as soil texture or bulk density. There is a need for better documentation and accessibility of measurement data and the associated meta-data, as has already been suggested by others (McBratney et al., 2011; Basche and DeLonge, 2019). OTIM offers the possibility of deriving more comprehensive pedotransfer approaches than the ones in Jorda et al. (2015). The construction and evaluation of such pedotransfer functions are envisioned for an upcoming companion paper to this study.
A1 Data query details
Table A1Query strings, search engines, number of result pages that were processed and dates of the search for new data for OTIM.
A2 Data rejection
A3 Database organization
OTIM is organized into nine individual tables illustrated in Fig. A1. The main table is named experiments. It contains identifiers with which all the other tables are linked. The identifiers are shown in bold font in Fig. A1. The reference table contains information on the references for each study. The location table lists the coordinates of the measurement sites. The tables soilProperties, soilManagement and climate store data, as implied by their names. The method table gives details of the specifications of the tension-disk infiltrometer and the method to calculate hydraulic conductivity from the infiltration rate. The rawData table contains the hydraulic conductivities and respective supply tensions as stated in the corresponding source publication. Note that OTIM does not contain raw data for the entries of the original version compiled for Jarvis et al. (2013). Finally, modelFit reports Kh for 100 mm as described above. For more details, the reader is directed to the “Description” tab of the database (not shown in Fig. A1), where the meanings and units of each column are explained.
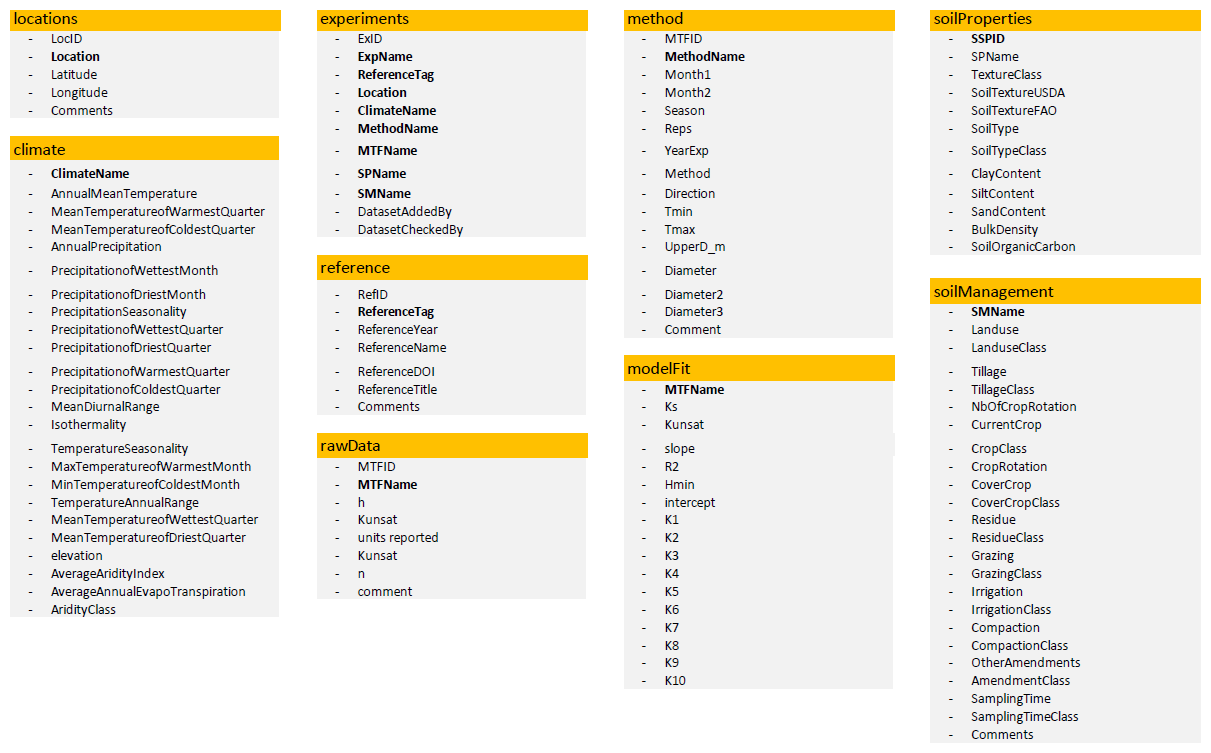
Figure A1Structure of the OTIM database with its different tables and columns. In the soilManagement table, the columns with the suffix “Class” denote columns in which the data reported in the source publications were summarized into classes to facilitate comparisons between them. For example, the reported CurrentCrop like wheat, rye, barley or oat was assigned the CropClass cereals. The rows in bold denote unique identifiers with which the table entries are linked to the experiments table.
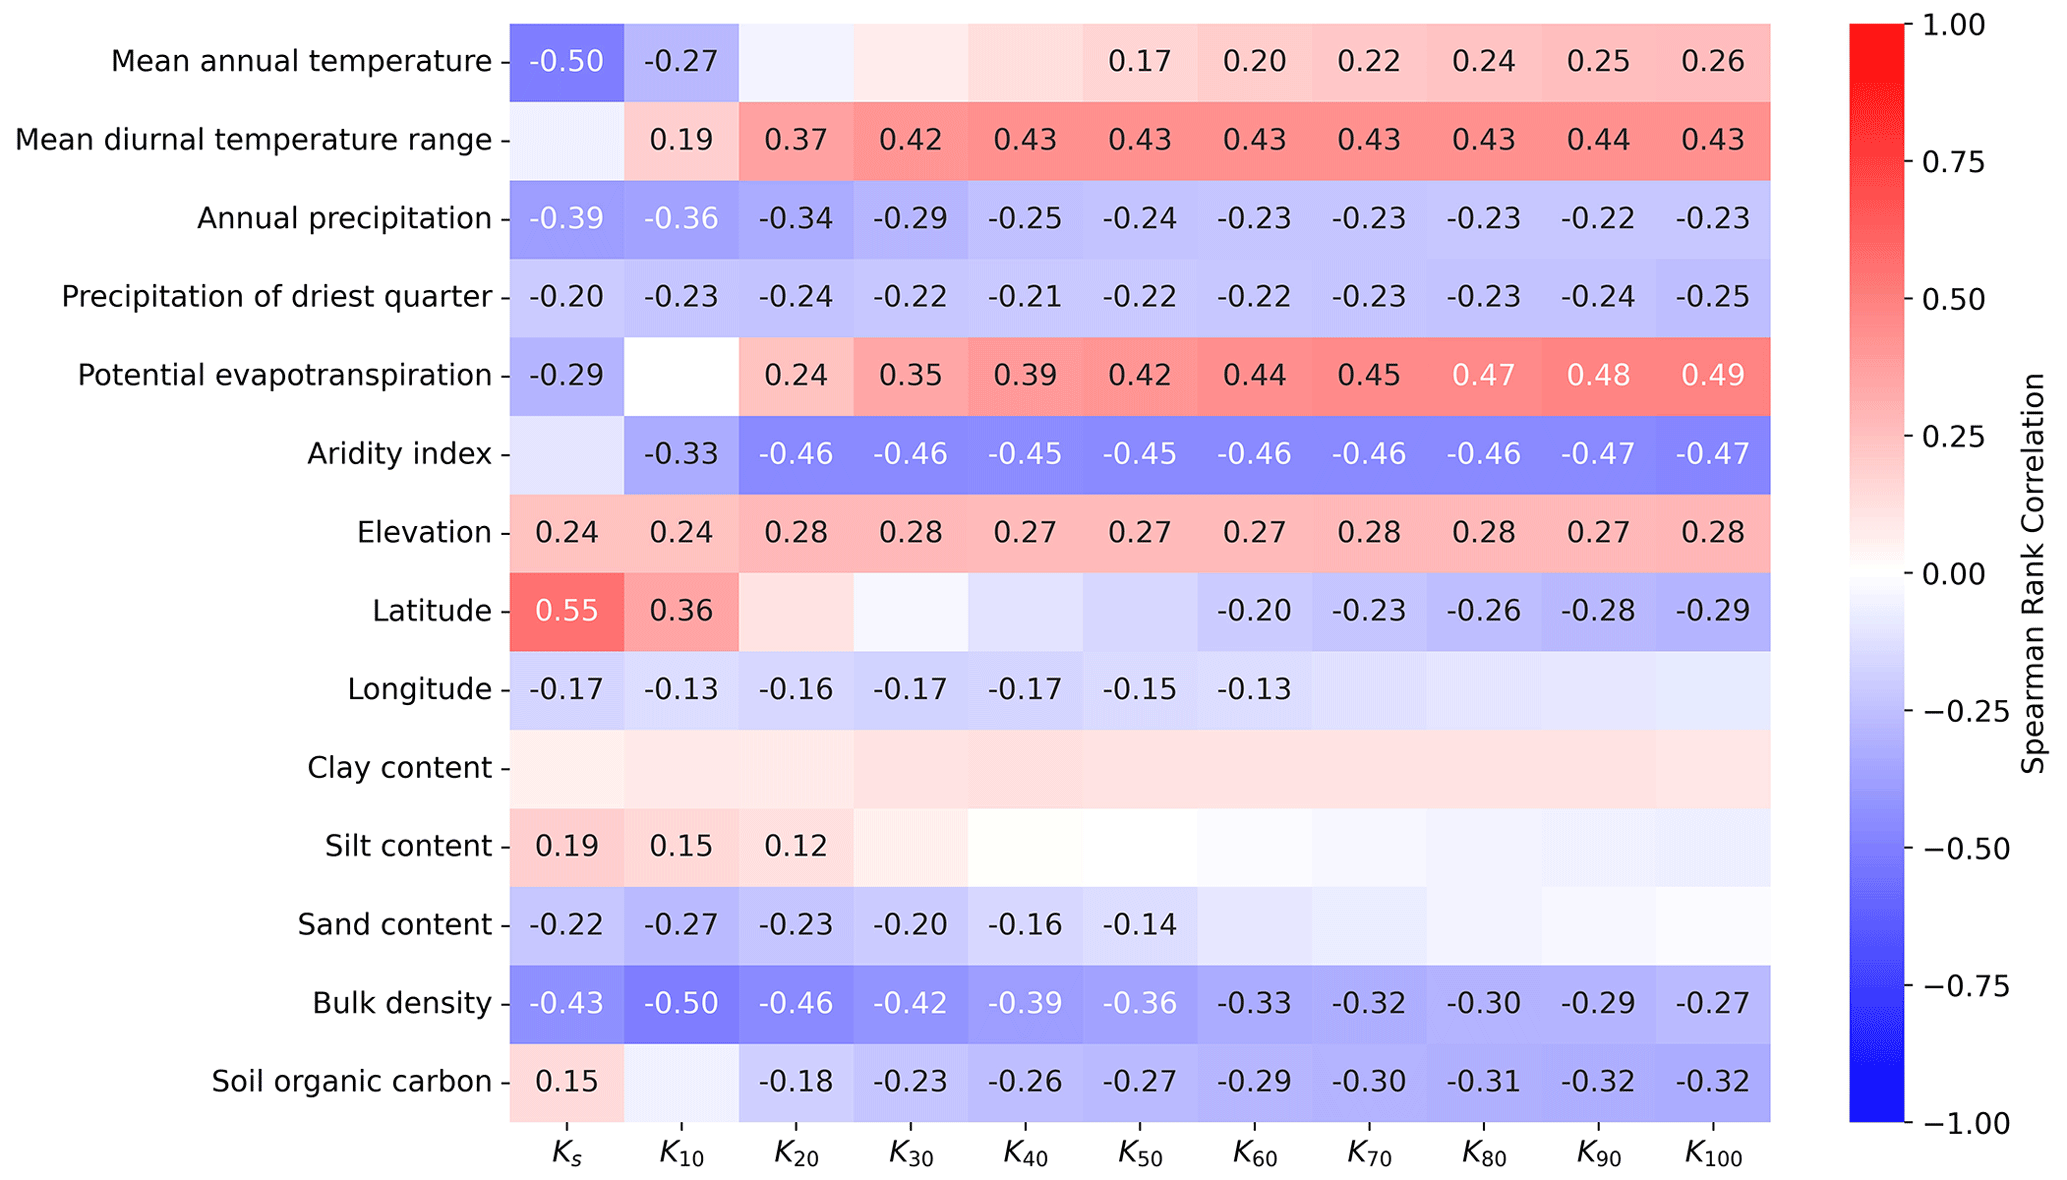
Figure B1Weighted Spearman rank correlation coefficients between Kh at different tensions and climatic features, soil properties, land use and management factors and methodological details. In contrast to Fig. 10, only the 193 data entries from arable fields using a dry-to-wet sequence and the steady-state piecewise method (Reynolds and Elrick, 1991; Ankeny et al., 1991) were considered. Correlation coefficients are shown up to p values of 0.001.
All scripts used to compile this study are publicly available in the form of Jupyter notebooks on GitHub: https://github.com/climasoma/otim-db (last access: 14 July 2023). They are citable by the respective Zenodo repository published by Blanchy et al. (2023) (https://doi.org/10.5281/zenodo.7687814).
The OTIM database is available from the BONARES data repository at https://doi.org/10.20387/BONARES-Q9B3-Z989 (Blanchy et al., 2022).
Funding acquisition: JK, SG; project administration, supervision and conceptualization: JK; meta-database collation and validation: LA, GuB, JK; Python code development, including visualization: GuB, JK; application of statistical analyses and writing the original manuscript draft: GuB, JK; reviewing and editing the manuscript: JK, NJ, SG, GiB, GuB.
The contact author has declared that none of the authors has any competing interests.
Publisher's note: Copernicus Publications remains neutral with regard to jurisdictional claims in published maps and institutional affiliations.
This study was carried out in the framework of the EJP Soil ClimaSoMa project, which received funding from the EU Horizon 2020 research and innovation programme under grant no. 862695. We thank Lionel Alleto, Mats Larsbo, Ali Meshgi, Lin Wang and Wim Cornelis for sharing additional details of their source publication.
This study was carried out in the framework of the EJP Soil ClimaSoMa project, which received funding from the EU Horizon 2020 research and innovation programme under grant no. 862695.
This paper was edited by Nunzio Romano and reviewed by Paul J. Morris and one anonymous referee.
Alagna, V., Bagarello, V., Di Prima, S., and Iovino, M.: Determining hydraulic properties of a loam soil by alternative infiltrometer techniques: Hydraulic Properties of a Loam Soil by Infiltrometer Techniques, Hydrol. Process., 30, 263–275, https://doi.org/10.1002/hyp.10607, 2016.
Alletto, L., Pot, V., Giuliano, S., Costes, M., Perdrieux, F., and Justes, E.: Temporal variation in soil physical properties improves the water dynamics modeling in a conventionally-tilled soil, Geoderma, 243–244, 18–28, https://doi.org/10.1016/j.geoderma.2014.12.006, 2015.
Angulo-Jaramillo, R., Vandervaere, J. P., Roulier, S., Thony, J. L., Gaudet, J. P., and Vauclin, M.: Field measurement of soil surface hydraulic properties by disc and ring infiltrometers - A review and recent developments, Soil Till. Res., 55, 1–29, 2000.
Ankeny, M. D., Ahmed, M., Kaspar, T. C., and Horton, R.: Simple field method for determining unsaturated hydraulic conductivity, Soil Sci. Soc. Am. J., 55, 467–470, 1991.
Bagarello, V., Baiamonte, G., Castellini, M., Di Prima, S., and Iovino, M.: A comparison between the single ring pressure infiltrometer and simplified falling head techniques, Hydrol. Process., 28, 4843–4853, https://doi.org/10.1002/hyp.9980, 2014.
Baranian Kabir, E., Bashari, H., Bassiri, M., and Mosaddeghi, M. R.: Effects of land-use/cover change on soil hydraulic properties and pore characteristics in a semi-arid region of central Iran, Soil Till. Res., 197, 104478, https://doi.org/10.1016/j.still.2019.104478, 2020.
Basche, A. D. and DeLonge, M. S.: Comparing infiltration rates in soils managed with conventional and alternative farming methods: A meta-analysis, PLOS ONE, 14, e0215702, https://doi.org/10.1371/journal.pone.0215702, 2019.
Bát'ková, K., Miháliková, M., and Matula, S.: Hydraulic Properties of a Cultivated Soil in Temperate Continental Climate Determined by Mini Disk Infiltrometer, Water, 12, 843, https://doi.org/10.3390/w12030843, 2020.
Blanchy, G., Albrecht, L., Bragato, G., Jarvis, N., and Koestel, J.: Open Tension-disk Infiltrometer Meta-database (OTIM) (1.0), BONARES [data set], https://doi.org/10.20387/BONARES-Q9B3-Z989, 2022.
Blanchy, G., Albrecht, L., Bragato, G., Jarvis, N., and Koestel, J.: climasoma/otim-db: v1.0.0 (v1.0.0), Zenodo [code], https://doi.org/10.5281/zenodo.7687814, 2023.
Bodner, G., Scholl, P., Loiskandl, W., and Kaul, H. P.: Environmental and management influences on temporal variability of near saturated soil hydraulic properties, Geoderma, 204, 120–129, https://doi.org/10.1016/j.geoderma.2013.04.015, 2013.
Bottinelli, N., Menasseri-Aubry, S., Cluzeau, D., and Hallaire, V.: Response of soil structure and hydraulic conductivity to reduced tillage and animal manure in a temperate loamy soil, Soil Use Manage., 29, 401–409, https://doi.org/10.1111/sum.12049, 2013.
Bouma, J.: Using Soil Survey Data for Quantitative Land Evaluation, in: Advances in Soil Science, vol. 9, edited by: Stewart, B. A., Springer US, New York, NY, 177–213, https://doi.org/10.1007/978-1-4612-3532-3_4, 1989.
Capowiez, Y., Sammartino, S., Keller, T., and Bottinelli, N.: Decreased burrowing activity of endogeic earthworms and effects on water infiltration in response to an increase in soil bulk density, Pedobiologia, 85–86, 150728, https://doi.org/10.1016/j.pedobi.2021.150728, 2021.
Costa, J. L., Aparicio, V., and Cerdà, A.: Soil physical quality changes under different management systems after 10 years in the Argentine humid pampa, Solid Earth, 6, 361–371, https://doi.org/10.5194/se-6-361-2015, 2015.
De Boever, M., Gabriels, D., Ouessar, M., and Cornelis, W.: Influence of Acacia Trees on Near-Surface Soil Hydraulic Properties in Arid Tunisia, Land Degrad. Dev., 27, 1805–1812, https://doi.org/10.1002/ldr.2302, 2016.
Etana, A., Larsbo, M., Keller, T., Arvidsson, J., Schjønning, P., Forkman, J., and Jarvis, N.: Persistent subsoil compaction and its effects on preferential flow patterns in a loamy till soil, Geoderma, 192, 430–436, https://doi.org/10.1016/j.geoderma.2012.08.015, 2013.
Fashi, F. H., Gorji, M., and Sharifi, F.: The Use Of Soil Hydraulic Properties As Indicators For Asseessing The Impact Of Management Practices Under Semi-arid Climates, Environ. Eng. Manag. J., 18, 1057–1066, https://doi.org/10.30638/eemj.2019.102, 2019.
Fasinmirin, J. T., Olorunfemi, I. E., and Olakuleyin, F.: Strength and hydraulics characteristics variations within a tropical Alfisol in Southwestern Nigeria under different land use management, Soil Till. Res., 182, 45–56, https://doi.org/10.1016/j.still.2018.04.017, 2018.
Fick, S. E. and Hijmans, R. J.: WorldClim 2: new 1-km spatial resolution climate surfaces for global land areas, Int. J. Climatol., 37, 4302–4315, https://doi.org/10.1002/joc.5086, 2017.
Greenwood, S. K.: Land use and tillage effects on soil saturated hydraulic conductivity: Does infiltration method matter?, PhD thesis, Lincoln University, New-Zeeland, 2017.
Gupta, S., Hengl, T., Lehmann, P., Bonetti, S., and Or, D.: SoilKsatDB: global database of soil saturated hydraulic conductivity measurements for geoscience applications, Earth Syst. Sci. Data, 13, 1593–1612, https://doi.org/10.5194/essd-13-1593-2021, 2021a.
Gupta, S., Lehmann, P., Bonetti, S., Papritz, A., and Or, D.: Global Prediction of Soil Saturated Hydraulic Conductivity Using Random Forest in a Covariate-Based GeoTransfer Function (CoGTF) Framework, J. Adv. Model. Earth Syst., 13, e2020MS002242, https://doi.org/10.1029/2020MS002242, 2021b.
Hallam, J., Berdeni, D., Grayson, R., Guest, E. J., Holden, J., Lappage, M. G., Prendergast-Miller, M. T., Robinson, D. A., Turner, A., Leake, J. R., and Hodson, M. E.: Effect of earthworms on soil physico-hydraulic and chemical properties, herbage production, and wheat growth on arable land converted to ley, Sci. Total Environ., 713, 136491, https://doi.org/10.1016/j.scitotenv.2019.136491, 2020.
Hardie, M. A., Doyle, R. B., Cotching, W. E., Mattern, K., and Lisson, S.: Influence of antecedent soil moisture on hydraulic conductivity in a series of texture-contrast soils, Hydrol. Process., 26, 3079–3091, https://doi.org/10.1002/hyp.8325, 2012.
Hillel, D.: Introduction to Environmental Soil Physics, Elsevier, 512 pp., ISBN 978-0-08-049577-4, 2003.
Hirmas, D. R., Giménez, D., Nemes, A., Kerry, R., Brunsell, N. A., and Wilson, C. J.: Climate-induced changes in continental-scale soil macroporosity may intensify water cycle, Nature, 561, 100–103, https://doi.org/10.1038/s41586-018-0463-x, 2018.
Holden, J., Wearing, C., Palmer, S., Jackson, B., Johnston, K., and Brown, L. E.: Fire decreases near-surface hydraulic conductivity and macropore flow in blanket peat, Hydrol. Process., 28, 2868–2876, https://doi.org/10.1002/hyp.9875, 2014.
Hyväluoma, J., Räty, M., Kaseva, J., and Keskinen, R.: Changes over time in near-saturated hydraulic conductivity of peat soil following reclamation for agriculture, Hydrol. Process., 34, 237–243, https://doi.org/10.1002/hyp.13578, 2020.
Iovino, M., Castellini, M., Bagarello, V., and Giordano, G.: Using Static and Dynamic Indicators to Evaluate Soil Physical Quality in a Sicilian Area, Land Degrad. Dev., 27, 200–210, https://doi.org/10.1002/ldr.2263, 2016.
IUSS Working Group WRB: World Reference Base for Soil Resources 2014, Update 2015, International Soil Classification System for Naming Soils and Creating Legends for Soil Maps, FAO, Rome, 2015.
Jarvis, N., Koestel, J., Messing, I., Moeys, J., and Lindahl, A.: Influence of soil, land use and climatic factors on the hydraulic conductivity of soil, Hydrol. Earth Syst. Sci., 17, 5185–5195, https://doi.org/10.5194/hess-17-5185-2013, 2013.
Jorda, H., Bechtold, M., Jarvis, N., and Koestel, J.: Using boosted regression trees to explore key factors controlling saturated and near-saturated hydraulic conductivity, Eur. J. Soil Sci., 66, 744–756, https://doi.org/10.1111/ejss.12249, 2015.
Kelishadi, H., Mosaddeghi, M. R., Hajabbasi, M. A., and Ayoubi, S.: Near-saturated soil hydraulic properties as influenced by land use management systems in Koohrang region of central Zagros, Iran, Geoderma, 213, 426–434, https://doi.org/10.1016/j.geoderma.2013.08.008, 2014.
Keskinen, R., Räty, M., Kaseva, J., and Hyväluoma, J.: Variations in near-saturated hydraulic conductivity of arable mineral topsoils in south-western and central-eastern Finland, Agr. Food Sci., 28, 70–83, https://doi.org/10.23986/afsci.79329, 2019.
Khetdan, C., Chittamart, N., Tawornpruek, S., Kongkaew, T., Onsamrarn, W., and Garré, S.: Influence of rock fragments on hydraulic properties of Ultisols in Ratchaburi Province, Thailand, Geoderma Regional, 10, 21–28, https://doi.org/10.1016/j.geodrs.2017.04.001, 2017.
Klute, A. and Dirksen, C.: Hydraulic conductivity and diffusivity: Laboratory measurements, in: Methods of soil analysis, Part 1, vol. 1, edited by: Klute, A., Soil Science Society of America, Inc., Madison, Wisconsin, USA, 687–734, 1986.
Koestel, J., Dathe, A., Skaggs, T. H., Klakegg, O., Ahmad, M. A., Babko, M., Giménez, D., Farkas, C., Nemes, A., and Jarvis, N.: Estimating the Permeability of Naturally Structured Soil From Percolation Theory and Pore Space Characteristics Imaged by X-Ray, Water Resour. Res., 54, 9255–9263, 2018.
Larsbo, M., Koestel, J., and Jarvis, N.: Relations between macropore network characteristics and the degree of preferential solute transport, Hydrol. Earth Syst. Sci., 18, 5255–5269, https://doi.org/10.5194/hess-18-5255-2014, 2014.
Larsbo, M., Sandin, M., Jarvis, N., Etana, A., and Kreuger, J.: Surface Runoff of Pesticides from a Clay Loam Field in Sweden, J. Environ. Qual., 45, 1367–1374, https://doi.org/10.2134/jeq2015.10.0528, 2016a.
Larsbo, M., Koestel, J., Kätterer, T., and Jarvis, N.: Preferential transport in macropores is reduced by soil organic carbon, Vadose Zone J., 15, vzj2016.03.0021, https://doi.org/10.2136/vzj2016.03.0021, 2016b.
Lipiec, J. and Hatano, R.: Quantification of compaction effects on soil physical properties and crop growth, Geoderma, 116, 107–136, 2003.
Logsdon, S. D. and Jaynes, D. B.: Methodology for Determining Hydraulic Conductivity with Tension Infiltrometers, Soil Sci. Soc. Am. J., 57, 1426–1431, https://doi.org/10.2136/sssaj1993.03615995005700060005x, 1993.
Lopes, V. S., Cardoso, I. M., Fernandes, O. R., Rocha, G. C., Simas, F. N. B., de Melo Moura, W., Santana, F. C., Veloso, G. V., and da Luz, J. M. R.: The establishment of a secondary forest in a degraded pasture to improve hydraulic properties of the soil, Soil Till. Res., 198, 104538, https://doi.org/10.1016/j.still.2019.104538, 2020.
Lozano, L. A., Germán Soracco, C., Buda, V. S., Sarli, G. O., and Filgueira, R. R.: Stabilization of soil hydraulic properties under a long term no-till system, Rev. Bras. Cienc. Solo, 38, 1281–1292, https://doi.org/10.1590/S0100-06832014000400024, 2014.
Lozano-Baez, S. E., Cooper, M., De Barros Ferraz, S. F., Ribeiro Rodrigues, R., Lassabatere, L., Castellini, M., and Di Prima, S.: Assessing Water Infiltration and Soil Water Repellency in Brazilian Atlantic Forest Soils, Appl. Sci., 10, 1950, https://doi.org/10.3390/app10061950, 2020.
Matula, S., Miháliková, M., Lufinková, J., and Bát'ková, K.: The role of the initial soil water content in the determination of unsaturated soil hydraulic conductivity using a tension infiltrometer, Plant Soil Environ., 61, 515–521, https://doi.org/10.17221/527/2015-PSE, 2015.
McBratney, A. B., Minasny, B., and Tranter, G.: Necessary meta-data for pedotransfer functions, Geoderma, 160, 627–629, https://doi.org/10.1016/j.geoderma.2010.09.023, 2011.
Meshgi, A. and Chui, T. F. M.: Analysing tension infiltrometer data from sloped surface using two-dimensional approximation, Hydrol. Process., 28, 744–752, https://doi.org/10.1002/hyp.9621, 2014.
Messing, I. and Jarvis, N. J.: Seasonal variation in field-saturated hydraulic conductivity in two swelling clay soils in Sweden, J. Soil Sci., 41, 229–237, https://doi.org/10.1111/j.1365-2389.1993.tb00430.x, 1990.
Messing, I. and Jarvis, N. J.: Temporal variation in the hydraulic conductivity of a tilled clay soil as measured by tension infiltrometers, J. Soil Sci., 44, 11–24, 1993.
Meurer, K., Barron, J., Chenu, C., Coucheney, E., Fielding, M., Hallett, P., Herrmann, A. M., Keller, T., Koestel, J., Larsbo, M., Lewan, E., Or, D., Parsons, D., Parvin, N., Taylor, A., Vereecken, H., and Jarvis, N.: A framework for modelling soil structure dynamics induced by biological activity, Glob. Change Biol., 26, 5382–5403, https://doi.org/10.1111/gcb.15289, 2020.
Miller, J. J., Beasley, B. W., Drury, C. F., Larney, F. J., Hao, X., and Chanasyk, D. S.: Influence of long-term feedlot manure amendments on soil hydraulic conductivity, water-stable aggregates, and soil thermal properties during the growing season, Can. J. Soil. Sci., 98, 421–435, https://doi.org/10.1139/cjss-2017-0061, 2018.
Mirzavand, J.: Effects of Soil Tillage Systems and plant Residue Management on Unsaturated Hydraulic Conductivity of soil in Wheat-Corn Rotation, Journal of Water and Soil Conservation, 23, 131–150, https://doi.org/10.22069/jwfst.2016.3190, 2016.
Morris, P. J., Davies, M. L., Baird, A. J., Balliston, N., Bourgault, M.-A., Clymo, R. S., Fewster, R. E., Furukawa, A. K., Holden, J., Kessel, E., Ketcheson, S. J., Kløve, B., Larocque, M., Marttila, H., Menberu, M. W., Moore, P. A., Price, J. S., Ronkanen, A.-K., Rosa, E., Strack, M., Surridge, B. W. J., Waddington, J. M., Whittington, P., and Wilkinson, S. L.: Saturated Hydraulic Conductivity in Northern Peats Inferred From Other Measurements, Water Resour. Res., 58, e2022WR033181, https://doi.org/10.1029/2022WR033181, 2022.
Nemes, A., Schaap, M. G., Leij, F. J., and Wosten, J. H. M.: Description of the unsaturated soil hydraulic database UNSODA version 2.0, J. Hydrol., 251, 151–162, https://doi.org/10.1016/S0022-1694(01)00465-6, 2001.
Pagliai, M., Vignozzi, N., and Pellegrini, S.: Soil structure and the effect of management practices, Soil Till. Res., 79, 131–143, 2004.
Poggio, L., de Sousa, L. M., Batjes, N. H., Heuvelink, G. B. M., Kempen, B., Ribeiro, E., and Rossiter, D.: SoilGrids 2.0: producing soil information for the globe with quantified spatial uncertainty, SOIL, 7, 217–240, https://doi.org/10.5194/soil-7-217-2021, 2021.
Pulido Moncada, M., Helwig Penning, L., Timm, L. C., Gabriels, D., and Cornelis, W. M.: Visual examinations and soil physical and hydraulic properties for assessing soil structural quality of soils with contrasting textures and land uses, Soil Till. Res., 140, 20–28, https://doi.org/10.1016/j.still.2014.02.009, 2014.
Rahbeh, M.: Characterization of preferential flow in soils near Zarqa river (Jordan) using in situ tension infiltrometer measurements, Peer J., 7, e8057, https://doi.org/10.7717/peerj.8057, 2019.
Rahmati, M., Weihermüller, L., Vanderborght, J., Pachepsky, Y. A., Mao, L., Sadeghi, S. H., Moosavi, N., Kheirfam, H., Montzka, C., Van Looy, K., Toth, B., Hazbavi, Z., Al Yamani, W., Albalasmeh, A. A., Alghzawi, M. Z., Angulo-Jaramillo, R., Antonino, A. C. D., Arampatzis, G., Armindo, R. A., Asadi, H., Bamutaze, Y., Batlle-Aguilar, J., Béchet, B., Becker, F., Blöschl, G., Bohne, K., Braud, I., Castellano, C., Cerdà, A., Chalhoub, M., Cichota, R., Císlerová, M., Clothier, B., Coquet, Y., Cornelis, W., Corradini, C., Coutinho, A. P., de Oliveira, M. B., de Macedo, J. R., Durães, M. F., Emami, H., Eskandari, I., Farajnia, A., Flammini, A., Fodor, N., Gharaibeh, M., Ghavimipanah, M. H., Ghezzehei, T. A., Giertz, S., Hatzigiannakis, E. G., Horn, R., Jiménez, J. J., Jacques, D., Keesstra, S. D., Kelishadi, H., Kiani-Harchegani, M., Kouselou, M., Kumar Jha, M., Lassabatere, L., Li, X., Liebig, M. A., Lichner, L., López, M. V., Machiwal, D., Mallants, D., Mallmann, M. S., de Oliveira Marques, J. D., Marshall, M. R., Mertens, J., Meunier, F., Mohammadi, M. H., Mohanty, B. P., Pulido-Moncada, M., Montenegro, S., Morbidelli, R., Moret-Fernández, D., Moosavi, A. A., Mosaddeghi, M. R., Mousavi, S. B., Mozaffari, H., Nabiollahi, K., Neyshabouri, M. R., Ottoni, M. V., Ottoni Filho, T. B., Pahlavan-Rad, M. R., Panagopoulos, A., Peth, S., Peyneau, P.-E., Picciafuoco, T., Poesen, J., Pulido, M., Reinert, D. J., Reinsch, S., Rezaei, M., Roberts, F. P., Robinson, D., Rodrigo-Comino, J., Rotunno Filho, O. C., Saito, T., Suganuma, H., Saltalippi, C., Sándor, R., Schütt, B., Seeger, M., Sepehrnia, N., Sharifi Moghaddam, E., Shukla, M., Shutaro, S., Sorando, R., Stanley, A. A., Strauss, P., Su, Z., Taghizadeh-Mehrjardi, R., Taguas, E., Teixeira, W. G., Vaezi, A. R., Vafakhah, M., Vogel, T., Vogeler, I., Votrubova, J., Werner, S., Winarski, T., Yilmaz, D., Young, M. H., Zacharias, S., Zeng, Y., Zhao, Y., Zhao, H., and Vereecken, H.: Development and analysis of the Soil Water Infiltration Global database, Earth Syst. Sci. Data, 10, 1237–1263, https://doi.org/10.5194/essd-10-1237-2018, 2018.
Reynolds, W. D. and Elrick, D. E.: Determination of Hydraulic Conductivity Using a Tension Infiltrometer, Soil Sci. Soc. Am. J., 55, 633–639, https://doi.org/10.2136/sssaj1991.03615995005500030001x, 1991.
Rienzner, M. and Gandolfi, C.: Investigation of spatial and temporal variability of saturated soil hydraulic conductivity at the field-scale, Soil Till. Res., 135, 28–40, https://doi.org/10.1016/j.still.2013.08.012, 2014.
Sandin, M., Koestel, J., Jarvis, N., and Larsbo, M.: Post-tillage evolution of structural pore space and saturated and near-saturated hydraulic conductivity in a clay loam soil, Soil Till. Res., 165, 161–168, https://doi.org/10.1016/j.still.2016.08.004, 2017.
Schaap, M. G. and Leij, F. J.: Improved prediction of unsaturated hydraulic conductivity with the Mualem-van Genuchten model, Soil Sci. Soc. Am. J., 64, 843–851, 2000.
Schaap, M. G., Leij, F. J., and van Genuchten, M. T.: ROSETTA: a computer program for estimating soil hydraulic parameters with hierarchical pedotransfer functions, J. Hydrol., 251, 163–176, 2001.
Schlüter, S., Albrecht, L., Schwärzel, K., and Kreiselmeier, J.: Long-term effects of conventional tillage and no-tillage on saturated and near-saturated hydraulic conductivity – Can their prediction be improved by pore metrics obtained with X-ray CT?, Geoderma, 361, 114082, https://doi.org/10.1016/j.geoderma.2019.114082, 2020.
Smettem, K. R. J. and Clothier, B. E.: Measuring unsaturated sorptivity and hydraulic conductivity using multiple disc permeameters, J. Soil Sci., 40, 563–568, https://doi.org/10.1111/j.1365-2389.1989.tb01297.x, 1989.
Soracco, C. G., Lozano, L. A., Villarreal, R., Palancar, T. C., Collazo, D. J., Sarli, G. O., and Filgueira, R. R.: Effects Of Compaction Due To Machinery Traffic On Soil Pore Configuration, Rev. Bras. Cienc. Solo, 39, 408–415, https://doi.org/10.1590/01000683rbcs20140359, 2015.
Soracco, C. G., Villarreal, R., Melani, E. M., Oderiz, J. A., Salazar, M. P., Otero, M. F., Irizar, A. B., and Lozano, L. A.: Hydraulic conductivity and pore connectivity. Effects of conventional and no-till systems determined using a simple laboratory device, Geoderma, 337, 1236–1244, https://doi.org/10.1016/j.geoderma.2018.10.045, 2019.
Tóth, B., Weynants, M., Nemes, A., Makó, A., Bilas, G., and Tóth, G.: New generation of hydraulic pedotransfer functions for Europe, Eur. J. Soil Sci., 66, 226–238, https://doi.org/10.1111/ejss.12192, 2015.
Trabucco, A. and Zomer, R.: Global Aridity Index and Potential Evapotranspiration (ET0) Climate Database, Figshare, https://doi.org/10.6084/m9.figshare.7504448.v3, 2019.
Vandervaere, J.-P., Vauclin, M., and Elrick, D. E.: Transient Flow from Tension Infiltrometers II. Four Methods to Determine Sorptivity and Conductivity, Soil Sci. Soc. Am. J., 64, 1272–1284, https://doi.org/10.2136/sssaj2000.6441272x, 2000.
Van Looy, K., Bouma, J., Herbst, M., Koestel, J., Minasny, B., Mishra, U., Montzka, C., Nemes, A., Pachepsky, Y. A., Padarian, J., Schaap, M. G., Toth, B., Verhoef, A., Vanderborght, J., van der Ploeg, M. J., Weihermuller, L., Zacharias, S., Zhang, Y. G., and Vereecken, H.: Pedotransfer Functions in Earth System Science: Challenges and Perspectives, Rev. Geophys., 55, 1199–1256, https://doi.org/10.1002/2017rg000581, 2017.
Vereecken, H., Weynants, M., Javaux, M., Pachepsky, Y., Schaap, M. G., and Genuchten, M. T. v.: Using pedotransfer functions to estimate the van Genuchten–Mualem soil hydraulic properties: A review, Vadose Zone J., 9, 795–820, 2010.
Wanniarachchi, D., Cheema, M., Thomas, R., Kavanagh, V., and Galagedara, L.: Impact of Soil Amendments on the Hydraulic Conductivity of Boreal Agricultural Podzols, Agriculture, 9, 133, https://doi.org/10.3390/agriculture9060133, 2019.
Weynants, M., Vereecken, H., and Javaux, M.: Revisiting Vereecken pedotransfer functions: Introducing a closed-form hydraulic model, Vadose Zone J., 8, 86–95, https://doi.org/10.2136/vzj2008.0062, 2009.
Weynants, M., Montanarella, L., Toth, G., Arnoldussen, A., Anaya Romero, M., Bilas, G., Borresen, T., Cornelis, W., Daroussin, J., Feichtinger, F., Gonçalves, M., Hannam, J., Haugen, L., Hennings, V., Houskova, B., Iovino, M., Javaux, M., Keay, C., Kätterer, T., Kvaerno, S., Laktinova, T., Lamorski, K., Lilly, A., Mako, A., Matula, S., Morari, F., Nemes, A., Nyborg, Å., Patyka, N., Riley, H., Romano, N., Schindler, U., Shein, E., Slawinski, C., Strauss, P., Tóth, B., and Woesten, H.: European HYdropedological Data Inventory (EU-HYDI), EUR 26053, Publications Office of the European Union, Luxembourg (Luxembourg), JRC81129., 2013.
Whalley, W. R., Dumitru, E., and Dexter, A. R.: Biological effects of soil compaction, Soil Till. Res., 35, 53–68, 1995.
Wooding, R. A.: Steady Infiltration from a Shallow Circular Pond, Water Resour. Res., 4, 1259–1273, 1968.
Wösten, J. H. M., Lilly, A., Nemes, A., and le Bas, C.: Development and use of a database of hydraulic properties of European soils, Geoderma, 90, 169–185, https://doi.org/0.1016/S0016-7061(98)00132-3, 1999.
Wösten, J. H. M., Pachepsky, Y. A., and Rawls, W. J.: Pedotransfer functions: bridging the gap between available basic soil data and missing soil hydraulic characteristics, J. Hydrol., 251, 123–150, https://doi.org/10.1016/S0022-1694(01)00464-4, 2001.
Yu, Z., Dong, W., Young, M. H., Li, Y., and Yang, T.: On evaluating characteristics of the solute transport in the arid vadose zone, Groundwater,, 52, 50–62, https://doi.org/10.1111/gwat.12026, 2014.
Yusuf, K. O., Ejieji, C. J., and Baiyeri, M. R.: Determination of sorptivity, infiltration rate and hydraulic conductivity of soil using a tension infiltrometer, J. Res. Forest. Wildlife Environ., 10, 99–108, 2018.
Yusuf, K. O., Obalowu, R. O., Akinleye, G. T., and Adio-Yusuf, S. I.: Determination of Sorptivity, Infiltration Rate and Hydraulic Conductivity of Loamy Sand using Tension Infiltrometer and Double-Ring Infiltrometer, FUOYEJET, 5, 2, https://doi.org/10.46792/fuoyejet.v5i2.501, 2020.
Zeng, C., Zhang, F., Wang, Q., Chen, Y., and Joswiak, D. R.: Impact of alpine meadow degradation on soil hydraulic properties over the Qinghai–Tibetan Plateau, J. Hydrol., 478, 148–156, https://doi.org/10.1016/j.jhydrol.2012.11.058, 2013a.
Zeng, C., Wang, Q., Zhang, F., and Zhang, J.: Temporal changes in soil hydraulic conductivity with different soil types and irrigation methods, Geoderma, 193–194, 290–299, https://doi.org/10.1016/j.geoderma.2012.10.013, 2013b.
Zhang, R.: Determination of Soil Sorptivity and Hydraulic Conductivity from the Disk Infiltrometer, Soil Sci. Soc. Am. J., 61, 1024–1030, https://doi.org/10.2136/sssaj1997.03615995006100040005x, 1997.
Zhang, Y., Zhao, W., Li, X., Jia, A., and Kang, W.: Contribution of soil macropores to water infiltration across different land use types in a desert–oasis ecoregion, Land Degrad. Dev., 32, 1751–1760, https://doi.org/10.1002/ldr.3823, 2021.
Zhang, Z., Lin, L., Wang, Y., and Peng, X.: Temporal change in soil macropores measured using tension infiltrometer under different land uses and slope positions in subtropical China, J. Soils Sediments, 16, 854–863, https://doi.org/10.1007/s11368-015-1295-z, 2016.
Zhang, Z. B., Zhou, H., Zhao, Q. G., Lin, H., and Peng, X.: Characteristics of cracks in two paddy soils and their impacts on preferential flow, Geoderma, 228–229, 114–121, https://doi.org/10.1016/j.geoderma.2013.07.026, 2014.
Zhang, Z.-H., Li, X.-Y., Jiang, Z.-Y., Peng, H.-Y., Li, L., and Zhao, G.-Q.: Changes in some soil properties induced by re-conversion of cropland into grassland in the semiarid steppe zone of Inner Mongolia, China, Plant Soil, 373, 89–106, https://doi.org/10.1007/s11104-013-1772-3, 2013.
Zhao, X., Wu, P., Gao, X., Tian, L., and Li, H.: Changes of soil hydraulic properties under early-stage natural vegetation recovering on the Loess Plateau of China, CATENA, 113, 386–391, https://doi.org/10.1016/j.catena.2013.08.023, 2014.
Zhou, B. B., Wang, Q. J., and Wu, X. B.: Optimal disc tension infiltrometer estimation techniques for hydraulic properties of soil under different land uses, Int. J. Agricult. Biol. Eng., 9, 92–98, https://doi.org/10.3965/j.ijabe.20160904.2161, 2016.