the Creative Commons Attribution 4.0 License.
the Creative Commons Attribution 4.0 License.
 | 19 Jul 2023
The role of atmospheric rivers in the distribution of heavy precipitation events over North America
Sara M. Vallejo-Bernal
Frederik Wolf
Niklas Boers
Dominik Traxl
Norbert Marwan
Jürgen Kurths
Atmospheric rivers (ARs) are filaments of extensive water vapor transport in the lower troposphere that play a crucial role in the distribution of freshwater but can also cause natural and economic damage by facilitating heavy precipitation. Here, we investigate the large-scale spatiotemporal synchronization patterns of heavy precipitation events (HPEs) over the western coast and the continental regions of North America (NA), during the period from 1979 to 2018. In particular, we use event synchronization and a complex network approach incorporating varying delays to examine the temporal evolution of spatial patterns of HPEs in the aftermath of land-falling ARs. For that, we employ the SIO-R1 catalog of ARs that landfall on the western coast of NA, ranked in terms of intensity and persistence on an AR-strength scale which varies from level AR1 to AR5, along with daily precipitation estimates from ERA5 with a 0.25∘ spatial resolution. Our analysis reveals a cascade of synchronized HPEs, triggered by ARs of level AR3 or higher. On the first 3 d after an AR makes landfall, HPEs mostly occur and synchronize along the western coast of NA. In the subsequent days, moisture can be transported to central and eastern Canada and cause synchronized but delayed HPEs there. Furthermore, we confirm the robustness of our findings with an additional AR catalog based on a different AR detection method. Finally, analyzing the anomalies of integrated water vapor transport, geopotential height, upper-level meridional wind, and precipitation, we find atmospheric circulation patterns that are consistent with the spatiotemporal evolution of the synchronized HPEs. Revealing the role of ARs in the precipitation patterns over NA will lead to a better understanding of inland HPEs and the effects that changing climate dynamics will have on precipitation occurrence and consequent impacts in the context of a warming atmosphere.
- Article
(7812 KB) - Full-text XML
-
Supplement
(5881 KB) - BibTeX
- EndNote


Atmospheric rivers (ARs) are channels of enhanced water vapor flux that transport moisture over thousands of kilometers, often from the tropics to the midlatitudes of both hemispheres, where they can cause substantial precipitation following landfall (e.g., Zhu and Newell, 1998; Ralph and Dettinger, 2011; Baggett et al., 2017; Eiras-Barca et al., 2018; Mundhenk et al., 2018; Shields et al., 2018; Ralph et al., 2019; Payne et al., 2020; O’Brien et al., 2022). Located in the lower troposphere, ARs can persist from several hours to several days, carrying as much water as the Amazon River (Newell et al., 1992). Therefore, they play a crucial role in the global water cycle (Neiman et al., 2008), the Arctic water influx (Baggett et al., 2016), and the occurrence of heavy precipitation events (HPEs) (Neiman et al., 2008; Krichak et al., 2015). However, intense and persistent ARs have also been associated with natural hazards such as extreme winds, floods, and landslides and their respective economic losses (Ramseyer and Teale, 2021; Sharma and Déry, 2020; Corringham et al., 2019; Ralph et al., 2019; Waliser and Guan, 2017). Further motivated by their high environmental, social, and economic impacts, occurrences of ARs have been studied intensively in the last decade, especially on the western coasts of North America (NA) and Europe (Smith et al., 2010; Dettinger et al., 2011; Newman et al., 2012; Lavers and Villarini, 2013; Warner et al., 2015; Krichak et al., 2015; Shields and Kiehl, 2016; Ramos et al., 2016; Baggett et al., 2017; Shields et al., 2018; Mundhenk et al., 2018; Eiras-Barca et al., 2018; Ralph et al., 2019; Lora et al., 2020; Guirguis et al., 2020; Eiras-Barca et al., 2021; Huang et al., 2021; O’Brien et al., 2022).
With this increased interest in understanding the dynamics, impacts, and future evolution of ARs, a plethora of methodological approaches to identify and track these atmospheric features have been proposed, and multiple AR catalogs have been produced and made available to the public (Gershunov et al., 2017; Guan and Waliser, 2015; Prabhat et al., 2021; Pan and Lu, 2019; Traxl, 2022). This abundance of information has brought big challenges to the climate research community as the climatological statistics of ARs have proven to be highly dependent on the identification method chosen (Huning et al., 2017), affecting, in particular, the resultant AR climatologies and the attribution of high-impact weather and climate events to ARs (Shields et al., 2018). As a collective effort to address these issues, the Atmospheric River Tracking Method Intercomparison Project (ARTMIP) has quantified and analyzed the uncertainties in AR science based on the choice of detection/tracking methodology (Shields et al., 2018; Rutz et al., 2019; O’Brien et al., 2022; Lora et al., 2020). The results achieved by this scientific community provide guidelines to identify the most appropriate algorithm for a given scientific question or region of interest.
As a consequence, novel and relevant topics of AR science have been studied, such as the initiation and evolution of ARs, their moisture sources (Guan and Waliser, 2019; Waliser and Guan, 2017; Rutz et al., 2014), and the foreseen response of ARs to a warmer or different climate (Gao et al., 2015; Hagos et al., 2016; Payne et al., 2020). Due to these contributions, the following key findings have been recently revealed to the climate scientific community:
-
In the Northern Hemisphere, ARs usually originate in the midlatitude ocean basins (Guan and Waliser, 2019) paired with extratropical cyclones (Zhang et al., 2019).
-
As they transit to the east, ARs accumulate and transport moisture, primarily to the western coasts of NA and Europe, where they facilitate precipitation and play a key role both in the freshwater supply and in the occurrence of HPEs.
-
In the context of ongoing climate change and as a response to the higher water vapor content in a warmer atmosphere, a poleward shift in the land-falling location, together with an increase in the frequency and intensity of ARs, can be expected in the coming decades (Gao et al., 2016; Hagos et al., 2016; Payne et al., 2020).
-
Compared with the present, ARs affecting middle and high elevations are expected to result in more liquid than solid precipitation, exacerbating the potential risk and severe impacts of natural hazards such as floods and landslides (Mahoney et al., 2018).
In light of the scientific knowledge that has been gained in recent decades about ARs, there has been an increasing effort to characterize and predict the landfall of ARs along the North American west coast by presenting comprehensive analyses of their drivers and properties. However, the spatiotemporal synchronization patterns of HPEs induced by ARs have not yet been studied. Here, we understand spatiotemporal synchronization as a relation between pairs of precipitation time series measured at different locations, for which events in one of the time series are significantly followed or preceded by events in the other one. Such an assessment has led, among other findings (see, e.g., Boers et al., 2013; Stolbova et al., 2014; Agarwal et al., 2019; Wolf et al., 2020b), to forecasting precipitation events in the eastern Central Andes (Boers et al., 2014a) and identifying Rossby waves as one controlling mechanism of HPEs worldwide (Boers et al., 2019). In this light, it has not been examined to what extent ARs are accompanied by characteristic synchronization patterns of HPEs. Additionally, the lag-dependent spatial impact of ARs making landfall on the western coast of NA remains unrevealed. To elaborate on the issues exposed by the ARTMIP project (Shields et al., 2018; Rutz et al., 2019; O’Brien et al., 2022), in this study we address these research gaps using two AR catalogs based on different tracking schemes. Both catalogs considered here, the SIO-R1 product which was recently published by Gershunov et al. (2017) and a self-constructed one using the Image-Processing-based Atmospheric River Tracking (IPART) algorithm (Xu et al., 2020; Traxl, 2022), cover the period between 1979 and 2018. Based on the occurrence of ARs, we perform time series and complex network analyses evaluating the nonlinear spatiotemporal correlation of HPEs and their relation to ARs. To interpret our results, we furthermore study the synoptic conditions of the lower atmosphere during AR events leading to the identified synchronization patterns.
The paper is structured as follows. First, we introduce the employed data sets and methods, in particular the characteristics of the two AR catalogs, ERA5, and the event synchronization (ES) and complex network techniques. Second, we conduct an ES-based assessment of the temporal correlation between land-falling ARs and HPEs for different lags. Having revealed different timescales at which AR-related HPEs occur, we set up two climate networks based on HPEs taking place at different lags. Finally, we study composite anomalies of integrated water vapor transport, geopotential height, wind, and precipitation for the times during which we identified features of synchronized HPEs to discuss our findings in the context of the guiding climatology.
2.1 Data sets
We use data from ERA5 (Hersbach et al., 2020; Hersbach et al., 2023a, b). All ERA5 data sets are available on a longitude–latitude grid with a spatial resolution of . We construct daily estimates for integrated water vapor transport (IVT), geopotential height at 500 hPa, wind at 650 hPa, and precipitation by considering the daily mean of the hourly data sets for the period 1979–2018. To examine the synchronization of HPEs, we especially consider the 95th percentile thresholds of the daily precipitation estimates (see Supplement, Fig. S1). Only days exceeding 1 mm of total precipitation, which we refer to as wet days, are used for computing the percentiles.
Recent studies have revealed the biases present in ERA5, especially for precipitation estimations. Disagreements on the number of wet days, the co-occurrence of precipitation events, and the precipitation intensity were identified, along with a consistent pattern of decreasing agreement with increasing intensity of events, independently of the season (Rivoire et al., 2021). Larger differences were found over western NA, where ERA5 has additional difficulties in detecting and estimating orographic precipitation events (Adhikari and Behrangi, 2022). However, despite these biases, we use ERA5 because it provides a globally gridded hourly product, from which we extracted regional daily estimates of all the climatic variables considered, maintaining consistency among the data and with the large-scale circulation patterns.
In addition to the ERA5 data set, we use the SIO-R1 catalog of ARs by Gershunov et al. (2017). It includes ARs land-falling on the western coast of NA and was constructed using Lagrangian backtracking of high values of two variables, namely the vertically integrated horizontal vapor transport and the vertically integrated water vapor (IWV), on a longitude–latitude grid with a resolution of . The catalog features a 6-hourly time series indicating whether an AR has been active as well as the grid cells covered by the AR and the IVT over the grid cell along the coast where the AR made landfall. We transform the 6-hourly catalog into a daily one by considering each day with at least one of the four 6-hourly time steps with an active AR as an AR day. Approximately one-third of all days of the analysis period are AR days (at least one AR active somewhere in the spatial domain covered by the catalog). These days are distributed relatively equally over the different years but are strongly seasonally clustered in the boreal autumn and winter.
Furthermore, we create an additional catalog of ARs with features similar to the SIO-R1 catalog but using the IPART algorithm (Xu et al., 2020). As opposed to conventional detection methods that rely on thresholding of IVT or IWV fields (for instance the detection algorithm of the SIO-R1 catalog), IPART implements the detection task from a spatiotemporal-scale perspective and is, therefore, free from magnitude thresholds. The advantage of IPART’s approach is that it negates the implicit assumption of thresholding approaches that the atmospheric moisture level stays unchanged throughout the analysis period. As input to the IPART algorithm, we use IVT fields of the ERA5 data set re-gridded to a spatial resolution of and a temporal resolution of 6 h. The parameters passed to the different steps of the IPART algorithm are summarized in Table S1 in the Supplement (Traxl, 2022). We transform the 6-hourly product into a daily one in the same manner as described for the SIO-R1 catalog.
To separate the impact of rather weak ARs from strong ARs, we rank AR events of both catalogs in terms of intensity and persistence on the AR-strength scale proposed by Ralph et al. (2019) and using the notation in Eiras-Barca et al. (2021). As a result, each AR event is assigned a level that increases from AR1 to AR5, and we run our analysis repeatedly, excluding ARs from lower levels.
2.2 Directed event synchronization (ES) between land-falling ARs and HPEs
ES, as initially introduced by Quiroga et al. (2002), is a nonlinear temporal correlation measure that quantifies the co-variability of events in a pair of time series. While it was originally proposed for analyzing spike trains in electroencephalographic time series, ES is nowadays an established tool employed to construct climate networks (Malik et al., 2012; Boers et al., 2013, 2019; Ozturk et al., 2019; Wolf et al., 2020).
To define directed ES, let the sequence denote the time series of ARs of level l or higher, making landfall on the western coast of NA, and let the sequence denote the time series of HPEs observed at grid cell i. The total number of land-falling ARs of level l or higher and the total number of HPEs at grid cell i are denoted by nl and ni, respectively. We say that the HPE ν, observed at location i, at time , is synchronized with the preceding AR event μ, of level l or higher, which made landfall at time , if and only if their temporal delay, , does not exceed the dynamical delay:
This adaptive lag allows us to consider events in more densely and more sparsely occupied parts of the time series in an automated manner, in contrast to the classical lead–lag approach that only allows one lead or lag for the entire time series. Since the first and last events of each time series do not have a preceding or following event, we exclude them from our calculations and only consider and . See Fig. 1 for an illustration of the computation of the dynamical delay .
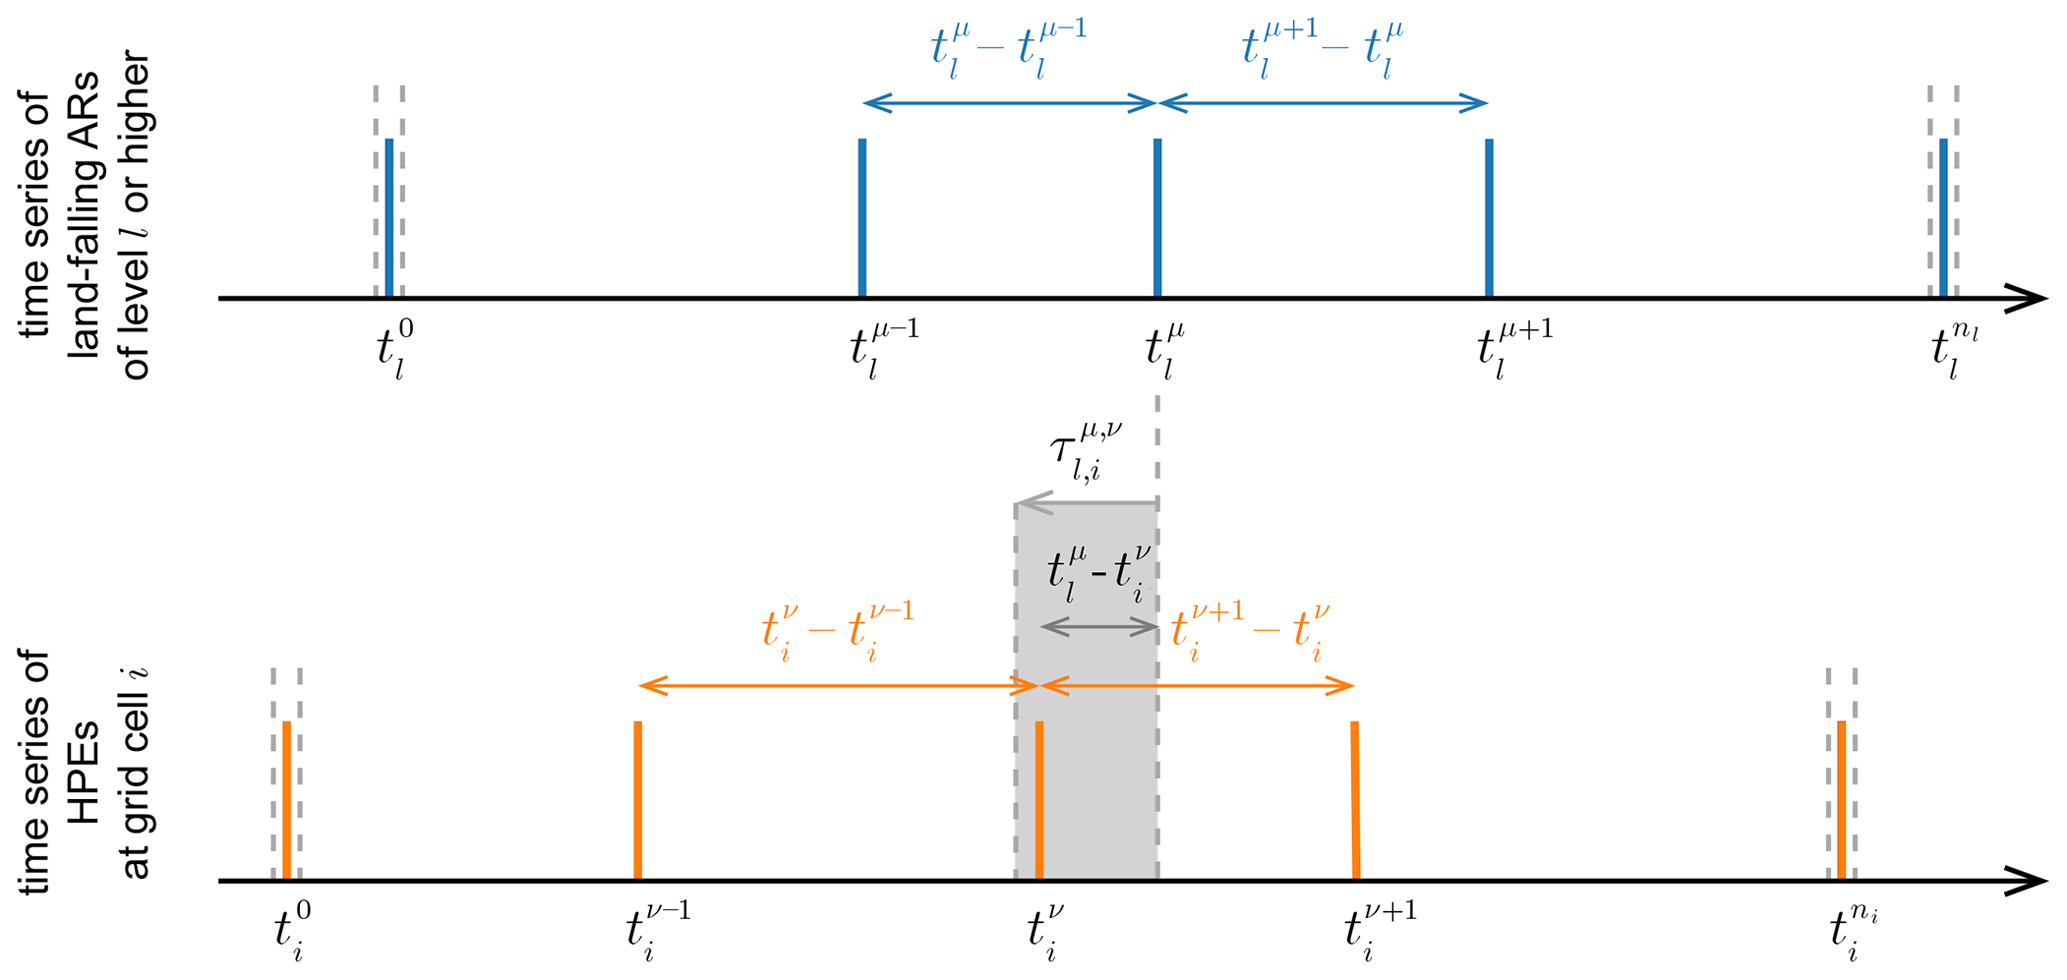
Figure 1Schematic sketch illustrating event synchronization (ES). Shown are a pair of time series and an exemplary computation of the dynamical delay . Additionally, the first and last events which are not considered for ES are marked by vertical gray lines.
To avoid a collapse of the dynamical delay to
time step due to sequences of consecutive events, we only consider the first event of all event sequences (cluster-corrected ES) (Boers et al., 2019; Wolf and Donner, 2021). Additionally, we can limit the dynamical delay by a minimal value τmin to consider a minimum lag between synchronized events and also by a maximal value τmax to prevent an unrealistically large temporal delay between synchronized events.
Then, the synchronization condition reads
and for grid cell i, we define
as the total number of HPEs that can be uniquely associated with a preceding land-falling AR in a time-resolved manner, within an interval of at least τmin days and no more than τmax days.
Finally, we analyze the statistical significance of each empirical value ESl,i by means of a null model. To account for the time order of directed ES, we use the unchanged time series of land-falling ARs and incorporate 1000 surrogate time series of HPEs, preserving the original number of events ni but destroying a potential correlation structure. We calculate the value of ESl,i from the time series of land-falling ARs and each surrogate to estimate an empirical probability distribution, which we then use to infer the significance level of our ESl,i value (Boers et al., 2019). We say that ESl,i is significant at the level if
where Θ denotes the Heaviside function and ET is the ρth percentile of the surrogate test distribution for ESl,i.
2.3 Identification of ARs highly synchronized with a specific region
One particular advantage of ES is that we can use it to identify the temporal ordering and the time delay of synchronized events. From the synchronization condition (see Eq. 2), note that if and only if the land-falling AR event μ precedes and is synchronized with the HPE event ν observed at location i. In that case, the time delay between this pair of uniquely associated events is . If we use Eq. (4) to only consider the grid cells where the synchronization between land-falling ARs and HPEs is significant, then, for a region of interest R, we can define
as the total number of HPEs within R that were preceded and uniquely associated with the land-falling AR μ at the significance level during the time window [τmin,τmax] (Boers et al., 2019). Based on this definition, we can retrieve the time delays between the AR event μ and the significantly synchronized HPEs,
to define and calculate the typical synchronization delay between the AR event μ and the region of interest R as the mode of Dμ→R (if there are multiple modes, we take the smallest one).
We use this framework to select the ARs of level l or higher with the largest number of significantly synchronized HPEs within the region of interest R and to identify the time points that are then used to compute the composite anomalies of integrated water vapor transport, geopotential height, upper-level meridional wind, and precipitation to be shown in our results.
Even more, we can use Eq. (5) to identify ARs that were not synchronized with HPEs in the region of interest (ES). Based on a precedence analysis, we can also identify the dates when HPEs occurred in the region of interest without any AR making landfall on the coast during the previous 12 d (the selection of this preceding time window comes after one of our results). These time points are used to compute composite anomalies of the aforementioned climatological variables in order to reveal the particular synoptic conditions that differentiate ARs distributing synchronized HPEs into the region of interest.
2.4 Directed event synchronization (ES) between HPEs at different locations
We are also interested in investigating if there is a directed synchronization pattern between HPEs at different locations in the aftermath of land-falling ARs. Adapting the definition of directed ES in Sect. 2.2, we consider two HPEs ν and φ in time series describing observations made at grid cells i and j at times and as synchronized if and only if their temporal delay, , does not exceed the dynamical delay:
Again, sequences of consecutive events are counted as single events (cluster-corrected ES), and the first and last events of each time series are discarded; i.e., and , where ni and nj denote the total number of HPEs at grid cells i and j, respectively.
In this case, when the event at i happens before the event at j, the synchronization condition reads
Note the subtle but important difference with Eq. (2): we do not include events that occur simultaneously at different locations, since we cannot determine their temporal ordering.
We define the directed event synchronization from i to j as
which is the total number of synchronized events where an event at i precedes an event at j by at least τmin days and no more than τmax days.
The reverse time direction is given by
resulting in the asymmetric matrix ES, which we use for setting up climate networks as described in the following section.
2.5 Climate networks
Functional networks are defined as graphs, where nodes represent the elements of a complex system and edges represent the interaction between them. In functional networks, edges are placed between nodes following some statistical similarity, regardless of whether the nodes are physically connected or not. A climate network, as introduced in previous work by Tsonis and Roebber (2004), Tsonis et al. (2006), and Donges et al. (2009a), is a functional network whose nodes are identified with geographical locations and whose edges account for a significant and strong correlation between the climatological time series measured at the respective locations. Recently, the climate network approach has attracted much attention after being successfully applied to reveal novel insights into the dynamics of the Earth's climate system over different spatiotemporal scales (Tsonis and Swanson, 2008; Yamasaki et al., 2008; Donges et al., 2009b, 2011; Malik et al., 2012; Steinhaeuser et al., 2012; Boers et al., 2014b, 2015; Agarwal et al., 2019; Boers et al., 2019; Messier et al., 2019; Wolf et al., 2020b).
A network consists of N nodes connected by e edges. The topology of such a network is commonly encoded in the adjacency matrix A, with elements aij indicating whether nodes i and j are connected. In this study, we construct climate networks based on directed ES to assess the spatiotemporal correlation structure of HPEs in NA and to unravel possibly non-linear and long-range climatic linkages associated with the land-falling of ARs on the western coast of NA. We identify the nodes of the network with the gridded time series of the ERA5 data and connect the nodes based on their statistical association evaluated by directed ES. To transform the daily ERA5 precipitation estimates to an event time series, we threshold the time series of wet days of each grid cell at the 95th percentile. Subsequently, we apply the cluster-corrected ES (Boers et al., 2014a; Wolf et al., 2020) with a lower and upper threshold for the dynamical delay which is specified in the respective sections. We use the resulting synchronization matrix ES to place a directed link pointing from grid cell i to grid cell j if HPEs at i precede and are synchronized with HPEs at j.
Note that, by construction, we typically have different numbers of events at different grid cells, since we calculate the percentile of the wet days and not of the entire time series. The number of events affects the measured values of ES; therefore, to ensure that the edges placed between nodes are statistically significant and to account for the time order of directed ES, we apply a locally tailored significance testing scheme. For a pair of grid cells (i,j), we set up a null model using the unchanged time series of HPEs for grid cell i and 1000 surrogate time series of HPEs for j that preserve the respective number of events nj. We assume that the events at j occur independently according to a uniform random distribution and compute the value ESi,j for each surrogate time series, obtaining an empirical distribution function. We then connect nodes in the network (by setting aij=1 in the adjacency matrix) if ESi,j exceeds the 99.5th percentile of the respective surrogate test distribution (Boers et al., 2019):
where Θ denotes the Heaviside function, ET is the 99.5th percentile of the surrogate test distribution for ESi,j, and Kronecker’s delta δij is used to exclude self-loops.
As a remark, we want to emphasize that considering the temporal ordering of the events to calculate ES (see Eqs. 9 and 10) results in a directed climate network, for which the adjacency matrix is not symmetric (in contrast to undirected networks). Moreover, since we also do not consider edge weights, the adjacency matrix is binary: aij=1 if an edge points from node i to node j; aij=0 otherwise.
This methodology of combining ES and complex networks is based on the idea that ARs influence the way HPEs synchronize at different locations and that these effects are contained in the internal structure of the climate network, which can be accessed by appropriate complex network measures. In many cases, climate networks are a powerful alternative to more traditional approaches based on eigenvalue techniques (e.g., principal component analysis, PCA) (Boers et al., 2013). However, the methodology employed here has been specifically developed to analyze time series of climatological extreme events, for which PCA-like methods are not applicable due to the binary-like structure and the non-Gaussian distributions of the data (Malik et al., 2012; Boers et al., 2013, 2014a, c, b, 2015, 2019; Stolbova et al., 2014).
To calculate the number of nodes to which node i is connected, we compute the in-degree (out-degree ) as the total number of links pointing to (from) grid cell i (Boccaletti et al., 2006). To aggregate both measures and to highlight regions of predominately outgoing (or incoming) connections, we define the network divergence as
with positive (negative) values of di indicating sources (sinks) of the network: HPEs in these locations are followed (preceded) by HPEs in other locations.
3.1 HPEs synchronized with strong ARs
As a first step, we investigate where HPEs occur synchronized with land-falling ARs and at which lags. For that, we employ ES and evaluate the synchronization between the AR time series and the time series of HPEs at each grid point in the study area. To obtain the latter, we threshold the precipitation time series during wet days at the respective 95th percentile. For the former, we consider ARs from the SIO-R1 catalog making landfall on the North American west coast at a latitude N. Initially, we included all ARs, but additional analyses showed that our results are predominantly caused by ARs that landfall north of 47.5∘ N (see Supplement, Fig. S2). Moreover, we want to emphasize that our results can be reproduced using an alternative AR catalog based on the IPART algorithm (also featured in the Supplement; see Fig. S3). To separate the impact of rather weak ARs from strong ARs, we differentiate between AR levels (classification based on Ralph et al., 2019, using the notation in Eiras-Barca et al., 2021) and run the analysis repeatedly, excluding ARs from lower levels.
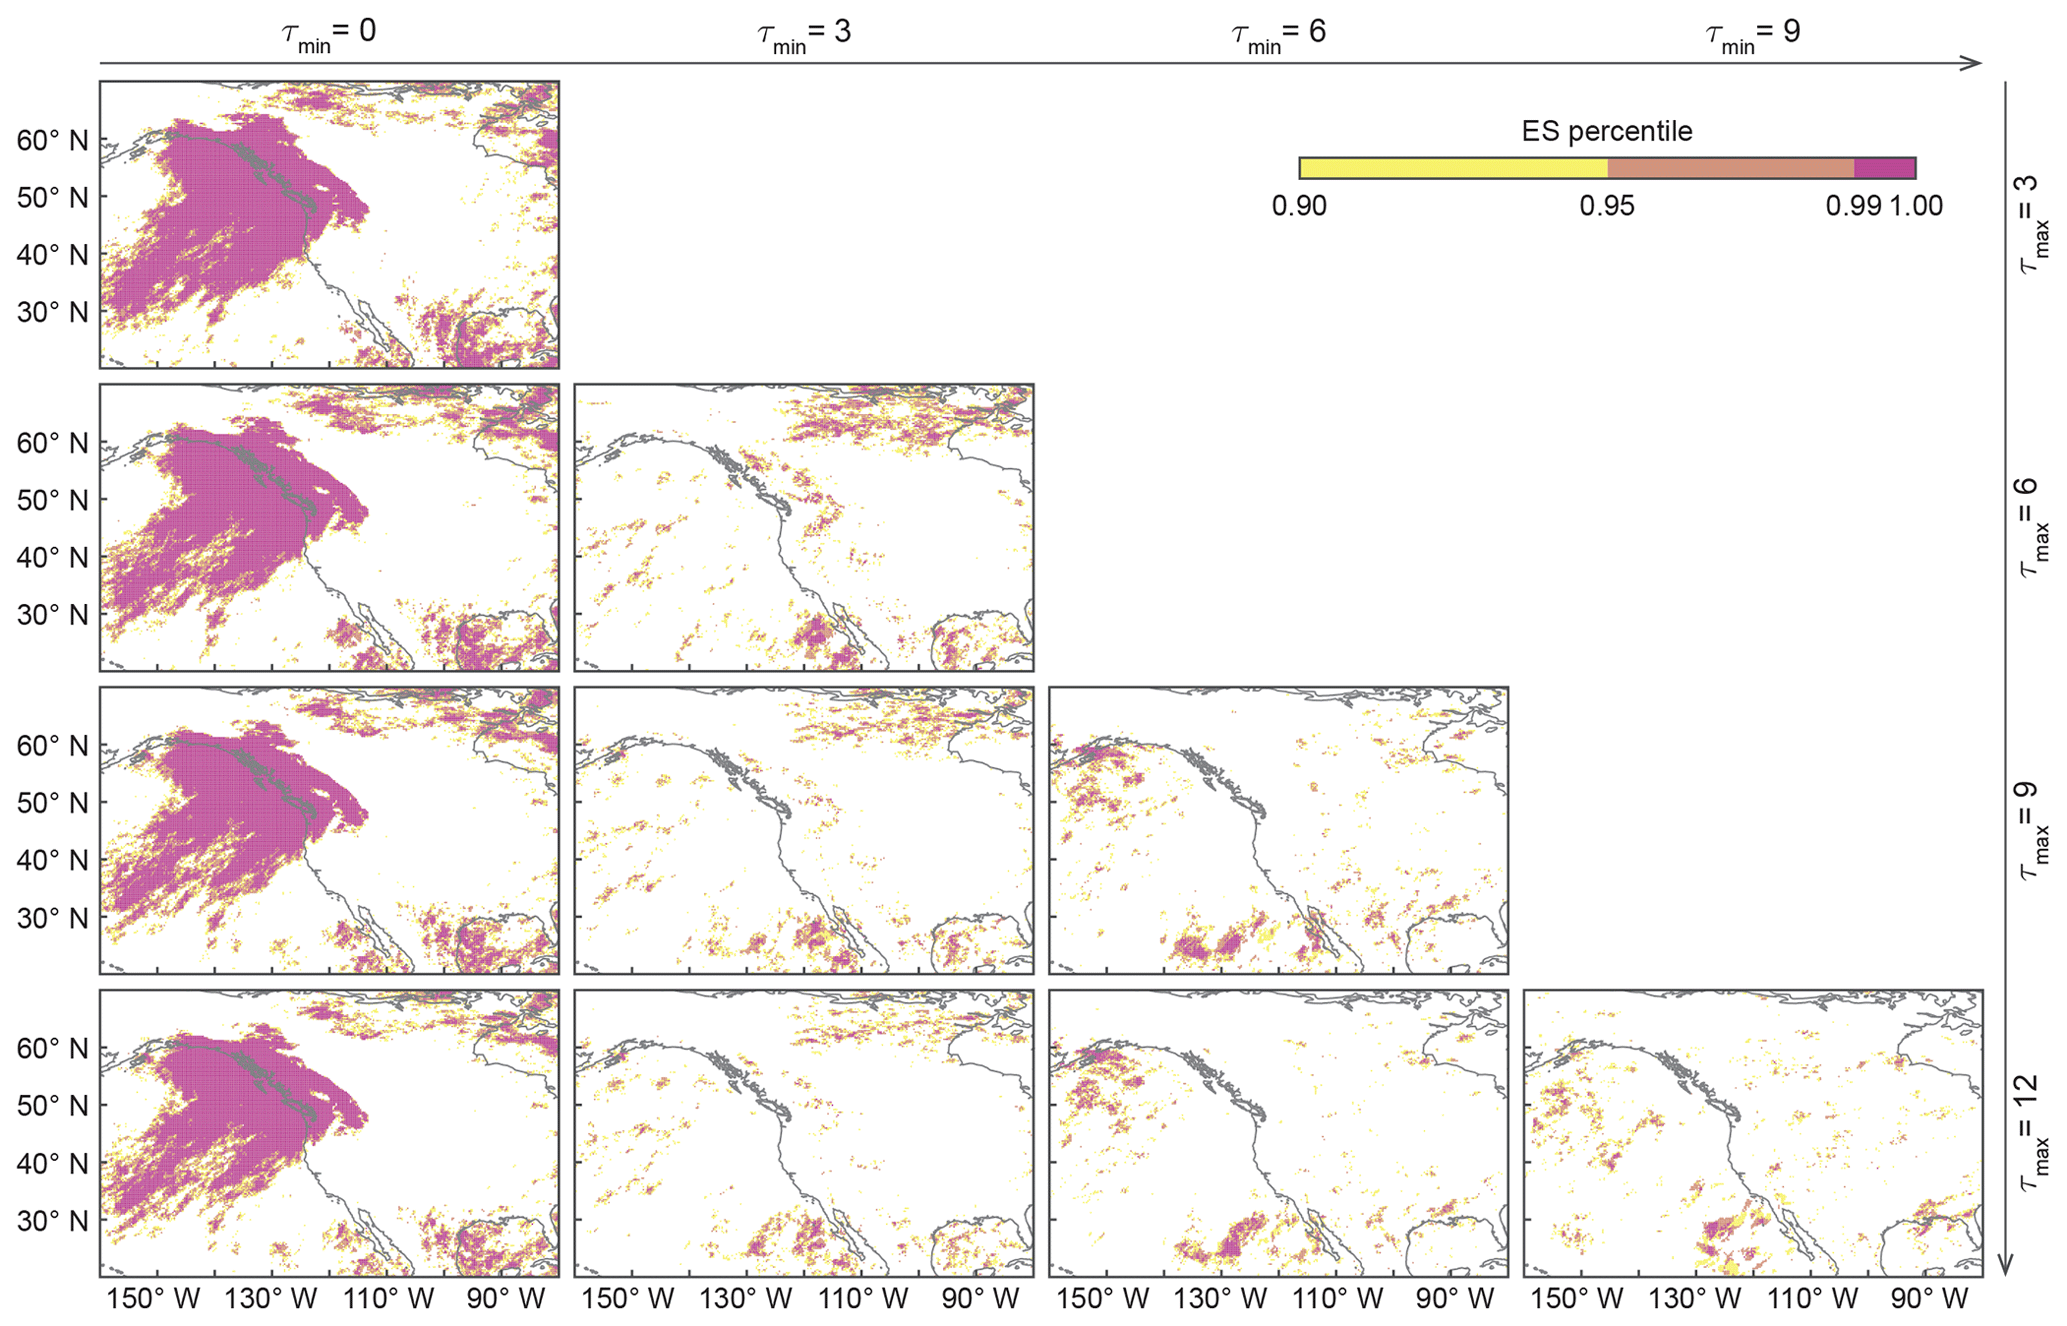
Figure 2Event synchronization (ES) between ARs making landfall on the western coast of NA and HPEs. We use the SIO-R1 catalog of land-falling ARs but only consider ARs of level AR3 or higher with a land-falling latitude north of 47.5∘ N. Different values of τmin and τmax are considered to calculate ES in each panel: τmin increases from left to right and τmax from top to bottom. Note the irregularly spaced color bar: yellow indicates high synchronization between HPEs and ARs of level AR3 or higher at a significance level of α=0.1 (and ES percentile > 0.90). Orange indicates high synchronization at a significance level of α=0.05 (and ES percentile > 0.95). Pink indicates high synchronization at a significance level of α=0.01 (and ES percentile > 0.99).
Figure 2 shows the grid points whose time series of HPEs are significantly synchronized with the AR time series, given a particular parameter setting of ES and ARs of level AR3 or higher. First, note that when τmin=0 (left column), large areas close to the western coast of NA show significant correlations. This pattern is caused by HPEs on the coast that are directly triggered by ARs and is not affected by increasing τmax. If events occur in close succession, then a higher possible maximal delay will often not be considered and, therefore, the pattern does not change visibly. This strong synchronization between land-falling ARs and HPEs on the western coast of NA was expected as it has already been implied by findings of previous studies (Neiman et al., 2008; Gershunov et al., 2017; Waliser and Guan, 2017; Ralph et al., 2019), and serves as a proof of concept for our methodology. Excluding ARs of the lower levels AR1 and AR2 does not change this result (see Supplement, Fig. S4). Therefore, we have selected ARs of level AR3 or higher for our analysis.
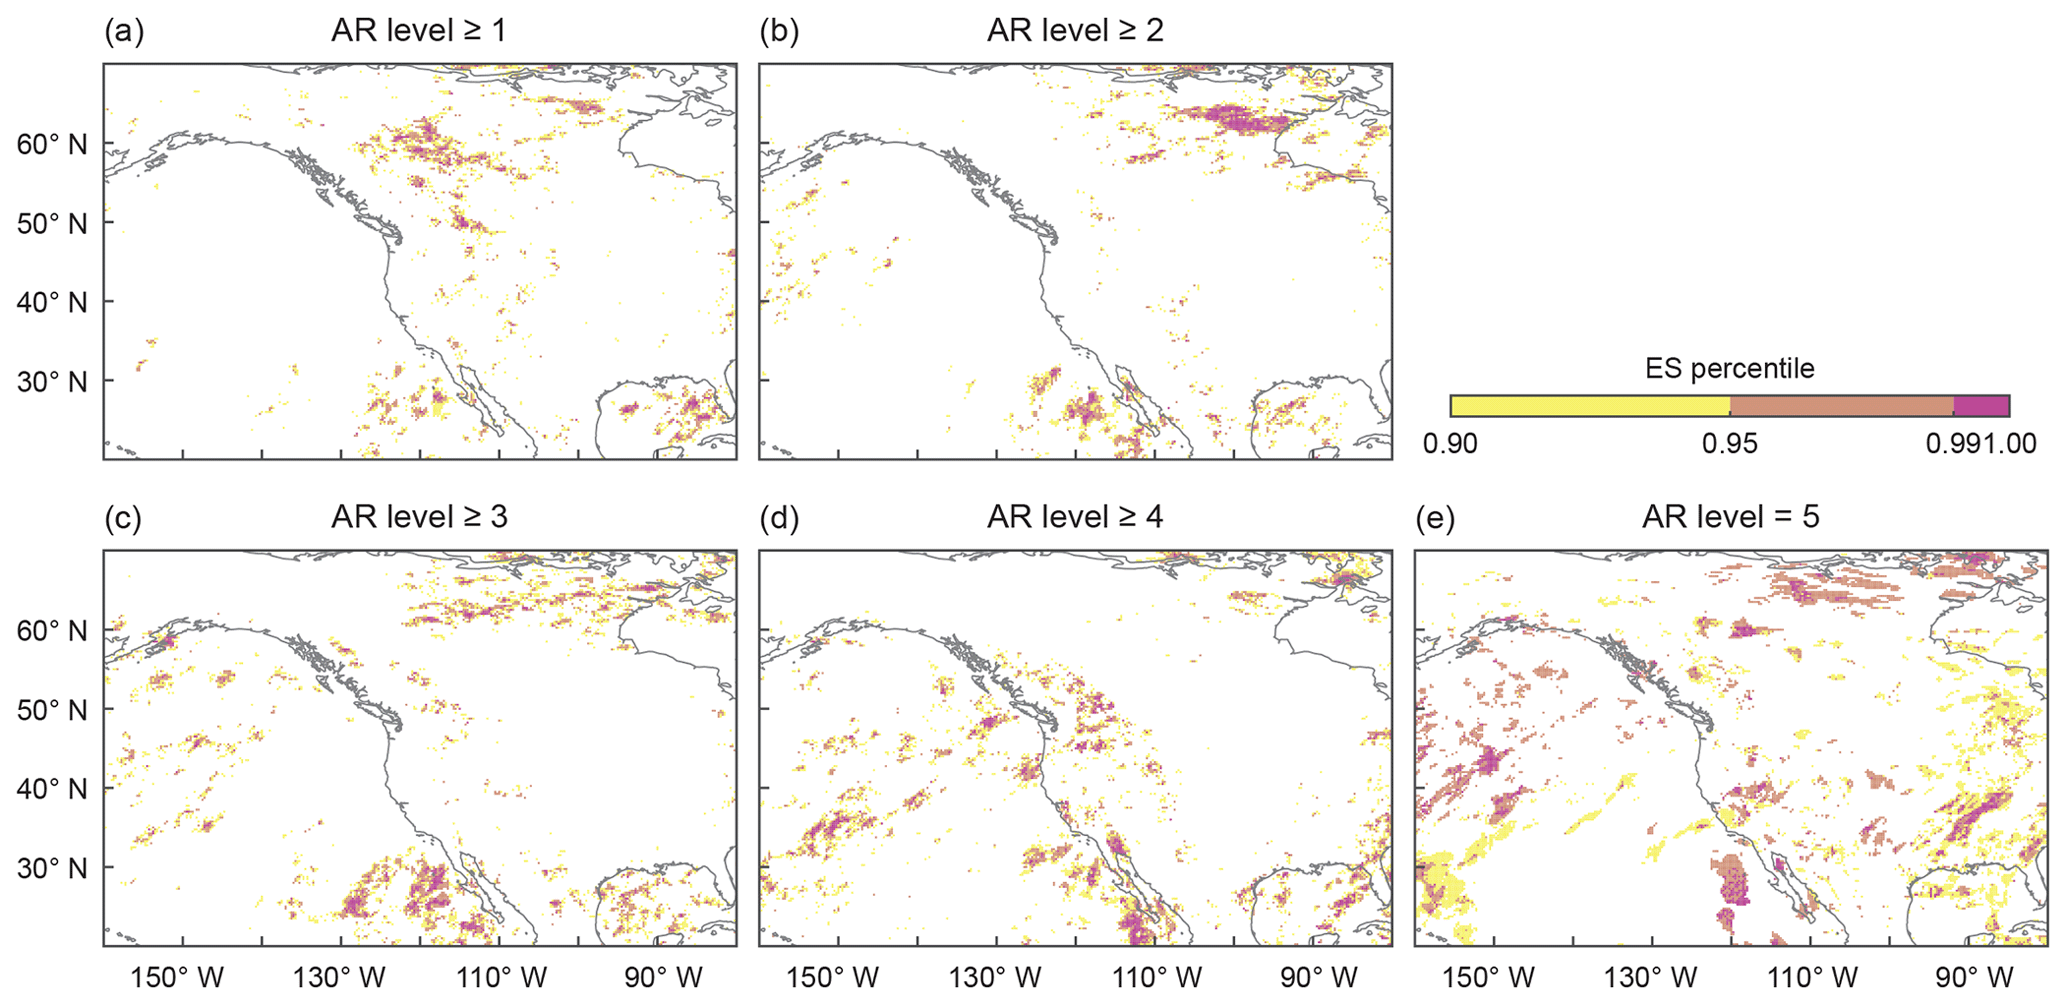
Figure 3Event synchronization (ES) between ARs making landfall on the western coast of NA and HPEs. We use the SIO-R1 catalog of land-falling ARs but only consider ARs making landfall north of 47.5∘ N. ES is calculated with τmin=3 and τmax=12. From (a) to (e) the lower limit of the considered AR level increases: (a) ARs of level AR1 and higher, i.e., all ARs, (b) ARs of level AR2 and higher, etc. Color bar as in Fig. 2.
When τmin=3 (second column), the synchronization close to the coast decreases as most HPEs occur on the first days after an AR makes landfall. Additionally, most ARs do not persist longer than 3 d (Gershunov et al., 2017). The remaining synchronized events are likely associated with ARs of the higher levels, which have a longer persistence. Additionally, we observe a patch of synchronized events in central and eastern Canada. This pattern is strongest when τmin=3 and τmax=6 and stands out to a smaller extent up to τmax=12. For elevated values of τmin (third and fourth columns), the synchronization pattern completely vanishes.
This result implies that in central and eastern Canada, HPEs occur synchronized with (but lagging) ARs making landfall on the western coast of NA. We, therefore, suspect that moisture that has been transported to the North American west coast by an AR can be channeled to central and eastern Canada and also cause HPEs there, as suggested in previous studies by Rutz et al. (2014), Waliser and Guan (2017), and Guan and Waliser (2019).
3.2 Synchronization across AR strength
Using ES, we have identified a region of synchronized HPEs in central and eastern Canada, as explained in the previous section. To further evaluate how the results depend on the selected AR-level criteria, we exclude ARs of the lower levels from the analysis stepwise, as shown in Fig. 3. Doing this, we reduce the number of events in the AR time series, which heavily affects the outcome of ES. As a result, we find that when we consider all ARs, the signal in central and eastern Canada is present but is accompanied by a more prominent synchronization pattern right next to the western coast of NA (Fig. 2). When we discard low-level ARs, the pattern next to the coast is filtered out, and when we consider ARs of level AR3 or higher, just the signal in central and eastern Canada is left. Only examining ARs of levels AR4 and AR5 leads to a vanishing of the synchronization in central and eastern Canada, although precipitation anomalies show HPEs in that region for composites based on the days after such strong ARs (see Supplement, Fig. S5). This is a result of reducing the number of events in the AR time series. Very intense ARs are rare, and when we only consider them, the AR time series contains very few events. In other words, the AR time series gets too sparse and the ES scores are not significant anymore, although HPEs might be always caused by such ARs but likely not just by them.
3.3 Network analysis of HPEs during AR days
In the previous sections, we examined the synchronization between HPEs and the singular AR time series. To elaborate further on the concept of synchronized HPEs, we assess how precipitation at different locations is organized during AR days. For that, we select the days with active ARs of level AR3 or higher, making landfall north of 47.5∘ N and the respective subsequent 3 d. We acknowledge that with this approach we can only relate HPEs close to the coastline to ARs. Based on these selected days, we run a network analysis using ES with the parameters τmin=0 and τmax=3. Therefore, we investigate the immediate synchronization pattern of HPEs occurring simultaneously with ARs.
In Fig. 4 we show the resulting network divergence, which is characterized by a large area of negative values on the coast overland and positive values over the eastern part of the Pacific. Note that network divergence is computed by subtracting (out-degree minus in-degree; see Eq. (12)); therefore, areas with positive (negative) values have more outgoing (incoming) edges and can be regarded as sources (sinks) of the network. We identify a clear source in the Pacific Ocean and a sink close to the western coast of NA. We find that HPEs over the Pacific occur first and are followed by HPEs over the western parts of NA. Additionally, there is a wave-like pattern hidden in Fig. 4 (moving further east, we observe another large area of positive network divergence, followed by negative values over the Atlantic and the east coast of NA). Since our filtering only allows for interpreting the dynamics near the western coast of NA, we can only speculate about the causes of this pattern. We suggest that this wave pattern resembles a large-scale midlatitude wave train that may indeed contain alternating moist and dry advection which may include a sequence of synchronized land-falling ARs and HPEs (Mo and Lin, 2019).
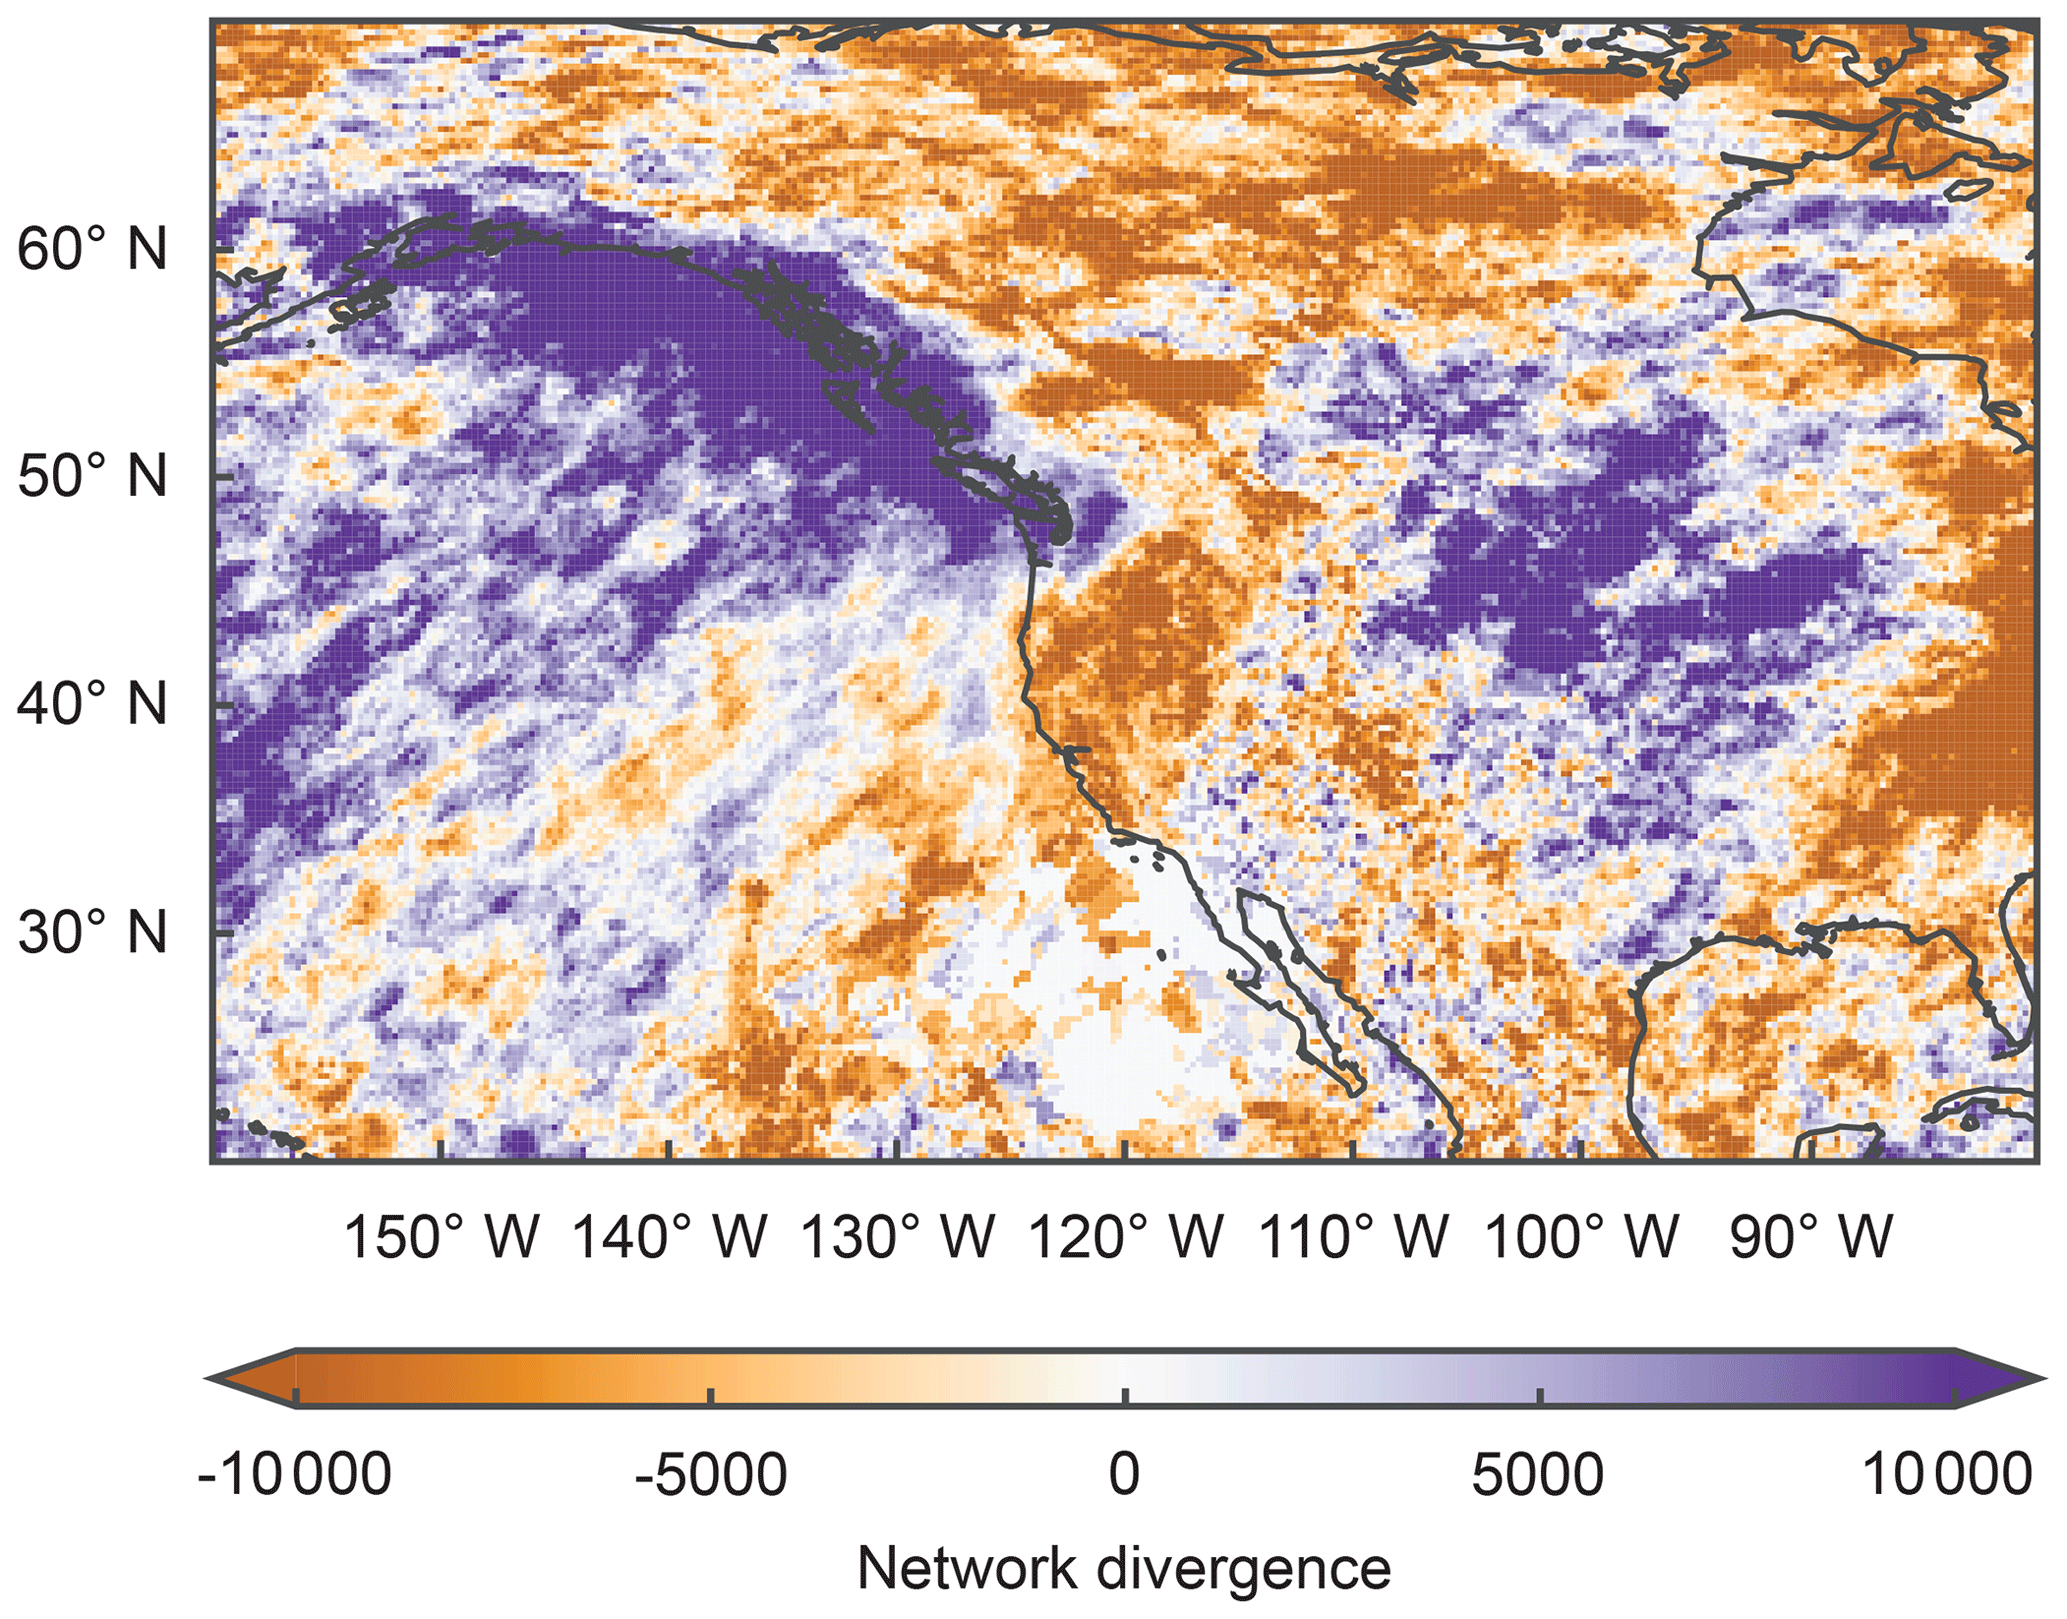
Figure 4Network divergence based on event synchronization (ES) between HPEs at different locations during AR days. We calculate ES with τmin=0 and τmax=3, and we only consider HPEs that occurred from 0 to 3 d after an AR of level AR3 or higher makes landfall north of 47.5∘ N according to the SIO-R1 catalog. In the network, only nodes with significantly directed event synchronization are connected (see Sect. 2.5 for more details). Purple (orange) colors indicate regions with positive (negative) divergence, i.e., nodes with more outgoing (incoming) connections.
3.4 Network analysis of HPEs in the aftermath of AR events
After the proof of concept in the previous section, we now extend the spatial and temporal domains. Our initial analysis showed that HPEs that occur in central and eastern Canada are synchronized with ARs land-falling on the western coast of NA considering delays in a window between τmin=3 and τmax=12 (See Fig. 2). Now, to link HPEs that are related to ARs, we choose the following setup: we consider events that occurred from 0 to 12 d after the landfall of an AR of at least level AR3 and employ ES with τmin=3 and τmax=12. With that, we assure that we keep HPEs on the coastline and in central and eastern Canada but only allow synchronization for temporal delays larger than 3 d. Consequently, we avoid obtaining a strong signal of synchronized events along the western coast of NA (where the main synchronization of events happens during the first 3 d after the first AR day). In other words: we examine the delayed synchronization pattern of HPEs (at least 3 d between events) occurring at any time after an intense AR makes landfall. The resulting network divergence is displayed in Fig. 5a.
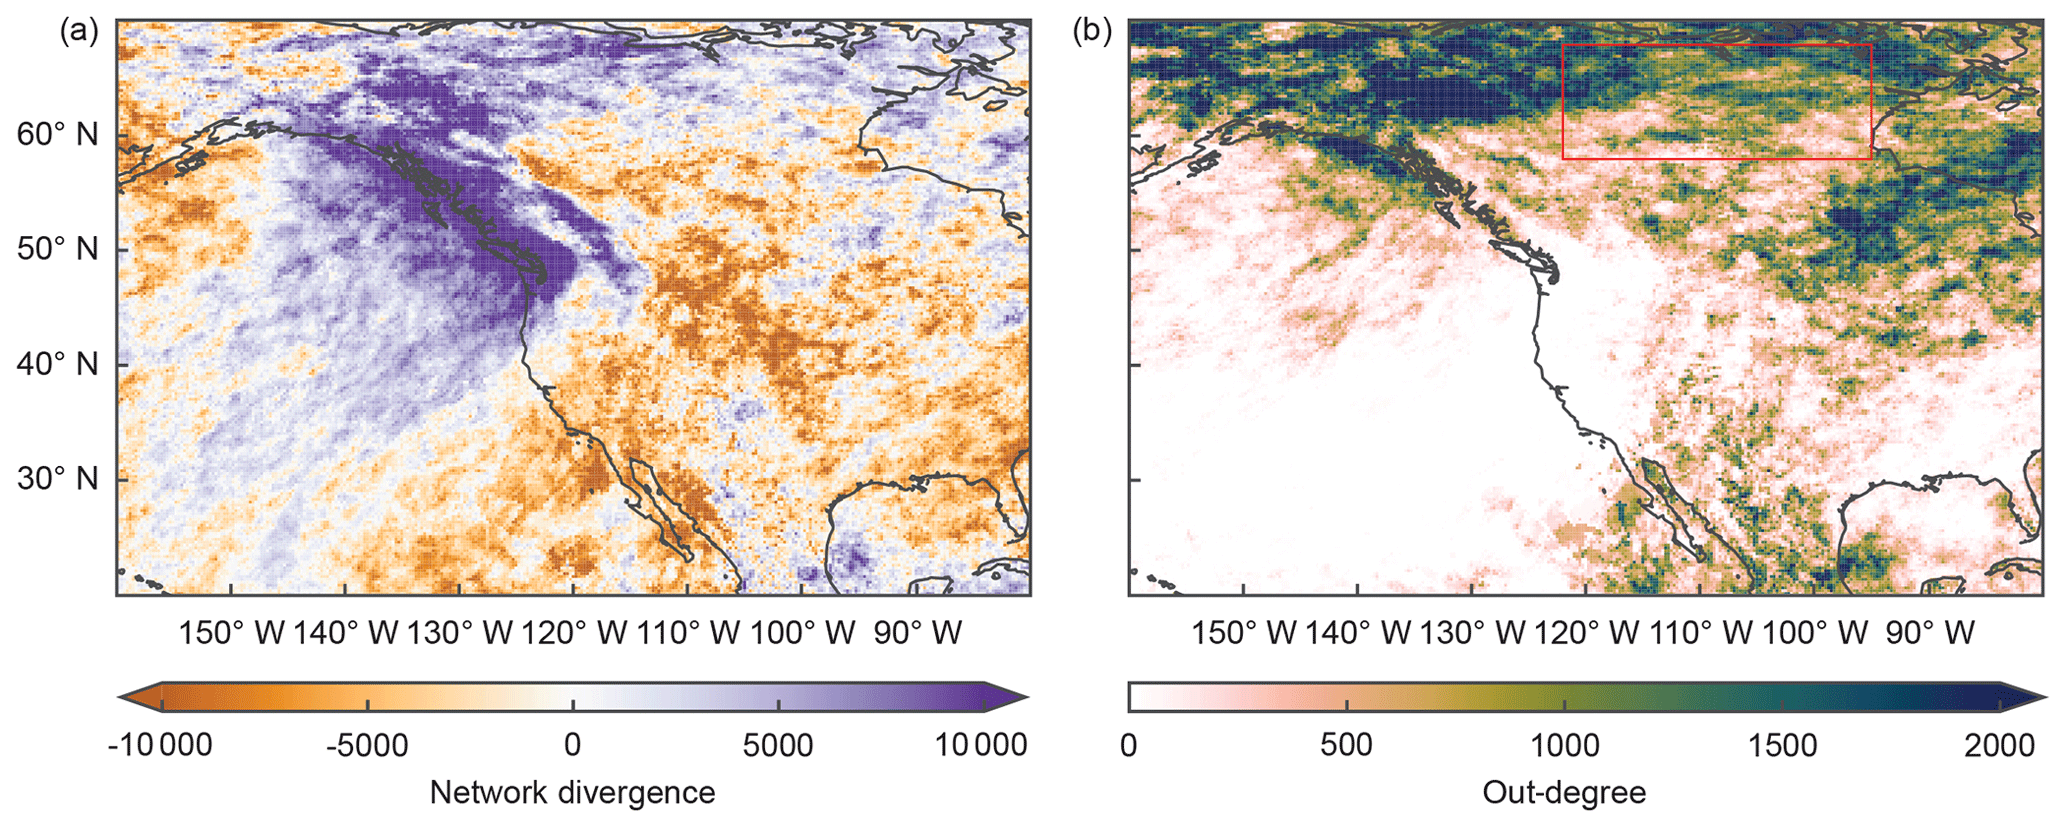
Figure 5Network analysis based on event synchronization (ES) between HPEs at different locations in the aftermath of land-falling ARs. We calculate ES with τmin=3 and τmax=12 and consider all HPEs that occurred from 0 to 12 d after an AR of level AR3 or higher makes landfall north of 47.5∘ N according to the SIO-R1 catalog. In the networks, only nodes with significantly directed event synchronization are connected (see Sect. 2.5 for more details). (a) Network divergence. Color bar as in Fig. 4. (b) Out-degree of a directed network. Highlighted are the grid cells where edges terminating in central and eastern Canada originated (red box, 58 to 68∘ N and 95 to 122∘ W). This box was chosen based on the region with significant synchronization between land-falling ARs and HPEs found in Figs. 2 and 3.
We identify a region of positive network divergence along the northern part of the western coast of NA and especially a region of reduced network divergence over central and eastern Canada, where the synchronization between the AR time series and the HPEs was initially discovered. To finally verify that there is a strong connection between the North American west coast, where we find a large number of outgoing edges, and central and eastern Canada, where many edges terminate, we analyze where edges that connect to central and eastern Canada originated (see out-degree and red box in Fig. 5b).
Figure 5b highlights the grid cells where edges originate that terminate in central and eastern Canada (red box, 58 to 68∘ N and 95 to 122∘ W). This box has been chosen based on where we have found the synchronization between the AR time series and the HPEs time series (see Figs. 2 and 3). One main source of edges to this region is the north and northwest of the study area. This confirms that edges emerge from the region that is marked by positive values in the network divergence (where HPEs synchronized within the first 3 d of the landfall of an AR) and terminate in the red box.
In summary, we have identified a cascade of HPEs: on the first 3 d after an AR of level AR3 or higher makes landfall, HPEs mostly occur close to or on the coast and synchronize in this area. In the subsequent days, moisture can be transported to central and eastern Canada and cause HPEs there. This takes place between 3 and 12 d after the first AR-induced precipitation on the coastline.
3.5 Synoptic conditions facilitating AR-induced HPEs in central and eastern Canada
Measuring the synchronization between time series revealed the spatial extent as well as the temporal dimensions of heavy precipitation related to land-falling ARs over NA. A delayed synchronization pattern between ARs making landfall on the western coast of NA and HPEs in central and eastern Canada was identified. To examine the climatic drivers leading to this long-range correlation, we study the synoptic conditions of different climatological variables for three types of events, defined as follows:
-
Type I event. An AR makes landfall on the western coast of NA and synchronizes with HPEs in central and eastern Canada in the subsequent 3 to 12 d.
-
Type II event. An AR makes landfall on the western coast of NA but does not synchronize with HPEs in central and eastern Canada in the subsequent 3 to 12 d.
-
Type III event. HPEs occur in central and eastern Canada but no AR made landfall on the western coast of NA during the previous 12 d.
To carefully choose the time points corresponding to each type of event, we first identify specific times with high event synchronization between land-falling ARs and HPEs in central and eastern Canada. We do so by using Eq. (5) with l=3, ρ=0.9, τmin=3, and τmax=12 (to match the spatial pattern found in Figs. 2 and 3) and the region of interest as the box in Fig. 5b, which we denote as region B (see Fig. 6a). Note that the resulting is a sequence that gives the total number of HPEs in region B that were preceded and uniquely associated with the AR event μ at a significance level α≤0.1. We identify ARs whose total number of associated HPEs is above the 80th percentile of the nonzero values of this sequence, and we get 35 AR events highly synchronized with HPEs in central and eastern Canada. The land-falling times of these ARs are the time points of type I events. We also use Eq. (6) to determine the typical synchronization delay between region B and each of these highly synchronized ARs, with the most common value being 5 d. We then select the 35 most intense AR events for which ES – i.e., those that did not synchronize with HPEs in central and eastern Canada – and we select their land-falling times as the time points of type II events. Finally, we identify the time points of type III events as the 35 d with the highest number of HPEs in central and eastern Canada that occurred in the absence of land-falling ARs during a time window of 12 preceding days.
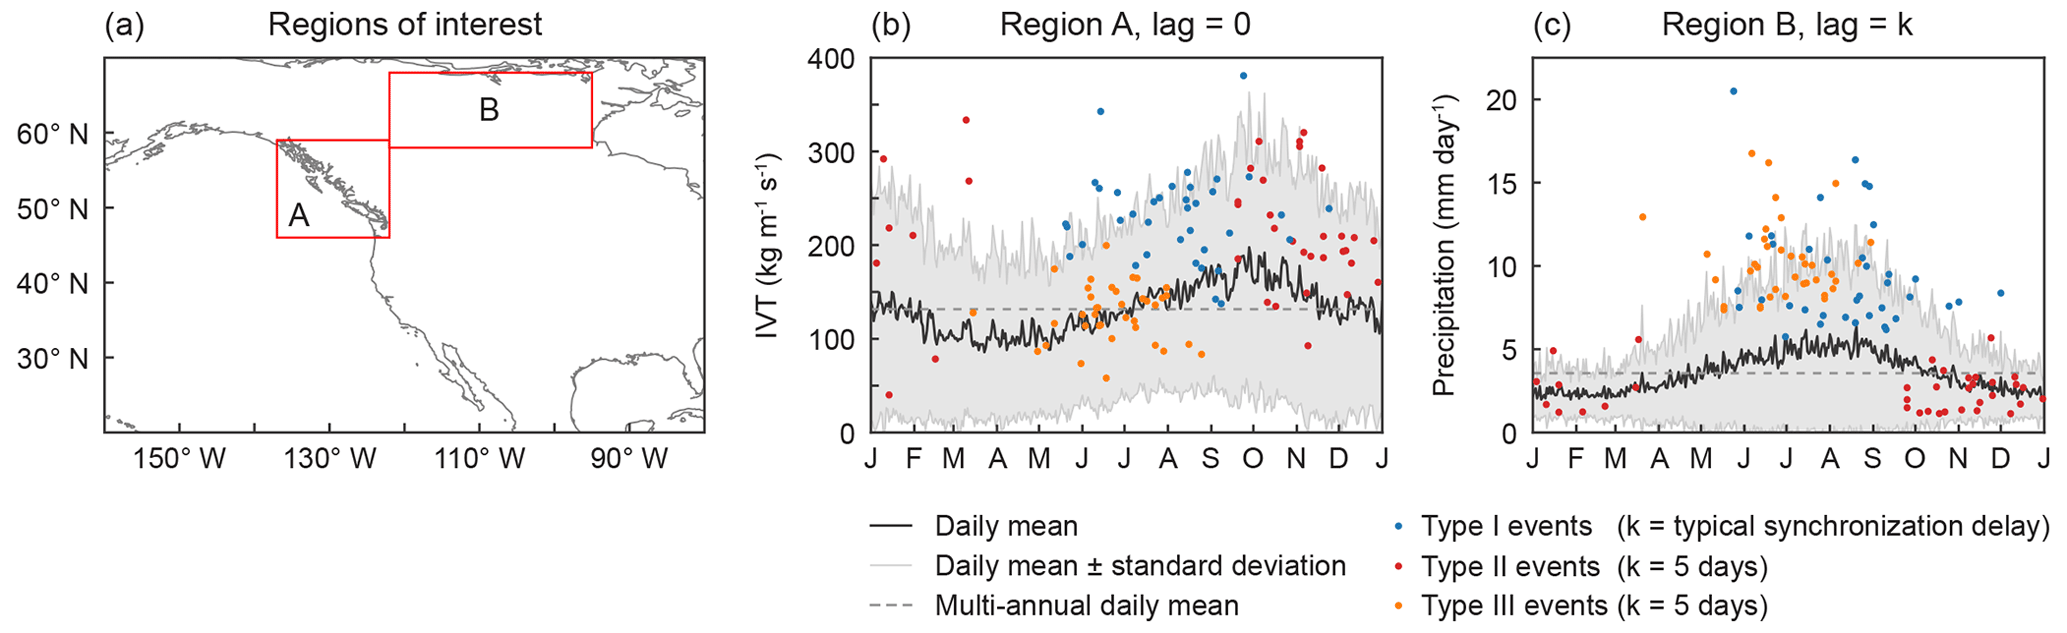
Figure 6(a) Regions of interest for the study of the synoptic conditions during and after the landfall of ARs. Region A (46 to 59∘ N latitude and 223 to 238∘ E longitude) delimits the area where ARs (with land-falling latitude ) make landfall. Region B (58 to 68∘ N latitude and 238 to 265∘ E longitude) delimits the area where the delayed synchronization between ARs and HPEs occurs. (b) Annual cycle at daily resolution of the mean IVT in region A (solid dark line). The shading encloses 1 standard deviation from the daily mean and the dashed line indicates the multi-annual mean IVT of the region. The dots show the IVT values for days with ARs that synchronize with HPEs (in blue), days with ARs that do not synchronize with HPEs (in red), and days preceding HPEs without land-falling ARs (in orange) (c) Annual cycle at daily resolution of the mean precipitation in region B, with the same conventions as in panel (b). Note that the dots in panel (c) are lagged with respect to the dots in panel (b) by a value of k∈ℕ that depends on the type of event, such that the dots in panel (b) show the IVT conditions on the western coast of NA and the dots in panel (c) show the subsequent precipitation conditions in central and eastern Canada. For more details on the types of events and the corresponding value of k, see Sects. 2.3 and 3.5.
We use these three types of events to analyze the antecedent IVT over the western coast of NA and the subsequent precipitation over central and eastern Canada and thus define the two regions of interest shown in Fig. 6a. Region A, where we analyze IVT anomalies, covers the area where the ARs make landfall north of 47.5∘ N (from 46 to 59∘ N latitude and from 223 to 238∘ E longitude). Region B, where we study precipitation anomalies, delimits the area where the delayed synchronization pattern between ARs and HPEs was identified (from 58 to 68∘ N latitude and from 238 to 265∘ E longitude). In Fig. 6b we show the annual cycle at daily resolution of the mean IVT in region A (solid dark line). The shading encloses 1 standard deviation from the daily mean and the dashed line indicates the multi-annual mean IVT of the region. The dots show the IVT values of the three types of events previously described. Similarly, Fig 6c shows the annual cycle at daily resolution of the mean precipitation in region B and the precipitation values of the three types of events. It is important to clarify that the dots in panel c are time-delayed with respect to the dots in panel b, as follows: (i) for type I events, the dots in panel b are shown on the day the AR makes landfall and the dots in panel c are shown after the respective typical synchronization delay (); (ii) for type II events, the dots in panel b are also shown on the day the AR makes landfall but the corresponding dots in panel c are shown 5 d later (k=5); and (iii) for type III events, the dots in panel b are shown 5 d before the occurrence of HPEs in central and eastern Canada and the corresponding dots in panel c are shown on the day when the HPEs were recorded (k=5).
First, note the clear imprint of ARs on IVT values for type I and II events (Fig 6b, blue and red dots). Whether or not the land-falling AR synchronizes with HPEs in central and eastern Canada, the IVT values in region A are above the daily and the multi-annual mean with very few exceptions. Highly synchronized ARs, corresponding to type I events, have particularly anomalous values of IVT, in most cases exceeding the mean climatology by 1 standard deviation or more. By contrast, the IVT values of most type III events (orange dots) are around or below the daily and multi-annual mean IVT of the region, confirming the absence of a preceding AR making landfall on the coast for this type of event. The delayed precipitation over central and eastern Canada associated with each type of event is displayed in Fig. 6. For type I events, as expected, the precipitation values are above the daily and the multi-annual mean, with anomalies that frequently exceed the mean climatology by more than 1 standard deviation. Conversely, type II events have average or lower precipitation values, which is consistent with the absence of a synchronization pattern between land-falling ARs and HPEs. Not surprisingly, type III events referring to HPEs with no preceding ARs also have high precipitation anomalies.
Besides this proof of concept of the effectiveness of our methodology to identify types of events and synchronization delays, Fig. 6 also reveals a key characteristic of the ARs that are highly synchronized with HPEs in central and eastern Canada: their seasonality. These ARs, which define the type I events, occur most likely during July, August, and September and can be characterized as intense, long-lasting, late-summer ARs. Type II events that do not contribute to the observed synchronization pattern in central and eastern Canada are caused by ARs with similar intensity and persistence but making landfall during the early winter, i.e., in October, November, and December. Lastly, type III events describing HPEs that are not preceded by ARs are more common during the early summer months of June, July, and August.
To reveal the synoptic conditions facilitating the delayed effect of ARs in the precipitation over central and eastern Canada, we compute composite anomalies of IVT, geopotential height at 500 hPa, wind at 500 hPa, and precipitation on the days of type I events (when the highly synchronized ARs made landfall) and for the following 3, 5, and 12 d. The results are shown in Fig. 7. Similar figures for type II and III events can be found in the Supplement (see Figs. S6 and S7).
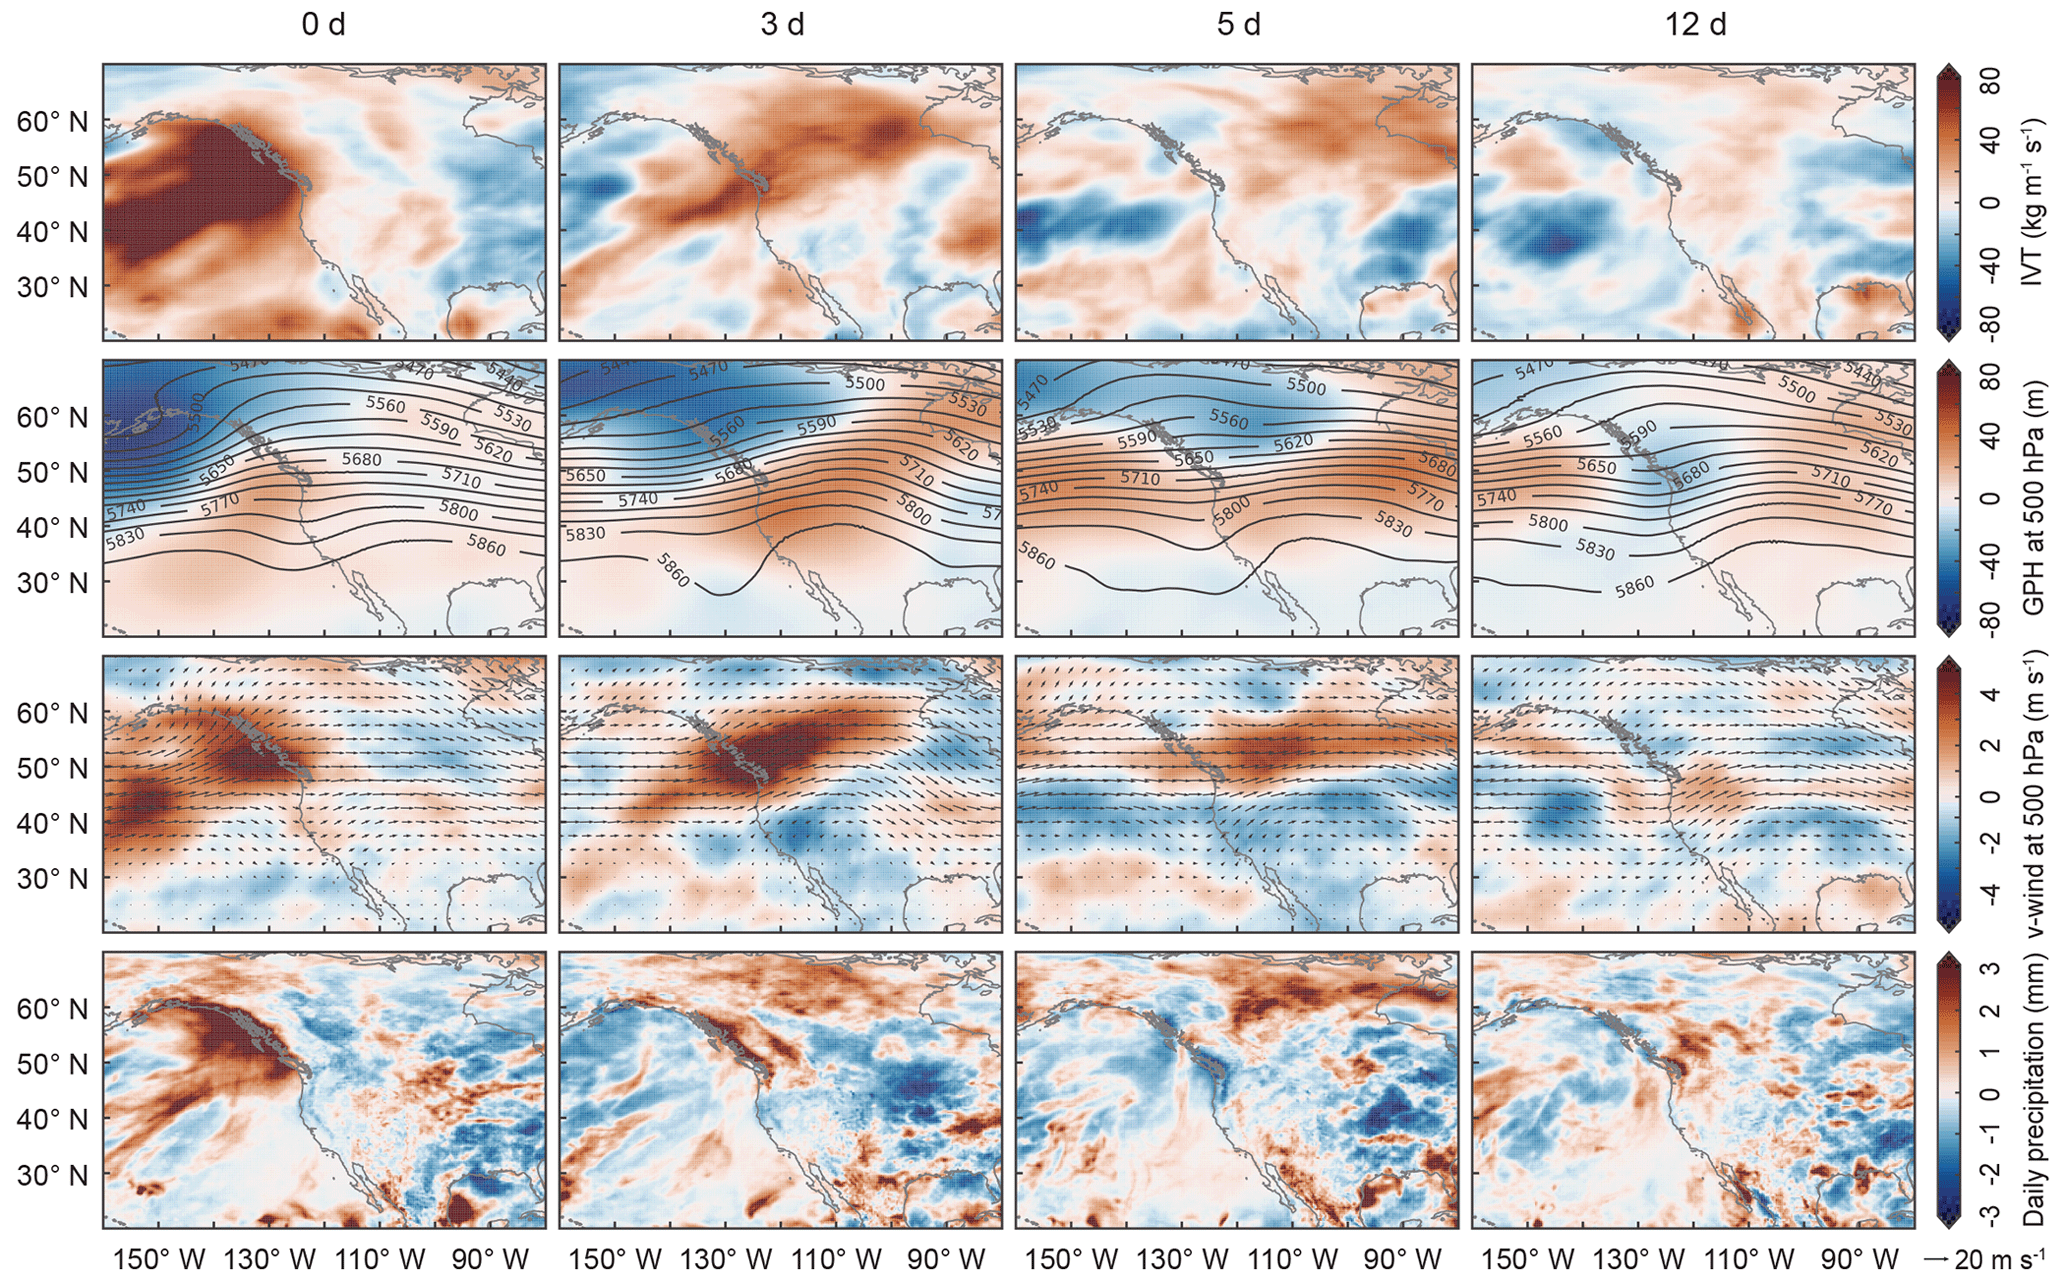
Figure 7IVT, geopotential height at 500 hPa, wind at 500 hPa, and precipitation anomalies (from top to bottom) from 0, 3, 5, and 12 d (from left to right) after the landfall of ARs leading to a delayed synchronization pattern with HPEs in central and eastern Canada. Only ARs of level AR3 or higher with land-falling latitude north of 47.5∘ N are considered. In the second row, the shading indicates the anomaly of the geopotential height at 500 hPa and the contours show the mean geopotential height. In the third row, the shading indicates the anomaly of the meridional wind at 500 hPa and the arrows show the mean wind field.
In Fig. 7, we first present the temporal evolution of the IVT anomalies (top row) after the landfall of highly synchronized ARs on the western coast of NA. The high positive IVT anomaly on the Pacific when lag = 0 d is a clear characteristic of land-falling ARs. It is noteworthy that, in the following days, this anomalous water vapor influx is able to penetrate the continent through the topographic gap previously identified by Rutz et al. (2014) and that it traverses the mainland reaching central and eastern Canada, where the synchronization pattern was found. In the second row of Fig. 7, the geopotential height at 500 hPa is assessed for varying delays as for the IVT. The trough together with the strong negative anomalies in the northwest of the study region at the moment of landfall indicates the position of the cold front driving the ARs. In the following days, the cold front digs into Canada as a ridge builds in the central and eastern United States. This configuration of the geopotential height field during highly synchronized ARs implies a mid-level pressure dipole that traverses the continent accompanied by a southwesterly steering wind (third row of Fig. 7), bringing warm moist air from the west coast into the northern regions of NA. Under these circumstances, high precipitation anomalies occur just downwind of the trough: first at the coast and then over region B, where we identified the delayed synchronization pattern between ARs and HPEs (fourth row of Fig. 7). These synoptic conditions, which are exclusive to highly synchronized ARs (see Figs. S6 and S7) and have already been identified as conducive to the occurrence of seasonal precipitation extremes over Canada (Tan et al., 2019), explain the physical mechanism by which land-falling ARs serve as moisture sources of HPEs in the northern regions of NA.
In this study, we have investigated the influence of ARs on the large-scale spatiotemporal synchronization patterns of HPEs over NA. For this purpose, we have first analyzed whether there is a significant association between ARs making landfall on the western coast of NA and HPEs over the coastal and continental regions. Employing event synchronization (ES), we have revealed timescale-dependent spatial patterns of HPEs that are significantly correlated with ARs making landfall north of 47.5∘ N: (i) immediately after an AR makes landfall on the coast, HPEs synchronize over the coastal areas; (ii) then, from 3 d after the landfall, the synchronization close to the coast decreases significantly, and only HPEs associated with more persistent ARs remain; and (iii) from 3 to 12 d after an AR makes landfall, a synchronization pattern between land-falling ARs and HPEs in central and eastern Canada emerges. These results have been reproduced using an alternative AR catalog, establishing the robustness of our findings.
After examining the synchronization of HPEs with the time series of land-falling ARs, we have analyzed the organization of HPEs on the day of landfall and the subsequent days. For this, we have evaluated directed ES between time series of HPEs at different locations and for different temporal lags after the landfall of ARs. Based on that, we have first constructed a complex network considering a time window from 0 to 3 d after landfall. This result confirmed the common knowledge of the association between ARs and HPEs in western NA. Initially, HPEs occurring simultaneously with ARs are synchronized over the eastern Pacific Ocean. They are then followed by synchronized HPEs on the western coast of NA. By examining a second complex network based on HPEs occurring at any time after the landfall of an intense AR but only allowing synchronization with a delay from 3 to 12 d, we have uncovered a strong connection between HPEs on the North American west coast and in central and eastern Canada: moisture from ARs land-falling along the coast can be transported to central and eastern Canada and cause HPEs there.
To further investigate this result, we identified specific days with high event synchronization between land-falling ARs of level AR3 or higher and HPEs in central and eastern Canada. Then, we used these time points to analyze the composite anomalies of vertically integrated water vapor transport (IVT), geopotential height at 500 hPa, wind at 500 hPa, and precipitation on the day of landfall and during the subsequent 3, 5, and 12 d. Our approach yielded two key findings regarding the climatic conditions that facilitate AR-induced HPEs in central and eastern Canada: (i) intense, long-lasting, late-summer ARs making landfall north of 47.5∘ N on the western coast of NA are the ones leading to the occurrence of delayed HPEs in central and eastern Canada, and (ii) such ARs are driven by a cold front digging from the northeast Pacific Ocean into Canada as a high-pressure region builds in central and eastern United States. This mid-level pressure dipole traverses the continent accompanied by a southwesterly steering wind, bringing the warm moist air deposited on the coast by the land-falling ARs into central and eastern Canada and facilitating synchronized but delayed HPEs there. These particular synoptic conditions, which are consistent with the seasonality of the identified ARs, explain the physical mechanism by which late-summer ARs serve as moisture sources of HPEs in the northern regions of NA. However, whether or not these ARs remain as identifiable objects following landfall remains an open question that requires a different catalog than SIO-R1 to be addressed, more specifically, a catalog that tracks the ARs not only until they make landfall but also as they penetrate the continent.
In summary, we have studied the spatiotemporal synchronization pattern of HPEs induced by ARs, revealing its extent and its temporal evolution. We have shown that the impact of ARs making landfall on the western coast of NA is not limited to these areas, since they can be accompanied by delayed but significantly synchronized HPEs in the continental regions. In particular, we have identified a cascade of synchronized HPEs: on the first 3 d after an AR makes landfall, HPEs occur and synchronize along the coast; on the subsequent days, this moisture can be transported to central and eastern Canada and cause synchronized HPEs there. Our results illustrate the role of ARs in the distribution of HPEs over NA, not only on the west coast but also over the continental regions through inland penetration of IVT. The findings presented in this work should be considered to better anticipate the evolution of the climate dynamics of the region and the associated impacts on the precipitation patterns in the context of a warming atmosphere, for which we expect an increased frequency and strength of the ARs as well as a northward shift in the locations where the ARs make landfall.
The code is available from the authors upon request. The analysis was conducted with Python. All data sets are publicly available. The ERA5 data sets can be downloaded at https://doi.org/10.24381/cds.adbb2d47 (Hersbach et al., 2023a) and https://doi.org/10.24381/cds.bd0915c6 (Hersbach et al., 2023b). The SIO-R1 catalog can be accessed at https://weclima.ucsd.edu/data-products/ (Gershunov et al., 2017).
The supplement related to this article is available online at: https://doi.org/10.5194/hess-27-2645-2023-supplement.
SMVB and FW conducted the analysis and wrote the paper. SMVB prepared the figures with the help of FW. DT prepared the section and table for the IPART catalog. All authors reviewed and improved the paper. SMVB took the lead in assessing the reviews, making the necessary changes, and coordinating the responses of all authors to the reviewers' comments.
The contact author has declared that none of the authors has any competing interests.
Publisher’s note: Copernicus Publications remains neutral with regard to jurisdictional claims in published maps and institutional affiliations.
This research has been funded by the project ClimXtreme and the training group NatRiskChange. Sara M. Vallejo-Bernal acknowledges and appreciates the stimulating and fruitful discussions with Tobias Braun. Frederik Wolf wants to give special thanks to Lukas Nageln for his exceptional advice. Niklas Boers acknowledges funding from the Volkswagen Foundation. Finally, the co-authors thank the reviewers for their valuable comments and suggestions, which contributed to improving the quality of this study.
This research has been supported by the Bundesministerium für Bildung und Forschung (grant no. 01LP1902J) and the Deutsche Forschungsgemeinschaft (grant no. GRK 2043/1).
The publication of this article was funded by the Open Access Fund of the Leibniz Association.
This paper was edited by Nadav Peleg and reviewed by two anonymous referees.
Adhikari, A. and Behrangi, A.: Assessment of satellite precipitation products in relation with orographic enhancement over the western United States, Earth Space Sci., 9, e2021EA001906, https://doi.org/10.1029/2021EA001906, 2022. a
Agarwal, A., Marwan, N., Ozturk, U., and Maheswaran, R.: Unfolding community structure in rainfall network of Germany using complex network-based approach, Springer, Singapore, https://doi.org/10.1007/978-981-13-2038-5, 2019. a, b
Baggett, C. F., Lee, S., and Feldstein, S.: An investigation of the presence of atmospheric rivers over the North Pacific during planetary-scale wave life cycles and their role in Arctic warming, J. Atmos. Sci., 73, 4329–4347, https://doi.org/10.1175/JAS-D-16-0033.1, 2016. a
Baggett, C. F., Barnes, E. A., Maloney, E. D., and Mundhenk, B. D.: Advancing atmospheric river forecasts into subseasonal-to-seasonal time scales, Geophys. Res. Lett., 44, 7528–7536, https://doi.org/10.1002/2017GL074434, 2017. a, b
Boccaletti, S., Latora, V., Moreno, Y., Chavez, M., and Hwang, D. U.: Complex networks: Structure and dynamics, Phys. Rep., 424, 175–308, 2006. a
Boers, N., Bookhagen, B., Marwan, N., Kurths, J., and Marengo, J. A.: Complex networks identify spatial patterns of extreme rainfall events of the South American Monsoon System, Geophys. Res. Lett., 40, 4386–4392, https://doi.org/10.1002/grl.50681, 2013. a, b, c, d
Boers, N., Bookhagen, B., Barbosa, H. M. J., Marwan, N., Kurths, J., and Marengo, J. A.: Prediction of extreme floods in the eastern Central Andes based on a complex networks approach, Nat. Commun., 5, 5199, https://doi.org/10.1038/ncomms6199, 2014a. a, b, c
Boers, N., Donner, R. V., and Bookhagen, B.: Complex network analysis helps to identify impacts of the El Niño Southern Oscillation on moisture divergence in South America, Clim. Dynam., 45, 619–632, https://doi.org/10.1007/s00382-014-2265-7, 2014b. a, b
Boers, N., Rheinwalt, A., Bookhagen, B., Barbosa, H. M. J., Marwan, N., Marengo, J. A., and Kurths, J.: The South American rainfall dipole: A complex network analysis of extreme events, Geophys. Res. Lett., 41, 7397–7405, 2014c. a
Boers, N., Bookhagen, B., Marwan, N., and Kurths, J.: Spatiotemporal characteristics and synchronization of extreme rainfall in South America with focus on the Andes Mountain range, Clim. Dynam., 46, 601–617, https://doi.org/10.1007/s00382-015-2601-6, 2015. a, b
Boers, N., Goswami, B., Rheinwalt, A., Bookhagen, B., Hoskins, B., and Kurths, J.: Complex networks reveal global pattern of extreme-rainfall teleconnections, Nature, 566, 373–377, https://doi.org/10.1038/s41586-018-0872-x, 2019. a, b, c, d, e, f, g, h
Corringham, T. W., Martin Ralph, F., Gershunov, A., Cayan, D. R., and Talbot, C. A.: Atmospheric rivers drive flood damages in the western United States, Sci. Adv., 5, eaax4631, https://doi.org/10.1126/sciadv.aax4631, 2019. a
Dettinger, M. D., Ralph, F. M., Das, T., Neiman, P. J., and Cayan, D. R.: Atmospheric rivers, floods and the water resources of California, Water, 3, 445–478, https://doi.org/10.3390/w3020445, 2011. a
Donges, J. F., Zou, Y., Marwan, N., and Kurths, J.: The backbone of the climate network, Europhys. Lett., 87, 48007, https://doi.org/10.1209/0295-5075/87/48007, 2009a. a
Donges, J. F., Zou, Y., Marwan, N., and Kurths, J.: Complex networks in climate dynamics, Eur. Phys.-J. Spec. Top., 174, 157–179, https://doi.org/10.1140/epjst/e2009-01098-2, 2009b. a
Donges, J. F., Schultz, H. C. H., Marwan, N., Zou, Y., and Kurths, J.: Investigating the topology of interacting networks: Theory and application to coupled climate subnetworks, Eur. Phys. J. B, 84, 635–651, https://doi.org/10.1140/epjb/e2011-10795-8, 2011. a
Eiras-Barca, J., Ramos, A. M., Pinto, J. G., Trigo, R. M., Liberato, M. L. R., and Miguez-Macho, G.: The concurrence of atmospheric rivers and explosive cyclogenesis in the North Atlantic and North Pacific basins, Earth Syst. Dynam., 9, 91–102, https://doi.org/10.5194/esd-9-91-2018, 2018. a, b
Eiras-Barca, J., Ramos, A. M., Algarra, I., Vázquez, M., Dominguez, F., Miguez-Macho, G., Nieto, R., Gimeno, L., Taboada, J., and Ralph, F. M.: European West Coast atmospheric rivers: A scale to characterize strength and impacts, Weather and Climate Extremes, 31, 100305, https://doi.org/10.1016/j.wace.2021.100305, 2021. a, b, c
Gao, J., Barzel, B., and Barabási, A.-l.: Universal resilience patterns in complex networks, Nature, 530, 307–312, https://doi.org/10.1038/nature16948, 2016. a
Gao, Y., Lu, J., Leung, L. R., Yang, Q., Hagos, S., and Qian, Y.: Dynamical and thermodynamical modulations on future changes of landfalling atmospheric rivers over western North America, Geophys. Res. Lett., 42, 7179–7186, https://doi.org/10.1002/2015GL065435, 2015. a
Gershunov, A., Shulgina, T., Ralph, F. M., Lavers, D. A., and Rutz, J. J.: Assessing the climate-scale variability of atmospheric rivers affecting western North America, Geophys. Res. Lett., 44, 7900–7908, https://doi.org/10.1002/2017GL074175, 2017 (data available at: https://weclima.ucsd.edu/data-products/, last access: 5 April 2022). a, b, c, d, e, f
Guan, B. and Waliser, D. E.: Detection of atmospheric rivers: Evaluation and application of an algorithm for global studies, J. Geophys. Res.-Atmos., 120, 12514–12535, 2015. a
Guan, B. and Waliser, D. E.: Tracking atmospheric rivers globally: Spatial distributions and temporal evolution of life cycle characteristics, J. Geophys. Res.-Atmos., 124, 12523–12552, 2019. a, b, c
Guirguis, K., Gershunov, A., DeFlorio, M. J., Shulgina, T., Delle Monache, L., Subramanian, A. C., Corringham, T. W., and Ralph, F. M.: Four atmospheric circulation regimes over the North Pacific and their relationship to California precipitation on daily to seasonal timescales, Geophys. Res. Lett., 47, e2020GL087609, https://doi.org/10.1029/2020GL087609, 2020. a
Hagos, S. M., Leung, L. R., Yoon, J.-H., Lu, J., and Gao, Y.: A projection of changes in landfalling atmospheric river frequency and extreme precipitation over western North America from the Large Ensemble CESM simulations, Geophys. Res. Lett., 43, 1357–1363, https://doi.org/10.1002/2015GL067392, 2016. a, b
Hersbach, H., Bell, B., Berrisford, P., Hirahara, S., Horányi, A., Muñoz-Sabater, J., Nicolas, J., Peubey, C., Radu, R., Schepers, D., Simmons, A., Soci, C., Abdalla, S., Abellan, X., Balsamo, G., Bechtold, P., Biavati, G., Bidlot, J., Bonavita, M., De Chiara, G., Dahlgren, P., Dee, D., Diamantakis, M., Dragani, R., Flemming, J., Forbes, R., Fuentes, M., Geer, A., Haimberger, L., Healy, S., Hogan, R. J., Hólm, E., Janisková, M., Keeley, S., Laloyaux, P., Lopez, P., Lupu, C., Radnoti, G., de Rosnay, P., Rozum, I., Vamborg, F., Villaume, S., and Thépaut, J.-N.: The ERA5 global reanalysis, Q. J. Roy. Meteor. Soc., 146, 1999–2049, 2020. a
Hersbach, H., Bell, B., Berrisford, P., Biavati, G., Horányi, A., Muñoz Sabater, J., Nicolas, J., Peubey, C., Radu, R., Rozum, I., Schepers, D., Simmons, A., Soci, C., Dee, D., and Thépaut, J.-N.: ERA5 hourly data on single levels from 1940 to present, Copernicus Climate Change Service (C3S) Climate Data Store (CDS) [data set], https://doi.org/10.24381/cds.adbb2d47, 2023a. a, b
Hersbach, H., Bell, B., Berrisford, P., Biavati, G., Horányi, A., Muñoz Sabater, J., Nicolas, J., Peubey, C., Radu, R., Rozum, I., Schepers, D., Simmons, A., Soci, C., Dee, D., and Thépaut, J.-N.: ERA5 hourly data on pressure levels from 1940 to present, Copernicus Climate Change Service (C3S) Climate Data Store (CDS) [data set], https://doi.org/10.24381/cds.bd0915c6, 2023b. a, b
Huang, H., Patricola, C. M., Bercos-Hickey, E., Zhou, Y., Rhoades, A., Risser, M. D., and Collins, W. D.: Sources of subseasonal-to-seasonal predictability of atmospheric rivers and precipitation in the western United States, J. Geophys. Res.-Atmos., 126, e2020JD034053, https://doi.org/10.1029/2020JD034053, 2021. a
Huning, L. S., Margulis, S. A., Guan, B., Waliser, D. E., and Neiman, P. J.: Implications of detection methods on characterizing atmospheric river contribution to seasonal snowfall across Sierra Nevada, USA, Geophys. Res. Lett., 44, 10–445, 2017. a
Krichak, S. O., Barkan, J., Breitgand, J. S., Gualdi, S., and Feldstein, S. B.: The role of the export of tropical moisture into midlatitudes for extreme precipitation events in the Mediterranean region, Theor. Appl. Climatol., 121, 499–515, https://doi.org/10.1007/s00704-014-1244-6, 2015. a, b
Lavers, D. A. and Villarini, G.: The nexus between atmospheric rivers and extreme precipitation across Europe, Geophys. Res. Lett., 40, 3259–3264, https://doi.org/10.1002/grl.50636, 2013. a
Lora, J. M., Shields, C., and Rutz, J.: Consensus and disagreement in atmospheric river detection: ARTMIP global catalogues, Geophys. Res. Lett., 47, e2020GL089302, https://doi.org/10.1029/2020GL089302, 2020. a, b
Mahoney, K., Swales, D., Mueller, M. J., Alexander, M., Hughes, M., and Malloy, K.: An examination of an inland-penetrating atmospheric river flood event under potential future thermodynamic conditions, J. Climate, 31, 6281–6297, 2018. a
Malik, N., Bookhagen, B., Marwan, N., and Kurths, J.: Analysis of spatial and temporal extreme monsoonal rainfall over South Asia using complex networks, Clim. Dynam., 39, 971–987, https://doi.org/10.1007/s00382-011-1156-4, 2012. a, b, c
Messier, C., Bauhus, J., Doyon, F., Maure, F., Sousa-Silva, R., Nolet, P., Mina, M., Aquilué, N., Fortin, M.-J., and Puettmann, K.: The functional complex network approach to foster forest resilience to global changes, Forest Ecosystems, 6, 1–16, 2019. a
Mo, R. and Lin, H.: Tropical–mid-latitude interactions: Case study of an inland-penetrating atmospheric river during a major winter storm over North America, Atmos. Ocean, 57, 208–232, 2019. a
Mundhenk, B. D., Barnes, E. A., Maloney, E. D., and Baggett, C. F.: Skillful empirical subseasonal prediction of landfalling atmospheric river activity using the Madden–Julian oscillation and quasi-biennial oscillation, npj Clim. Atmos. Sci., 1, 19–21, https://doi.org/10.1038/s41612-017-0008-2, 2018. a, b
Neiman, P. J., Ralph, F. M., Wick, G. A., Lundquist, J. D., and Dettinger, M. D.: Meteorological characteristics and overland precipitation impacts of atmospheric rivers affecting the West coast of North America based on eight years of SSM/I satellite observations, J. Hydrometeorol., 9, 22–47, https://doi.org/10.1175/2007JHM855.1, 2008. a, b, c
Newell, R. E., Newell, N. E., Zhu, Y., and Scott, C.: Tropospheric rivers? – A pilot study, Geophys. Res. Lett., 19, 2401–2404, 1992. a
Newman, M., Kiladis, G. N., Weickmann, K. M., Ralph, F. M., and Sardeshmukh, P. D.: Relative contributions of synoptic and low-frequency eddies to time-mean atmospheric moisture transport, including the role of atmospheric rivers, J. Climate, 25, 7341–7361, https://doi.org/10.1175/JCLI-D-11-00665.1, 2012. a
Ozturk, U., Malik, N., Cheung, K., Marwan, N., and Kurths, J.: A network-based comparative study of extreme tropical and frontal storm rainfall over Japan, Clim. Dynam., 53, 521–532, https://doi.org/10.1007/s00382-018-4597-1, 2019. a
O’Brien, T. A., Wehner, M. F., Payne, A. E., Shields, C. A., Rutz, J. J., Leung, L.-R., Ralph, F. M., Collow, A., Gorodetskaya, I., Guan, B., Lora, J. M., McClenny, E., Nardi, K. M., Ramos, A. M., Tomé, R., Sarangi, C., Shearer, E. J., Ullrich, P. A., Zarzycki, C., Loring, B., Huang, H., Inda-Díaz, H. A., Rhoades, A. M., and Zhou, Y.: Increases in future AR count and size: Overview of the ARTMIP Tier 2 CMIP5/6 experiment, J. Geophys. Res.-Atmos., 127, e2021JD036013, https://doi.org/10.1029/2021JD036013, 2022. a, b, c, d
Pan, M. and Lu, M.: A novel atmospheric river identification algorithm, Water Resour. Res., 55, 6069–6087, 2019. a
Payne, A. E., Demory, M.-E., Leung, L. R., Ramos, A. M., Shields, C. A., Rutz, J. J., Siler, N., Villarini, G., Hall, A., and Ralph, F. M.: Responses and impacts of atmospheric rivers to climate change, Nat. Rev. Earth Environ., 1, 143–157, https://doi.org/10.1038/s43017-020-0030-5, 2020. a, b, c
Prabhat, Kashinath, K., Mudigonda, M., Kim, S., Kapp-Schwoerer, L., Graubner, A., Karaismailoglu, E., von Kleist, L., Kurth, T., Greiner, A., Mahesh, A., Yang, K., Lewis, C., Chen, J., Lou, A., Chandran, S., Toms, B., Chapman, W., Dagon, K., Shields, C. A., O'Brien, T., Wehner, M., and Collins, W.: ClimateNet: An expert-labeled open dataset and deep learning architecture for enabling high-precision analyses of extreme weather, Geosci. Model Dev., 14, 107–124, https://doi.org/10.5194/gmd-14-107-2021, 2021. a
Quiroga, R. Q., Kreuz, T., and Grassberger, P.: Event synchronization: A simple and fast method to measure synchronicity and time delay patterns, Phys. Rev. E, 66, 041904, https://doi.org/10.1103/PhysRevE.66.041904, 2002. a
Ralph, F. M. and Dettinger, M. D.: Storms, floods, and the science of atmospheric rivers, Eos, T. Am. Geophys. Un., 92, 265–266, https://doi.org/10.1029/2011EO320001, 2011. a
Ralph, F. M., Rutz, J. J., Cordeira, J. M., Dettinger, M., Anderson, M., Reynolds, D., Schick, L. J., and Smallcomb, C.: A scale to characterize the strength and impacts of atmospheric rivers, B. Am. Meteorol. Soc., 100, 269–289, https://doi.org/10.1175/BAMS-D-18-0023.1, 2019. a, b, c, d, e, f
Ramos, A. M., Nieto, R., Tomé, R., Gimeno, L., Trigo, R. M., Liberato, M. L. R., and Lavers, D. A.: Atmospheric rivers moisture sources from a Lagrangian perspective, Earth Syst. Dynam., 7, 371–384, https://doi.org/10.5194/esd-7-371-2016, 2016. a
Ramseyer, C. A. and Teale, N.: On the emerging global relevance of atmospheric rivers and impacts on landscapes and water resources, Prog. Phys. Geog.-Earth and Environment, 45, 965–978, 2021. a
Rivoire, P., Martius, O., and Naveau, P.: A comparison of moderate and extreme ERA-5 daily precipitation with two observational data sets, Earth Space Sci., 8, e2020EA001633, https://doi.org/10.1029/2020EA001633, 2021. a
Rutz, J. J., Steenburgh, W. J., and Ralph, F. M.: Climatological characteristics of atmospheric rivers and their inland penetration over the western United States, Mon. Weather Rev., 142, 905–921, 2014. a, b, c
Rutz, J. J., Shields, C. A., Lora, J. M., Payne, A. E., Guan, B., Ullrich, P., O’Brien, T., Leung, L. R., Ralph, F. M., Wehner, M., Brands, S., Collow, A., Goldenson, N., Gorodetskaya, I., Griffith, H., Kashinath, K., Kawzenuk, B., Krishnan, H., Kurlin, V., Lavers, D., Magnusdottir, G., Mahoney, K., McClenny, E., Muszynski, G., Nguyen, P. D., Prabhat, M., Qian, Y., Ramos, A. M., Sarangi, C., Sellars, S., Shulgina, T., Tome, R., Waliser, D., Walton, D., Wick, G., Wilson, A. M., and Viale, M.: The Atmospheric River Tracking Method Intercomparison Project (ARTMIP): Quantifying uncertainties in atmospheric river climatology, J. Geophys. Res.-Atmos., 124, 13777–13802, 2019. a, b
Sharma, A. R. and Déry, S. J.: Contribution of atmospheric rivers to annual, seasonal, and extreme precipitation across British Columbia and southeastern Alaska, J. Geophys. Res.-Atmos., 125, 1–21, https://doi.org/10.1029/2019JD031823, 2020. a
Shields, C. A. and Kiehl, J. T.: Atmospheric river landfall-latitude changes in future climate simulations, Geophys. Res. Lett., 43, 8775–8782, 2016. a
Shields, C. A., Rutz, J. J., Leung, L.-Y., Ralph, F. M., Wehner, M., Kawzenuk, B., Lora, J. M., McClenny, E., Osborne, T., Payne, A. E., Ullrich, P., Gershunov, A., Goldenson, N., Guan, B., Qian, Y., Ramos, A. M., Sarangi, C., Sellars, S., Gorodetskaya, I., Kashinath, K., Kurlin, V., Mahoney, K., Muszynski, G., Pierce, R., Subramanian, A. C., Tome, R., Waliser, D., Walton, D., Wick, G., Wilson, A., Lavers, D., Prabhat, Collow, A., Krishnan, H., Magnusdottir, G., and Nguyen, P.: Atmospheric River Tracking Method Intercomparison Project (ARTMIP): Project goals and experimental design, Geosci. Model Dev., 11, 2455–2474, https://doi.org/10.5194/gmd-11-2455-2018, 2018. a, b, c, d, e
Smith, B. L., Yuter, S. E., Neiman, P. J., and Kingsmill, D. E.: Water vapor fluxes and orographic precipitation over northern California associated with a landfalling atmospheric river, Mon. Weather Rev., 138, 74–100, https://doi.org/10.1175/2009MWR2939.1, 2010. a
Steinhaeuser, K., Ganguly, A. R., and Chawla, N. V.: Multivariate and multiscale dependence in the global climate system revealed through complex networks, Clim. Dynam., 39, 889–895, 2012. a
Stolbova, V., Martin, P., Bookhagen, B., Marwan, N., and Kurths, J.: Topology and seasonal evolution of the network of extreme precipitation over the Indian subcontinent and Sri Lanka, Nonlin. Processes Geophys., 21, 901–917, https://doi.org/10.5194/npg-21-901-2014, 2014. a, b
Tan, X., Gan, T. Y., and Chen, Y. D.: Synoptic moisture pathways associated with mean and extreme precipitation over Canada for summer and fall, Clim. Dynam., 52, 2959–2979, 2019. a
Traxl, D.: dominiktraxl/artracks: Release v1.0.0, Zenodo [data set], https://doi.org/10.5281/zenodo.7130642, 2022. a, b, c
Tsonis, A. A. and Roebber, P. J.: The architecture of the climate network, Phys. A, 333, 497–504, 2004. a
Tsonis, A. A. and Swanson, K. L.: Topology and predictability of El Niño and la Niña networks, Phys. Rev. Lett., 100, 1–4, https://doi.org/10.1103/PhysRevLett.100.228502, 2008. a
Tsonis, A. A., Swanson, K. L., and Roebber, P. J.: What do networks have to do with climate?, B. Am. Meteorol. Soc., 87, 585–595, 2006. a
Waliser, D. and Guan, B.: Extreme winds and precipitation during landfall of atmospheric rivers, Nat. Geosci., 10, 179–183, https://doi.org/10.1038/ngeo2894, 2017. a, b, c, d
Warner, M. D., Mass, C. F., and Salathe Jr, E. P.: Changes in winter atmospheric rivers along the North American west coast in CMIP5 climate models, J. Hydrometeorol., 16, 118–128, 2015. a
Wolf, F. and Donner, R. V.: Spatial organization of connectivity in functional climate networks describing event synchrony of heavy precipitation, Eur. Phys. J.-Spec. Top., 230, 3045–3063, https://doi.org/10.1140/epjs/s11734-021-00166-1, 2021. a
Wolf, F., Bauer, J., Boers, N., and Donner, R. V.: Event synchrony measures for functional climate network analysis: A case study on South American rainfall dynamics, Chaos, 30, 033102, https://doi.org/10.1063/1.5134012, 2020. a, b
Wolf, F., Ozturk, U., Cheung, K., and Donner, R. V.: Spatiotemporal patterns of synchronous heavy rainfall events in East Asia during the Baiu season, Earth Syst. Dynam., 12, 295–312, https://doi.org/10.5194/esd-12-295-2021, 2021. a, b
Xu, G., Ma, X., and Chang, P.: IPART: A Python Package for Image-Processing based Atmospheric River Tracking, Journal of Open Source Software, 5, 2407, https://doi.org/10.21105/joss.02407, 2020. a, b
Yamasaki, K., Gozolchiani, A., and Havlin, S.: Climate networks around the globe are significantly affected by El Niño, Phys. Rev. Lett., 100, 1–4, https://doi.org/10.1103/PhysRevLett.100.228501, 2008. a
Zhang, Z., Ralph, F. M., and Zheng, M.: The relationship between extratropical cyclone strength and atmospheric river intensity and position, Geophys. Res. Lett., 46, 1814–1823, 2019. a
Zhu, Y. and Newell, R. E.: A proposed algorithm for moisture fluxes from atmospheric rivers, Mon. Weather Rev., 126, 725–735, https://doi.org/10.1175/1520-0493(1998)126<0725:APAFMF>2.0.CO;2, 1998. a