the Creative Commons Attribution 4.0 License.
the Creative Commons Attribution 4.0 License.
 | 04 Apr 2023
Local moisture recycling across the globe
Jolanda J. E. Theeuwen
Arie Staal
Obbe A. Tuinenburg
Bert V. M. Hamelers
Stefan C. Dekker
Changes in evaporation over land affect terrestrial precipitation via atmospheric moisture recycling and, consequently, freshwater availability. Although global moisture recycling at regional and continental scales is relatively well understood, the patterns of local moisture recycling and the main variables that impact it remain unknown. We calculate the local moisture recycling ratio (LMR) as the fraction of evaporated moisture that precipitates within a distance of 0.5∘ (typically 50 km) of its source, identify variables that correlate with it over land globally, and study its model dependency. We derive the seasonal and annual LMR using a 10-year climatology (2008–2017) of monthly averaged atmospheric moisture connections at a scale of 0.5∘ obtained from a Lagrangian atmospheric moisture tracking model. We find that, annually, an average of 1.7 % (SD of 1.1 %) of evaporated moisture returns as precipitation locally, although with large temporal and spatial variability, and the LMR peaks in summer and over wet and mountainous regions. Our results show that wetness, orography, latitude, convective available potential energy, wind speed, and total cloud cover correlate clearly with the LMR, indicating that wet regions with little wind and strong ascending air are particularly favourable for a high LMR. Finally, we find that spatial patterns of local recycling are consistent between different models, yet the magnitude of recycling varies. Our results can be used to study the impacts of evaporation changes on local precipitation, with implications for, for example, regreening and water management.
- Article
(15970 KB) - Full-text XML
- BibTeX
- EndNote


Atmospheric moisture connections redistribute water from evaporation sources to precipitation sinks, affecting climates globally, regionally, and locally. These connections are key in the global hydrological cycle and are used to understand the importance of terrestrial evaporation for water availability. As evaporated moisture can travel up to thousands of kilometres in the atmosphere, changes in evaporation can affect precipitation over a large area. An “evaporationshed”, as defined by Van der Ent and Savenije (2013), describes an area in which evaporated moisture from a specific source region precipitates; therefore, they can be used to study (1) the changes in precipitation at a global scale following a change in evaporation in the source region and (2) atmospheric moisture recycling. Globally, more than half of terrestrial evaporated moisture precipitates over land (Van der Ent et al., 2010; Tuinenburg et al., 2020a), which is a process called terrestrial moisture recycling. About half of terrestrial precipitation originates from land (Tuinenburg et al., 2020a). Hence, terrestrial moisture recycling has an important contribution to water availability. For example, 80 % of China's water resources originate from evaporation over Eurasia (Van der Ent et al., 2010). Furthermore, areas can also feed precipitation to themselves through regional moisture recycling. In the Amazon Basin, 63 % of the evaporated moisture precipitates within the basin itself (Tuinenburg et al., 2020a). Terrestrial moisture recycling is considered an ecosystem service (Falkenmark et al., 2019; Keys et al., 2016), as almost 20 % of terrestrial precipitation originates from vegetation-regulated moisture recycling globally (Keys et al., 2016). How this ecosystem service is affected by factors such as deforestation can be studied using atmospheric moisture connections.
Moisture recycling has been used to study the downwind impacts of land-use changes (e.g. Bagley et al., 2012; Keys et al., 2012; Wang-Erlandsson et al., 2018), which can affect both the magnitude and pattern of moisture recycling (Van der Ent et al., 2014), and the impact of ecosystems on other ecosystems (e.g. O'Connor et al., 2021). Hence, atmospheric moisture connections can be used for freshwater governance to understand and manage the impacts of land-use changes downwind, such as changes in freshwater availability for irrigation and plants. (te Wierik et al., 2020, 2021). For example, previous research has shown that an increase in vegetation is beneficial for downwind water availability for 45 % of the land surface (Cui et al., 2022).
To date, analytical recycling models and moisture tracking models have been used to study terrestrial recycling and downwind impacts of land-cover change at the global and regional levels (Burde and Zangvil, 2001; Van der Ent et al., 2010). Multiple studies have focused on the regional recycling for specific regions, with a spatial scale ranging from 500 km up to several thousands of kilometres (e.g. Burde, 2006; Dominguez et al., 2006; Lettau et al., 1979; Staal et al., 2018; Trenberth, 1999). Furthermore, regional recycling at a spatial scale of 1.5∘ has been studied globally using a Eulerian moisture tracking model, assuming a well-mixed atmosphere (Van der Ent and Savenije, 2011). It has been debated that regional recycling ratios are difficult to compare due to differences in the shape and size of the studied regions (Van der Ent and Savenije, 2011). Therefore, Van der Ent and Savenije (2011) defined the typical length scale of evaporation recycling, which can be used for a comparison between different regions because it is independent of the size and shape of a regions. This length scale decreases with increasing regional recycling and, therefore, is a proxy for an area's regional recycling. However, it does not allow for the quantification of the amount of water that is recycled within the defined region and, therefore, does not provide quantitative insight into the regional impacts of evaporation changes induced by land-cover changes.
In regions with a high regional recycling, reforestation can enhance freshwater availability, whereas reforestation may cause local drying for regions with a low recycling (Hoek van Dijke et al., 2022) due to reductions in streamflow as a result of enhanced evaporation locally (Brown et al., 2005; Jackson et al., 2005). To physically understand, for instance, the role of local wetting or drying due to reforestation, deforestation, or the use of groundwater or surface water for irrigation, local moisture recycling is key. We argue that local impacts need to be studied explicitly, as they may have a crucial role in future water governance, for example, to prevent tree restoration projects causing local drying.
The state-of-the-art high-resolution atmospheric moisture connections obtained with the UTrack Lagrangian atmospheric moisture tracking model allow us to calculate the evaporation recycling ratio at a higher spatial resolution (0.5∘) (Tuinenburg et al., 2020a; Tuinenburg and Staal, 2020). We define this as the local moisture recycling ratio (LMR), as this high resolution allows us to study local-scale land–atmosphere feedbacks that will help us better understand the hydrological impacts of land-use change. The LMR describes which fraction of evaporated moisture is recycled within its source grid cell and its eight surrounding grid cells. Moisture recycling has not been previously studied at this high-resolution scale globally. To get a better physical understanding of this metric, we identify which factors correlate with it. We analyse this for different latitude classes to account for different cell sizes across latitude. Factors included in this analysis are orography, precipitation, precipitation type, evaporation, shear, convective available potential energy, atmospheric moisture flux, wind speed, total cloud cover, boundary layer height, and surface net solar radiation. These variables relate to convection, local wetness, or moisture transport away from the source location, which we identified as important factors for local moisture recycling. Furthermore, we study how the LMR varies over the globe and throughout the year for a 10-year climatology (2008–2017) as well as its scaling and model dependency.
We use global atmospheric moisture connections obtained from Tuinenburg et al. (2020a) to calculate the LMR worldwide. These moisture connections are a 10-year climatology (2008–2017) of monthly averages and have a spatial resolution of 0.5∘. These UTrack atmospheric moisture data are derived using a Lagrangian atmospheric moisture tracking model by Tuinenburg and Staal (2020), which tracks evaporated moisture at a spatial scale of 0.25∘, and they are stored at a spatial resolution of 0.5∘. In this model, for each 0.25∘ grid cell, each millimetre of evaporation is represented by 100 released moisture parcels. The wind transports these parcels horizontally and vertically through the atmosphere. Additionally, a probabilistic scheme describes the vertical movement of the moisture parcels over 25 atmospheric layers. In this scheme, the parcels are randomly distributed across the vertical moisture profile of each grid cell. At each time step (0.1 h), the moisture budget is made using evaporation, precipitation, and total precipitable water. Parcels are tracked for up to 30 d or up to the point at which only 1 % of their original moisture is still present. On average, the lifetime of atmospheric moisture is 8–10 d (Sodemann, 2020). However, some moisture might still remain in the parcels after 10 d. After 30 d, all of the original moisture has rained out for most of the parcels (Tuinenburg and Staal, 2020). Input data for UTrack consist of evaporation, precipitation, precipitable water, and wind speed obtained from the ERA5 dataset (Hersbach et al., 2020). We refer to Tuinenburg and Staal (2020) for a complete description of the model settings as well as the tests and the assumptions underlying them.
The LMR is the fraction of evaporated moisture that precipitates locally. To study the scale dependency of local moisture recycling, we examine three definitions of the LMR (Fig. A1): the fraction of evaporated moisture that precipitates in (1) its source grid cell (i.e. r1), (2) its source grid cell and its 8 neighbouring grid cells (i.e. r9), and (3) its source grid cell and its 24 neighbouring grid cells (i.e. r25). Equations (1)–(3) describe the three definitions of the LMR, in which Ei,j is the amount of moisture evaporated from source grid cell i, j. The fraction of Ei,j that precipitates within its source grid cell and its (8 or 24) neighbouring grid cells is indicated by , where l=0 and k=0 for r1; , 0, or 1 and , 0, or 1 for r9; and , −1, 0, 1, or 2 and , −1, 0, 1, or 2 for r25.
r1, r9, and r25 result in different local moisture recycling ratios across the globe (Fig. A2). r1 peaks over the ocean where precipitation is relatively low and evaporation is relatively large, which results in relatively large recycling ratios. In addition, we find exceptionally low values over mountain peaks, but not over all elevated terrain. This result is inconsistent with the patterns found for r9 and r25, as these patterns include peaks over mountains and low recycling over the oceans. These patterns can be explained by enhanced convection over mountains due to orographic lift and strong winds over the ocean that carry moisture away from its source. The patterns found for r9 and r25 seem to capture multiple physical processes that are important for moisture transport and the formation of precipitation better than the pattern of r1. In our study, we do not focus on r1, as r1 does not include all small-scale flows of <50 km. This is because moisture can evaporate from cell i, j and precipitate in the adjacent cell while the transport length is <50 km. Furthermore, as the patterns of r9 and r25 are similar and agree with our understanding of relevant processes, we decided to define the local moisture recycling ratio (LMR) as r9 to keep the spatial scale as small as possible. For r9, the distance between the centre of the source grid cell and its surrounding grid cells describes the typical length of the local moisture flow, which is approximately 0.5∘. We calculated this typical length across the globe by calculating the average of the average zonal length, meridional length, and diagonal length of all terrestrial grid cells. The total average equals 50.1 km (SD of 15.5 km); thus, the average moisture flow length is approximately 50 km.
Furthermore, the LMR derived with the Lagrangian approach using output from UTrack is compared with the output from the WAM2-layers Eulerian moisture tracking model (Link et al., 2020) in order to study the model dependency of the LMR. For this comparison, the resolution of the UTrack data is reduced to 1.5∘ to match the output of the WAM2-layers model. To do so, all evaporationsheds over land were multiplied by their source evaporation. The recycling within cells of 1.5∘ was then calculated for all terrestrial surfaces. A detailed description of the atmospheric moisture connections obtained with WAM2-layers and the model itself are provided by Link et al. (2020) and Van der Ent et al. (2013).
We study the relations between multiple variables and the 10-year climatology (2008–2017) of local moisture recycling to identify factors that relate to recycling in order to assess what factors might affect recycling. To calculate this 10-year climatology of the LMR, for each month, we weighted the multi-year (2008–2017) monthly LMR by the multi-year monthly evaporation in the same period as follows:
where Eyear is the sum of the evaporation of the 12 months. To identify factors that might affect the LMR, variables related to atmospheric moisture and vertical displacement of air, as both higher atmospheric moisture content and ascending air promote precipitation, are selected. All of these variables are obtained, either directly or indirectly, from ERA5 reanalysis data (Hersbach et al., 2020). We downscaled the original resolution from 0.25 to 0.5∘ by centrally averaging the data. For all variables, we calculated the climatological mean for the years 2008–2017.
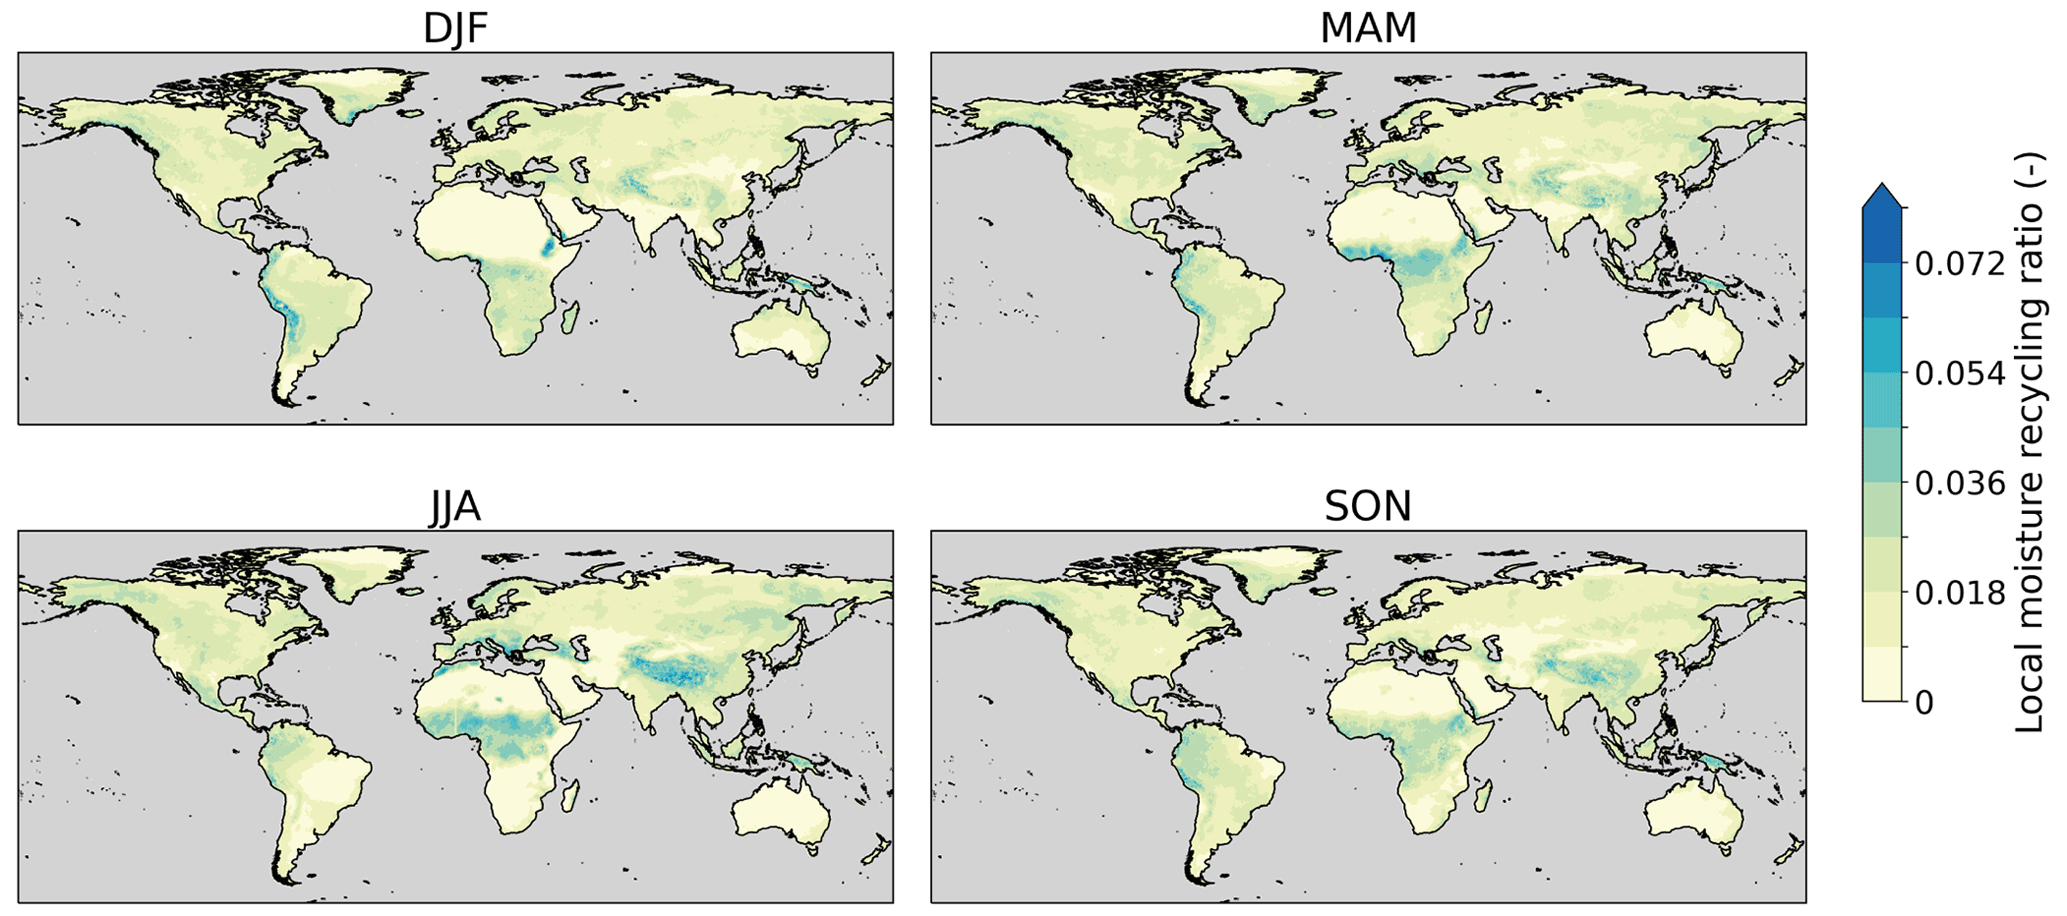
Figure 1The 10-year climatology (2008–2017) of the seasonal averages of local moisture recycling across the global land surface. Here, local moisture recycling is defined as the fraction of evaporated moisture that precipitates in its source grid cell and its eight neighbouring grid cells (r9). The different seasons are December–February (DJF), March–May (MAM), June–August (JJA), and September–November (SON).
In total, 13 variables are selected (Fig. A3): (1) elevation (z), which we expect to enhance the LMR through orographic lift; (2) precipitation, which we expect to correlate positively with the LMR given that, in Lagrangian moisture tracking models, the amount of moisture that leaves the parcel (i.e. precipitates) scales with precipitation; (3) total evaporation, as it enhances the atmospheric moisture content, and we therefore expect it to promote precipitation locally; (4) wetness (precipitation minus evaporation), as the downward flux of moisture increases with increasing wetness and evaporated water also becomes more likely to precipitate, possibly promoting the LMR; (5) convective precipitation and (6) large-scale precipitation, as they, by definition, scale with precipitation (both are included to study if the type of precipitation is an important factor explaining the LMR); (7) latitude, which is a proxy for processes related to the Hadley cell circulation, characterized by the strong ascent and descent of air at specific latitudes that we expect to have an important contribution to the LMR because they enhance and reduce the formation of precipitation respectively (Wang and Yang, 2022); (8) the vertical integral of the atmospheric moisture flux (in the northward and eastward directions and the total flux), as it carries the moisture away from its source and could, thus, reduce the LMR; (9) convective available potential energy (CAPE), which feeds convection and, therefore, promotes precipitation locally, which could enhance the LMR; (10) vertical wind shear between 650 and 750 hPa of both meridional and zonal winds, as it affects moisture transport in multiple directions, and we therefore expect it to impact the LMR; (11) total wind speed, as it carries the moisture, and we therefore expect it to correlate negatively with the LMR; (12) total cloud cover as a proxy for condensation processes that possibly enhance the LMR (Richards and Arkin, 1998); (13) boundary layer height, as thinner boundaries need less evaporation to reach saturation of air, and we therefore expect that it will promote precipitation locally; and, finally, (14) net surface solar radiation as a proxy for the energy source of convection (and other processes), which we expect to be important for the LMR. We calculate shear (τ) as follows:
where v1 and v2 are the wind speed (in the zonal and meridional directions) at two different heights (z1 and z2). We identified significant correlations using Spearman rank correlations. It should be noted that a correlation does not imply causality. We exclude oceans, seas, and Antarctica from this analysis using the land–sea mask from ERA5. We classify the data based on latitude to account for decreasing grid cell size with increasing latitude. Each class has a range of 15∘ and includes the grid cells in both the Northern and Southern hemispheres (see Table A1). Between 60 and 90∘ S, the grid cells do not contain land besides Antarctica; therefore, they are not included in the classes. Additionally, we used the Ecoregions 2017 data (https://ecoregions.appspot.com/, last access: 7 July 2022) to study the spatially averaged local moisture recycling of 14 biomes across the globe (Fig. A4). We study variation amongst biomes, as biomes include information on both biotic factors, such as vegetation type, and abiotic factors, such as climate.
3.1 The LMR obtained from the output of UTrack
Annually, on average, about 1.7 % (SD of 1.1 %) of terrestrial evaporated moisture recycles locally. The LMR shows spatio-temporal variation (Fig. 1), with peaks over elevated (e.g. the Atlas Mountains and Ethiopian Highlands) and wet (e.g. the Congo Basin and Southeast Asia) areas and minima over arid (e.g. Australia and the Sahara Desert) regions. Additionally, we find peaks in the LMR during summer (i.e. during DJF for the Southern Hemisphere and during JJA for the Northern Hemisphere). This seasonality is especially strong over mountainous and wet areas. For the mid-latitudes, especially the Mediterranean Basin shows seasonality, with peaks in summer (JJA). However, seasonality is largest at low latitudes. Within the tropics, we find some spatial differences: first, the LMR values in the Congo Basin and Southeast Asia exceed the LMR in the Amazon Basin; second, recycling in the Congo Basin and Southeast Asia peaks in JJA and recycling in the Amazon Basin peaks in DJF, which is the wet season for a large part of the Amazon.
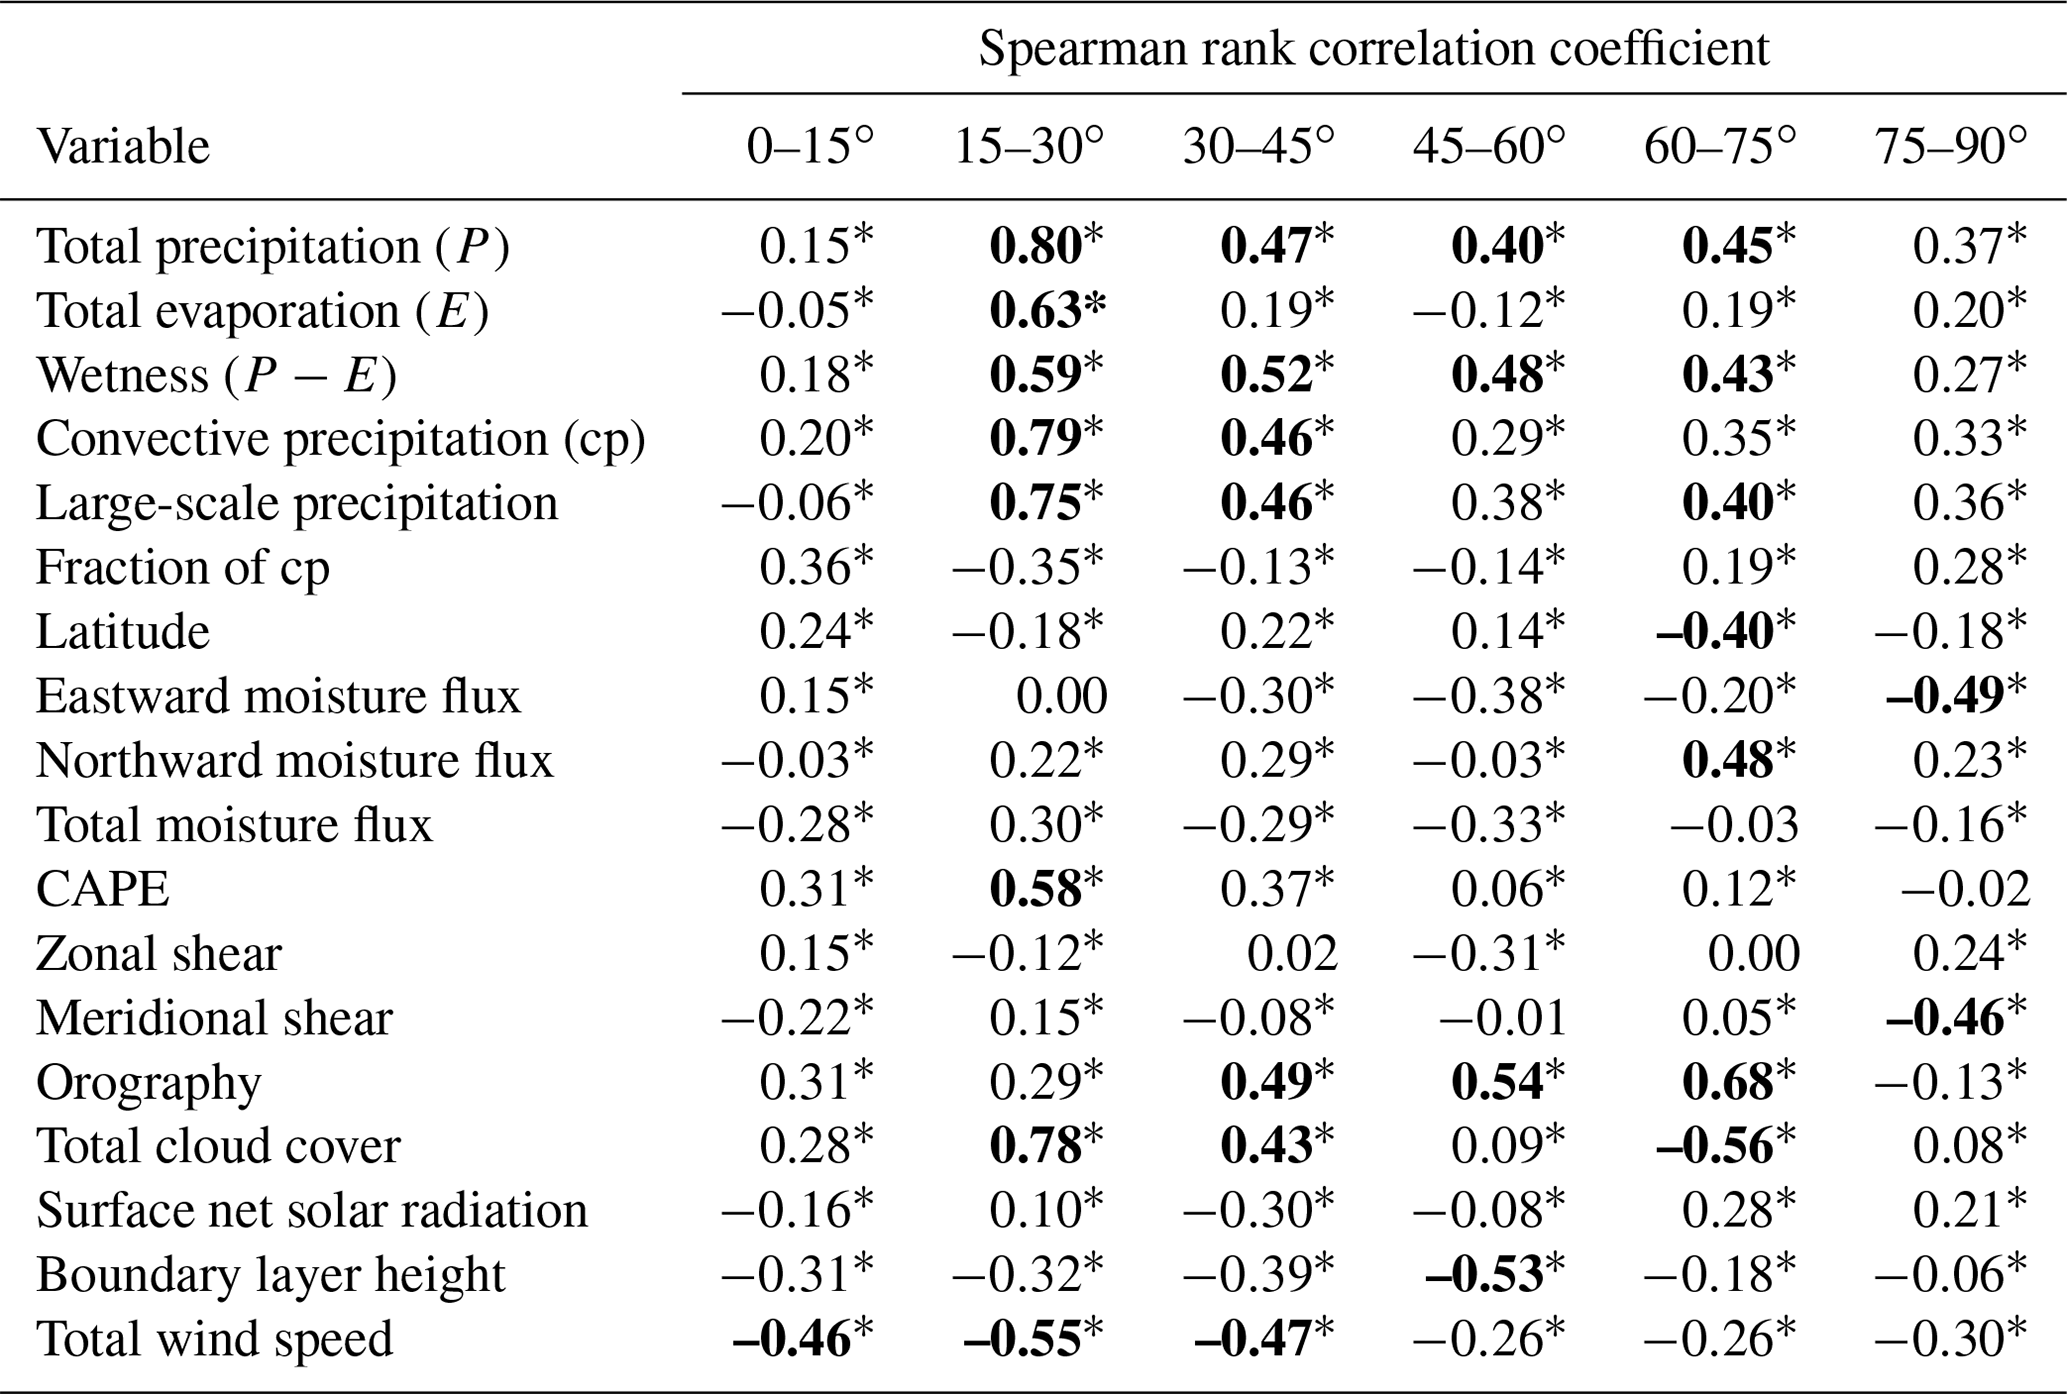
Table 1Spearman rank correlation coefficients between the LMR and all tested variables. “*” indicates a significant correlation (p<0.05), and moderate and strong relations (ρ>0.4) are shown using bold font. The classes encompassing latitudes between 0 and 60∘ include grid cells of the Northern Hemisphere and Southern Hemisphere. The classes encompassing latitudes exceeding 60∘ include grid cells of the Northern Hemisphere only.
We calculated recycling on a 1.5∘ grid using both the dataset of Link et al. (2020), which we refer to as rWAM2-layers, and the dataset of Tuinenburg et al. (2020a) (upscaled to 1.5∘), which we refer to as rUTrack, to study the model dependency of local recycling (Fig. 2). We find that the global spatial patterns of rUTrack and rWAM2-layers agree (Figs. 2, A5). However, the magnitude of rWAM2_layers is larger than rUTrack over mountains, the tropics, and the high latitudes. rUtrack is larger than rWAM2-layers over drylands and deserts (e.g. the Sahel region and Western Asia) (Fig. 2). However, over drylands and deserts, recycling ratios are relatively small; therefore, the relative difference, as presented in Fig. 2, has less meaning here. Globally, the difference between rUTrack and rWAM2-layers and its variation is largest around the Equator (Fig. A6). On average, the relative difference between UTrack and WAM2-layers (() equals −1.5 (SD of 3.4).
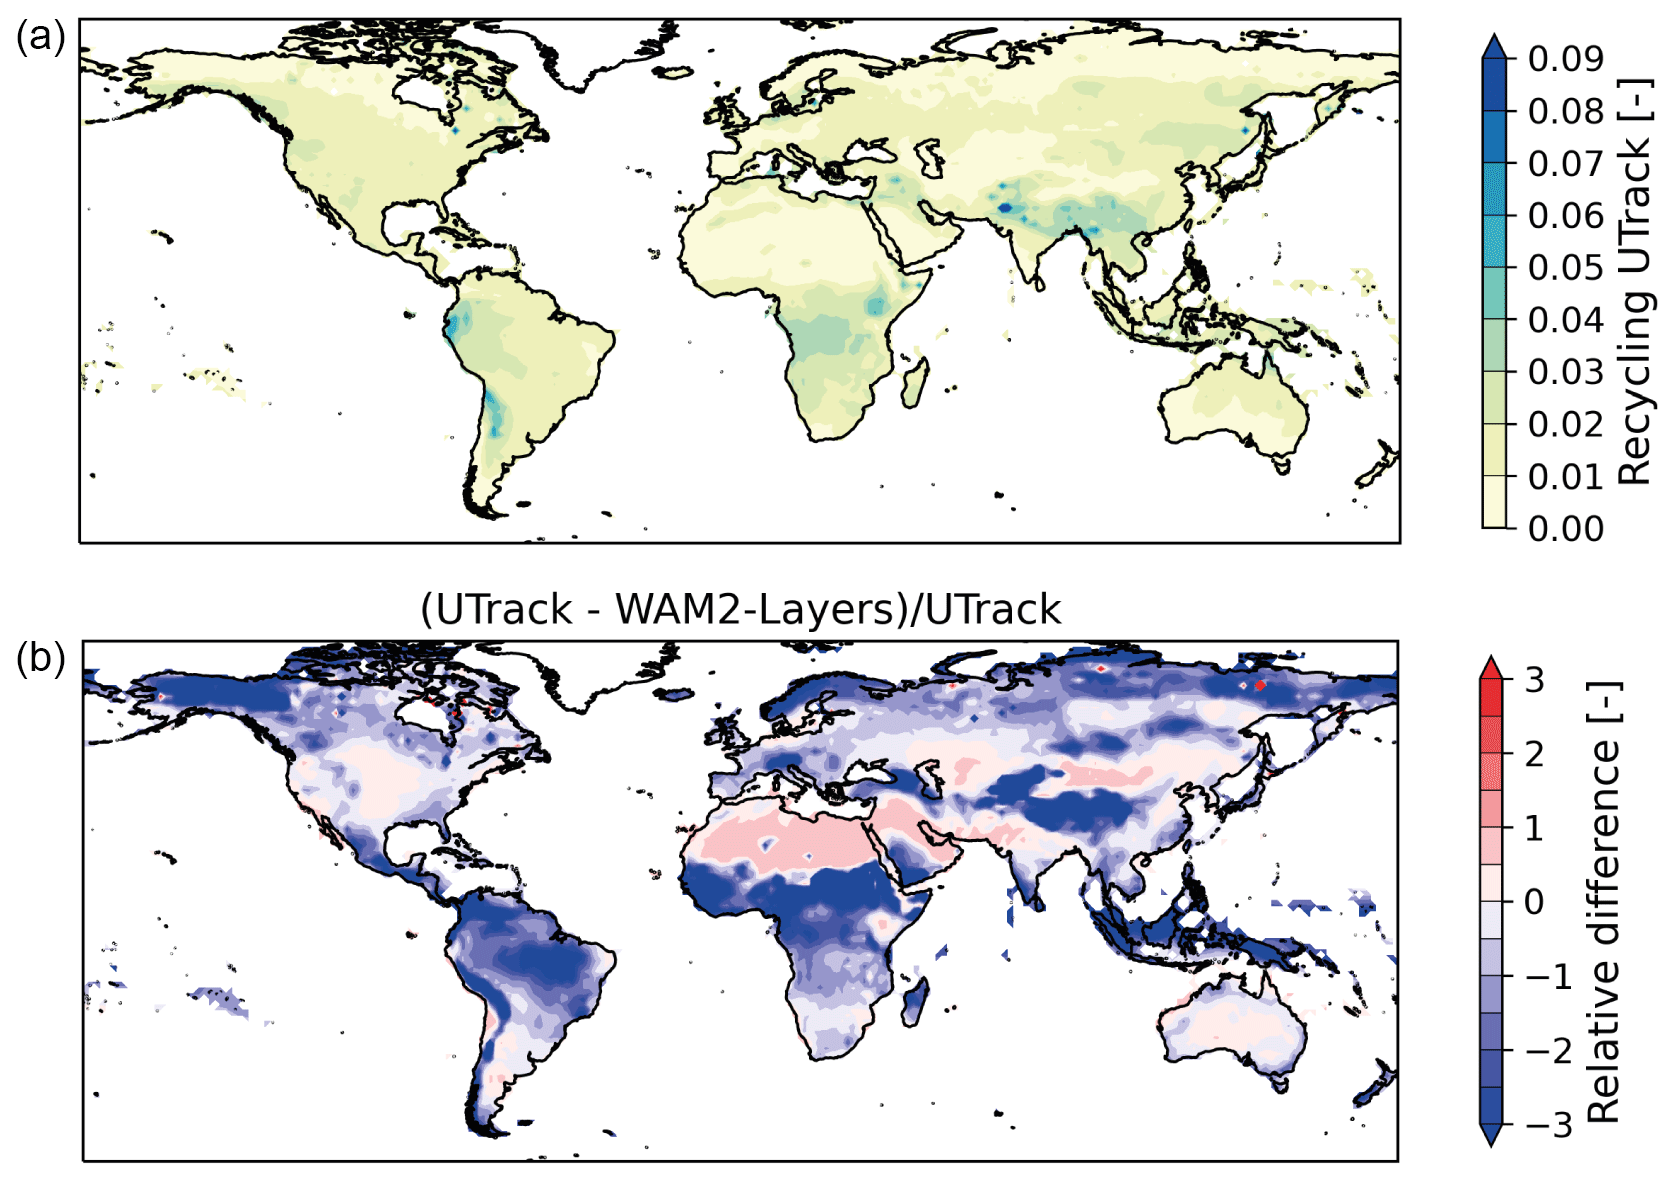
Figure 2Panel (a) shows rUtrack, the fraction of evaporated moisture that recycles within its source grid cell of 1.5∘. Panel (b) displays the relative deviation between rUtrack and rWAM2-layers. This deviation is calculated using the recycling within one grid cell at a resolution of 1.5∘ obtained from the datasets of Tuinenburg et al. (2020a) and Link et al. (2020).
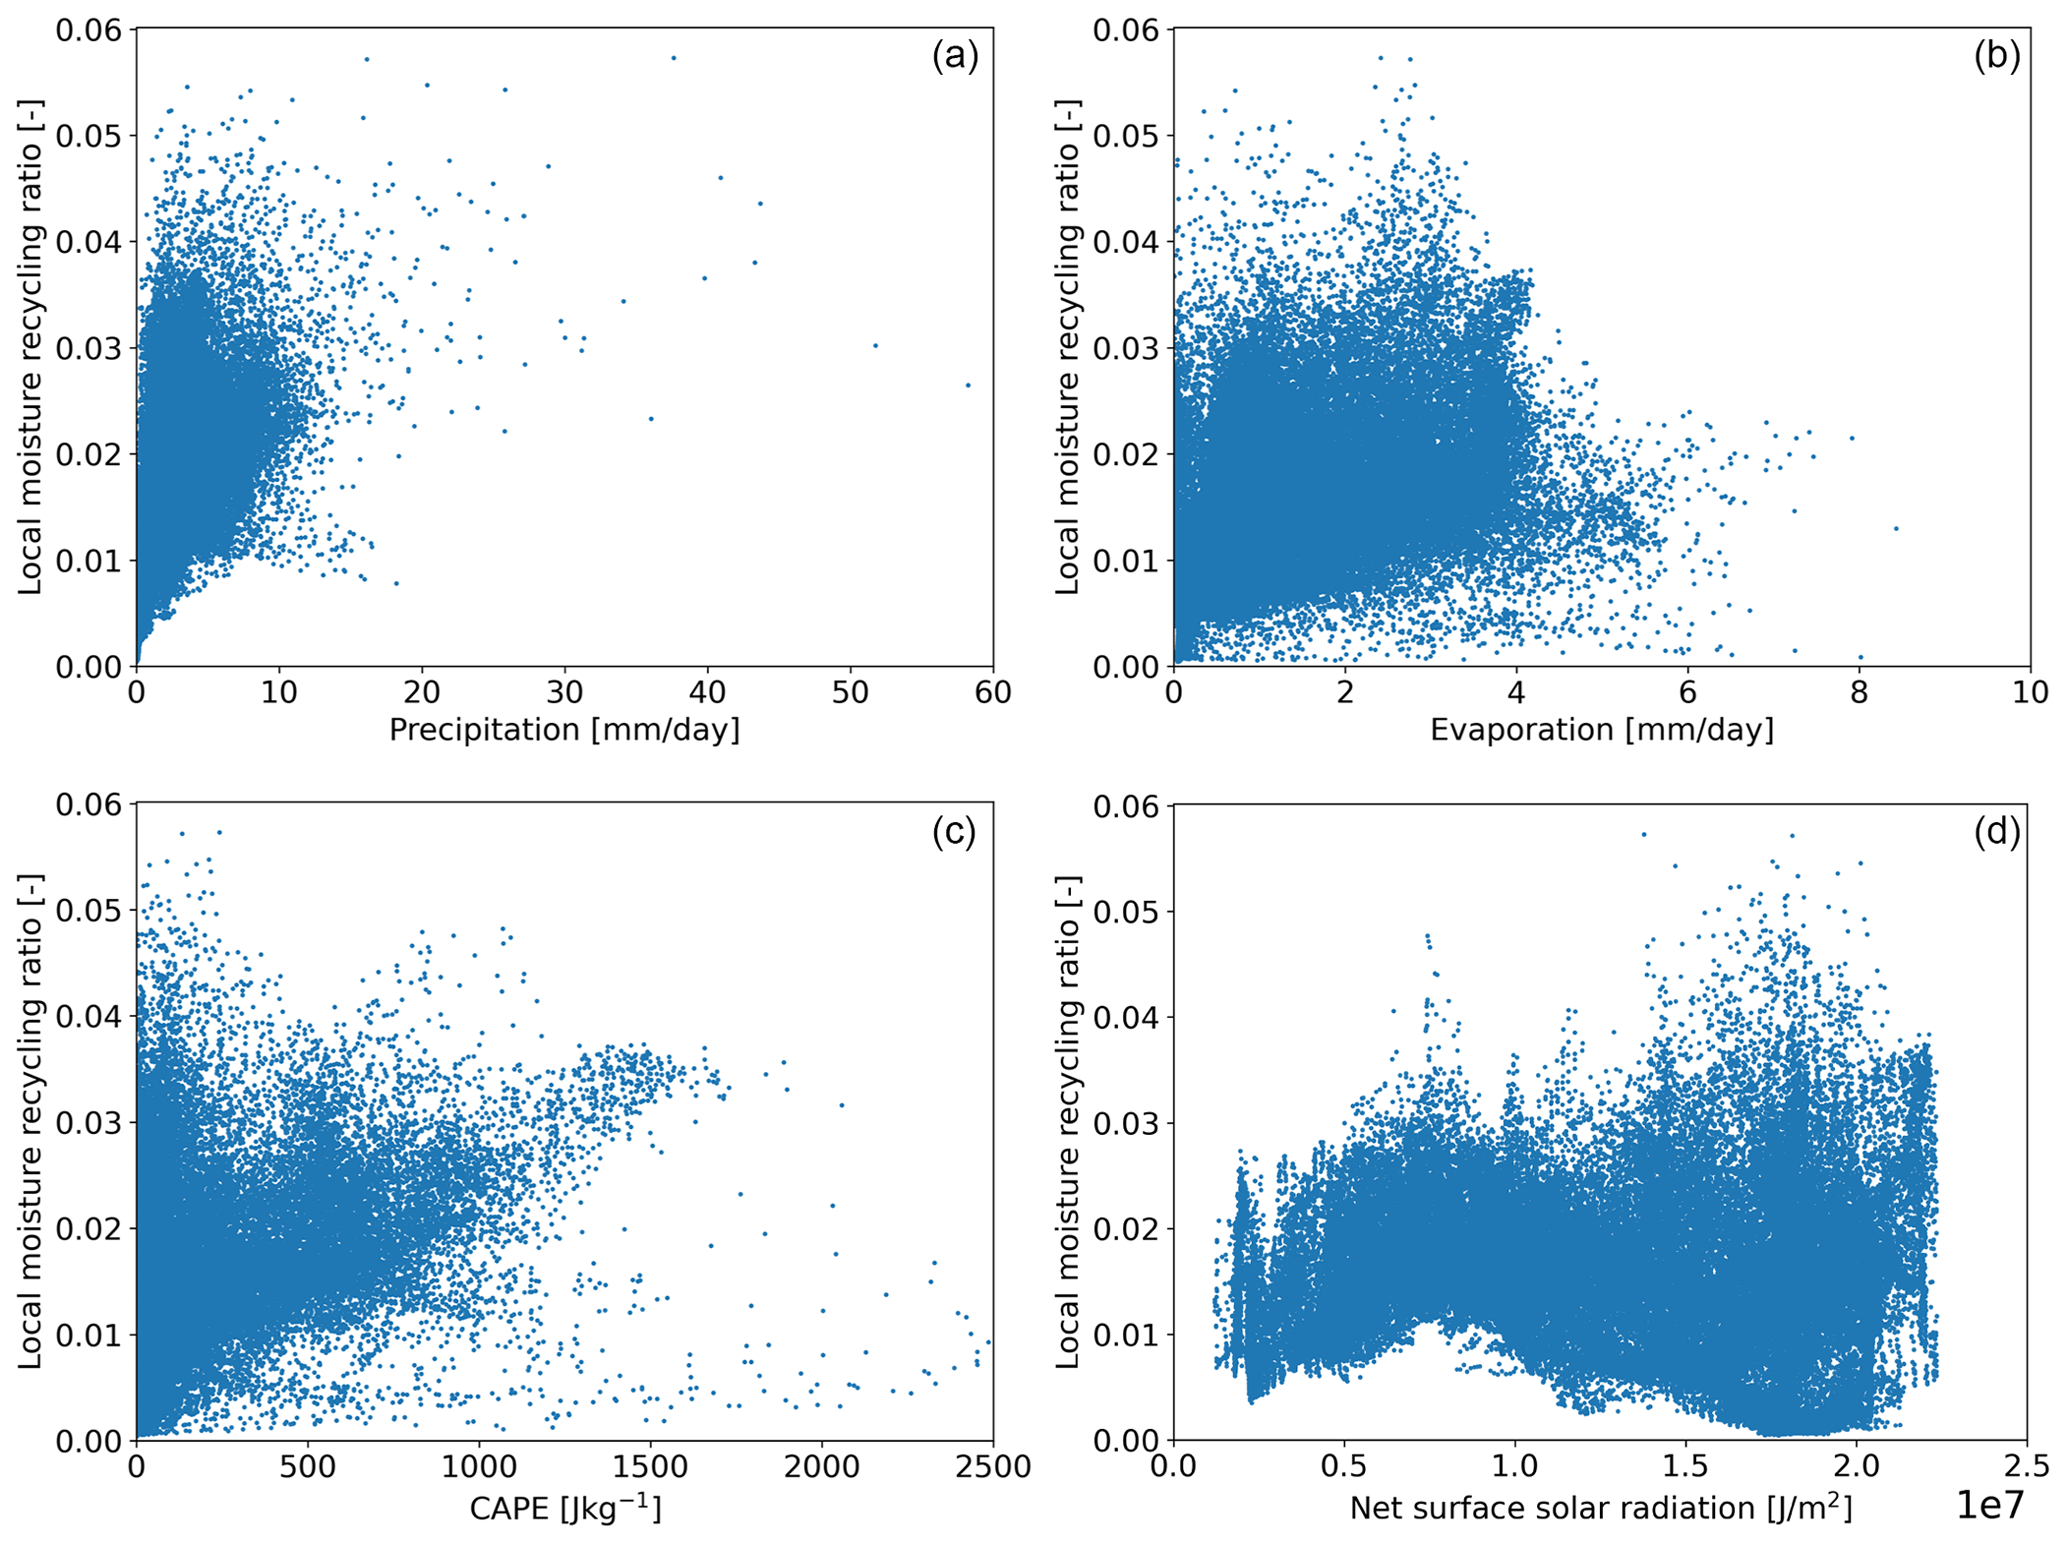
Figure 3Scatter plots of the 10-year climatology (2008–2017) of the local moisture recycling ratio over land against (a) precipitation, (b) evaporation, (c) convective available potential energy (CAPE), (d) and solar net surface radiation. Each dot represents a 0.5∘ resolution grid cell over land.
3.2 Factors underlying the LMR
For each latitude class, we calculated the Spearman rank correlation coefficient (ρ) (Table 1). Below, we discuss only statistically significant (p<0.05) correlations with ρ≥0.4, which indicates a moderate correlation. These correlations are shown using bold font in Table 1. We find that the LMR correlates positively with total precipitation and wetness for all classes between 15 and 75∘. In addition, between 15 and 30∘, the LMR correlates strongly with total precipitation (ρ=0.80). Besides total precipitation, large-scale precipitation (between 15 and 45∘ and between 60 and 75∘) and convective precipitation (between 15 and 45∘) correlate positively with the LMR. Overall, there is a moderate correlation between precipitation and the LMR for the mid-latitudes. The highest correlation between the LMR and convective precipitation is found between latitudes of 15 and 30∘. For this latitude class, the LMR also correlates positively with evaporation and CAPE. Despite the low correlation between the LMR and CAPE for most of the latitude classes, high CAPE clearly relates to the LMR, as the skewed profile in the scatter density plot indicates that only a small amount of the grid cells with a relatively high CAPE have a low LMR (Fig. 3). Furthermore, the presence of clouds also correlates with the LMR. Between the LMR and total cloud cover, a positive correlation holds between 15 and 45∘, whereas a negative correlation holds between 60 and 75∘. Furthermore, the vertical integrals of the eastward and northward moisture fluxes correlate less with the LMR compared to the vertical fluxes (e.g. precipitation). For the higher latitudes, the northward moisture flux correlates positively with the LMR (between 60 and 75∘), whereas the eastward moisture flux correlates negatively with the LMR (between 75 and 90∘). The moisture flux depends on wind speed, yet the wind speed correlates negatively with the LMR for the lower latitudes (between 0 and 45∘). Furthermore, the LMR correlates positively with orography between 30 and 75∘. We find that, the LMR is always relatively high at high elevations (Fig. A7). Additionally, the LMR correlates negatively with the boundary layer height between 45 and 60∘. Finally, the LMR correlates negatively with wind shear at 650 hPa in the meridional direction (between 75 and 90∘) and with latitude (between 60 and 75∘). However, we find an oscillating relation between the LMR and latitude (Fig. 4), which is not captured by the Spearman rank correlation coefficients. This pattern indicates a high LMR over the Equator (0∘) and 60∘ N as well as a low LMR around 30∘ N and S. Orography seems to disrupt the relation between latitude and the LMR, causing peaks in the LMR at around 35∘ N and 20∘ S (Fig. 4). The LMR does not correlate with surface net solar radiation for any latitude. However, the LMR increases with increasing surface net solar radiation for low surface net solar radiation ( J m−2; Fig. 3).

Figure 4Scatter plot of the 10-year climatology (2008–2017) of the LMR and latitude. The colour scale indicates elevation, with blue being low elevation and yellow being high elevation. The black line represents the zonal average of the LMR. Each dot represents a 0.5∘ resolution grid cell over land.
4.1 Factors underlying the LMR
Moisture recycling affects humanity by influencing water security, agriculture, forestry, regional climate stability, and Earth system resilience (Keys et al., 2019; Wang-Erlandsson et al., 2022). Different types of moisture recycling have been subject to research used for different applications (e.g. Bagley et al., 2012; Pranindita et al., 2022; Van der Ent et al., 2010). We analysed the local moisture recycling ratio (LMR) (of evaporated moisture) across the globe at a 0.5∘ resolution as well as the factors that might affect it. We find that the LMR, defined as the fraction of evaporated moisture that precipitates within a distance of 0.5∘ (typically 50 km) of its source, varies over time and space, peaking in summer and over elevated and wet regions. First, latitude, elevation, and convective available potential energy (CAPE) seem to be important factors influencing the LMR (Fig. 5). These variables all promote convection (Roe, 2005; Scheff and Frierson, 2012; Wallace and Hobbs, 2006), strongly suggesting a dependency of the LMR on convection. Convective storms develop due to unstable conditions, resulting in precipitation locally (Eltahir, 1998), and a higher CAPE results in more rainfall (Eltahir and Pal, 1996; Williams and Renno, 1993). The pattern of the LMR across latitudes also coincides with the updraught and downdraught of air caused by the Hadley cell circulation (Wallace and Hobbs, 2006): around the Equator and 60∘ N and S, where air ascends, we find a high LMR; around 30∘ N and S, where air descends, we find a low LMR. Deviations from this pattern correspond to higher elevations, which promote the LMR through orographic lift. Overall, our results suggest a positive relation between convection and the LMR.

Figure 5Conceptual model of the most important factors influencing local moisture recycling around the globe. Rainy clouds indicate variables that increase the LMR, whereas clouds without raindrops indicate variables that decrease the LMR. Blue indicates wet regions, whereas yellow indicates arid regions.
Second, wetness seems to be an important factor underlying the LMR, as it significantly correlates with precipitation and P−E (precipitation minus evaporation). Furthermore, both large-scale and convective precipitation significantly correlate with the LMR. This is surprising, as convection promotes precipitation locally (Eltahir, 1998); therefore, we expected a stronger correlation between the LMR and convective precipitation than between the LMR and large-scale precipitation. As both correlations are similar, this suggests that the type of precipitation might not affect the LMR. Although convection is a local-scale process (i.e. with a spatial scale below 100 km) (Miyamoto et al., 2013), remotely evaporated moisture can be transported to a region with high convective activity and then precipitate as convective precipitation (Jana et al., 2018; Liberato et al., 2012). In that way, the precipitation type is independent of the distance between the moisture source and target location and, therefore, does not relate to the LMR. Total cloud cover correlates both positively (between 15 and 45∘) and negatively (between 60 and 75∘) with the LMR. Total cloud cover correlates with precipitation, convective precipitation, and large-scale precipitation for all latitudes except between 60 and 75∘ (Table A2). Due to the positive correlation between the LMR and precipitation as well as the absence of a correlation between precipitation and total cloud cover at these latitudes, we can statistically explain the negative correlation between total cloud cover and the LMR. Physically, this result is harder to explain. Our results describe the importance of convection underlying the LMR at lower latitudes, where total cloud cover correlates with convective precipitation. For higher latitudes, the importance of convection underlying the LMR decreases; therefore, we also expected the correlation between total cloud cover and the LMR to decrease but not to become negative. It is likely that another process which we cannot identify with our analysis causes the correlation between total cloud cover and the LMR to be negative. Overall, we find that wetness enhances the LMR irrespective of the precipitation type.
Unexpectedly, we do not find a clear correlation between the vertical integral of the atmospheric moisture flux and the LMR. However, for the lower latitudes (between 0 and 45∘), the LMR correlates with wind speed (at 10 and 100 m), which carries evaporated moisture away from its source location, enhancing the moisture flux. Therefore, horizontal moisture fluxes at specific altitudes are better for our analysis than the vertical integral of the moisture flux. However, as wind carries moisture away from its source, we expected that wind speed and the LMR would also correlate for the higher latitudes (above 45∘). It could be that a more significant amount of moisture is present at higher latitudes, explaining why the LMR and wind at 10 m do not correlate. However, wind speeds at 650 and 750 hPa also do not correlate with the LMR for these latitudes (Table A2).
Despite the importance of vertical shear in atmospheric moisture tracking models (Van der Ent et al., 2013), we do not find a correlation between local moisture recycling and vertical shear between 650 and 750 hPa. Shear is the friction between air layers that minimizes complete mixing, which is strongest between 650 and 750 hPa for some regions around the world (Dominguez et al., 2016). A possible explanation is that, due to its small spatial scale, the temporal scale of the LMR is small, which may prevent the air reaching 700 hPa within the spatial scale of the LMR. Furthermore, it is possible that our study design is insufficient to capture the relation between the LMR and shear throughout the year over the globe. We aimed for a general analysis in order to identify the main factors that might influence the LMR. A more detailed study that distinguishes between different seasons and isolates different climate zones is necessary to identify more factors that influence the LMR, as some factors might be more important during a specific season. For example, convection occurs more during summer than during winter and, therefore, might have a stronger correlation with the LMR during summer. Moreover, some factors are shape- and size-dependent, similar to the LMR, whereas other factors are not dependent on the grid cell size and shape. This might cause bias in the results of the Spearman analysis. Furthermore, due to the many interactions within the Earth system and, consequently, between the variables included in our study, it is impossible to determine the true drivers of the LMR. However, the correlations do indicate how changes in the environment might affect the LMR.
4.2 Regional patterns
To zoom in on the importance of each of the different factors underlying the LMR for various areas across the globe, we determined the LMR for the major global biomes (Fig. A8). The LMR is highest for the wet tropics (between 0 and 15∘ N and S) and montane grasslands and lowest for desert-like biomes in both the Northern and Southern hemispheres (between 30 and 45∘ N and S), confirming the importance of wetness, orography, and latitude. However, in the tropics (between 0 and 15∘ latitude), we do not find any correlation between the LMR and precipitation, evaporation, wetness, or orography. Possibly, due to the abundance of water and energy to evaporate, there is local recycling under all circumstances, except for when the wind speed is high. Comparing the LMR for each biome between both hemispheres indicates that some of the factors underlying the LMR are more robust than others for some biomes. In the Mediterranean biomes, located between 30 and 40∘ N and S, air generally descends due to the Hadley cell circulation. As a result, these biomes are expected to have a low LMR. Although we find a low LMR for the Mediterranean biomes in the Southern Hemisphere, we find a relatively high LMR for the Mediterranean biomes in the Northern Hemisphere. The Spearman rank analysis indicates that wind speed correlates with the LMR at these latitudes, which may explain the difference between both hemispheres.
Although the LMR is the highest in the wet tropics, we find different results among the various tropical regions (the Amazon Basin, Congo Basin, and Southeast Asia). The LMR in the Congo Basin exceeds the LMR in the Amazon Basin (Fig. 1), despite larger amounts of precipitation in the Amazon Basin (Hersbach et al., 2020). In the tropics, current deforestation results in drying (Bagley et al., 2014; Staal et al., 2020), reducing evaporation. As the LMR in the Congo Basin exceeds the LMR in the Amazon Basin, deforestation has a relatively large impact on local precipitation in the Congo Basin, suggesting a larger impact on droughts locally. This is further exacerbated by the fact that the Congo Basin, in comparison with the Amazon Basin, has many small-scale moisture feedback loops (Wunderling et al., 2022). Unlike the LMR, basin recycling is similar for both basins (Tuinenburg et al., 2020a). This suggests that the impact of deforestation on precipitation in the entire basin is similar for both basins, indicating that both basins would experience similar overall drying. However, drought conditions can also enhance recycling ratios (Bagley et al., 2014), possibly promoting the LMR. Further research is necessary to understand the impact of deforestation on the LMR in the tropics in more detail.
4.3 The spatial scale of the local moisture recycling ratio
We study local moisture recycling at a spatial scale of 0.5∘, which is approximately 55 km around the Equator and 50 km on average globally for all land cells. Instead of recycling within one grid cell (r1), we studied the recycling of evaporated moisture within its source grid cell and its eight surrounding grid cells (r9). Compared to r1, this r9 includes all moisture flows with a typical length scale of 50 km (0.5∘). For r1, moisture flows with a length smaller than 50 km can occur close to the border of grid cells; therefore, r1, by definition, underestimates the actual recycling. These moisture flows are accounted for in r9.
However, defining the LMR at the grid scale introduces complications. First, the longitudinal distance for a grid cell size decreases with latitude, resulting in different sizes and shapes, which makes it difficult to compare the LMR among all grid cells. For the low and middle latitudes, the variation in grid cell size only affects the LMR slightly, as confirmed when the LMR for each grid cell was scaled to a single area (Fig. A9). Therefore, we believe that the variation in grid size only causes a small bias in the statistical analysis, as the largest fraction of the land surface is in the low and middle latitudes, and moisture recycling is less important for the higher latitudes. However, it should be noted that the LMR will be lower in smaller grid cells than in larger grid cells for a similar wind speed. Second, the spatial scale of recycling is strongly dependent on regional differences, such as biome type, the dominating winds, and the proximity to mountains. For instance, with increasing distance from the Andes Mountains, the median travelling distance of transpired moisture from the Amazon forest increases (Staal et al., 2018), and evaporated moisture is blocked by the Himalayas for the Ganges Basin, limiting upward moisture flow and inducing precipitation (Tuinenburg et al., 2012). Furthermore, precipitation can be triggered by micrometeorological processes (e.g. Knox et al., 2011; Taylor et al., 2012), meaning that the spatial scale at which moisture recycling is the dominant process for precipitation is unknown. Therefore, we believe that a grid-based approach to systematically examine the LMR globally is a solid technique to define and study the physical processes at a spatial scale > 50 km via, for instance, a Spearman analysis (to study the underlying processes). However, our definition of the LMR is not sufficient to identify processes at a spatial scale smaller than 50 km that might be relevant.
4.4 Model and definition dependencies
It is important to note that the typical length scale of moisture recycling, as defined by Van der Ent and Savenije (2011), allows for a comparison of regional moisture recycling for different regions around the world due to its lack of dependence on the region's size and shape (Fig. A10). The typical length scale of evaporated moisture recycling decreases with increasing recycling. It peaks over deserts and is small over the tropics and mountainous regions (Fig. A9), overlapping with the spatial pattern of the LMR. However, this typical length scale does not allow for the quantification of the amount of recycled moisture; therefore, it is difficult to apply this metric to study the impact of evaporation changes due to land-use change. Hence, studies that aim to quantify moisture recycling locally may best use recycling ratios. However, studies that aim to compare recycling among different regions can best use the typical length scale of recycling.
In this article, we focus on model dependency, as we calculated the differences in magnitude of recycling within one grid cell of 1.5∘ obtained from output of the UTrack and WAM2-layers models (Link et al., 2020; Tuinenburg et al., 2020a). The spatial patterns are similar, yet the different magnitudes indicate a large model dependency, and, therefore, an uncertainty in moisture recycling. Furthermore, Van der Ent et al. (2010) calculated recycling within a grid cell of 1.5∘ for the years 1999–2008 using WAM2-layers and found a similar spatial pattern with high recycling over mountainous and tropical regions and low recycling over desert-like regions. These recycling ratios also have a larger magnitude than the LMR. However, it is not straightforward to interpret the differences in recycling ratios, as both models use different input data (i.e. ERA5 and ERA-Interim). To assess the possible role of the models in causing the difference in moisture recycling, we describe the main differences between the models. First, WAM2-layers calculates the atmospheric moisture recycling at a larger temporal and spatial scale than UTrack. A larger grid cell size and time step increases the likelihood of evaporation and precipitation taking place within the same small amount of time, which might result in an overestimation of recycling within one grid cell. Second, WAM2-layers generates moisture flows using two vertical layers; therefore, strong winds at specific vertical levels will be described in less detail, reducing estimated moisture transport and enhancing estimated moisture recycling within a single grid cell. Differences between rUTrack and rWAM2-layers are highly visible over mountainous regions where wind experiences relatively strong friction, highly impacting the wind. Finally, different approaches are used to include vertical mixing in the two models. Vertical mixing causes the greatest error in moisture tracking models, but the extent to which vertical mixing is underestimated is unknown (Stohl et al., 2005; Tuinenburg and Staal, 2020).
Besides studies employing atmospheric moisture tracking (e.g. Bagley et al., 2014; Keys et al., 2014; Van der Ent et al., 2010), some previous studies have used different methods to calculate regional moisture recycling for a specific area, such as isotope measurements (e.g. An et al., 2017) and bulk recycling models (e.g. Burde and Zangvil, 2001). The most common recycling models are modifications of Budyko's model (Budyko, 1974; Burde and Zangvil, 2001), which are 1D or 2D analytical models. These models assume that the atmosphere is completely mixed, meaning that evaporated water directly mixes perfectly with advected water throughout the entire water column. Because of this assumption, these models overlook fast recycling, which describes local showers that yield precipitation before the evaporated water is fully mixed. Excluding fast recycling causes models to underestimate terrestrial moisture recycling for some regions (e.g. the Amazon Basin) (Burde et al., 2006). Moreover, these models ignore the influence of vertical shear, which causes a significant error (Dominguez et al., 2020). Our method minimizes the errors due to fast recycling and vertical shear because of two model aspects. First, at each time step, each parcel has a small chance of getting mixed, causing each parcel to move approximately once in the vertical direction every 24 h, in addition to the displacement based on reanalysis data of vertical winds. This process minimizes complete mixing and reduces the error due to shear and fast recycling. Second, the error due to fast recycling also becomes smaller because lower atmospheric levels contribute more to the total precipitation than higher levels due to the skewed vertical moisture profile. WAM2-layers accounts for vertical shear, as it models two vertical atmospheric layers, the interface of which is located at the height where shear typically occurs. These two layers are both completely mixed; therefore, compared with bulk models, WAM2-layers better represents the distribution of moisture throughout the atmospheric column. As an alternative method, moisture flows can be calculated at a smaller time step to increase the interactions between different wind components, resulting in a better representation of turbulence (Keune et al., 2022). Despite the error reduction, the representation of fast recycling in UTrack should be studied in more detail, as fast recycling is expected to influence the LMR significantly.
The LMR is calculated as a 10-year average. This period of 10 years might miss multi-year climate variability such as the El Niño–Southern Oscillation and the North Atlantic Oscillation. The time series of atmospheric moisture connections provided by Link et al. (2020) allowed for the study of inter-annual variation in relatively local recycling. This shows that recycling is dependent on multi-year atmospheric phenomena. During the major El Niño event of 2015–2016, the northeast of South Africa had a below-average local recycling ratio (Fig. A11) for 2015. This pattern coincides with the impact of wetness during El Niño years, consistent with the hypothesis that wetness enhances the LMR. Furthermore, strong events such as heat waves and droughts might affect the multi-year annual mean. For example, we clearly find lower recycling over Russia during 2010, which may relate to the 2010 heat wave in eastern Europe and Russia. Overall, for these multi-year and strong events, we find that, for regions that face wetter than normal conditions, the LMR is enhanced, whereas the LMR is reduced for regions that face drier than normal conditions. Hence, drought events might result in a decrease in the LMR, as seen for the 2010 heat wave event in Europe and Russia. However, we did not find a clear impact on moisture recycling for all inter-annual climate variability modes. It may be that these phenomena do not affect wetness throughout the entire year; therefore, annual means might not represent them well.
4.5 Implications/applications of the LMR
The LMR could be applied in the field of water management. The spatial pattern of the LMR shows some overlap with global agricultural water management (Molden, 2007; Salmon et al., 2015). Generally, the tropics have a high LMR and agriculture is mainly rainfed (Salmon et al., 2015; Costa et al., 2019), indicating that these agricultural regions are self-dependent to some extent with respect to precipitation. Moreover, agriculture in the Mediterranean Basin and southern Australia is mainly rainfed. For semi-arid regions that are dependent on rainfed agriculture, changes in precipitation may have a significant impact (Keys et al., 2016). The LMR in the Mediterranean Basin exceeds the LMR in southern Australia, indicating that a larger fraction of evaporated moisture returns locally. Thus, when evaporation is maintained in the Mediterranean Basin, part of the precipitation will be sustained in the region, which holds to a lesser extent for southern Australia. Besides the LMR (i.e. local evaporation recycling), local precipitation recycling can help to understand the dependence of precipitation on local evaporation for each region. Irrigated agriculture is important in India and China (Salmon et al., 2015; Döll and Siebert, 2002), which are regions with a relatively low LMR, indicating that only a small amount of the evaporated moisture returns as precipitation locally. For irrigated agriculture in regions that are characterized by a high LMR, a relatively large amount of the evaporated water returns to its source, which reduces the amount of water that is necessary for irrigation. Terrestrial evaporation is an important source of precipitation and, thus, freshwater availability (Keune and Miralles, 2019). Therefore, spatial planning using the LMR might improve agricultural water management.
Global climate change likely affects atmospheric moisture connections due to changes in atmospheric dynamics. For example, due to global warming, the tropical atmospheric circulation may weaken (Vecchi et al., 2006) and the Hadley cells may move poleward (Shaw, 2019), affecting the updraught and downdraught of air around the globe, which we found to be important processes underlying the LMR. Furthermore, climate change has different opposing impacts on storm tracks, which have an important role in moisture transport by moving latent heat poleward (Shaw et al., 2016). Moreover, in a warmer climate, continental recycling is predicted to decrease and precipitation over land would be more dependent on evaporation over the ocean (Findell et al., 2019). However, our study does not account for any impacts of climate change. As our results indicate that wetness and convection enhance the LMR, the LMR may change due to, for example, drying and wetting of regions, changes in Hadley cell circulation, and circulation in the tropics. Furthermore, climate change enhances the risk of droughts (Rasmijn et al., 2018; Teuling, 2018), and the LMR might be used to study drought resilience globally. As for a high LMR, a local drought might drastically impact the local water cycle.
We expect that the LMR can also be helpful in other ways. Specifically, we expect that the concept of the LMR can be used to study how changes in evaporation, due to, for example, afforestation, affect the local water cycle beyond merely a loss of moisture. However, besides evaporation, land-use changes also influence the energy balance and other factors that might alter the atmospheric moisture connections and, thus, the LMR. Using future land-use scenarios as input for moisture tracking models, it will be possible to study the impact of land-use changes on atmospheric moisture connections. However, future scenarios often include other changes besides land use, which makes it impossible to study the changes in land use specifically. However, the LMR can help us better predict the impact of land-cover changes on the local water cycle. Thus, it might help us identify regions where reforestation would not cause local drying due to enhanced evaporation (Hoek van Dijke et al., 2022; Tuinenburg et al., 2022). Overall, the LMR gives us better insight into the atmospheric part of the local water cycle and terrestrial evaporation as a source of local freshwater availability.
We calculated the local moisture recycling ratio (LMR) from atmospheric moisture connections at a spatial scale of 0.5∘. The LMR is the fraction of evaporated moisture that precipitates within a distance of 0.5∘ (typically 50 km) from its source. On average, 1.7 % (SD of 1.1 %) of global terrestrial evaporation returns as precipitation locally, with peaks of approximately 6 %. The LMR peaks in summer and in wet and elevated regions. We find a correlation between the LMR and orography, precipitation, wetness, convective available potential energy, and wind, suggesting these variables might affect the LMR. In addition, latitude correlates with the LMR, which likely indicates the importance of the ascending and descending air related to the Hadley cell circulation. Furthermore, by comparing the LMR calculated using different models, we found that the spatial pattern of the LMR is not model dependent, but the magnitude of the LMR is strongly dependent on the model. The LMR defines the local impacts of enhanced evaporation on precipitation and, thus, its role as a source of local freshwater availability. Therefore, the LMR can be used to evaluate which locations may be suitable for regreening without largely disrupting the local water cycle.
Table A1Defined classes for the Spearman rank correlation analysis.
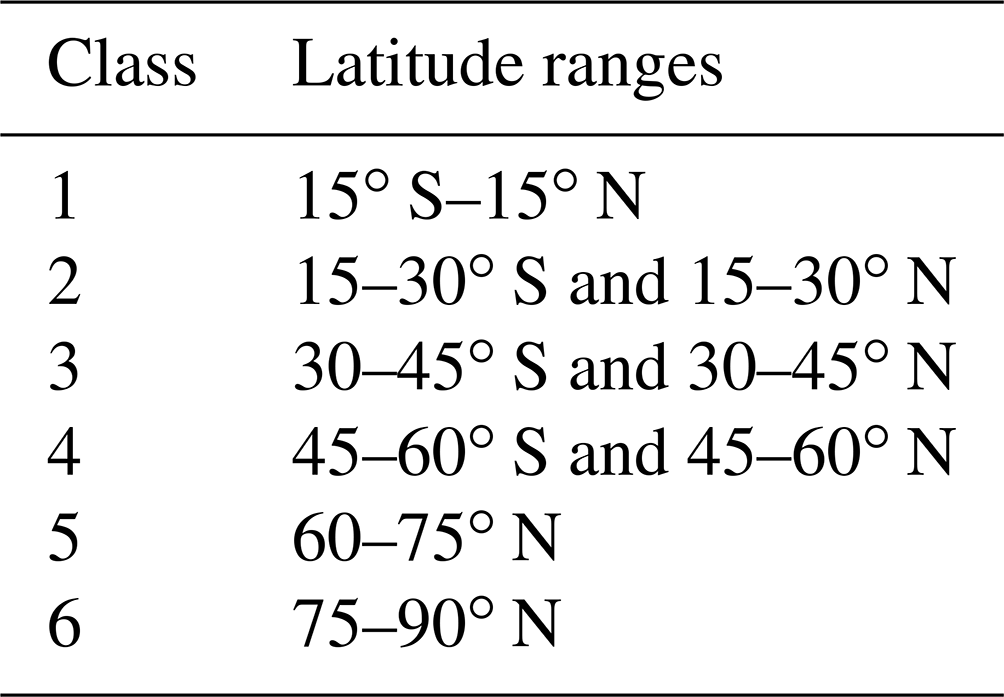
Table A2Spearman rank correlation coefficients for additional variables in different latitude classes. “*” indicates a significant correlation (p<0.05), and moderate and strong relations (ρ>0.4) are shown using bold font. The classes encompassing latitudes between 0 and 60∘ include grid cells of the Northern Hemisphere and Southern Hemisphere. The classes encompassing latitudes exceeding 60∘ include grid cells of the Northern Hemisphere only.
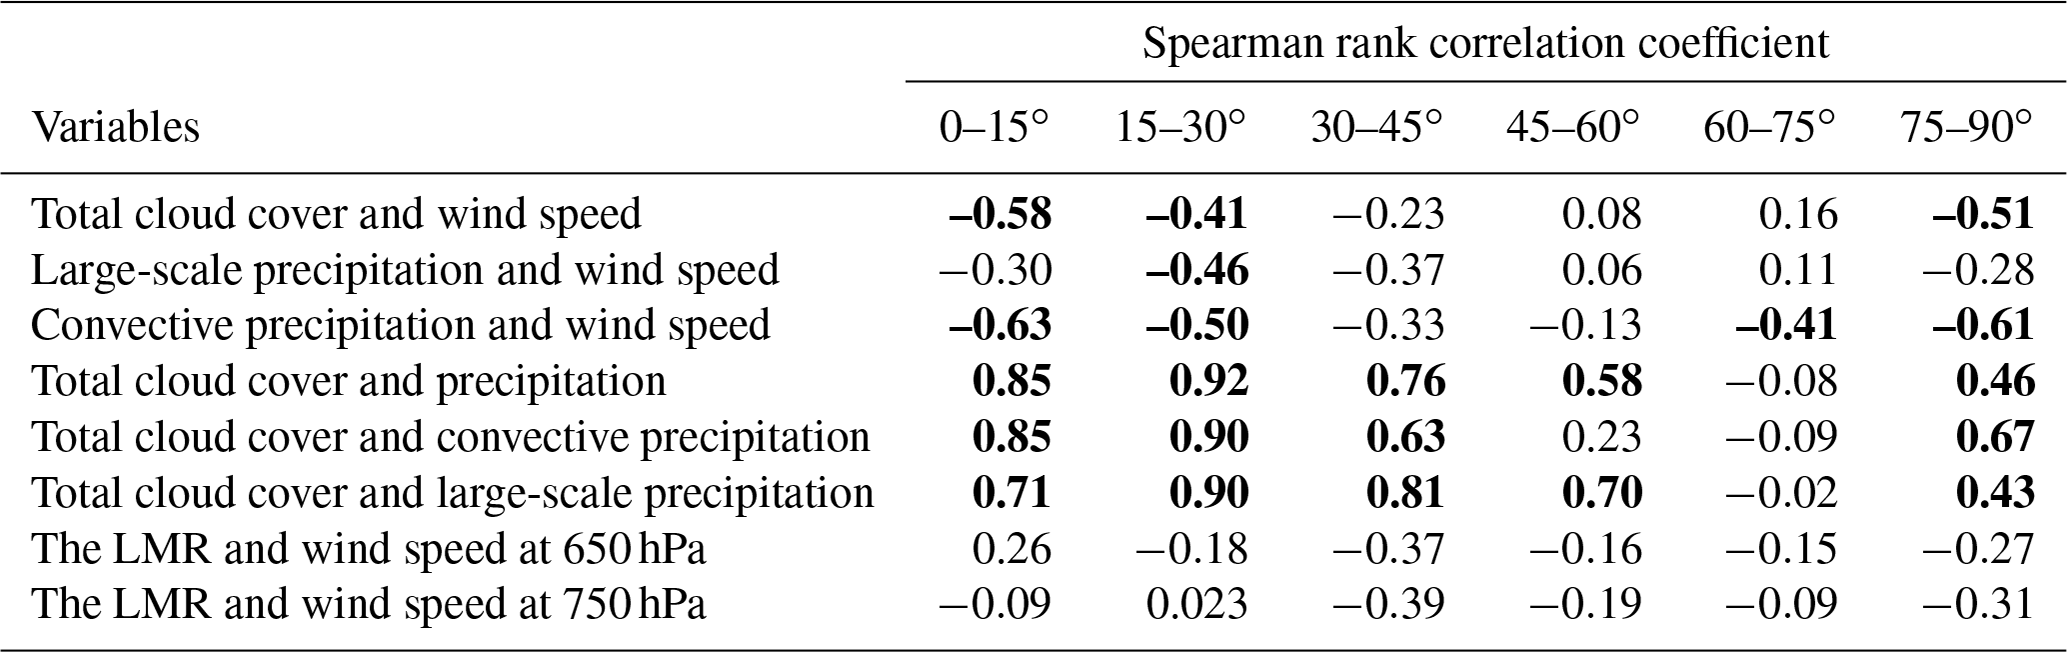
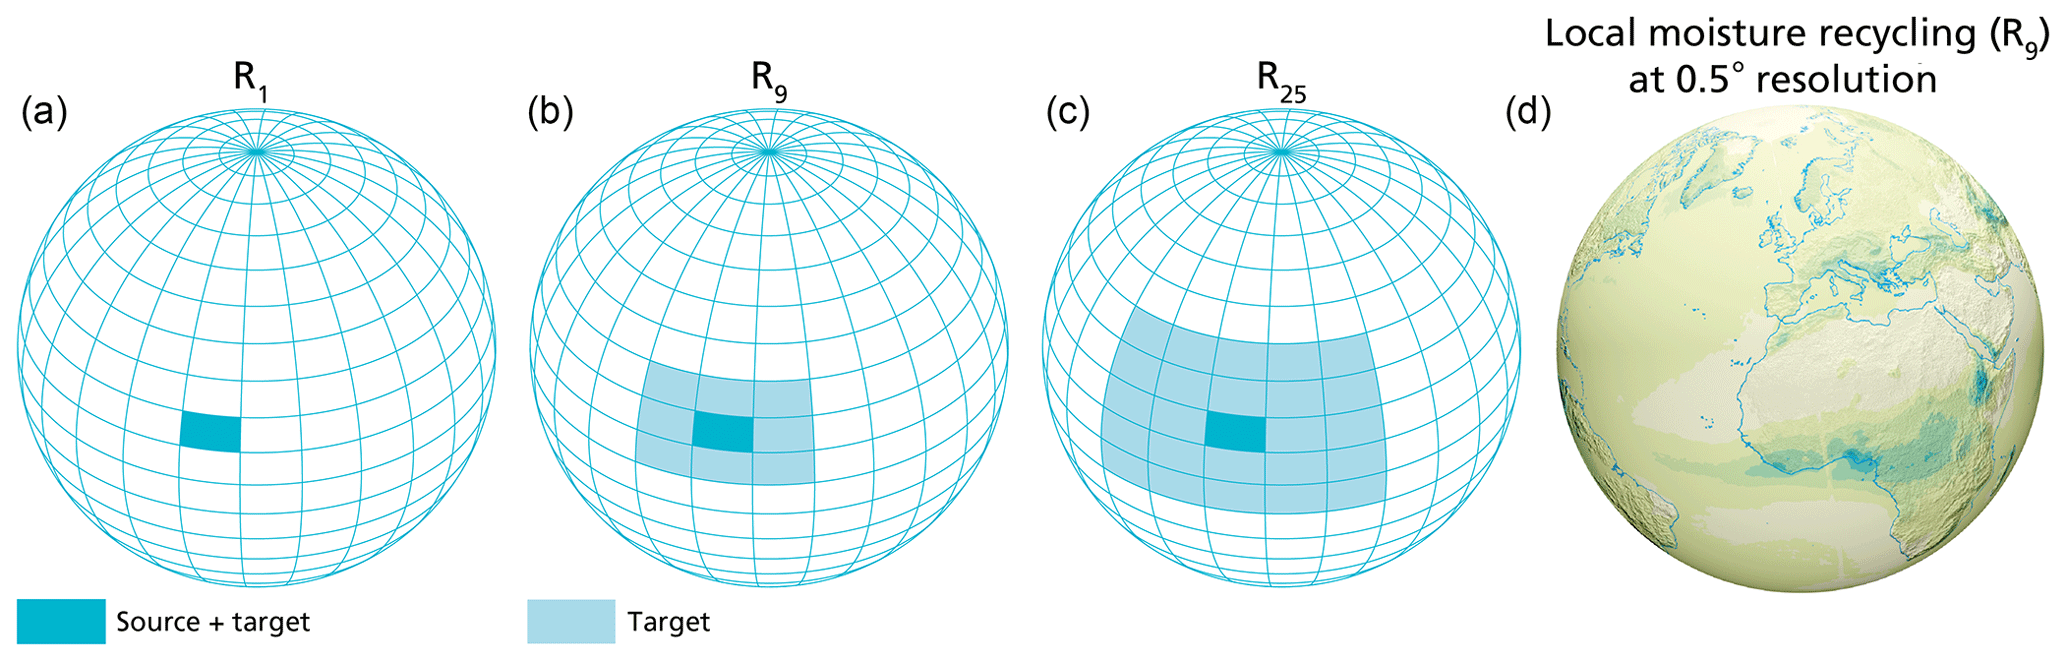
Figure A1Three definitions of the local moisture recycling ratio (LMR): (a) r1 describes the fraction of evaporated moisture that returns as precipitation in its source grid cell, (b) r9 describes the fraction of evaporated moisture that returns as precipitation in its source grid cell and 8 neighbouring grid cells, and (c) r25 describes the fraction of evaporated moisture that returns as precipitation in its source grid cell and 24 neighbouring grid cells. The LMR is calculated at a spatial scale of 0.5∘, and the first three plots do not have a similar resolution. Panel (d) shows the LMR at a spatial scale of 0.5∘, which is the resolution at which we calculate all definitions (r1, r9, and r25).

Figure A2The 10-year climatology (2008–2017) of the three definitions of the local moisture recycling ratio (LMR). Panel (a) indicates the fraction of evaporated moisture that precipitates within its source grid cell (r1), panel (b) shows the fraction of evaporated moisture that precipitates within its source grid cell and its 8 neighbouring grid cells (r9), and panel (c) shows the fraction of evaporated moisture that precipitates within its source grid cell and its 24 neighbouring grid cells (r25).
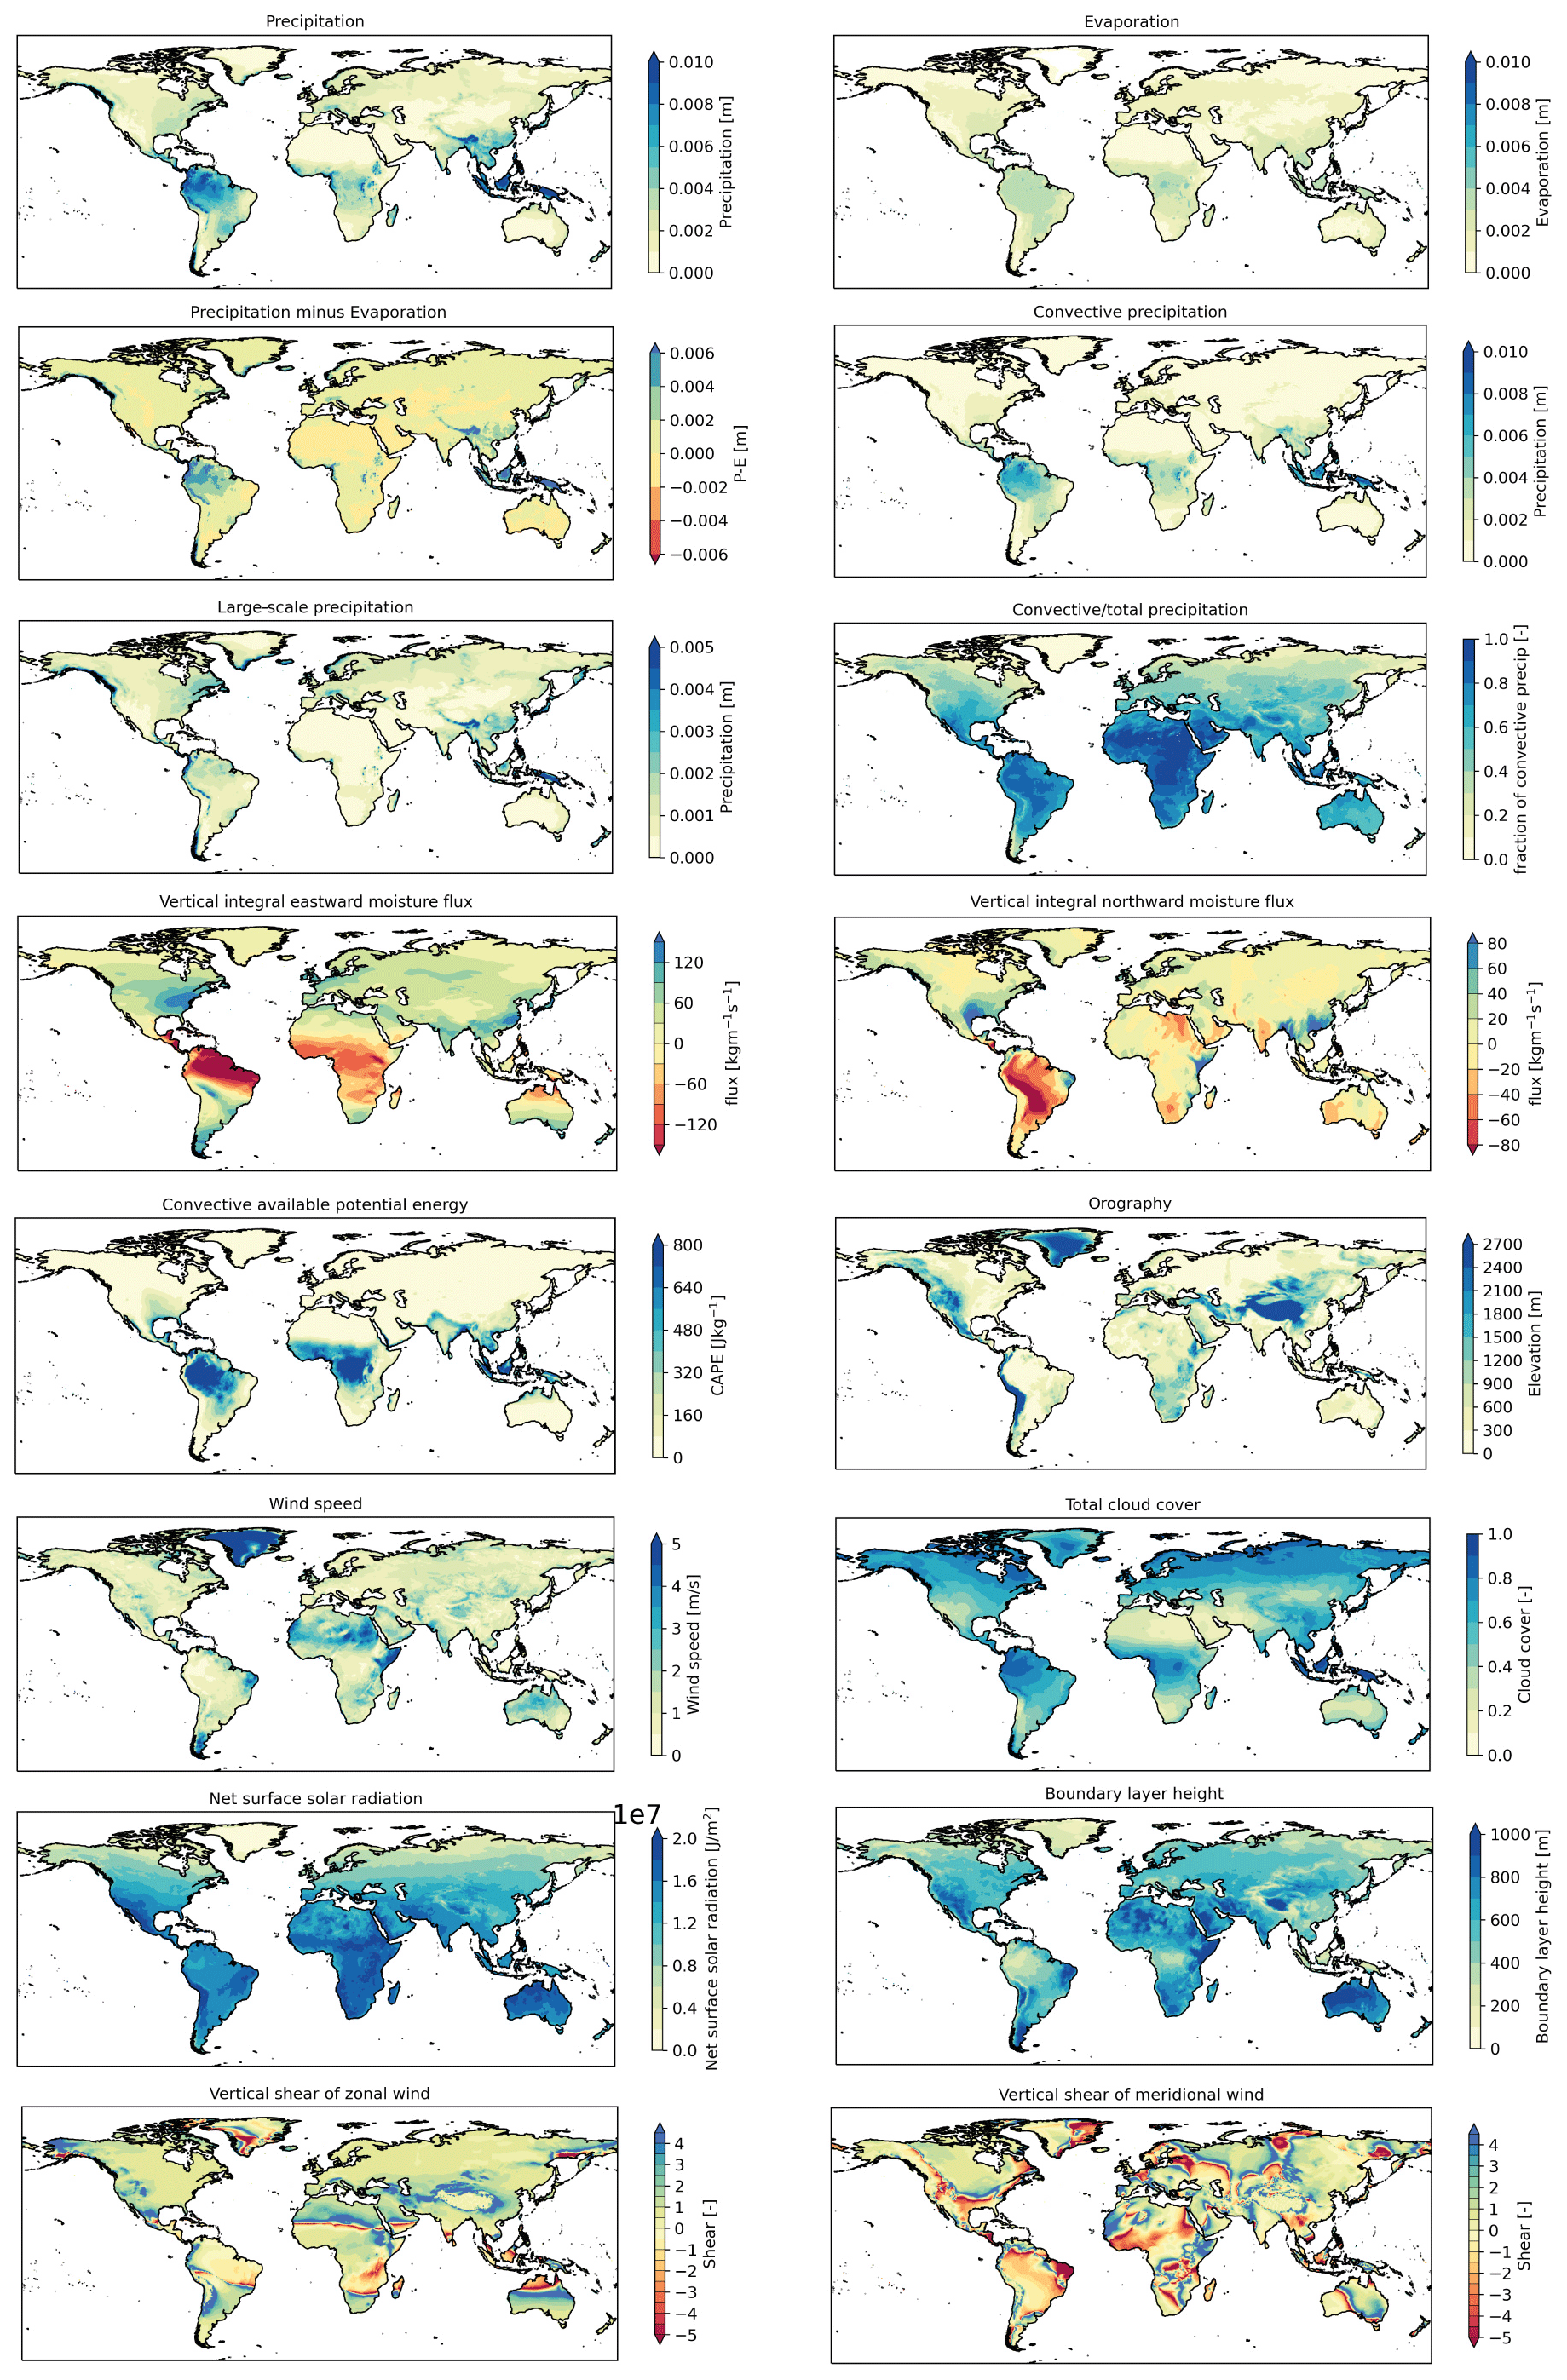
Figure A3The global 10-year climatology (2008–2017) of (from top to bottom and left to right) precipitation, evaporation, precipitation minus evaporation, convective precipitation, large-scale precipitation, fraction of convective precipitation, vertical integral of moisture flux in the eastward direction, vertical integral of moisture flux in the northward direction, CAPE, orography, vertical shear (between 650 and 750 hPa) of zonal wind, and vertical shear (between 650 and 750 hPa) of meridional wind.
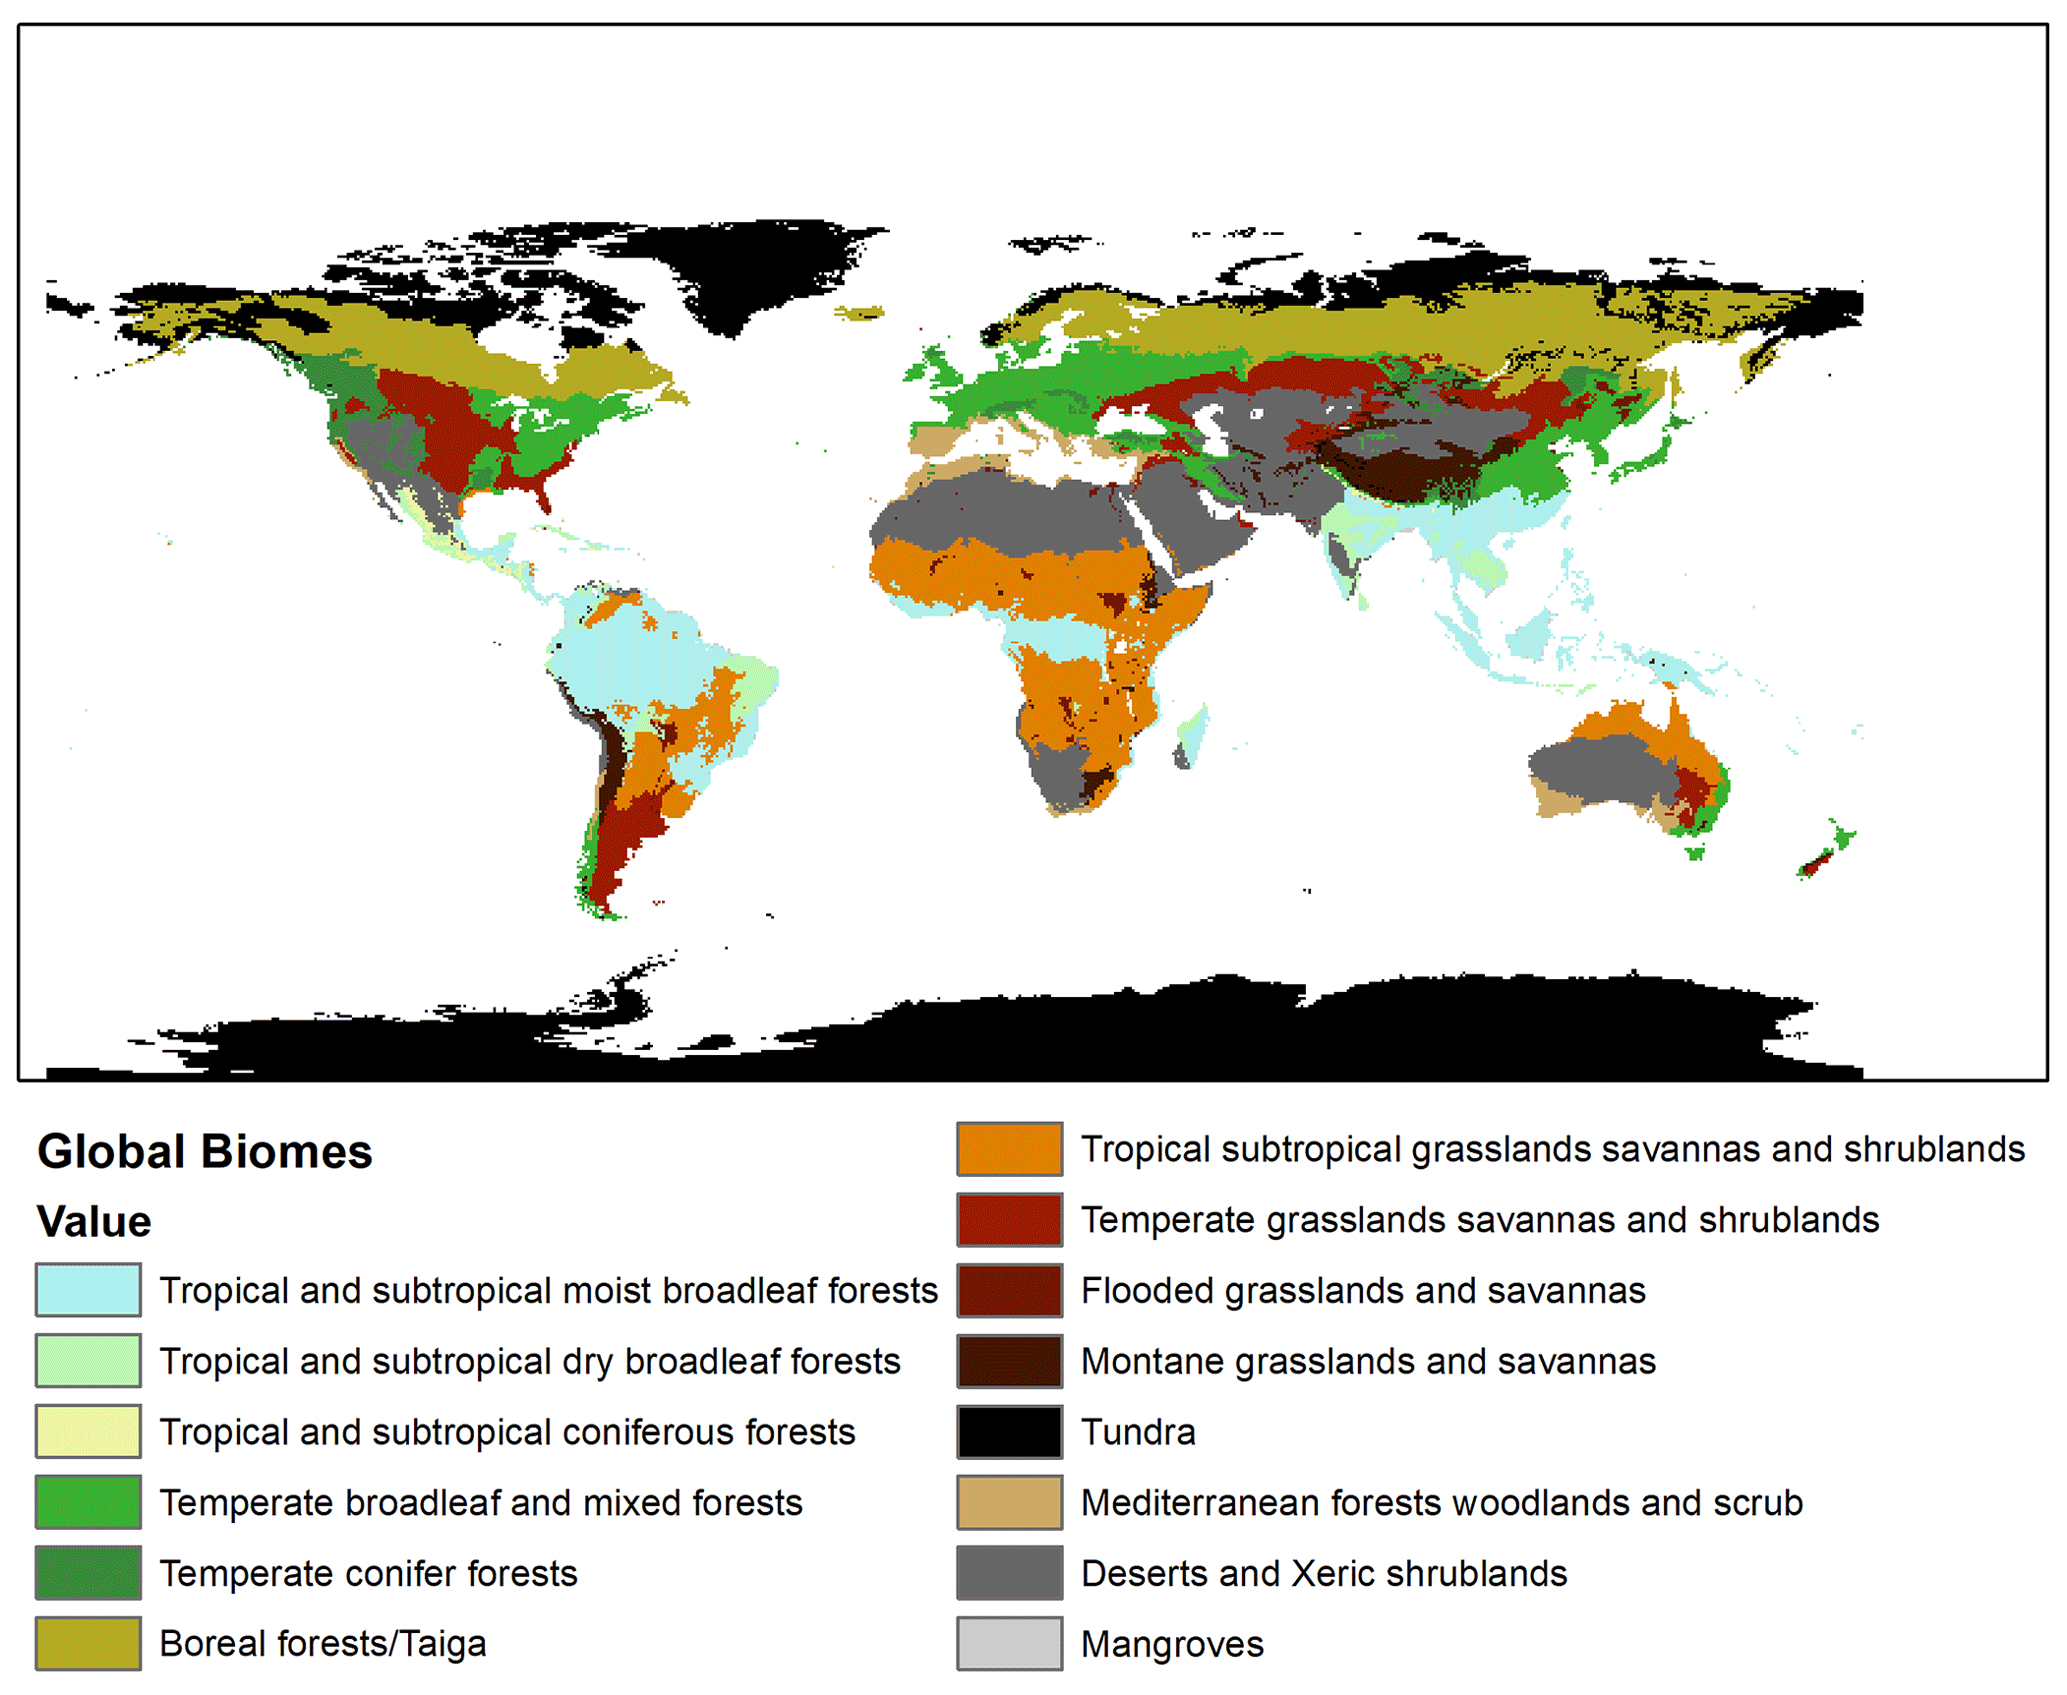
Figure A4Major global biomes from Ecoregions 2017 (https://ecoregions.appspot.com/, last access: 7 July 2022; © NASA Terra Metrics, Google INEGI Imagery).
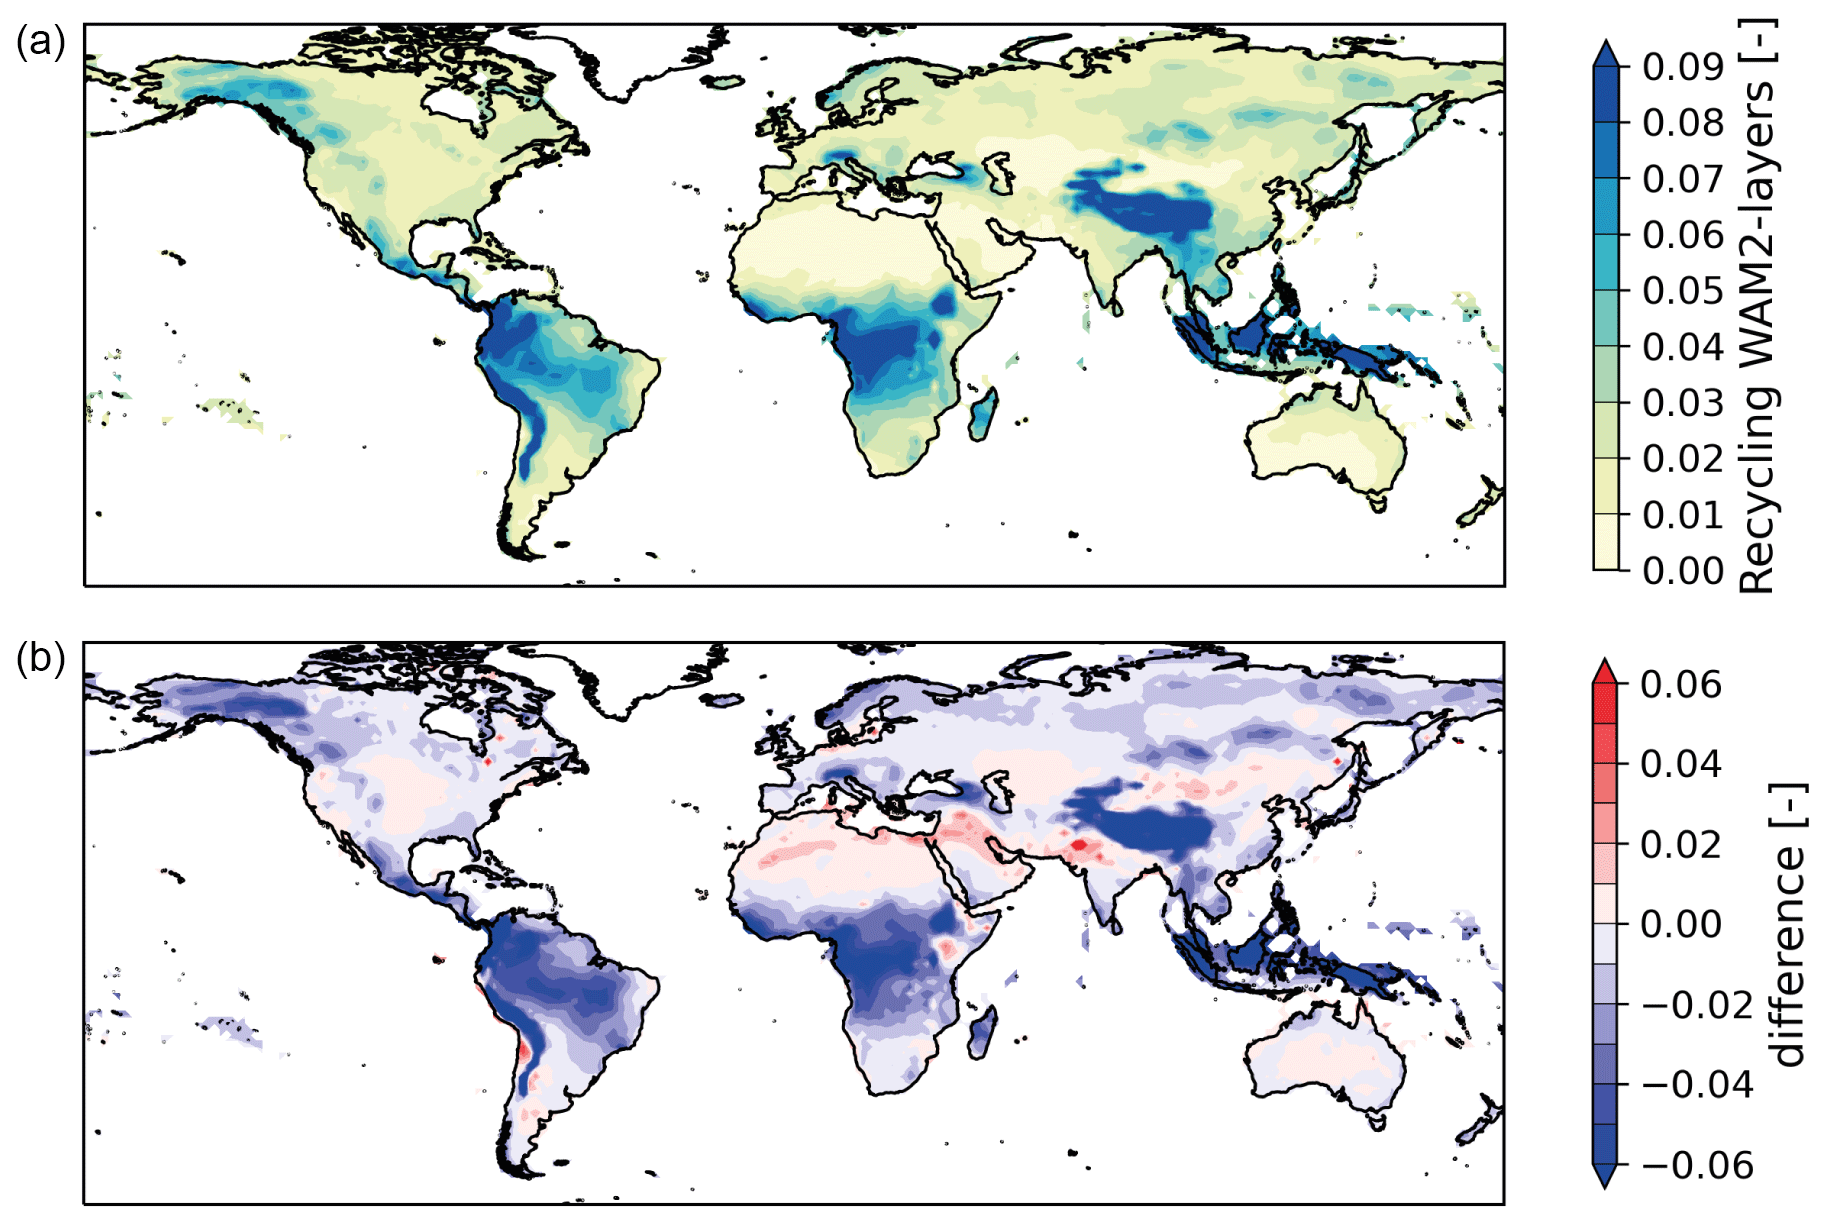
Figure A5The 10-year climatology (2008–2017) of the (a) recycling within one 1.5∘ grid cell calculated with the dataset of Link et al. (2020), i.e. the output from the Eulerian moisture tracking model WAM2-layers, and (b) the difference with the 10-year climatology (2008–2017) of the recycling within one 1.5∘ grid cell calculated with the dataset of Tuinenburg et al. (2020a).
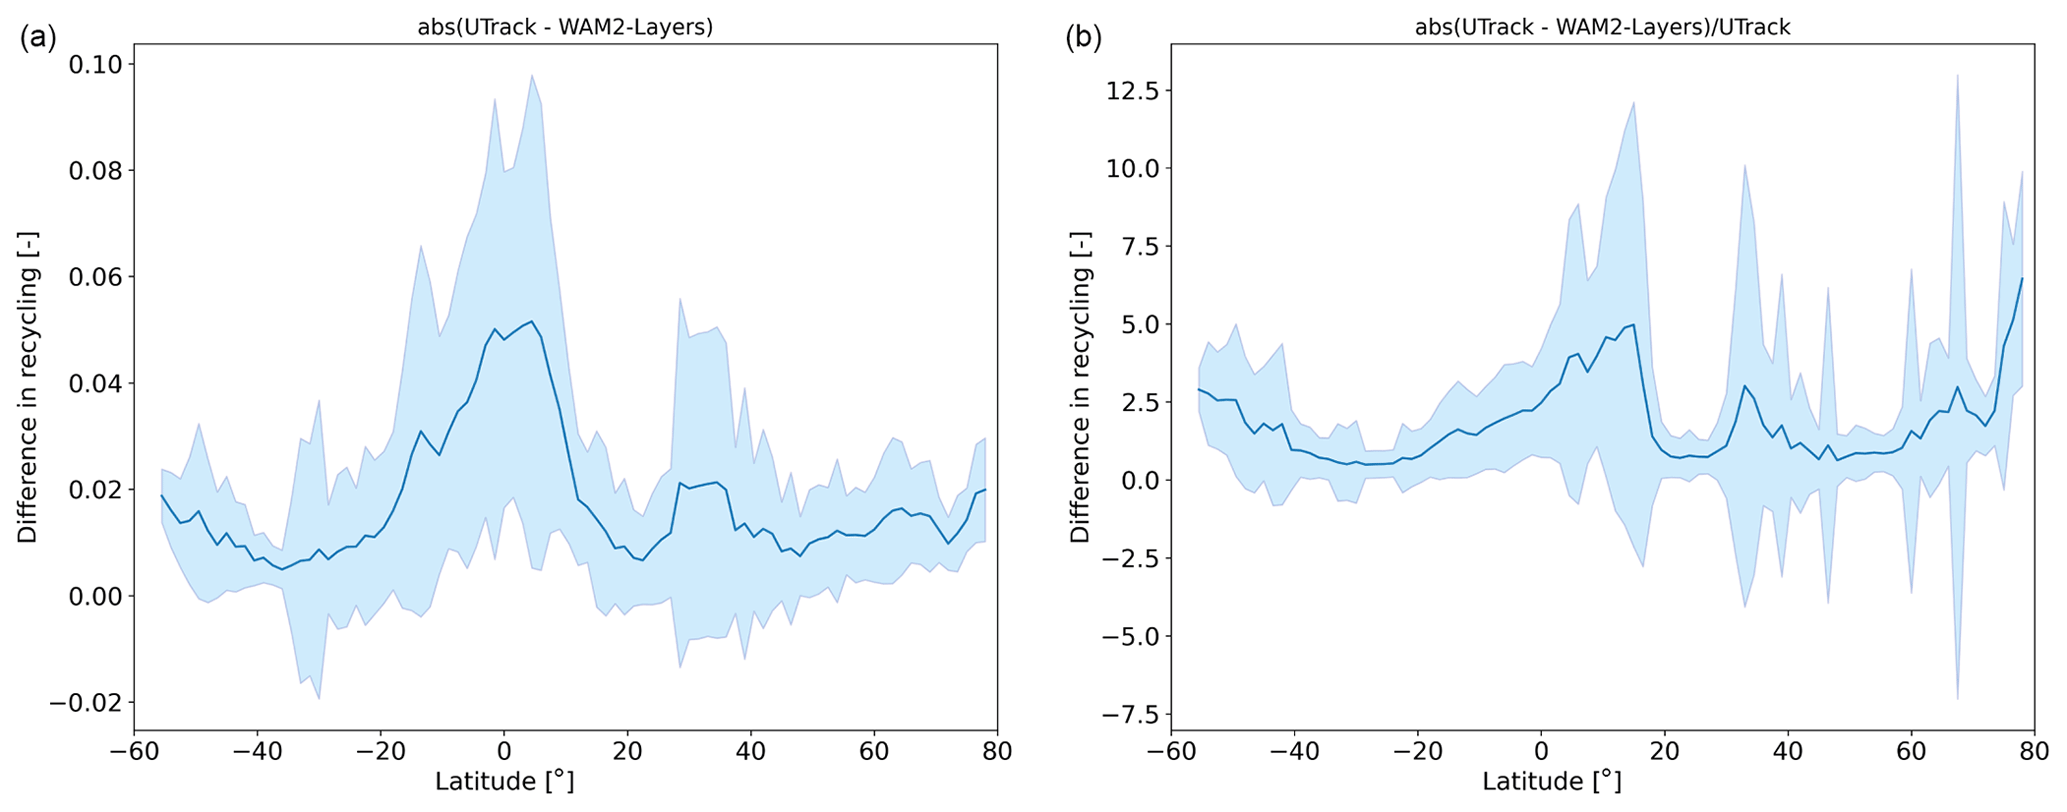
Figure A6The zonal mean of the absolute difference (a) and relative difference (b) between rUTrack and rWAM2-layers (calculated as rUTrack minus rWAM2-layers, indicated by the blue line) and its standard deviation (blue area).

Figure A7Scatter plots of the 10-year climatology (2008–2017) of the local moisture recycling ratio and (from top to bottom and left to right) precipitation minus evaporation (P−E), convective precipitation, large-scale precipitation, fraction of convective precipitation, vertical integral of moisture flux in the eastward direction, vertical integral of moisture flux in the northward direction, orography, vertical shear (between 650 and 750 hPa) of zonal wind, vertical shear (between 650 and 750 hPa) of meridional wind, boundary layer height, total cloud cover, and wind speed. Each scatter represents one grid cell.

Figure A8Time series of the local moisture recycling ratio for global biomes in the Northern (a) and Southern (b) hemispheres. The plots show the 10-year climatology (2008–2017).
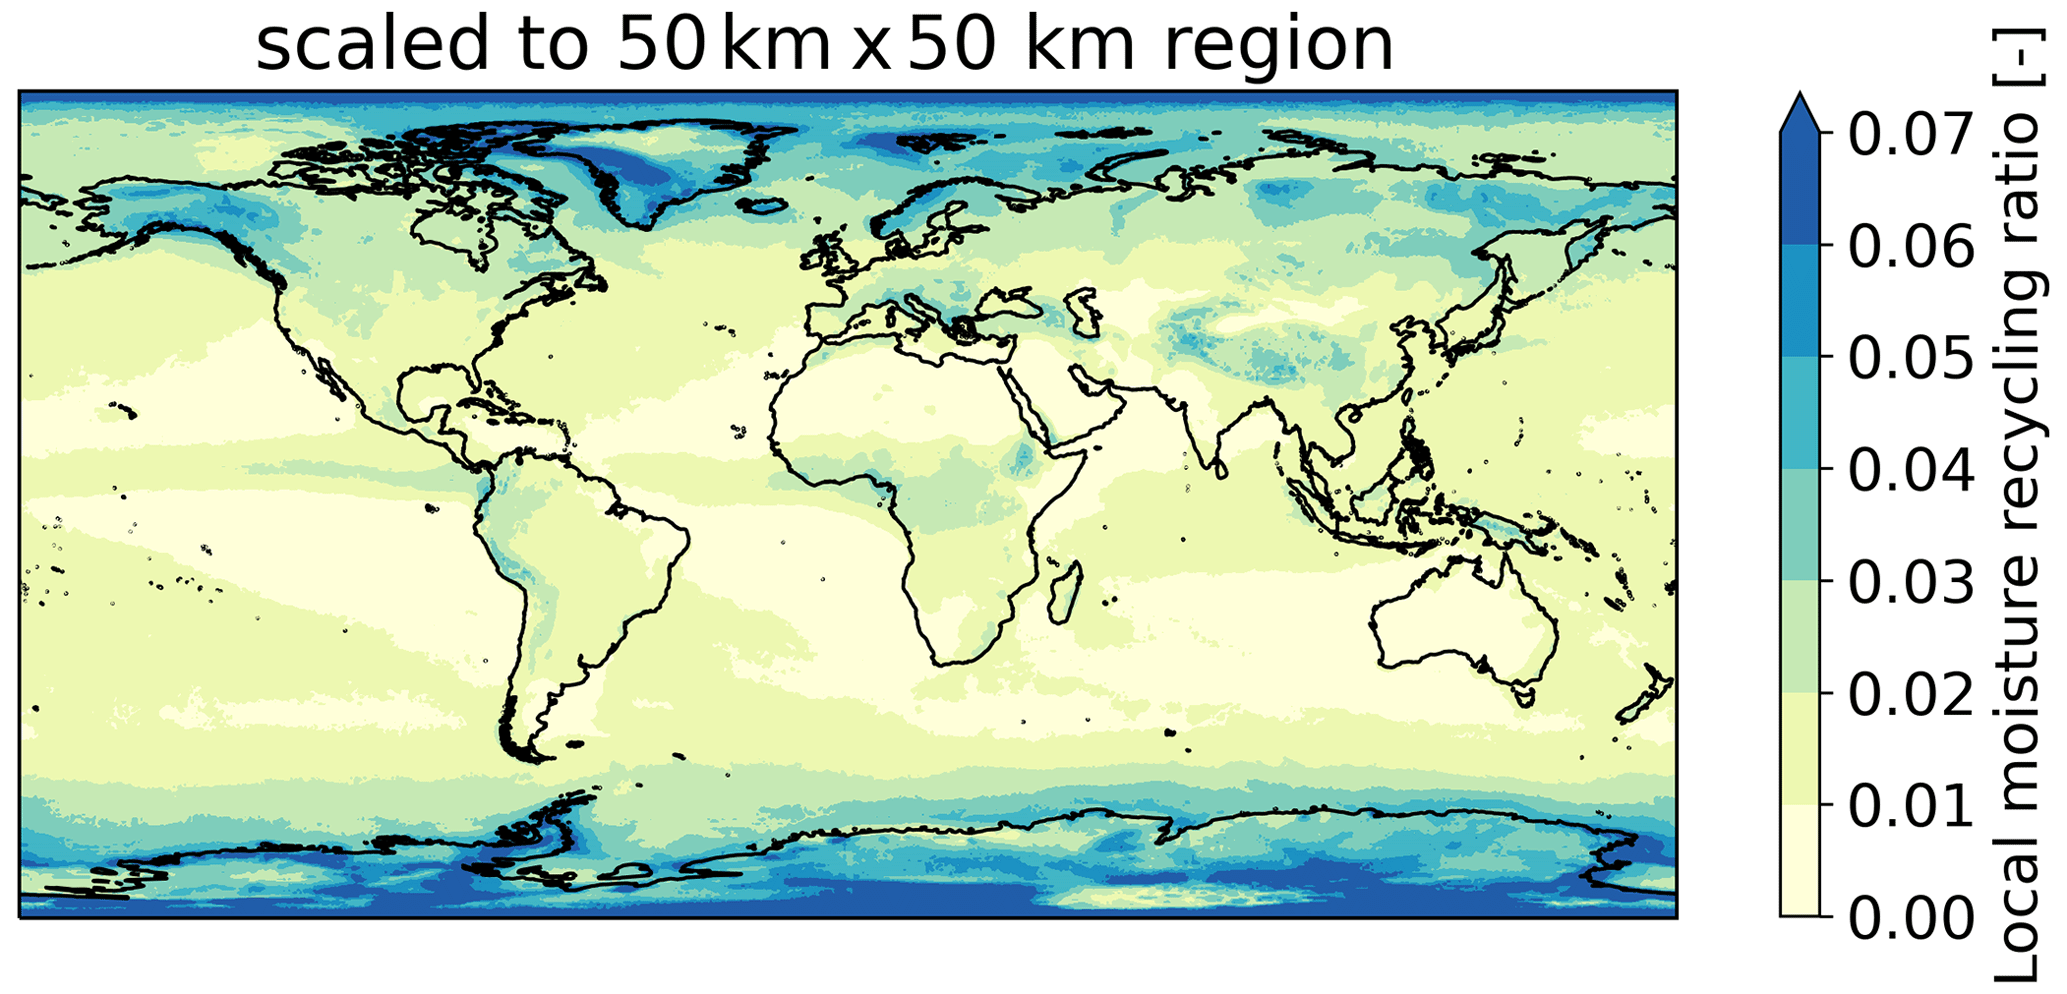
Figure A9The local moisture recycling ratio scaled to a grid cell size of 50 km × 50 km. The plot shows the 10-year climatology (2008–2017). We divided the original local moisture recycling ratio by the area of the grid cell and multiplied it by 2500 km2.
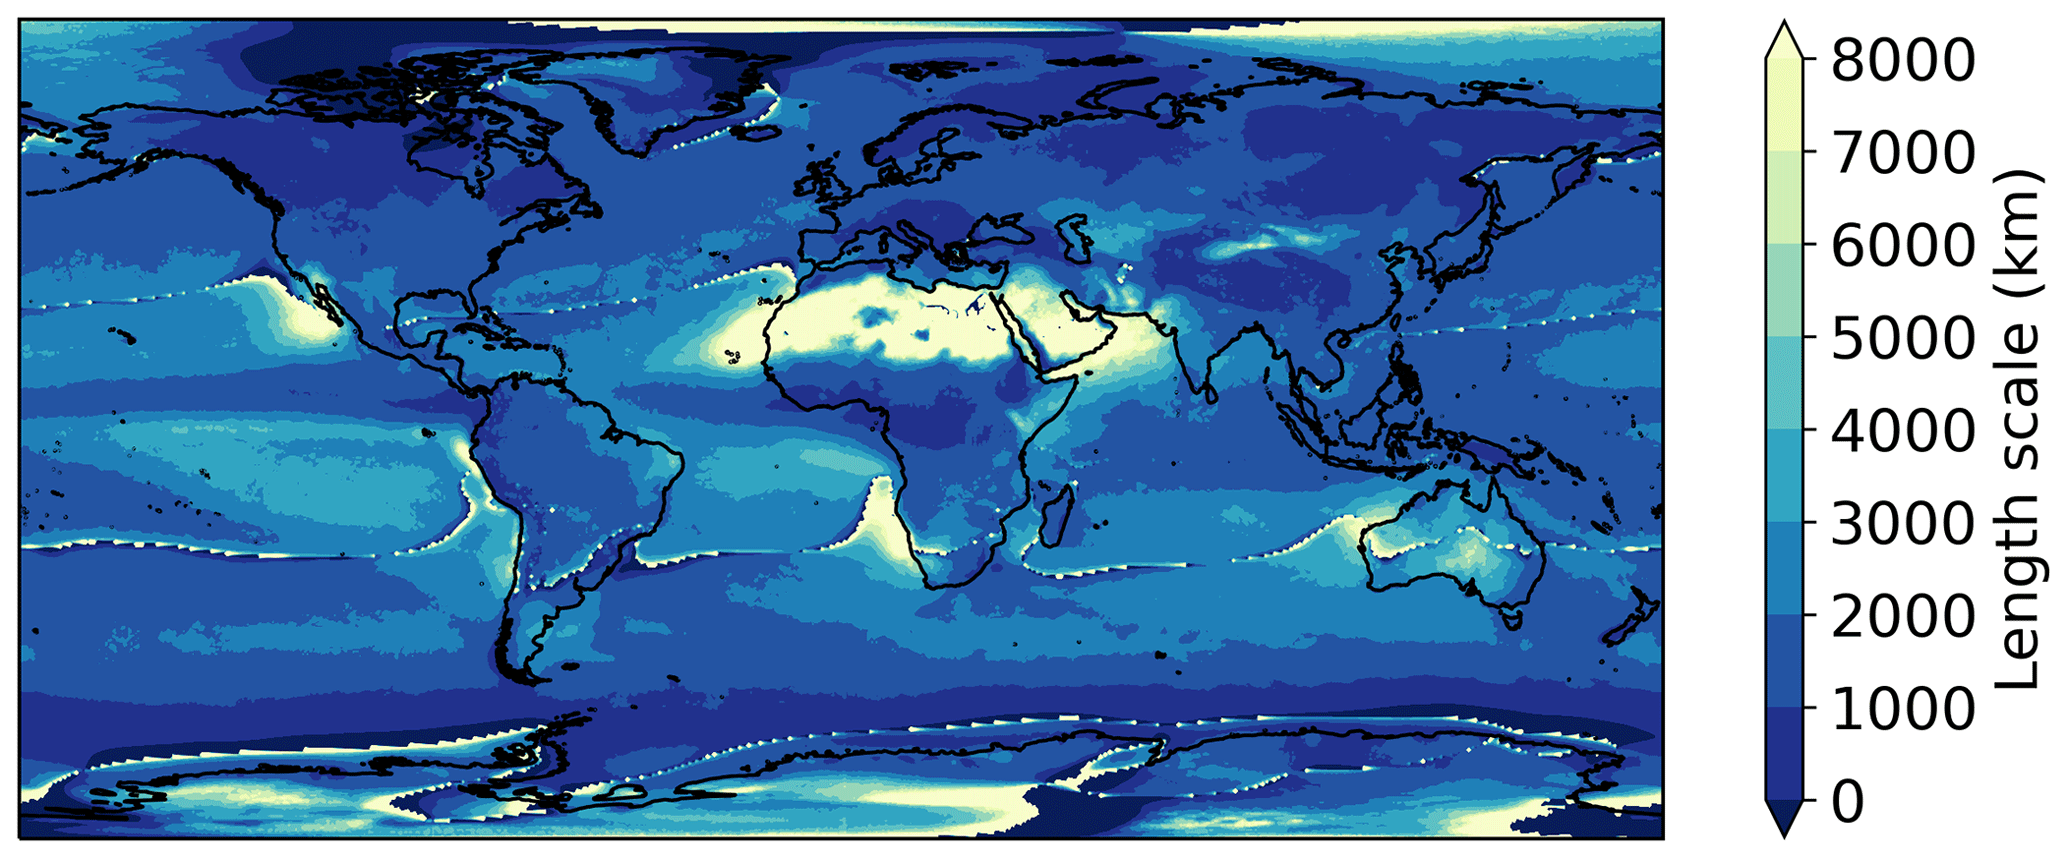
Figure A10Evaporation recycling length scale as defined by Van der Ent and Savenije (2011) for each grid cell. The plot shows the average of 2008–2017.
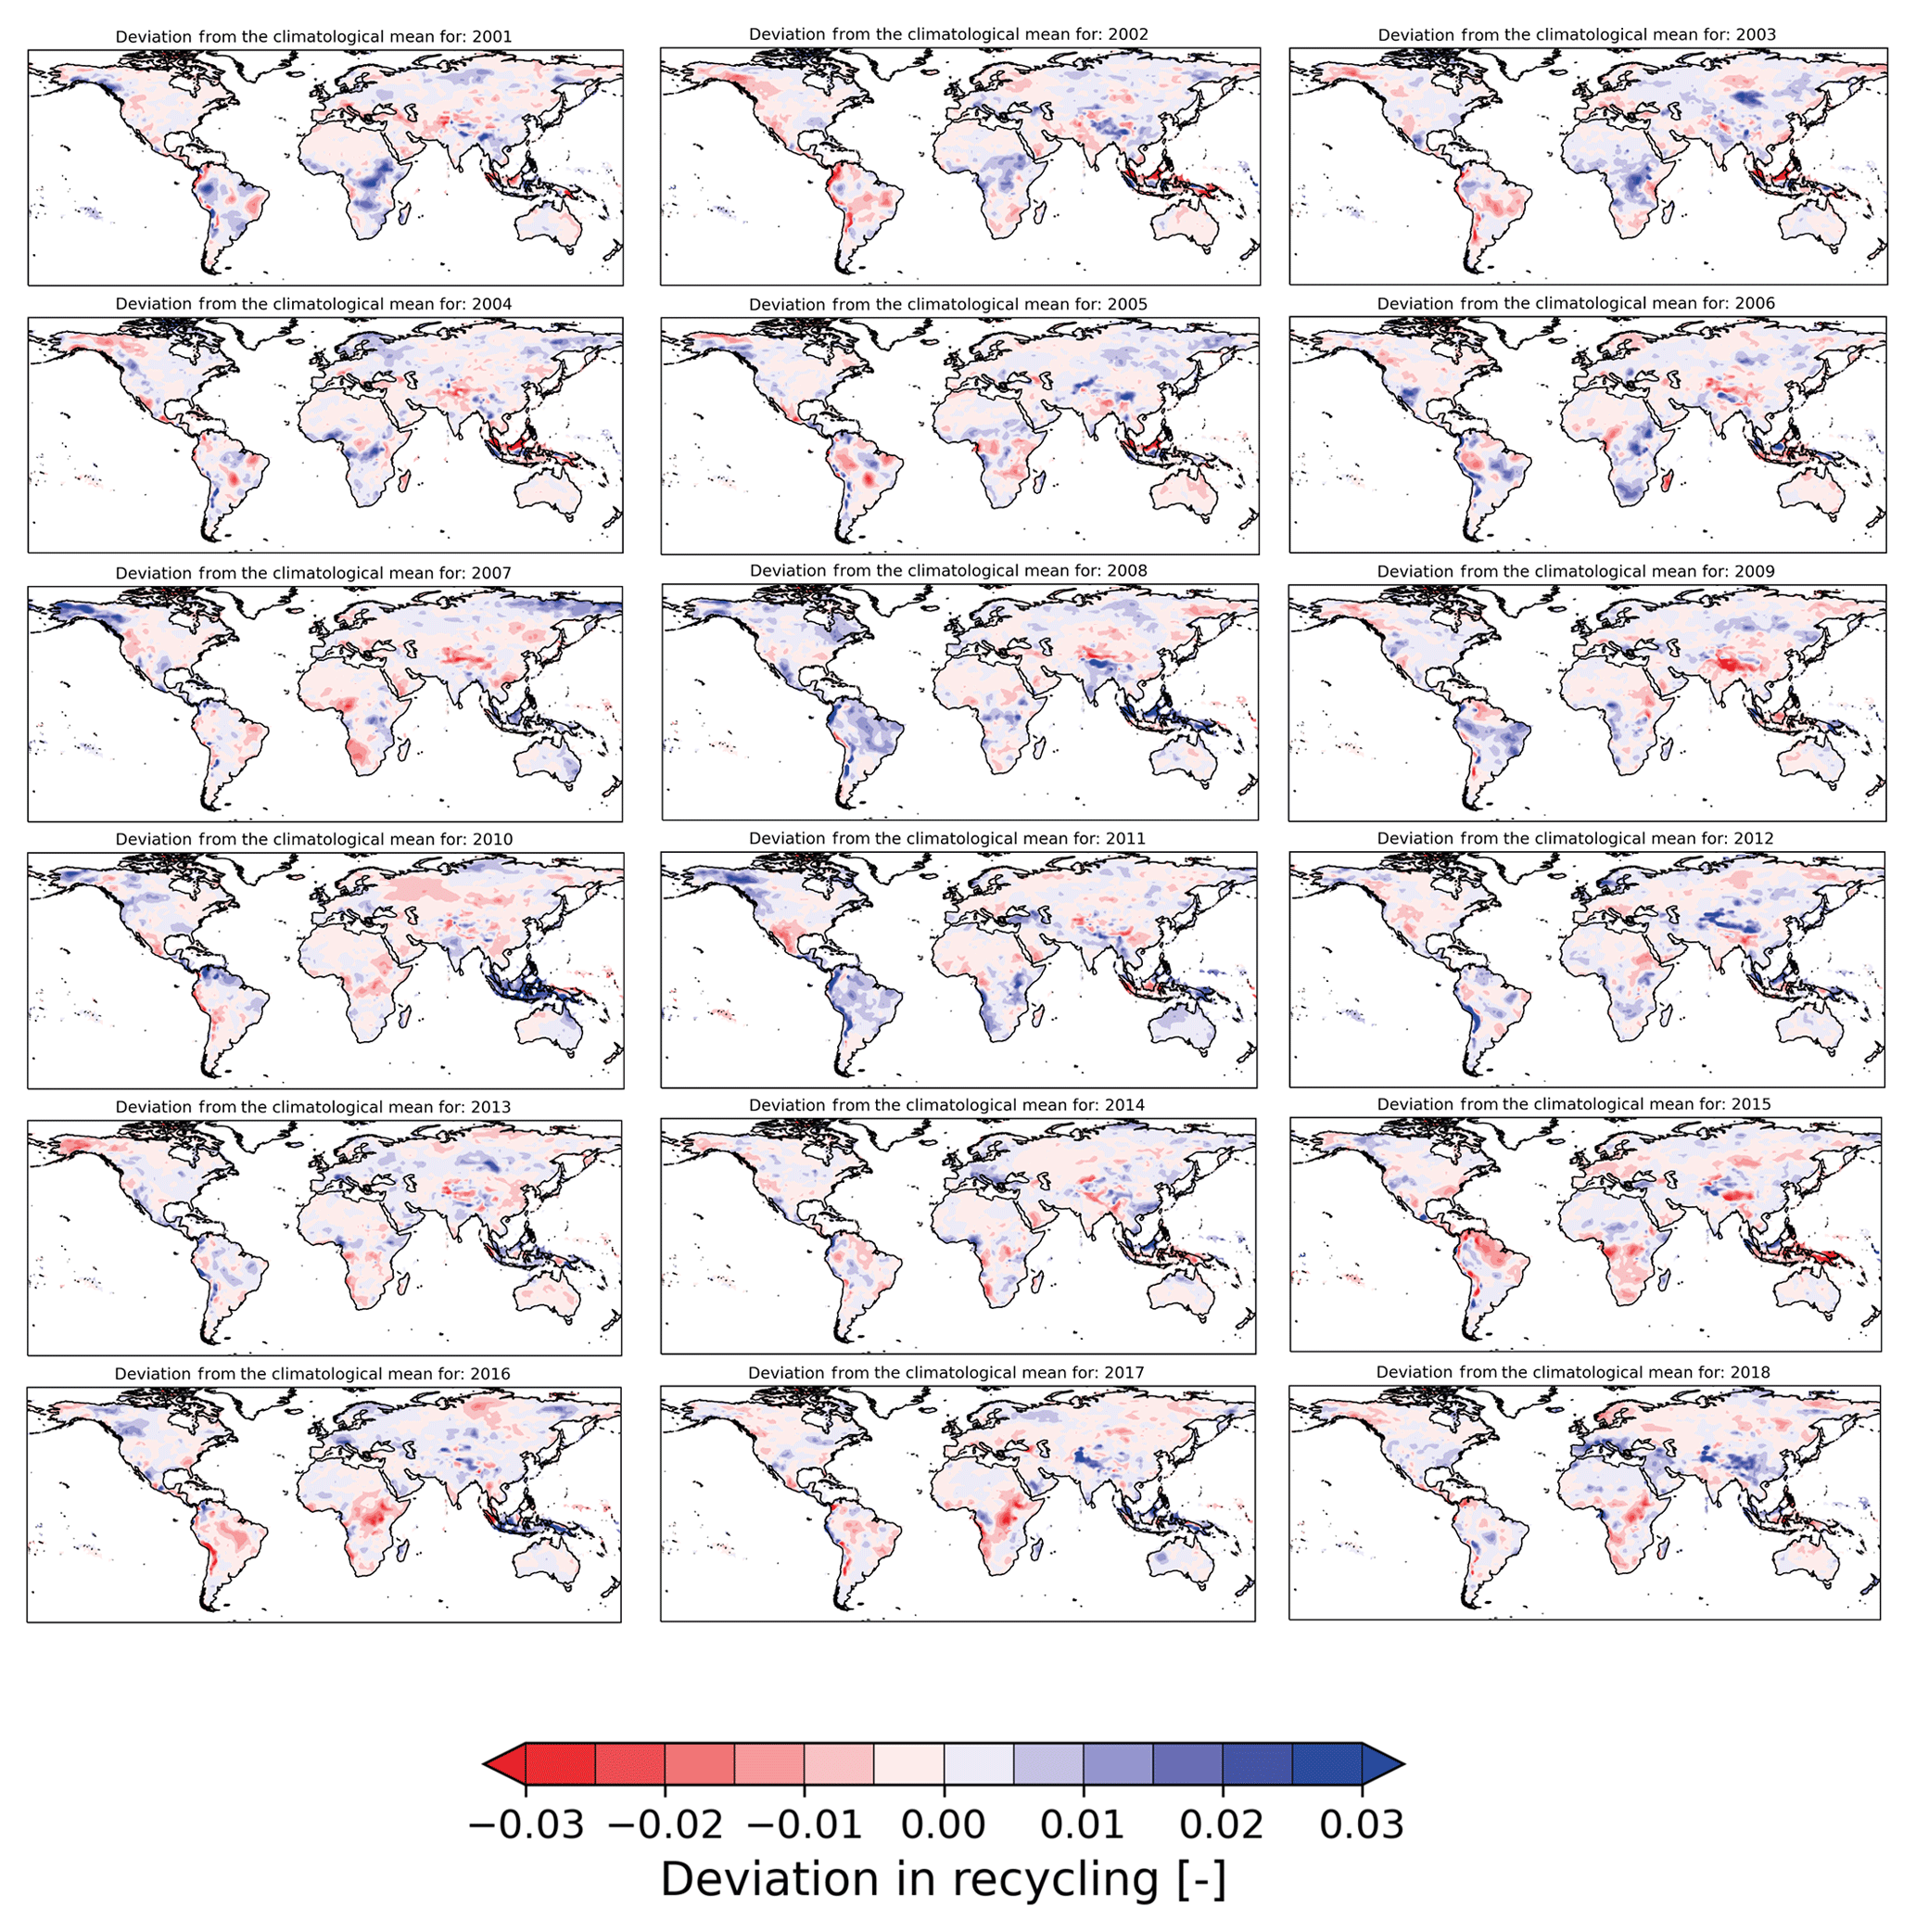
Figure A11Inter-annual variation in recycling within a single 1.5∘ grid cell between 2001 and 2018. Each plot shows the difference between annual averaged recycling and the climatological mean of recycling. Data were obtained from Link et al. (2020).
The code that was used to calculate and plot the local moisture recycling ratio is provided on GitHub https://github.com/jtheeu/LocalMoistureRecycling (Theeuwen, 2023).
The local moisture recycling ratios are available from the Zenodo archive at a 0.5∘ and 1.5∘ resolution (https://doi.org/10.5281/zenodo.7684640; Theeuwen et al., 2023). The atmospheric moisture connections from Tuinenburg et al. (2020a) are available from the PANGAEA archive at a 0.5∘ and 1.0∘ resolution (https://doi.org/10.1594/PANGAEA.912710; Tuinenburg et al., 2020b). The atmospheric moisture connections from Link et al. (2020) are available from the PANGAEA archive at a 1.5∘ resolution (https://doi.org/10.1594/PANGAEA.908705; Link et al., 2019).
JJET designed the study with contributions from all authors, carried out the research, and wrote the first draft of the manuscript in close collaboration with AS. All authors contributed to the discussion and the final version of the manuscript.
The contact author has declared that none of the authors has any competing interests.
Publisher's note: Copernicus Publications remains neutral with regard to jurisdictional claims in published maps and institutional affiliations.
The authors wish to thank Patrick Keys, Ruud van der Ent, and the anonymous reviewer for commenting on earlier versions of this paper. This work was performed in the cooperation framework of Wetsus, European Centre of Excellence for Sustainable Water Technology (https://www.wetsus.nl/, last access: 7 July 2022). Wetsus is co-funded by the Dutch Ministry of Economic Affairs and Climate Policy, the Northern Netherlands Provinces, and the Province of Fryslân. The authors would like to thank the participants of the Wetsus natural water production theme for fruitful discussions and financial support. Arie Staal acknowledges support from the Dutch Research Council (NWO) Talent Programme (grant no. VI.Veni.202.170). Obbe A. Tuinenburg acknowledges support from the NWO Innovational Research Incentives Scheme Veni research programme (grant no. 016.veni.171.019).
This research has been supported by the Aard- en Levenswetenschappen, Nederlandse Organisatie voor Wetenschappelijk Onderzoek (grant nos. VI.Veni.202.170 and 016.veni.171.019).
This paper was edited by Alexander Gruber and reviewed by Patrick Keys, Ruud van der Ent, and one anonymous referee.
An, W., Hou, S., Zhang, Q., Zhang, W., Wu, S., Xu, H., Pang, H., Wang, Y., and Liu, Y.: Enhanced recent local moisture recycling on the northwestern Tibetan Plateau deduced from ice core deuterium excess records, J. Geophys. Res.-Atmos., 122, 12541–12556, https://doi.org/10.1002/2017JD027235, 2017.
Bagley, J. E., Desai, A. R., Dirmeyer, P. A., and Foley, J. A.: Effects of land cover change on moisture availability and potential crop yield in the worlds breadbaskets, Environ. Res. Lett., 7, 014009, https://doi.org/10.1088/1748-9326/7/1/014009, 2012.
Bagley, J. E., Desai, A. R., Harding, K. J., Snyder, P. K., and Foley, J. A.: Drought and deforestation: Has land cover change influenced recent precipitation extremes in the Amazon?, J. Climate, 27, 345–361, https://doi.org/10.1175/JCLI-D-12-00369.1, 2014.
Brown, A. E., Zhang, L., McMahon, T. A., Western, A. W., and Vertessy, R. A.: A review of paired catchment studies for determining changes in water yield resulting from alterations in vegetation, J. Hydrol., 310, 28–61, https://doi.org/10.1016/j.jhydrol.2004.12.010, 2005.
Budyko, M. I.: Climate and life, Academic Press, New York, ISBN 9780080954530, 1974.
Burde, G. I.: Bulk recycling models with incomplete vertical mixing. Part II: Precipitation recycling in the Amazon Basin, J. Climate, 19, 1461–1472, https://doi.org/10.1175/JCLI3687.1, 2006.
Burde, G. I. and Zangvil, A.: The estimation of regional precipitation recycling. Part I: Review of recycling models, J. Climate, 14, 2509–2527, https://doi.org/10.1175/1520-0442, 2001.
Costa, M. H., Fleck, L. C., Cohn, A. S., Abrahão, G. M., Brando, P. M., Coe, M. T., Fu, R., Lawrence, D., Pires, G. F., Pousa, R., and Soares-Filho, B. S.: Climate risks to Amazon agriculture suggest a rationale to conserve local ecosystems, Front. Ecol. Environ., 17, 584–590, https://doi.org/10.1002/fee.2124, 2019.
Cui, J., Lian, X., Huntingford, C., Gimeno, L., Wang, T., Ding, J., He, M., Xu, H., Chen, A., Gentine, P., and Piao, S.: Global water availability boosted by vegetation-driven changes in atmospheric moisture transport, Nat. Geosci., 15, 982–988, https://doi.org/10.1038/s41561-022-01061-7, 2022.
Döll, P. and Siebert, S.: Global modeling of irrigation water requirements, Water Resour. Res., 38, 1037, https://doi.org/10.1029/2001wr000355, 2002.
Dominguez, F., Kumar, P., Liang, X. Z., and Ting, M.: Impact of atmospheric moisture storage on precipitation recycling, J. Climate, 19, 1513–1530, https://doi.org/10.1175/JCLI3691.1, 2006.
Dominguez, F., Miguez-Macho, G., and Hu, H.: WRF with water vapor tracers: A study of moisture sources for the North American Monsoon, J. Hydrometeorol., 17, 1915–1927, https://doi.org/10.1175/JHM-D-15-0221.1, 2016.
Dominguez, F., Hu, H., and Martinez, J. A.: Two-Layer Dynamic Recycling Model (2L-DRM): Learning from moisture tracking models of different complexity, J. Hydrometeorol., 21, 3–16, https://doi.org/10.1175/jhm-d-19-0101.1, 2020.
Eltahir, E. A. B.: A soil moisture-rainfall feedback mechanism, Water Resour. Res., 34, 765–776, 1998.
Eltahir, E. A. B. and Pal, J. S.: Relationship between surface conditions and subsequent rainfall in convective storms, J. Geophys. Res.-Atmos., 101, 26237–26245, https://doi.org/10.1029/96jd01380, 1996.
Falkenmark, M., Wang-Erlandsson, L., and Rockström, J.: Understanding of water resilience in the Anthropocene, J. Hydrol., 2, 100009, https://doi.org/10.1016/j.hydroa.2018.100009, 2019.
Findell, K. L., Keys, P. W., Van der Ent, R. J., Lintner, B. R., Berg, A., and Krasting, J. P.: Rising temperatures increase importance of oceanic evaporation as a source for continental precipitation, J. Climate, 32, 7713–7726, https://doi.org/10.1175/jcli-d-19-0145.1, 2019.
Hersbach, H., Bell, B., Berrisford, P., Hirahara, S., Horányi, A., Muñoz-Sabater, J., Nicolas, J., Peubey, C., Radu, R., Schepers, D., Simmons, A., Soci, C., Abdalla, S., Abellan, X., Balsamo, G., Bechtold, P., Biavati, G., Bidlot, J., Bonavita, M., De Chiara, G., Dahlgren, P., Dee, D., Diamantakis, M., Dragani, R., Flemming, J., Forbes, R., Fuentes, M., Geer, A., Haimberger, L., Healy, S., Hogan, R. J., Hólm, E., Janisková, M., Keeley, S., Laloyaux, P., Lopez, P., Lupu, C., Radnoti, G., de Rosnay, P., Rozum, I., Vamborg, F., Villaume, S., and Thépaut, J. N.: The ERA5 global reanalysis, Q. J. Roy. Meteorol. Soc., 146, 1999–2049, https://doi.org/10.1002/qj.3803, 2020.
Hoek van Dijke, A. J., Herold, M., Mallick, K., Benedict, I., Machwitz, M., Schlerf, M., Pranindita, A., Theeuwen, J. J. E., Bastin, J.-F., and Teuling, A. J.: Shifts in regional water availability due to global tree restoration, Nat. Geosci., 15, 363–368, https://doi.org/10.1038/s41561-022-00935-0, 2022.
Jackson, R. B., Jobbágy, E. G., Avissar, R., Roy, S. B., Barrett, D. J., Cook, C. W., Farley, K. A., Le Maitre, D. C., McCarl, B. A., and Murray, B. C.: Atmospheric science: Trading water for carbon with biological carbon sequestration, Science, 310, 1944–1947, https://doi.org/10.1126/science.1119282, 2005.
Jana, S., Rajagopalan, B., Alexander, M. A., and Ray, A. J.: Understanding the dominant sources and tracks of moisture for summer rainfall in the southwest united states, J. Geophys. Res.-Atmos., 123, 4850–4870, https://doi.org/10.1029/2017JD027652, 2018.
Keune, J. and Miralles, D. G.: A precipitation recycling network to assess freshwater vulnerability: Challenging the watershed convention, Water Resour. Res., 55, 9947–9961, https://doi.org/10.1029/2019WR025310, 2019.
Keune, J., Schumacher, D. L., and Miralles, D. G.: A unified framework to estimate the origins of atmospheric moisture and heat using Lagrangian models, Geosci. Model Dev., 15, 1875–1898, https://doi.org/10.5194/gmd-15-1875-2022, 2022.
Keys, P. W., Van der Ent, R. J., Gordon, L. J., Hoff, H., Nikoli, R., and Savenije, H. H. G.: Analyzing precipitationsheds to understand the vulnerability of rainfall dependent regions, Biogeosciences, 9, 733–746, https://doi.org/10.5194/bg-9-733-2012, 2012.
Keys, P. W., Barnes, E. A., Van der Ent, R. J., and Gordon, L. J.: Variability of moisture recycling using a precipitationshed framework, Hydrol. Earth Syst. Sc., 18, 3937–3950, https://doi.org/10.5194/hess-18-3937-2014, 2014.
Keys, P. W., Wang-Erlandsson, L., and Gordon, L. J.: Revealing invisible Water: Moisture recycling as an ecosystem service, PLoS One, 11, e0151993, https://doi.org/10.1371/journal.pone.0151993, 2016.
Keys, P. W., Porkka, M., Wang-Erlandsson, L., Fetzer, I., Gleeson, T., and Gordon, L. J.: Invisible water security: Moisture recycling and water resilience, Water Secur., 8, 57–89, https://doi.org/10.1016/j.wasec.2019.100046, 2019.
Knox, R., Bisht, G., Wang, J., and Bras, R.: Precipitation variability over the forest-to-nonforest transition in Southwestern Amazonia, J. Climate, 24, 2368–2377, https://doi.org/10.1175/2010JCLI3815.1, 2011.
Lettau, H., Lettau, K., and Molion, L. C. B.: Amazonia's hydrologic cycle and the role of atmospheric recycling in assessing deforestation effects, Mon. Weather Rev., 107, 227–238, 1979.
Liberato, M. L. R., Ramos, A. M., Trigo, R. M., Trigo, I. F., Durán-Quesada, A. M., Nieto, R., and Gimeno, L.: Moisture sources and large-scale dynamics associated with a flash flood event, in: Geoph. Monog. Ser. 200, AGU, 111–126, https://doi.org/10.1029/2012GM001244, 2012.
Link, A., Van der Ent, R., Berger, M., Eisner, S., and Finkbeiner, M.: The fate of evaporation – A global dataset, PANGAEA [data set], https://doi.org/10.1594/PANGAEA.908705, 2019.
Link, A., Van der Ent, R., Berger, M., Eisner, S., and Finkbeiner, M.: The fate of land evaporation – A global dataset, Earth Syst. Sci. Data, 12, 1897–1912, https://doi.org/10.5194/essd-12-1897-2020, 2020.
Miyamoto, Y., Kajikawa, Y., Yoshida, R., Yamaura, T., Yashiro, H., and Tomita, H.: Deep moist atmospheric convection in a subkilometer global simulation, Geophys. Res. Lett., 40, 4922–4926, https://doi.org/10.1002/grl.50944, 2013.
Molden, D.: A Comprehensive Assessment of Water Management in Agriculture: Summary, Earthscan, 40 pp., ISBN 978-1-84407-396-2, 2007.
O'Connor, J. C., Dekker, S. C., Staal, A., Tuinenburg, O. A., Rebel, K. T., and Santos, M. J.: Forests buffer against variations in precipitation, Global Change Biol., 27, 4686–4696, https://doi.org/10.1111/gcb.15763, 2021.
Pranindita, A., Wang-Erlandsson, L., Fetzer, I., and Teuling, A. J.: Moisture recycling and the potential role of forests as moisture source during European heatwaves, Clim. Dynam., 58, 609–624, https://doi.org/10.1007/s00382-021-05921-7, 2022.
Rasmijn, L. M., Van Der Schrier, G., Bintanja, R., Barkmeijer, J., Sterl, A., and Hazeleger, W.: Future equivalent of 2010 Russian heatwave intensified by weakening soil moisture constraints, Nat. Clim. Change, 8, 381–385, https://doi.org/10.1038/s41558-018-0114-0, 2018.
Richards, F. and Arkin, P.: On the Relationship between Satellite-Observed Cloud Cover and Precipitation, Mon. Weather Rev., 109, 1081–1093, 1998.
Roe, G. H.: Orographic precipitation, Annu. Rev. Earth. Pl. Sci., 33, 645–671, https://doi.org/10.1146/annurev.earth.33.092203.122541, 2005.
Salmon, J. M., Friedl, M. A., Frolking, S., Wisser, D., and Douglas, E. M.: Global rain-fed, irrigated, and paddy croplands: A new high resolution map derived from remote sensing, crop inventories and climate data, Int. J Appl. Earth. Obs., 38, 321–334, https://doi.org/10.1016/j.jag.2015.01.014, 2015.
Scheff, J. and Frierson, D.: Twenty-First-Century multimodel subtropical precipitation declines are mostly midlatitude shifts, J. Climate, 25, 4330–4347, https://doi.org/10.1175/JCLI-D-11-00393.1, 2012.
Shaw, T. A.: Mechanisms of future predicted changes in the zonal mean mid-latitude circulation, Curr. Clim. Change Rep., 5, 345–357, https://doi.org/10.1007/s40641-019-00145-8, 2019.
Shaw, T. A., Baldwin, M., Barnes, E. A., Caballero, R., Garfinkel, C. I., Hwang, Y. T., Li, C., O'Gorman, P. A., Rivière, G., Simpson, I. R., and Voigt, A.: Storm track processes and the opposing influences of climate change, Nat. Geosci., 9, 656–664, https://doi.org/10.1038/ngeo2783, 2016.
Sodemann, H.: Beyond turnover time: Constraining the lifetime distribution of water vapor from simple and complex approaches, J. Atmos. Sci., 77, 413–433, https://doi.org/10.1175/JAS-D-18-0336.1, 2020.
Staal, A., Tuinenburg, O. A., Bosmans, J. H. C., Holmgren, M., Van Nes, E. H., Scheffer, M., Zemp, D. C., and Dekker, S. C.: Forest-rainfall cascades buffer against drought across the Amazon, Nat. Clim. Change, 8, 539–543, https://doi.org/10.1038/s41558-018-0177-y, 2018.
Staal, A., Flores, B. M., Aguiar, A. P. D., Bosmans, J. H. C., Fetzer, I., and Tuinenburg, O. A.: Feedback between drought and deforestation in the Amazon, Environ. Res. Lett., 15, 044024, https://doi.org/10.1088/1748-9326/ab738e, 2020.
Stohl, A., Forster, C., Frank, A., Seibert, P., and Wotawa, G.: Technical note: The Lagrangian particle dispersion model FLEXPART version 6.2, Atmos. Chem. Phys., 5, 2461–2474, https://doi.org/10.5194/acp-5-2461-2005, 2005.
Taylor, C. M., de Jeu, R. A. M., Guichard, F., Harris, P. P., and Dorigo, W. A.: Afternoon rain more likely over drier soils, Nature, 489, 423–426, https://doi.org/10.1038/nature11377, 2012.
Teuling, A. J.: A hot future for European droughts, Nat. Clim. Change, 8, 364–365, https://doi.org/10.1038/s41558-018-0154-5, 2018.
te Wierik, S. A., Gupta, J., Cammeraat, E. L. H., and Artzy-Randrup, Y. A.: The need for green and atmospheric water governance, Wiley Interdisciplin. Rev. Water, 7, e1406, https://doi.org/10.1002/wat2.1406, 2020.
te Wierik, S. A., Cammeraat, E. L. H., Gupta, J., and Artzy-Randrup, Y. A.: Reviewing the impact of land use and land-use change on moisture recycling and precipitation patterns, Water Resour. Res., 57, e2020WR029234, https://doi.org/10.1029/2020WR029234, 2021.
Theeuwen, J.: LocalMoistureRecycling, GitHub [code], https://github.com/jtheeu/LocalMoistureRecycling, last access: 30 March 2023.
Theeuwen, J. J. E., Staal, A., Tuinenburg, O. A., Hamelers, H. V. M., and Dekker S. C.: Local moisture recycling across the globe, Zenodo [data set], https://doi.org/10.5281/zenodo.7684640, 2023.
Trenberth, K. E.: Atmospheric moisture recycling: Role of advection and local evaporation, J. Climate, 12, 1368–1381, https://doi.org/10.1175/1520-0442(1999)012<1368:amrroa>2.0.co;2, 1999.
Tuinenburg, O. A. and Staal, A.: Tracking the global flows of atmospheric moisture and associated uncertainties, Hydrol. Earth Syst. Sci., 24, 2419–2435, https://doi.org/10.5194/hess-24-2419-2020, 2020.
Tuinenburg, O. A., Hutjes, R. W. A., and Kabat, P.: The fate of evaporated water from the Ganges basin, J. Geophys. Res.-Atmos., 117, D01107, https://doi.org/10.1029/2011JD016221, 2012.
Tuinenburg, O. A., Theeuwen, J. J. E., and Staal, A.: High-resolution global atmospheric moisture connections from evaporation to precipitation, Earth Syst. Sci. Data, 12, 3177–3188, https://doi.org/10.5194/essd-12-3177-2020, 2020a.
Tuinenburg, O. A., Theeuwen, J. J. E., and Staal, A.: Global evaporation to precipitation flows obtained with Lagrangian atmospheric moisture tracking, PANGAEA [data set], https://doi.org/10.1594/PANGAEA.912710, 2020b.
Tuinenburg, O. A., Bosmans, J. H. C., and Staal, A.: The global potential of forest restoration for drought mitigation, Environ. Res. Lett., 17, 034045, https://doi.org/10.1088/1748-9326/ac55b8, 2022.
Van der Ent, R. J. and Savenije, H. H. G.: Length and time scales of atmospheric moisture recycling, Atmos. Chem. Phys., 11, 1853–1863, https://doi.org/10.5194/acp-11-1853-2011, 2011.
Van der Ent, R. J. and Savenije, H. H. G.: Oceanic sources of continental precipitation and the correlation with sea surface temperature, Water Resour. Res., 49, 3993–4004, https://doi.org/10.1002/wrcr.20296, 2013.
Van der Ent, R. J., Savenije, H. H. G., Schaefli, B., and Steele-Dunne, S. C.: Origin and fate of atmospheric moisture over continents, Water Resour. Res., 46, W09525, https://doi.org/10.1029/2010WR009127, 2010.
Van der Ent, R. J., Tuinenburg, O. A., Knoche, H. R., Kunstmann, H., and Savenije, H. H. G.: Should we use a simple or complex model for moisture recycling and atmospheric moisture tracking?, Hydrol. Earth Syst. Sci., 17, 4869–4884, https://doi.org/10.5194/hess-17-4869-2013, 2013.
Van der Ent, R. J., Wang-Erlandsson, L., Keys, P. W., and Savenije, H. H. G.: Contrasting roles of interception and transpiration in the hydrological cycle – Part 2: Moisture recycling, Earth Syst. Dynam., 5, 471–489, https://doi.org/10.5194/esd-5-471-2014, 2014.
Vecchi, G. A., Soden, B. J., Wittenberg, A. T., Held, I. M., Leetmaa, A., and Harrison, M. J.: Weakening of tropical Pacific atmospheric circulation due to anthropogenic forcing, Nature, 441, 73–76, https://doi.org/10.1038/nature04744, 2006.
Wallace, J. M. and Hobbs, P. V.: Atmospheric science: an introductory survey, in: 2nd Edn., Elsevier, ISBN 13:978-0-12-732951-2, 2006.
Wang, C. and Yang, K.: Changes in the moisture contribution over global arid regions, Clim. Dynam., https://doi.org/10.1007/s00382-022-06600-x, in press, 2022.
Wang-Erlandsson, L., Fetzer, I., Keys, P. W., Van der Ent, R. J., Savenije, H. H. G., and Gordon, L. J.: Remote land use impacts on river flows through atmospheric teleconnections, Hydrol. Earth Syst. Sci., 22, 4311–4328, https://doi.org/10.5194/hess-22-4311-2018, 2018.
Wang-Erlandsson, L., Tobian, A., Van der Ent, R. J., Fetzer, I., te Wierik, S., Porkka, M., Staal, A., Jaramillo, F., Dahlmann, H., Singh, C., Greve, P., Gerten, D., Keys, P. W., Gleeson, T., Cornell, S. E., Steffen, W., Bai, X., and Rockström, J.: A planetary boundary for green water, Nat. Rev. Earth Environ., 3, 380–392, https://doi.org/10.1038/s43017-022-00287-8, 2022.
Williams, E. and Renno, N.: An analysis of the conditional instability of the tropical atmosphere, Mon. Weather Rev., 121, 21–35, 1993.
Wunderling, N., Wolf, F., Tuinenburg, O. A., and Staal, A.: Network motifs shape distinct functioning of Earth's moisture recycling hubs, Nat. Commun., 13, 6574, https://doi.org/10.1038/s41467-022-34229-1, 2022.