the Creative Commons Attribution 4.0 License.
the Creative Commons Attribution 4.0 License.
 | 17 Nov 2022
How do inorganic nitrogen processing pathways change quantitatively at daily, seasonal, and multiannual scales in a large agricultural stream?
Dietrich Borchardt
Michael Rode
Large agricultural streams receive excessive inputs of nitrogen. However, quantifying the role of these streams in nitrogen processing remains limited because continuous direct measurements of the interacting and highly time-varying nitrogen processing pathways in larger streams and rivers are very complex. Therefore, we employed a monitoring-driven modelling approach with high-frequency in situ data and the river water quality model Water Quality Analysis Simulation Program (WASP) 7.5.2 in the 27.4 km reach of the sixth-order agricultural stream called Lower Bode (central Germany) for a 5-year period (2014–2018). Paired high-frequency sensor data (15 min interval) of discharge, nitrate, dissolved oxygen, and chlorophyll a at upstream and downstream stations were used as model boundaries and for setting model constraints. The WASP model simulated 15 min intervals of discharge, nitrate, and dissolved oxygen with Nash–Sutcliffe efficiency values higher than 0.9 for calibration and validation, enabling the calculation of gross and net dissolved inorganic nitrogen uptake and pathway rates on a daily, seasonal, and multiannual scale. Results showed daily net uptake rate of dissolved inorganic nitrogen ranged from −17.4 to 553.9 . The highest daily net uptake could reach almost 30 % of the total input loading, which occurred at extreme low flow in summer 2018. The growing season (spring and summer) accounted for 91 % of the average net annual uptake of dissolved inorganic nitrogen in the measured period. In spring, both the DIN gross and net uptake were dominated by the phytoplankton uptake pathway. In summer, benthic algae assimilation dominated the gross uptake of dissolved inorganic nitrogen. Conversely, the reach became a net source of dissolved inorganic nitrogen with negative daily net uptake values in autumn and winter, mainly because the release from benthic algae surpassed uptake processes. Over the 5 years, average gross and net uptake rates of dissolved inorganic nitrogen were 124.1 and 56.8 , which accounted for only 2.7 % and 1.2 % of the total loadings in the Lower Bode, respectively. The 5-year average gross DIN uptake decreased from assimilation by benthic algae through assimilation by phytoplankton to denitrification. Our study highlights the value of combining river water quality modelling with high-frequency data to obtain a reliable budget of instream dissolved inorganic nitrogen processing which facilitates our ability to manage nitrogen in aquatic systems. This study provides a methodology that can be applied to any large stream to quantify nitrogen processing pathway dynamics and complete our understanding of nitrogen cycling.
- Article
(1375 KB) - Full-text XML
-
Supplement
(1211 KB) - BibTeX
- EndNote


The instream processing of dissolved inorganic nitrogen (DIN) consists of complex and multiple simultaneous pathways (Hensley and Cohen, 2020). The dominant pathway processes include nitrification, denitrification, autotrophic uptake and release, heterotrophic uptake and release, and mineralization (Burgin and Hamilton, 2007; Tank et al., 2018). Disentangling these interacting processes at the reach scale is challenging because they coincide in streams and share the same DIN constituents for their substrates and products. The classic method for reach-scale DIN pathway quantification is the addition of DIN isotope tracers (Mulholland et al., 2008). Using this methodology, Mulholland et al. (2008) quantified the shares of denitrification and assimilation on total nitrate () in-stream uptake in the Lotic Intersite Nitrogen eXperiment (LINX) project in a wide range of biomes. This method's main limitation is that it is difficult to apply in higher-order streams and can only provide snapshots of the highly dynamic processes. For higher-order streams, Heffernan and Cohen (2010) developed a method of calculating mass balance using high-frequency measurements to allow the partitioning of uptake rates into assimilatory and dissimilatory pathways in a spring-fed river. To achieve a continuous estimation of assimilatory uptake, Rode et al. (2016a) correlated the daily assimilatory uptake with the gross primary production (GPP) using high-frequency oxygen and data. However, both methods rely on a robust diel pattern of concentration fluctuations, which is possibly only obtained where external inputs are well constrained and is difficult to obtain in large agricultural streams (Hensley and Cohen, 2020). Due to the lack of effective methods, quantification of DIN processing pathways in large agricultural streams remains poorly explored.
Besides, each pathway process is highly time-varying (Hensley and Cohen, 2020). As a vital DIN processing pathway, autotrophic assimilatory uptake is affected by light availability, temperature, and autotrophic biota and presents significant seasonal changes (Tank et al., 2017). Furthermore, denitrification, nitrification, and mineralization also exhibit seasonal changes due to the influences of temperature, substrate concentrations, and hydrological conditions (Burgin and Hamilton, 2007; Verstraete and Focht, 1977). Phytoplankton and benthic algae might co-exist in higher-order agricultural streams, and both of their metabolisms determine autotrophic assimilatory uptake (Durand et al., 2011; Desmet et al., 2011; Minaudo et al., 2021). The temporal changes in their relative importance for reach-scale assimilatory DIN uptake is still not well known (Jäger and Borchardt, 2018; Riis et al., 2012). Many studies have reported that DIN can be largely assimilated and fixed in benthic algae's biomass during the growing season (Mulholland et al., 2008). However, few studies have paid attention to the fate of assimilated nitrogen (N) during the non-growing season (Riis et al., 2012; Tank et al., 2018). It is unclear whether the DIN release can exceed gross uptake in the non-growing season and if temporally decoupled DIN uptake and release can cause a seasonal shift in the DIN release from stream biomass. Von Schiller et al. (2015) quantified N release by comparing gross and net uptake and found that the streams remained at a biogeochemical steady state on a timescale of hours. However, the knowledge about the DIN release on longer timescales, such as seasons, still lacks due to measurement constraints (von Schiller et al., 2015). In addition, considering the highly dynamic nature of the processes, interpolating and aggregating instream DIN uptake rates from snapshot experiment results in the growing season to estimate how effective a river reach is in processing DIN at annual or multiannual scales can cause uncertainty. In order to gain overarching insights into the DIN fate in streams, it is therefore necessary to quantify the DIN pathways not only on a daily or weekly basis within the growing season but also continuously throughout the hydro-climatic year and beyond.
Instream water quality models offer synthesis tools to study spatiotemporal DIN variation and turnover processes in streams/rivers (Wagenschein and Rode, 2008; Raimonet et al., 2015; Huang et al., 2019). However, the infrequent temporal resolution of monitoring data for model input and testing commonly restricts the reliability of modelling instream DIN processing (Khorashadi Zadeh et al., 2019). A limited temporal resolution of the data can result in the equifinality of the model parameter sets and considerable model uncertainties due to the insufficient ability to validate single internal reaction processes (Khorashadi Zadeh et al., 2019; Huang et al., 2021). Emerging high-frequency monitoring techniques can provide a higher temporal resolution of the boundary conditions and support the robust calibration and validation of data-hungry mechanistic models (Hamilton et al., 2015; Minaudo et al., 2018; Pathak et al., 2021). Thus, combining emerging high-frequency monitoring techniques and river water quality modelling may allow the continuous quantification of instream DIN processing pathways and increase their reliability (Rode et al., 2016b).
Therefore, in this study, DIN processing pathways were examined using a 5-year paired high-frequency water quality dataset from a 27.4 km reach of the sixth-order agricultural Bode stream in central Germany and a complementary set-up of the river water quality model, the Water Quality Analysis Simulation Program (WASP) 7.5.2. With this methodological approach, the instream rates of gross and net DIN uptake, denitrification, and assimilatory uptake and release by phytoplankton and benthic algae were quantified at daily, seasonal, and yearly scales. The objectives of this study are to answer the following three questions: (1) how temporally variable are the DIN processing pathways at a daily scale? (2) Are there seasonal shifts in the role of river reach as the N sources and sinks? If so, what is the pathway dominating this shift? (3) Based on the continuous multiyear DIN budget, how effective is the river reach in processing DIN, and what are its dominant pathways? Finally, our findings highlight the utility and value of high-frequency data for supporting river water quality modelling by allowing continuous quantification of instream N uptake pathways and thus improving our understanding of the biogeochemical functioning of the large streams regarding the N cycling and fate.
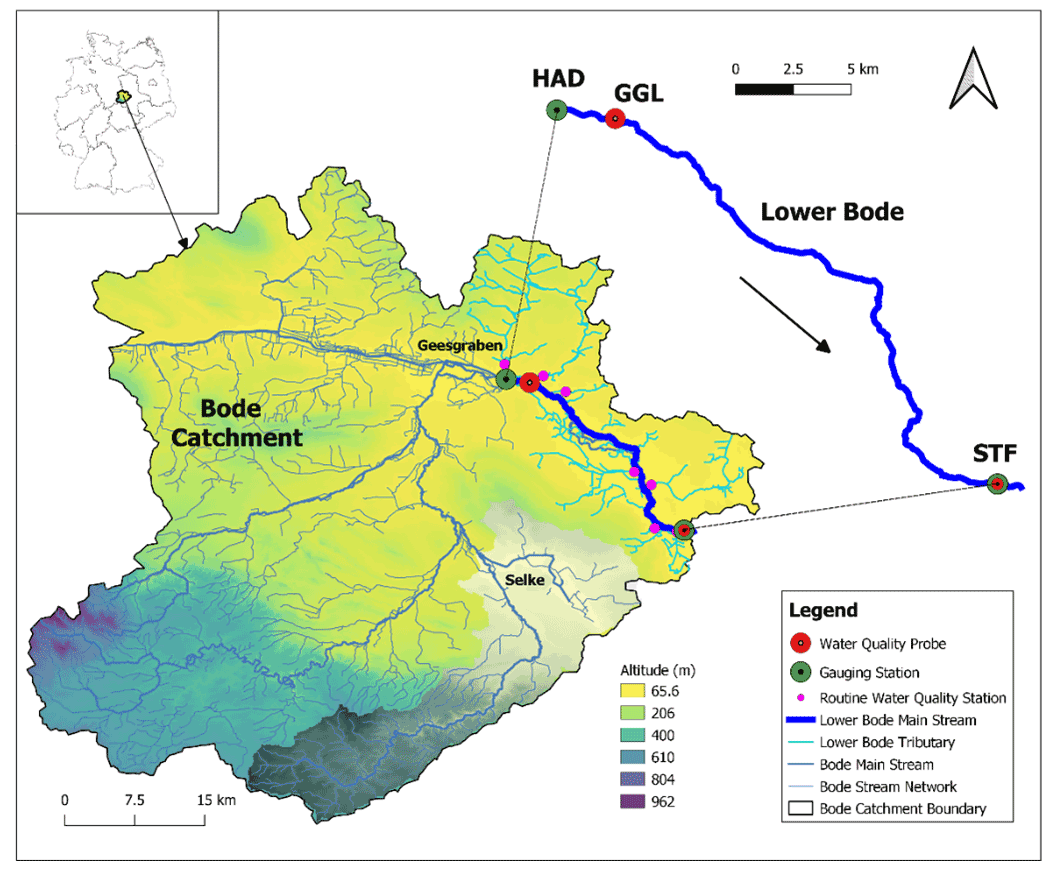
Figure 1Bode catchment, stream networks, digital elevation model (DEM), study reach of the Lower Bode, and site description of the Lower Bode. The red circles represent the high-frequency water quality sensors. The green circles denote the gauge stations. The small pink circles depict the routine water quality monitoring stations of the tributaries. HAD, GGL, and STF stand for the monitoring station names of Hadmersleben, Groß Germersleben, and Staßfurt, respectively. The grey shaded area represents the Selke sub-catchment.
2.1 Study site
The Bode river is a 169 km long sixth-order stream in Saxony-Anhalt, originating in the Harz mountains and discharging into the Saale. It drains a watershed area of 3270 km2. The Bode catchment is one of the most intensively monitored areas within the Terrestrial Environmental Observatories (TERENO) network (http://www.tereno.net, last access: 7 November 2022) operated by the Helmholtz Centre for Environmental Research (UFZ). The land use within the basin varies along a longitudinal gradient, with the headwaters dominated by forests, while the lower reaches are dominated by intensive agriculture and partly by urban land. Due to intensive agricultural activities, the Bode river is characterized by high concentrations.
We studied a 27.4 km reach of the Lower Bode river between Groß Germersleben (GGL) and Staßfurt (STF), with two discharge gauging stations at both ends (Fig. 1). The land use is mainly agricultural and, to a minor degree, urban. The mean stream width is 20 m. The mean river depth of the reach is approximately 1 m. In the summer low flow period, the river depth is about 0.5 m, and during the high flow period in winter, it can be up to 2–3 m high. The stream bed substrate is sand and small gravel. The reach has a mean river slope of 0.4 m km−1, with rectangular or trapezoidal cross sections. There are three weirs installed in the reach. The original meandering reach has been mostly straightened or re-routed artificially over the past century (LHW, 2012). A line of deciduous trees on the banks only partly shade the reach. The insufficient shading and open canopy allow high irradiance at the water surface and the subsequent development of phytoplankton and benthic algae. Note that benthic algae refer to the whole primary producer community in benthic habitats, including periphyton and macrophytes.
2.2 Hydrological and water quality data
Discharge (Q) data at 15 min intervals were obtained at the gauging station Hadmersleben (HAD), which is located 2.7 km upstream of the water quality station GGL, and at the downstream station STF from the hydrological state authority of Saxony-Anhalt (State Agency for Flood Protection and Water Management – LHW). We assume that discharge at station HAD is also valid for station GGL because no lateral flow contributes to the reach between the two stations.
In the Lower Bode, lateral inputs were not significant compared to the magnitude of the inflow from the main stem (Fig. S1 in the Supplement). Daily discharges of the eight small tributary streams within the study reach were calculated based on monthly discharge measurements from LHW and by the specific discharge method. The reference gauging station measures daily Q at the outlet of a similar stream, Geesgraben, which is about 0.5 km upstream of HAD (Fig. 1). Detailed descriptions of the Q estimations of the streams are provided in Sect. S1 in the Supplement. The sum of the tributary flows accounted only for 5.88 % of the upstream inflow over the whole study period. The percentage error of flow balance (Eq. S2) between GGL and STF was +0.97 % (a positive value means that the sum of inflows was higher than the outflow). Targeted on the low flow period, the percentage error of flow balance was only +0.59 % for the extreme summer low flow period in 2018. These small errors, both on a multiannual basis and for the extreme summer low flow period, are a direct indication that lateral groundwater exchange with the watercourse in the study reach does not significantly affect the water balance (Sect. S1). Hourly solar radiation was provided by the German Weather Service (DWD). All data were taken for 5 years (01 January 2014–31 December 2018).
Paired high-frequency water quality sensors were installed at GGL and STF. Water temperature (WT), dissolved oxygen (DO), pH, and chlorophyll a (chl a) were measured with a YSI 610 multiparameter probe at 15 min intervals. measurements were also conducted at 15 min intervals using a TriOS ProPS UV sensor with an optical path length of 10 mm. Self-cleaning of the sensor was done with air pressure before every measurement. Maintenance of all sensors, including manual cleaning and calibration, was done monthly. All high-frequency water quality measurements were matched with Q by date and time, except chl a. Chl a was only measured from spring to autumn, typically from April until November. All high-frequency data were screened to eliminate outliers, based on Grubb's test, using a moving window method for post-processing. Additionally, the sensor data curves were adjusted to the laboratory measurements from the grab samples by linear regression.
Grab samples were collected monthly for the study period at both stations, filtered, and analysed for , ammonium (), total nitrogen (TN), orthophosphate (), total phosphorus (TP), and dissolved organic carbon (DOC) using standard methods (Rode et al., 2016a). Monthly 7 d biochemical oxygen demand (BOD7) at HAD and STF were obtained from the Saxony-Anhalt Water Service data portal (GLD; https://gld.lhw-sachsen-anhalt.de/, last access: 7 November 2022) for the study period. The molar carbon to nitrogen ratio () of the benthic algae in the Lower Bode is available in Kamjunke et al. (2015), with a value of 9.3. In this reach, the dominant taxonomic composition of benthic algae in biofilms was diatom (Kamjunke et al., 2015).
Bi-monthly routine measurements of , , TP, DO, and BOD7 for the eight small tributary streams were obtained from GLD. As all the streams are in agricultural areas, we assumed that concentrations are likely to be temporally variable and change with Q. Thus, their concentration–discharge (C–Q) relationships were evaluated for all tributary streams with the long-term monitoring data from 1994 to 2016. All C–Q relationships for the tributaries with available data exhibit enrichment responses with positive slopes (Table S1 in the Supplement). The daily concentration for each tributary was calculated by its C–Q linear regression.
Table 1Areal rates (in ) of DIN-related processes in the advanced eutrophication module of WASP 7.5.2∗.
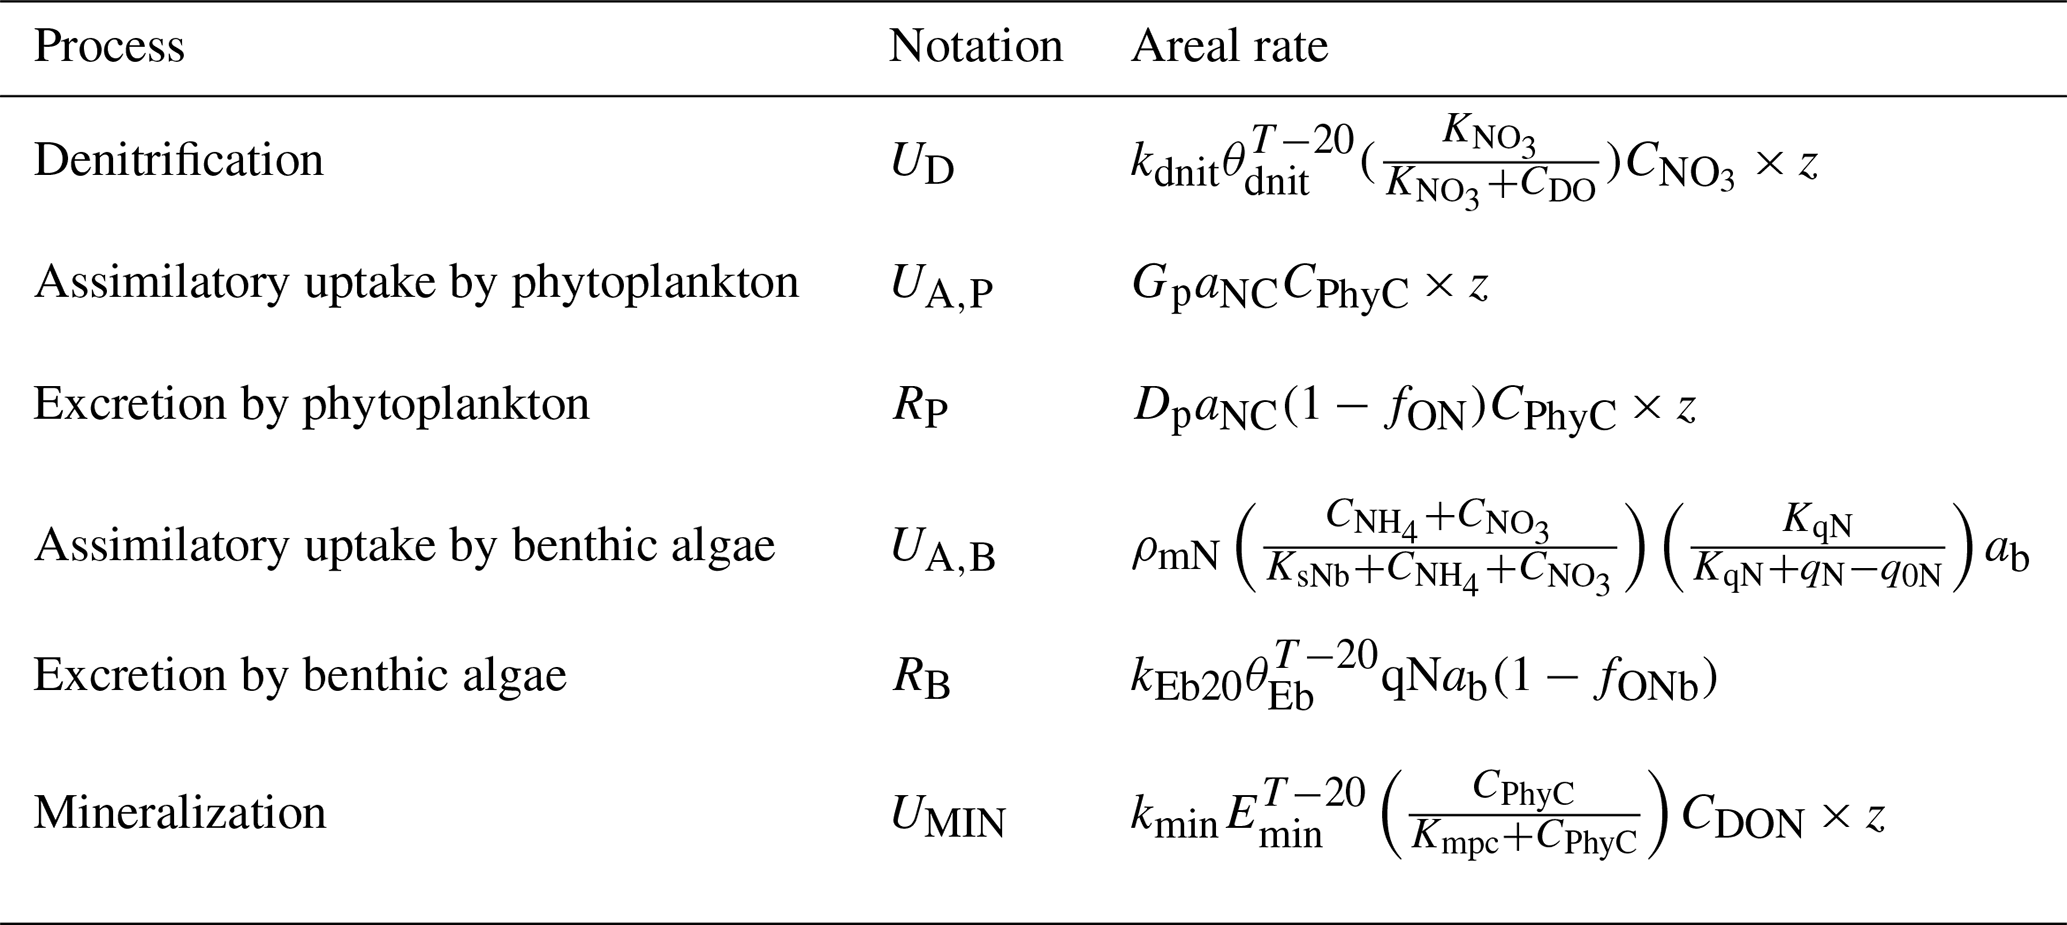
∗ Note that we used milligrams of N per square metre per day as the unit for areal rates in Sect. 3 and Sect. 4, which needs multiplying the rate values calculated in the table by 1000. The parameters used for the calculations are shown in Table S2. CDO, , CPhyC, , and CDON represent the concentrations of DO, , phytoplankton biomass carbon, , and DON in milligrams per day. qN represents algal cell N in milligrams of N per gram of dry-weight biomass and ab represents the bottom algal biomass in grams of dry-weight biomass per square metre. z denotes the water depth (in meters).
2.3 Water quality modelling
2.3.1 Model description
WASP 7.5.2 advanced eutrophication module developed by the United States Environmental Protection Agency (US EPA) is a river water quality model including nitrogen and phosphorus cycling, dissolved oxygen–organic matter interactions, and kinetics of both phytoplankton and benthic algae (Fig. S2) (Wool et al., 2020). Its DIN processing equations characterize denitrification, assimilatory uptake and excretion by phytoplankton, assimilatory uptake and excretion by benthic algae, mineralization, and nitrification (Table 1). WASP 7.5.2 can simulate the diurnal dynamics of water quality variables (Wool et al., 2002) and derive its outputs at the resolution of 15 min intervals, allowing the full use of high-frequency data.
2.3.2 Model set-up
The WASP model was set up for the 27.4 km study reach of the Lower Bode between GGL and STF for 5 years (01 January 2014–31 December 2018). The entire reach was divided into 34 model segments, with an average length of 806 m. Average segment riverbed morphology was characterized by 413 cross-sectional profiles provided by LHW (LHW, 2012). The upper boundary condition was forced by the 15 min interval Q and monthly BOD7 at HAD, 15 min interval for , DO, and chl a, and monthly , , and TP at GGL. The lateral boundary conditions were defined by the daily Q and concentrations and bi-monthly , , TP, DO, and BOD7 concentrations of the eight tributaries. Environmental conditions, including WT and solar radiation, were provided with the data mentioned in Sect. 2.2. Hydrological and water quality variables were simulated with variable time steps smaller than 1 min. All the input data at different temporal frequencies were linearly interpolated to fit the computation time step of the WASP model. Generally, low-frequency data also followed consistent seasonal patterns according to multiannual records like, for example, in Fig. S8.
2.3.3 Sensitivity analysis, calibration, and validation
Before calibration, a sensitivity analysis (SA) was conducted to screen the parameters significantly influencing model outcomes. The 31 parameters related to the DIN processes were defined with uniform distribution within the ranges previously reported (Table S2). The elementary effects (EEs) method was used, and the analysis was performed using the SAFE (Sensitivity Analysis For Everybody) Toolbox (Pianosi et al., 2015). The objective functions were defined by the root mean square error (RMSE) coefficients of , , DO, and chl a. The most sensitive parameters for and , and additional parameters sensitive to DO and chl a, were identified. After SA, the most identifiable parameters were automatically calibrated using the Gauss–Marquardt–Levenberg algorithm with OSTRICH v17.12.19 (Matott, 2017). The ranges of the selected parameters were defined in the same way as in the SA (Table S2). The objective function was defined as the weighted sum of square error of the four variables (, , DO, and chl a) at STF for the calibration period of 01 January 2014–31 December 2015. We assigned the values to the other, less sensitive, parameters within the ranges frequently reported (Wool et al., 2002). After calibration, we evaluated the model performance in Q and water quality variables for the validation period of 1 January 2016–31 December 2018 using the following three criteria: Nash–Sutcliffe efficiency (NSE) coefficient, percent bias (PBias), and RMSE.
We calculated daily GPP (in grams of oxygen per squared meters per day) with the 15 min interval DO data using the single-station method (Rode et al., 2016a) and compared it with the sum of GPP of phytoplankton (GPPp) and benthic algae (GPPb) calculated with the WASP 7.5.2 model results, as follows:
where Gp is the phytoplankton growth rate (d−1), CPhyC represent the concentration of phytoplankton biomass carbon (mg C L−1), ROC represents oxygen to carbon ratio (; Table S2), z denotes the stream depth (m), FGb is zero-order growth rate for benthic algae (gD m−2 d−1; D refers to biomass dry-weight), and ADC represents detritus to carbon ratio (; Table S2). This procedure provides a process validation in addition to a variable validation, especially for phytoplankton and benthic algae growth parameters.
2.4 Quantification of DIN uptake rates
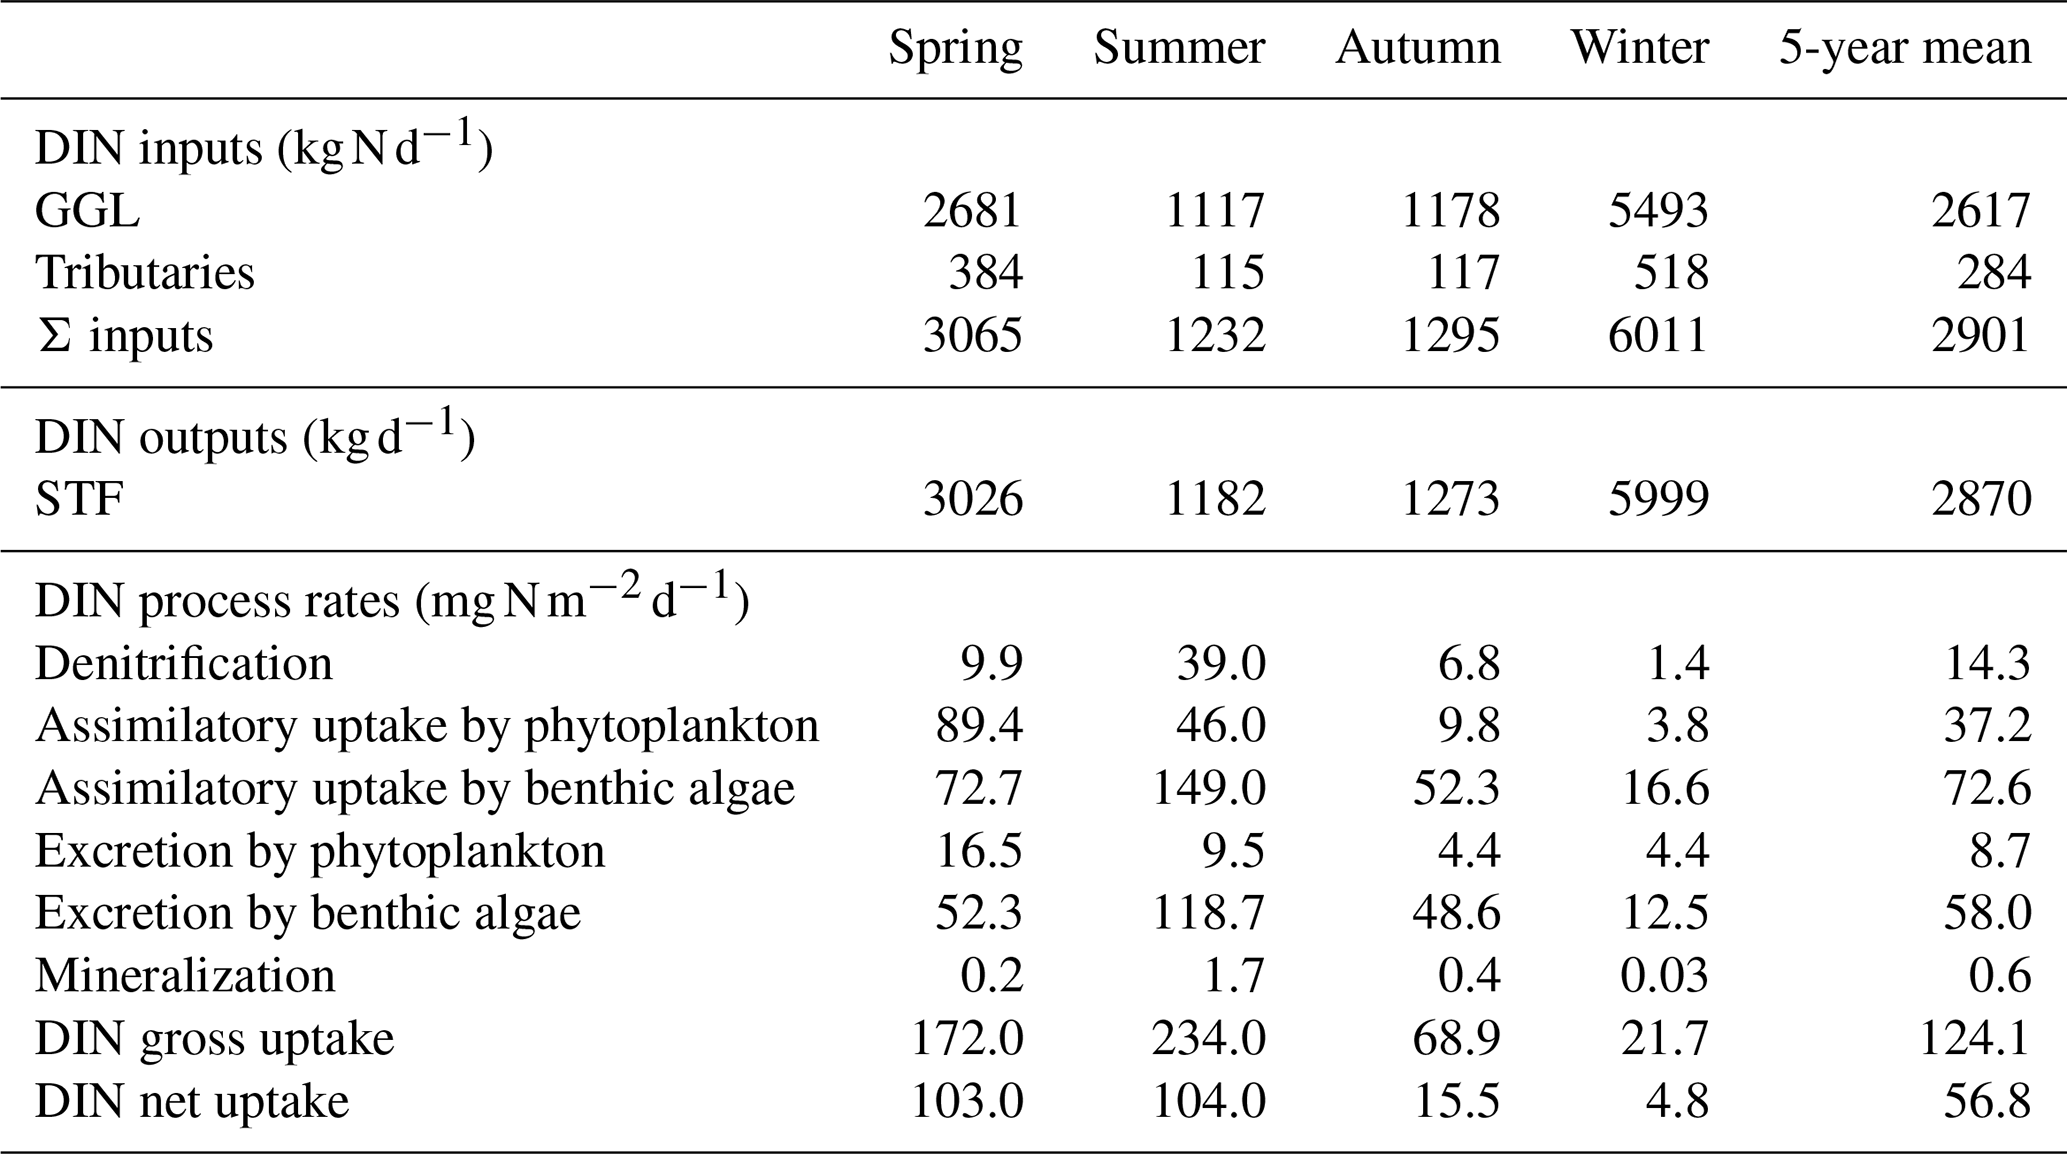
DIN input and output (in kg N d−1) were defined as the sum of the and loadings at GGL and tributaries and the loading at STF, respectively. Areal rates of DIN-related processes (in ) were calculated for each segment with the equations in Table 1 and were added up over the study river reach. The DIN inputs, output, and process rates were averaged daily, seasonally, and for the whole 5-year period. The seasons start with spring on 1 March, summer on 1 June, autumn on 1 September, and winter on 1 December.
The gross DIN uptake rate (UGROSS; in ) was calculated as the sum of denitrification rate (UD) and gross assimilatory uptake rate by phytoplankton (UA,P) and by benthic algae (UA,B), as follows:
The net uptake rate was calculated by subtracting the DIN release rates by phytoplankton (RP), benthic algae (RB), and mineralization (UMIN) from UGROSS, as follows:
Table 2Identifiable parameters related to DIN processing and their optimized values.

∗ Sources of the literature values can be found in Wool et al. (2002) and Martin et al. (2017).
The percentage gross uptake of total input loading (EGROSS; in %) and the percentage net uptake (ENET; in %) were calculated as follows:
where A represents the riverbed area of the study reach in square metres, I represents the total DIN input in kilograms per day, and 10−6 is the unit converted from milligrams per day to kilograms per day. The net assimilatory uptake rates by phytoplankton () and by benthic algae () were calculated by subtracting release rates from gross uptake rates, as follows:
For a better comparison of the uptake rate results of this study with others, we calculated the gross and net uptake rate ( and ) and gross and net uptake rate ( and ) separately (see a detailed description in Sect. S2).
3.1 Modelling performance and physio-chemical characteristics
The parameter sensitivity ranking results showed that the parameters related to benthic algae metabolism, including FGb20, ρmN, KLb, Khnxb, kDb20, KqN, kRb20, fONb, kEb20, and θGb, influenced the goodness-of-fit of the measured and simulated and the most (Fig. S3; Table 2). Following those, the parameters related to denitrification and phytoplankton processes, including kdnit and kGmax, were also screened as the identifiable parameters (Fig. S3). The most sensitive parameters for simulating N dynamics are related to benthic algae and phytoplankton turnover and denitrification.
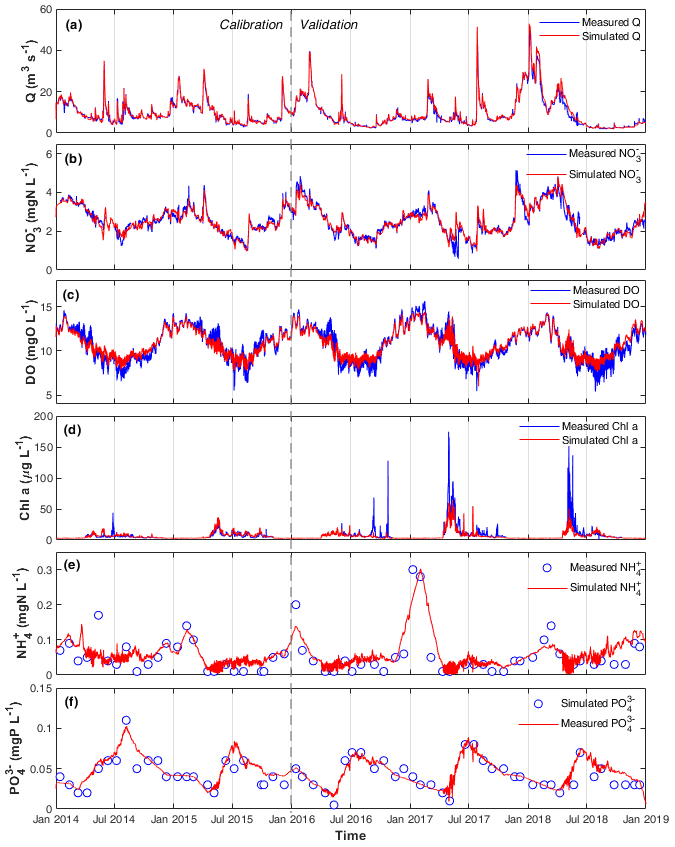
Figure 2Measured and simulated (a) Q, (b) , (c) DO, (d) chl a, (e) , and (f) concentrations in the calibration and validation periods at the STF station.
Table 3Statistics of measurements and model evaluation criteria (NSE, RMSE, and PBias) of calibration and validation results at the STF station of the Lower Bode river.
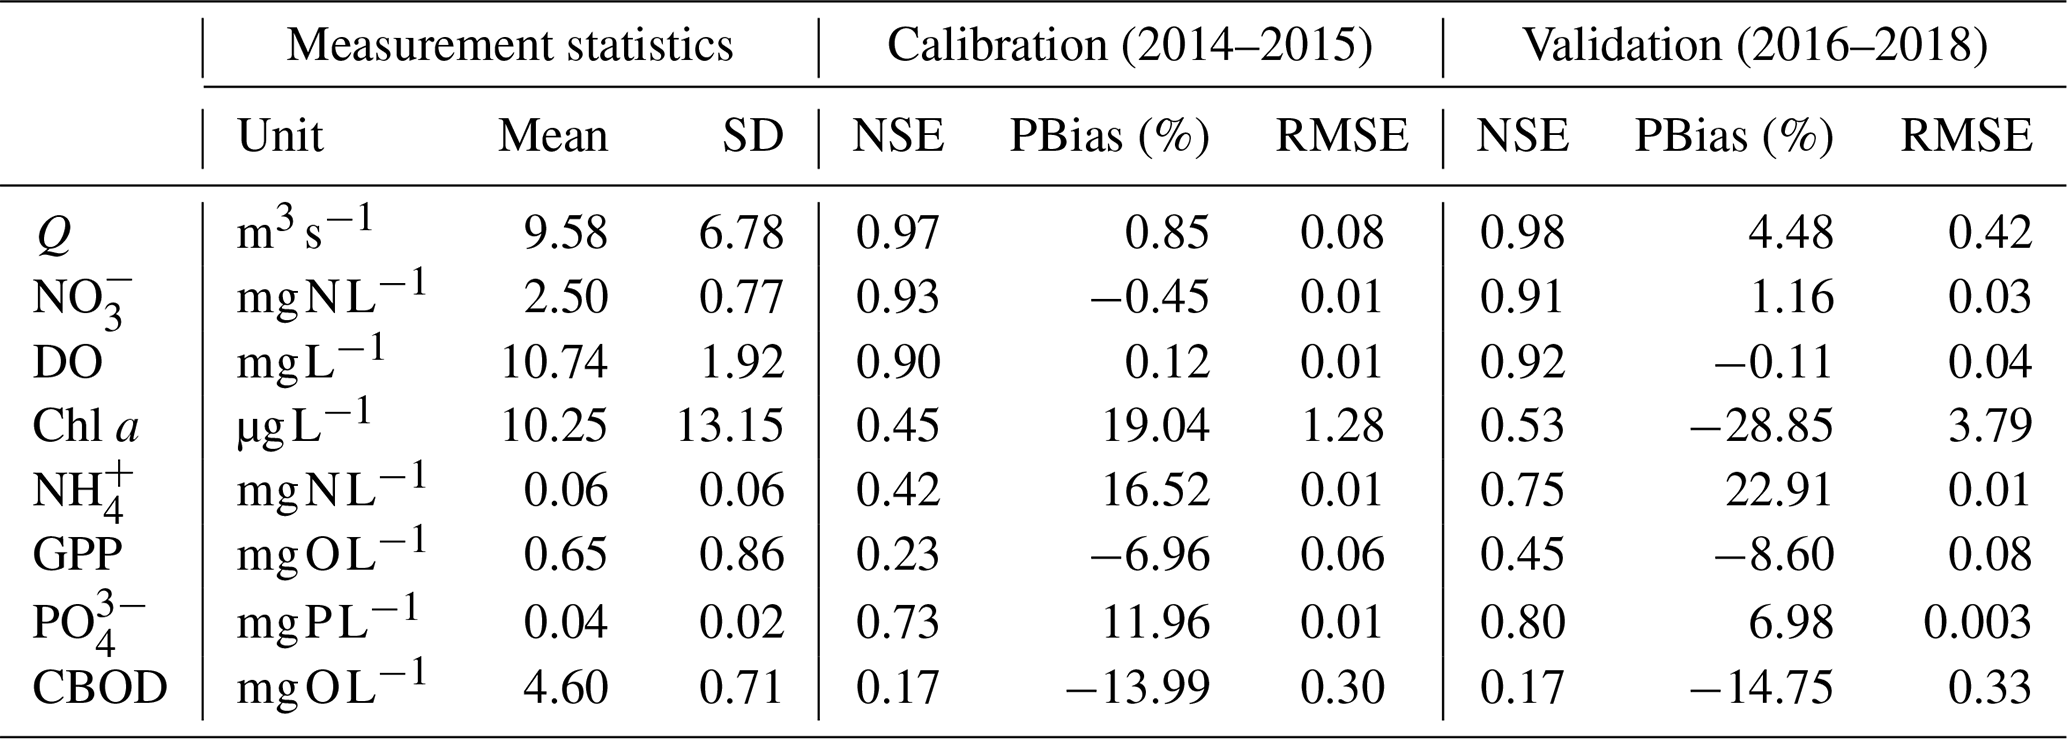
The optimized model parameters using automatic calibration are presented in Table 2. Simulation results of Q, , DO, chl a, and and the corresponding evaluation criteria for calibration (2 years) and validation periods (3 years) are shown in Fig. 2 and Table 3. The PBias was lower than 5 %, and the NSE was higher than 0.90 between the simulated and measured high-frequency data of Q, , and DO for both periods (Table 3). Our chl a simulation results captured the timing of blooms, peaks, and decline of phytoplankton (Fig. 2d). The NSE of chl a was relatively low, partly due to the leverage effect of missing the extremely high chl a concentrations only on some days during the bloom periods on the overall performance criteria. The underestimation of the spring bloom peaks during the validation period is due to the compensation of reproducing the spring peaks using the same set of parameters during the calibration period. The WASP model simulations of , , and carbonaceous BOD (CBOD) also mimicked the seasonality well (Figs. 2e and f, S4a, and Table 3).

Figure 3(a) Comparison of the daily GPP calculated by WASP (simulated GPP) and by the single-station method (measured GPP). (b) The two components of simulated GPP, i.e. GPP by phytoplankton (GPPp) and by benthic algae (GPPb) are shown.
A clear seasonal pattern of Q can be observed, with higher values in winter and lower ones in summer (Fig. 2a). Q averaged 9.58 m3 s−1, with a minimum of 2.05 m3 s−1 during the extreme low flow in August 2018 and a maximum of 49.49 m3 s−1 during winter high flow in January 2018 (Table 3; Fig. 2a). concentration was higher in winter when Q was high and lower in summer when Q was low (range 0.57–5.15 and mean 2.50 mg N L−1; Fig. 2b). By comparing the concentrations of and , we found that was the dominant form of DIN in the Lower Bode, accounting for more than 97 % of the total DIN (calculated according to their mean values in Table 3). DO concentrations were higher in winter and lower in summer (range 5.40–15.63 and mean 10.74 mg L−1; Fig. 2c). Oxygen daily amplitudes were most pronounced during the spring phytoplankton bloom period and the summer low flow period. In the extreme summer low flow period of 2018 (validation period), simulated DO amplitudes were smaller than the measured ones (Fig. S5), indicating an underestimation of primary production. Phytoplankton blooms were observed in spring between April and late May, especially in 2017 and 2018, with peak concentrations of chl a higher than 150 µg L−1 (Fig. 2e). A good fit of the simulated and observed diurnal patterns of the chl a concentration were observed for the summer low flow (Fig. S5). and concentrations reached the lowest value during the spring blooms. concentration usually recovered to the highest value in summer, while reached the high level in winter. Note that the diurnal patterns of and were observed in the simulation results with a minimum in the afternoon and a maximum around dawn. However, their diurnal variations were smaller than the seasonal ones (Fig. S5).
Simulated GPP from WASP reflected those calculated by the single-station method (Fig. 3; Table 3). GPP showed two seasonal peaks each year, with one in spring and one in summer (Fig. 3a). The first peak in spring corresponded to the peak of phytoplankton chl a concentrations (Fig. 2d), while the other corresponded to the peak of benthic algae biomass (Fig. S4b). Accordingly, the model results showed that GPP was dominated by phytoplankton growth in spring, while in summer, GPP was controlled by benthic algae (Fig. 3b).
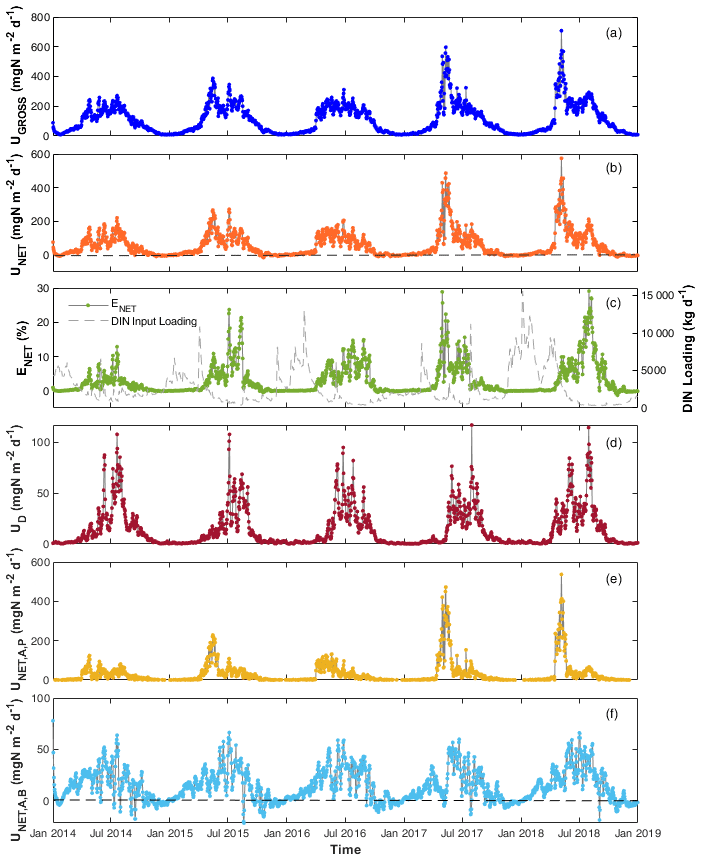
Figure 4Daily DIN (a) gross uptake rate (UGROSS), (b) net uptake rate (UNET), (c) percentage net uptake (ENET), (d) denitrification rate (UD), (e) net uptake rate by phytoplankton (), and (f) by benthic algae () in the Lower Bode river (2014–2018). Black dashed lines in panels (b) and (f) are zero lines to better show that the net N uptake is often negative in autumn and winter.
3.2 Daily DIN uptake rates
Daily DIN gross uptake rate (UGROSS) averaged 124.1 and ranged from 7.9 to 707.9 (Table S3). The daily net uptake rate (UNET) averaged 56.8 and ranged from −17.4 to 553.9 . Contrary to the seasonal trends of and concentrations, higher UGROSS and UNET were primarily found in spring and summer, whereas the rates were lower in autumn and winter, even with negative UNET (Fig. 4a and b). The two highest peak values appeared in the spring of 2017 and 2018 when phytoplankton bloomed and the chl a level peaked (Fig. 4a and b). The UGROSS and UNET increased significantly with the bloom formations and dropped with their vanishing. In summer, UNET was high most of the time until it decreased towards September (Fig. 4b). The negative values of UNET in autumn and winter showed that the river reach released net DIN. Consistent with the uptake rate, ENET was also higher in spring and summer and lower in autumn and winter. However, the efficiencies in summer were generally even higher than those in spring because of the lower DIN loading in summer (Fig. 4c). The percentage daily net uptake (ENET) peaked at 29.1 % during the extreme summer low flow of August 2018 (Fig. 4c). The variability in the daily net uptake rate by phytoplankton () was more extensive than that of benthic algae (; Fig. 4e and f). We observed constant negative in autumn and winter when RB was higher than UA,B. was also negative but closer to zero compared with in autumn and winter. The daily denitrification rate (UD), as the only N removal process, averaged 14.1 and ranged from 0.2 to 117.1 (Fig. 4d).
Table 4Seasonal DIN budget including inputs, outputs, and process rates in the Lower Bode (average results from 2014 to 2018).
3.3 Seasonal and multiannual pattern of DIN uptake
DIN fluxes exhibited evident seasonal variation, with the highest loadings in winter, accounting for more than half of the total fluxes in the year (Table 4). The seasonal rankings of both averaged DIN gross and net uptake rates were summer > spring > autumn > winter (Table 4). In spring, both the DIN gross and net uptake were dominated by the phytoplankton uptake pathway. In summer, benthic algae assimilation dominated the gross DIN uptake. However, the contribution of benthic algae to net uptake was limited due to the elevated excretion rate by higher temperatures. Besides, the denitrification rate increased significantly in summer, accounting for 16.7 % of the gross uptake and 37.5 % of the net uptake in summer. Thus, the three DIN processing pathways contributed similar shares of DIN net uptake in summer. It should be noted that the averaged net DIN uptake by benthic algae was found to be positive in autumn and winter despite many negative daily values. One explanation is that the net uptake was calculated only for DIN. In the WASP model, the algae uptake uses two forms of N source, i.e. and , and they excrete in the two forms of DON and . The organic fraction of excreted N (fONb; Table 2) for benthic algae was set to 0.21 in the model after calibration. From the perspective of reactive N (DIN + DON; Nr), benthic algae in fact played the role of the Nr source in autumn (48.6/(1–0.21) > 52.3; Table 4).
The 5-year average UGROSS and UNET were 124.1 and 56.8 , respectively. On a 5-year basis, the gross uptake accounted for 2.7 % of the total DIN input loading, and the net uptake accounted for 1.2 % of total loading of the study reach in the Lower Bode. UGROSS via different pathways ranked as an assimilatory uptake by benthic algae (72.6 ) > assimilatory uptake by phytoplankton (37.2 ) > denitrification (14.3 ). In contrast, UNET ranked as phytoplankton net uptake (28.5 ) > benthic algae net uptake (14.6 ) > denitrification (14.3 ).
4.1 Seasonal role shift and multiannual performance of instream DIN processing
The DIN gross and net uptake rates in the Lower Bode showed large seasonal variability, with 85 % of the gross and 91 % of the net uptake occurring in the growing seasons, i.e. spring and summer. Thus, the uptake during the growing season dominates the annual uptake amount. values in the growing season in the Lower Bode are comparable to those measured in rivers of similar size from other studies, e.g. the Weiße Elster in Germany (Kunz et al., 2017) and six subtropical streams in Florida (Hensley et al., 2014; for more comparison, see Sect. S3).
Starting from autumn in October, net releases began to appear, and the DIN net release rate could reach 17.4 . The net release phenomenon can last until January of the following year. It is worth noting that the net release phenomenon was rarely reported in previous studies (von Schiller et al., 2015). One important reason is that most previous measurements were taken by snapshot experiments, which were mainly conducted in the growing season with high biological activity (Mulholland et al., 2008). Still, knowing the net release rate and timing of the shift is also essential. As the net release occurs in the Lower Bode only in autumn and winter, it may not boost downstream ecosystem productivity as the light availability, temperatures, and residence time (Fig. S4c) are not favourable in these seasons. The reliable estimation of instream DIN release and timing of the functional shift from net uptake to release can benefit from continuous high-frequency measurements.
The net release is caused by the DIN excretion by primary producers (mainly benthic algae) overpassing the denitrification and assimilatory uptake. Excretion occurs during the whole growing season, but it is more than balanced by denitrification and assimilatory uptake. In autumn, the two removal processes are losing importance, which leads to a net release. It is challenging to observe the net release from a short-term observation (in hours) because N has a “round-trip ticket” to the benthic algae, and the net N uptake can be a quasi-equilibrium (von Schiller et al., 2015). Estimates of the flux of immobilized N back to the water column in the non-growing season have been overlooked for a long time (von Schiller et al., 2015; Riis et al., 2012; Tank et al., 2018). Still, it is critical for our understanding of the entire instream N processing. We overvalue the role of streams in N uptake if we do not consider the N release phenomena.
Analysing the seasonality of the DIN uptake can help us understand the multiannual performance of the study reach in processing DIN. The 5-year average ENET in the Lower Bode was only 1.2 %, despite the highest net uptake percentage being close to 30 % in the growing season at the daily scale. By only looking at the results from the experiments in the growing season, we might have an impression that the river is very efficient at removing N generally. However, the input DIN loadings of the growing season (spring + summer) accounted for only 37 % of the total input loadings for the whole year (calculated from Table 4). In the Lower Bode, nitrate concentration is positively correlated with discharge, which can be observed in many other agriculture streams in Europe (Moatar et al., 2017). The Lower Bode receives higher N input loadings but becomes less efficient at removing N in the non-growing season when hydraulic conditions (Fig. S4c), temperatures, and light were less favourable for instream uptake processes. Moreover, there is also a seasonal shift from net DIN uptake to net DIN release in an annual cycle. This results in its average net DIN uptake percentage of only 1.2 % on a multiannual basis. From this study, we learnt that the simple aggregation of instream DIN uptake from snapshot experiment results in the growing season might cause significant uncertainties in estimating the annual DIN instream uptake.
4.2 Benthic algae and phytoplankton uptake pathways
The DIN assimilation by benthic algae accounts for 59 % of the annual gross uptake of the Lower Bode. In contrast, the net DIN uptake by phytoplankton dominates the annual net uptake of the Lower Bode (50 %; Table 4). Our results showed that assimilatory DIN uptakes by phytoplankton and benthic algae both play an essential role in the annual DIN uptake budget in the Lower Bode. The sixth-order Lower Bode belongs to the mid-reach river system with a transitional size between small streams and large rivers. In the fourth-order stream of Selke, which is upstream of Bode (Fig. 1), benthic algae dominate the assimilatory DIN uptake (Rode et al., 2016a). In contrast, in the eighth-order Elbe river downstream of Bode, phytoplankton dominates the assimilatory DIN uptake (Kamjunke et al., 2021). In the transitional sixth-order Lower Bode, phytoplankton gains importance in the DIN assimilation. Still, both phytoplankton and benthic algae play a critical overlapping role in assimilatory DIN uptakes at this stream order.
The shift of assimilatory DIN uptake from benthic algae dominated to phytoplankton dominated across stream orders demonstrates the river continuum concept (RCC) well. According to the RCC, mid-reach river systems are broader, deeper, and less strongly influenced by dilution. Autochthonous primary production can occur through planktonic (typically stream orders 5–7) development (Durand et al., 2011; Vannote et al., 1980). Recently, Yang et al. (2021) provided evidence of a regime shift in algal biomass over stream order. Our results further supplemented the algal role transition in terms of DIN uptake across the river network.
Despite both important roles for annual assimilatory DIN uptake, phytoplankton and benthic algae had different dominant seasons determined by their characteristics and interaction. Phytoplankton formed outbreaks in spring, usually May, especially in 2017 and 2018, whereas benthic algae biomass peaks in the midsummer, typically July. The spring phytoplankton peaks are often observed in many large rivers, e.g. the Elbe, Rhine (Hardenbicker et al., 2014), and Danube (Reynolds and Descy, 1996). The formation of the spring bloom is suggested to be related to the seasonal changes in solar irradiation, water temperature, nutrient availability, and flow condition (Reynolds and Descy, 1996). The most decisive factor of the phytoplankton bloom in the Lower Bode is the seeding chl a concentration at the upstream site (Fig. S1d). It basically shapes the timing of the start, peak, and disappearance, as well as the extent, of the spring phytoplankton bloom for the whole study reach (Fig. S1d). Favourable instream environment conditions can promote the phytoplankton growth within the study reach, further intensifying the spring bloom peak downstream of the reach. The dominant taxa of phytoplankton were identified as diatoms in the Lower Bode (Kamjunke et al., 2015). The average phytoplankton chl a levels in the Lower Bode reached the highest levels when the water temperature was between 10–14 ∘C (Fig. S6), which fits the optimal growth temperature of diatoms (Chapra, 2008). As the light availability and other conditions were also favourable in spring, phytoplankton further developed within the study reach, consequently assimilating large amounts of DIN. The disappearance of the spring phytoplankton bloom is mainly driven by the decreasing phytoplankton concentration at the upstream boundary.
In contrast with phytoplankton, benthic algae had the highest biomass and DIN assimilatory uptake in July. A similar seasonal peaking time of benthic algae was also found in other rivers (Desmet et al., 2011; Glasaitė and Šatkauskienė, 2013). The development of benthic algae in summer can be explained by the different environmental factors such as increasing temperature, decreasing turbulence, and grazing during the summer months (Glasaitė and Šatkauskienė, 2013, Jäger and Borchardt, 2018). Note that here benthic algae refers to the whole primary producer community in benthic habitats in our model, as we did not distinguish periphyton and macrophytes. Macrophytes are increasingly important in some large rivers in Europe, e.g. Seine, Moselle, Loire, and Ebre, because of invasive species (Minaudo et al., 2021). However, periphyton is recognized as being dominant in the benthic habitats in the study reach, despite some macrophytes leading to a small partition (LHW, 2012). Although the newest version of WASP 8 can describe them separately (Wool et al., 2020), we preferred avoiding increasing the model structure complexity by avoiding the introduction of more model parameters with no sufficient data to identify in our modelling practice. More investigations are needed to determine the reason for the seasonal shift in phytoplankton and benthic algae dominance, especially considering the development of phytoplankton in the course of the whole Bode river.
The differences between phytoplankton and benthic algae in the DIN assimilation were also reflected in the characteristic time. The DIN uptake by phytoplankton was acute, while uptake by benthic algae was chronic (day–week vs. month–years; Lepoint et al., 2004). The phytoplankton biomass can be temporally very dynamic. It can increase rapidly under favourable conditions within days to weeks in the blooming phase and assimilate massive DIN within a short period. Due to the high dynamics of phytoplankton, paired high-frequency monitoring data can better define boundaries of seeds and capture instream growth rates, ensuring a high-accuracy estimation of the DIN assimilation. Nevertheless, uncertainty still exists in the estimation results because of the difficulties inherent in the use of the high-frequency chlorophyll fluorescence signal as indirect measures of phytoplankton biomass and the lack of direct measurements (Hamilton et al., 2015). Hamilton et al. (2015) show the impact of non-photochemical quenching on high-frequency chl a fluorescence signals in summer for Lake Rotoehu. However, a recent study from Pathak et al. (2021) found no impact of quenching on high-frequency chl a measurements in the River Thames in England and observed diurnal pattern of chl a concentration, which can be reproduced by the model. Similarly, in our study, the diurnal pattern of the chl a signals related to biomass was also found for the summer low flow condition when the chl a concentration is at a low level (Fig. S5). However, during the spring bloom in 2017 and 2018, the signal of chl a sometimes fluctuates wildly within a day, which cannot represent the actual diurnal biomass changes. In contrast, the biomass change of benthic algae is suggested to be gradual and continuous unless disturbances, such as detachment from the river bottom in high flow events, occur (Jäger and Borchardt, 2018; Rimet et al., 2015). As the DIN uptake or release by benthic algae is closely related to the changes in their biomass, more measurements of benthic algae biomass across seasons are strongly recommended to support the estimation of the assimilatory DIN uptake via benthic algae with more evidence.
The DIN assimilation by phytoplankton and benthic algae showed another significant difference in terms of gross vs. net uptake. On a 5-year average basis, the net DIN uptake by phytoplankton was 77 % of its gross uptake in the Lower Bode, while the net DIN uptake by benthic algae was only 20 % of its gross uptake (Table 4). The difference is mainly because the phytoplankton can be transported downstream beyond the study reach, while the benthic algae are fixed in the river bottom in the reach. The assimilated DIN by phytoplankton can be transported out of the reach before it has enough residence time to release. Consequently, massive gross and net uptake in the study reach can be observed simultaneously during the spring phytoplankton blooming phase in the Lower Bode. In contrast, the uptake and excretion of N by the benthic algae is happening simultaneously within the study reach, as the assimilated N does not move downstream like in phytoplankton. Besides, the benthic algae's biomass completes a cycle on a yearly basis. Large amounts of N assimilated and stored in the benthic algae during the growing season will be released back into the waters after they die (Desmet et al., 2011). In the end, although the gross uptake by benthic algae was higher than by phytoplankton on a yearly basis, its net uptake was lower than by phytoplankton at the reach scale (Table 4). Note that our release calculations are conservative estimates because N release in the form of DON was not included, and we were not able to measure particulate N release for the stream reach. Specifically, during higher flows, benthic algae and particulate N can be scored from the stream bottom and carried downstream out of our study reach (Jäger and Borchardt, 2018).
Nevertheless, the high DIN net uptake via phytoplankton does not mean DIN is completely removed from the riverine system. Phytoplankton can settle and become a nutrient source further downstream. On the other hand, the low net uptake by benthic algae does not mean that they do not play an essential role in instream N processing. Although the assimilated N by phytoplankton and benthic algae is temporarily stored in their biomass pools and eventually sustains the nutrient spiralling downstream, their uptake contributes to downstream water quality by retarding the N downstream transport before denitrification or ultimate burial (Hall et al., 2009; Desmet et al., 2011). Cooper and Cooke (1984) also concluded that the aquatic vegetation modified catchment nitrogen export in terms of form and timing, rather than acting as a net remover from studying nutrient dynamics in a New Zealand stream. This downstream impact is not restricted to N but is also valid for phosphorus (P). Due to the relatively stable stoichiometric N:P relationship in benthic algae (Redfield, 1958; Rutherford et al., 2020), we can assume that nutrient uptake is also valid for P. Therefore, the temporal sequestration and associated turnover time delay the downstream transport of nutrients (Ensign and Doyle, 2006) and can lower available downstream P in ecologically relevant spring and summer periods. Our results show that N is strongly released from biomass during less biologically active periods in autumn and early winter, and this is likely also the case for P.
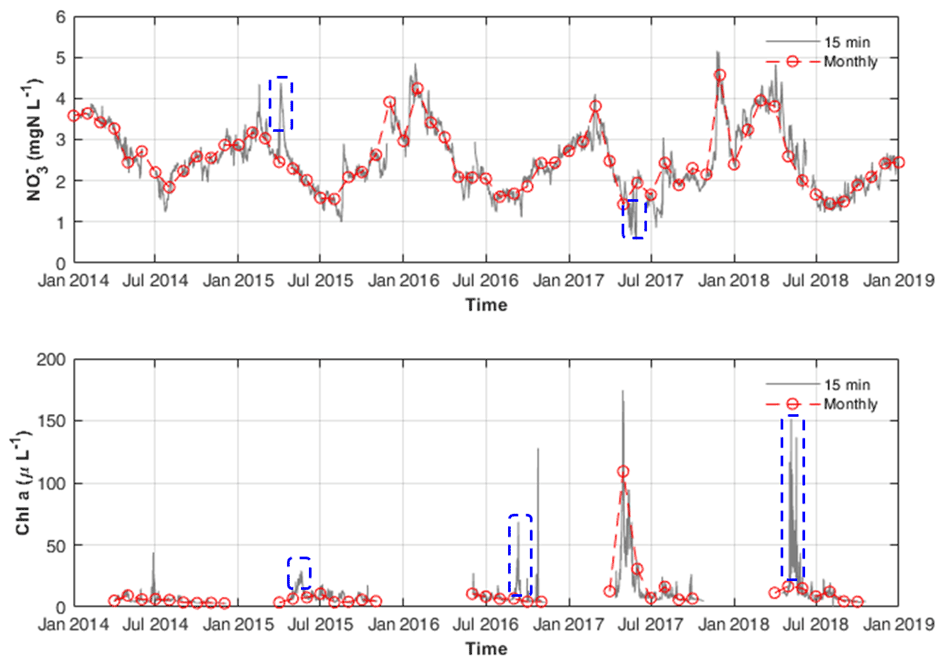
Figure 5The 15 min interval and resampled monthly and chl a measurements at STF. Blue dashed rectangles illustrate the examples in the discussion given in Sect. 4.4.
4.3 Relevance of P in modelling DIN uptake
Evidence from the model results clearly shows that both phytoplankton and benthic algae in the Lower Bode were P limited and never reached N limitations (Fig. S7) similar to other agricultural streams/rivers in Europe (Descy et al., 2011; Minaudo et al., 2018). P is especially limiting when the spring bloom happens. Therefore, P is an important aspect in terms of modelling the phytoplankton and benthic algae metabolisms and, furthermore, the DIN processes and pathways. Although this study has a very good dataset with paired high-frequency measurements for many variables, some water quality variables, e.g. , are still not yet available at high frequency. Linear interpolation of concentration was implemented based on the consistent observed seasonal patterns with multiannual records at GGL and STF (Fig. S8). Nevertheless, there could be discontinuities of concentrations falling out of the linear interpolation line of monthly measurements, which is most probably caused by storm events. As P availability is a limiting factor for the phytoplankton and benthic algae growth (Fig. S8), such changes can reduce or enhance the algae growth limitation in the short term, thus affecting their growth rate, which in turn affects the DIN assimilatory uptake rate. This effect might be stronger for phytoplankton (Fig. S7) because benthic algae have an internal phosphorus storage in their biomass that can adapt to and buffer the response to a sudden change in P availability in the environment.
Our model was able to reproduce the phytoplankton growth between GGL and STF for 5 years, which was proved with the high-frequency paired chl a measurements (Fig. 2d). Hence, we can assume that the impact of on phytoplankton growth was also captured reasonably. This might also be true for benthic algae, as proved by the GPP calculation, which represents the sum of phytoplankton and benthic algae metabolism. Furthermore, we can assume that the variation is discharge dependent (r = −0.35, p < 0.05 at GGL). This means that concentration does not vary much during stable low flow conditions. The highest phytoplankton growth is mostly associated with stable low flow conditions and the absence of discharge disturbances. Taking this into account may explain why our infrequent concentration measurements still allowed a reasonable reproduction of phytoplankton growth and DIN uptake calculation.
Besides, concentration is susceptible to diel cycles, which cannot be reproduced by linearly interpolating the monthly measurements. Our modelling results show that diurnal variations in are in a small range which cannot interfere with the robust long-term seasonal patterns in data (Fig. S5). In other words, the magnitude of diurnal variations caused by the instream processes does not overshoot the seasonal pattern. Therefore, the uncertainty in estimating reach-scale N uptake by linearly interpolating the monthly data which might contain diel patterns is constrained to a small magnitude on a daily scale. Nevertheless, there might be room to improve phytoplankton simulations and DIN uptake with high-frequency measurements. Ongoing work investigates short-term variation in , which offers 30 min measurement frequencies to better link and DIN uptake by primary production.
4.4 The value of using high-frequency data in quantifying N pathways
This study improved confidence in quantifying the instream N processes using a combination of high-frequency data and a water quality model from several aspects.
First, the synchronous continuous high-frequency and Q data accurately define the upper boundary conditions for DIN external loadings. Hensley et al. (2019) suggested that DIN fluxes are highly uneven in time, and a significant fraction of yearly export occurs during a few high flow events. Therefore, missing some high flux events may cause a significant deviation in estimating the DIN uptake in the model, especially on multiannual scales. As shown in Fig. 5, some concentration peaks caused by storm events were found between the monthly data points.
Second, the GPP from model results can be validated by calculated GPP through high-frequency DO measurements. Recent work suggests that nutrient fluxes are large relative to autotrophic demand in streams that are no longer N limited (Covino et al., 2018). Thus, the validation of simulated GPP is vital to constrain the model parameterization of the assimilatory uptake processes. In another study, we have proved that using 15 min interval DO sensor data can improve the identifiability and reduce uncertainties of the parameters for phytoplankton and benthic algae metabolisms using a Bayesian inference approach (Huang et al., 2021). As the autotrophic assimilation plays such an important role in DIN uptake in the Lower Bode, better parameter identification of algae-related processes using high-frequency DO data supports the quantification of DIN uptake processes.
Third, paired high-frequency chl a data enabled us to approximate the growth rate of phytoplankton. As shown in Fig. 5, by using routine monitoring frequency data (e.g. monthly data) of chl a concentrations, one can easily miss its concentration peaks between two monthly measurements. Thus, using monthly chl a concentration data for model calibration will cause difficulty and uncertainty in determining the phytoplankton growth and its nitrogen uptake. Besides, high-frequency data are useful in determining how much uptake occurred during the phytoplankton bloom as they can capture short term but massive uptake-induced reductions in concentration (Fig. 5). Based on the total GPP and phytoplankton GPP, the assimilatory DIN uptakes by phytoplankton and benthic algae are disentangled with more evidence.
Fourth, the downstream high-frequency concentration signal is a synthesis of upstream delivery and internal biogeochemical processing signals. By ascertaining the external loading, downstream concentration signal, and internal assimilatory uptake processes, the denitrification rate can be well constrained in the model. Especially in the summer low flow period, the simulation is sensitive to denitrification because it accounts for over 30 % of the net uptake in the Lower Bode. Note that this removal can be dedicated to the sum of denitrification plus heterotrophic uptake. As heterotrophic uptake is not described in the WASP, these two processes cannot be disentangled.
Finally, a continuous estimation of DIN processing via multiple pathways in the Lower Bode was achieved by incorporating high-frequency data into water quality modelling. The significance of our study lies in the overarching picture of the N processing in a sixth-order agricultural stream, which deepens our systematic insights into the processes and facilitates our ability to manage aquatic systems.
High-frequency data from autonomous sensors offer an opportunity to align observations and simulations from a water quality model. The combination of model and high-frequency data has great potential to deliver the long-needed inference about continuous quantification of instream DIN processing pathways. In this study, we mimicked the patterns of Q, , and DO with the NSE values higher than 0.9 in the Lower Bode using the WASP Eutrophication Model (EUTRO). This is one of the few model testings with both simulated and measured state variables at such high temporal resolution (15 min interval). On this basis, our model could adequately infer continuous DIN processing, including denitrification, assimilatory uptake and release pathways at daily, seasonal, and multiannual scales, and the three research questions could be answered. The daily DIN net uptake rates were highly temporally variable, ranging from −17.4 to 553.9 . Seasonal role shifts of the Lower Bode from N net sink to source were captured, and the dominating process causing this shift, namely net N release from benthic algae in the non-growing season, was quantified. Based on the continuous DIN budget across 5 years, the percentage gross uptake in the Lower Bode was only 2.7 %, which was dominated by benthic algae assimilation, followed by phytoplankton assimilation and denitrification. Our results demonstrate the WASP EUTRO model's ability to estimate DIN processing pathways in a large agricultural lowland stream where benthic algae and phytoplankton co-exist. The long-term high-frequency data increased the reliability of the process estimation from the model through both state and process validations. Nevertheless, in other aquatic systems, the dominant N processing pathways may be different. If the high-frequency measurements happen to have discrepancies with model results in other systems, they also provides an opportunity to identify the mechanisms that may be incompletely represented in the model formulation. In the end, the approach of combining models with high-frequency measurements provides a tool to drive forward a more rigorous model assessment and process representation. The resulting improvements in model process representation and performance provide opportunities to move beyond quantifying current snapshot instream N processes and into a domain of dynamic continuous estimation and prediction.
The Water Quality Analysis Simulation Program (WASP) is freely available (https://www.epa.gov/ceam/water-quality-analysis-simulation-program-wasp; US EPA, 2022). The parameterization of the model is available in the Supplement.
The high-frequency water quality from the sensors used in this study are archived in the TERENO (Terrestrial Environmental Observatories) database and available for the scientific community upon request through the TERENO Online Data Portal (https://www.tereno.net/ddp; UFZ, 2022). The discharge data are freely available and downloadable from the data portal of the State Office of Flood Protection and Water Quality of Saxony-Anhalt (https://gld.lhw-sachsen-anhalt.de/; LHW, 2022). The water quality data of the tributaries are also downloadable from the same portal. The hourly solar radiation data can be downloaded from open data portal of German Meteorological Service (https://opendata.dwd.de/; DWD, 2022).
The supplement related to this article is available online at: https://doi.org/10.5194/hess-26-5817-2022-supplement.
JH conceptualized the paper, developed the methodology and software, validated the research, conducted the formal analysis and investigation, prepared the original draft preparation, and visualized the paper. DB collected the resources, reviewed and edited the paper, and acquired the funding. MR curated the data, reviewed and edited the paper, and supervised and administered the project.
The contact author has declared that none of the authors has any competing interests.
Publisher's note: Copernicus Publications remains neutral with regard to jurisdictional claims in published maps and institutional affiliations.
We thank the flood protection and water management agency of the state of Saxony-Anhalt, Germany (LHW), for providing the data on water discharge and routine water quality data. We also thank the TERENO (Terrestrial Environmental Observatories) project, for supporting the high-frequency monitoring in Lower Bode, and Uwe Kiwel, for maintaining the sensor measurements. We appreciate Camille Minaudo and an anonymous reviewer, for their valuable comments and suggestions in helping us improve the paper.
Jingshui Huang has been supported by the CSC-DAAD Postdoc Fellowship Program and Technical University of Munich (TUM) University Foundation Fellowship. The article processing charges for this open-access publication were covered by the Helmholtz Centre for Environmental Research – UFZ.
This paper was edited by Damien Bouffard and reviewed by Camille Minaudo and one anonymous referee.
Burgin, A. J. and Hamilton, S. K.: Have we overemphasized the role of denitrification in aquatic ecosystems? A review of nitrate removal pathways, Front. Ecol. Environ., 5, 89–96, https://doi.org/10.1890/1540-9295(2007)5[89:HWOTRO]2.0.CO;2, 2007.
Chapra, S. C.: Surface water-quality modeling, Waveland Press, Long Grove, IL, US, 2008.
Cooper, A. B. and Cooke, J. G.: Nitrate loss and transformation in 2 vegetated headwater streams, New Zeal. J. Mar. Fresh., 18, 441–450, https://doi.org/10.1080/00288330.1984.9516065, 1984.
Covino, T. P., Bernhardt, E. S., and Heffernan, J. B.: Measuring and interpreting relationships between nutrient supply, demand, and limitation, Freshw. Sci., 37, 448–455, https://doi.org/10.1086/699202, 2018.
Ensign, S. H. and Doyle, M. W.: Nutrient spiraling in streams and river networks, J. Geophys. Res.-Biogeo., 111, G04009, https://doi.org/10.1029/2005JG000114, 2006.
Descy, J.-P., Leitão, M., Everbecq, E., Smitz, J. S., and Deliege, J.-F.: Phytoplankton of the River Loire, France: a biodiversity and modelling study, J. Plankton Res., 34, 120–135, https://doi.org/10.1093/plankt/fbr085, 2011.
Desmet, N. J. S., Van Belleghem, S., Seuntjens, P., Bouma, T. J., Buis, K. and Meire, P.: Quantification of the impact of macrophytes on oxygen dynamics and nitrogen retention in a vegetated lowland river, Phys. Chem. Earth Pt. A/B/C, 36, 479–489, https://doi.org/10.1016/j.pce.2008.06.002, 2011.
Durand, P., Breuer, L., Johnes, P. J., Billen, G., Butturini, A., Pinay, G., van Grinsven, H., Garnier, J., Rivett, M., Reay, D. S., Curtis, C., Siemens, J., Maberly, S., Kaste, Ø., Humborg, C., Loeb, R., de Klein, J., Hejzlar, J., Skoulikidis, N., Kortelainen, P., Lepistö, A., and Wright, R.: 7 – Nitrogen processes in aquatic ecosystems, in: The European Nitrogen Assessment: Sources, Effects and Policy Perspectives, edited by: Bleeker, A., Grizzetti, B., Howard, C. M., Billen, G., van Grinsven, H., Erisman, J. W., Sutton, M. A., and Grennfelt, P., Cambridge University Press, Cambridge, UK, 126–146, https://doi.org/10.1017/CBO9780511976988.010, 2011.
DWD – German Meteorological Service: Index of/climate_environment/CDC/observations_germany/climate/, DWD [data set], https://opendata.dwd.de/, last access: 7 November 2022.
Glasaitė, R. and Šatkauskienė, I.: Periphyton composition and diversity in the Kaunas Lagoon and the Nemunas River, Biologija, 59, 141–150, https://doi.org/10.6001/biologija.v59i2.2746, 2013.
Hall Jr, R. O., Tank, J. L., Sobota, D. J., Mulholland, P. J., O'Brien, J. M., Dodds, W. K., Webster, J. R., Valett, H. M., Poole, G. C., Peterson, B. J., Meyer, J. L., McDowell, W. H., Johnson, S. L., Hamilton, S. K., Grimm, N. B., Gregory, S. V., Dahm, C. N., Cooper, L. W., Ashkenas, L. R., Thomas, S. M., Sheibley, R. W., Potter, J. D., Niederlehner, B. R., Johnson, L. T., Helton, A. M., Crenshaw, C. M., Burgin, A. J., Bernot, M. J., Beaulieu, J. J., and Arangob, C. P.: Nitrate removal in stream ecosystems measured by 15N addition experiments: Total uptake, Limnol. Oceanogr., 54, 653–665, https://doi.org/10.4319/lo.2009.54.3.0653, 2009.
Hamilton, D. P., Carey, C. C., Arvola, L., Arzberger, P., Brewer, C., Cole, J. J., Gaiser, E., Hanson, P. C., Ibelings, B. W., Jennings, E., Kratz, T. K., Lin, F.-P., McBride, C. G., David de Marques, M., Muraoka, K., Nishri, A., Qin, B., Read, J. S., Rose, K. C., Ryder, E., Weathers, K. C., Zhu, G., Trolle, D., and Brookes, J. D.: A Global Lake Ecological Observatory Network (GLEON) for synthesising high-frequency sensor data for validation of deterministic ecological models, Inland Waters, 5, 49–56, https://doi.org/10.5268/IW-5.1.566, 2015.
Hardenbicker, P., Rolinski, S., Weitere, M., and Fischer, H.: Contrasting long-term trends and shifts in phytoplankton dynamics in two large rivers, Int. Rev. Hydrobiol., 99, 287–299, https://doi.org/10.1002/iroh.201301680, 2014.
Heffernan, J. B. and Cohen, M. J.: Direct and indirect coupling of primary production and diel nitrate dynamics in a subtropical spring-fed river, Limnol. Oceanogr., 55, 677–688, https://doi.org/10.4319/lo.2010.55.2.0677, 2010.
Hensley, R. T. and Cohen, M. J.: Nitrate depletion dynamics and primary production in riverine benthic chambers, Freshw. Sci., 39, 169–182, https://doi.org/10.1086/707650, 2020.
Hensley, R. T., Cohen, M. J., and Korhnak, L. V.: Inferring nitrogen removal in large rivers from high-resolution longitudinal profiling, Limnol. Oceanogr., 59, 1152–1170, https://doi.org/10.4319/lo.2014.59.4.1152, 2014.
Hensley, R. T., Kirk, L., Spangler, M., Gooseff, M. N., and Cohen, M. J.: Flow extremes as spatiotemporal control points on river solute fluxes and metabolism, J. Geophys. Res.-Biogeo., 124, 537–555, https://doi.org/10.1029/2018JG004738, 2019.
Huang, J., Yin, H., Jomaa, S., Rode, M., and Zhou, Q.: Limited nitrogen retention in an urban river receiving raw sewage and wastewater treatment plant effluent, Environ. Sci.-Proc. Imp., 21, 1477–1488, https://doi.org/10.1039/C9EM00201D, 2019.
Huang, J., Merchan-Rivera P., Chiogna G., Disse M., and Rode M.: Can high-frequency data enable better parameterization of water quality models and disentangling of DO processes?, EGU General Assembly 2021, Online, 13–30 April 2021, EGU2020-18622, https://doi.org/10.5194/egusphere-egu21-8936, 2021.
Jäger, C. G. and Borchardt, D.: Longitudinal patterns and response lengths of algae in riverine ecosystems: A model analysis emphasising benthic-pelagic interactions, J. Theor. Biol., 442, 66–78, https://doi.org/10.1016/j.jtbi.2018.01.009, 2018.
Kamjunke, N., Mages, M., Büttner, O., Marcus, H., and Weitere, M.: Relationship between the elemental composition of stream biofilms and water chemistry—a catchment approach, Environ. Monit. Assess., 187, 432, https://doi.org/10.1007/s10661-015-4664-6, 2015.
Kamjunke, N., Rode, M., Baborowski, M., Kunz, J. V., Zehner, J., Borchardt, D., and Weitere, M.: High irradiation and low discharge promote the dominant role of phytoplankton in riverine nutrient dynamics, Limnol. Oceanogr., 66, 2648–2660, https://doi.org/10.1002/lno.11778, 2021.
Khorashadi Zadeh, F., Nossent, J., Woldegiorgis, B. T., Bauwens, W., and van Griensven, A.: Impact of measurement error and limited data frequency on parameter estimation and uncertainty quantification, Environ. Model. Softw., 118, 35–47, https://doi.org/10.1016/j.envsoft.2019.03.022, 2019.
Kunz, J. V., Hensley, R., Brase, L., Borchardt, D., and Rode, M.: High frequency measurements of reach scale nitrogen uptake in a fourth order river with contrasting hydromorphology and variable water chemistry (Weiße Elster, Germany), Water Resour. Res., 53, 328–343, https://doi.org/10.1002/2016WR019355, 2017.
Lepoint, G., Gobert, S., Dauby, P., and Bouquegneau, J.-M.: Contributions of benthic and planktonic primary producers to nitrate and ammonium uptake fluxes in a nutrient-poor shallow coastal area (Corsica, NW Mediterranean), J. Exp. Mar. Biol. Ecol., 302, 107–122, https://doi.org/10.1016/j.jembe.2003.10.005, 2004.
LHW: Niedrigwasserbewirtschaftungsmodell Untere Bode Endbericht, Landesbetrieb für Hochwasserschutz und Wasserwirtschaft Sachsen-Anhalt, Magdeburg, Germany, 2012.
LHW: Hydrologische Situation in Sachsen-Anhalt, https://gld.lhw-sachsen-anhalt.de/, last access: 11 November 2022.
Martin, J. L., Robert B., and Wool, T. A.: WASP7 Benthic Algae – Model Theory and User's Guide, Supplement to Water Analysis Simulation Program (WASP) User Documentation, US Environmental Protection Agency – Region 4, Atlanta, GA, US, 2017.
Matott, L.: OSTRICH: an Optimization Software Tool, Documentation and User's Guide, Version 17.12.19, University at Buffalo Center for Computational Research, USA, https://www.eng.buffalo.edu/~lsmatott/Ostrich/OstrichMain.html (last access: 7 November 2022), 2017.
Minaudo, C., Curie, F., Jullian, Y., Gassama, N., and Moatar, F.: QUAL-NET, a high temporal-resolution eutrophication model for large hydrographic networks, Biogeosciences, 15, 2251–2269, https://doi.org/10.5194/bg-15-2251-2018, 2018.
Minaudo, C., Abonyi, A., Leitão, M., Lançon, A. M., Floury, M., Descy, J.-P. and Moatar, F.: Long-term impacts of nutrient control, climate change, and invasive clams on phytoplankton and cyanobacteria biomass in a large temperate river, Sci. Total Environ., 756, 144074, https://doi.org/10.1016/j.scitotenv.2020.144074, 2021.
Moatar, F., Abbott, B. W., Minaudo, C., Curie, F., and Pinay, G.: Elemental properties, hydrology, and biology interact to shape concentration-discharge curves for carbon, nutrients, sediment, and major ions, Water Resour. Res., 53, 1270–1287, https://doi.org/10.1002/2016WR019635, 2017.
Mulholland, P. J., Helton, A. M., Poole, G. C., Hall, R. O., Hamilton, S. K., Peterson, B. J., Tank, J. L., Ashkenas, L. R., Cooper, L. W., Dahm, C. N., Dodds, W. K., Findlay, S. E. G., Gregory, S. V., Grimm, N. B., Johnson, S. L., McDowell, W. H., Meyer, J. L., Valett, H. M., Webster, J. R., Arango, C. P., Beaulieu, J. J., Bernot, M. J., Burgin, A. J., Crenshaw, C. L., Johnson, L. T., Niederlehner, B. R., O'Brien, J. M., Potter, J. D., Sheibley, R. W., Sobota, D. J., and Thomas, S. M.: Stream denitrification across biomes and its response to anthropogenic nitrate loading, Nature, 452, 202–205, https://doi.org/10.1038/nature06686, 2008.
Pathak, D., Hutchins, M., Brown, L., Loewenthal, M., Scarlett, P., Armstrong, L., Nicholls, D., Bowes, M., and Edwards, F.: Hourly prediction of phytoplankton biomass and its environmental controls in lowland rivers, Water Resour. Res., 57, e2020WR028773, https://doi.org/10.1029/2020WR028773, 2021.
Pianosi, F., Sarrazin, F., and Wagener, T.: A Matlab toolbox for Global Sensitivity Analysis, Environ. Model. Softw. 70, 80–85, https://doi.org/10.1016/j.envsoft.2015.04.009, 2015.
Raimonet, M., Vilmin, L., Flipo, N., Rocher, V., and Laverman, A. M.: Modelling the fate of nitrite in an urbanized river using experimentally obtained nitrifier growth parameters, Water Res., 73, 373–387, https://doi.org/10.1016/j.watres.2015.01.026, 2015.
Reynolds, C. S. and Descy, J. P.: The production, biomass and structure of phytoplankton in large rivers, Large Rivers, 10, 161–187, https://doi.org/10.1127/lr/10/1996/161, 1996.
Riis, T., Dodds, W. K., Kristensen, P. B., and Baisner, A. J.: Nitrogen cycling and dynamics in a macrophyte-rich stream as determined by a release, Freshw. Biol., 57, 1579–1591, https://doi.org/10.1111/j.1365-2427.2012.02819.x, 2012.
Rimet, F., Bouchez, A., and Montuelle, B.: Benthic diatoms and phytoplankton to assess nutrients in a large lake: Complementarity of their use in Lake Geneva (France–Switzerland), Ecol. Indic., 53, 231–239, https://doi.org/10.1016/j.ecolind.2015.02.008, 2015.
Redfield, A. C.: The biological control of chemical factors in the environment, Am. Sci., 46, 230A, 205–221. 1958.
Rode, M., Halbedel née Angelstein, S., Anis, M. R., Borchardt, D., and Weitere, M.: Continuous in-stream assimilatory nitrate uptake from high-frequency sensor measurements, Environ. Sci. Technol., 50, 5685–5694, https://doi.org/10.1021/acs.est.6b00943, 2016a.
Rode, M., Wade, A. J., Cohen, M. J., Hensley, R. T., Bowes, M. J., Kirchner, J. W., Arhonditsis, G. B., Jordan, P., Kronvang, B., Halliday, S. J., Skeffington, R. A., Rozemeijer, J. C., Aubert, A. H., Rinke, K., and Jomaa, S.: Sensors in the stream: the high-frequency wave of the present, Environ. Sci. Technol., 50, 10297–10307, https://doi.org/10.1021/acs.est.6b02155, 2016b.
Rutherford, J. C., Young, R. G., Quinn, J. M., Chapra, S. C., and Wilcock, R. J.: Nutrient attenuation in streams: a simplified model to explain field observations, J. Environ. Eng., 146, 04020092, https://doi.org/10.1061/(ASCE)EE.1943-7870.0001753, 2020.
Tank, J. L., Reisinger, A. J., and Rosi, E. J.: Chapter 31 – Nutrient limitation and uptake, in: Methods in Stream Ecology (Third Edition), edited by: Lamberti, G. A. and and Hauer, F. R., Academic Press, Elsevier, 147–171, https://doi.org/10.1016/B978-0-12-813047-6.00009-7, 2017.
Tank, J. L., Martí, E., Riis, T., von Schiller, D., Reisinger, A. J., Dodds, W. K., Whiles, M. R., Ashkenas, L. R., Bowden, W. B., Collins, S. M., Crenshaw, C. L., Crowl, T. A., Griffiths, N. A., Grimm, N. B., Hamilton, S. K., Johnson, S. L., McDowell, W. H., Norman, B. M., Rosi, E. J., Simon, K. S., Thomas, S. A., and Webster, J. R.: Partitioning assimilatory nitrogen uptake in streams: an analysis of stable isotope tracer additions across continents, Ecol. Monogr., 88, 120–138, https://doi.org/10.1002/ecm.1280, 2018.
UFZ – Helmholtz Centre for Environmental Research: Harz/Central German Lowland Observatory under Terrestrial Environmental Observatories (TERENO), https://www.tereno.net/ddp, last access: 7 November 2022.
US EPA: Water Quality Analysis Simulation Program (WASP), https://www.epa.gov/ceam/water-quality-analysis-simulation-program-wasp, last access: 7 November 2022.
Vannote, R. L., Minshall, G. W., Cummins, K. W., Sedell, J. R., and Cushing, C. E.: The River Continuum Concept, Can. J. Fish. Aquat. Sci., 37, 130–137, https://doi.org/10.1139/f80-017, 1980.
Verstraete, W. and Focht, D. D.: Biochemical ecology of nitrification and denitrification, in: Advances in Microbial Ecology, edited by: Alexander, M., Springer, Boston, MA, US, 135–214, https://doi.org/10.1007/978-1-4615-8219-9_4, 1977.
von Schiller, D., Bernal, S., Sabater, F., and Martí, E.: A round-trip ticket: the importance of release processes for in-stream nutrient spiraling, Freshw. Sci., 34, 20–30, https://doi.org/10.1086/679015, 2015.
Wagenschein, D. and Rode, M.: Modelling the impact of river morphology on nitrogen retention—A case study of the Weisse Elster River (Germany), Ecol. Modell., 211, 224–232, https://doi.org/10.1016/j.ecolmodel.2007.09.009, 2008.
Wool, T., Ambrose, R. B., Martin, J. L., and Comer, E. A.: WASP 8: The Next Generation in the 50-year Evolution of USEPA's Water Quality Model, Water, 12, 1398, https://doi.org/10.3390/w12051398, 2020.
Wool, T. A., Ambrose, R. B., Martin, J. L., and Comer, E. A.: Water Quality Analysis Simulation Program (WASP) Version 6.0 DRAFT: User's Manual, US Environmental Protection Agency – Region 4, Atlanta, GA, US, 2002.
Yang, S., Bertuzzo, E., Büttner, O., Borchardt, D., and Rao, P. S. C.: Emergent spatial patterns of competing benthic and pelagic algae in a river network: A parsimonious basin-scale modeling analysis, Water Res., 193, 116887, https://doi.org/10.1016/j.watres.2021.116887, 2021.