the Creative Commons Attribution 4.0 License.
the Creative Commons Attribution 4.0 License.
 | 16 Nov 2022
The effect of rainfall amount and timing on annual transpiration in a grazed savanna grassland
Mika Aurela
Ville Vakkari
Johan P. Beukes
Juha-Pekka Tuovinen
Pieter G. Van Zyl
Miroslav Josipovic
Stefan J. Siebert
Tuomas Laurila
Markku Kulmala
Lauri Laakso
Janne Rinne
Gabriel Katul
The role of precipitation (P) variability with respect to evapotranspiration (ET) and its two components, transpiration (T) and evaporation (E), from savannas continues to draw significant research interest given its relevance to a number of ecohydrological applications. Our study reports on 6 years of measured ET and estimated T and E from a grazed savanna grassland at Welgegund, South Africa. Annual P varied significantly with respect to amount (508 to 672 mm yr−1), with dry years characterized by infrequent early-season rainfall. T was determined using annual water-use efficiency and gross primary production estimates derived from eddy-covariance measurements of latent heat flux and net ecosystem CO2 exchange rates. The computed annual T for the 4 wet years with frequent early wet-season rainfall was nearly constant, 326±19 mm yr−1 (), but was lower and more variable between the 2 dry years (255 and 154 mm yr−1, respectively). Annual T and were linearly related to the early wet-season storm frequency. The constancy of annual T during wet years is explained by the moderate water stress of C4 grasses as well as trees' ability to use water from deeper layers. During extreme drought, grasses respond to water availability with a dieback–regrowth pattern, reducing leaf area and transpiration and, thus, increasing the proportion of transpiration contributed by trees. The works suggest that the early-season P distribution explains the interannual variability in T, which should be considered when managing grazing and fodder production in these grasslands.
- Article
(4479 KB) - Full-text XML
-
Supplement
(1435 KB) - BibTeX
- EndNote


Similar to other semiarid areas, wooded grasslands in central South Africa deliver essential ecosystem services such as grazing land and fodder (Bengtsson et al., 2019). In such semiarid zones, evapotranspiration (ET) approximately matches annual precipitation (P≈500 mm yr−1; Zhang et al., 2001). The transpiration (T) component accounts for water loss from the leaf stomata of the sparse tree component, seasonal grasses, and the minor forb component. The evaporation (E) component is large following rain events, as intercepted water and near-surface soil water evaporate; the latter may continue over periods longer than a week (Perez-Priego et al., 2018). The partitioning of ET between E and T may affect the net radiation (Rn) and surface temperature on short timescales (sub-daily). However, the processes that increase the proportion (and amount) of water used in T, facilitating greater carbon uptake and subsequent fodder production for cattle, occur over timescales of weeks or longer. Given the link between T and carbon uptake from the atmosphere, there is growing interest in how ET is partitioned into E and T in semiarid ecosystems (Merbold et al., 2009; Sankaran et al., 2004; Scanlon et al., 2002, 2005; Scholes and Archer, 1997; Scott and Biederman, 2017; Volder et al., 2013; Williams and Albertson, 2004; Xu et al., 2015; Yu and D'Odorico, 2015). The aim here is to explore this partitioning of ET using a long-term data set of measured fluxes of energy, water, carbon dioxide (CO2), and vegetation activity from a grazed wooded grassland. The focus is restricted to processes operating over daily to seasonal timescales, commensurate with controls over the annual partitioning of P into T, and the resulting carbon uptake in gross primary production (GPP). These longer timescales are of interest in the valuation of ecosystem productivity and their services when assessing climatic shifts (Godde et al., 2020). The results presented here on the partitioning of ET must be viewed as necessary but insufficient for developing best practices for the management of grazing or fodder production.
The contrasting vegetation layers of wooded grasslands have distinct seasonal dynamics of leaf area and physiological activity. In southern African drylands, Vachellia erioloba (camel thorn tree) is an important woody component of grasslands (Barnes et al., 1997); this species is a deep-rooted semi-deciduous tree with a low leaf turnover rate, resulting in minor leaf area changes. Furthermore, V. erioloba has been shown to absorb 37 % of its water below a depth of 1 m, partially decoupling its physiological activity from recent precipitation and shallow soil water content (Beyer et al., 2018). Little interannual variation in tree water use has been shown in many semiarid ecosystems (Do et al., 2008; Hutley et al., 2001; Montaldo et al., 2020). However, pronounced seasonality in tree transpiration of semi-deciduous and deciduous savanna tree species has been observed in South Africa, even in riparian forest (Scott-Shaw and Everson, 2019). Perennial C4 grass species in the area have shallower rooting systems and are physiologically responsive to intermittent rainfall events (Sankaran, 2019). The grass dependence on the temporal distribution of P has been demonstrated by a positive correlation between rainfall frequency and productivity at the field scale (Swemmer et al., 2007) and by a positive relationship between wet-season rainfall frequency and grass cover in the grassland ecosystems of sub-Saharan Africa (P≤630 mm yr−1; D'Onofrio et al., 2019). Compared with C3 trees, the C4 grass layer has CO2 concentrated in the bundle sheath that enables greater light- and water-use efficiencies of CO2 uptake in the warmer inter-canopy spaces (Ripley et al., 2010). Due to their ability to regulate intercellular CO2 concentrations, C4 grasses have a higher photosynthetic ability per unit leaf area that can be sustained even in moderate-water-stress situations (Taylor et al., 2014). However, for the same volume of soil, a C4 grass is an intensive and fast user of soil water when compared with C3 trees. Indeed, due to their shallow rooting depth, severe droughts may alter both their water-use efficiency per unit leaf area and their leaf area dynamics. Thus, our study objective is not only to partition measured ET into T and E but also to quantify the effect of environmental variables on the seasonality of the grass activity.
Three methods that link T to GPP are used to estimate monthly . These methods were chosen because previous applications have shown some success in partitioning ET into E and T when applied to multi-site data sets. These three methods provide an estimate of ecosystem-scale T, albeit with differing assumptions and uncertainty (Stoy et al., 2019). Previous method comparisons have shown that the linear regression method with optimality assumption produces lower estimates than the machine learning approach to ET partitioning for grassland and savanna ecosystems (Nelson et al., 2020; Scott et al., 2021). Comparing these methods allows for the selection of the most suitable partitioning scheme for water-limited ecosystems in general and savannas in particular. Furthermore, an agreement between the methods lends confidence to the estimates of and the drivers of T (e.g., precipitation). Disagreements between the methods may also identify potential uncertainties in the hydroclimatic or land-cover conditions explored here. Hence, a corollary goal is to understand the opportunities and limitations of these methods when combined with eddy-covariance-measured ET, such as those supplied by FLUXNET (Baldocchi et al., 2001).
The main question addressed here is how T and vary with P at monthly and annual timescales in a grazed savanna grassland ecosystem. Available MODIS vegetation indexes and Landsat 8 grass and tree normalized difference vegetation index (NDVI) information allow for the quantification of vegetation dynamics at the site. Soil-moisture-based grass transpiration and ecosystem-scale T offer a new perspective on the relation between water fluxes at seasonal and annual timescales as well as new ways to examine the role of grass and trees in water budgets. Our study objectives are (i) to quantify the variation in annual P, ET, and T; (ii) identify the main drivers of the annual and monthly T and ; and (iii) relate the growth dynamics of tree and grass components to the hydrological balance.
2.1 Site description
The Welgegund measurement site is located in a grazed savanna grassland in South Africa (26∘34′10′′ S, 26∘56′2′′ E; 1480 m a.s.l.), as shown in Fig. 1. The research site is part of a large-scale commercial ranch with an annual cattle head count of 1300±300. The cattle grazing area is approximately 6000 ha.
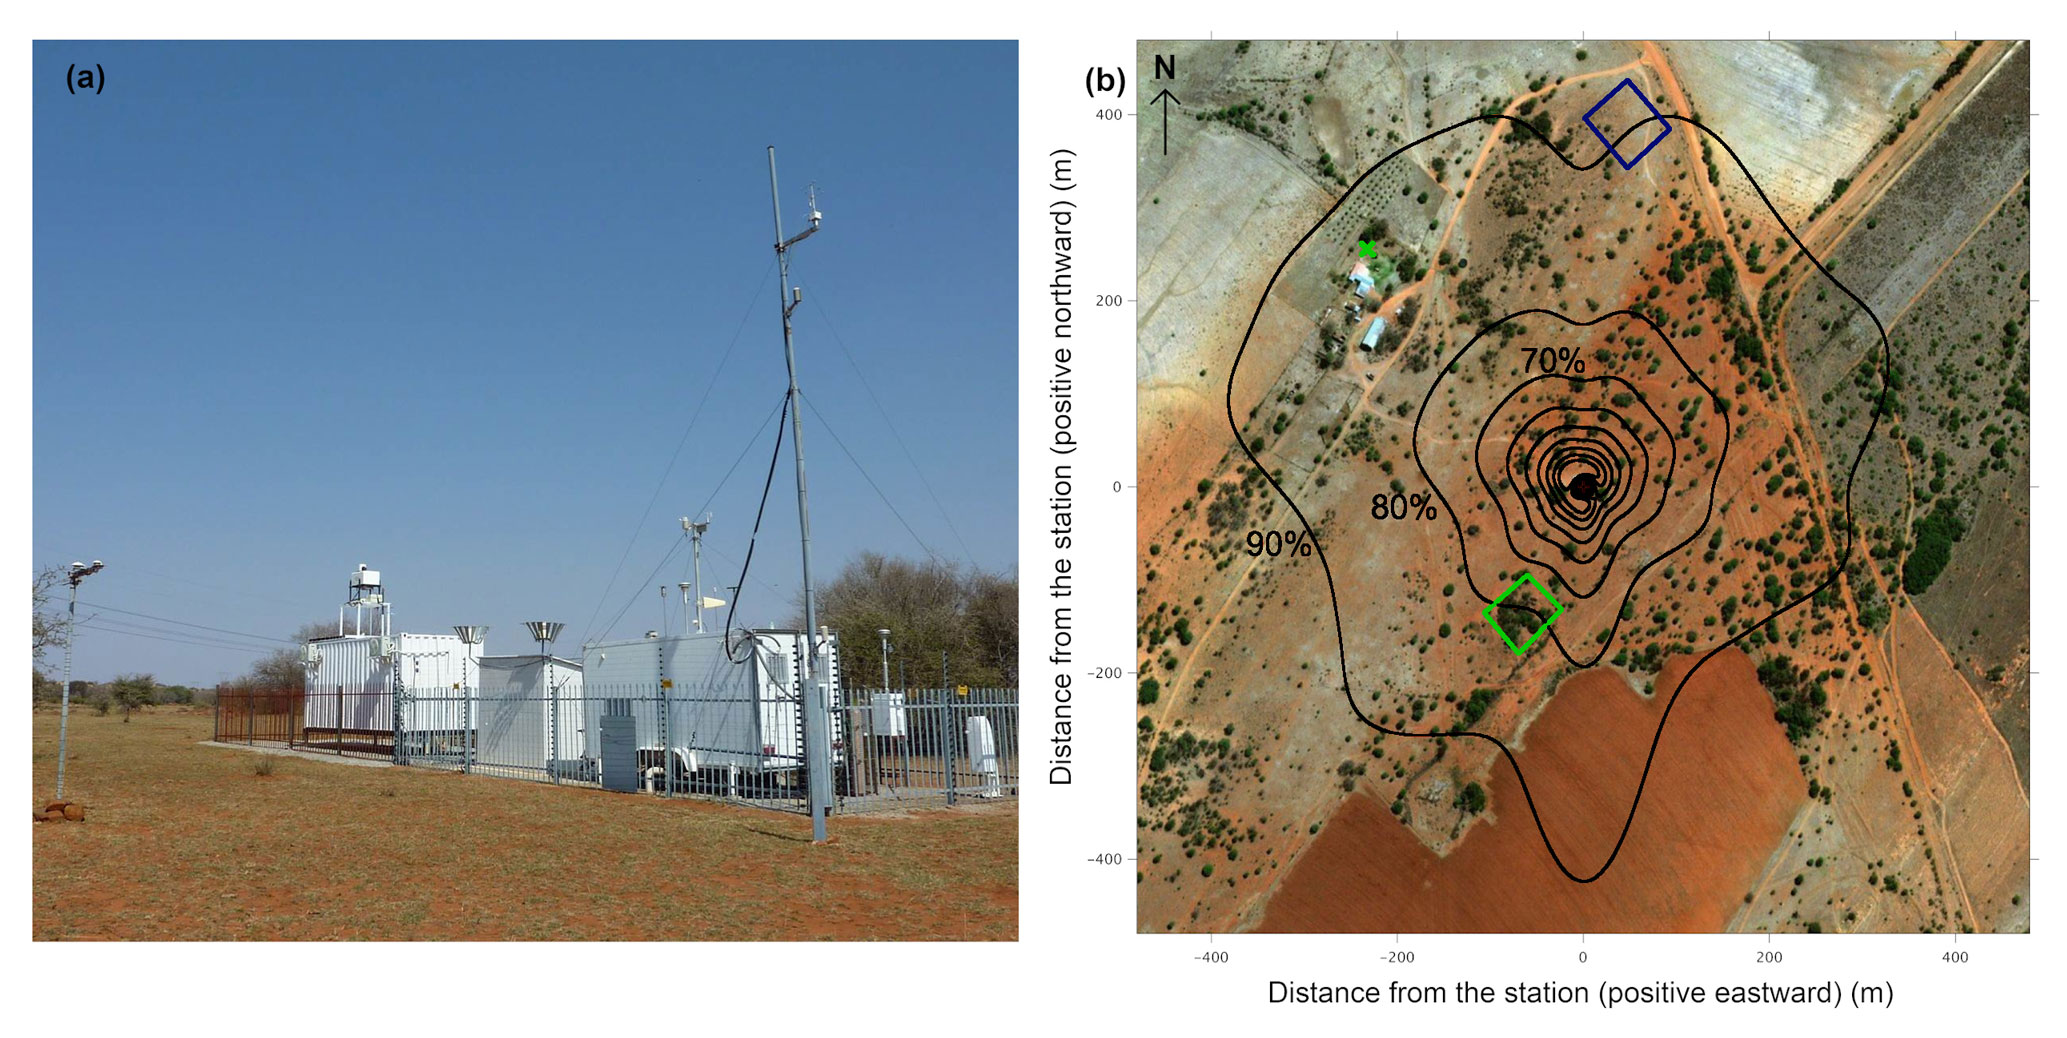
Figure 1(a) Photograph of the measurement station and surrounding vegetation taken on 22 August 2016. (b) Daytime flux footprint estimated with measured flow statistics and a 2D footprint model (Kljun et al., 2015). Footprint contour lines (black) are shown in 10 % increments from 10 % to 90 %. The station is located at the center, and the green cross indicates the farm well. The Landsat 8 NDVI was calculated from the area marked by the blue square for grass and by the green square for trees.
The area experiences two seasonal periods: a warm rainy season from October to April and a cool dry season from May to September. The 16-year mean annual rainfall determined at a nearby weather station (town of Potchefstroom) was 540 mm yr−1 ± 112 mm yr−1 (Räsänen et al., 2017). The soil around the site is loamy sand in the top 1 m. Although the water table depth is not known, the farm well has a continuous water supply at 30 m below the surface (Fig. 1).
The vegetation in the area is an open thornveld. Eragrostis trichophora, Panicum maximum, and Setaria sphacelata are the dominant perennial C4 grass species. The mean maximum grass height across sampling plots was 0.1 m in 2011 (Räsänen et al., 2017). Tree cover is 15 %, and the dominant tree species is V. erioloba, with other less-prominent species such as Celtis africana and Searsia pyroides. Dicoma tomentosa, Hermannia depressa, Pentzia globosa, and Selago densiflora are the dominant forb species. Details on the site and vegetation cover may be found elsewhere (Jaars et al., 2016; Räsänen et al., 2017).
2.2 Measurements
Atmospheric aerosols, trace gases, and meteorological variables were measured continuously at the site (Beukes et al., 2015; Petäjä et al., 2013). The measurements directly related to energy fluxes and water balance are briefly described. The eddy-covariance (EC) system consisted of a triaxial sonic anemometer (METEK USA-1) and a LI-COR (LI-7000) closed-path infrared gas analyzer, which were positioned 9 m a.g.l. (meters above ground level). The sampling frequency of the EC system was 10 Hz. The gas analyzer was calibrated every month with a high-precision CO2 span gas using synthetic air with CO2 < 0.5 ppm as a reference gas. The meteorological measurements included atmospheric temperature and pressure, mean wind speed and direction, and mean air relative humidity. The radiation measurements were made using Kipp & Zonen PAR-lite sensors, CMP-3 pyranometers, and an NR Lite2 net radiometer positioned 3 m a.g.l. with a field of view at the grass level. These sensors measure photosynthetically active radiation (PAR), direct and reflected global radiation, and net radiation. The soil surface heat flux was measured with a Hukseflux HFP01 heat flux plate at 5 cm below the soil surface. The meteorological variables were sampled every 1 min (radiation every 10 s), and 15 min averages were then recorded.
Precipitation was measured 1.5 m a.g.l. with two tipping bucket gauges (Vaisala QMR102 and Casella). Most of the precipitation values reported here are from the Vaisala gauge, with the Casella gauge only used to gap-fill missing values in the Vaisala gauge time series. No significant differences were observed between the two sensors. Between December 2011 and February 2012, the measured rainfall was underestimated due to the high intensity of the rainfall, and it was corrected using nearby weather station measurements (Sect. S1, Figs. S1 and S2 in the Supplement). Wind-induced underestimation is a well-known problem with pointwise rainfall measurements. Thus, the measured precipitation was corrected by multiplying it by 1.094. This corresponds to the 9.4 % bias that was determined for the Casella rain gauge at the height of 0.5 m at a measurement site with a similar mean wind speed (5 m s−1) and annual rainfall (P=700–1000 mm yr−1) (Pollock et al., 2018).
Stored soil water changes were determined using two separate soil moisture profiles. The measurements of individual soil moisture sensors at depths of 0.05, 0.2, and 0.5 m (Delta-T ML2) were converted to a single average soil moisture value using the weights of 125, 225, and 200 mm, respectively. These soil moisture measurements covered the complete experiment period from September 2010 to August 2016. Starting from March 2012 onwards, a Delta-T PR probe was installed to record soil moisture at depths of 0.1, 0.2, 0.3, 0.4, 0.6, and 1.0 m. This profile measurement was converted to stored soil water using the weights 150, 100, 100, 150, 300, and 200 mm, respectively, and it was used to calculate the annual change in soil water storage (ΔΘ1 m) over the entire 1 m soil column.
The site was visited once or twice a week during the 6-year period to check the status of the sensors and correct errors if necessary. Measurement records were used to identify anomalies, outliers, or erroneous measurement periods. Further details on the site and EC measurements are presented elsewhere (Aurela et al., 2009; Räsänen et al., 2017). The annual energy balance closure was also computed, which varied from 0.75 to 0.85. This lack of closure is comparable to those reported for FLUXNET sites (Stoy et al., 2013; Wilson et al., 2002). Given the heterogeneity in vegetation cover and that EC measurements sense a different footprint from the footprint representing the difference between net radiation and soil heat flux, no Bowen ratio adjustments were performed to force an energy balance closure.
2.3 Flux calculation and gap filling
The details on the turbulent flux calculations are presented in Räsänen et al. (2017). Briefly, the turbulent fluxes were calculated as 30 min block averages after double rotation and by applying the Webb–Pearman–Leuning (WPL) density correction (Webb et al., 1980). The low-frequency flux correction was performed according to Moore (1986), and high-frequency losses were corrected using empirical transfer functions determined using sensible heat flux as a reference scalar. The sensible and latent heat flux values were discarded when the measured friction velocity u* was below 0.28 m s−1, which was deemed as a state of low turbulence mixing. The steady-state test of Foken and Wichura (1996) was used to screen the latent heat flux data for nonstationary conditions within each 30 min averaging period. The data were discarded if the relative nonstationarity defined by this test exceeded a threshold, which was set to 30 % and 100 % for the data used for gap filling and final analysis, respectively. Latent heat fluxes were checked for an acceptable H2O concentration range and variance to detect anomalous spikes due to condensation or rainfall. Heat flux values were filtered for outliers by considering values for each month of all of the measurement years and removing outliers using an adjusted boxplot (Hubert and Vandervieren, 2008). The steady-state check resulted in less than 30 % filtered fluxes, which were gap filled using marginal distribution sampling (MDS) from the REddyProc package (Reichstein et al., 2005). Both daytime and nighttime fluxes were gap filled using this approach, given the significant role that nighttime evaporation and respiration play in the water and carbon balances. Gap filling of nighttime evaporation is of significance at Welgegund, as most of the rainfall occurs in the late afternoon and early evening. The meteorological parameters were also gap filled using the MDS approach (Reichstein et al., 2005).
The flux footprint was estimated using the daytime measured flow statistics for the 6-year period and a standard 2D footprint model (Kljun et al., 2015), which are presented in Fig. 1. These calculations suggest that 80 % of the ET fluxes originate from the homogeneous thornveld.
The EC-inferred GPP was used to derive the water-use efficiencies to partition measured ET into T and E. The measured net ecosystem CO2 exchange (NEE) was partitioned into GPP and ecosystem respiration using nighttime mean respiration values. These values were assumed to be the same for daytime respiration, and GPP was determined as the difference between NEE and daytime ecosystem respiration. Nighttime mean respiration was used instead of the exponential temperature function, as only 2 % of the fitting windows had a linear or exponential relation between EC-based ecosystem respiration and soil temperature. The difference between the mean monthly transpiration from these two methods was small, with transpiration from the exponential temperature function being 4 % higher than transpiration from the nighttime mean method (Fig. S3). The GPP fit parameters and the nighttime mean respiration were calculated in a moving data window that was defined for each day with an initial length of 6 d. The moving window was expanded by up to 20 d if necessary, to include at least 50 measurement points. The measured NEE had one large 25 d gap in September 2013, and the fit parameters were linearly interpolated for this gap. The preprocessing of NEE was performed with the same filters as the heat fluxes, as discussed in Räsänen et al. (2017).
The potential ET (PET) was calculated using the Priestley–Taylor formulation given by Priestley and Taylor (1972):
where αPT=1.26 is the Priestley–Taylor coefficient, (Pa K−1), e* (Pa) is the saturation vapor pressure given by the Clausius–Clapeyron equation and evaluated at the measured air temperature Ta (K), Rn (W m−2) is net radiation, G (W m−2) is soil heat flux, and γp (Pa K−1) is the psychrometric constant. The energy balance closure (EBC) slope was estimated for each year by regressing all measured 30 min values of Rn–G against the sum of the measured latent and sensible heat fluxes for the same period.
2.4 Uncertainty of annual ET estimates
The friction velocity (u*) threshold was estimated using a bootstrapping technique from 200 artificial replicates of the data set (Wutzler et al., 2018). The mean u* estimate value for the whole data set was 0.28 m s−1, with heat flux and NEE values being discarded when u* was lower than this limit. The 5th, 50th, and 95th percentiles of the estimates were 0.27, 0.29, and 0.32 m s−1, respectively. The data set was u* filtered and gap filled with these three u* limits. The annual u* uncertainty range was calculated for each k year as follows:
where is the u* uncertainty for year k, and ETk is the evapotranspiration for year k.
The MDS gap-filling algorithm estimates random error for each 30 min value based on the standard deviation of the observed latent heat flux with similar meteorological conditions in a moving window. The annual random error was estimated as the root-mean-squared error:
where nk is the number of 30 min periods in year k, and σi is the standard deviation of latent heat flux from the MDS gap-filling algorithm. The total uncertainty of the annual ET was calculated by adding the random error and u* uncertainty in quadrature to yield
2.5 Rainfall interception
The total rainfall interception (It) was not measured; instead, it was estimated by modeling grass, litter, and tree interception. The interception was estimated for each storm using discrete rainfall events separated by at least 1 h. The grass interception for one storm event was calculated using an expression derived for crops (Moene and Van Dam, 2014):
where a is the scale parameter; cg is the grass cover fraction; LAI is the leaf area index, estimated here from satellite (Sect. 2.7); and Pg is the rainfall amount per storm. The scale parameter was set to 0.5 mm per event, which corresponds to a maximal 1 mm interception loss for LAI = 2. The grass cover fraction was estimated using LAI, as follows:
where the extinction coefficient (k) is set to 0.4. Tree interception was estimated using the revised model for a sparse canopy (Gash et al., 1995). The model assumes that rainfall events consist of wetting, saturation, and drying phases. The interception for small events that do not saturate the canopy was estimated separately from large storms that saturate the canopy. The rainfall to fill the canopy storage is
where is the canopy storage capacity per unit cover, is the mean rainfall, and is the mean evaporation rate during a storm. The measured ET was used to calculate the mean evaporation rate for each event. The tree cover fraction ct was set to a constant 0.15, and storage capacity S was set to 1.07 mm, corresponding to a measured value for Acacia mearnsii (Bulcock and Jewitt, 2012). The total tree interception is then determined as follows:
The first sum accounts for the m small events that do not saturate the canopy, and the second sum accounts for the n large events. The litter interception was assumed to be 1 mm per rainfall event (Scholes and Walker, 1993), and it was multiplied by ct.
2.6 Partitioning ET
Prior to presenting the three ET partitioning approaches, the link between GPP and T is reviewed. From definitions, the flux-based water-use efficiency (WUE) is as follows:
where ci and ca are the respective intercellular and ambient atmospheric CO2 concentrations, and VPD is the vapor pressure deficit. Based on stomatal optimization theories that maximize carbon gain for a given amount of water loss in the rooting system per unit leaf area, the ratio of CO2 concentrations () is proportional to , as demonstrated in several studies reviewed elsewhere (Hari et al., 2000; Katul et al., 2009, 2010). Combining these theories with the definition of WUE (Eq. 9) makes T proportional to GPP×VPD0.5 provided that ca does not vary appreciably. The proportionality constant in this expression () is linked to the so-called marginal water-use efficiency (or the Lagrange multiplier in optimal stomatal control theories), which differs from the intrinsic water-use efficiency . It must be externally supplied or determined from EC measurements during conditions when T approximately equals ET. When this proportionality constant is known, an EC-based GPP estimate (together with VPD) can be used to infer T and, via subtraction from ET, produce an estimate of E.
Table 1Summary of the ET partitioning methods applied to the 6 years of data.
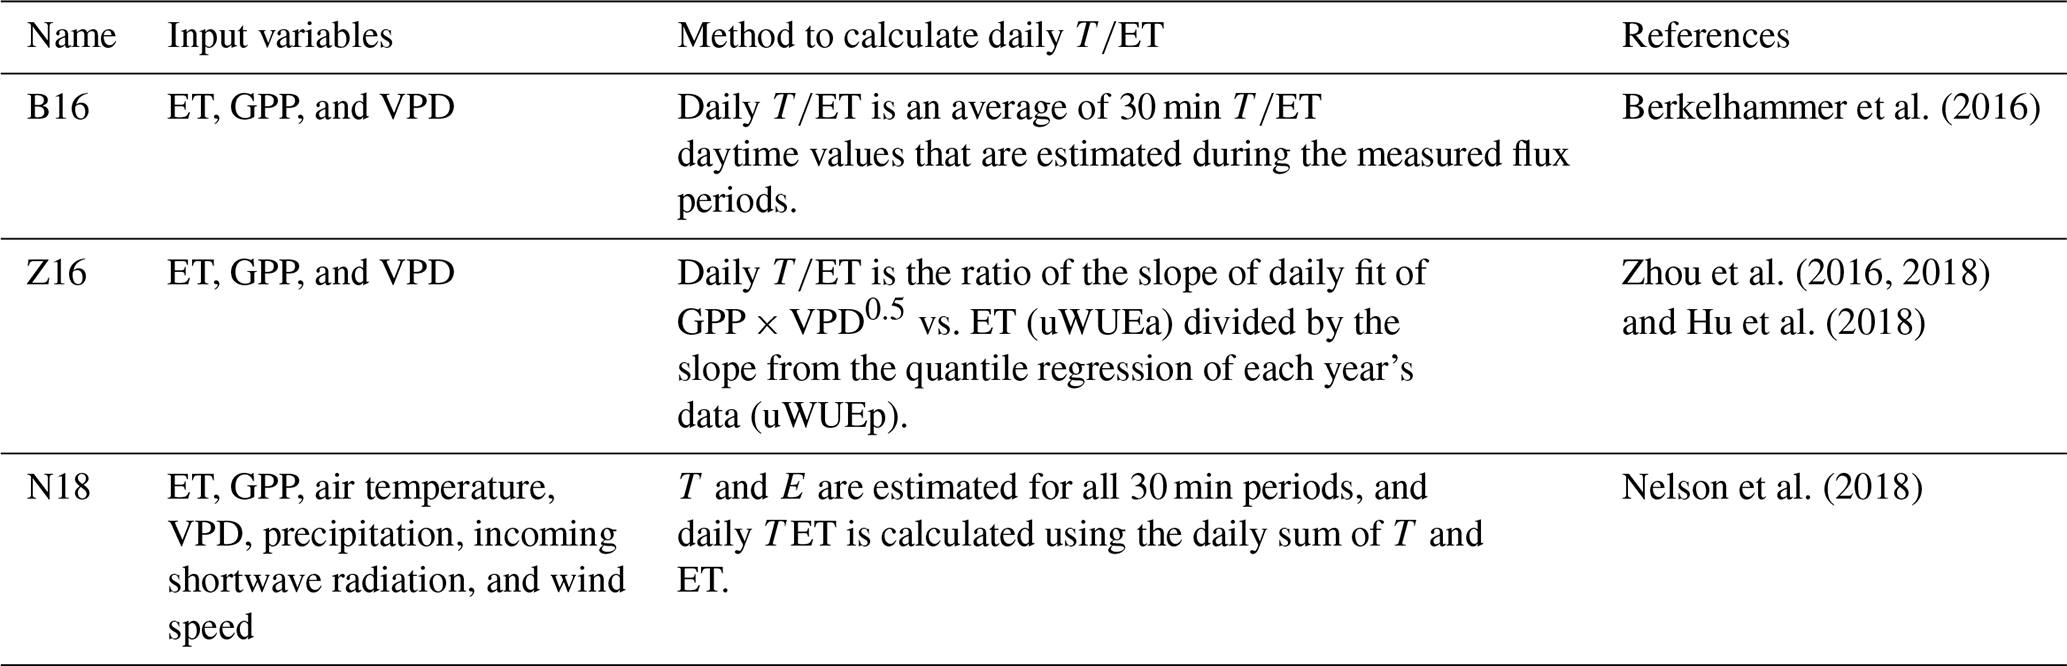
Three approaches were used to divide ET into E and T using the abovementioned link between GPP and T (Table 1). The first method was presented by Berkelhammer et al. (2016) (hereafter, B16). Here, it was applied to each year individually to allow for the large interannual variation in vegetation phenology. The method assumes that ET is linearly related to GPP×VPD0.5 only when T is the dominant term in ET. Moreover, the ratio is assumed to approach unity intermittently. To estimate the value for each 30 min period, the product GPP×VPD0.5 was plotted against ET for each year, and the minimum value of ET was then selected as the 5th percentile for each equal-sized GPP×VPD0.5 bin. The bin was defined by discretizing the 30 min GPP×VPD0.5 values into 50 bins, with each containing the same number of measurements but encompassing different value ranges, for reasons provided elsewhere (Berkelhammer et al., 2016). A linear regression line of these bins defines the ET value for which T dominates ET. Any value falling below the line is considered to have . For points above the regression line, is defined as the ratio between the minimum ET that represents T and the observed ET:
where is the minimum ET value, and ETflux is the observed ET value. The calculation of 30 min values for 1 year is illustrated in Fig. S4. The daily values were calculated by taking the mean of these 30 min values, and it was used to calculate daily T and E using the measured ET. The regression slope and intercept of the T=ET line are related to the inverse of water-use efficiency for each year based on the 30 min data. The 30 min data points used for the estimation were also filtered with additional quality criteria, i.e., only data points with measured ET, positive GPP, and Rn were used (see Zhou et al., 2016). However, rainy days were included in the estimation to capture the rainfall interception events measured by the EC system while maintaining the data-stationarity filter. Shortly after rain, water droplets remaining on the sonic anemometer transducers can block the detection of sound waves emitted and received, leading to anomalous vertical velocity and friction velocity measurements for these 30 min runs. However, as the sonic anemometer transducers are inclined, smooth, and have small surface area, they dry out faster than the leaves, thereby allowing the EC system to operate shortly after each rainfall event. At an annual scale, the estimated It was used to calculate soil evaporation (Es) by subtracting It from E.
As previously mentioned, two other methods were also used to estimate T in order to identify the method most appropriate to water-limited ecosystems. The second approach entailed fitting the T=ET line using quantile regression with zero intercept for each year; the slopes of these fitted lines are termed uWUEp (Zhou et al., 2016) (hereafter, Z16). The apparent uWUE slopes (uWUEa) were defined for each day separately by fitting the 30 min ET values to GPP×VPD0.5 values using linear regression with zero intercept. The daily value is the ratio of the uWUEa slope and uWUEp of each year. The difference between the B16 method and the uWUE method is primarily in the process of fitting the T=ET line.
The third approach is a random forest regressor that first isolates the most likely periods when T is equal to ET, after which it trains on GPP and T relations during these periods to infer T from measured GPP (Nelson et al., 2018) (hereafter, N18). A summary of these methods and their requirements is featured in Table 1 for convenience. In addition, an ET partitioning method that does not assume equality between T and ET during any periods was tested, but it could not be applied at this site because the monthly multiyear correlations between ET and GPP were not significant (Fig. S5) (Scott and Biederman, 2017).
2.7 Stage-2 soil evaporation
The estimated daily E was assessed using the stage-2 soil evaporation theory each year during the early dry season. During stage-2 conditions of soil evaporation, the evaporation is controlled by the soil moisture and soil physical properties (desorptivity) (Brutsaert and Chen, 1995; Hu and Lei, 2021). After the rainfall event, the cumulative daily E can be expressed as , where De is the soil desorptivity to be determined, and td is the dry-down duration in days. By regressing cumulative daily E inferred from the aforementioned partitioning methods upon for a single dry-down period, the De can be computed and compared to literature values. The rainfall events were chosen from the end of April onwards, and all rainfall events were higher than 10 mm. The dry-down periods varied from 12 to 30 d. The expected range of De based on several experiments is about 3 to 6 mm d for sandy soils (Brutsaert and Chen, 1995).
2.8 Grass transpiration
The grass transpiration (Tg) was estimated from step-shaped diurnal changes in soil moisture for the last 4 years (Jackisch et al., 2020). The method estimates root water uptake from the daily change in root zone soil moisture, and it was applied to each soil moisture measurement from 10 to 60 cm. Total daily grass transpiration is the sum of daily changes in each soil moisture layer. The algorithm considers only periods when soil moisture measurement has characteristic root water uptake decline and excludes periods of percolation (Jackisch et al., 2020). Twelve percent of the estimated Tg values exceeded daily ET and were replaced with the daily ET values. The daily grass transpiration was set to zero during the dry season, defined by a MODIS LAI value of less than 0.3. The portion of soil evaporation was removed from the grass transpiration estimate by removing a constant 0.28 mm d−1, which is the mean daily dry-season evaporation from the B16 method, from the estimated daily grass transpiration. This constant value was used instead of the daily E from ET partitioning methods because the EC-estimated daily E values were unrealistically high compared with the estimated grass transpiration. This is because the soil moisture measurements may not fully capture the soil evaporation of the EC footprint.
2.9 Satellite data
Changes in vegetation cover were quantified using the monthly average of the MODIS 16 d enhanced vegetation index (EVI) with a 250 m spatial resolution (MOD13Q1, Collection 6) (Didan, 2015). The monthly average of MODIS 8 d LAI (MOD15A2H, Collection 6) with a 500 m spatial resolution was used to relate monthly to LAI, comparing estimated to variations in vegetation phenology. The EVI signal is a ratio of spectral bands, whereas the LAI has corrected units of foliage area per ground area. For the last 3 years, Landsat 8 L2 16 d NDVI with a 30 m spatial resolution was used to determine separate grass and tree NDVI for the EC footprint (Fig. 1). Cloud- and cloud-shadow-affected Landsat pixels were removed using automated cloud cover identification (Braaten et al., 2015).
2.10 Rainy-season timing and green-up dates
Rainy-season length (Twet) was estimated based on a climatological threshold of 5 % of the mean annual rainfall (Guan et al., 2014). The start of the rainy season was defined as the day when cumulative rainfall of the hydrological year (September to August) reached the threshold value of 27 mm, which was based on the long-term mean annual rainfall (540 mm yr−1). Similarly, the end of the rainy season was estimated as the first day when cumulative rainfall, starting backward from the end of the hydrological year (August), reached the same threshold value. Early wet-season (September to November) precipitation was characterized by estimating the mean daily rainfall statistics using the daily mean precipitation amount (α) and daily mean storm frequency (λ). The daily mean precipitation amount was calculated as the mean precipitation of rainy days, and the mean storm frequency was calculated as the inverse of the mean time between rainy days.
The tree green-up date, estimated from the raw 16 d EVI time series (Archibald and Scholes, 2007), was defined as the day when the EVI signal was higher than the moving average of the previous four time steps at the beginning of the hydrological year, which is the time when the EVI time series experiences a sudden increase.
Before addressing the study objectives, we first present the variability in precipitation and LAI (or EVI). Next, the outcomes of the three ET partitioning methods summarized in Table 1 are featured. The tree and grass dynamics are outlined analyzing the monthly variability in grass and tree NDVI, T, and Tg. Finally, the annual water balance components are presented. Hereafter, hydrological years are defined as the time period from September to August and are referred to by the year in which they began.
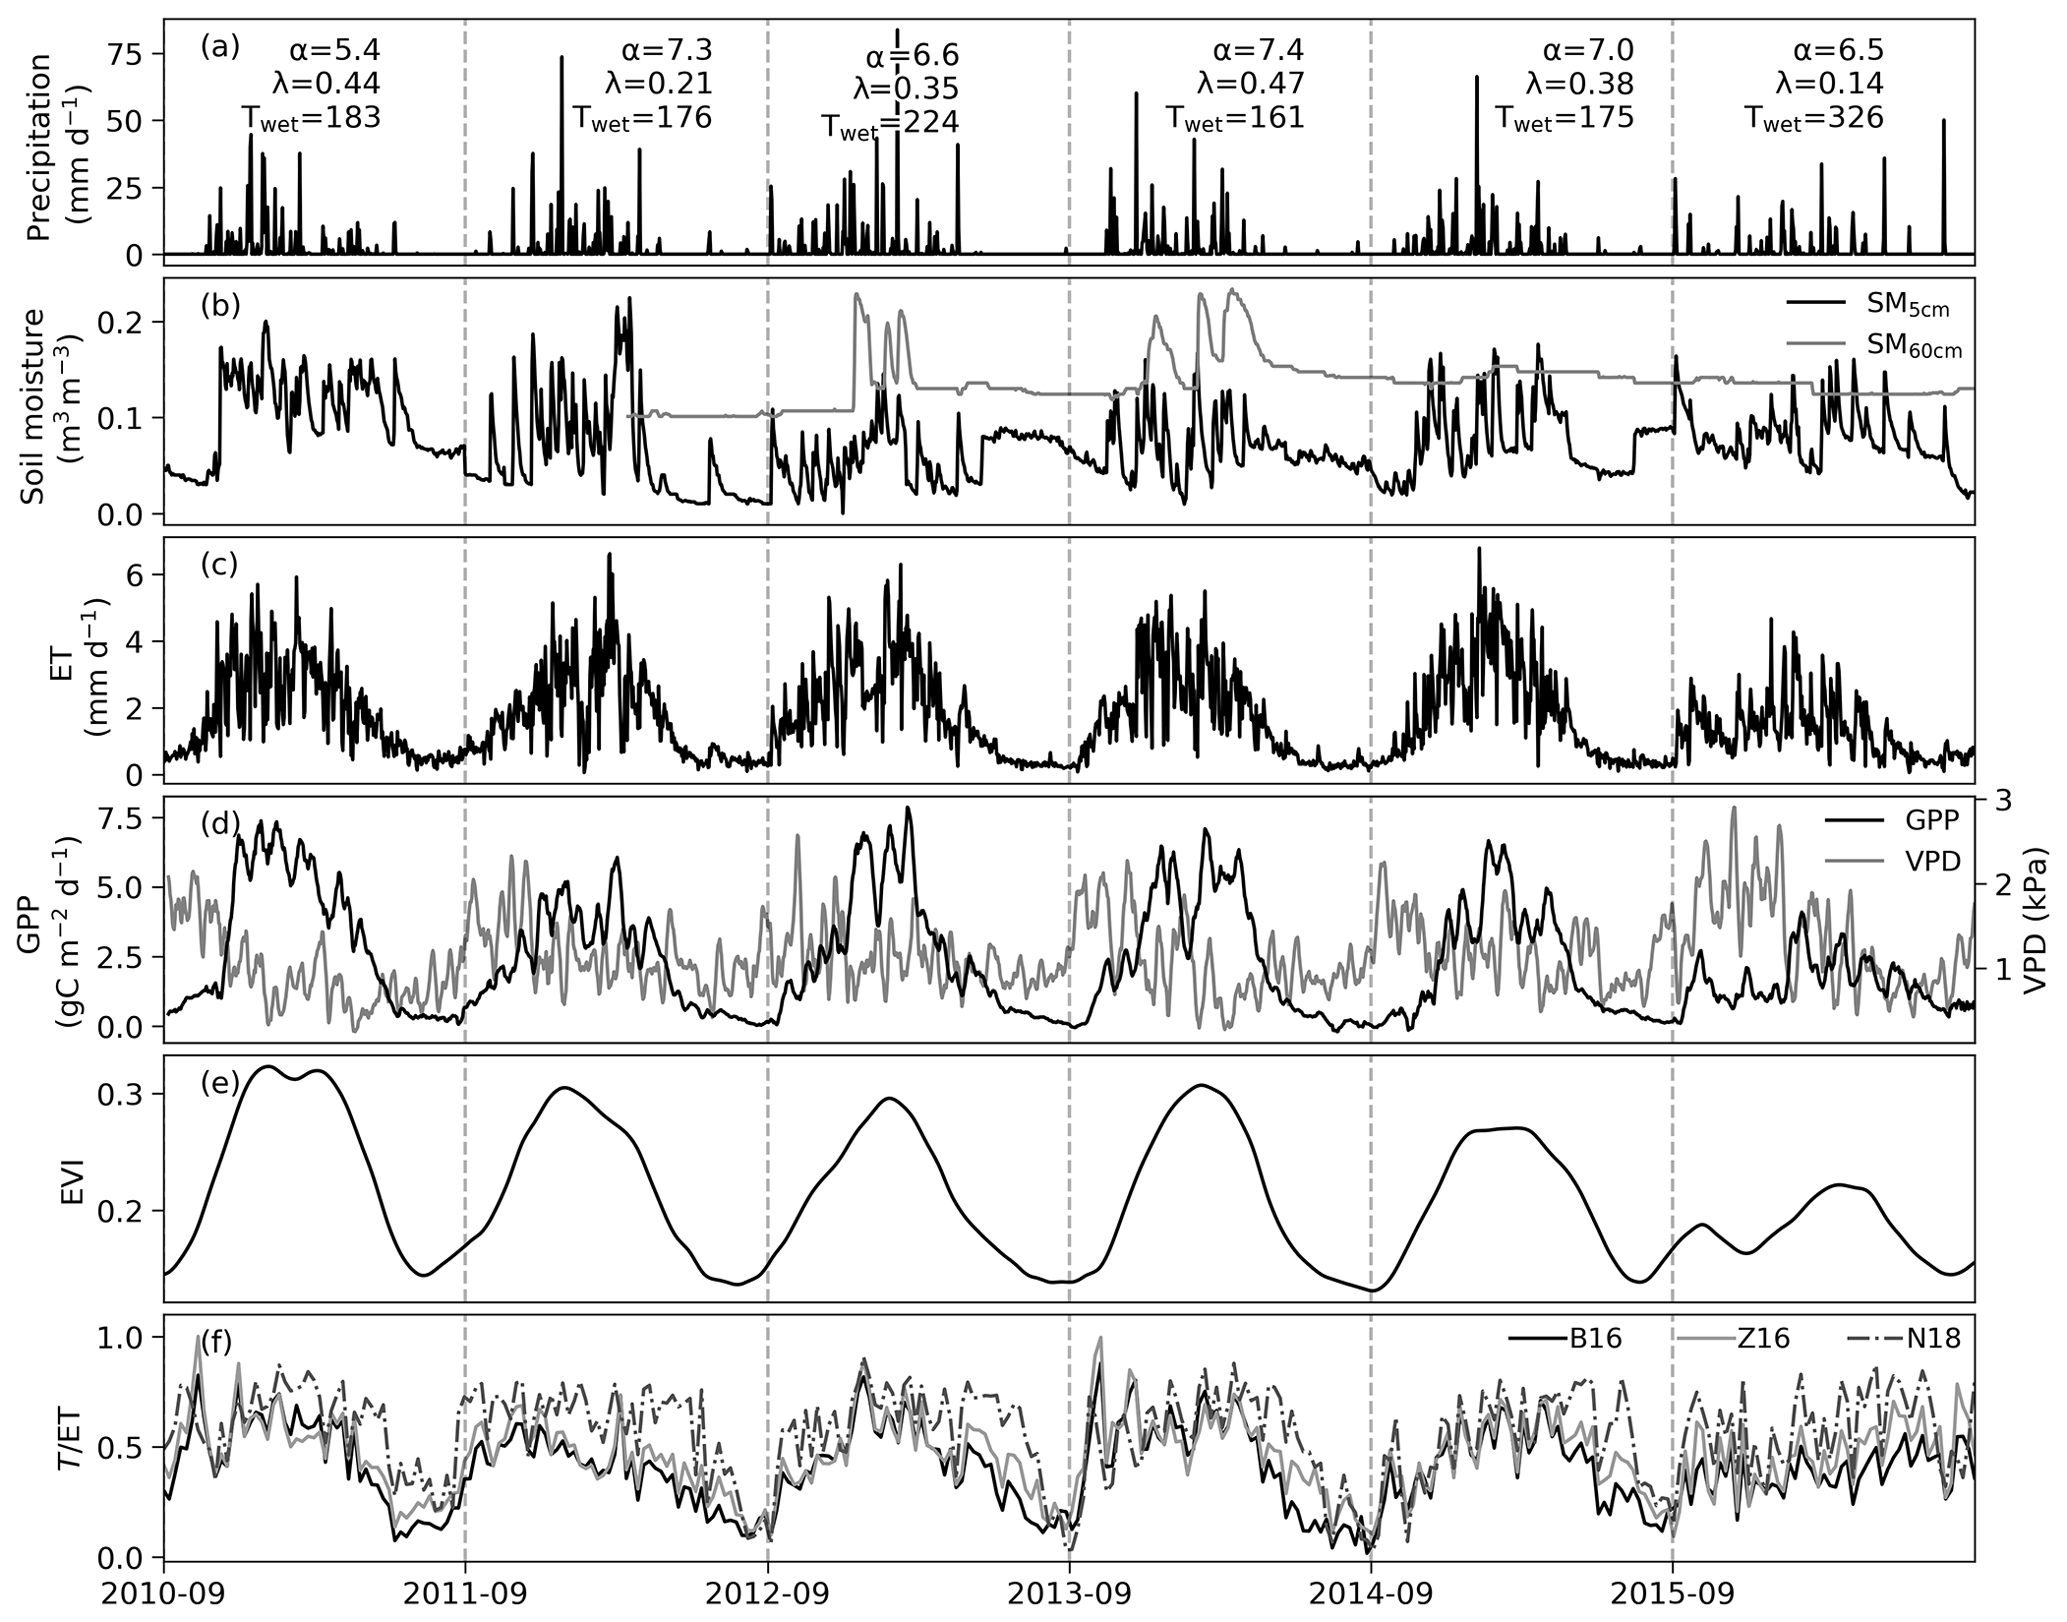
Figure 2Time series of daily precipitation, soil moisture at 10 and 60 cm depth, EC-based evapotranspiration, GPP, VPD, EVI, and 7 d average for the B16, Z16, and N18 methods. The GPP and VPD lines show the 7 d running mean. Rainy-season length Twet (days), daily mean precipitation amount (λ), and storm frequency (α) for the early wet season (September to November) are indicated for each year in panel (a).
3.1 Site meteorology and ET partitioning
The early-season rainfall was frequent in all years except 2011 and 2015 (Fig. 2a). The tree green-up days and start of the rainy period were not linearly related (R2=0.03, p=0.753; Table S1 in the Supplement): the earliest tree green-up date occurred in 2011, 72 d earlier than the start of the rainy season. The year 2015 was an extreme drought year in South Africa, and it was characterized by the lowest early-season rainfall frequency and by a rainy-season length that was nearly twice as long as in other years (Fig. 2a). Water entered the deeper soil layers in wet years 2012 and 2013 but not in the wet year 2014 nor in the drought year 2015 (Fig. 2b). There was a 2-week dry spell at the end of January 2011 and another dry spell at the end of November 2015, which are visible through the low measured ET and soil moisture values (Fig. 2b, c). Grass experienced dieback and regrowth in 2015, as shown by decreased GPP during the early wet season (Fig. 2d). This is also seen in the EVI trend, which decreases after initial increase (Fig. 2e). This period was also characterized by high VPD.
The daily estimated using the N18 method was consistently higher than the from the B16 and Z16 methods (Fig. 2f). The difference between N18 and the other methods was most significant during the end of wet seasons and during the drought year. The estimated from Z16 was higher than from B16 during the dry seasons. In the B16 method, the annually fitted line between the variable GPP×VPD0.5 and ET established the empirical link between GPP and T. The bin values of the variable GPP×VPD0.5 were linearly related to the 5th percentile of measured ET (Fig. S6), with the largest scatter occurring during the drought year (R2=0.85, in 2015). For all years, the mean surface soil moisture during T=ET instances was 0.1 m3 m−3 or less (Table S1). The annual slope of the T=ET was related to the rainy-season length, with the year 2011 falling below the 95 % confidence interval of the mean (Fig. 3a). The slope represents the T=ET values, and only 67 % of those values were from the rainy season in 2011, as opposed to 75 %–84 % in the other years (Table S1). The greater slope value in 2011 means lower water-use efficiency. The slope and intercept of the T=ET line were also linearly related (Fig. 3b). Thus, when most T=ET values are observed during the rainy season, it is possible to estimate the annual T=ET line based only on the rainy-season length for the B16 method. The annually fitted uWUEp for the Z16 method was related to the sum of Rn during the wet season (Fig. 3c).
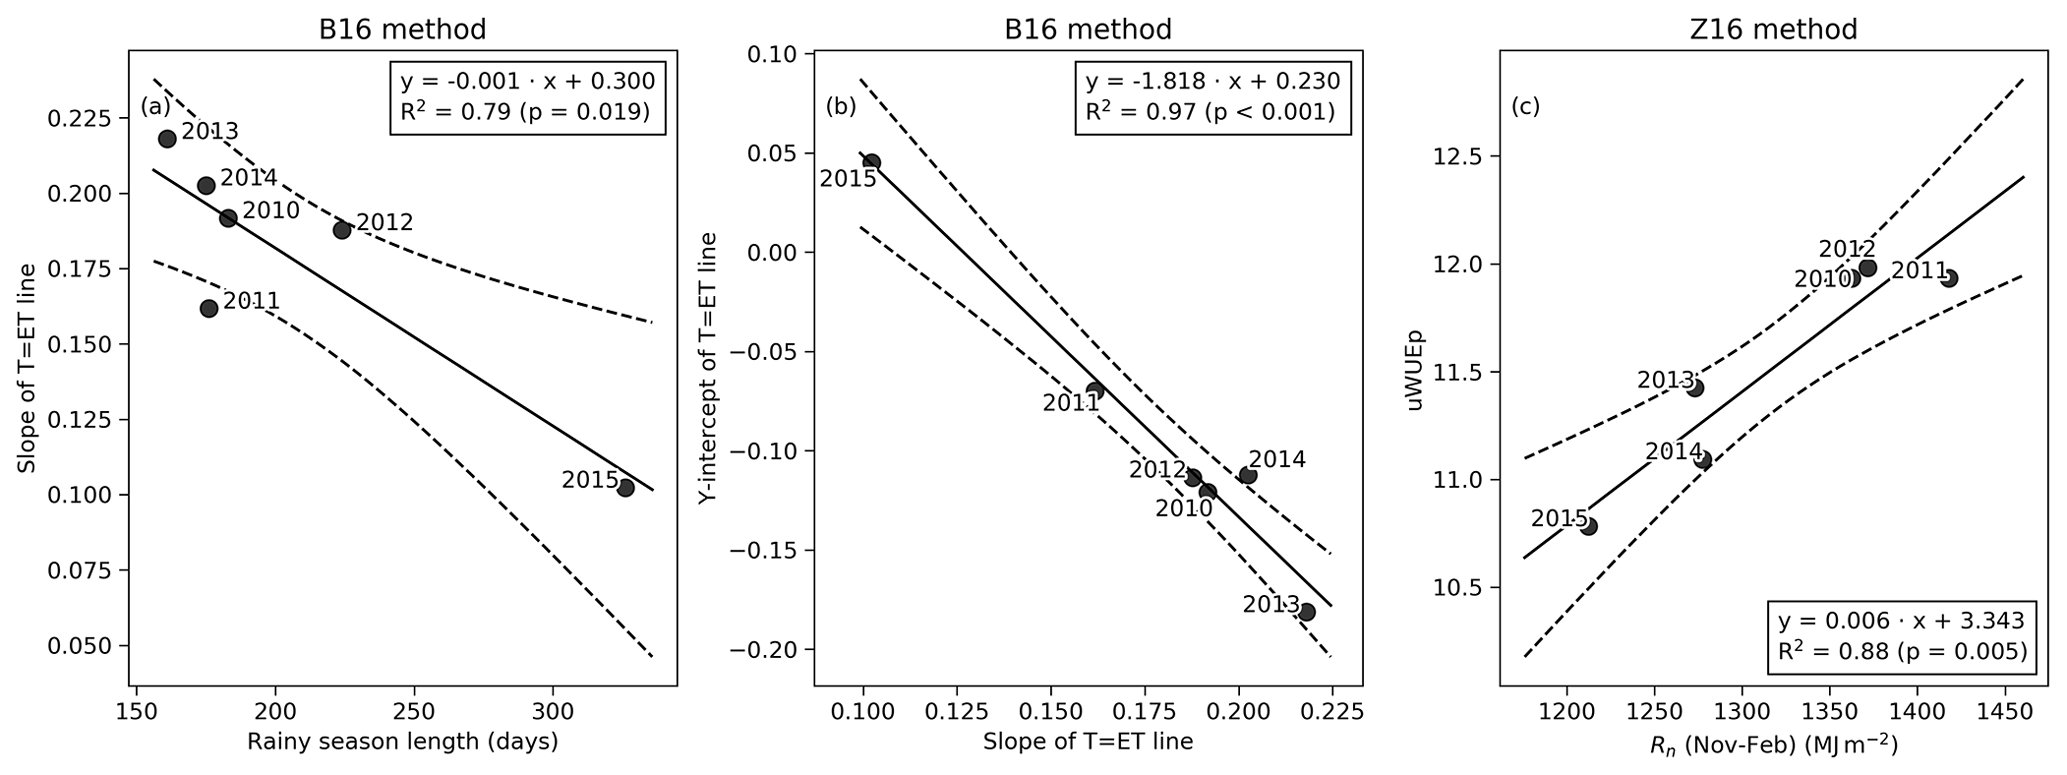
Figure 3(a) The relationship between the slope of the T=ET line (B16 method) and rainy-season length. (b) The relationship between the y intercept and the slope of the T=ET line for the B16 method. (c) The relationship between annual uWUEp (Z16 method) and wet-season Rn. Dashed lines demarcate the 95 % confidence interval.
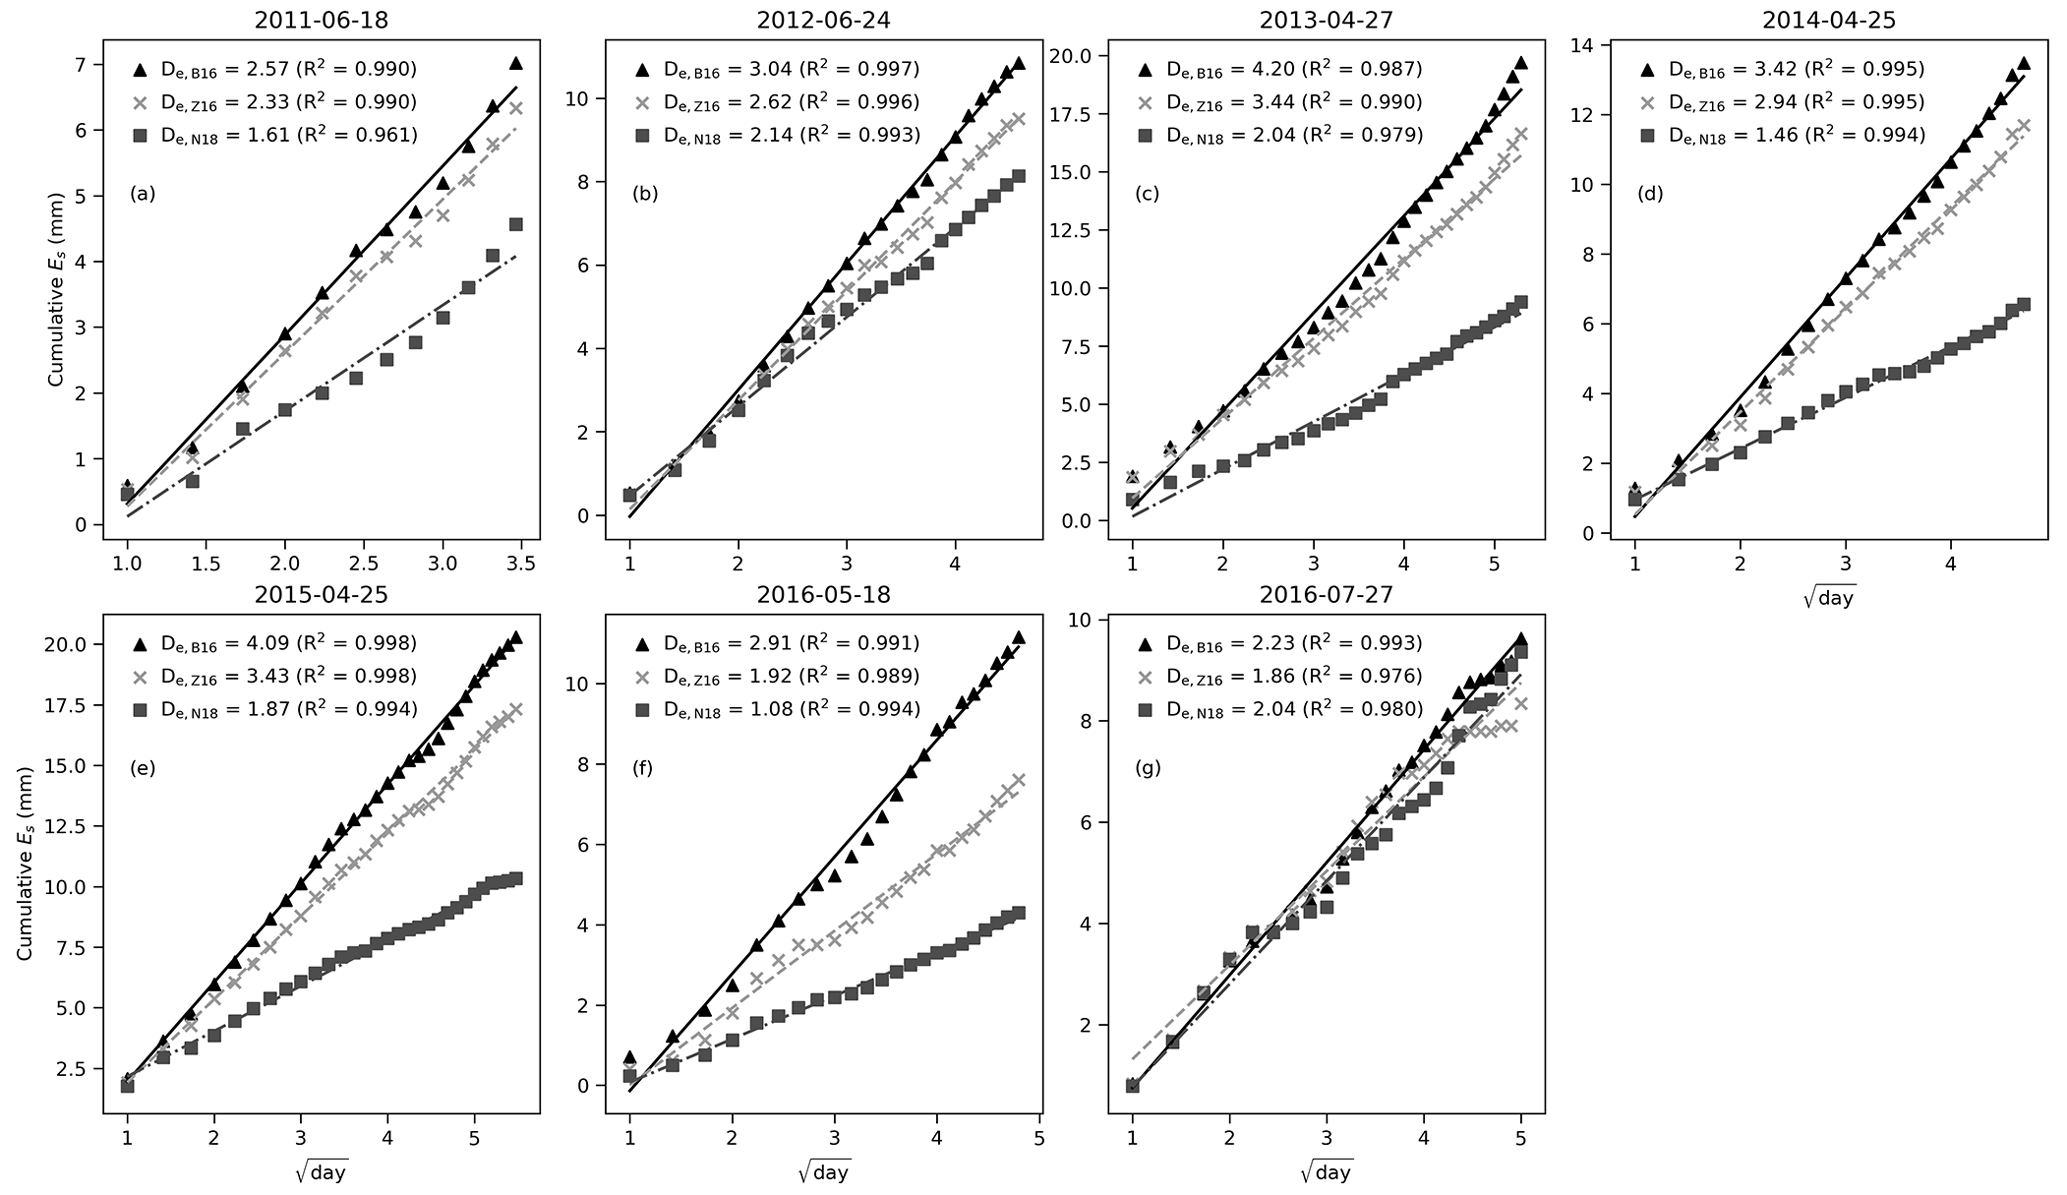
Figure 4The relationship between cumulative daily soil evaporation and (day) for the stage-2 evaporation events for the B16, Z16, and N18 methods. The slope of the regression line is soil desorptivity. Titles indicate the start date of each dry-down event.
The early dry-season daily evaporation was assessed according to the stage-2 theory of soil evaporation. The regression between cumulative daily E and is linear for all methods (Fig. 4). The derived De values are the highest for the B16 method, ranging from 2.23 to 4.20 mm d. The largest difference between the methods occurred in the late wet season in 2015, with De values of 2.91, 1.92, and 1.08 for the B16, Z16, and N18 methods, respectively (Fig. 4f). The N18 method has the lowest De values except in the middle of the dry season in 2015 (Fig. 4g). The estimated De values were linearly related to the first day air temperature for the B16 and Z16 methods (Fig. S7). Overall, the De values from the B16 method most closely match the reported range of De from other studies of sandy soils (Brutsaert and Chen, 1995; Hu and Lei, 2021).

Figure 5(a) Time series of monthly estimated with the B16, Z16, and N18 methods. (b) Time series of monthly T and Tg. (c) Time series of 16 d MODIS EVI and Landsat 8 NDVI for grasses and trees. The dotted vertical line indicates the start of the hydrological year (1 September).
3.2 Monthly tree and grass transpiration
A comparison of the three different monthly estimates shows that according to the N18 method is consistently higher than the from the other two methods during the wet seasons (Fig. 5a). The B16 and Z16 methods have similar seasonality during the wet seasons, whereas the N18 is higher than the other methods during the late wet seasons. The monthly from N18 is nearly constant during the wet season in 2011, whereas from B16 and Z16 shows a decreasing trend after the early-season peak. The largest difference between estimated with the Z16 and B16 methods occurred from March to June 2015 (Fig. 5a). During that period, according to all methods, the monthly GPP decreased while increased. The B16 soil desorption was closest to published values during this period (Fig. 4f), suggesting that Z16 and N18 overestimated during the late wet season of 2015.
Estimates of monthly T were similar based on the B16 and Z16 methods, but they were consistently higher based on the N18 method (Fig. 5b). The rainy season began 48 d later in 2014 than in 2012 (Table S1). This delay is consequently reflected in the monthly course of T (B16 method) in 2014, which lagged behind that of 2012 until January (Fig. 5b). The dry spell in 2011 is clearly shown by reduced T and ET during this period. The soil-moisture-based estimate of grass transpiration shows a similar trend to estimated T in 2012 and 2013, whereas the Tg trend is less variable than the T trend in 2014 and 2015 (Fig. 5b). In 2014, Tg was nearly constant during the wet season despite increasing grass NDVI (Fig. 5b, c).
Both the tree and grass peak NDVI values are lower during the drought year compared with the wet years 2013 and 2014 (Fig. 5c). The grass dieback is reflected in low grass NDVI after the initial increase during the early drought year. In addition, the Tg decreases during this period. The second peak in grass NDVI is similar in magnitude to the first, suggesting modest grass growth after the dieback. The grass NDVI and Tg decrease during the middle and late wet season, whereas the tree NDVI and T stay nearly constant. This means that the tree contribution to the total transpiration increases from the middle of the wet season onwards in 2015.
The monthly to LAI relation was scattered for all methods (Fig. 6a). The was higher for the Z16 method than for B16 at low LAI values. The VPD response of monthly was most nonlinear for the B16 method and least nonlinear for the N18 method (Fig. 6b). The monthly LAI–T relation was linear for all methods and was similar between the B16 and Z16 methods (Fig. 6c). The Tg was increasing for higher LAI values in 2012 and 2013, whereas it was nearly constant at 15 mm per month for a wide range of LAI values in 2014 and 2015 (Fig. 6d).

Figure 6The relationship between monthly and MODIS LAI. The black line is the relationship for shrub and grass ecosystems that is based on measured LAI values (Wei et al., 2017). The equal-width bins are fitted using the following equation: a⋅(LAI)b. (b) The relationship between monthly and monthly mean VPD. The fit line is . (c) The relationship between monthly T and MODIS LAI. (d) The relationship between monthly Tg and MODIS LAI, where colors indicate data from the 4 different years.
The monthly GPP and T were linearly related (R2=0.97, p<0.001; Fig. S8), allowing for the estimate of an effective (constant) ecosystem water-use efficiency using a zero-intercept regression. The constant water-use efficiency was 2.83, 2.78, and 2.29 g C per kg H2O for B16, Z16, and N18 methods, respectively (Fig. S8).
3.3 Interannual variation
Annual P was close to or above the mean annual rainfall of 591 mm yr−1 (adjusted here for the undercatch) for every year except in 2015, which was an extreme drought year in South Africa (Table 2). The EC-measured annual ET was close to annual P for all years (Table 2). The annual P−ET ranged from −31 to 45 mm yr−1, and it was inversely related to the annual maximum EVI (R2=0.87, p=0.007). The annual change in soil water storage was small (1 to 14 mm yr−1) compared with the variation in other water balance components, and it was unrelated to the annual P−ET (R2=0.45, p=0.332). The frequent evening and nighttime precipitation resulted in nighttime evapotranspiration (ETN), which varied from 58 to 85 mm yr−1 (12 % of annual ET). The annual P−ET would be positive for all years if ETN were assumed to be zero. The annual estimated rainfall interception ranged from 69 to 97 mm yr−1 and was linearly related to ETN (R2=0.75, p=0.025).
Table 2Annual sum of water balance components for each hydrological year (September to August). The total uncertainty (Eq. 4) is indicated for ET after the “±” sign. ETN is the annual nighttime evapotranspiration. Transpiration and evaporation estimated using the B16 method are shown. The tree transpiration (Ttree) was calculated by subtracting Tg from T. The PET was determined from Eq. (1). The EBC slope stands for the slope of the energy balance closure, with the ordinate defined by measured Rn-G and the abscissa defined by the sum of the measured latent and sensible heat fluxes.

The estimated annual ratio varied from 0.33 to 0.56 for the B16 method (Table 2). The annual from Z16 was similar to that from the B16 method (with a 0.04 higher 6-year mean), whereas the N18 mean was 0.15 higher than the B16 mean (Table S2). The in 2011 was similar to other wet years for the N18 method but reduced compared with other wet years for the B16 and Z16 methods (Tables 2, S2). The annual and T were linearly related to the early wet-season storm frequency for the B16 and Z16 methods (Fig. 7), while the relation of early-season P, middle wet-season P, annual P, or mean annual EVI with annual and T were more scattered (Figs. S9, S10, S11). For the N18 method, the annual T was linearly related to mid-wet-season P (Fig. S10), and annual T and were linearly related to mean EVI (Fig. S11).
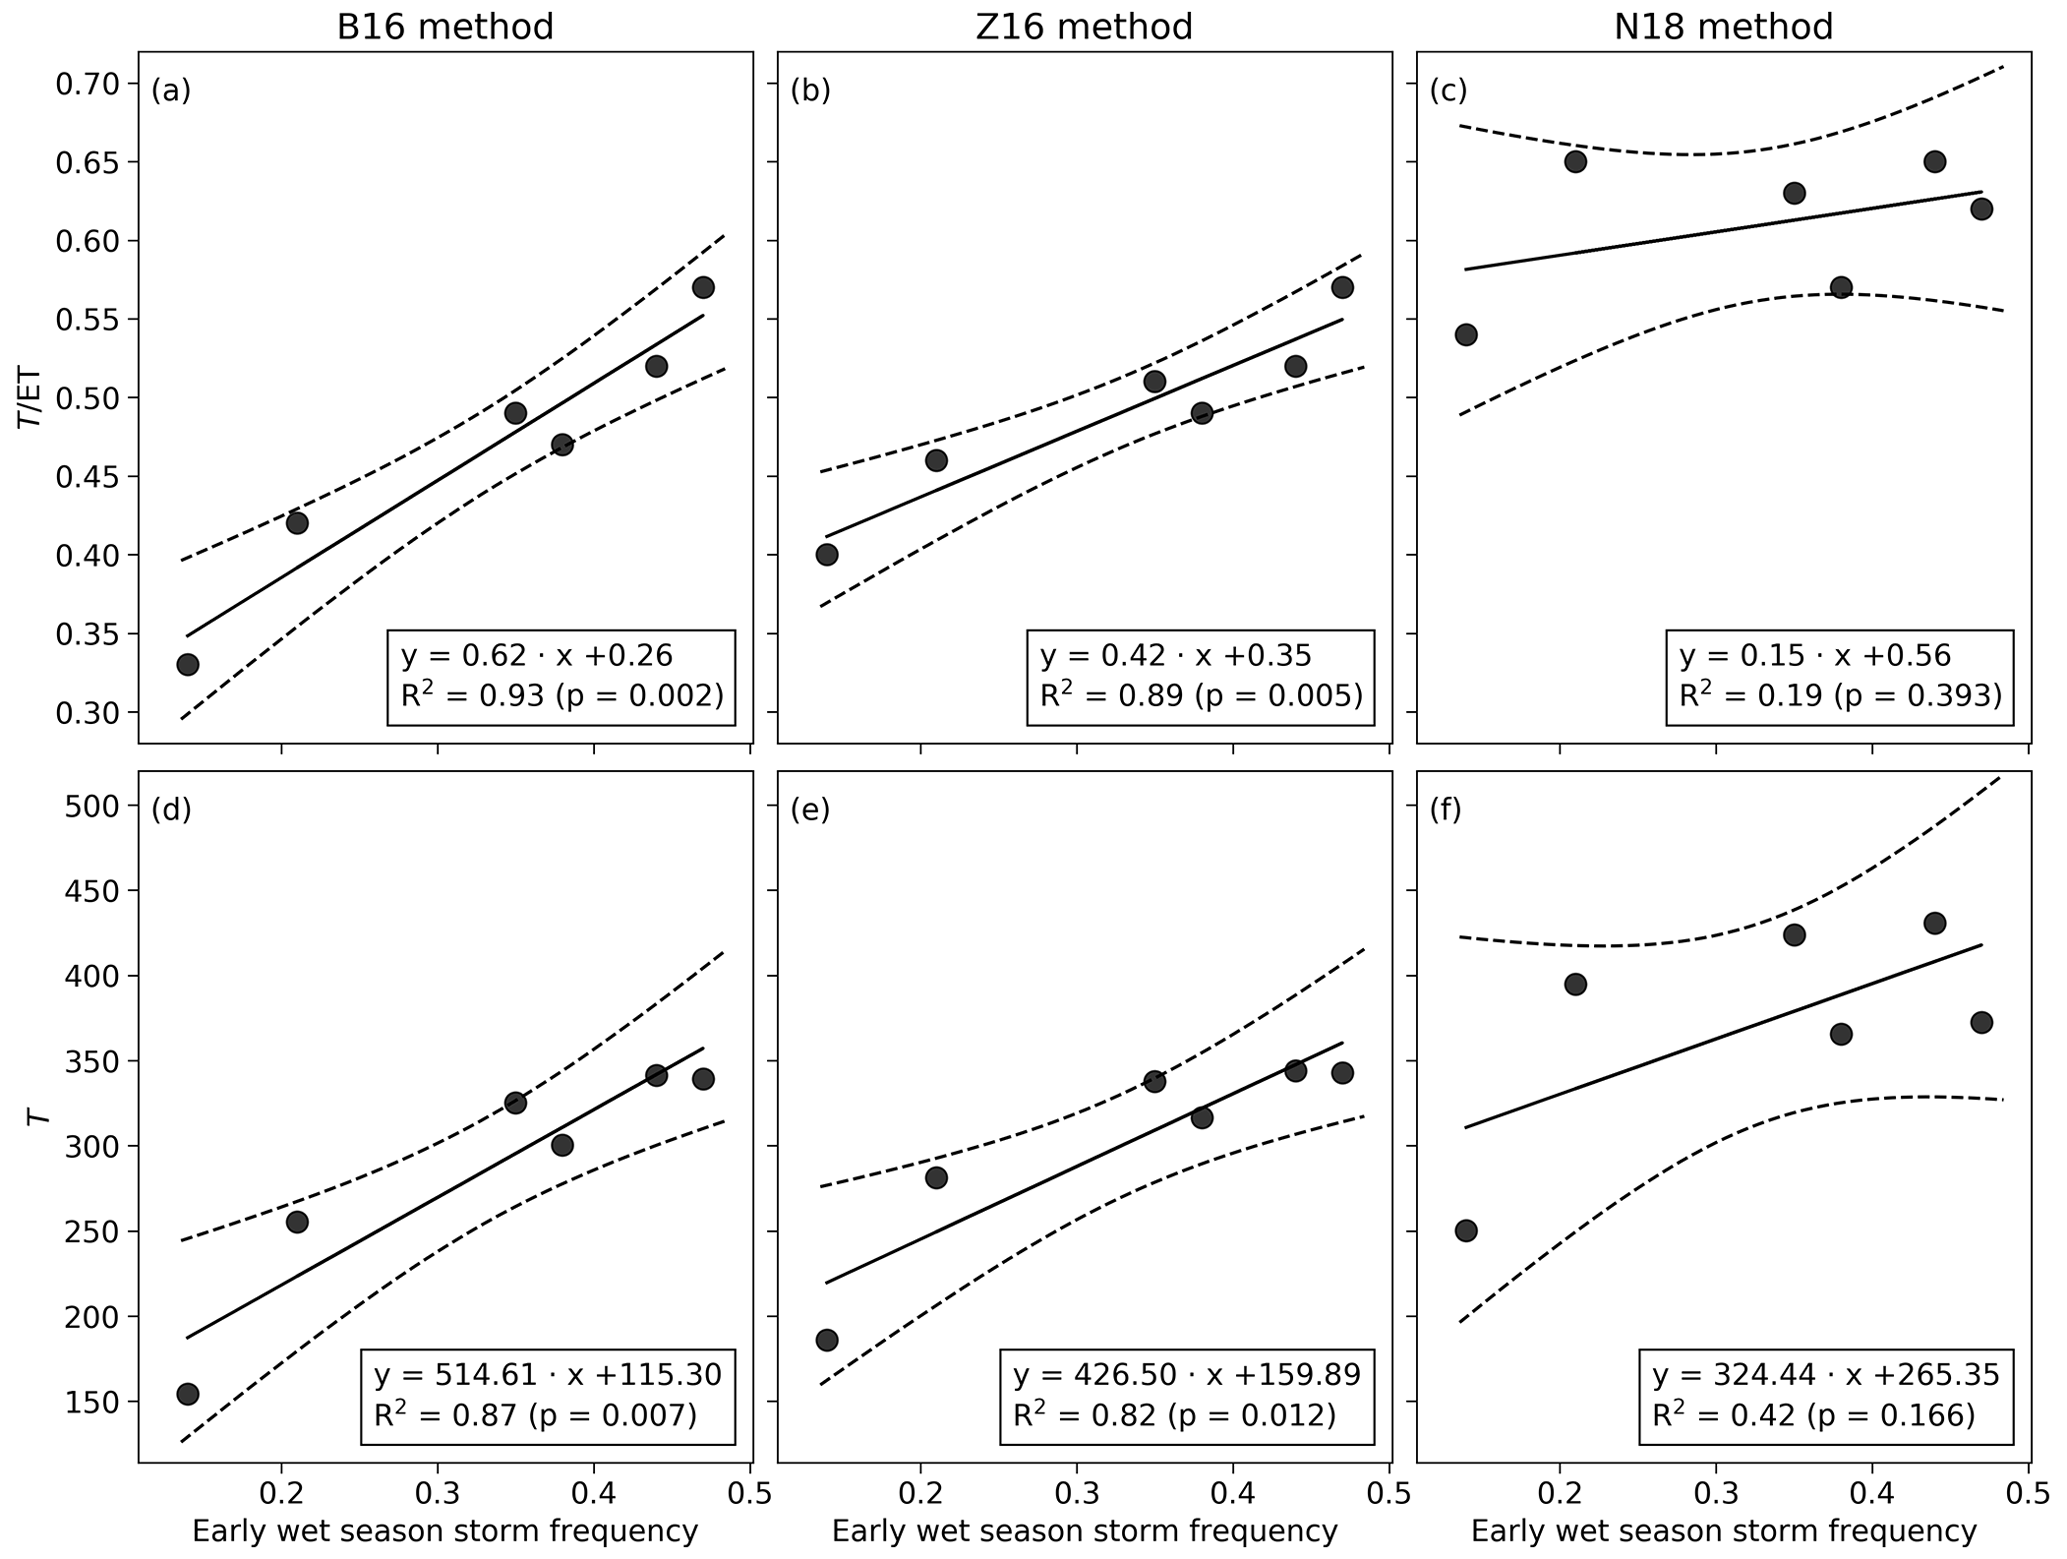
Figure 7The relationship between early wet-season storm frequency and annual and T for the B16, Z16, and N18 methods. Dashed lines demarcate the 95 % confidence intervals.
Annual transpiration was nearly constant at 326±19 mm yr−1 for the 4 years with frequent early-season rainfall (Table 2). The annual T was similar for the wet years of 2012 and 2014, despite 97 mm lower Tg and the late start of the rainy season in 2014. The lower T in 2011 is explained by the infrequent early-season rainfall and the 2-week dry spell in January. The average dry-season transpiration was 9 mm (per quarter) for the B16 method (Table S3), which suggests a minimum tree transpiration of 36 mm yr−1. The annual T−Tg representing tree transpiration ranged from 88 to 160 mm yr−1 for the 3 wet years (Table 2). The annual Tg was similar for 2014 and 2015, despite a significantly lower grass NDVI in 2015 (Fig. 5c). Therefore, during the drought year, Tg might be an overestimate due to the contribution from soil evaporation, which would explain the low value (23 mm yr−1) of tree transpiration.
At annual timescales, P was approximately equal to annual ET, consistent with other studies from sites with similar annual rainfall (Gwate et al., 2018; Scholes and Walker, 1993). Annual T was nearly constant (326±19 mm yr−1) during the 4 years with frequent early wet-season precipitation (Table 2), as has been found in different types of forest ecosystems (Oishi et al., 2010; Tor-ngern et al., 2017; Ward et al., 2018). However, it was lower in years with infrequent early wet-season rainfall, producing intermittent dry spells. The variation in annual T and was explained by the variation in the early wet-season storm frequency (Fig. 7). The monthly T was linearly related to LAI, whereas had an expected nonlinear relation to LAI (Fig. 6a, c). The constancy of annual T reflects the moderate water stress of C4 grasses shown by similar Tg during the 2 wet years (Table 2). The annual T was not reduced during the year with a late rainy-season start and lower Tg, showing that trees can use the water that is not transpired by the grass layer (Fig. 5b). However, during the extreme drought year, the peak grass and tree NDVI values were lower than during the wet years (Fig. 5c). The Tg was decreasing and grass regrowth was modest after the grass dieback from the middle to late wet season, while the tree NDVI was constant, showing a greater contribution of tree transpiration during the late wet season (Fig. 5b, c). The rainfall timing control on annual T as well as the grass dieback and regrowth dynamics show that the grasses' early-season development foreshadows the interannual variation in T and , which reflects the fact that the temporal distribution of P is a good predictor of the productivity at these Highveld grasslands (Swemmer et al., 2007).
4.1 Transpiration
The small interannual variation in transpiration is likely due to moderate water stress of the C4 grass layer as well as trees' ability to use water from shallow and deeper soil layers, depending on water availability. The photosynthesis reduction in C4 grass is more related to non-stomatal limitations compared with C3 grass, which is predominantly limited by stomatal control (Ripley et al., 2010). Under South African field conditions over one growing season, the C4 grass layer tended to maintain a constant difference between the predawn and midday leaf water potential, with similar transpiration at rain-fed and irrigated pot trials (Taylor et al., 2014). The annual Tg at Welgegund was similar during the 2 wet years, but it was lower during the year with a late start to the rainfall. During the 2015 drought year, the grass cover underwent a dieback–regrowth cycle, tree peak NDVI was less than during wet years, and the annual T was reduced by 51 % from the mean of wet years (Fig. 5b, c). The tree contribution to the total transpiration increased from the middle of the wet season onwards during the drought year, as Tg decreased while T increased (Fig. 5b). A similar grass growth pattern was also observed in Kruger National Park, where the grass biomass decreased and vast areas were barren during the drought, but the grasses quickly recovered once the rains returned (Wigley-Coetsee and Staver, 2020).
The trees at Welgegund likely rely more on topsoil water when available, switching to a greater reliance on deeper layers during dry seasons and droughts. A similar tree water-use pattern has been observed using stable isotopes in the South African savanna (Priyadarshini et al., 2016). Welgegund is located at the wet end of the distribution range of the dominant tree species V. erioloba. The estimated radiocarbon age of these trees is approximately 20 years (Steenkamp et al., 2008). The roots of V. erioloba are deep and reportedly extend to a depth of up to 60 m (Jennings, 1974); in one study, the roots absorbed 37 % of the transpired water below a depth of 1 m (Beyer et al., 2018). In addition, the horizontal extent of the roots of this species can exceed 20 m (Wang et al., 2007). When soil moisture profile measurements at the site were installed 15 m away from the nearest tree, tree roots were observed 0.4 m from the surface and deeper. The mean annual tree transpiration was 127 mm yr−1 (40 % of annual T) for the 3 wet years (Table 2). This estimate is similar to the tree transpiration of 126 mm yr−1 at a site in South Africa (Nylsvley) (P=586 mm yr−1) with 30 % tree cover and shallower tree roots (measurements and modeling; Scholes and Walker, 1993). At a savanna site in this region (P=241 mm yr−1), V. erioloba (5 m tall) had an annual/dry-season transpiration ratio of 6.5 ( mm d−1; Tfwala et al., 2019). Multiplying this ratio by the 9 mm dry-season tree transpiration in our study results in 59 mm yr−1 annual tree transpiration. This shows that the dry-season-based tree transpiration estimate is lower than the T−Tg estimated that combines the eddy-covariance estimate of T and soil-moisture-based Tg. The T−Tg tree transpiration estimate includes any error made in the Tg estimation. The overestimation of Tg likely explains the low tree transpiration during the drought year. Removing the constant soil evaporation from the Tg estimate may not be adequate during the drought year, leading to a soil evaporation contribution to Tg. The Tg estimation algorithm also has lower performance in dryer soils (Jackisch et al., 2020). The estimated long-term water-use efficiency was 2.83 and 2.78 g C per kg H2O for the respective B16 and Z16 methods. This is somewhat higher than the wet-season value of 2.4 g C per kg H2O (Z16 method) at a C4 grassland site in southeastern Arizona, USA (Scott et al., 2021), and the field-scale long-term grass community value of 2.15 g C per kg H2O for the aforementioned savanna with shallower-rooted trees and 30 % tree cover in Nylsvley (Scholes and Walker, 1993).
During water-stressed years, the partitioning of the tree and grass contribution to LAI and may be needed to derive meaningful relations at the monthly scale. The drought year was characterized by different grass and tree NDVI trends (Fig. 5c) as well as nearly constant grass transpiration for a wide range of LAI values (Fig. 6d). New remote sensing products may be able to separate these contributions, as shown by a recent study that successfully separated tree and grass leaf area using a canopy height model, Sentinel vegetation indexes (10 m spatial resolution), and a Sentinel radar band during the 2015 drought in Kruger National Park (Urban et al., 2018). The effect of dieback–regrowth on annual transpiration is also interesting, as a stochastic model based on measured precipitation statistics with explicit bare soil, grass, and tree cover showed that vegetation dynamics had little effect on annual transpiration (Williams and Albertson, 2005).
Water availability for grass is the dominant factor in transpiration at Welgegund. The annual range (0.33 to 0.56) at Welgegund is slightly wider than the mean annual range of 0.35 to 0.46 at a C4 grassland site in southeastern Arizona, USA (P=317 mm yr−1), where the annual correlates with annual P and mean LAI (Scott et al., 2021). At Welgegund, the early-season rainfall frequency was a better predictor of annual T than annual P or mean EVI (Figs. 7, S10, S11). These relations might be due to the heavy grazing at the site, which limits peak EVI and emphasizes the early-season grass development. The analysis of the different C4 grass species during the 2014–2016 South African drought suggests that their bundle sheath morphology explains the differences in drought tolerance (Wigley-Coetsee and Staver, 2020). Therefore, it is difficult to generalize whether the invariance in annual transpiration during the wet years would hold for sites with higher grass LAI or a different grass species composition.
4.2 Uncertainty
The 6-year mean ratio was 1.0 at Welgegund (Table 2), slightly higher than a long-term ratio of 0.96 at a C4 grassland in Arizona, USA (Scott and Biederman, 2019). The lowest annual P−ET was −31 mm yr−1, which is more negative than the estimated annual ET uncertainty but less than the uncertainty related to ETN gap filling (Table 2). Due to frequent afternoon and nighttime precipitation, the ETN was 12 % of the annual ET. The ETN values here may appear high, but they are commensurate with reported values for forested ecosystems (Novick et al., 2009) in regions with higher precipitation and LAI. The gap-filled ETN may be an overestimate because only 30 % of the values were measured, and these values were determined during high wind speeds ( m s−1).
The ratio of annual ET uncertainty to annual ET was 1.3 %, which is lower than the 5 % to 9 % range reported from eddy-covariance ET measurements from a cultivated area in Benin (Mamadou et al., 2016). The difference can be ascribed to different error terms used in the uncertainty estimation. The ET in the middle of the dry season ranged from 45 to 68 mm (per quarter; middle dry-season monthly value multiplied by 3) at this cultivated site in Benin, which has isolated trees (height < 10 m) and bare soil during the dry season (Mamadou et al., 2014, 2016). This is higher than the 29 to 52 mm (per quarter) range measured in our study. These differences may be attributed to the relatively shallow water table (a depth of 3 m during the dry season) and the higher annual precipitation (P=1200 mm yr−1) at the Beninese site.
4.3 ET partitioning methods
The B16 and Z16 transpiration estimates were more similar and closer to reported grassland values than the N18 estimate (Fig. 5a). The N18 estimate was also higher than the Z16 estimate at the C4 grassland site in southeastern Arizona, USA (Scott et al., 2021). The annual maximum of monthly ranged from 0.57 to 0.67 for the 4 wet years (B16 and Z16 methods), which is similar to the maximum value of 0.60 at a C4 grassland site in southeastern Arizona, USA, estimated using the ET partitioning method that does not assume equality between T and ET (Scott and Biederman, 2017). The assessment of soil evaporation according to stage-2 theory (Fig. 4) showed that the B16-estimated De most closely matched the reported range of De (3 to 6 mm d) from other studies of sandy soils (Brutsaert and Chen, 1995; Hu and Lei, 2021). The largest difference in De between the B16 and Z16 methods occurred in the late wet season in 2015, when the Z16 was deemed an overestimate based on the low De value of 1.92 mm d. The estimated De values were linearly related to the air temperature on the first day for the B16 and Z16 methods (Fig. S7). Similar dependence has been observed under laboratory conditions with the full wetting of sandy soil columns (Ben Neriah et al., 2014). For the Z16 method, a one-to-one T=ET line is fitted using quantile regression for each year combined with the intercept forced through zero, whereas the T=ET line is fitted using linear regression over the GPP×VPD0.5 bins for the B16 method. Regarding the N18 method, T was likely an overestimate for several reasons. The estimated De values were much lower than the literature values, and the annual values had much higher range (0.54 to 0.65) than other methods and studies (Scholes and Walker, 1993; Scott et al., 2021). In addition, the tree transpiration estimated using N18 (by subtracting estimated grass transpiration from N18 estimated annual T) results in an average annual tree transpiration of 193 mm over the 3 wet years, which is much higher than values reported in the literature. The N18 algorithm does not use measured soil moisture in the training period; instead, it uses the P and ET water balance, which may explain the small interannual variance in the maximum values (Nelson et al., 2018).
The low surface soil moisture values during T=ET periods and their concentration during the rainy season give assurance that the annual fitted T=ET lines correspond to periods when T equals ET (Table S1). The annual T=ET line could be predicted using the rainy-season length, except in 2011, which experienced the earliest green-up of trees and the highest number of T=ET moments outside of the rainy season (Fig. 4a, Table S1). The water balance analysis, focused on monthly and annual timescales using the ET partition methods, has shown good agreement with independent estimates (Berkelhammer et al., 2016; Zhou et al., 2018). Berkelhammer et al. (2016) showed that a 3 d running mean of the 30 min estimates reduced the root-mean-square difference between the Berkelhammer method (B16) and the isotopic estimate of to ≤0.2. Therefore, the random error of the monthly means of the 30 min estimates in this study can be assumed to be small. For a Mediterranean tree–grass savanna, was shown to rarely exceed 0.8 (Perez-Priego et al., 2018). In contrast to the Mediterranean site, the Welgegund site has sandy soil, deep-rooted trees, and no clay horizon close to the soil surface. More importantly, the mean surface soil moisture was 0.1 m3 m−3 or below for the 30 min runs when T=ET at Welgegund. This low soil moisture resulted in small diffusion-limited soil evaporation and, thus, periods when T=ET. This is another independent confirmation of the partitioning of ET into E and T (even at such short timescales).
The measurements reported here show that annual transpiration is nearly constant during years with frequent early-season rainfall but can be lower because the C4 grass cover reacts to dry spells. Trees at the site are likely able to utilize water that is not used by the grass layer as well as water from deeper layers during extreme drought. Our work highlights precipitation control over T and the annual variation in the T–LAI relationship. These results can be used to assess the water resources and fodder production of grassland grazing systems. Although further work is required to determine the generality of these conclusions to other savanna systems, the methodologies developed and tested here can be employed when investigating a wide range of arid and semiarid ecosystems experiencing water shortages in times of drought.
The data used in this study are available online: https://doi.org/10.6084/m9.figshare.11322464 (Räsänen et al., 2019).
The supplement related to this article is available online at: https://doi.org/10.5194/hess-26-5773-2022-supplement.
MR, RO, and GK designed the analysis. VV, MA, and JT performed the EC data processing. MA, VV, PB, JT, PVZ, MJ, SS, TL, LL, MK, and JR conducted the measurements. All authors contributed to the final version of the paper.
The contact author has declared that none of the authors has any competing interests.
Publisher's note: Copernicus Publications remains neutral with regard to jurisdictional claims in published maps and institutional affiliations.
This work was supported by the Finnish Meteorological Institute, North-West University, the University of Helsinki, the Finnish Academy project “Developing the atmospheric measurement capacity in Southern Africa”. This publication forms part of the output of the Biogeochemistry Research Infrastructure Platform (BIOGRIP) of the Department of Science and Innovation of South Africa. Financial support for Ram Oren was provided by the Erkko Visiting Professor Programme of the Jane and Aatos Erkko 375th Anniversary Fund, through the University of Helsinki. Gabriel Katul acknowledges partial support from the US National Science Foundation (grant nos. NSF-AGS-1644382, NSF-AGS-2028633, and NSF-IOS-175489). The corresponding author wishes to thank Janne Heiskanen for discussions on the Landsat data analysis. The authors acknowledge the ranchers for their help with the setup and instrument maintenance.
This research has been supported by the Academy of Finland (grant no. 272041) and the European Commission, Horizon 2020 framework program (SEACRIFOG; project no. 730995).
Open-access funding was provided by the Helsinki University Library.
This paper was edited by Loes van Schaik and reviewed by two anonymous referees.
Archibald, S. and Scholes, R. J.: Leaf green-up in a semi-arid African savanna – separating tree and grass responses to environmental cues, J. Veg. Sci., 18, 583–594, https://doi.org/10.1111/j.1654-1103.2007.tb02572.x, 2007.
Aurela, M., Lohila, A., Tuovinen, J.-P., Hatakka, J., Riutta, T., and Laurila, T.: Carbon dioxide exchange on a northern boreal fen, Boreal Environ. Res., 14, 699–710, 2009.
Baldocchi, D., Falge, E., Gu, L., Olson, R., Hollinger, D., Running, S., Anthoni, P., Bernhofer, C., Davis, K., Evans, R., Fuentes, J., Goldstein, A., Katul, G., Law, B., Lee, X., Malhi, Y., Meyers, T., Munger, W., Oechel, W., U, K. T. P., Pilegaard, K., Schmid, H. P., Valentini, R., Verma, S., Vesala, T., Wilson, K., and Wofsy, S.: FLUXNET: A new tool to study the temporal and spatial variability of ecosystem-scale carbon dioxide, water vapor, and energy flux densities, B. Am. Meteorol. Soc., 82, 2415–2434, 2001.
Barnes, R. D., Fagg, C. W., and Milton, S. J.: Acacia Erioloba: Monograph and Annotated Bibliography, Oxford Forestry Institute, University of Oxford, https://ora.ox.ac.uk/objects/uuid:9f260e92-d72d-4fff-988d-5ef95e716f94 (last access: 15 November 2022), 1997.
Bengtsson, J., Bullock, J. M., Egoh, B., Everson, C., Everson, T., O'Connor, T., O'Farrell, P. J., Smith, H. G., and Lindborg, R.: Grasslands – more important for ecosystem services than you might think, Ecosphere, 10, e02582, https://doi.org/10.1002/ecs2.2582, 2019.
Ben Neriah, A., Assouline, S., Shavit, U., and Weisbrod, N.: Impact of ambient conditions on evaporation from porous media, Water Resour. Res., 50, 6696–6712, https://doi.org/10.1002/2014WR015523, 2014.
Berkelhammer, M., Noone, D. C., Wong, T. E., Burns, S. P., Knowles, J. F., Kaushik, A., Blanken, P. D., and Williams, M. W.: Convergent approaches to determine an ecosystem's transpiration fraction, Global Biogeoch. Cy., 30, 933–951, https://doi.org/10.1002/2016GB005392, 2016.
Beukes, J. P., Venter, A. D., Josipovic, M., Zyl, P. G. V., Vakkari, V., Jaars, K., Dunn, M., and Laakso, L.: Chapter 6 – Automated Continuous Air Monitoring, in: Monitoring of Air Pollutants, vol. 70, edited by: Forbes, P. B. C., Elsevier, 183–208, https://doi.org/10.1016/bs.coac.2015.09.006, 2015.
Beyer, M., Hamutoko, J. T., Wanke, H., Gaj, M., and Koeniger, P.: Examination of deep root water uptake using anomalies of soil water stable isotopes, depth-controlled isotopic labeling and mixing models, J. Hydrol., 566, 122–136, https://doi.org/10.1016/j.jhydrol.2018.08.060, 2018.
Braaten, J. D., Cohen, W. B., and Yang, Z.: Automated cloud and cloud shadow identification in Landsat MSS imagery for temperate ecosystems, Remote Sens. Environ., 169, 128–138, https://doi.org/10.1016/j.rse.2015.08.006, 2015.
Brutsaert, W. and Chen, D.: Desorption and the two Stages of Drying of Natural Tallgrass Prairie, Water Resour. Res., 31, 1305–1313, https://doi.org/10.1029/95WR00323, 1995.
Bulcock, H. H. and Jewitt, G. P. W.: Modelling canopy and litter interception in commercial forest plantations in South Africa using the Variable Storage Gash model and idealised drying curves, Hydrol. Earth Syst. Sci., 16, 4693–4705, https://doi.org/10.5194/hess-16-4693-2012, 2012.
Didan, K.: MOD13Q1 MODIS/Terra Vegetation Indices 16-Day L3 Global 250 m SIN Grid V006, NASA EOSDIS Land Processes DAAC, https://doi.org/10.5067/MODIS/MOD13Q1.006, 2015.
Do, F. C., Rocheteau, A., Diagne, A. L., Goudiaby, V., Granier, A., and Lhomme, J.-P.: Stable annual pattern of water use by Acacia tortilis in Sahelian Africa, Tree Physiol., 28, 95–104, https://doi.org/10.1093/treephys/28.1.95, 2008.
D'Onofrio, D., Sweeney, L., von Hardenberg, J., and Baudena, M.: Grass and tree cover responses to intra-seasonal rainfall variability vary along a rainfall gradient in African tropical grassy biomes, Scient. Rep., 9, 2334, https://doi.org/10.1038/s41598-019-38933-9, 2019.
Foken, T. and Wichura, B.: Tools for quality assessment of surface-based flux measurements, Agr. Forest Meteorol., 78, 83–105, https://doi.org/10.1016/0168-1923(95)02248-1, 1996.
Gash, J. H. C., Lloyd, C. R., and Lachaud, G.: Estimating sparse forest rainfall interception with an analytical model, J. Hydrol., 170, 79–86, https://doi.org/10.1016/0022-1694(95)02697-N, 1995.
Godde, C. M., Boone, R. B., Ash, A. J., Waha, K., Sloat, L. L., Thornton, P. K., and Herrero, M.: Global rangeland production systems and livelihoods at threat under climate change and variability, Environ. Res. Lett., 15, 044021, https://doi.org/10.1088/1748-9326/ab7395, 2020.
Guan, K., Wood, E. F., Medvigy, D., Kimball, J., Pan, M., Caylor, K. K., Sheffield, J., Xu, X., and Jones, M. O.: Terrestrial hydrological controls on land surface phenology of African savannas and woodlands, J. Geophys. Res.-Biogeo., 119, 1652–1669, https://doi.org/10.1002/2013JG002572, 2014.
Gwate, O., Mantel, S. K., Gibson, L. A., Munch, Z., and Palmer, A. R.: Exploring dynamics of evapotranspiration in selected land cover classes in a sub-humid grassland: A case study in quaternary catchment S50E, South Africa, J. Arid Environ., 157, 66–76, https://doi.org/10.1016/j.jaridenv.2018.05.011, 2018.
Hari, P., Mäkelä, A., and Pohja, T.: Surprising implications of the optimality hypothesis of stomatal regulation gain support in a field test, Funct. Plant Biol., 27, 77–80, 2000.
Hu, H., Chen, L., Liu, H., Ali Khan, M. Y., Tie, Q., Zhang, X., and Tian, F.: Comparison of the vegetation effect on et partitioning based on eddy covariance method at five different sites of Northern China, Remote Sens., 10, 1755, https://doi.org/10.3390/rs10111755, 2018.
Hu, X. and Lei, H.: Evapotranspiration partitioning and its interannual variability over a winter wheat-summer maize rotation system in the North China Plain, Agr. Forest Meteorol., 310, 108635, https://doi.org/10.1016/j.agrformet.2021.108635, 2021.
Hubert, M. and Vandervieren, E.: An adjusted boxplot for skewed distributions, Comput. Stat. Data Anal., 52, 5186–5201, https://doi.org/10.1016/j.csda.2007.11.008, 2008.
Hutley, L. B., O'Grady, A. P., and Eamus, D.: Monsoonal Influences on Evapotranspiration of Savanna Vegetation of Northern Australia, Oecologia, 126, 434–443, 2001.
Jaars, K., van Zyl, P. G., Beukes, J. P., Hellén, H., Vakkari, V., Josipovic, M., Venter, A. D., Räsänen, M., Knoetze, L., Cilliers, D. P., Siebert, S. J., Kulmala, M., Rinne, J., Guenther, A., Laakso, L., and Hakola, H.: Measurements of biogenic volatile organic compounds at a grazed savannah grassland agricultural landscape in South Africa, Atmos. Chem. Phys., 16, 15665–15688, https://doi.org/10.5194/acp-16-15665-2016, 2016.
Jackisch, C., Knoblauch, S., Blume, T., Zehe, E., and Hassler, S. K.: Estimates of tree root water uptake from soil moisture profile dynamics, Biogeosciences, 17, 5787–5808, https://doi.org/10.5194/bg-17-5787-2020, 2020.
Jennings, C. M. H.: The hydrology of botswana, PhD thesis, University of Natal, http://hdl.handle.net/10413/8524 (last access: 15 November 2022), 1974.
Katul, G., Manzoni, S., Palmroth, S., and Oren, R.: A stomatal optimization theory to describe the effects of atmospheric CO2 on leaf photosynthesis and transpiration, Ann. Bot., 105, 431–442, 2010.
Katul, G. G., Palmroth, S., and Oren, R.: Leaf stomatal responses to vapour pressure deficit under current and CO2-enriched atmosphere explained by the economics of gas exchange, Plant Cell Environ., 32, 968–979, 2009.
Kljun, N., Calanca, P., Rotach, M. W., and Schmid, H. P.: A simple two-dimensional parameterisation for Flux Footprint Prediction (FFP), Geosci. Model Dev., 8, 3695–3713, https://doi.org/10.5194/gmd-8-3695-2015, 2015.
Mamadou, O., Cohard, J. M., Galle, S., Awanou, C. N., Diedhiou, A., Kounouhewa, B., and Peugeot, C.: Energy fluxes and surface characteristics over a cultivated area in Benin: Daily and seasonal dynamics, Hydrol. Earth Syst. Sci., 18, 893–914, https://doi.org/10.5194/hess-18-893-2014, 2014.
Mamadou, O., Galle, S., Cohard, J.-M., Peugeot, C., Kounouhewa, B., Biron, R., Hector, B., and Zannou, A. B.: Dynamics of water vapor and energy exchanges above two contrasting Sudanian climate ecosystems in Northern Benin (West Africa), J. Geophys. Res.-Atmos., 121, 11269–11286, https://doi.org/10.1002/2016JD024749, 2016.
Merbold, L., Ardö, J., Arneth, A., Scholes, R. J., Nouvellon, Y., de Grandcourt, A., Archibald, S., Bonnefond, J. M., Boulain, N., Brueggemann, N., Bruemmer, C., Cappelaere, B., Ceschia, E., El-Khidir, H. A. M., El-Tahir, B. A., Falk, U., Lloyd, J., Kergoat, L., Le Dantec, V., Mougin, E., Muchinda, M., Mukelabai, M. M., Ramier, D., Roupsard, O., Timouk, F., Veenendaal, E. M., and Kutsch, W. L.: Precipitation as driver of carbon fluxes in 11 African ecosystems, Biogeosciences, 6, 1027–1041, https://doi.org/10.5194/bg-6-1027-2009, 2009.
Moene, A. F. and Van Dam, J. C.: Transport in the atmosphere-vegetation-soil continuum, Cambridge University Press, ISBN 9780521195683, 2014.
Montaldo, N., Curreli, M., Corona, R., and Oren, R.: Fixed and variable components of evapotranspiration in a Mediterranean wild-olive – grass landscape mosaic, Agr.d Forest Meteorol., 280, 107769, https://doi.org/10.1016/j.agrformet.2019.107769, 2020.
Moore, C. J.: Frequency response corrections for eddy correlation systems, Bound.-Lay. Meteorol., 37, 17–35, https://doi.org/10.1007/BF00122754, 1986.
Nelson, J. A., Carvalhais, N., Cuntz, M., Delpierre, N., Knauer, J., Ogée, J., Migliavacca, M., Reichstein, M., and Jung, M.: Coupling water and carbon fluxes to constrain estimates of transpiration: The TEA algorithm, J. Geophys. Res.-Biogeo., 123, 3617–3632, https://doi.org/10.1029/2018JG004727, 2018.
Nelson, J. A., Pérez-Priego, O., Zhou, S., Poyatos, R., Zhang, Y., Blanken, P. D., Gimeno, T. E., Wohlfahrt, G., Desai, A. R., Gioli, B., Limousin, J.-M., Bonal, D., Paul-Limoges, E., Scott, R. L., Varlagin, A., Fuchs, K., Montagnani, L., Wolf, S., Delpierre, N., Berveiller, D., Gharun, M., Marchesini, L. B., Gianelle, D., Šigut, L., Mammarella, I., Siebicke, L., Black, T. A., Knohl, A., Hörtnagl, L., Magliulo, V., Besnard, S., Weber, U., Carvalhais, N., Migliavacca, M., Reichstein, M., and Jung, M.: Ecosystem transpiration and evaporation: Insights from three water flux partitioning methods across FLUXNET sites, Global Change Biol., 26, 6916–6930, https://doi.org/10.1111/gcb.15314, 2020.
Novick, K. A., Oren, R., Stoy, P. C., Siqueira, M. B. S., and Katul, G. G.: Nocturnal evapotranspiration in eddy-covariance records from three co-located ecosystems in the Southeastern U.S.: Implications for annual fluxes, Agr. Forest Meteorol., 149, 1491–1504, https://doi.org/10.1016/j.agrformet.2009.04.005, 2009.
Oishi, A. C., Oren, R., Novick, K. A., Palmroth, S., and Katul, G. G.: Interannual Invariability of Forest Evapotranspiration and Its Consequence to Water Flow Downstream, Ecosystems, 13, 421–436, https://doi.org/10.1007/s10021-010-9328-3, 2010.
Perez-Priego, O., Katul, G., Reichstein, M., El-Madany, T. S., Ahrens, B., Carrara, A., Scanlon, T. M., and Migliavacca, M.: Partitioning eddy covariance water flux components using physiological and micrometeorological approaches, J. Geophys. Res.-Biogeo., 123, 3353–3370, https://doi.org/10.1029/2018JG004637, 2018.
Petäjä, T., Vakkari, V., Pohja, T., Nieminen, T., Laakso, H., Aalto, P. P., Keronen, P., Siivola, E., Kerminen, V.-M., Kulmala, M., and Laakso, L.: Transportable Aerosol Characterization Trailer with Trace Gas Chemistry: Design, Instruments and Verification, Aerosol Air Qual. Res., 13, 421–435, https://doi.org/10.4209/aaqr.2012.08.0207, 2013.
Pollock, M. D., O'Donnell, G., Quinn, P., Dutton, M., Black, A., Wilkinson, M. E., Colli, M., Stagnaro, M., Lanza, L. G., Lewis, E., Kilsby, C. G., and O'Connell, P. E.: Quantifying and mitigating wind-induced undercatch in rainfall measurements, Water Resour. Res., 54, 3863–3875, https://doi.org/10.1029/2017WR022421, 2018.
Priestley, C. H. B. and Taylor, R. J.: On the assessment of surface heat flux and evaporation using large-scale parameters, Mon. Weather Rev., 100, 81–92, https://doi.org/10.1175/1520-0493(1972)100<0081:OTAOSH>2.3.CO;2, 1972.
Priyadarshini, K. V. R., Prins, H. H. T., de Bie, S., Heitkönig, I. M. A., Woodborne, S., Gort, G., Kirkman, K., Ludwig, F., Dawson, T. E., and de Kroon, H.: Seasonality of hydraulic redistribution by trees to grasses and changes in their water-source use that change tree–grass interactions, Ecohydrology, 9, 218–228, https://doi.org/10.1002/eco.1624, 2016.
Räsänen, M., Aurela, M., Vakkari, V., Beukes, J. P., Tuovinen, J.-P., Van Zyl, P. G., Josipovic, M., Venter, A. D., Jaars, K., Siebert, S. J., Laurila, T., Rinne, J., and Laakso, L.: Carbon balance of a grazed savanna grassland ecosystem in South Africa, Biogeosciences, 14, 1039–1054, https://doi.org/10.5194/bg-14-1039-2017, 2017.
Räsänen, M., Aurela, M., Vakkari, V., Beukes, P., Tuovinen, J.-P., Siebert, S., Zyl, P. V., Josipovic, M., Laurila, T., Kulmala, M., Laakso, L., Rinne, J., Oren, R., and Katul, G. G.: Dataset for “The effect of rainfall amount and timing on annual transpiration in grazed savanna grassland”, figshare [data set], https://doi.org/10.6084/m9.figshare.11322464, 2019.
Reichstein, M., Falge, E., Baldocchi, D., Papale, D., Aubinet, M., Berbigier, P., Bernhofer, C., Buchmann, N., Gilmanov, T., Granier, A., Grünwald, T., Havránková, K., Ilvesniemi, H., Janous, D., Knohl, A., Laurila, T., Lohila, A., Loustau, D., Matteucci, G., Meyers, T., Miglietta, F., Ourcival, J.-M., Pumpanen, J., Rambal, S., Rotenberg, E., Sanz, M., Tenhunen, J., Seufert, G., Vaccari, F., Vesala, T., Yakir, D., and Valentini, R.: On the separation of net ecosystem exchange into assimilation and ecosystem respiration: Review and improved algorithm, Global Change Biol., 11, 1424–1439, https://doi.org/10.1111/j.1365-2486.2005.001002.x, 2005.
Ripley, B., Frole, K., and Gilbert, M.: Differences in drought sensitivities and photosynthetic limitations between co-occurring C3 and C4 (NADP-ME) Panicoid grasses, Ann. Bot., 105, 493–503, https://doi.org/10.1093/aob/mcp307, 2010.
Sankaran, M.: Droughts and the ecological future of tropical savanna vegetation, J. Ecol., 107, 1531–1549, https://doi.org/10.1111/1365-2745.13195, 2019.
Sankaran, M., Ratnam, J., and Hanan, N. P.: Tree–grass coexistence in savannas revisited–insights from an examination of assumptions and mechanisms invoked in existing models, Ecol. Lett., 7, 480–490, 2004.
Scanlon, T. M., Albertson, J. D., Caylor, K. K., and Williams, C. A.: Determining land surface fractional cover from NDVI and rainfall time series for a savanna ecosystem, Remote Sens. Environ., 82, 376–388, 2002.
Scanlon, T. M., Caylor, K. K., Manfreda, S., Levin, S. A., and Rodriguez-Iturbe, I.: Dynamic response of grass cover to rainfall variability: Implications for the function and persistence of savanna ecosystems, Adv. Water Resour., 28, 291–302, 2005.
Scholes, R. and Archer, S.: Tree-grass interactions in savannas, Annu. Rev. Ecol. System., 28, 517–544, 1997.
Scholes, R. and Walker, H.: An African Savanna: Synthesis of the Nylsvley study, Cambridge University Press, ISBN 9780511565472, 1993.
Scott, R. L. and Biederman, J. A.: Partitioning evapotranspiration using long-term carbon dioxide and water vapor fluxes, Geophys. Res. Lett., 44, 6833–6840, https://doi.org/10.1002/2017GL074324, 2017.
Scott, R. L. and Biederman, J. A.: Critical Zone Water Balance Over 13 Years in a Semiarid Savanna, Water Resour. Res., 55, 574–588, https://doi.org/10.1029/2018WR023477, 2019.
Scott, R. L., Knowles, J. F., Nelson, J. A., Gentine, P., Li, X., Barron-Gafford, G., Bryant, R., and Biederman, J. A.: Water availability impacts on evapotranspiration partitioning, Agr. Forest Meteorol., 297, 108251, https://doi.org/10.1016/j.agrformet.2020.108251, 2021.
Scott-Shaw, B. C. and Everson, C. S.: Water-use dynamics of an alien-invaded riparian forest within the summer rainfall zone of South Africa, Hydrol. Earth Syst. Sci., 23, 1553–1565, https://doi.org/10.5194/hess-23-1553-2019, 2019.
Steenkamp, C. J., Vogel, J. C., Fuls, A., van Rooyen, N., and van Rooyen, M. W.: Age determination of Acacia erioloba trees in the Kalahari, J. Arid Environ., 72, 302–313, https://doi.org/10.1016/j.jaridenv.2007.07.015, 2008.
Stoy, P. C., Mauder, M., Foken, T., Marcolla, B., Boegh, E., Ibrom, A., Arain, M. A., Arneth, A., Aurela, M., Bernhofer, C., Cescatti, A., Dellwik, E., Duce, P., Gianelle, D., van Gorsel, E., Kiely, G., Knohl, A., Margolis, H., McCaughey, H., Merbold, L., Montagnani, L., Papale, D., Reichstein, M., Saunders, M., Serrano-Ortiz, P., Sottocornola, M., Spano, D., Vaccari, F., and Varlagin, A.: A data-driven analysis of energy balance closure across fluxnet research sites: The role of landscape scale heterogeneity, Agr. Forest Meteorol., 171, 137–152, 2013.
Stoy, P. C., El-Madany, T. S., Fisher, J. B., Gentine, P., Gerken, T., Good, S. P., Klosterhalfen, A., Liu, S., Miralles, D. G., Perez-Priego, O., Rigden, A. J., Skaggs, T. H., Wohlfahrt, G., Anderson, R. G., Coenders-Gerrits, A. M. J., Jung, M., Maes, W. H., Mammarella, I., Mauder, M., Migliavacca, M., Nelson, J. A., Poyatos, R., Reichstein, M., Scott, R. L., and Wolf, S.: Reviews and syntheses: Turning the challenges of partitioning ecosystem evaporation and transpiration into opportunities, Biogeosciences, 16, 3747–3775, https://doi.org/10.5194/bg-16-3747-2019, 2019.
Swemmer, A. M., Knapp, A. K., and Snyman, H. A.: Intra-seasonal precipitation patterns and above-ground productivity in three perennial grasslands, J. Ecol., 95, 780–788, https://doi.org/10.1111/j.1365-2745.2007.01237.x, 2007.
Taylor, S. H., Ripley, B. S., Martin, T., De-Wet, L.-A., Woodward, F. I., and Osborne, C. P.: Physiological advantages of C4 grasses in the field: A comparative experiment demonstrating the importance of drought, Global Change Biol., 20, 1992–2003, https://doi.org/10.1111/gcb.12498, 2014.
Tfwala, C. M., van Rensburg, L. D., Bello, Z. A., and Zietsman, P. C.: Transpiration dynamics and water sources for selected indigenous trees under varying soil water content, Agr. Forest Meteorol., 275, 296–304, https://doi.org/10.1016/j.agrformet.2019.05.030, 2019.
Tor-ngern, P., Oren, R., Oishi, A. C., Uebelherr, J. M., Palmroth, S., Tarvainen, L., Ottosson-Löfvenius, M., Linder, S., Domec, J.-C., and Näsholm, T.: Ecophysiological variation of transpiration of pine forests: synthesis of new and published results, Ecol. Appl., 27, 118–133, 2017.
Urban, M., Berger, C., Mudau, T. E., Heckel, K., Truckenbrodt, J., Onyango Odipo, V., Smit, I. P. J., and Schmullius, C.: Surface moisture and vegetation cover analysis for drought monitoring in the southern Kruger National Park using Sentinel-1, Sentinel-2, and Landsat-8, Remote Sens., 10, 1482, https://doi.org/10.3390/rs10091482, 2018.
Volder, A., Briske, D. D., and Tjoelker, M. G.: Climate warming and precipitation redistribution modify tree–grass interactions and tree species establishment in a warm-temperate savanna, Global Change Biol., 19, 843–857, 2013.
Wang, L., D'Odorico, P., Ringrose, S., Coetzee, S., and Macko, S. A.: Biogeochemistry of Kalahari sands, J. Arid Environ., 71, 259–279, https://doi.org/10.1016/j.jaridenv.2007.03.016, 2007.
Ward, E. J., Oren, R., Kim, H. S., Kim, D., Tor-ngern, P., Ewers, B. E., McCarthy, H. R., Oishi, A. C., Pataki, D. E., Palmroth, S., Phillips, N. G., and Schäfer, K. V. R.: Evapotranspiration and water yield of a pine-broadleaf forest are not altered by long-term atmospheric [CO2] enrichment under native or enhanced soil fertility, Global Change Biol., 24, 4841–4856, https://doi.org/10.1111/gcb.14363, 2018.
Webb, E. K., Pearman, G. I., and Leuning, R.: Correction of flux measurements for density effects due to heat and water vapour transfer, Q. J. Roy. Meteorol. Soc., 106, 85–100, 1980.
Wei, Z., Yoshimura, K., Wang, L., Miralles, D. G., Jasechko, S., and Lee, X.: Revisiting the contribution of transpiration to global terrestrial evapotranspiration, Geophys. Res. Lett., 44, 2792–2801, https://doi.org/10.1002/2016GL072235, 2017.
Wigley-Coetsee, C. and Staver, A. C.: Grass community responses to drought in an African savanna, Afr. J. Range Forage Sci., 37, 43–52, https://doi.org/10.2989/10220119.2020.1716072, 2020.
Williams, C. A. and Albertson, J. D.: Soil moisture controls on canopy-scale water and carbon fluxes in an African savanna, Water Resour. Res., 40, W09302, https://doi.org/10.1029/2004WR003208, 2004.
Williams, C. A. and Albertson, J. D.: Contrasting short- and long-timescale effects of vegetation dynamics on water and carbon fluxes in water-limited ecosystems: vegetation controls on dryland fluxes, Water Resour. Res., 41, W06005, https://doi.org/10.1029/2004WR003750, 2005.
Wilson, K., Goldstein, A., Falge, E., Aubinet, M., Baldocchi, D., Berbigier, P., Bernhofer, C., Ceulemans, R., Dolman, H., Field, C., Grelle, A., Ibrom, A., Law, B. E., Kowalski, A., Meyers, T., Moncrieff, J., Monson, R., Oechel, W., Tenhunen, J., Valentini, R., and Verma, S.: Energy balance closure at fluxnet sites, Agr. Forest Meteorol., 113, 223–243, 2002.
Wutzler, T., Lucas-Moffat, A., Migliavacca, M., Knauer, J., Sickel, K., Šigut, L., Menzer, O., and Reichstein, M.: Basic and extensible post-processing of eddy covariance flux data with REddyProc, Biogeosciences, 15, 5015–5030, https://doi.org/10.5194/bg-15-5015-2018, 2018.
Xu, X., Medvigy, D., and Rodriguez-Iturbe, I.: Relation between rainfall intensity and savanna tree abundance explained by water use strategies, P. Natl. Acad. Sci. USA, 112, 12992–12996, 2015.
Yu, K. and D'Odorico, P.: Hydraulic lift as a determinant of tree–grass coexistence on savannas, New Phytol., 207, 1038–1051, 2015.
Zhang, L., Dawes, W. R., and Walker, G. R.: Response of mean annual evapotranspiration to vegetation changes at catchment scale, Water Resour. Res., 37, 701–708, https://doi.org/10.1029/2000WR900325, 2001.
Zhou, S., Yu, B., Zhang, Y., Huang, Y., and Wang, G.: Partitioning evapotranspiration based on the concept of underlying water use efficiency, Water Resour. Res., 52, 1160–1175, https://doi.org/10.1002/2015WR017766, 2016.
Zhou, S., Yu, B., Zhang, Y., Huang, Y., and Wang, G.: Water use efficiency and evapotranspiration partitioning for three typical ecosystems in the Heihe River Basin, northwestern China, Agr. Forest Meteorol., 253–254, 261–273, https://doi.org/10.1016/j.agrformet.2018.02.002, 2018.