the Creative Commons Attribution 4.0 License.
the Creative Commons Attribution 4.0 License.
 | 13 Jul 2022
Projecting end-of-century climate extremes and their impacts on the hydrology of a representative California watershed
Fadji Z. Maina
Alan Rhoades
Erica R. Siirila-Woodburn
Peter-James Dennedy-Frank
In California, it is essential to understand the evolution of water resources in response to a changing climate to sustain its economy and agriculture and to build resilient communities. Although extreme conditions have characterized the historical hydroclimate of California, climate change will likely intensify hydroclimatic extremes by the end of the century (EoC). However, few studies have investigated the impacts of EoC extremes on watershed hydrology. We use cutting-edge global climate and integrated hydrologic models to simulate EoC extremes and their effects on the water-energy balance. We assess the impacts of projected driest, median, and wettest water years under Representative Concentration Pathway (RCP) 8.5 on the hydrodynamics of the Cosumnes River basin. Substantial changes to annual average temperature ( ∘C) and precipitation ( %) will characterize the EoC extreme water years compared to their historical counterparts. A shift in the dominant form of precipitation, mostly in the form of rain, is projected to fall earlier. These changes reduce snowpack by more than 90 %, increase peak surface water and groundwater storages up to 75 % and 23 %, respectively, and drive the timing of peak storage to occur earlier in the year. Because EoC temperatures and soil moisture are high, both potential and actual evapotranspiration (ET) increase. The latter, along with the lack of snowmelt in the warm EoC, causes surface water and groundwater storages to significantly decrease in summer, with groundwater showing the highest rates of decrease. These changes result in more ephemeral EoC streams with more focused flow and increased storage in the mainstem of the river network during the summer.
- Article
(6697 KB) - Full-text XML
-
Supplement
(4565 KB) - BibTeX
- EndNote


California, the fifth-largest economy in the world, hosts one of the largest agricultural regions in the United States and is home to over 39 million people. Because of its geographic location, Mediterranean climate, geology, and landscape, the state of California is sensitive to climate change (Hayhoe et al., 2004). Understanding how water resources will evolve under a changing climate is crucial for sustaining the state's economy and agricultural productivity. The region is especially susceptible to climate change given its reliance on the Sierra Nevada snowpack as a source of water supply (e.g., Dettinger and Anderson, 2015). Studies show that temperatures may warm by as much as 4.5 ∘C by the end of the century (hereafter EoC) (Cayan et al., 2008), that snowpack is expected to decrease as most precipitation will fall as rain instead of snow (Rhoades et al., 2018a, b; Siirila-Woodburn, et al., 2021), and that rain-on-snow events will exacerbate melt (Cayan et al., 2008; Gleick, 1987; Maurer, 2007; Mote et al., 2005; Musselman et al., 2017a, b). Given that precipitation falls predominantly in winter months and the summers are hot and dry, the snow accumulated during the winter provides important water storage for the dry season and is crucial to meet urban demand, sustain ecosystem function, and maintain agricultural productivity (Bales et al., 2006; Dierauer et al., 2018). As such, any significant reduction in the snowpack has the potential to drastically affect the hydrology of the state (Barnett et al., 2005; Harpold and Molotch, 2015; Milly et al., 2005; Rhoades et al., 2018a, b).
Over the past several decades, researchers have worked to understand how changes in Sierra Nevada snowpack will affect important hydrologic fluxes such as evapotranspiration (Tague and Peng, 2013) and streamflow (Berghuijs et al., 2014; Gleick, 1987; He et al., 2019; Maurer, 2007; Safeeq et al., 2014; Son and Tague, 2019; Vicuna and Dracup, 2007; Vicuna et al., 2007). For example, analyses of recent historical trends show that snowpack reductions result in increases in winter streamflow and decreases in summer streamflow (e.g. Safeeq et al., 2013). However, the sensitivity of a given area to these climatic changes depends on many factors including geology and therefore drainage efficiency, topography, and land cover (Alo and Wang, 2008; Christensen et al., 2008; Cristea et al., 2014; Ficklin et al., 2013; Mayer and Naman, 2011; Safeeq et al., 2015; Son and Tague, 2019; Tang et al., 2019).
Climate change in California is also expected to lead to unprecedented extreme conditions, which include severe drought and intense deluge (Swain et al., 2018). In recent years, these changes have already been observed in the forms of multi-year droughts (Cook et al., 2004; Griffin and Anchukaitis, 2014; Shukla et al., 2015) and high-intensity precipitation events, mainly caused by atmospheric rivers (Dettinger et al., 2004; Dettinger, 2011, 2013; Ralph and Dettinger, 2011; Ralph et al., 2006). These unprecedented conditions will require water management strategies to adapt to ensure demands are met. This will be especially true if periods of precipitation become more extreme and variable and occur over a shorter window of time (Swain et al., 2018; Gershunov et al., 2019; Huang et al., 2020; Rhoades et al., 2020b, 2021).
To project how changes in climate will impact watershed behavior, high-resolution, physics-based models are needed to simulate system dynamics accurately, particularly those that are nonlinear, and constitute a better way to analyze a no-analog future. Previous studies analyzed future hydrologic conditions in California but relied on models that do not (1) account for the interactions, feedbacks, and movements of water from the lower atmosphere to the subsurface; (2) represent groundwater dynamics and lateral flow; or (3) incorporate physics-based high-resolution climate models and/or hydrologic models (e.g., Berghuijs et al., 2014; Gleick, 1987; He et al., 2019; Maurer, 2007; Safeeq et al., 2014; Son and Tague, 2019; Vicuna and Dracup, 2007; Vicuna et al., 2007). Considerations of coupled interactions that explicitly account for groundwater connections are important (Condon et al., 2013, 2020; Maxwell and Condon, 2016). Also, previous studies have focused on the mid-century period (e.g., Maurer and Duffy, 2005; Son and Tague, 2019), which may indicate a more muted signal in hydrologic impacts than at EoC. Understanding these impacts is essential because long-term climate projections show that extremes will become more frequent and intense by the EoC (Cayan et al., 2008).
In this work, we assess the impacts of EoC extremely dry and intensely wet conditions on the hydrodynamics of a Californian watershed that contains one of the last naturally flowing rivers in the state. This allows us to investigate the impacts of climate change without the complexity of active water management and thus to set the context for water management decisions. We specifically investigate how the water-energy balance responds to climate change and how those changes propagate to alter the spatiotemporal distribution of water in different hydrologic compartments of the watershed. We focus our investigation on the changes in groundwater and surface water storages. The balance of these two natural reservoirs, and their relationship in response to changes in snowpack changes, is important for water management decision-making. We aim to (1) strengthen our physics-based understanding of the main hydrologic processes controlling changes in water storages under a changing climate, (2) quantify the magnitude and timing of these shifts in storage, and (3) identify the areas that are most vulnerable to change. To do so, we utilize a novel combination of cutting-edge climate and hydrologic model simulations. We drive the integrated hydrologic model ParFlow-CLM (Maxwell and Miller, 2005) with climate forcing from a physics-based, variable-resolution enabled global climate model (the variable-resolution enabled Community Earth System Model, VR-CESM; Zarzycki et al., 2014) that dynamically couples multi-scale interactions within the atmosphere–ocean–land system.
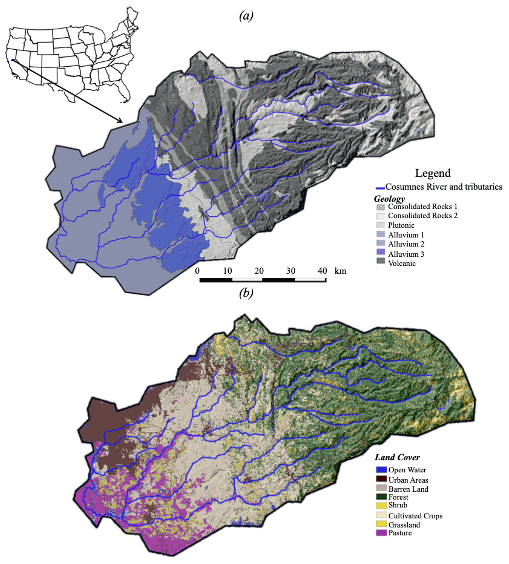
Figure 1The Cosumnes watershed. (a) Location and geology (Jennings et al., 1977); the alluvium in blue corresponds to the Central Valley aquifers, whereas the consolidated rocks in gray correspond to the Sierra Nevada and cross-cutting marine sediments. (b) Land cover (Homer et al., 2015).
The Cosumnes River is one of the last rivers in the western United States without a major dam, offering a rare opportunity to isolate the impacts of a changing climate on the hydrodynamics without reservoir management consideration (Maina et al., 2020a; Maina and Siirila-Woodburn, 2020b). The watershed spans the Central Valley–Sierra Nevada interface and therefore represents important aspects of the large-scale hydrology patterns of the state, namely the assessment of interactions between changes in precipitation, snowpack, streamflow, and groundwater across elevation and geologic gradients. Located in Northern California, USA, the Cosumnes watershed is approximately 7000 km2 in size (Fig. 1) and is situated between the American and the Mokelumne rivers. Its geology ranges from low-permeability rocks typical of the Sierra Nevada landscape (volcanic and plutonic) to the porous and permeable alluvial depositions of the Central Valley aquifers. These are separated by very low-permeability marine sediments. The watershed topography includes a range of landscapes typical of the region (e.g. varying from flat agricultural land, rolling foothills, and steep mountainous hillsides), and elevation varies from approximately 2500 m in the upper watershed to sea level in the Central Valley (Fig. 1). The Sierra Nevada are characterized by evergreen forest, while the Central Valley hosts an intensive agricultural region including crops such as alfalfa, vineyards, and pastureland. Like other Californian watersheds, the climate in the Cosumnes is Mediterranean, consisting of wet and cold winters (with a watershed average temperature equal to 0 ∘C) and hot and dry summers (with watershed average temperature reaching 25 ∘C) (Cosgrove et al., 2003).
3.1 Variable-resolution Community Earth System Model (VR-CESM)
Our modeling approach represents both dynamical and thermodynamic atmospheric response to climate change across scales, different from “pseudo-global warming” and “statistical delta” approaches used in many hydrologic modeling studies. While these approaches are useful to isolate the impact of a given perturbation and/or variable, expected changes in climate will involve the co-evolution of many processes and may therefore not account for compensating factors. The interaction between dynamical and thermodynamic responses has important and, sometimes, offsetting effects on features such as atmospheric rivers. For example, Payne et al. (2020) show that the thermodynamic response to climate change enhances atmospheric river characteristics (e.g., Clausius–Clapeyron relationship), whereas the dynamical response diminishes atmospheric river characteristics (e.g., changes in the jet stream and storm track landfall location). Therefore, VR-CESM may simulate a more inclusive hydroclimatic response to climate change in the western United States at a resolution that is at the cutting edge of today's global climate modeling capabilities for decadal- to centennial-length simulations (Haarsma et al., 2016). Historical and EoC meteorological forcings are obtained from a simulation using the VR-CESM at a regionally refined resolution of 28 km over the northern Pacific Ocean through the western United States, including the Cosumnes watershed and a global resolution of 111 km. CESM has been jointly developed by NCAR (National Center for Atmospheric Research) and the DOE (US Department of Energy) and simulates a continuum of Earth system processes including the atmosphere, land surface, land ice, ocean, ocean waves, and sea ice and the interactions between them (Collins et al., 2006; Gent et al., 2011; Hurrell et al., 2013). VR-CESM is a novel tool to perform dynamical downscaling as it allows for the interactions between the major components of the global climate system (e.g., atmosphere, cryosphere, land surface, and ocean) while allowing for regional-scale phenomena to emerge where regional refinement is applied, all within a single model (Huang et al., 2016; Rhoades et al., 2016, 2018a, c).
The atmospheric model used for these simulations is the Community Atmosphere Model (CAM) version 5.4 with the spectral element dynamical core, with an atmospheric dynamics time step of 75 s, an atmospheric physics time step of 450 s, a prognostic treatment of rainfall and snowfall in the microphysics scheme (Gettelman and Morrison, 2015), and run under Atmosphere Model Intercomparison Project (AMIP) protocols (Gates, 1992). Under the AMIP protocols, the atmosphere and land surface components of the Earth system model are coupled and periodically bounded by monthly observed sea-surface temperatures and sea-ice extents. Although this configuration does not exactly recreate historical water years and events, it is expected to reasonably simulate the distribution of water year types (see Supplement A for more details). Also, it should be noted that the model only projects one scenario (Representative Concentration Pathway 8.5, RCP8.5) of future conditions with assumptions of greenhouse gas emissions, sea-surface temperatures, and sea-ice extents and would not be expected to exactly forecast future water years but rather an envelope of plausible future conditions. Simulations with VR-CESM are performed for 30-year periods based on the climates from a historical period (1985–2015) and an EoC period (2070–2100). EoC simulations, analogous to Rhoades et al. (2018a), are bounded by estimates of future changes in ocean conditions derived from a fully coupled bias-corrected CESM simulation and forced by greenhouse gases and aerosol concentrations assumed in the RCP8.5 emissions scenario. Historical VR-CESM outputs have been compared with reanalyses, and future VR-CESM outputs have been analyzed for shifts in hydrometeorological extremes in Rhoades et al. (2020a, b). To couple the outputs with ParFlow-CLM, we regrid the unstructured 28 km VR-CESM data over the Cosumnes watershed using bilinear interpolation using the Earth System Modeling Framework (Jones, 1999) to a final resolution of approximately 11 km (i.e., 57 grid cells over the Cosumnes watershed). Notably, each of the spectral elements in the VR-CESM grid, shown in Fig. S1 in the Supplement, has a 4×4 set of Gauss–Lobatto–Legendre (GLL) quadrature nodes, where equations of the atmospheric model are solved (Herrington et al., 2019). Therefore, the actual resolution at which the atmospheric dynamics and physics are solved in VR-CESM is high (∼28 km), making these some of the highest-resolution global Earth system model simulations over California to date (Haarsma et al., 2016). VR-CESM simulations were evaluated by comparing them to a widely used observational product, the Parameter-elevation Regressions on Independent Slopes Model (PRISM; Daly et al., 2008) at 4 km resolution, analogous to Rhoades et al. (2020a). More details about the comparisons can be found in Supplement A.
3.2 Integrated hydrologic model: ParFlow-CLM
The integrated hydrologic model ParFlow-CLM (Kollet and Maxwell, 2006; Maxwell, 2013; Maxwell and Miller, 2005) solves the transfer and interactions of water and energy from the subsurface to the lower atmosphere including groundwater dynamics, streamflow, infiltration, recharge, evapotranspiration, and snow dynamics. The model describes 3D groundwater flow in variably saturated media with the Richards equation (Eq. 1, Richards, 1931) and 2D overland flow with the kinematic-wave equation (Eq. 2).
where SS is the specific storage (L−1), SW(ψP) is the degree of saturation (–) associated with the subsurface pressure head ψP (L), t is the time (T), ϕ is the porosity (–), kr is the relative permeability (–), z is the depth, qs is the source–sink term (T−1), and K(x) is the saturated hydraulic conductivity (L T−1, where L is length and T is time).
ParFlow solves the mixed form of the Richards equation, which has the advantage of conserving the mass (Celia et al., 1990).
The kinematic-wave equation is used to describe surface flow in two dimensions is defined as
where ψ0 is the ponding depth, indicates the greater term between ψ0 and 0, υ is the depth averaged velocity vector of surface runoff (L T−1), and qr is a source–sink term representing rainfall and evaporative fluxes (L T−1).
Surface water velocity at the surface in x and y directions, (υx) and (υy) respectively, is computed using the following set of equations:
where Sf,x and Sf,y friction slopes along x and y respectively and m is Manning's coefficient. ParFlow employs a cell-centered finite difference scheme along with an implicit backward Euler scheme and the Newton–Krylov linearization method to solve these nonlinear equations. The computational grid follows the terrain to mimic the slope of the domain (Maxwell, 2013).
ParFlow has many advantages in comparison to other hydrologic models such as MODFLOW (Harbaugh et al., 2000), FELFOW (Trefry and Muffels, 2007), SWAT (Soil and Water Assessment Tool) (Neitsch et al., 2001), and SAC-MA (Sacramento Soil Moisture Accounting Model). ParFlow's advantages include land surface processes such as snow dynamics and evapotranspiration and their interactions with the subsurface, which are crucial for studying the hydrology of California. ParFlow also solves subsurface flow by accounting for variably saturated conditions, an important feature for calculating groundwater recharge and the connection between the groundwater and the land surface processes, which is not the case for the aforementioned models. While some hydrologic models have a better representation of the land surface processes such as Noah-MP (Niu et al., 2011) and VIC (Variable Infiltration Capacity model, a macroscale hydrologic model; Liang et al., 1994), these models do not have a detailed representation of the subsurface flows. Compared to other integrated hydrologic models including CATHY (Catchment Hydrology; Bixio et al., 2002) and MIKE-SHE (Abbott et al., 1986), ParFlow has the advantage that it solves a two-dimensional kinematic flow equation that is fully coupled to the Richards equation.
ParFlow is coupled to the Community Land Model (CLM) that solves the surface energy and water balance, which enables interactions between the land surface and the lower atmosphere and the calculation of key land surface processes governing the system hydrodynamics such as evapotranspiration, infiltration, and snow dynamics. CLM simulates the thermal processes by closing the energy balance at the land surface given by
where θ=ϕSw is the soil moisture, Rn is the net radiation at the land surface (W m−2), a balance between the shortwave (also called solar) and longwave radiation, LE is the latent heat flux (W m−2) which captures the energy required to change the phase of water, H is the sensible heat flux (W m−2) and G is the ground heat flux (W m−2).
More information about the coupling between ParFlow and CLM can be found in Maxwell and Miller (2005). CLM uses the following forcings from the VR-CESM model at 3-hourly resolution to solve the energy balance at the land surface: precipitation, air temperature, specific humidity, atmospheric pressure, north/south and east/west wind speed, and shortwave and longwave wave radiation.
We constructed a high-resolution model of the Cosumnes watershed with a horizontal discretization of 200 m and vertical discretization that varies from 10 cm at the land surface to 30 m at the bottom of the domain. The model has eight layers; the first four layers represent the soil layers and the other four the deeper subsurface. The total thickness of the domain is 80 m to ensure appropriate representation of water table dynamics. Observed water table depths (as measured at several wells located in the Central Valley portion of the domain) can reach approximately 50 m below the land surface (Maina et al., 2020a). The resulting model comprises approximately 1.4 million active cells and was solved using 320 cores in a high-performance computing environment. The Cosumnes watershed is bounded by the American and Mokelumne rivers. We, therefore, impose weekly varying values of Dirichlet boundary conditions along these borders to reflect the observed changes of river stages. The eastern part of the watershed corresponding to the upper limit in the Sierra Nevada is modeled as a no-flow (i.e., Neumann) boundary condition. Hydrodynamic parameters required to solve the surface and subsurface flows (e.g., hydraulic conductivity, specific storage, porosity, and van Genuchten parameters) are derived from a regional geological map (Geologic Map of California, 2015; Jennings et al., 1977) and a literature review of previous studies (Faunt et al., 2010; Faunt and Geological Survey, 2009; Gilbert and Maxwell, 2017; Welch and Allen, 2014). We use the 2011 National Land Cover Database (NLCD) map (Homer et al., 2015) to define land use and land cover required by CLM. We further delineate specific croplands (notably alfalfa, vineyards, and pasture) in the Central Valley using the agricultural maps provided by the National Agricultural Statistics Service (NASS) of the Cropland Data Layer (CDL) of the US Department of Agriculture (USDA) (Boryan et al., 2011). Vegetation parameters are defined by the International Geosphere-Biosphere Programme (IGBP) database (IGBP, 2018). A complete description of the model parameterization can be found in Supplement B, and more details are provided in Maina et al. (2020a). Model validation of groundwater levels, river stages, and land surface processes (evapotranspiration, soil moisture, and snow water equivalent (SWE)) was performed over a period of 3 years that includes extremely dry and wet water years (Supplement C). The model has also been successfully used in recent investigations of post-wildfire and hydrometeorological extreme conditions and to assess the role of meteorological forcing scale in simulated watershed dynamics (Maina et al., 2020a, b; Maina and Siirila-Woodburn, 2020a). Initial conditions for pressure head were obtained by a spin-up procedure using the forcing of the historical median water year (WY). We recursively simulated the historical median WY forcing until the differences of storage at the end of the WY were less than 1 %, indicating convergence. This pressure-head field is then used as the initial condition for each of the 5 WYs of interest (i.e., the EoC wet, EoC dry, historic wet, historic dry, EoC median). Though we acknowledge land cover alterations are expected to occur by the EoC (either naturally or anthropogenically), in this work we assume that the vegetation remains constant for both historical and EoC simulations for simplicity. Further, while the Central Valley of California hosts intensive agriculture that is reliant on groundwater pumping for irrigation, we did not incorporate pumping and irrigation in our model configuration because groundwater pumping rates may substantially change in the future due to new demands, policies, regulations, and changes in land cover and land use and aim to provide an estimate of the natural hydrologic system response to climate change.
3.3 Analysis of EoC hydrodynamics
To investigate how the EoC climate extremes affect water storages, we investigate five hydrologic variables: SWE, ET, pressure-head (ψ) distributions, and surface and subsurface water storage. Total groundwater (GW) storage is given by
where nGW is the total number of subsurface saturated cells (–), Δxi and Δyi are cell discretizations along the x and y directions (L), Δzi is the discretization along the vertical direction the cell (L), is the specific storage associated with cell i, ψi is the pressure head, and ϕi is the porosity.
Total surface water (SW) storage which accounts for any water located at the land surface (i.e., any cell of the model with a pressure head greater than 0) and includes river water or overland flow is calculated via
where nSW is the total number of cells with surface water, i.e., with surface ψ greater than 0 (–), and i indicates the cell.
We compare each EoC WY simulation to its corresponding historical WY counterpart and both the historical and EoC medians. Comparisons are shown as a percent change (PC) calculated using
where X is the model output (ET, SWE, or ψ) at a given point in space (i) at a time (t), “baseline” is the selected simulation (historical median, EoC median, or historical extreme), and “projection” represents the simulation obtained with the EoC extreme WYs (dry or wet).
In this section, we present a subset of the outputs from VR-CESM (precipitation and temperature) to identify the extreme (dry and wet) and median WYs of interest. Changes in fluxes and storages over the course of each WY, as well as the spatial variability of these changes in two hydrologically important periods of the WY (peak flow and baseflow), are also shown.
4.1 Selection of the median, dry, and wet WYs
From the historical and EoC 30-year VR-CESM simulations we select the median, wettest, and driest WYs for comparison (see Fig. 2a). Overall, the future WYs are ∼30 % wetter than the historical WYs (p value ∼ 0.006 for two-tailed t test of equal average annual precipitation) in addition to being ∼4.6 ∘C warmer. Precipitation and temperature variances are mostly similar in the historical and EoC simulations, though EoC minimum temperature may be more variable (p value ∼ 0.059 for two-tailed f test of equal variance in minimum temperature). On average the timing for the start, length, and end of precipitation is similar, though EoC precipitation may be less variable in its start time (p value ∼ 0.053 for f test of equal variance in days to reach 5th percentile of annual precipitation). In the climate model, there are no clear trends between the precipitation timing metrics and the total amount of precipitation.
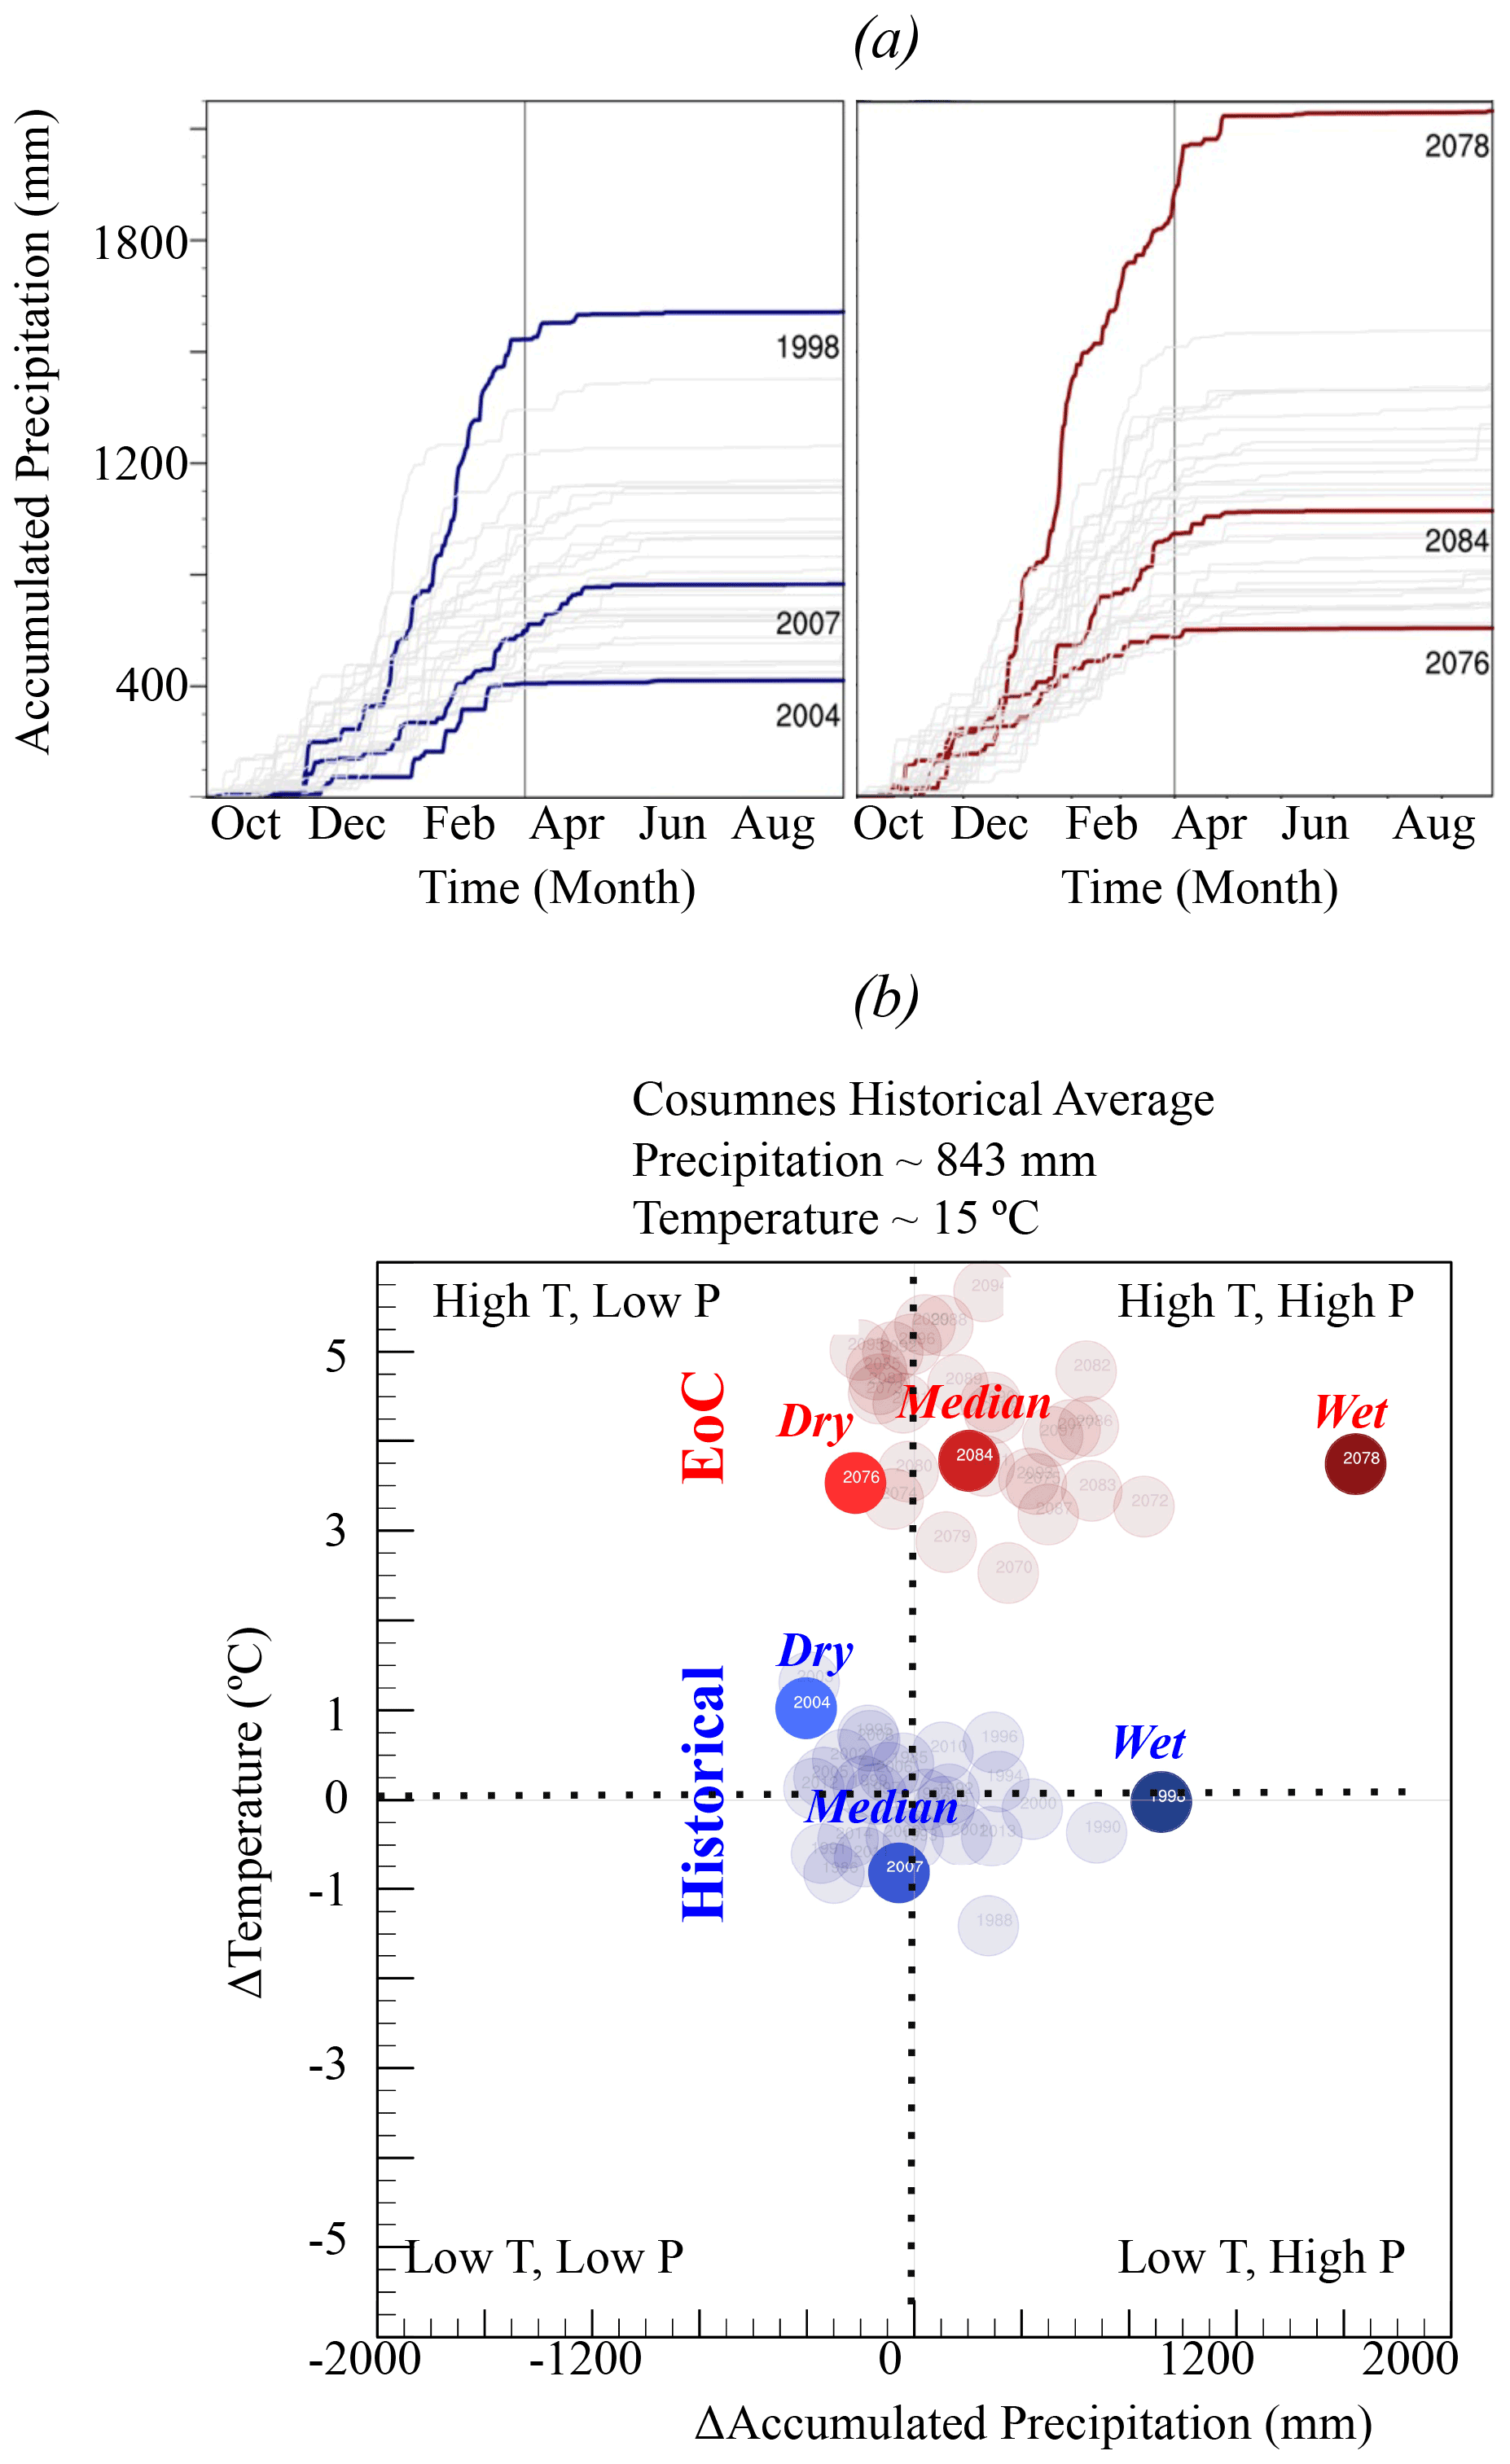
Figure 2(a) VR-CESM accumulated total precipitation for the historical and end-of-century (EoC) simulations and (b) quadrants for differences between each individual water year (WY) and the historical average temperature and accumulated precipitation in the Cosumnes watershed. The historical and EoC dry, median, and wet WYs are indicated in blue and red, respectively.
The EoC median WY is much wetter than its historical counterpart, with about ∼250 mm yr−1 more precipitation that begins approximately 1 week earlier and ends approximately 2 weeks earlier in the year. The EoC wettest WY is much wetter than the historical wettest WY (42 % more precipitation) and consistent with theory outlined in Allan et al. (2020). The EoC wettest WY is 3.8 ∘C warmer than the historical wettest WY and 4.6 ∘C warmer than the historical median WY, as the historical median WY is one of the coolest years in the series. Precipitation occurs earlier in the EoC wet WY compared to the historical wet or median WYs, with the 5th percentile of precipitation occurring 12 d earlier in the EoC wettest WY than either the wettest or median historical WYs. The duration of the EoC wettest WY precipitation season (146 d) is between the historical wettest WY (133 d) and the historical median WY (155 d). The EoC dry WY is also much wetter than its historic counterpart; in fact, the EoC dry WY is wetter than the 7 driest historical WYs of the 30-year historical ensemble. Simulation of 30 random draws from two identical normal distributions, repeated 100 000 times, finds that the lowest value in one is higher than the seven lowest values in the other only ∼1.1 % of the time (p value ∼ 0.011). This statistical test reveals that this VR-CESM simulation suggests that future dry years will be wetter than historical dry years. The EoC dry WY is only ∼2.5 ∘C warmer than the historical dry WY. The divergence in temperature is smaller for the comparison of EoC and historical WYs of the dry extremes as opposed to the wet extremes because the historical dry WY is the second warmest WY in the historical simulations, while the EoC dry WY is the third coolest in the EoC simulations. Precipitation in the EoC dry WY starts particularly early, with the 5th percentile of annual precipitation reached by mid-October. This is much earlier than either the dry or median historical WYs, which do not reach that percentile of precipitation until mid-November to late November. The historical dry WY also has a particularly short precipitation duration of only 97 d, while the EoC dry WY has a 163 d precipitation duration, more similar to the median historical WY duration of 155 d.
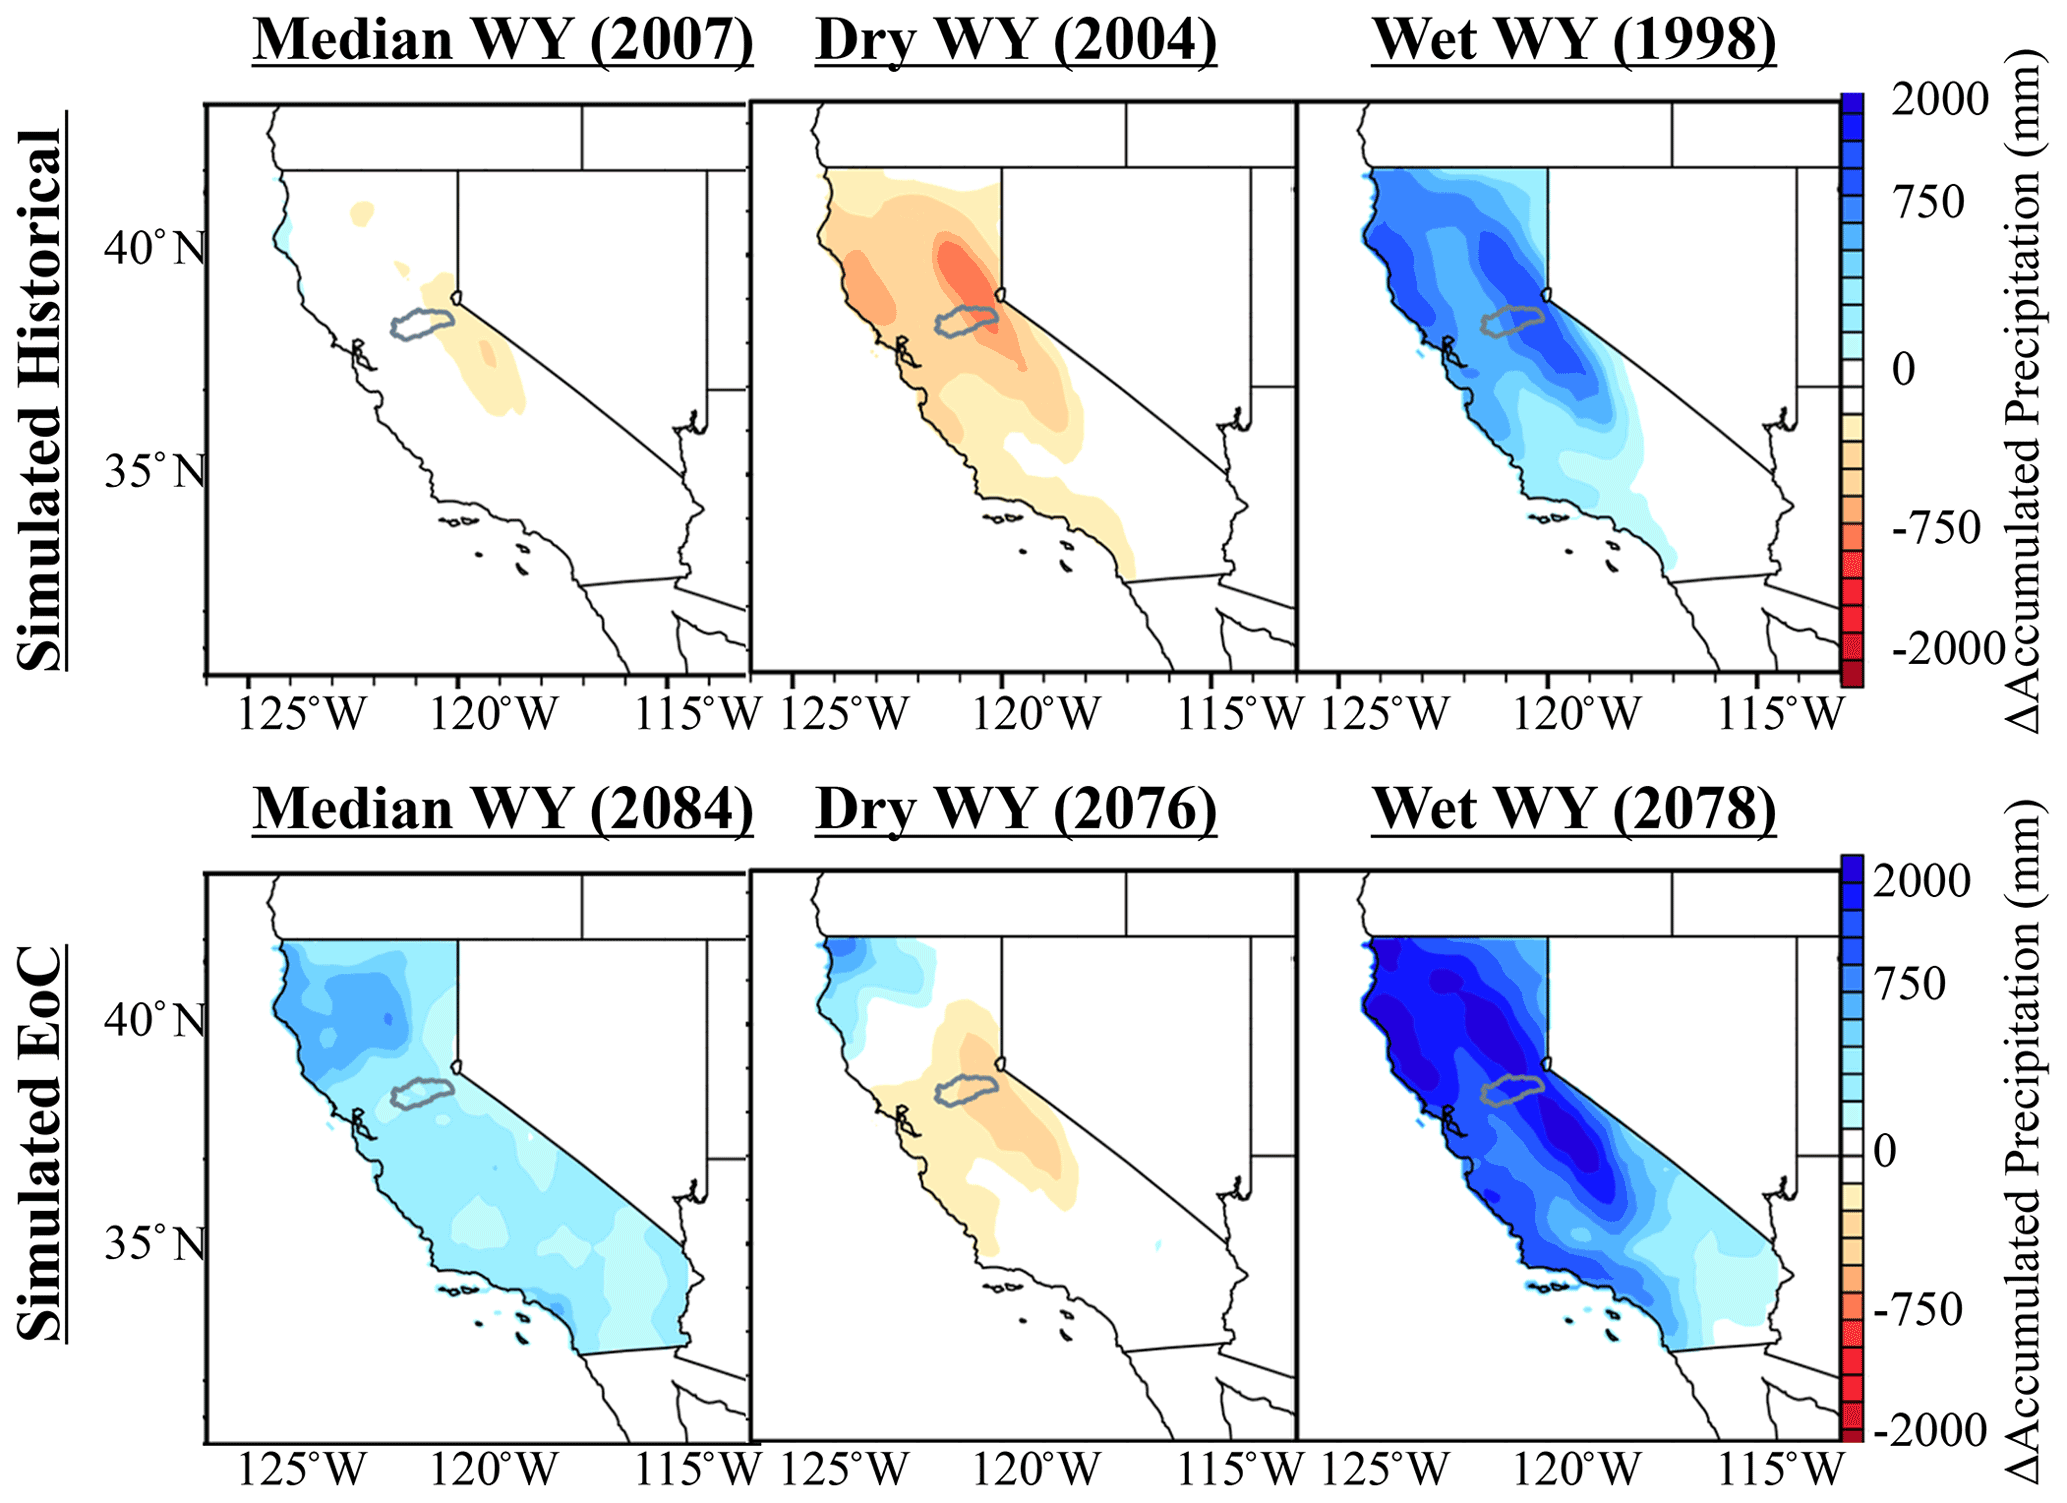
Figure 3Precipitation spatial distributions of the dry, median, and wet water years (WYs) for the 30-year historical and EoC simulations relative to the climatological average (derived from the 30-year historical mean).
Figure 3 shows the spatial distribution of accumulated precipitation anomalies across California. These anomalies are computed for each of the 6 identified WYs relative to the climatological average (the 30-year historical mean). These spatial plots provide context for the changes modeled in the Cosumnes watershed relative to broader precipitation changes California-wide. As in the Cosumnes, California-wide EoC dry, median, and wet WYs are all characterized by higher precipitation totals than their historical counterparts. Importantly, the EoC wet WY is a true outlier, not only in the Cosumnes but across California too. Notably, California lies at an important large-scale circulation transition, namely semi-permanent high-pressure systems associated with the Hadley circulation. Therefore, how climate change alters the atmospheric dynamics over California or more specifically how far northward storm tracks may shift remains uncertain and can depend on climate model choice. This has led to papers that claim the future of California will be wet across a range of climate models (e.g., Neelin et al, 2013; Swain et al., 2018; Gershunov et al., 2019; Rhoades et al., 2020b; Persad et al., 2020) and, for select climate models, that it could be drier. Notably, these studies highlight an asymmetric response in the frequency of wet versus dry WYs (i.e., anomalously wet WYs increase in frequency much more in the future than anomalously dry WYs). Many of the aforementioned studies also highlight that in anomalously wet WYs, extreme precipitation events (e.g., atmospheric rivers) will occur with greater intensity and frequency and largely drive changes in WY precipitation totals (which is shown in our VR-CESM simulations for California in more detail in Rhoades et al., 2020b). Given these complexities and others such as consideration for how dynamical and thermodynamical effects of climate change may interact with one another to offset or amplify extreme precipitation events (Payne et al., 2020), the hypothesis that global warming will result in a climate where the “wet gets wetter and dry gets drier” may be too simplistic of an assumption for California. Rhoades et al. (2020b) show quantitatively that the increases in precipitation observed in the VR-CESM outputs are due to a greater number of intense atmospheric river events that occur more regularly back to back (recently corroborated by Rhoades et al., 2021, using uniform high-resolution CESM simulations at different warming scenarios) and that atmospheric river (AR) precipitation totals increase at a much larger rate (+53 % K−1) than non-AR precipitation totals (+1.4 % K−1), which agrees with findings made in other studies such as Gershunov et al. (2019).
4.2 Changes in annual watershed-integrated fluxes and storages
Figure 4 illustrates the annual changes in the integrated hydrologic budget of the Cosumnes watershed for the EoC WYs (i.e., median, dry, and wet) compared to the historical median WY. The EoC median WY compared to the historical median WY has 38 % more precipitation, and the temperature is 4.4 ∘C higher. Further, the precipitation phase also shifts with an increase in rainfall (54 %) and a decrease in snowfall (−54 %). This results in a significant decrease in SWE (−91 %), which is consistent with many other studies that have shown that increased temperatures due to climate change will lead to low- to no-snow conditions (Berghuijs et al., 2014; Cayan et al., 2008; Mote et al., 2005; Rhoades et al., 2018a, b; Son and Tague, 2019; Siirila-Woodburn et al., 2021). The increase in temperature and precipitation results in an increase in ET (62 %), consistent with the findings of other recent studies (e.g., McEvoy et al., 2020). Nevertheless, the larger amount of precipitation associated with the EoC is enough to offset higher ET demand and recharge groundwater and surface water, which increase by 4 % and 19 % respectively. The EoC wet WY has similar changes to the EoC median WY when compared to the historical wet WY, yet the magnitude of the increase in surface (21 %) and groundwater (11 %) storages is higher due to more precipitation and higher temperatures. The dry EoC WY is also characterized by higher precipitation (43 %, the largest increase) than its historical counterpart; this results in large increases in total groundwater (8 %) and surface water (38 %) storages.

Figure 4Annual percent changes in precipitation, rainfall, snowfall, temperature, SWE, ET, surface water, and groundwater storages in the EoC water years (WYs) (i.e. median, dry, and wet) at the watershed scale relative to their historical counterparts. Infographic size scaled to EoC conditions.
4.3 Temporal variation of watershed-integrated fluxes and storages
Understanding annual changes at the watershed scale is important to broadly understand changes in the water budget in response to future climate extremes. However, a deeper understanding of the processes that drive these changes and the interactions from the atmosphere through bedrock require an analysis of their spatiotemporal variations as well. Figure 5 shows the temporal variations of each of the historical and EoC WY's integrated hydrologic budgets grouped by WY type (columns), with a top-down sequencing of hydrologic variables of interest in order from the atmosphere through subsurface (rows). This organization allows for the investigation of propagating impacts to be directly compared in time. In this section, we discuss historical vs. EoC changes observed in each of the WY types (i.e., median, dry, and wet). Each WY shows unique hydrodynamic behaviors and changes compared to the historical conditions. The median WY sheds light on how changes in the precipitation phase and increases in temperature and precipitation in the EoC will impact the hydrodynamics. The dry WYs allow EoC and historical low- to no-snow conditions to be compared, whereas assessing the hydrodynamics of the EoC wet WY provides a better understanding of how intense EoC precipitation along with the warm EoC climate will shape the hydrology.

Figure 5Temporal variations of the total cumulative precipitation, rainfall, and snowfall at the watershed scale, total SWE at the watershed scale, the average watershed values of soil moisture, the cumulative watershed ET, and the total surface water, and groundwater storages at the watershed scale associated with the 6 historical and EoC water years (WYs). The blue area indicates the selected peak flow period, while the gray area corresponds to the selected baseflow conditions for the spatial distribution analyses.
4.3.1 Median water years
As indicated in Sect. 3.1, the EoC median WY has more precipitation than the historical median WY. The EoC precipitation comes mainly as rain due to the warmer temperatures of the EoC and includes virtually no snowfall from late winter to early spring. This precipitation phase change combined with the earlier snowfall cessation date in the WY results in minimal and even nonexistent SWE in the Cosumnes watershed for much of the WY, a significant change compared to historic conditions. EoC peak SWE occurs in February in contrast to the historical peak SWE, which occurs in April. Due to the watershed's relatively low elevation, snow accumulates only in the upper part of the Cosumnes watershed (∼10 % of the total watershed area). Only areas located in the highest elevations (>2000 m), such as the eastern limit of the watershed, show any SWE in the EoC simulations, whereas in the historical WYs we observed SWE as low as 1000 m.
The decrease in snow and the increase in rain along with an earlier onset of seasonal precipitation directly impact soil moisture, which sees an early increase with a slightly higher peak than historical. As more water is available earlier in the EoC, the ET demand from increased temperatures is met until substantially higher summer temperatures increase ET at a much faster rate than the historical WY. The high EoC ET and the lack of snowmelt cause the soil to rapidly dry from late spring through late summer.
Because of the marked increase in total precipitation and shift from snow to rain in the EoC simulations, surface water storage generally increases throughout the WY. This is consistent with previous studies (Gleick, 1987; He et al., 2019; Maurer, 2007; Safeeq et al., 2014; Son and Tague, 2019; Vicuna and Dracup, 2007; Vicuna et al., 2007). Surface water storage increases in early November in the EoC simulations, while in the historical simulations this increase occurs in January. Similar to the earlier peak SWE and soil moisture, the peak surface water storage in the EoC is also earlier (January through February) compared to the historical period (March through April). This late-season surface water storage remains larger because the accumulated precipitation is large enough to overcome the increased ET in a warmer climate. Similar to surface water storage, groundwater storage increases earlier and peaks at a larger amount than the historical WY. However, in contrast to the surface water storage, the groundwater storage during baseflow conditions is lower in the median EoC compared to the median historical year. This decrease in groundwater during baseflow conditions is due to the lack of snowmelt and higher EoC ET. In late spring and summer in the EoC, groundwater keeps depleting through ET and is not recharged by snowmelt through surface and subsurface flows from the Sierra Nevada as in the historical period. This may indicate that compared to surface water storage, groundwater storage may be more sensitive to EoC hydroclimatic changes (which are multifold and, in this case, include an increase in precipitation, a transition from snow to rain, and higher ET). One way to quantitatively measure this sensitivity is to compare the seasonal change in water storage between peak and baseflow conditions. Historically, changes between peak and baseflow conditions (i.e., the amount of water lost between peak and base flow) resulted in moderate seasonal changes in groundwater storage (30 %) and surface water storage (32 %). The EoC simulations reveal larger seasonal variation for groundwater and surface water storage (40 % and 37 % decreases, respectively). Groundwater in the Cosumnes watershed is mainly recharged in the headwaters and stored in the Central Valley. Therefore, these Central Valley aquifers experience earlier and larger increases in storage, which lead to more water available for ET and therefore aquifer depletion. A deeper understanding of this phenomenon requires an analysis of the spatial patterns of these changes, which is performed later on in this study.
4.3.2 Dry water years
All EoC WYs are characterized by higher precipitation in the form of rainfall compared to their historical counterparts. The historical dry WY has ∼43 % less total precipitation than the EoC dry WY. However, we note that for the EoC dry WY the decrease in snowfall is less drastic than the median or wet EoC years. This is because the historically driest WY is significantly warmer than the historical average WY and therefore already has a smaller snowpack, 94 % lower than the historical median WY. The EoC dry WY SWE also accumulates 2 months earlier than the historical SWE. Because the differences in SWE between the dry WYs are smaller than the differences in SWE between the median WYs (7 % versus 91 %), we can deduce that the earlier and larger rise in soil moisture in the EoC dry WY is mostly due to an earlier and larger amount of rainfall. The higher soil moisture and EoC temperatures result in higher ET throughout the WY compared to the historical WY. This ET results in lower soil moisture by the end of the summer, similar to the median WY. In addition, surface water storage peaks earlier and at a larger amount compared to the historical WY. The surface water storage in the EoC remains higher throughout the WY compared to its historical counterpart despite this higher ET due to the low precipitation associated with the historical dry WY. We further note that the difference in surface water storage during baseflow conditions between the 2 dry WYs is higher than the difference between the 2 median WYs. The groundwater recharge starts 2 months earlier in the EoC driest WY compared to the historical driest WY due to the changes in timing and magnitude of precipitation. However, it is interesting to note that groundwater storage during baseflow conditions in the EoC WY is nearly equal to the historical WY (within 3 %). Thus, although more water enters the EoC dry WY system through greater precipitation, it eventually exits by the end of the WY, and no considerable net gains to groundwater are observed. This significant reduction in groundwater storage from late winter to the end of summer is a result of the much larger EoC ET and highlights the dynamic nature of the EoC dry-year watershed interactions. Also similar to the median WY, dry WY seasonal decreases in EoC storage are more pronounced in the groundwater signal (36 %) than in the surface water signal (33 %). We further note that the decreases in groundwater and surface water storages are, as in the median WY, larger (+8 %) than the historical decreases.
4.3.3 Wet water years
The EoC wet WY is significantly wetter than all other WYs. Yet, unlike the historical WY, the precipitation largely comes as rain, as shown by the low to no snowfall and SWE totals (Fig. 5). The difference in future versus contemporary wet WY SWE (99 %) is larger than the differences between the median and the dry WYs (91 %). As in other WYs, soil moisture increases earlier compared to the historical wet WY. A greater water availability enables the system to meet the high EoC ET demand. Hence, ET in the EoC wettest year remains higher than the historical wettest year ET throughout the WY. However, the increase in ET, combined with the lack of snowmelt that can buffer and recharge soil moisture in spring, leads to less soil moisture at the end of the WY compared with the historical WY. Further, surface water storage increases earlier and at a much faster rate in the EoC WY compared to the historical WY. This is mirrored in the groundwater storages. As in the other EoC simulations, when compared to the historical counterpart, the EoC wettest year shows a sharper decline in seasonal above- and belowground water storage changes (occurring between peak flow and baseflow). Groundwater storage decreases 47 % in the EoC between peak flow and baseflow, whereas only a 41 % decrease occurs in the historical wet WY. Similarly, surface water storage decreases 44% in the EoC, whereas only a 41 % decrease occurs in the historical wet WY.
4.4 Spatial patterns of the changes in fluxes and pressure heads
4.4.1 Median water years
Figure 6 shows the percent changes in ET, surface water pressure heads, and subsurface pressure heads (i.e., pressure heads of the model bottom layer) in the EoC median WY compared to the historical median WY during peak flow and baseflow conditions (see the time frames in Fig. 5). Regions in red correspond to areas with smaller fluxes or pressure heads in the EoC compared to the historical ones, whereas regions in blue correspond to areas with larger fluxes or pressure heads in the EoC compared to the historical median WY. We study peak flow and baseflow conditions because the analysis of the temporal variations of fluxes and storages has shown that these two periods are characterized by different trends and represent the key periods in understanding the hydrologic responses to the EoC extreme climate.
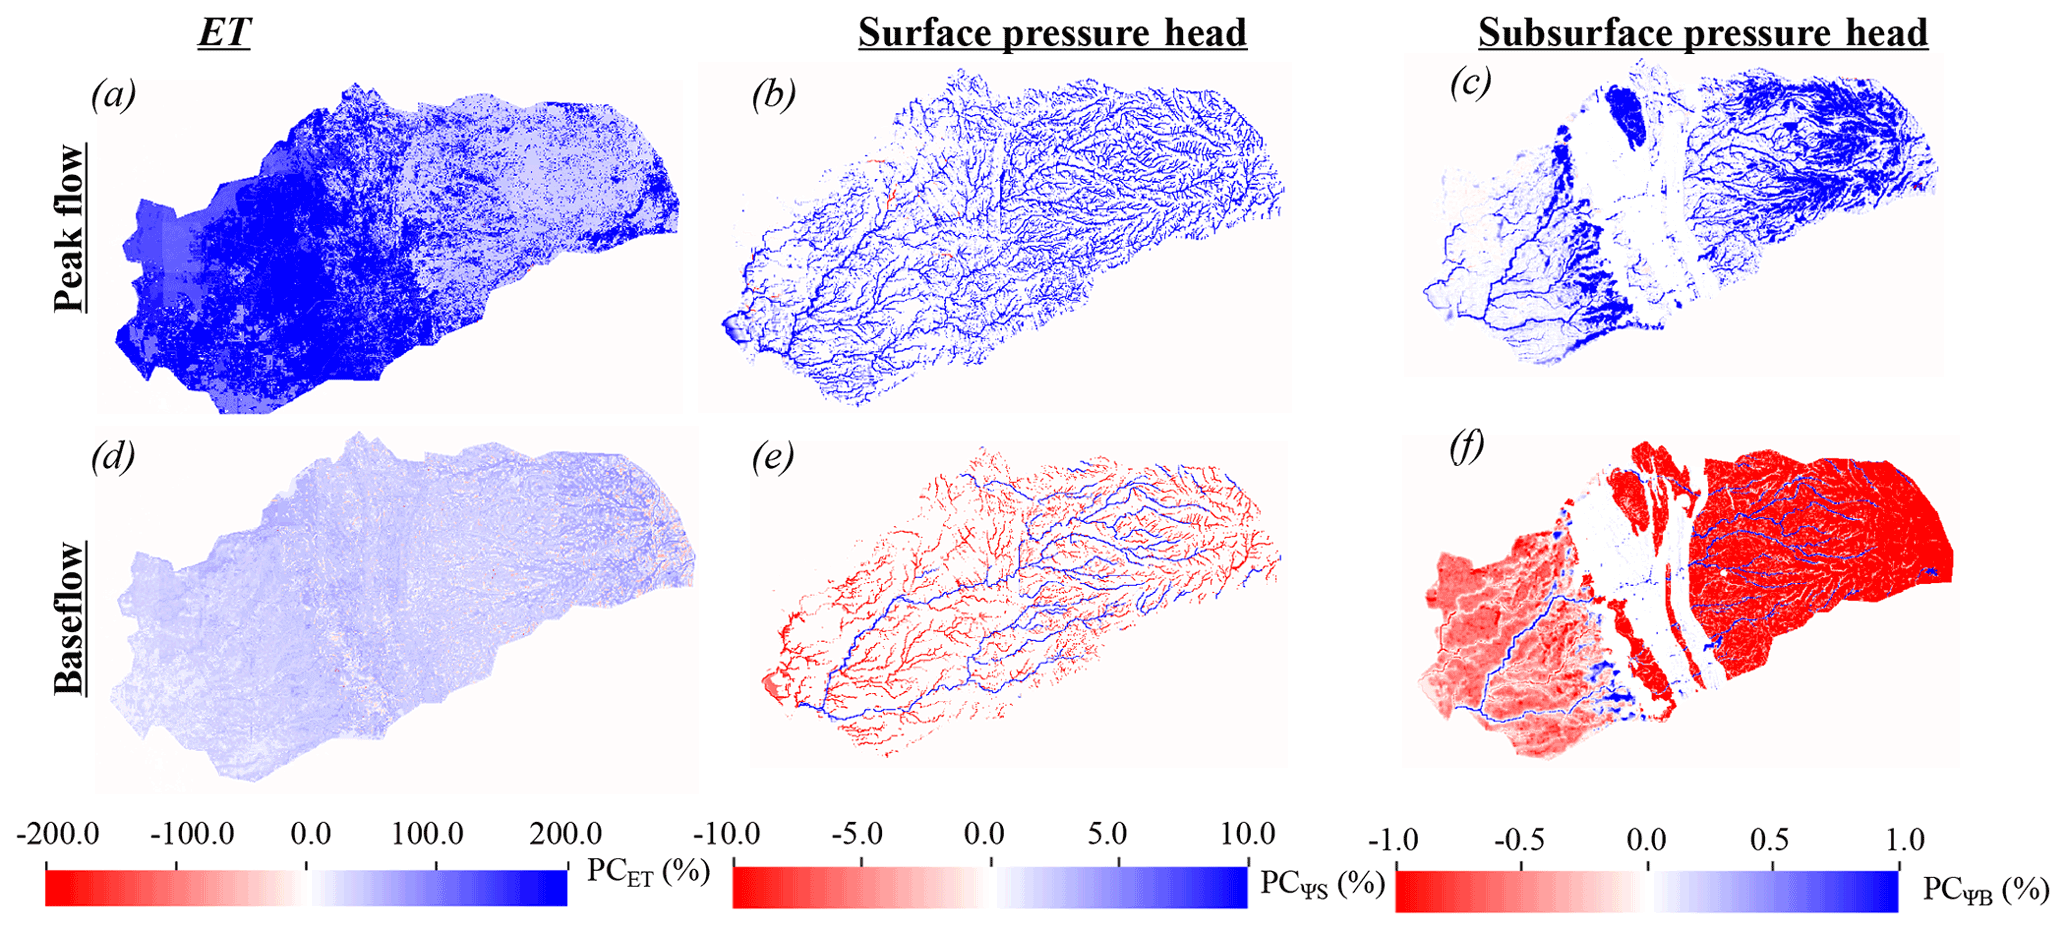
Figure 6Comparisons between EoC median water year (WY) and the historical median WY peak flow and baseflow spatial distributions of percent changes in ET (PCET), surface water (PCΨS), and subsurface (PCΨB) pressure heads. Regions in red correspond to areas with smaller fluxes or pressure heads in the EoC compared to the historical ones, whereas regions in blue correspond to areas with larger fluxes or pressure heads in the EoC compared to the historical WY.
Relative to the historical median WY, during peak flow the EoC median WY is characterized by an increased ET across the majority of the watershed, especially in the Central Valley, and larger surface water and subsurface pressure heads (Fig. 6a–c). ET increases in the EoC because of both the increase in water availability and increased evaporative demand, as discussed in the previous section (Sect. 3.3.1). The increase in ET is nonuniform across the watershed because of the heterogeneity of the landscape's topographical gradients, land surface cover, and subsurface geological conditions. The Central Valley is characterized by a large increase in ET compared to the Sierra Nevada, and the patterns of ET in the Central Valley are also more homogeneous, a result of the geological characteristics of the area and the hydroclimate of the watershed. This leads to more water available in the Central Valley compared to the Sierra Nevada characterized by less permeable rocks. In addition, as most of the ET in the Central Valley comes from evaporation due to the high temperatures of the EoC (not shown here), the increase in evaporation is higher in the Central Valley due to its aquifers being characterized by a high permeability (Maina and Siirila-Woodburn, 2020a) and the availability of water.
Surface and subsurface pressure heads both show general increases during the EoC peak flow, yet these maps reveal that unlike ET, the pressure head (and therefore storage) of water is very heterogeneous in space. For example, in the Sierra Nevada, we observe an increase in subsurface pressure head (Fig. 6c) only in some relatively permeable areas susceptible to infiltration and recharge. Although the Central Valley aquifers are more permeable and geologically less heterogeneous than the Sierra Nevada (as defined in the model), the changes in subsurface pressure head in the Central Valley are heterogeneous. This is because the recharge of the Central Valley aquifers is dependent on the subsurface and surface flows from the headwater. Only areas of the Central Valley that are subject to stronger connectivity with the headwaters see an increase in subsurface pressure head in the EoC.
Relative to its historical counterpart, the EoC median WY is characterized by high ET during baseflow conditions though less than during peak flow conditions (Fig. 6d). We observe larger surface water pressure heads in higher-order streams, whereas surface water pressure heads decrease in the EoC in the majority of the low-order, ephemeral streams (Fig. 6e). This opposition of spatial pattern trends, resulting in more water in the main river channels, and less in the smaller streams, occurs for several reasons. First, peak flow occurs earlier in the EoC and is more rainfed, so that the ephemeral streams drain earlier in the EoC compared to historical. This sustained and longer duration of drainage increases the surface water pressure head along the main river channels and is due to the contribution of the subsurface flow from the headwaters. This contribution is also higher in the EoC due to larger amounts of precipitation. The trends along the main river channel are also evident in the subsurface pressure-head maps (Fig. 6f). Because the surface water is larger along the main channels, the subsurface pressure heads are also larger here due to the interconnection between the subsurface and the surface (Fig. 6f). However, in general, subsurface pressure heads decrease elsewhere in the EoC during baseflow because of the lack of snowmelt and the higher ET demand. This result highlights the spatiotemporal complexity of an expected watershed's response to changes in climate (shown here to be bidirectional) and how factors such as river proximity may be crucial for consideration.

Figure 7Comparisons between EoC dry water year (WY) and the historical dry WY peak flow and baseflow spatial distributions of percent changes in ET (PCET), surface water (PC), and subsurface (PC) pressure heads. Regions in red correspond to areas with smaller fluxes or pressure heads in the EoC compared to the historical ones, whereas regions in blue correspond to areas with larger fluxes or pressure heads in the EoC compared to the historical WY.
4.4.2 Dry water years
Figure 7 illustrates the percent changes in ET, surface water, and subsurface pressure heads in the EoC dry WY compared to the historical dry WY during peak flow and baseflow conditions. During peak flow conditions, the EoC dry WY has larger ET, surface, and subsurface pressure heads than the historical dry WY (Fig. 7a–c). ET is larger in this EoC dry WY, not only because it is hotter, but also because there is more precipitation. Increases in surface pressure heads are nonuniform across the domain. For example, surface water does not increase in high-elevation areas (i.e., elevation > 2000 m) in the EoC dry WY because the change in the precipitation phase is not significant. The main difference between the EoC and the historical dry WY is the amount of the water flowing down gradient, which is higher in the EoC; hence the surface water in the EoC becomes higher downstream. The increase in subsurface pressure heads in the EoC dry WY during peak flow conditions is heterogeneous, with patterns similar to the changes in subsurface pressure heads associated with the EoC median WY.
During baseflow conditions, even though ET increases in the EoC driest WY relative to the historical driest WY, surface and subsurface pressure heads also generally increase (Fig. 7d–f). Given wetter conditions in the driest EoC WY, first-order streams are more pronounced. A few low-order streams have less surface water in the EoC when compared to the historical dry WY, similar to the results of the median WYs (see Sect. 3.4.2). Subsurface pressure head is generally larger in areas subject to strong connectivity, with the headwaters in the EoC dry WY relative to the historical dry WY, with some regions experiencing no change from the historical conditions. This suggests that the larger amount of precipitation associated with the EoC dry WY is sufficient to supply enough water to account for high ET demands and recharge the groundwater.
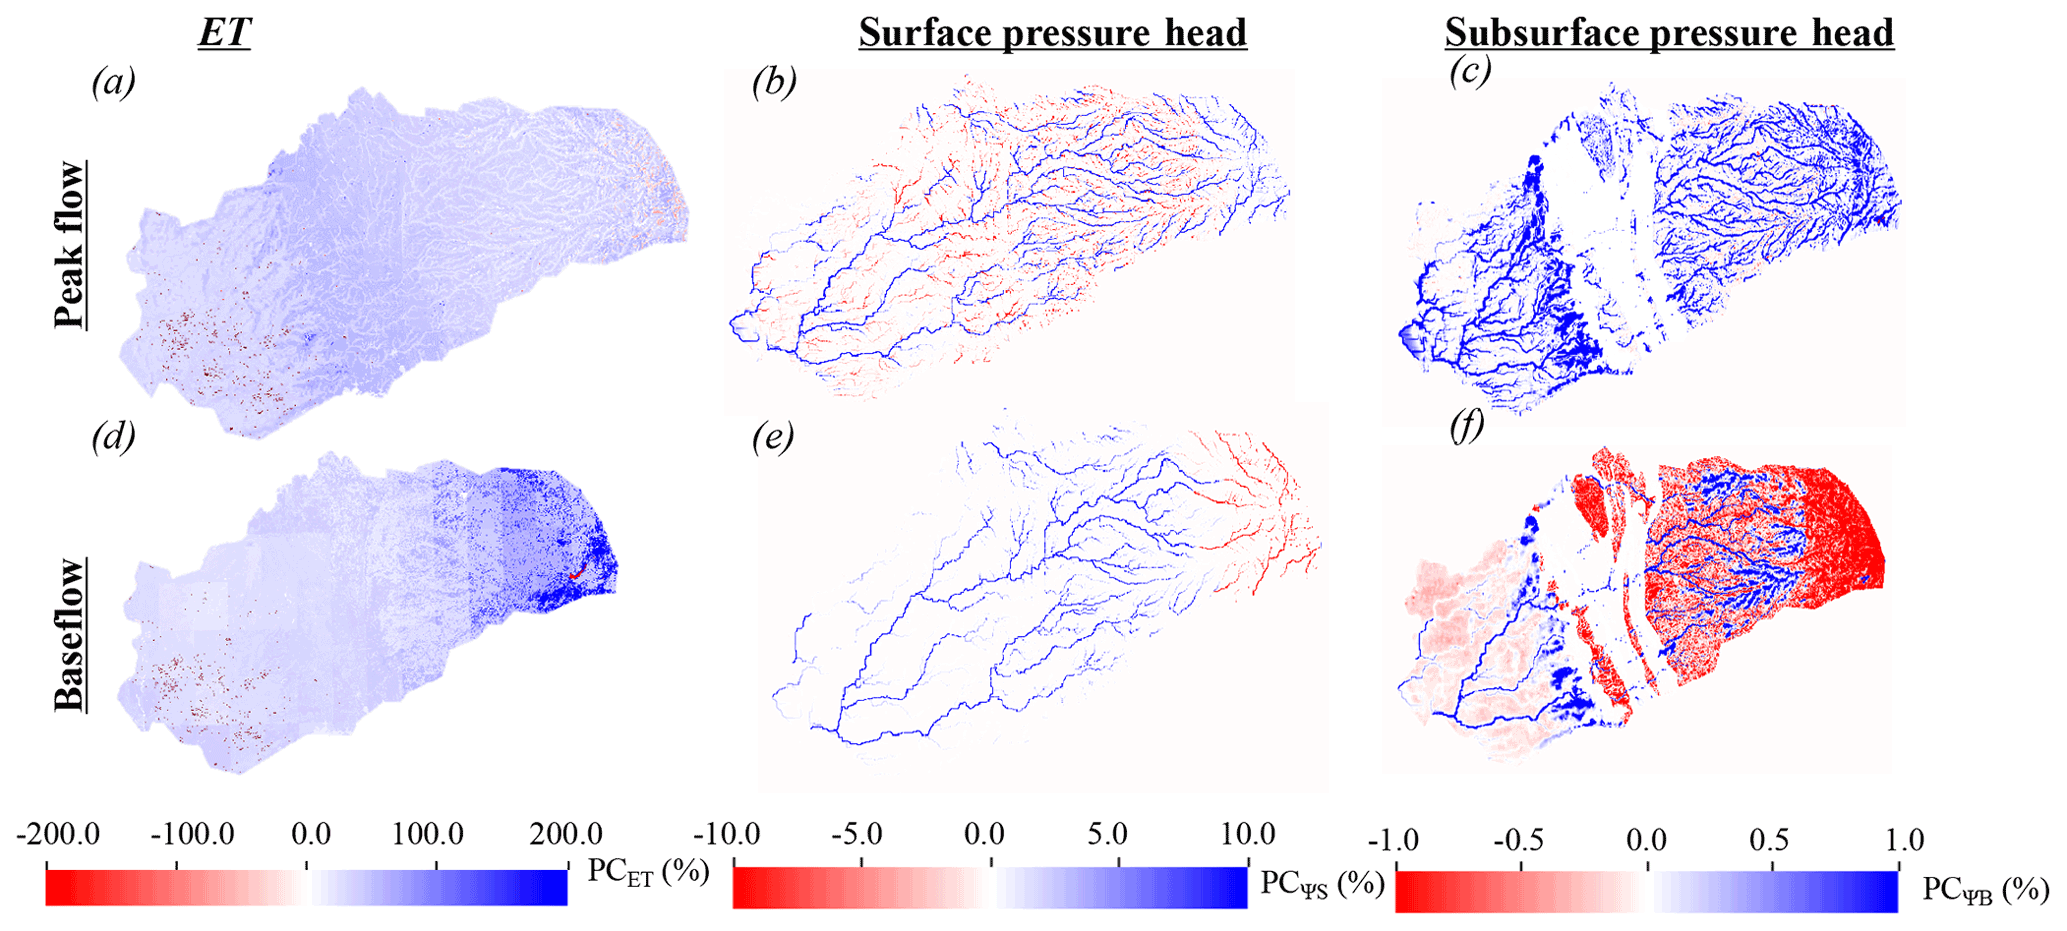
Figure 8Comparisons between EoC wet water year (WY) and the historical wet WY peak flow and baseflow spatial distributions of percent changes in ET (PCET), surface water (PC), and subsurface (PC) pressure heads. Regions in red correspond to areas with smaller fluxes or pressure heads in the EoC compared to the historical ones, whereas regions in blue correspond to areas with larger fluxes or pressure heads in the EoC compared to the historical WY.
4.4.3 Wet water years
Figure 8 shows the percent changes in ET, surface water, and subsurface pressure heads in the EoC wet WY compared to the historical wet WY during peak flow and baseflow conditions. During peak flow, the EoC wet WY is characterized by larger ET and subsurface pressure heads relative to the historical wet WY and a more heterogeneous mixture of regions with both higher and lower surface water conditions throughout the catchment (Fig. 8a–c). Analogous to other WYs at EoC, the surface water pressure-head increases (decreases) are apparent in larger-order (smaller-order) streams, both in the Sierra Nevada and in the Central Valley. In the wettest WY, this occurs for several reasons. First, the larger volume of precipitation, plus seasonal shifts in precipitation timing, results in the filling of the higher-order streams and depletion of the lower-order streams during peak flow. Second, in the historical wet WY, a significantly greater amount of snowpack is present in the Sierra Nevada in the upper elevation of the headwaters, allowing for slower, steadier amounts of water to be released during the spring via snowmelt and, in turn, supporting low-order streams over a longer period of time. The latter effect is immediately visible in Fig. 8e, where decreases in EoC surface pressure heads are visible in the headwaters, despite the watershed total showing an increase in EoC surface water storage during baseflow (see Fig. 5). Similar to the two previous EoC WYs, the subsurface pressure-head increases are shown more distinctly in the Central Valley during peak flow, under the main river channels, and in the foothills during baseflow (see previous sections on the discussion of hydroclimatic and geologic impacts).
5.1 Comparison with previous studies
Some of the results presented in this study qualitatively agree with previous studies yet provide important new insights. For example, Maurer and Duffy (2005) used 10 global climate models to project, as in this study, an increase in winter flows with an earlier peak flow timing in the WY and a decrease in summer flows. Maurer and Duffy (2005) showed mid-century projected annual precipitation and streamflow increases of 7 % and 13 %, respectively. Although our study focused on EoC projections, we found that compared to the historical median WY, annual surface water will increase by 19 % in the EoC median WY. Compared to their findings, our work sheds light on how these changes in runoff will occur across the watershed based on its physical characteristics and highlights that while runoff will increase in the EoC, lower-order streams mainly located in the Sierra Nevada will see a decrease due to a change in precipitation phase. Mallakpour et al. (2018) also had a similar finding showing that future California streamflow is altered similarly to Maurer and Duffy (2005) under both the RCP4.5 and RCP8.5 emissions scenarios, with RCP8.5 showing the highest changes during peak flow. However, contrary to our work, the authors mentioned that the annual changes in streamflow will not be significant, probably due to the compensation between increases in peak flow and decreases in baseflow. This was likely shaped by the differences in climate and hydrologic models used to derive these conclusions. Similar changes in streamflow were obtained by He et al. (2019), who drove the hydrologic model VIC with 10 global climate models to understand potential changes in runoff in California due to climate change. Hydrologic changes computed from the 10 global climate models were consistent and showed an increase of around 10 % in annual streamflow by the late century, a percentage similar to what has been found in this study. The authors mentioned that watershed characteristics such as geology, topography, and land cover strongly impact the hydrologic response to climate change. Relationships between watershed characteristics (e.g., physiographic parameters) and its responses to climate change were further explored by Son and Tague (2019), who highlighted that because vegetation and subsurface geology control both water availability and energy demand, they in turn influence watershed sensitivity to a changing climate, as emphasized in this study. The increases in groundwater storage shown in this study are also in agreement with Niraula et al. (2017), who used the hydrologic model VIC to show that groundwater recharge will likely increase in the northern portion of the western United States in a changing climate. However, in this work, we show that groundwater recharge decreases in the summer in some areas due to the lack of snowmelt and higher EoC ET.
5.2 Implications for water resources management
While previous work more broadly focused on how temperature increases will alter the precipitation phase, reduce seasonal snowpack and increase winter runoff, this work brings new physical and more granular insights into how watersheds may respond to climate extremes. In particular, both wet and dry WYs in the future experience increased precipitation. As such, even in future dry WYs, water managers and stakeholders may need to prepare more for large precipitation events that may increase the possibility of flooding which requires new infrastructure management strategies. Shifts in precipitation timing, phase, and magnitude have cascading impacts on soil moisture profiles and ET withdrawals, which subsequently impact discharge and groundwater dynamics. Future shifts in water availability earlier in the year, as well as more dynamic transitions between peak and baseflow conditions (as quantified here), may impose stresses on water distribution, especially those systems already under scrutiny (e.g., those resources over-allocated or facing environmental degradation).
In addition, while these projections show increases in surface water and groundwater storages at watershed scale, our results also highlight important localized spatiotemporal changes across a watershed, where the assumption of water storage increase does not necessarily hold in all geographic locations (e.g., areas that are not close to the river in the Central Valley). Our study also shows that the decreases in groundwater storage in the Central Valley aquifers are more significant than the decreases in surface water storage during baseflow conditions. This may call for new conveyance infrastructure that can move water from the relatively wetter areas to the drier areas and/or where infiltration can more readily occur. The latter suggests solutions such as managed aquifer recharge (MAR) could become an increasingly important climate change adaptation. Finally, our study also highlights that lower-order streams will likely become more ephemeral in the EoC due to flashier runoff and higher evaporative demand; such conditions will have important implications for fish spawning and ecosystem nutrient cycling.
5.3 Study limitations
In the integrated hydrologic model, the subsurface geology and land cover characterization has inherent and, in some cases, irreducible uncertainty. This study uses hydrodynamic parameters as defined by Maina et al. (2020a), which assumes that the subsurface hydrodynamics from the Sierra Nevada to the Central Valley is almost completely hydrologically separated except through overland flow. However, it is not clear whether fractures may drive more surface and subsurface flow from the headwaters to the Central Valley aquifers. In addition, we use the historical land surface cover map when simulating the EoC. It has been shown that the stomatal resistance of plants will change due to rising CO2, with important implications for both the water and energy balance (Lemordant et al., 2018; Milly and Dunne, 2017). Future studies could assess the impact of changes in vegetation physiology and land surface cover on watershed hydrodynamics. Future studies can also estimate the impacts of different pumping and irrigation scenarios at EoC that may further impact the hydrologic system hydrodynamics in a changing climate and compare with this work. Although our VR-CESM simulations represent a cutting-edge global climate model simulation, further work may be needed to evaluate how a more refined grid resolution impacts atmospheric process representation over the Cosumnes watershed, particularly in the headwaters (Maina et al., 2020b). We further acknowledge that the 30-year simulation may not be sufficient to capture certain climate extremes (e.g., 1-in-50-year storm). Future studies, if computational resources are available, will seek to explore how the use of a longer time period might influence the identification of the most extreme dry and wet WYs from VR-CESM.
In this study, we relied on deterministic models to represent both the atmospheric (VR-CESM) and hydrologic (ParFlow-CLM) dynamics. These models are very sensitive to the initial conditions and input parameters (La Follette et al., 2021; Lehner et al., 2020; Song et al., 2015), which are uncertain given the lack of data characterizing the above- and belowground environment, including its hydrological response. Thus, while it is important to assess the sensitivity of the model outputs to these uncertain parameters, these models are computationally expensive and require many parameters. Therefore, these approaches are not feasible with the computational resources available in this study. Future work could employ reduced-order models based on a subset of the physics-based model runs to explore parameter space further (e.g., Maina and Siirila-Woodburn, 2020b; Maina et al., 2022). In addition, because of the behavior of hydrological processes, the climate variability, and the uncertainties of deterministic models, model validation should ideally be performed over a long period to account for different changes and variabilities. In this study, model validation was limited to a period of 5 years due to computational constraints. Although this period encompasses the wettest and driest years on record in the region, we acknowledge that it may not be sufficient to capture the full range of hydrological variability experienced in the Cosumnes. Another limitation of using deterministic models is that the temporal variations of hydrological processes tend to follow a stochastic behavior in accordance with the so-called Hurst phenomenon (Hurst, 1951; Koutsoyiannis, 2003). As a result, these models could intensify the impacts of hydrological extremes and climate change. Finally, it has also been demonstrated that while the changes in water balance exhibit greater variability on climatic scales, the most important changes in hydrologic processes remain the overexploitation of groundwater (Ferguson and Maxwell, 2010), which has an impact on the rise in sea level (Koutsoyiannis, 2020). In addition to projecting the use of groundwater by the end of the century, future studies could compare the two approaches (deterministic and stochastic) to better assess the limitations and the uncertainties associated with them.
Our coupled simulations project that, for the Cosumnes watershed, temperature and precipitation will both increase by the EoC across all WY types (wettest, median, and driest). In addition, precipitation is projected to occur earlier compared to historical conditions and mainly in the form of rain. For the median and wet WYs, the precipitation season has earlier cessation dates, while the dry EoC WY, which is wetter than its historical counterpart, persists significantly longer into the spring. As a consequence of warmer temperatures, all WYs show a substantial decrease in SWE. The shift of precipitation from snowfall to rainfall, as well as the increase in the amount of precipitation and the early start of precipitation, leads to an overall increase in soil moisture and more water available to meet the higher EoC ET demand. Importantly, this increase in ET is heterogeneous across the watershed and highlights one of the main advantages of using an integrated hydrologic model to assess the spatiotemporal patterns of change. Our results show that the sensitivity to the changes in ET at EoC depends on the subsurface geology and topographical gradients, more specifically as follows:
-
The geological and topographical complexities of the Sierra Nevada headwaters lead to highly heterogeneous changes in ET. Changes in ET are higher in permeable areas such as the plutonic rocks where water can be more easily extracted.
-
ET changes in the Central Valley of the Cosumnes watershed are predominantly uniform, with the highest sensitivities in the vicinity of the Cosumnes River due to the high availability of water.
Precipitation increases enough at EoC to provide water for both increased ET and increased surface water storage. Surface water storages also increase earlier in the WY and have higher peak amounts. These earlier and larger increases are a direct consequence of an earlier start in precipitation at EoC, a marked change in the precipitation phase, and an overall larger amount of precipitation when compared with the historical WYs. However, our results also highlight that during baseflow conditions surface water decreases, especially in lower-order streams, showing that these areas are highly sensitive to changes in precipitation phase. Our simulations also show that the seasonal variability of the EoC watershed behavior is also more dynamic. In general, decreases in seasonal water storages occurring between peak flow and baseflow conditions are more than 10 % higher in the EoC compared to the historical conditions.
EoC groundwater storages are also projected to increase earlier in the WY, with peaks greater than those found historically. Yet these storages decrease significantly during baseflow conditions due to the higher ET at EoC and the absence of recharge from snowmelt. Contrary to the changes in surface water storages, groundwater storages show a larger decrease due to their dependence on the surface water from the Sierra Nevada. Our results also show that changes in subsurface pressure heads are not uniform and are bidirectional throughout the Cosumnes watershed. Because the connectivity between the Central Valley aquifers and the Sierra Nevada headwaters (i.e., subsurface and surface flows from the headwater to the Central Valley aquifers) plays an important role in the hydrodynamics of this watershed, only areas with a strong connection with the headwaters, such as the foothills and the river channels, see an increase in subsurface pressure heads at EoC. However, the subsurface pressure heads decrease elsewhere in the Central Valley aquifers, especially in baseflow conditions due to the high ET and the lack of snowmelt. In the river channels, this is due to the exchange between the subsurface and the surface, whereas the foothills characterized by the consolidated sediments serve as “spillover”.
Our results provide novel understandings about possible changes in the integrated hydrologic response to changes in EoC climate extremes. An important caveat is that our simulation was a single set of climate realizations and may not properly bound internal climate variability uncertainty like an ensemble of climate simulations could. However, beyond the widely agreed upon changes of decreased snowpack and shifts in runoff timing in the literature, we show the following in this simulation: (1) EoC precipitation increases, even in the driest years. (2) Despite an increased temperature, and hence ET, both groundwater and surface water storage increase relative to historical conditions because of increased precipitation. (3) There is a distinct spatial pattern, particularly in surface water storage, in which smaller-order streams see reduced flow, while the larger order streams see an increased flow. These changes will have strong implications on natural resource management.
The climate model VR-CESM can be downloaded here: https://www.cesm.ucar.edu/models/ (NCAR/UCAR, 2022). The integrated hydrologic model ParFlow-CLM can be found here: https://parflow.org/#download (ParFlow, 2022).
Data supporting the findings of this study can be found at https://portal.nersc.gov/archive/home/a/arhoades/Shared/www/Hyperion/ (NERSC, 2022).
The supplement related to this article is available online at: https://doi.org/10.5194/hess-26-3589-2022-supplement.
FZM was responsible for conceptualizing the study, undertaking the formal analysis, running the hydrologic model ParFlow-CLM, writing and preparing the original draft of the paper, and reviewing and editing the paper. ERSW was responsible for conceptualizing the study, writing and preparing the original draft of the paper, and reviewing and editing the paper. AR was responsible for conceptualizing the study, undertaking the formal analysis, running the climate model VR-CESM, writing and preparing the original draft of the paper, and reviewing and editing the paper. PJDF was responsible for conceptualizing the study, writing and preparing the original draft of the paper, and reviewing and editing the paper.
The contact author has declared that neither they nor their co-authors have any competing interests.
Publisher's note: Copernicus Publications remains neutral with regard to jurisdictional claims in published maps and institutional affiliations.
This research used resources of the National Energy Research Scientific Computing Center (NERSC), a US Department of Energy Office of Science User Facility located at Lawrence Berkeley National Laboratory, operated under contract no. DE-AC02-05CH11231.
Fadji Z Maina and Erica R. Siirila-Woodburn were supported by LDRD funding from Berkeley Lab, provided by the Director, Office of Science, of the US Department of Energy, under contract no. DE-AC02-05CH11231.
Author Alan Rhoades was funded by the Department of Energy, Office of Science Office of Biological and Environmental Research program, under award number DE-SC0016605 “A Framework for Improving Analysis and Modeling of Earth System and Intersectoral Dynamics at Regional Scales” and award number DE-AC02-05CH11231 “The Calibrated and Systematic Characterization, Attribution, and Detection of Extremes – Science Focus Area”.
This paper was edited by Dominic Mazvimavi and reviewed by two anonymous referees.
Abbott, M. B., Bathurst, J. C., Cunge, J. A., Oconnell, P. E., and Rasmussen, J.: An introduction to the european hydrological system: Systeme hydrologique Europeen, She. 2. Structure of a physically-based, distributed modeling system, J. Hydrol., 87, 61–77, 1986.
Allan, R. P., Barlow, M., Byrne, M. P., Cherchi, A., Douville, H., Fowler, H. J., Gan, T. Y., Pendergrass, A. G., Rosenfeld, D., Swann, A. L. S., Wilcox, L. J., and Zolina, O.: Advances in understanding large-scale responses of the water cycle to climate change, Ann. N.Y. Acad. Sci., 1472, 49–75, https://doi.org/10.1111/nyas.14337, 2020.
Alo, C. A. and Wang, G.: Hydrological impact of the potential future vegetation response to climate changes projected by 8 GCMs, J. Geophys. Res.-Biogeo., 113, G03011, https://doi.org/10.1029/2007JG000598, 2008.
Bales, R. C., Molotch, N. P., Painter, T. H., Dettinger, M. D., Rice, R., and Dozier, J.: Mountain hydrology of the western United States, Water Resour. Res., 42, 690, https://doi.org/10.1029/2005WR004387, 2006.
Barnett, T. P., Adam, J. C., and Lettenmaier, D. P.: Potential impacts of a warming climate on water availability in snow-dominated regions, Nature, 438, 303–309, https://doi.org/10.1038/nature04141, 2005.
Berghuijs, W. R., Woods, R. A., and Hrachowitz, M.: A precipitation shift from snow towards rain leads to a decrease in streamflow, Nat. Clim. Change, 4, 583–586, https://doi.org/10.1038/nclimate2246, 2014.
Bixio, A. C., Gambolati, G., Paniconi, C., Putti, M., Shestopalov, V. M., Bublias, V. N., Bohuslavsky, A. S., Kasteltseva, N. B., and Rudenko, Y. F.: Modeling groundwater-surface water interactions including effects of morphogenetic depressions in the Chernobyl exclusion zone, Environ. Geol., 42, 162–177, 2002.
Boryan, C., Yang, Z., Mueller, R., and Craig, M.: Monitoring US agriculture: the US Department of Agriculture, National Agricultural Statistics Service, Cropland Data Layer Program, Geocarto Int., 26, 341–358, https://doi.org/10.1080/10106049.2011.562309, 2011.
Cayan, D. R., Maurer, E. P., Dettinger, M. D., Tyree, M., and Hayhoe, K.: Climate change scenarios for the California region. Climatic Change, 87, 21–42, https://doi.org/10.1007/s10584-007-9377-6, 2008.
Celia, M. A., Bouloutas, E. T., and Zarba, R. L.: A general mass-conservative numerical solution for the unsaturated flow equation, Water Resour. Res., 26, 1483–1496, https://doi.org/10.1029/WR026i007p01483, 1990.
Christensen, L., Tague, C. L., and Baron, J. S.: Spatial patterns of simulated transpiration response to climate variability in a snow dominated mountain ecosystem, Hydrol. Process., 22, 3576–3588, https://doi.org/10.1002/hyp.6961, 2008.
Collins, W. D., Bitz, C. M., Blackmon, M. L., Bonan, G. B., Bretherton, C. S., Carton, J. A., Chang, P., Doney, S. C., Hack, J. J., Henderson, T. B., Kiehl, J. T., Large, W. G., McKenna, D. S., Santer, B. D., and Smith, R. D.: The Community Climate System Model Version 3 (CCSM3), J. Climate, 19, 2122–2143, https://doi.org/10.1175/JCLI3761.1, 2006.
Condon, L. E., Maxwell, R. M., and Gangopadhyay, S.: The impact of subsurface conceptualization on land energy fluxes, Adv. Water Resour., 60, 188–203, https://doi.org/10.1016/j.advwatres.2013.08.001, 2013.
Condon, L. E., Atchley, A. L., and Maxwell, R. M.: Evapotranspiration depletes groundwater under warming over the contiguous United States, Nat. Commun., 11, 873, https://doi.org/10.1038/s41467-020-14688-0, 2020.
Cook, E. R., Woodhouse, C. A., Eakin, C. M., Meko, D. M., and Stahle, D. W.: Long-Term Aridity Changes in the Western United States, Science, 306, 1015–1018, https://doi.org/10.1126/science.1102586, 2004.
Cosgrove, B. A., Lohmann, D., Mitchell, K. E., Houser, P. R., Wood, E. F., Schaake, J. C., Robock, A., Marshall, C., Sheffield, J., Duan, Q., Luo, L., Higgins, R. W., Pinker, R. T., Tarpley, J. D., and Meng, J.:: Real-time and retrospective forcing in the North American Land Data Assimilation System (NLDAS) project, J. Geophys. Res.-Atmos., 108, 8842, https://doi.org/10.1029/2002JD003118, 2003.
Cristea, N. C., Lundquist, J. D., Loheide, S. P., Lowry, C. S., and Moore, C. E.: Modelling how vegetation cover affects climate change impacts on streamflow timing and magnitude in the snowmelt-dominated upper Tuolumne Basin, Sierra Nevada, Hydrol. Process., 28, 3896–3918, https://doi.org/10.1002/hyp.9909, 2014.
Daly, C., Halbleib, M., Smith, J. I., Gibson, W. P., Doggett, M. K., Taylor, G. H., Curtis, J., and Pasteris, P. P.: Physiographically mapping of climatological temperature and precipitation across the conterminous United States, Int. J. Climatol., 28, 2031–2064, https://doi.org/10.1002/joc.1688, 2008.
Dettinger, M.: Climate Change, Atmospheric Rivers, and Floods in California – A Multimodel Analysis of Storm Frequency and Magnitude Changes1, J. Am. Water Resour. Assoc., 47, 514–523, https://doi.org/10.1111/j.1752-1688.2011.00546.x, 2011.
Dettinger, M. and Anderson, M. L.: Storage in California's reservoirs and snowpack in this time of drought, San Francisco Estuary and Watershed Science, 13, https://doi.org/10.15447/sfews.2015v13iss2art1, 2015.
Dettinger, M., Redmond, K., and Cayan, D.: Winter Orographic Precipitation Ratios in the Sierra Nevada – Large-Scale Atmospheric Circulations and Hydrologic Consequences, J. Hydrometeorol., 5, 1102–1116, https://doi.org/10.1175/JHM-390.1, 2004.
Dettinger, M. D.: Atmospheric Rivers as Drought Busters on the U.S. West Coast, J. Hydrometeorol., 14, 1721–1732, https://doi.org/10.1175/JHM-D-13-02.1, 2013.
Dierauer, J. R., Whitfield, P. H., and Allen, D. M.: Climate Controls on Runoff and Low Flows in Mountain Catchments of Western North America, Water Resour. Res., 54, 7495–7510, https://doi.org/10.1029/2018WR023087, 2018.
Faunt, C. C. and Geological Survey (US) (Eds.): Groundwater availability of the Central Valley Aquifer, California, US Geological Survey professional paper, US Geological Survey, Reston, VA, 225 pp., 2009.
Faunt, C. C., Belitz, K., and Hanson, R. T.: Development of a three-dimensional model of sedimentary texture in valley-fill deposits of Central Valley, California, USA, Hydrogeo. J., 18, 625–649, https://doi.org/10.1007/s10040-009-0539-7, 2010.
Ferguson, I. M. and Maxwell, R. M.: Role of groundwater in watershed response and land surface feedbacks under climate change, Water Resour. Res., 46, 1–15, https://doi.org/10.1029/2009WR008616, 2010.
Ficklin, D. L., Luo, Y., and Zhang, M.: Climate change sensitivity assessment of streamflow and agricultural pollutant transport in California's Central Valley using Latin hypercube sampling, Hydrol. Process., 27, 2666–2675, https://doi.org/10.1002/hyp.9386, 2013.
Gates, W. L: AMIP: the atmospheric model intercomparison project, B. Am. Meteorol. Soc., 73, 1962–1970, https://doi.org/10.1175/1520-0477(1992)073<1962:ATAMIP>2.0.CO;2, 1992.
Gent, P. R., Danabasoglu, G., Donner, L. J., Holland, M. M., Hunke, E. C., Jayne, S. R., Lawrence, D. M., Neale, R. B., Rasch, P. J., Vertenstein, M., Worley, P. H., Yang, Z.-L., and Zhang, M.: The Community Climate System Model Version 4, J. Climate, 24, 4973–4991, https://doi.org/10.1175/2011JCLI4083.1, 2011.
Geologic Map of California: Geologic Map of California, https://maps.conservation.ca.gov/cgs/gmc/ (last access: 17 October 2018), 2015.
Gershunov, A., Shulgina, T., Clemesha, R. E. S., Guirguis, K., Pierce, D. W., Dettinger, M. D., Lavers, D. A., Cayan, D. R., Polade, S. D., Kalansky, J., and Ralph, F. M.:: Precipitation regime change in Western North America: The role of Atmospheric Rivers, Sci. Rep., 9, 9944, https://doi.org/10.1038/s41598-019-46169-w, 2019.
Gettelman, A. and Morrison, H.: Advanced Two-Moment Bulk Microphysics for Global Models. Part I: Off-Line Tests and Comparison with Other Schemes, J. Climate, 28, 1268–1287, https://doi.org/10.1175/JCLI-D-14-00102.1, 2015.
Gilbert, J. M. and Maxwell, R. M.: Examining regional groundwater–surface water dynamics using an integrated hydrologic model of the San Joaquin River basin, Hydrol. Earth Syst. Sci., 21, 923–947, https://doi.org/10.5194/hess-21-923-2017, 2017.
Gleick, P. H.: The development and testing of a water balance model for climate impact assessment: Modeling the Sacramento Basin, Water Resour. Res., 23, 1049–1061, https://doi.org/10.1029/WR023i006p01049, 1987.
Griffin, D. and Anchukaitis, K. J.: How unusual is the 2012–2014 California drought?, Geophys. Res. Lett., 41, 9017–9023, https://doi.org/10.1002/2014GL062433, 2014.
Haarsma, R. J., Roberts, M. J., Vidale, P. L., Senior, C. A., Bellucci, A., Bao, Q., Chang, P., Corti, S., Fučkar, N. S., Guemas, V., von Hardenberg, J., Hazeleger, W., Kodama, C., Koenigk, T., Leung, L. R., Lu, J., Luo, J.-J., Mao, J., Mizielinski, M. S., Mizuta, R., Nobre, P., Satoh, M., Scoccimarro, E., Semmler, T., Small, J., and von Storch, J.-S.: High Resolution Model Intercomparison Project (HighResMIP v1.0) for CMIP6, Geosci. Model Dev., 9, 4185–4208, https://doi.org/10.5194/gmd-9-4185-2016, 2016.
Harbaugh, A. W., Banta, E. R., Hill, M. C., and McDonald, M. G.: MODFLOW-2000, the US Geological Survey modular ground-water model: User guide to modularization concepts and the ground-water flow process, US Geological Survey, Reston, VA, 2000.
Harpold, A. A. and Molotch, N. P.: Sensitivity of soil water availability to changing snowmelt timing in the western U.S., Geophys. Res. Lett., 42, 8011–8020, https://doi.org/10.1002/2015GL065855, 2015.
Hayhoe, K., Cayan, D., Field, C. B., Frumhoff, P. C., Maurer, E. P., Miller, N. L., Moser, S. C., Schneider, S. H., Cahill, K. N., Cleland, E. E., Dale, L., Drapek, R., Hanemann, R. M., Kalkstein, L. S., Lenihan, J., Lunch, C. K., Neilson, R. P., Sheridan, S. C., and Verville, J. H.: Emissions pathways, climate change, and impacts on California, P. Natl. Acad. Sci. USA, 101, 12422–12427, https://doi.org/10.1073/pnas.0404500101, 2004.
He, M., Anderson, M., Schwarz, A., Das, T., Lynn, E., Anderson, J., Munévar, A., Vasquez, J., and Arnold, W.: Potential Changes in Runoff of California's Major Water Supply Watersheds in the 21st Century, Water, 11, 1651, https://doi.org/10.3390/w11081651, 2019.
Herrington, A. R., Lauritzen, P. H., Taylor, M. A., Goldhaber, S., Eaton, B. E., Bacmeister, J. T., Reed, K. A., and Ullrich, P. A.: Physics–Dynamics Coupling with Element-Based High-Order Galerkin Methods: Quasi-Equal-Area Physics Grid, Mon. Weather Rev., 147, 69–84, https://doi.org/10.1175/MWR-D-18-0136.1, 2019.
Homer, C., Dewitz, J., Yang, L., Jin, S., Danielson, P., Xian, G., Coulston, J., Herold, N., Wickham, J., and Megown, K.: Completion of the 2011 National Land Cover Database for the conterminous United States – representing a decade of land cover change information, Photogram. Eng. Remote Sens., 81, 345–354, 2015.
Huang, X., Rhoades, A. M., Ullrich, P. A., and Zarzycki, C. M.: An evaluation of the variable-resolution CESM for modeling California's climate, J. Adv. Model. Earth Syst., 8, 345–369, https://doi.org/10.1002/2015MS000559, 2016.
Huang, X., Stevenson, S., and Hall, A. D.: Future warming and intensification of precipitation extremes: A “double whammy” leading to increasing flood risk in California, Geophys. Res. Lett., 47, e2020GL088679, https://doi.org/10.1029/2020GL088679, 2020.
Hurrell, J. W., Holland, M. M., Gent, P. R., Ghan, S., Kay, J. E., Kushner, P. J., Lamarque, J.-F., Large, W. G., Lawrence, D., Lindsay, K., Lipscomb, W. H., Long, M. C., Mahowald, N., Marsh, D. R., Neale, R. B., Rasch, P., Vavrus, S., Vertenstein, M., Bader, D., Collins, W. D., Hack, J. J., Kiehl, J., and Marshall, S.: The Community Earth System Model: A Framework for Collaborative Research, B. Am. Meteorol. Soc., 94, 1339–1360, https://doi.org/10.1175/BAMS-D-12-00121.1, 2013.
Hurst.: Long-Term Storage Capacity of Reservoirs, Trans. Am. Soc. Civ. Eng., 116, 770–799, 1951.
IGBP: Global plant database published – IGBP, http://www.igbp.net/news/news/news/globalplantdatabasepublished.5.1b8ae20512db692f2a6800014762.html, last access: 17 October 2018.
Jennings, C. W., Strand, R. G., and Rogers, T. H.: Geologic Map of California, https://maps.conservation.ca.gov/cgs/gmc/ (last access: 17 October 2018), 1977.
Jones, P. W.: First- and Second-Order Conservative Remapping Schemes for Grids in Spherical Coordinates, Mon. Weather Rev., 127, 2204–2210, https://doi.org/10.1175/1520-0493(1999)127<2204:FASOCR>2.0.CO;2, 1999.
Kollet, S. J. and Maxwell, R. M.: Integrated surface–groundwater flow modeling: A free-surface overland flow boundary condition in a parallel groundwater flow model, Adv. Water Resour., 29, 945–958, https://doi.org/10.1016/j.advwatres.2005.08.006, 2006.
Koutsoyiannis, D.: Climate change, the Hurst phenomenon, and hydrological statistics, Hydrolog.Sci. J., 48, 3–24, https://doi.org/10.1623/hysj.48.1.3.43481, 2003.
Koutsoyiannis, D.: Revisiting the global hydrological cycle: is it intensifying?, Hydrol. Earth Syst. Sci., 24, 3899–3932, https://doi.org/10.5194/hess-24-3899-2020, 2020.
La Follette, P. T., Teuling, A. J., Addor, N., Clark, M., Jansen, K., and Melsen, L. A.: Numerical daemons of hydrological models are summoned by extreme precipitation, Hydrol. Earth Syst. Sci., 25, 5425–5446, https://doi.org/10.5194/hess-25-5425-2021, 2021.
Lehner, F., Deser, C., Maher, N., Marotzke, J., Fischer, E. M., Brunner, L., Knutti, R., and Hawkins, E.: Partitioning climate projection uncertainty with multiple large ensembles and CMIP5/6, Earth Syst. Dynam., 11, 491–508, https://doi.org/10.5194/esd-11-491-2020, 2020.
Lemordant, L., Gentine, P., Swann, A. S., Cook, B. I., and Scheff, J.: Critical impact of vegetation physiology on the continental hydrologic cycle in response to increasing CO2, P. Natl. Acad. Sci. USA, 115, 4093–4098, https://doi.org/10.1073/pnas.1720712115, 2018.
Liang, X., Lettenmaier, D. P., Wood, E. F., and Burges, S. J.: A simple hydrologically based model of land surface water and energy fluxes for general circulation models, J. Geophys. Res., 99, 14415–14428, https://doi.org/10.1029/94JD00483, 1994.
Maina, F. Z. and Siirila-Woodburn, E. R.: Watersheds dynamics following wildfires: Nonlinear feedbacks and implications on hydrologic responses, Hydrol. Process., 34, 33–50, https://doi.org/10.1002/hyp.13568, 2020a.
Maina, F. Z. and Siirila-Woodburn, E. R.: The Role of Subsurface Flow on Evapotranspiration: A Global Sensitivity Analysis, Water Resour. Res., 56, e2019WR026612, https://doi.org/10.1029/2019WR026612, 2020b.
Maina, F. Z., Siirila-Woodburn, E. R., Newcomer, M., Xu, Z., and Steefel, C.: Determining the impact of a severe dry to wet transition on watershed hydrodynamics in California, USA with an integrated hydrologic model, J. Hydrol., 580, 124358m, https://doi.org/10.1016/j.jhydrol.2019.124358, 2020a.
Maina, F. Z., Siirila-Woodburn, E. R., and Vahmani, P.: Sensitivity of meteorological-forcing resolution on hydrologic variables, Hydrol. Earth Syst. Sci., 24, 3451–3474, https://doi.org/10.5194/hess-24-3451-2020, 2020b.
Maina, F. Z., Siirila-Woodburn, E. R., and Dennedy-Frank, P. J.: Assessing the impacts of hydrodynamic parameter uncertainties on simulated evapotranspiration in a mountainous watershed, J. Hydrol., 608, 127620, https://doi.org/10.1016/j.jhydrol.2022.127620, 2022.
Mallakpour, I., Sadegh, M., and AghaKouchak, A.: A new normal for streamflow in California in a warming climate: Wetter wet seasons and drier dry seasons, J. Hydrol., 567, 203–211, https://doi.org/10.1016/j.jhydrol.2018.10.023, 2018.
Maurer, E. P.: Uncertainty in hydrologic impacts of climate change in the Sierra Nevada, California, under two emissions scenarios, Climatic Change, 82, 309–325, https://doi.org/10.1007/s10584-006-9180-9, 2007.
Maurer, E. P. and Duffy, P. B.: Uncertainty in projections of streamflow changes due to climate change in California, Geophys. Res. Lett., 32, L03704, https://doi.org/10.1029/2004GL021462, 2005.
Maxwell, R. M.: A terrain-following grid transform and preconditioner for parallel, large-scale, integrated hydrologic modeling, Adv. Water Resour., 53, 109–117, https://doi.org/10.1016/j.advwatres.2012.10.001, 2013.
Maxwell, R. M. and Condon, L. E.: Connections between groundwater flow and transpiration partitioning, Science, 353, 377–380, https://doi.org/10.1126/science.aaf7891, 2016.
Maxwell, R. M. and Miller, N. L.: Development of a Coupled Land Surface and Groundwater Model, J. Hydrometeorol., 6, 233–247, https://doi.org/10.1175/JHM422.1, 2005.
Mayer, T. D. and Naman, S. W.: Streamflow Response to Climate as Influenced by Geology and Elevation, J. Am. Water Resour. Assoc., 47, 724–738, https://doi.org/10.1111/j.1752-1688.2011.00537.x, 2011.
McEvoy, D. J., Pierce, D. W., Kalansky, J. F., Cayan, D. R., and Abatzoglou, J. T.: Projected Changes in Reference Evapotranspiration in California and Nevada: Implications for Drought and Wildland Fire Danger, Earth's Future, 8, e2020EF001736, https://doi.org/10.1029/2020EF001736, 2020.
Milly, P. C. D. and Dunne, K. A.: A Hydrologic Drying Bias in Water-Resource Impact Analyses of Anthropogenic Climate Change, J. Am. Water Resour. Assoc., 53, 822–838, https://doi.org/10.1111/1752-1688.12538, 2017.
Milly, P. C. D., Dunne, K. A., and Vecchia, A. V.: Global pattern of trends in streamflow and water availability in a changing climate, Nature, 438, 347–350, https://doi.org/10.1038/nature04312, 2005.
Mote, P. W., Hamlet, A. F., Clark, M. P., and Lettenmaier, D. P.: Declining mountain snowpack in western north america, B. Am. Meteorol. Soc., 86, 39–50, https://doi.org/10.1175/BAMS-86-1-39, 2005.
Musselman, K. N., Clark, M. P., Liu, C., Ikeda, K., and Rasmussen, R.: Slower snowmelt in a warmer world, Nat. Clim. Change, 7, 214–219, https://doi.org/10.1038/nclimate3225, 2017a.
Musselman, K. N., Molotch, N. P., and Margulis, S. A.: Snowmelt response to simulated warming across a large elevation gradient, southern Sierra Nevada, California, The Cryosphere, 11, 2847–2866, https://doi.org/10.5194/tc-11-2847-2017, 2017b.
NCAR/UCAR: CESM Models, https://www.cesm.ucar.edu/models/, last acce4ss: 20 June 2022.
Neelin, J. D., Langenbrunner, B., Meyerson, J. E., Hall, A., and Berg, N.: California Winter Precipitation Change under Global Warming in the Coupled Model Intercomparison Project Phase 5 Ensemble, J. Climate, 26, 6238–6256, https://doi.org/10.1175/JCLI-D-12-00514.1, 2013.
Neitsch, S. L., Arnold, J. G., Kiniry, J. R., and Williams, J. R.: Soil and Water Assessment tool (SWAT) user's manual version 2000, Grassland Soil and Water Research Laboratory, Temple, TX, https://data.nal.usda.gov/dataset/swat-soil-and-water-assessment-tool (last access: 20 June 2022), 2001.
NERSC: HPSS archive: listing of /home/a/arhoades/Shared/www/Hyperion/, NERCS [data set], https://portal.nersc.gov/archive/home/a/arhoades/Shared/www/Hyperion/, last access: 20 June 2022.
Niraula, R., Meixner, T., Dominguez, F., Bhattarai, N., Rodell, M., Ajami, H., Gochis, D., and Castro, C.: How Might Recharge Change Under Projected Climate Change in the Western U.S.?, Geophys. Res. Lett., 44, 10407–10418, https://doi.org/10.1002/2017GL075421, 2017.
Niu, G.-Y., Yang, Z.-L., Mitchell, K. E., Chen, F., Ek, M. B., Barlage, M., Kumar, A., Manning, K., Niyogi, D., Rosero, E., Tewari, M., and Xia, Y.: The community Noah land surface model with multiparameterization options (Noah-MP): 1. Model description and evaluation with local-scale measurements, J. Geophys. Res., 116, D12109, https://doi.org/10.1029/2010JD015139, 2011.
ParFlow: ParFlow hydrologic model, https://parflow.org/#download, last accee: 20 June 2022.
Payne, A. E., Demory, M.-E., Leung, L. R., Ramos, A. M., Shields, C. A., Rutz, J. J., Siler, N., Villarini, G., Hall, A., and Ralph, F. M.: Responses and impacts of atmospheric rivers to climate change, Nat. Rev. Earth Environ., 1, 143–157, https://doi.org/10.1038/s43017-020-0030-5, 2020.
Persad, G. G., Swain, D. L., Kouba, C., and Ortiz-Partida, J. P.: Inter-model agreement on projected shifts in California hydroclimate characteristics critical to water management, Climatic Change, 162, 1493–1513, https://doi.org/10.1007/s10584-020-02882-4, 2020.
Ralph, F. M. and Dettinger, M. D.: Storms, floods, and the science of atmospheric rivers, Eos Trans. Am. Geophys. Union, 92, 265–266, https://doi.org/10.1029/2011EO320001, 2011.
Ralph, F. Martin, Neiman, P. J., Wick, G. A., Gutman, S. I., Dettinger, M. D., Cayan, D. R., and White, A. B.: Flooding on California's Russian River: Role of atmospheric rivers, Geophys. Res. Lett., 33, L13801, https://doi.org/10.1029/2006GL026689, 2006.
Rhoades, A. M., Huang, X., Ullrich, P. A., and Zarzycki, C. M.: Characterizing Sierra Nevada Snowpack Using Variable-Resolution CESM, J. of Appl. Meteorol. Clim., 55, 173–196, https://doi.org/10.1175/JAMC-D-15-0156.1, 2016.
Rhoades, A. M., Ullrich, P. A., and Zarzycki, C. M.: Projecting 21st century snowpack trends in western USA mountains using variable-resolution CESM, Clim. Dynam., 50, 261–288, https://doi.org/10.1007/s00382-017-3606-0, 2018a.
Rhoades, A. M., Jones, A. D., and Ullrich, P. A.: The changing character of the California Sierra Nevada as a natural reservoir, Geophys. Res. Lett., 45, 13008–13019, https://doi.org/10.1029/2018GL080308, 2018b.
Rhoades, A. M., Ullrich, P. A., Zarzycki, C. M., Johansen, H., Margulis, S. A., Morrison, H., Xu, Z., and Collins, W. D.: Sensitivity of Mountain Hydroclimate Simulations in Variable-Resolution CESM to Microphysics and Horizontal Resolution, J. Adv. Modeling Earth Syst., 10, 1357–1380, https://doi.org/10.1029/2018MS001326, 2018c.
Rhoades, A. M., Jones, A. D., O'Brien, T. A., O'Brien, J. P., Ullrich, P. A., and Zarzycki, C. M.: Influences of North Pacific Ocean domain extent on the western U.S. winter hydroclimatology in variable-resolution CESM, J. Geophys. Res.-Atmos., 125, e2019JD031977, https://doi.org/10.1029/2019JD031977, 2020a.
Rhoades, A. M., Jones, A. D., Srivastava, A., Huang, H., O'Brien, T. A., Patricola, C. M., Ullrich, P. A., Wehner, M., and Zhou, Y.: The shifting scales of western U.S. landfalling atmospheric rivers under climate change, Geophys. Res. Lett., 47, e2020GL089096, https://doi.org/10.1029/2020GL089096, 2020b.
Rhoades, A. M., Risser, M. D., Stone, D. A., Wehner, M. F., and Jones, A. D.: Implications of warming on western United States landfalling atmospheric rivers and their flood damages, Weather Clim. Extrem., 32, 100326, https://doi.org/10.1016/j.wace.2021.100326, 2021.
Richards, L. A.: Capillary conduction of liquids through porous medium, J. Appl. Phys., 1, 318–333, https://doi.org/10.1063/1.1745010, 1931.
Safeeq, M., Grant, G .E., Lewis, S. L., and Tague, C. L.: Coupling snowpack and groundwater dynamics to interpret historical streamflow trends in the western United States, Hydrol. Process., 27, 655–668, https://doi.org/10.1002/hyp.9628, 2013.
Safeeq, M., Grant, G. E., Lewis, S. L., Kramer, M. G., and Staab, B.: A hydrogeologic framework for characterizing summer streamflow sensitivity to climate warming in the Pacific Northwest, USA, Hydrol. Earth Syst. Sci., 18, 3693–3710, https://doi.org/10.5194/hess-18-3693-2014, 2014.
Safeeq, Mohammad, Grant, G. E., Lewis, S. L., and Staab, B.: Predicting landscape sensitivity to present and future floods in the Pacific Northwest, USA, Hydrol. Process., 29, 5337–5353, https://doi.org/10.1002/hyp.10553, 2015.
Shukla, S., Safeeq, M., AghaKouchak, A., Guan, K., and Funk, C.: Temperature impacts on the WY 2014 drought in California, Geophys. Res. Lett., 42, 4384–4393, https://doi.org/10.1002/2015GL063666, 2015.
Siirila-Woodburn, E. R., Rhoades, A. M., Hatchett, B. J., Huning, L. S., Szinai, J., Tague, C., Nico, P. S., Feldman, D. R., Jones, A. D., Collins, W. D., and Kaatz, L.: A low-to-no snow future and its impacts on water resources in the western United States, Nat. Rev. Earth Environ., 2, 800–819, https://doi.org/10.1038/s43017-021-00219-y, 2021.
Son, K. and Tague, C.: Hydrologic responses to climate warming for a snow-dominated watershed and a transient snow watershed in the California Sierra, Ecohydrology, 12, e2053, https://doi.org/10.1002/eco.2053, 2019.
Song, X., Zhang, J., Zhan, C., Xuan, Y., Ye, M., and Xu, C.: Global sensitivity analysis in hydrological modeling: Review of concepts, methods, theoretical framework, and applications, J. Hydrol., 523, 739–757, https://doi.org/10.1016/j.jhydrol.2015.02.013, 2015.
Swain, D. L., Langenbrunner, B., Neelin, J. D., and Hall, A.: Increasing precipitation volatility in twenty-first-century California, Nat. Clim. Change, 8, 427–433, https://doi.org/10.1038/s41558-018-0140-y, 2018.
Tague, C. and Peng, H.: The sensitivity of forest water use to the timing of precipitation and snowmelt recharge in the California Sierra: Implications for a warming climate, J. Geophys. Res.-Biogeo., 118, 875–887, https://doi.org/10.1002/jgrg.20073, 2013.
Tang, G., Li, S., Yang, M., Xu, Z., Liu, Y., and Gu, H.: Streamflow response to snow regime shift associated with climate variability in four mountain watersheds in the US Great Basin, J. Hydrol., 573, 255–266, https://doi.org/10.1016/j.jhydrol.2019.03.021, 2019.
Trefry, M. G. and Muffels, C.: FEFLOW: a finite-element ground water flow and transport modeling tool, Ground Water, 45, 525–528, https://doi.org/10.1111/j.1745-6584.2007.00358.x, 2007.
Vicuna, S. and Dracup, J. A.: The evolution of climate change impact studies on hydrology and water resources in California, Climatic Change, 82, 327–350, https://doi.org/10.1007/s10584-006-9207-2, 2007.
Vicuna, S., Maurer, E. P., Joyce, B., Dracup, J. A., and Purkey, D.: The Sensitivity of California Water Resources to Climate Change Scenarios, J. Am. Water Resou. Assoc., 43, 482–498, https://doi.org/10.1111/j.1752-1688.2007.00038.x, 2007.
Welch, L. A. and Allen, D. M.: Hydraulic conductivity characteristics in mountains and implications for conceptualizing bedrock groundwater flow, Hydrogeol. J., 22, 1003–1026, https://doi.org/10.1007/s10040-014-1121-5, 2014.
Zarzycki, C. M., Levy, M. N., Jablonowski, C., Overfelt, J. R., Taylor, M. A., and Ullrich, P. A.: Aquaplanet Experiments Using CAM's Variable-Resolution Dynamical Core, J. Climate, 27, 5481–5503, https://doi.org/10.1175/JCLI-D-14-00004.1, 2014.