the Creative Commons Attribution 4.0 License.
the Creative Commons Attribution 4.0 License.
 | 24 Jan 2022
Trends and variability in snowmelt in China under climate change
Yong Yang
Guohua Liu
Zhangwen Liu
Xiqiang Wang
Snowmelt is a major fresh water resource, and quantifying snowmelt and its variability under climate change is necessary for the planning and management of water resources. Spatiotemporal changes in snow properties in China have drawn wide attention in recent decades; however, country-wide assessments of snowmelt are lacking. Using precipitation and temperature data with a high spatial resolution (0.5′; approximately 1 km), this study calculated the monthly snowmelt in China for the 1951–2017 period, using a simple temperature index model, and the model outputs were validated using snowfall, snow depth, snow cover extent and snow water equivalent. Precipitation and temperature scenarios developed from five CMIP5 models were used to predict future snowmelt in China under three different representative concentration pathway (RCP) scenarios (RCP2.6, RCP4.5 and RCP8.5). The results show that the mean annual snowmelt in China from 1951 to 2017 is 2.41×10¹¹ m3 yr−1. The mean annual snowmelt values in Northern Xinjiang, Northeast China and the Tibetan Plateau – China's three main stable snow cover regions – are 0.18×10¹¹, 0.42×10¹¹ and 1.15×10¹¹ m3 yr−1, respectively. From 1951 to 2017, the snowmelt increased significantly in the Tibetan Plateau and decreased significantly in northern, central and southeastern China. In the whole of China, there was a decreasing trend in snowmelt, but this was not statistically significant. The mean annual snowmelt runoff ratios are generally more than 10 % in almost all third-level basins in West China, more than 5 % in third-level basins in North and Northeast China and less than 2 % in third-level basins in South China. From 1951 to 2017, the annual snowmelt runoff ratios decreased in most third-level basins in China. Under RCP2.6, RCP4.5 and RCP8.5, the projected snowmelt in China in the near future (2011–2040; mid-future –2041–2070; far future – 2071–2099) may decrease by 10.4 % (15.8 %; 13.9 %), 12.0 % (17.9 %; 21.1 %) and 11.7 % (24.8 %; 36.5 %) compared to the reference period (1981–2010), respectively. Most of the projected mean annual snowmelt runoff ratios in third-level basins in different future periods are lower than those in the reference period. Low temperature regions can tolerate more warming, and the snowmelt change in these regions is mainly influenced by precipitation; however, the snowmelt change in warm regions is more sensitive to temperature increases. The spatial variability in snowmelt changes may lead to regional differences in the impact of snowmelt on water supply.
- Article
(15050 KB) - Full-text XML
-
Supplement
(11093 KB) - BibTeX
- EndNote


Snow properties have changed significantly under the ongoing warming of the global climate, and variations in snow cover exert strong feedbacks on the climate system due to its high albedo and low thermal conductivity, as well as the high latent heat of the phase change (Zhang and Ma, 2018; Pulliainen et al., 2020; Vano, 2020; You et al., 2020). Additionally, snow is a critical component of the hydrological system and water cycle, and snowmelt is a major fresh water resource in many regions (Mankin et al., 2015). More than one-sixth of the Earth's population relies on snowmelt for their water supply, and snowmelt-dominated regions contribute roughly one-quarter of the global gross domestic product (Barnett et al., 2005). Climate warming has resulted in smaller snowfall/precipitation ratios and an earlier onset of snowmelt and slower snowmelt rates (Berghuijs et al., 2014; Musselman et al., 2017; Barnhart et al., 2020). This has not only changed seasonal runoff distributions but has also affected the total annual runoff (Bloschl et al., 2019; Jenicek and Ledvinka, 2020). Consequently, determining the amount of snowmelt and its variability under climate change is important for the planning and management of water resources, such as agricultural water management, flood forecasting, reservoir operations and the design of hydraulic structures (Barnhart et al., 2020; Qin et al., 2020).
There are many models for calculating snowmelt, and these can be basically divided into the following two types: physically based snowmelt models and simplified temperature index models (also known as degree–day methods; Skaugen et al., 2018; Li et al., 2019). In theory, physically based snowmelt models can provide more accurate predictions by considering the coupled interaction between energy components in complex snowmelt processes (Li et al., 2019). However, many studies have shown that, due to the mathematical complexities and massive data requirements of physically based models, they do not necessarily perform better than temperature index models (Hock, 2003; Jost et al., 2012; Skaugen et al., 2018; Lopez et al., 2020). Temperature index models are based on the assumption that the temporal variability in incoming solar radiation is adequately represented by the variations in air temperature and that the snowmelt during a time interval is proportional to positive air temperatures (Hock, 2003; Jost et al., 2012; Lopez et al., 2020). Because of the wide availability of air temperature data, their computational simplicity and their generally good model performance, temperature index models are the most common approach for calculating snowmelt around the world (Hock, 2003; Immerzeel et al., 2010; Lopez et al., 2020).

Figure 1The three main stable snow cover regions and the mean snow depth in China (1951–2009) (a). China's five climatic zones (MPZ – mountain plateau zone; TMZ – temperate monsoon zone; TCZ – temperate continental zone; SMZ – subtropical monsoon zone) and mean annual air temperature (1951–2017) (b). The snow cover classification and mean monthly snow density in China (1999–2008) (c). The third-level basins and mean annual snowfall in China (1961–1979) (d).
China covers a vast area and a variety of climate regions, and its snow-covered regions are widely distributed geographically with evident spatial differences (Tan et al., 2019). Northern Xinjiang, Northeastern China–Inner Mongolia (hereafter referred to as Northeast China) and the Tibetan Plateau are the three main regions with stable snow cover in China (Ke et al., 2016; Fig. 1a). As a typical arid and semi-arid region of Central Asia with a significant lack of freshwater resources, the surface runoff in the Xinjiang Uygur Autonomous Region (hereafter, Xinjiang) is mainly supplied by snowmelt (Chen et al., 2020; Wu et al., 2021). In Northeast China, snow plays an important role as a natural reservoir in winter and a source of water in spring, with snowmelt contributing more than half of the runoff during the main crop sowing season (April and May; Qi et al., 2020). Melting snow is also an important hydrological process on the Tibetan Plateau, which is the source region of many major Asian rivers, and is considered as being the Asian water tower (Immerzeel et al., 2010, 2020). Furthermore, snowmelt is an important water source in other parts of China, especially the arid and semi-arid areas in North China (Zhang et al., 2015; Wu et al., 2021). Spatiotemporal changes in China's snow properties (e.g., snow cover extent, snow cover phenology, snow depth, snow density and snow water equivalent) have drawn wide attention in recent decades (Dai and Chen, 2010; Wang and Li, 2012; Chen et al., 2016; Ke et al., 2016; Tan et al., 2019; Ma et al., 2020; Yang et al., 2020); however, country-wide assessments of snowmelt are lacking. Projected increases in air temperature and associated precipitation regime shifts are expected to have significant consequences for snowmelt and water resources (Ficklin et al., 2016). Although many studies have investigated snowmelt in single or multiple basins (e.g., Zhang et al., 2015, 2020; Chen et al., 2019; Li et al., 2019, 2021), the spatiotemporal variability in snowmelt in China and its response to climate warming remain unclear.
Under this background, we developed a simple monthly temperature index model to calculate the snowmelt in China using a high spatial resolution (0.5′; approximately 1 km) data set of monthly air temperatures and precipitation. The model considers complex snow processes, such as melting, accumulation and sublimation, and was validated using snowfall, snow depth, snow cover extent and snow water equivalent. The objectives of this study are to (1) quantify the snowmelt across China and in its three main stable snow cover distribution regions, (2) analyze the spatiotemporal variability in snowmelt in China during 1951–2017, (3) elucidate the spatiotemporal variability in snowmelt runoff ratio in the third-level basins in China and (4) assess the impacts of projected future climate change on snowmelt in China.
2.1 Study region
In general, China can be divided into the following five main climatic zones: the mountain plateau zone (MPZ), the temperate monsoon zone (TMZ), the temperate continental zone (TCZ), the subtropical monsoon zone (SMZ) and the tropical monsoon zone (Yang et al., 2021; Fig. 1b). Because the land area of the tropical monsoon zone is significantly smaller than that of the other climatic zones, and it has extremely low snowfall, it was incorporated into the SMZ for parameter assignment. Additionally, because of the lack of meteorological data, and the fact that it has very little snowfall, Taiwan was not considered in this study. The snow cover types in China can be divided into the following five types: prairie, taiga, tundra, mountain and ephemeral (X. Li et al., 2020; Fig. 1c). The analysis of snowmelt runoff ratio is carried out at the three-level basin scale, and Fig. 1d shows the boundaries of the three-level basins in China (the first-level and second-level basins can be seen in Fig. S1 in the Supplement).
2.2 Data collection
2.2.1 High spatial resolution data set of monthly air temperatures and precipitation
Data with a high spatial resolution of 0.5′ (approximately 1 km), including the monthly minimum, maximum and mean temperatures (Tmin, Tmax and Ta, respectively) and precipitation, were obtained from Zenodo in the Network Common Data Form (NetCDF; https://doi.org/10.5281/zenodo.3114194, for precipitation, Peng, 2019a; https://doi.org/10.5281/zenodo.3185722, for air temperature, Peng, 2019b). The data were spatially downscaled from the 0.5∘ Climatic Research Unit time series data, with the 0.5′ climatology data set of WorldClim, using delta spatial downscaling. Peng et al. (2019) evaluated this data set using observations collected from 1951 to 2016 by 496 meteorological stations across China, and the average values of the coefficient of determination (R2), mean absolute error (MAE), root mean square error (RMSE) and Nash–Sutcliffe efficiency (NSE), for the monthly mean temperature at all meteorological stations are 0.996, 0.820, 0.969 and 0.981 ∘C, respectively, and for the monthly precipitation are 0.863, 13.269, 21.941 and 0.808 mm, respectively. Detailed information on the data set was given by Peng et al. (2019). Although the original data set covers the 1901 to 2017 period, we selected 1951 to 2017 as the study period, as only data from after 1951 have been validated by observations from meteorological stations (Table 1).
Table 1Data used in the snowmelt model.

* Minimum, maximum and mean temperatures. Note: CMA – China Meteorological Administration; NTPDC – National Tibetan Plateau Data Center; NCDDC – National Cryosphere Desert Data Center.
2.2.2 Data sets for model parameterization
The observational air temperature data used to determine positive degree–day (PDD) parameters were collected from 824 meteorological stations (Fig. 1b) in the 1951–2017 period and were provided by the China Meteorological Administration (http://data.cma.cn/, last access: 27 December 2019). The positive degree–day is defined as the cumulative temperature above 0 ∘C over a given period (Wake and Marshall, 2017), and in this study, it was the monthly positive accumulated temperature.
The observational snow density data used to determine degree–day factors (DDFs) were collected from 417 meteorological stations in China (Fig. 1c) during the 1999–2008 period and were provided by the China Meteorological Administration.
The threshold temperature parameters for determining the precipitation types at meteorological stations (Fig. S2) were obtained from Han et al. (2010), who derived threshold temperature parameters using air temperature and precipitation data from 485 meteorological stations in China from 1961 to 1979. The threshold temperatures of each calculated cell were interpolated using the parameters from the meteorological stations via the inverse distance weighting (IDW) method.
2.2.3 Data sets for model evaluation
The observational snowfall (snow depth) data used to validate the model were collected from 475 (557) meteorological stations in China (Fig. 1d (1a)) during the 1961–1979 (1951–2009) period and were provided by the China Meteorological Administration (Table 1). Because of the scarce data or the very low snowfall (shallow snow) at some stations, snowfall (snow depth) observations from 457 (264) stations were selected to verify the snowfall (snow depth) from the model.
A long time series of daily snow depth derived from passive microwave remote sensing data (1979–2018) was obtained from the National Tibetan Plateau Data Center (http://data.tpdc.ac.cn, last access: 26 November 2019; Che and Dai, 2015; Table 1). The data set covers the entire land surface of China, with a spatial resolution of 0.25∘. Detailed information on the data set sources and product processes can be found in Che et al. (2008) and Dai et al. (2012). This data set has been widely utilized in climatic and hydrological research in China (e.g., Liu et al., 2020; Wu et al., 2021; Zhu et al., 2021). The spatial resolution of this data set is significantly different from that of the air temperature and precipitation data used in this study. The snow cover extent measures generated from this data set were used to validate the model.
Additionally, a long time series of a daily snow water equivalent data set derived from passive microwave remote sensing data (1980–2020) was provided by the National Cryosphere Desert Data Center (https://www.ncdc.ac.cn, last access: 9 April 2021; Jiang et al., 2020; Table 1). The snow water equivalent data set was produced from the passive microwave remote sensing data using the mixed-pixel method. The data set covers the entire land surface of China, with a spatial resolution of 25 km. Detailed information on the data set sources and product processes are given by Jiang et al. (2014) and Yang et al. (2019).
2.2.4 Climate projections and downscaling
In total, five CMIP5 models under three different representative concentration pathway scenarios (RCP2.6, RCP4.5 and RCP8.5), namely GFDL-ESM2M, HadGEM2-ES, IPSL-CM5A-LR, MIROC-ESM-CHEM and NorESM1-M, were selected to predict the future snowmelt changes in China. The Inter-Sectoral Impact Model Intercomparison Project (ISIMIP) selected these five CMIP5 models to span the space of global mean temperature change and relative precipitation changes (Warszawski et al., 2014). The aforementioned climate projections have been bias-corrected and downscaled to a grid with a resolution of 0.5∘ by ISIMIP (Hempel et al., 2013) and widely utilized in climate change research in China (e.g., Li et al., 2016; Yuan et al., 2017; Chang et al., 2020). In this study, we use the delta downscaling method to determine the monthly future meteorological data (2006–2099) based on the high spatial resolution temperature and precipitation data set and the simulations of the five CMIP5 models during the historical period (1951–2005). Detailed information on the delta method was given in Immerzeel et al. (2012) and Zhao et al. (2019). The projected precipitation and temperature changes in China and the three main stable snow cover regions can be seen in Figs. S3 and S4, respectively.

Figure 2The relationship between the observed monthly accumulated positive air temperature (PDD) and mean air temperature (Ta) (a) and the scatterplot between the calculated and observed monthly PDD (b) at meteorological stations in the mountain plateau zone of China. R2 is the coefficient of determination, MAE is the mean absolute error (degrees Celsius), RMSE is the root mean square error (degrees Celsius) and NSE is the Nash–Sutcliffe efficiency.
3.1 Snowmelt model
Temperature index models are based on an assumed relationship between snowmelt and air temperature, which is usually expressed in the form of positive temperature sums. In this study, the snowmelt was calculated as follows:
where M, Sacc, Psnow and Ssub are the snowmelt, snow accumulation, snowfall and snow sublimation (millimeters), respectively. DDF is the degree–day factor (millimeters per degree Celsius per day; hereafter ), an empirical factor that relates the rate of snowmelt to air temperature. PDD is the accumulated positive air temperature (degrees Celsius). The subscript m indicates the month, and D is the number of days in the month m.
3.1.1 Snowfall
The determination of the precipitation types is the first crucial step, and the distinction between rainfall and snowfall is based on the assumption that precipitation falls either as rain, as snow or as a mix, depending on two threshold temperature parameters, as follows:
where Psnow and P are the monthly snowfall and precipitation (millimeters), respectively. Ta is the monthly mean temperature (degrees Celsius). Train and Tsnow are the threshold temperature (degrees Celsius) for rainfall and snowfall, respectively.
3.1.2 DDF
DDF is the key parameter of the temperature index snowmelt model, which depends on the snow density and varies with space and time. We used the following the empirical equation to determine the DDF after Rajkumari et al. (2019):
where ρs and ρw are the density of snow and water (grams per cubic centimeter; hereafter g cm−3), respectively. The observed snow density is variable and the density of water is constant. DDF is the degree–day factor (). For taiga regions (Fig. 1c), the equation was corrected as follows:
The DDF values at the meteorological stations were calculated for each month and were then interpolated to each calculated cell.
3.1.3 PDD
Based on the daily mean air temperatures from 1960 to 2018 at meteorological stations in China, Liu et al. (2021) proposed a simple method to calculate the monthly PDD according to the monthly mean temperature, as follows:
where T1 and T2 are threshold temperatures (degrees Celsius), and a, b and c are empirical parameters.
First, T1, T2, a, b and c were calculated according to the measured data from meteorological stations in the four different climate zones (Fig. 1b) and were then interpolated to each calculated cell. Table 2 shows the different threshold temperatures and empirical parameters in the four climate zones, and Fig. 2 shows the relationship between the measured monthly PDD and the mean temperature at meteorological stations and the relationship between the calculated and measured monthly PDD, taking the MPZ as an example. A statistical analysis of the calculated monthly PDD against observed PDD at 824 meteorological stations shows the excellent performance at almost all of the stations (Fig. S5). Statistical analysis shows that Eq. (6) can adequately calculate the monthly PDD (Table 2).
Table 2The parameters required for the calculation of the monthly accumulated positive air temperature (PDD) and the statistical analysis between the calculated and measured monthly PDD in four different climatic zones of China.
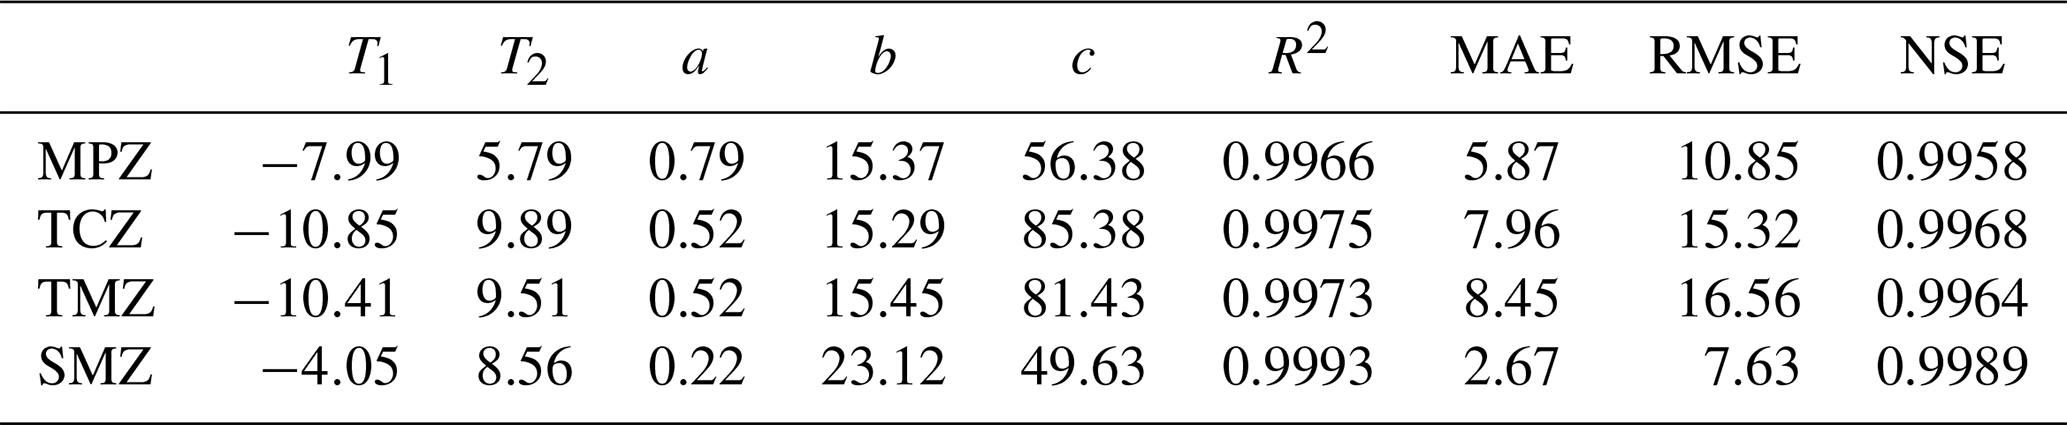
MPZ – mountain plateau zone; TMZ – temperate monsoon zone; TCZ – temperate continental zone; SMZ – subtropical monsoon zone; T1, T2, a, b and c – parameters in Eq. (6); R2 – coefficient of determination; MAE – mean absolute error (degrees Celsius); RMSE – root mean square error (degrees Celsius); NSE – Nash–Sutcliffe efficiency.
3.1.4 Snow sublimation
As a loss of water from the snowpack to the atmosphere, snow sublimation is difficult to quantify by measurement or modeling (Stigter et al., 2018). The bulk aerodynamic method and aerodynamic profile methods are the common methods to calculate snow sublimation (Svoma, 2016). Some researchers used evapotranspiration equations (e.g., the Penman–Monteith method) to estimate sublimation (Stigter et al., 2018). In general, these methods require accurate meteorological data and are very difficult to scale up from the microscale to the macroscale (Svoma, 2016). Many studies have reported the ratio of snow sublimation to snowfall (e.g., Zhang et al., 2008; Zhu et al., 2014; Sexstone et al., 2018). Therefore, considering the limited data availability and the monthly scale of this study, the following simple equation was used to estimate the monthly snow sublimation:
where k⋅Sacc and PET are the amount of snow accumulation available for sublimation and the potential sublimation (millimeters), respectively. The empirical parameter k was set according to studies reporting the ratio of snow sublimation to snowfall in China and surrounding areas (Table S1 and Fig. S6), as shown in Table 3.
Table 3The values of the empirical parameter k used to estimate snow sublimation (Eq. 7) for different climate zones and different snow types.
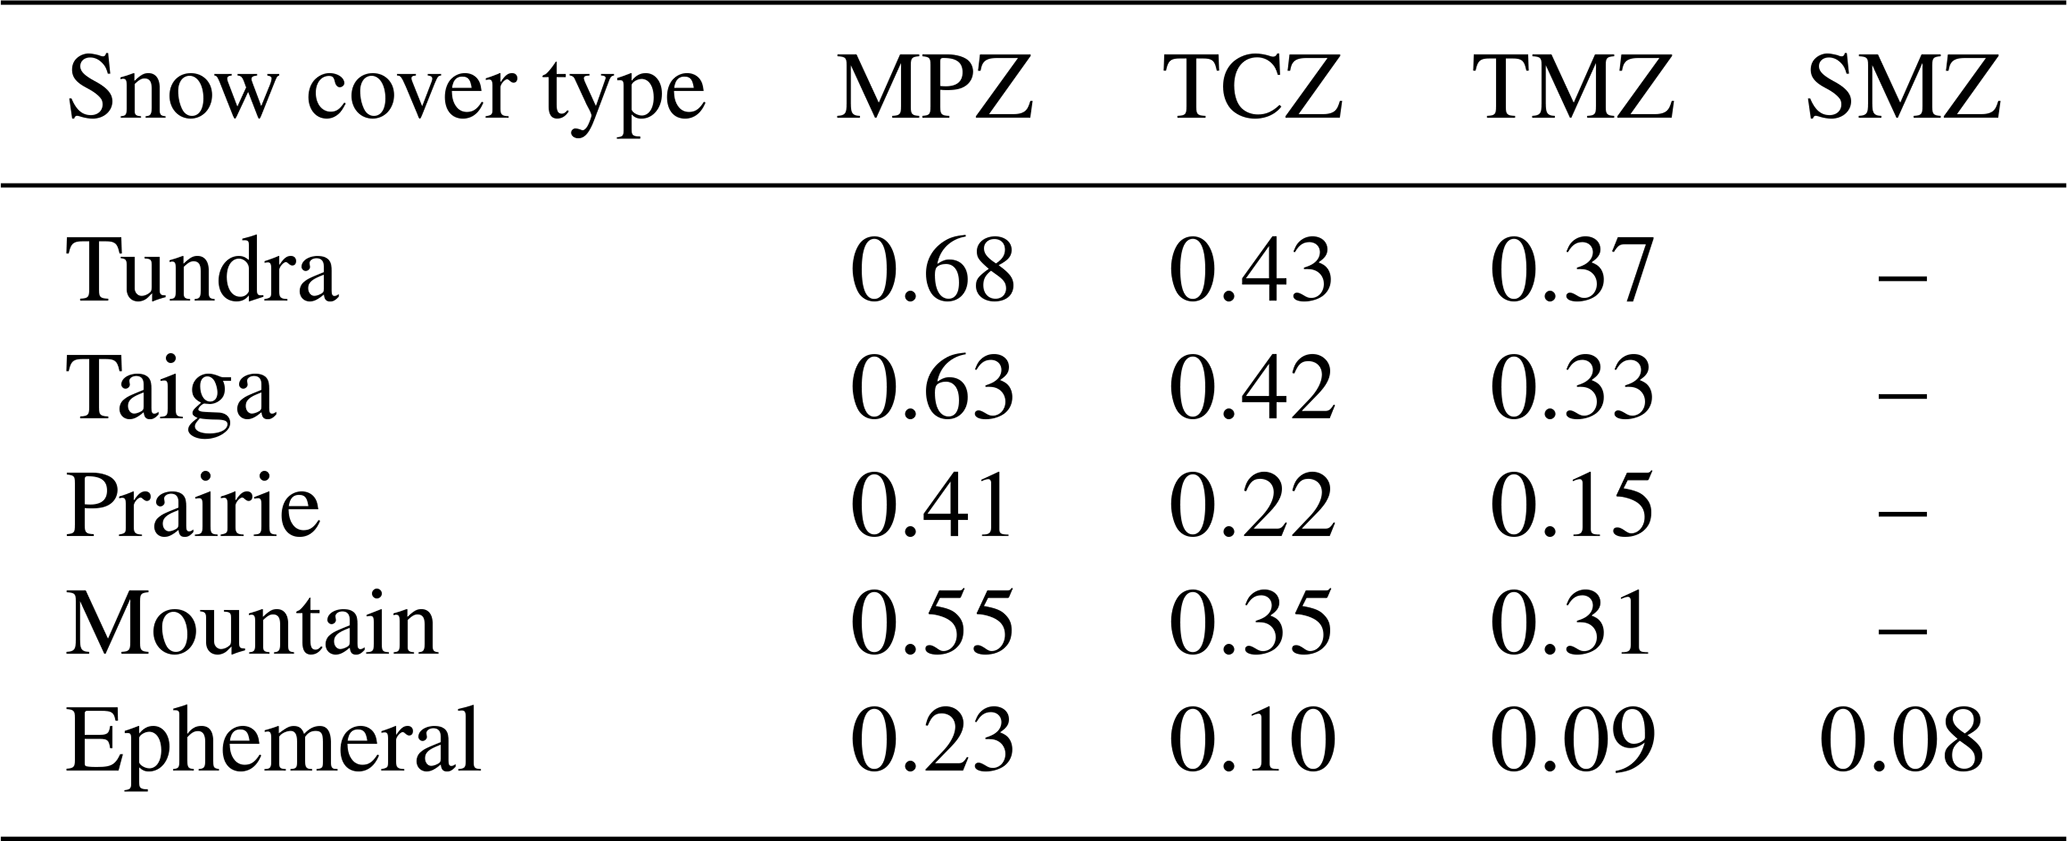
MPZ – mountain plateau zone; TMZ – temperate monsoon zone; TCZ – temperate continental zone; SMZ – subtropical monsoon zone.
PET was calculated by the Hargreaves–Samani method, as follows (Hargreaves and Samani, 1985):
where Ta, Tmax and Tmin are the monthly average temperature, maximum temperature and minimum temperature (degrees Celsius), respectively; Ra is the extraterrestrial radiation (megajoules per square meter per month; hereafter ), which is a function of the latitude and the Julian day, and λ is the latent heat of vaporization (megajoules per kilogram; hereafter MJ kg−1).
3.2 Snowmelt runoff ratio
The snowmelt runoff ratio, which represents the contribution of snowmelt to river discharge, is defined as the percentage of runoff derived from snowmelt to the total runoff. Many studies have used indirect indicators to estimate the snowmelt runoff ratio, such as the ratios of total snowfall to total precipitation, total snowfall to total runoff or melt season runoff to total annual runoff (Li et al., 2017). Snowmelt and rainfall are the sources of runoff generation (Vormoor et al., 2016). In this study, the snowmelt runoff ratio was calculated as the ratio of snowmelt to the sum of snowmelt and rainfall, as follows:
where M and Prain are the snowmelt and rainfall (millimeters), respectively, and Snowr is the percentage of runoff derived from snowmelt to the total runoff.
3.3 Trend analysis
The non-parametric Mann–Kendall test (Mann, 1945; Kendall, 1975) was used to analyze the trend and significance level of the snowmelt and other variables, as follows:
where n is the number of the data set, xj and xk are the data values in time series j and k, m is the number of tied groups, and ti denotes the number of ties of extent i. A tied group is a set of sample data having the same value. Positive and negative values of Z indicate increasing and decreasing trends, respectively. The testing of the trends is done at the specific α significance level. If , then the trend is statistically significant; otherwise, the trend is not statistically significant. In this study, significance levels of α=0.05 (95 % confidence level) were applied.
Additionally, Sen's (1968) slope method was used to analyze the slope of the variation, as follows:
where the β sign reflects whether a trend is negative or positive, while its value indicates the steepness of the trend.
3.4 Evaluation criteria
Statistical indices were used for quantitative analysis of the snowmelt model performance, and a series of statistical criteria are used in this study as follows:
where R2, MAE, RMSE and NSE are the coefficient of determination, mean absolute error, root mean square error and Nash–Sutcliffe efficiency, respectively. Xsi and Xoi represent simulated and observed data at time i, respectively. n is the number of data points, and cov and σ are the covariance and standard deviation, respectively.
4.1 Model performance
4.1.1 Snowfall validation using observational data from meteorological stations
Figure 3 shows the statistical criteria between the calculated and observed snowfall at meteorological stations in China from 1961 to 1979. The MAE and RMSE vary greatly between stations due to the huge difference in the amount of snowfall at each station. The ratios of MAE and RMSE to monthly mean snowfall ( and , respectively) were selected to analyze the model performance. Of the 457 stations, 315 (68.9 %) have R2>0.4, 263 (57.5 %) have , 274 (60.0 %) have , and 353 (77.2 %) have NSE>0. Among China's three main stable snow cover regions, the most accurate snowfall simulation is obtained for Northeast China, followed by North Xinjiang and then the Tibetan Plateau.
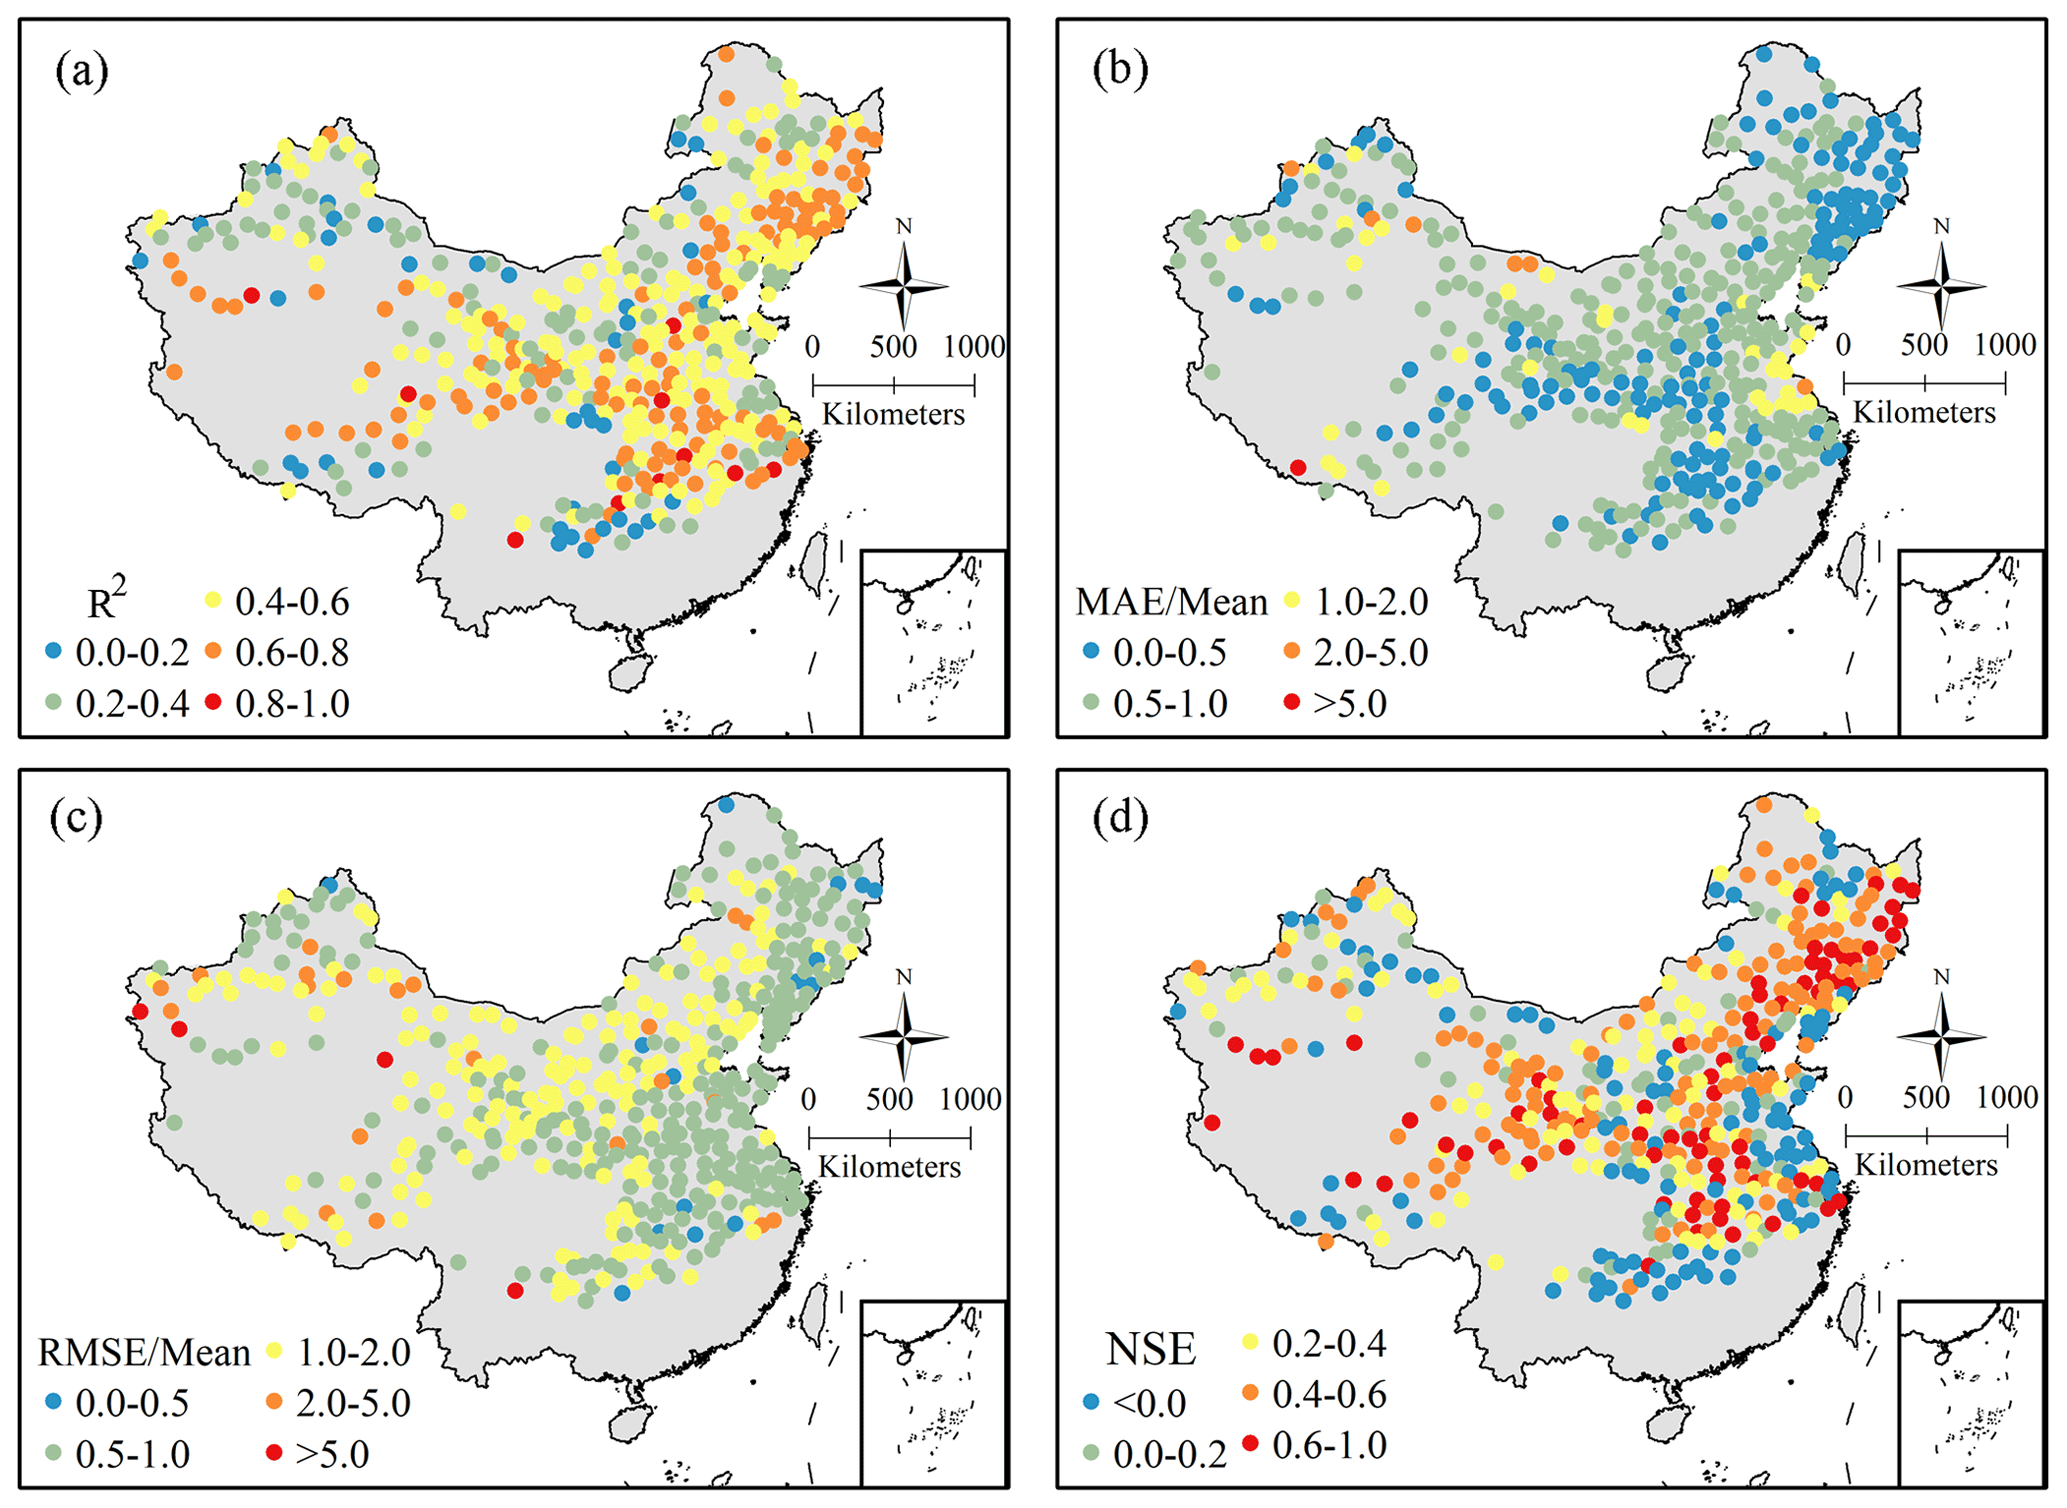
Figure 3Statistical criteria of the calculated snowfall against observed snowfall at 457 meteorological stations in China. Panel (a) shows the R2 (coefficient of determination). Panel (b) shows , where MAE is the mean absolute error, and Mean is the monthly mean snowfall. Panel (c) shows , where RMSE is the root mean square error. Panel (d) shows the NSE (Nash–Sutcliffe efficiency).
4.1.2 Snow depth validation using observational data from meteorological stations
The monthly snow depth in each grid was calculated from the snow accumulation and snow density. As the snow depth was observed at meteorological stations daily, the snow depth observation on the last day of each month was selected to verify the model's snow depth output. Figure 4 shows the statistical analyses of the calculated and observed snow depths in China from 1951 to 2009. Similar to snowfall validation, besides R2 and NSE, the ratios of MAE and RMSE to the mean snow depth ( and , respectively) were selected to analyze the model performance. Of the 264 stations, 108 (40.9 %) have R2>0.2, 221 (83.7 %) have , 52 (19.7 %) have , and 105 (39.8 %) have NSE>0. Better snow depth simulations are obtained in regions with larger snow depths, such as Northeast China and North Xinjiang.
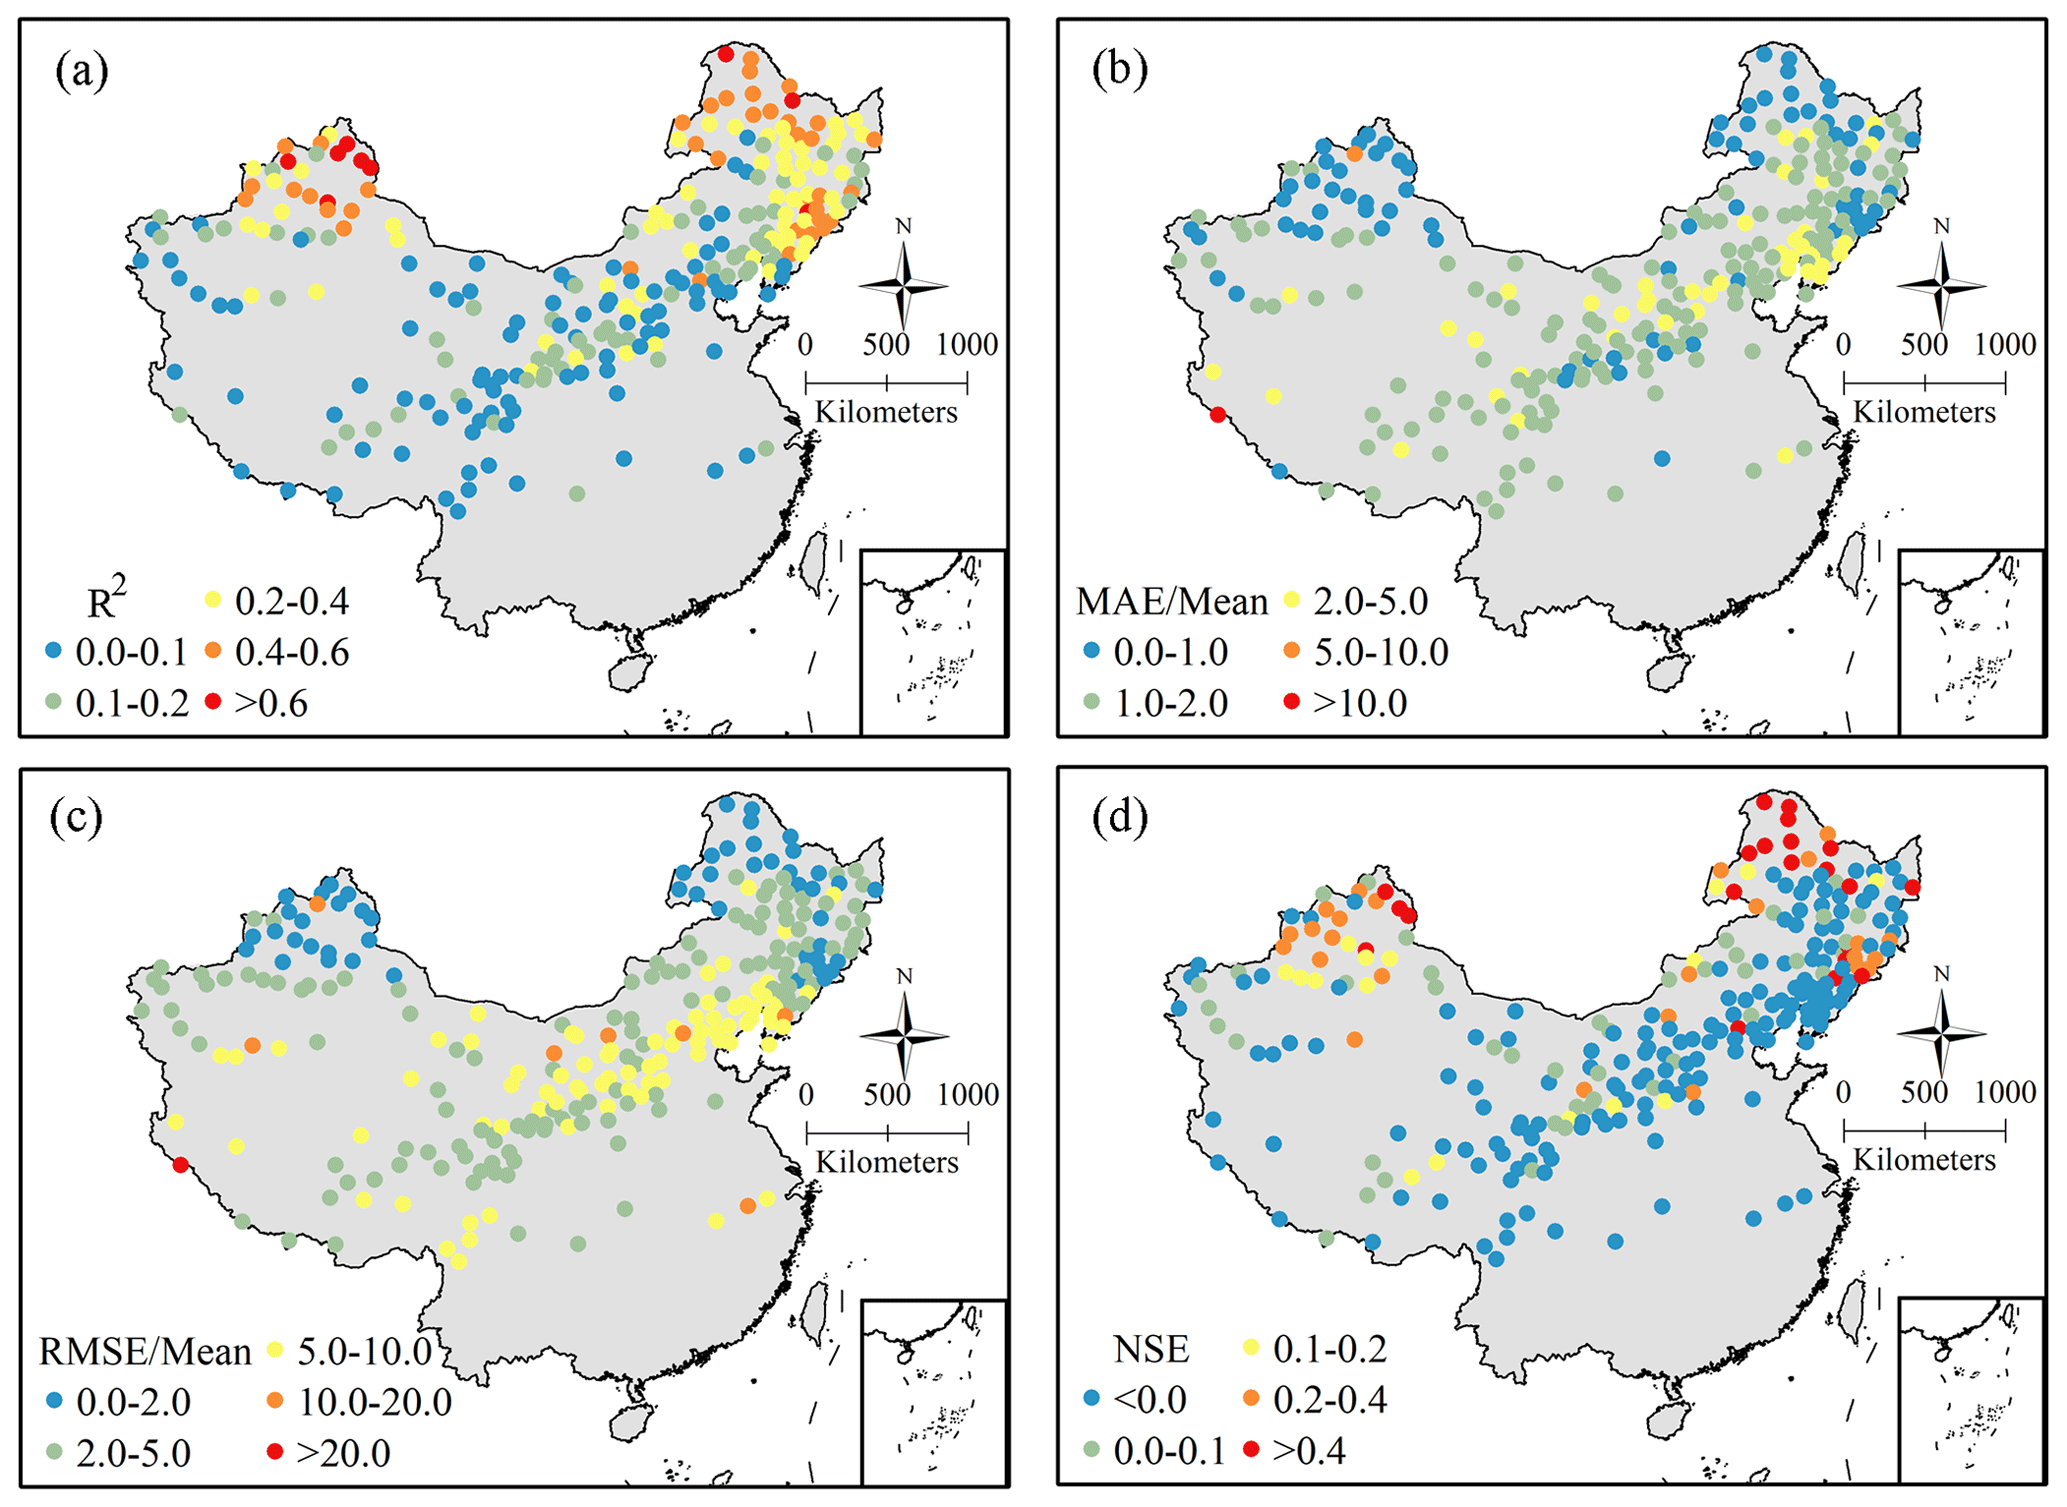
Figure 4Statistical criteria of the calculated snow depth against observed snow depth at 264 meteorological stations in China. Panel (a) shows the R2 (coefficient of determination). Panel (b) shows , where MAE is the mean absolute error, and Mean is the monthly mean snow depth. Panel (c) shows , where RMSE is the root mean square error. Panel (d) shows the NSE (Nash–Sutcliffe efficiency).
4.1.3 Snow cover extent validation using the data set derived from passive microwave remote sensing
As the extent of the snow cover derived from remote sensing has a daily timescale and the snowmelt model has a monthly timescale, the remote sensing data on the last day of each month were selected to verify the model's snow cover extent output. The mean monthly snow cover extent in China output by the model and the information derived from passive microwave remote sensing from 1979 to 2017 are 1.74×10⁶ and 1.62×10⁶ km2, respectively. The R2, MAE, RMSE and NSE between the snow cover extent output by the model against the data set derived from remote sensing in China from 1979 to 2017 are 0.93, 0.45×10⁶, 0.64×10⁶ km2 and 0.89, respectively. Among the three main stable snow cover regions, the R2, MAE, RMSE and NSE are, respectively, 0.81, 0.06×10⁶, 0.09×10⁶ km2 and 0.76, for Northern Xinjiang, 0.93, 0.13×10⁶, 0.21×10⁶ km2 and 0.87 for Northeast China, and 0.90, 0.32×10⁶, 0.40×10⁶ km2 and 0.81 for the Tibetan Plateau (Fig. 5).
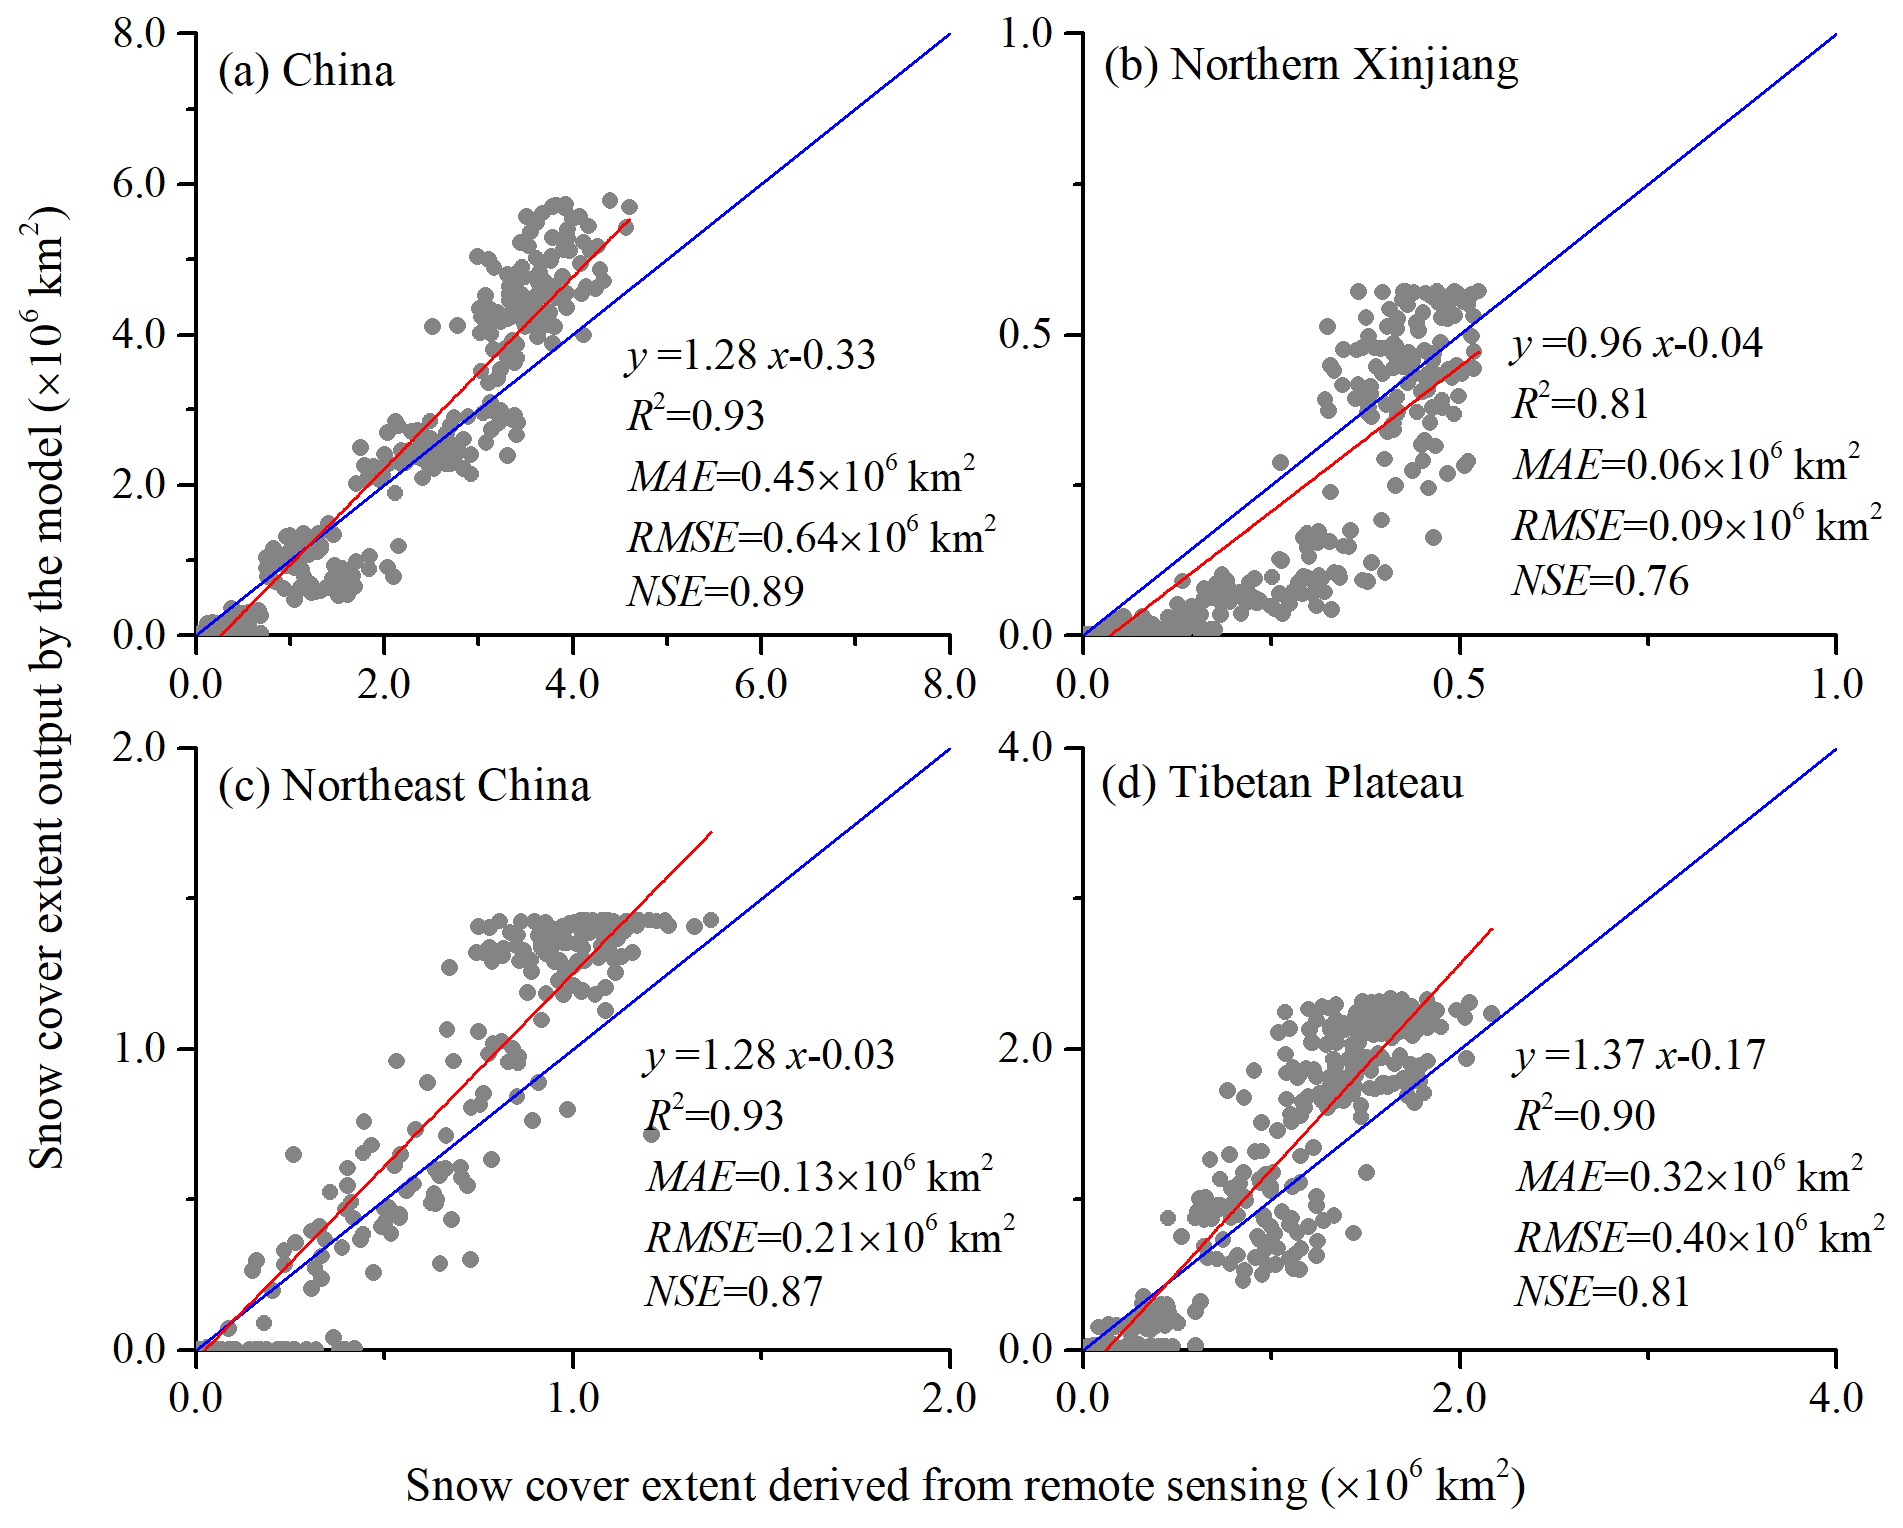
Figure 5Scatterplots of the snow cover extent output by the model and information derived from remote sensing in China and its three main stable snow cover regions. The red and blue solid lines are the linear fit and the 1:1 line, respectively.
4.1.4 Snow water equivalent validation using the data set derived from passive microwave remote sensing
The snow water equivalent derived from passive microwave remote sensing on the last day of each month was used to verify the snow accumulation output by the model. As the spatial resolution of the snow water equivalent data set is 25 km, and the grid scale of the model is about 1 km, to facilitate comparison, they were uniformly converted into water equivalent units of cubic meters for different regions. The mean monthly snow accumulation in China output by the model from 1980 to 2017 is 2.55×10¹⁰ m3, while the mean snow water equivalent derived from passive microwave remote on the last day of each month is 1.47×10¹⁰ m3. The R2, MAE, RMSE and NSE between the snow accumulation output by the model against snow water equivalent data set in China from 1980 to 2017 are 0.62, 1.27×10¹⁰, 1.27×10¹⁰ m3 and 0.80, respectively. The R2, MAE, RMSE and NSE for the three main stable snow cover regions are shown in Fig. 6. A large number of glaciers are distributed in the Tibetan Plateau, many of which may not be recorded in the remote-sensing-based snow water equivalent data set because its spatial resolution of about 25 km is larger than the width of most glaciers. This can explain the fact that a snow water equivalent of 0 is observed in some months in this region. However, the spatial scale of the model is about 1 km, meaning that the snow accumulation in the glacier areas is always detected. This can explain the observation that, in the Tibetan Plateau, the modeled snow water equivalent is higher than the remote-sensing-based values. When the snow accumulation in the glacier areas was not considered, the model performance improved in both the Tibetan Plateau and the whole of China (MAE and RMSE decreased and NSE increased; see Fig. S7).
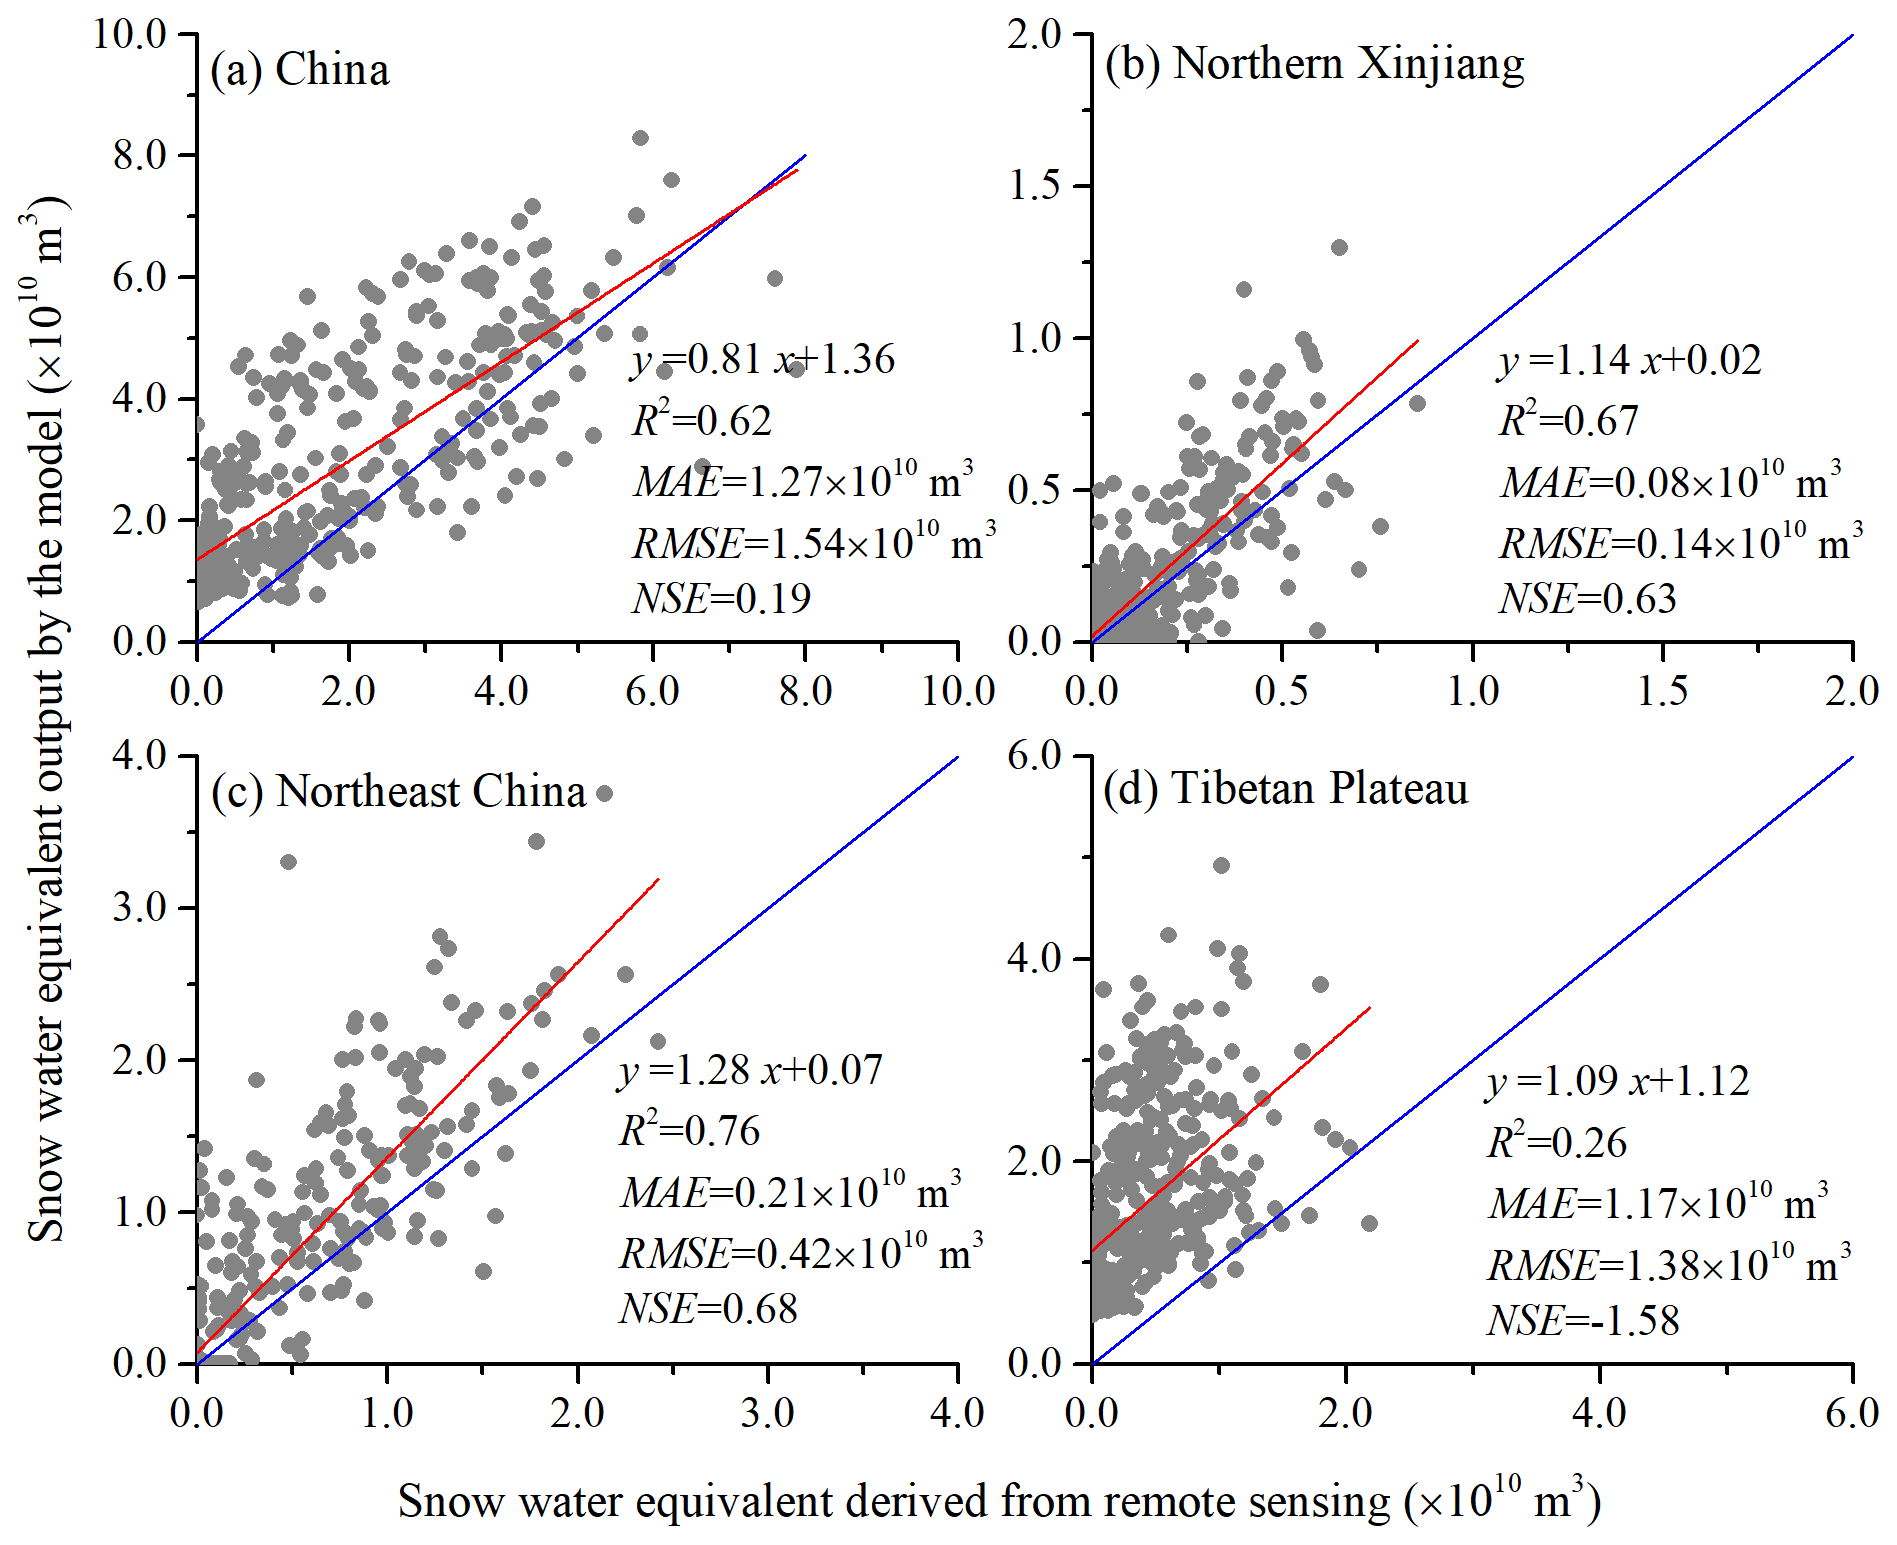
Figure 6Scatterplots of the snow water equivalent output by the model and derived from remote sensing in China and its three main stable snow cover regions. The red and blue solid lines are the linear fit and the 1:1 line, respectively.
4.2 Spatial and temporal variability in snowmelt
4.2.1 Spatial distribution
The mean annual snowmelt in China from 1951 to 2017 is about 2.41×10¹¹ m3 yr−1. The three main stable snow cover regions account for about 72.62 % of the total snowmelt in China, with the mean annual snowmelt in Northern Xinjiang, Northeast China and the Tibetan Plateau being about 0.18×10¹¹, 0.42×10¹¹ and 1.15×10¹¹ m3 yr−1, respectively. Southeast China (mainly the Huaihe River basin and the lower reaches of the Yangtze River) also has high snowmelt due to heavy snowfall (Fig. 7a). The areas with the lowest snowmelt are mainly distributed in the arid region of Northwest China, because of this region's low precipitation, and in the humid region of South China, because of this region's high air temperature and low snowfall.

Figure 7Spatial distribution of mean annual snowmelt (a), the month of maximum snowmelt (b), trends in annual snowmelt based on the Mann–Kendall method (c) and Sen's slope of the annual snowmelt in China during the 1951–2017 period.

Figure 8Spatial distribution of the mean monthly snowmelt (millimeters) for 12 months in China during the 1951–2017 period.
The spatial pattern of snowmelt differs considerably during the year (Fig. 8). In the three stable snow cover regions, in winter, the air temperature is low, and there is little snowmelt. The winter snowmelt mainly occurs in South China. In spring, North Xinjiang and Northeast China are the main regions of snowmelt in China. With further warming, the Tibetan Plateau becomes the main region of snowmelt until May. In summer, there is no snowfall in most of China, and snowmelt occurs only in the high mountains of the Tibetan Plateau and the Tianshan mountains.
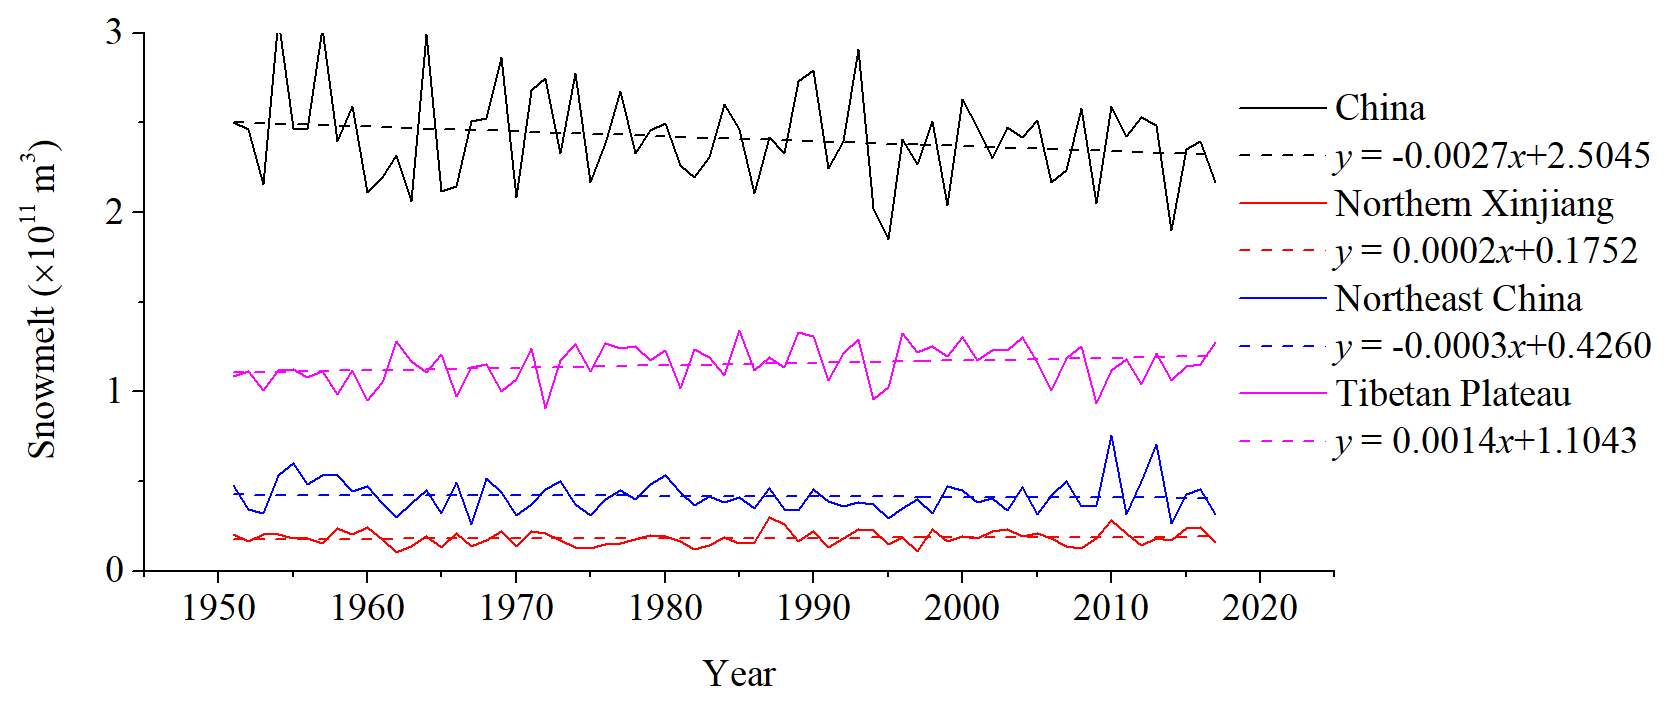
Figure 9Interannual variability in the mean annual snowmelt in China and its three main stable snow cover regions from 1951 to 2017.
The month of maximum snowmelt differs between regions (Fig. 7b). In Northern Xinjiang and Northeast China, due to the warming in spring, the maximum monthly snowmelt generally occurs in March, April or May. Meanwhile, in North and Southeast China, which are ephemeral snow regions where the snow melts quickly after falling, the maximum snowmelt generally occurs in the month with the largest snowfall (which occurs in winter). Because of the Tibetan Plateau's complex terrain and varied climate, the months of maximum snowmelt vary greatly across this region. In the southeastern part of the Tibetan Plateau, the month of maximum snowmelt occurs during the winter snowfall period because of the warm and humid climate. In the area between the Himalayas and the Gangdise Mountains, the Qaidam Basin and other colder regions (Fig. S8), the month of maximum snowmelt generally occurs in spring. Meanwhile, in the Qiangtang plateau, which has a drier climate, most snowfall occurs in summer, and the month of maximum snowmelt also occurs in this season. There are many high-elevation mountains in the Tibetan Plateau, with air temperatures above 0 ∘C for only a few days in the summer, and the month of maximum snowmelt in those high elevations areas also occurs in summer.
4.2.2 Temporal variations
From 1951 to 2017, the annual snowmelt increased significantly in some areas of Northern Xinjiang, although it did not increase significantly in Northern Xinjiang as a whole. In Northeast China, although the central and eastern regions showed a significant increasing trend, the southwestern regions showed a decreasing trend, leading to a slight decreasing trend (although not a significant trend) in the whole of Northeast China. Annual snowmelt increased significantly in most parts of the Tibetan Plateau, leading to a significant increasing trend in the Tibetan Plateau as a whole. In Southeast China, the annual snowfall decreased due to climate warming, and snowmelt also decreased significantly in this region, leading to a decreasing trend (although not a significant trend) of annual snowmelt in China (Figs. 7c and d and 9). From 1951 to 2017, the linear trends of annual snowmelt in China, Northern Xinjiang, Northeast China and the Tibetan Plateau are , 0.2×10⁹, and 1.4×10⁹ m3 per decade, respectively.
The temporal trend of snowmelt in each month from 1951 to 2017 varies across China (Figs. S9 and S10). In Northern Xinjiang and Northeast China, snowmelt increased significantly in March but decreased significantly in April. This might imply that the warming of these two regions led to the earlier onset of snowmelt. Regarding seasonal changes between 1951 and 2017, at the Tibetan Plateau, spring snowmelt increased significantly, whereas summer snowmelt decreased significantly. This may be due to the warming in spring and the reduction of snowfall in summer. In Southeast China, snowmelt experienced a decreasing trend in almost all months because of the reduction in snowfall due to climate warming.
4.3 Spatial and temporal variability in the snowmelt runoff ratio
4.3.1 Spatial distribution
Of the 210 third-level basins in China, only nine small basins near the tropical monsoon region have no snowmelt runoff from 1951 to 2017 (as snowmelt was not calculated in Taiwan, it was assumed that there was no snowmelt there). In West China, which contains two main stable snow cover regions – Northern Xinjiang and the Tibetan Plateau – the mean annual snowmelt runoff ratios are more than 10 % in all basins, except those in the Taklimakan Desert. In the basins in North and Northeast China, the snowmelt runoff ratios are generally more than 5 %, whereas, due to heavy rainfall, the snowmelt runoff ratios in basins in South China are generally less than 2 % (Fig. 10a).
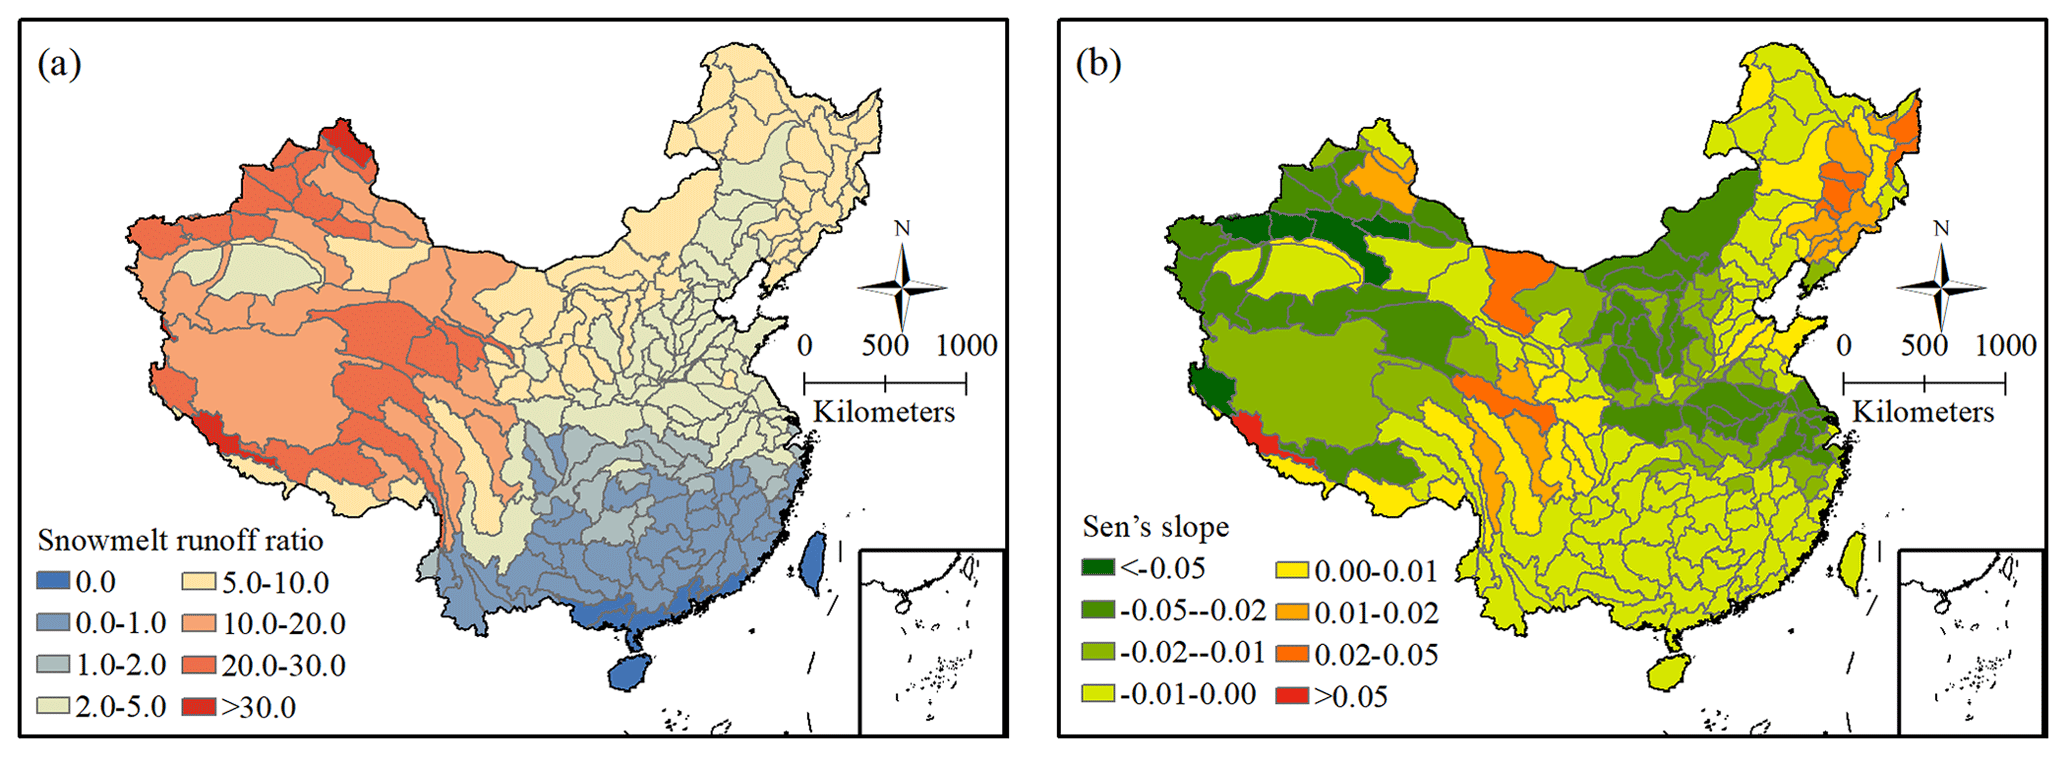
Figure 10Spatial distribution of the mean annual snowmelt runoff ratio (percent) (a), and Sen's slope of the annual snowmelt runoff ratio (percent per year; hereafter % yr−1) (b) in the third-level basins in China during the 1951–2017 period.
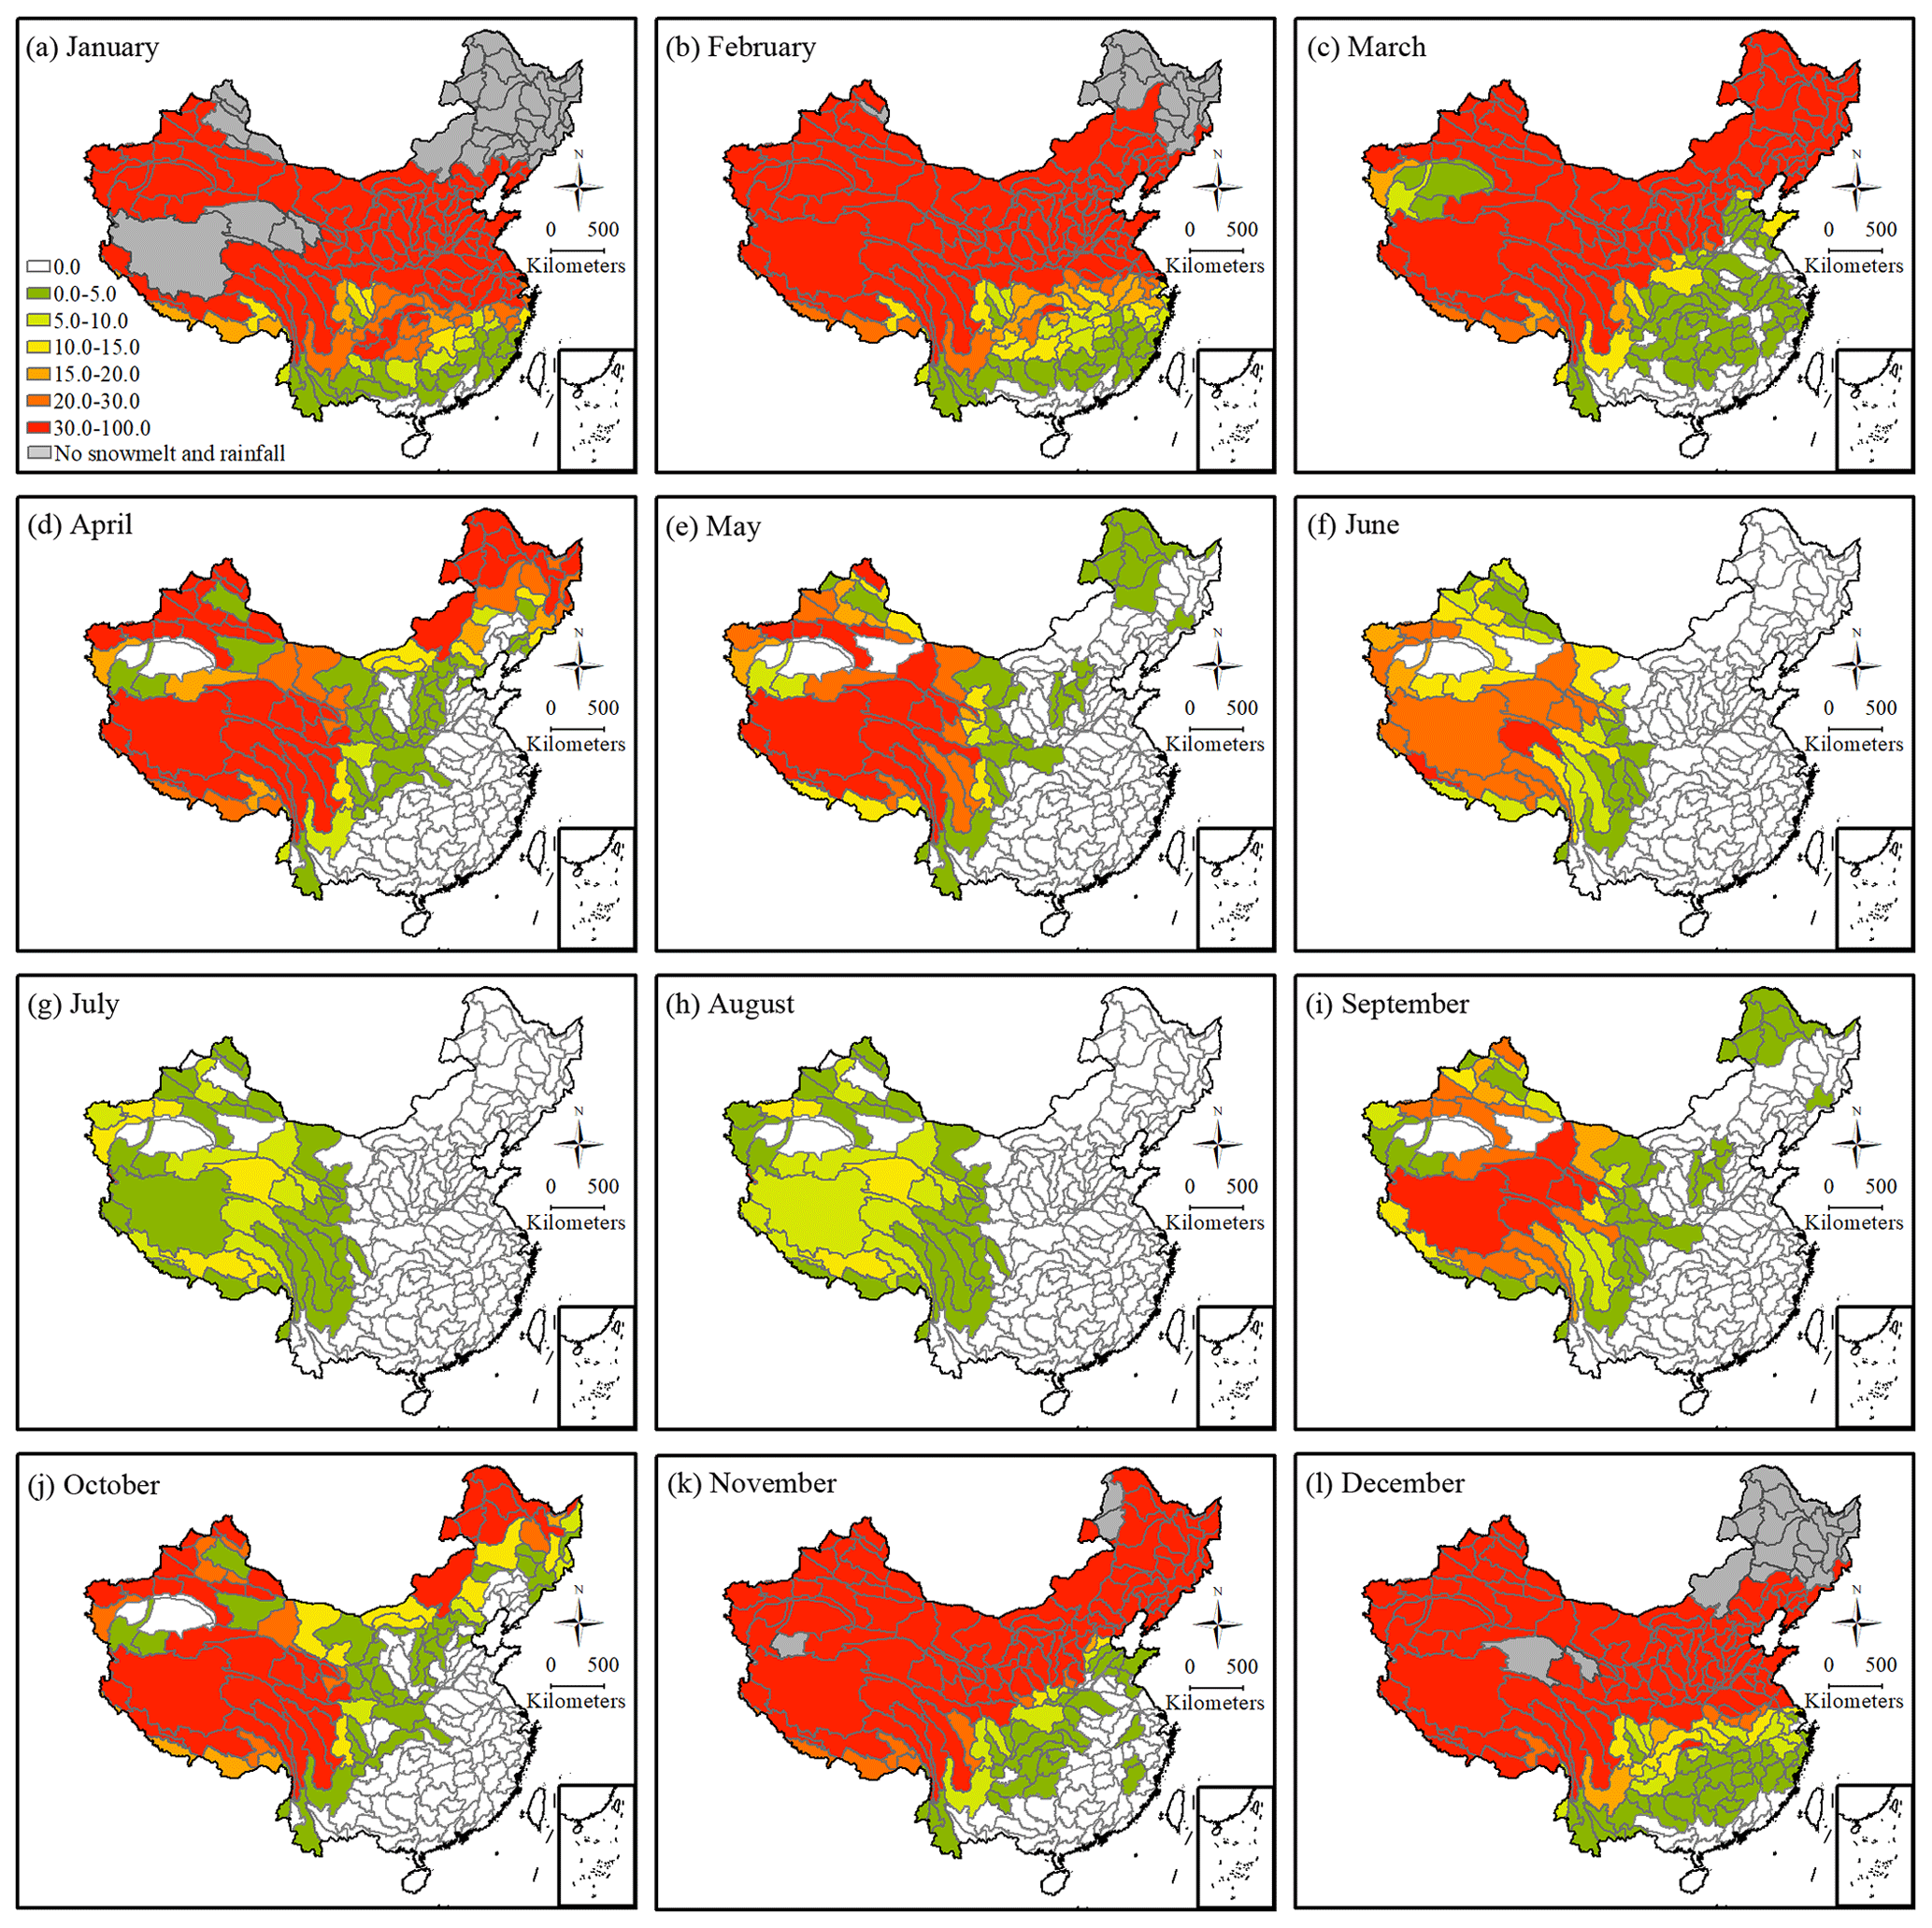
Figure 11Spatial distribution of the monthly mean snowmelt runoff ratio (percent) for 12 months in the third-level basins in China during the 1951–2017 period.
The monthly snowmelt runoff ratio also shows large spatial differences (Fig. 11). In the cold months of November, December, January and February, the snowmelt runoff ratios in the basins of Central and North China are over 30 % due to the precipitation being dominated by snowfall because of the extremely low temperatures in the cold months, and there is no snowmelt or rainfall in some basins of the three stable snow cover regions. In March, although the rainfall increased, the snowmelt from the snow that accumulated in winter also increased, and the snowmelt runoff ratios are still relatively high in most basins of North China. In April, the snowmelt runoff ratios begin to decline in most basins, and basins with snowmelt runoff ratios greater than 30 % are mainly located in the three stable snow cover regions. In May and June, the snowmelt runoff ratios further decrease, dropping to zero in most of South, East, and Northeast China; however, they are still more than 30 % in some basins in Northern Xinjiang and the Tibetan Plateau. In July and August, there is no snowmelt runoff in any basins, except for some in Xinjiang and the Tibetan Plateau, and almost no basins have a snowmelt runoff ratio of more than 30 %. In September and October, snowfall and snowmelt gradually increase, leading to a gradual increase in the snowmelt runoff ratio in many basins.
4.3.2 Temporal variations
From 1951 to 2017, the Sen's slope in third-level basins shows that the annual snowmelt runoff ratio decreased in most basins (Fig. 10b). Additionally, the Mann–Kendall test shows that the basins with a significant decreasing trend of the snowmelt runoff ratio are mainly distributed in central Inner Mongolia, the southern slope of the Tianshan Mountains and South China (Fig. S11). The basins with an increased snowmelt runoff ratio are mainly distributed in the southeastern part of the Tibetan Plateau, the Heihe River basin in the Qilian Mountains, the Gurbantünggüt Desert and Wulungu River in Northern Xinjiang, and the Songhua River basin in Northeast China. Among these basins, the Mann–Kendall test shows that only four basins had significant increasing trends, i.e., the source region of the Yellow River and three subbasins of the Songhua River.
The temporal trend in the snowmelt runoff ratio from 1951 to 2017 shows spatial variations in China in every month (Figs. S12 and S13). In the third-level basins in Central and East China, the snowmelt runoff ratio decreased in almost every month. In December, January and February, the snowmelt runoff ratio decreased significantly in the subbasins of the Huaihe River and the middle and lower reaches of the Yangtze River. In March, the snowmelt runoff ratio decreased mainly in the middle reaches of the Yellow River and in Northwest China. In April and May, the snowmelt runoff ratios decreased significantly in Northern Xinjiang and Northeast China, and in June, July and August, they decreased significantly in the Tibetan Plateau, Tianshan mountains and Altai Mountains. In September, the snowmelt runoff ratios decreased in only a few basins, mainly in the Tianshan mountains and at the edge of the Tibetan Plateau. In October, the snowmelt runoff ratios decreased significantly, mainly in Northern Xinjiang and central Inner Mongolia in October, and in November, they decreased significantly in Southern Xinjiang and the middle reaches of the Yellow River. In some months, the snowmelt runoff ratio increased in a few basins, mainly in the Tibetan Plateau and nearby areas. For example, in May, the snowmelt runoff ratios showed a large increase in the upper reaches of four rivers, namely the Yangtze River, the Nu River, the Lancang River and the Yarlung Zangbo River; however, the Mann–Kendall test shows that these monthly increasing trends in third-level basins are rarely significant (Fig. S13).
4.4 Future changes in snowmelt under different climate scenarios
4.4.1 Snowmelt
The snowmelt in Northern Xinjiang and Northeast China show a significant decreasing trend from 2006 to 2099 under RCP8.5 but shows no significant changes under RCP2.6 or RCP4.5. The snowmelt in the Tibetan Plateau and the whole of China show significant decreasing trends from 2006 to 2099 under all three RCPs, with the most drastic decline being under RCP8.5 (Fig. 12). The changes in snowmelt in China and its three main stable snow cover regions in the near-future (2011–2040), mid-future (2041–2070), far future (2071–2099) periods under the three RCPs are shown in Table 4. In Northern Xinjiang, the total projected snowmelt in these three future periods under the three RCPs are not very different than the snowmelt in the reference period (1981–2010). The models project that snowmelt will increase in low-elevation arid areas and decrease in the higher-elevation Tianshan and Altai Mountains (Fig. 13). In Northeast China, the total projected snowmelt in different future periods under the three RCPs is lower than in the reference period. The models project that snowmelt will increase in the Greater Khingan Range and the Songliao Plain and decrease in the Lesser Khingan and Changbai mountains. In most areas of the Tibetan Plateau, the models project a large decrease in snowmelt (Fig. 13). Under RCP2.6, RCP4.5 and RCP8.5, the snowmelt in the Tibetan Plateau in the near future (mid-future; far future) is projected to decrease by 16.7 % (20.8 %; 19.2 %), 18.8 % (24.8 %; 26.1 %) and 18.3 % (31.1 %; 44.2 %), respectively, compared to the reference period. Southeast China is another area where snowmelt is projected to decrease to a large degree (Fig. 13). The models project that the total snowmelt in China will decrease in different future periods. Under RCP2.6, RCP4.5 and RCP8.5, the projected decrease in snowmelt in China in the near future (mid-future; far future) is 10.4 % (15.8 %; 13.9 %), 12.0 % (17.9 %; 21.1 %) and 11.7 % (24.8 %; 36.5 %), respectively, compared to the reference period.
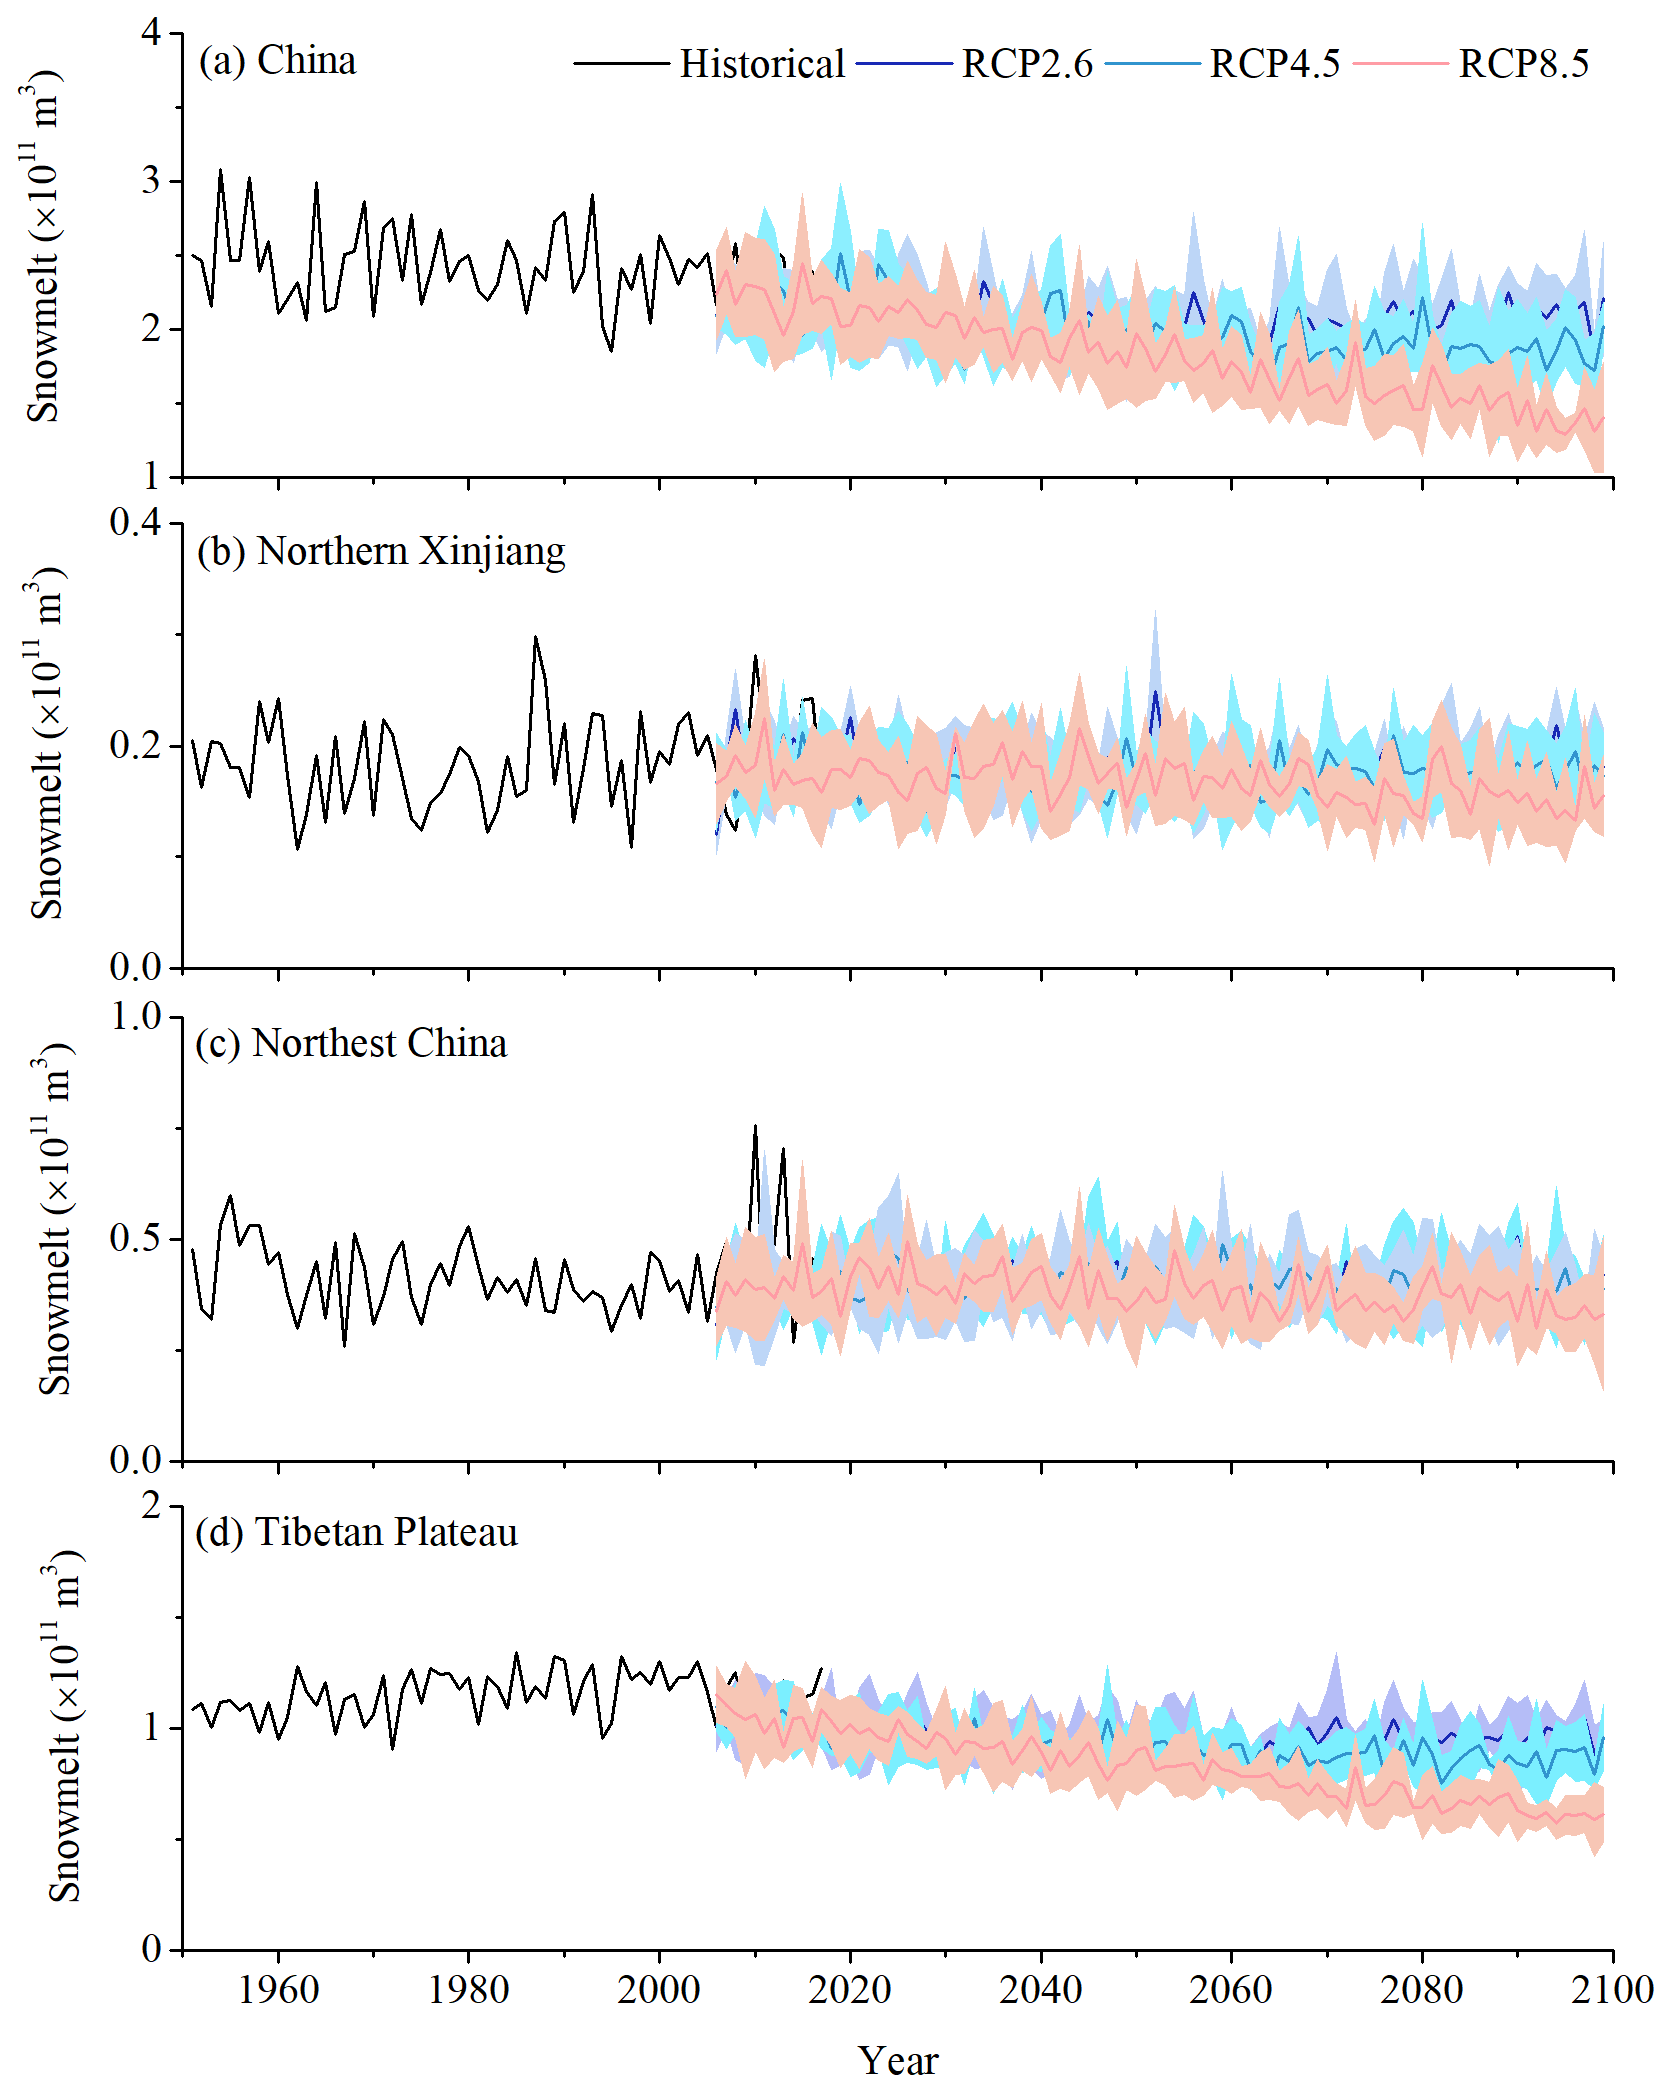
Figure 12Projected future changes in snowmelt in China and its three main stable snow cover regions. The historical period is 1951–2017, and RCP is the representative concentration pathway.
Table 4Changes in mean annual air temperature (Ta; degrees Celsius), precipitation (P; millimeters) and snowmelt (M; ×1011 m3) in China and its three main stable snow cover regions during the reference period (1981–2010), near future (2011–2040), mid-future (2041–2070) and far future (2071–2099) under the three representative concentration pathways (RCPs).
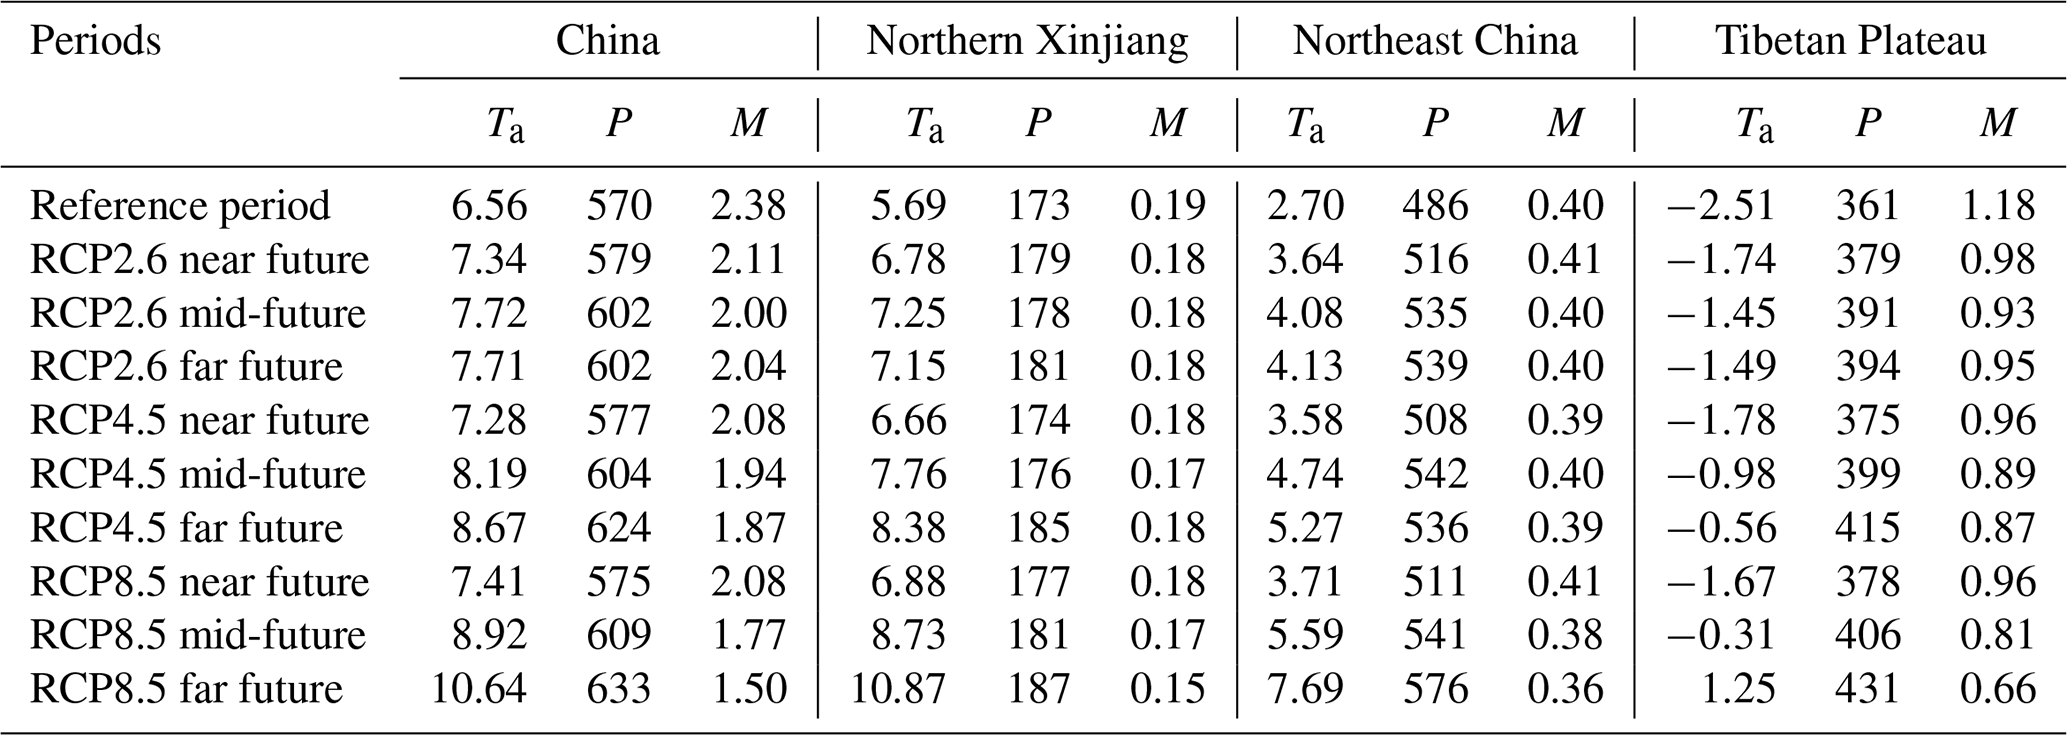

Figure 13Spatial distributions of differences (millimeters) between the projected mean annual snowmelt and the reference period (1981–2010) for the near future (2011–2040), mid-future (2041–2070) and far future (2071–2099) under RCP2.6, RCP4.5 and RCP8.5 in China.
4.4.2 Snowmelt runoff ratio
Under the three RCPs, the projected mean annual snowmelt runoff ratios in the third-level basins in different future periods are mostly smaller than those in the reference period, except for a few basins in Xinjiang and North China (Fig. 14). In general, the largest decreases in snowmelt runoff ratio in the basins are projected to occur by in far future, followed by the mid-future and near future. The largest decreases are projected under RCP8.5, followed by RCP4.5 and RCP2.6. Among the three main stable snow cover regions, the snowmelt runoff ratios are projected to decrease the most in basins in the Tibetan Plateau, followed by basins in Northern Xinjiang and Northeast China. Under RCP8.5, the projected mean annual snowmelt runoff ratios in the far future are lower than those in the reference period in all basins, except the three basins near the Taklimakan Desert and one basin in central Inner Mongolia. Under RCP8.5, relative to the reference period, the snowmelt runoff ratios in the Tibetan Plateau and Tianshan mountains are projected to decrease by more than 5 % in most basins and by more than 10 % in a few basins in the far future (Fig. 14i).
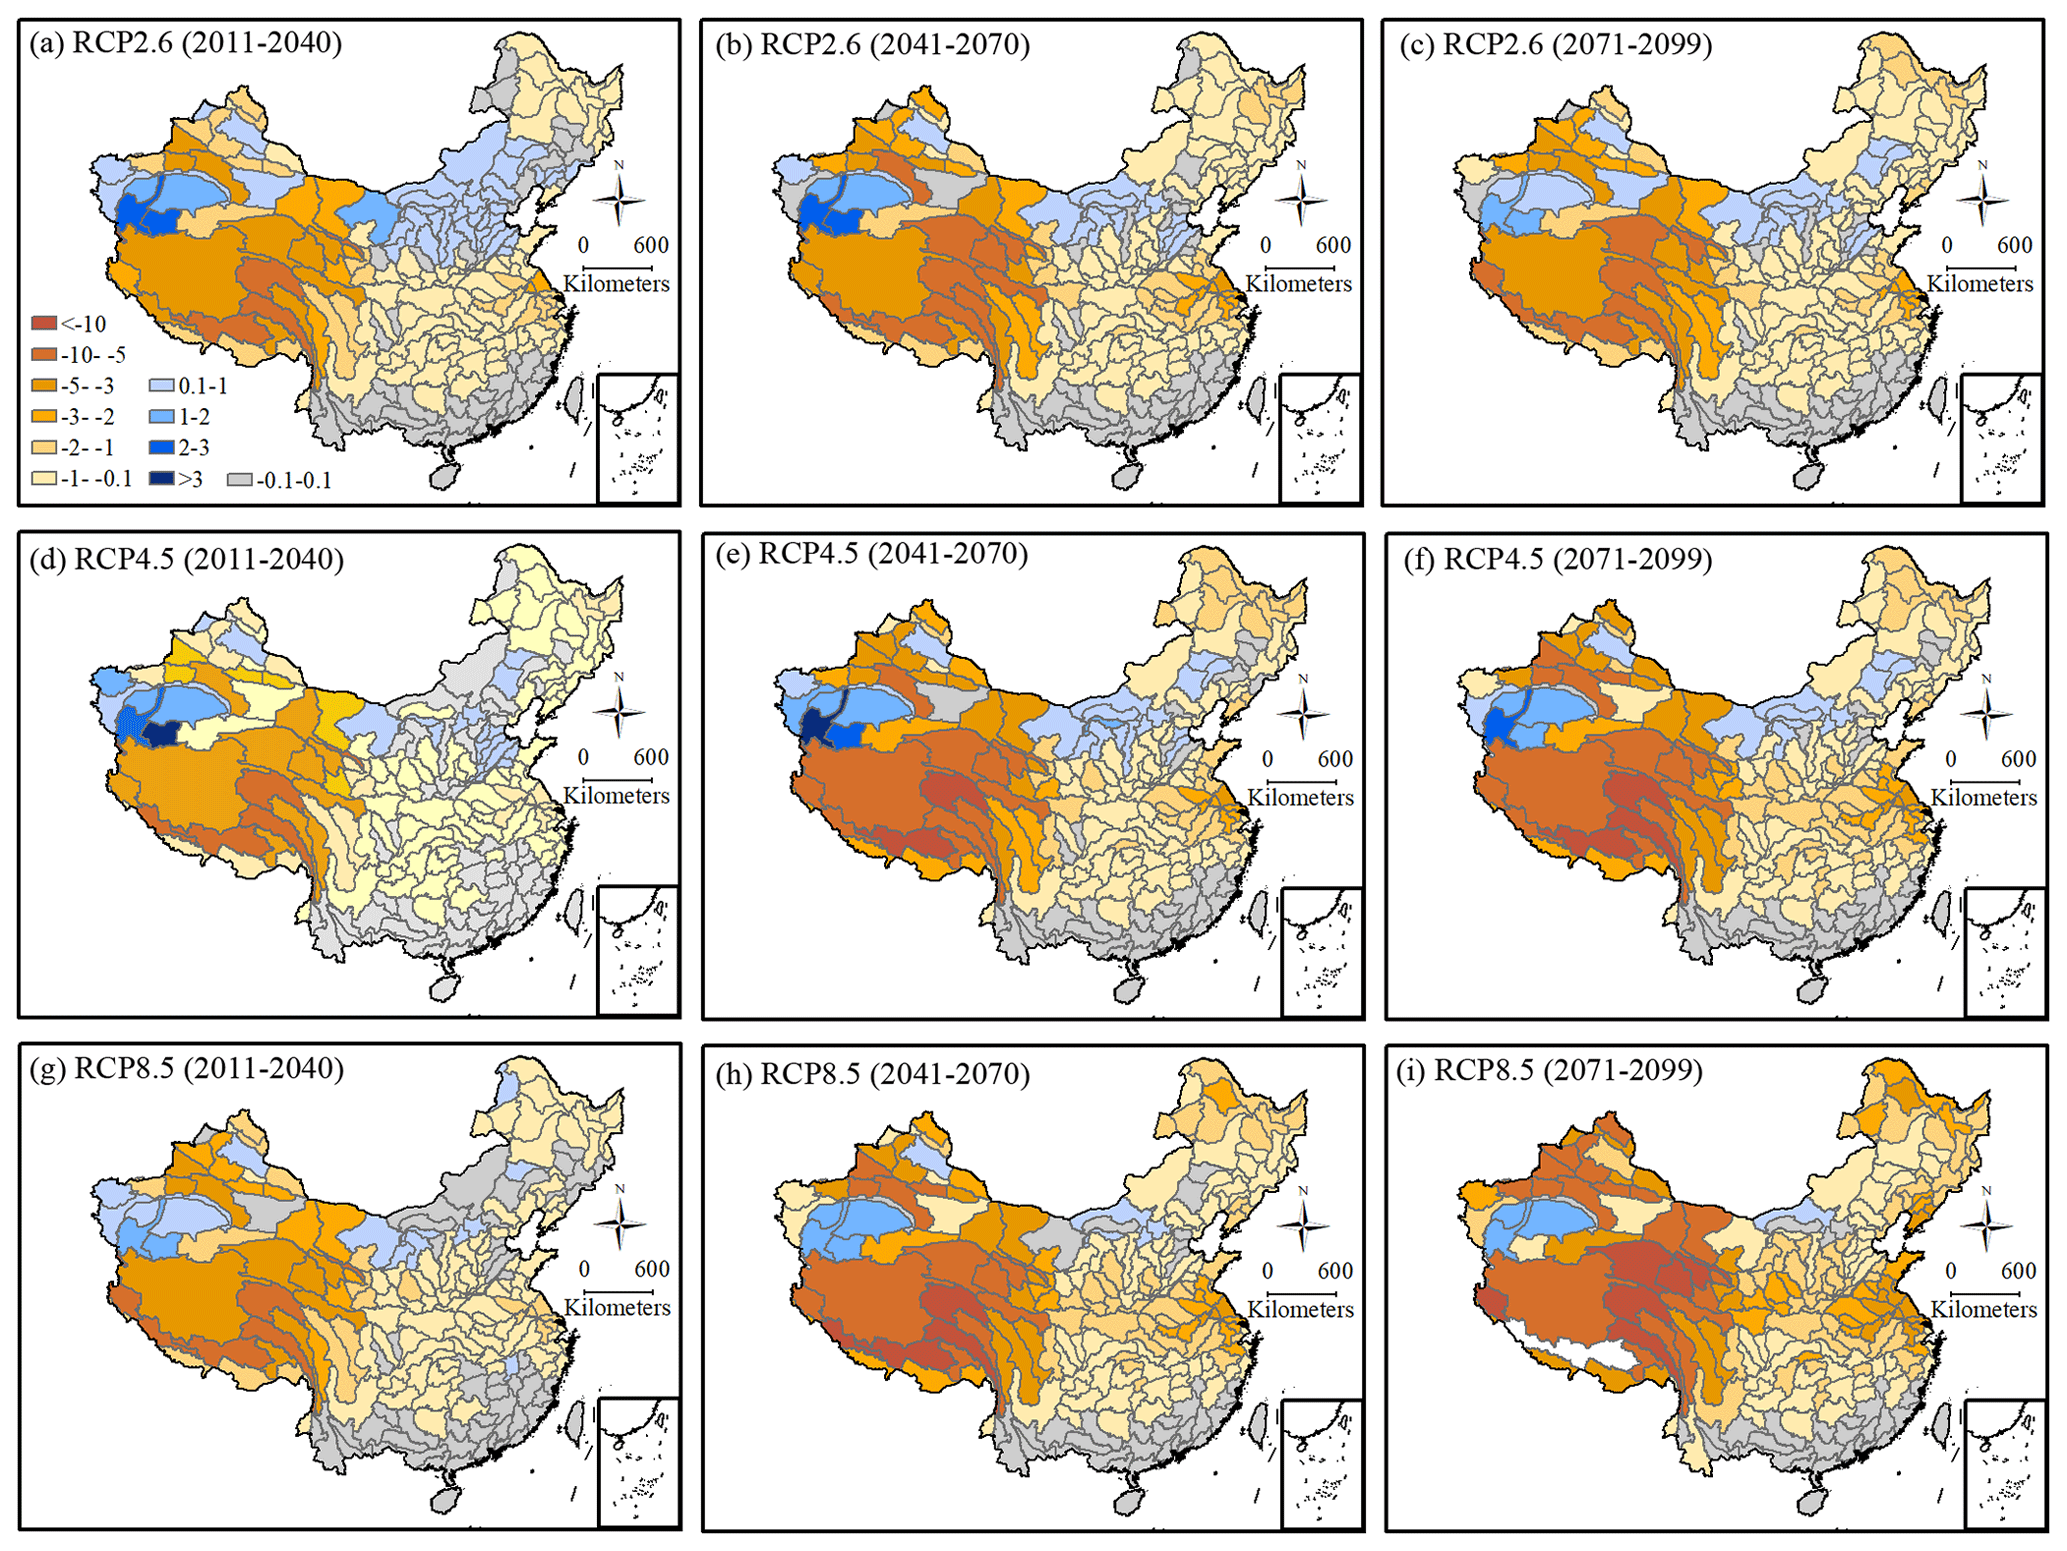
Figure 14Spatial distributions of differences (percent) between the projected mean annual snowmelt runoff ratio and the reference period (1981–2010) for the near future (2011–2040), mid-future (2041–2070) and far future (2071–2099) under RCP2.6, RCP4.5 and RCP8.5 in China.
5.1 Model evaluation
Snowmelt is difficult to measure directly, and therefore, the model outputs of snowfall, snow depth, snow cover extent and snow water equivalent were selected to verify the model performance. Although the model is solely driven by air temperature and precipitation, the model outputs show acceptable performance compared with the results from other studies. Han et al. (2021) used rainfall and snowfall temperature thresholds to identify precipitation types in the Lancang River basin in Southwest China and obtained R2 values between the simulated snowfall and the snowfall observed at three meteorological stations of 0.42, 0.34 and 0.61, respectively; in this study, the R2 values at the same stations are 0.72, 0.46 and 0.39, respectively. Z. Li et al. (2020) used temperature thresholds to calculate the snowfall in the Tianshan mountains of Central Asia and obtained a mean R2 value between the simulated snowfall and the snowfall observed at 27 meteorological stations of 0.61; in this study, the mean R2 value at 50 stations in Xinjiang is 0.39. Zhong et al. (2018) discriminated the precipitation phase based on temperature thresholds in the Songhua River basin, Northeast China, and obtained R2 values between simulated and observed snowfall of less than 0.3 for most meteorological stations; in this study, the R2 is larger than 0.3 for most stations.
Snow depth is the worst-performing model output, and this is mainly for the following reasons. (1) The model was performed on a monthly scale, whereas the output data were compared with the observed snow depth measured on the last day of each month, which increased the error. (2) The output data are at the grid scale, whereas the observed snow depth is at the site scale, where the snow properties are not always representative of snow at grid scale (Sexstone et al., 2020). (3) Snow depth itself is difficult to simulate, and even the snow depth retrieved by remote sensing has been shown to have high uncertainty. Orsolini et al. (2019) found that the mean annual snow depth at 33 meteorological stations in the Tibetan Plateau, based on multiple global reanalysis products, was 1.38 to 11.71 cm, with a mean value of 7.88 cm, while the observed snow depth was 0.23 cm. Furthermore, Bin et al. (2013) evaluated snow depth obtained from five algorithms using Advanced Microwave Scanning Radiometer for EOS (AMSR-E) passive microwave against ground observations from meteorological stations across China and found that the RMSE varied from 6.85 to 16.79 cm in Xinjiang region and from 6.21 to 18.05 cm in Northeast China. In this study, the RMSE varies from 0.56 to 13.32 cm in Xinjiang and 0.54 to 9.00 cm in Northeast China. Additionally, many studies have shown that the retrieved snow depth is more accurate in regions with larger snow depth (e.g., Zhou et al., 2017; Wang and Zheng, 2020), and in this study, the performances in the regions with larger snow depth such as Northern Xinjiang and Northeast China are also much better than those in other regions.
Among the simulated snow properties, the snow cover extent shows the best performance, with R2 and NSE values above 0.80 (Fig. 5). The performance of the snow water equivalent is acceptable in northern Xinjiang and Northeast China but is poor in the Tibetan Plateau (Fig. 6). There are several possible reasons for this difference. (1) The accuracy of the driving data of precipitation and temperature in the Tibetan Plateau is lower than that in other regions (Peng et al., 2019). (2) Due to the sparse distribution of meteorological stations in the Tibetan Plateau and the fact that most of these are located at low elevations, the reliability of the model parameters might be worse in this region than in other regions. (3) The snow water equivalent data used for verification have large uncertainties in the Tibetan Plateau because of its high elevation and complex terrain and climatic conditions (You et al., 2020).
In summary, the verification of snowfall, snow depth, snow cover extent and snow water equivalent suggests that the model is reliable for calculating snowmelt in China.
5.2 Influence of changes in temperature and precipitation on snowmelt
Snowmelt is sensitive to both temperature and precipitation, and the relationship between snowmelt and warming is more complex than monotonic declines (Mankin et al., 2015). In China, climate warming has led to temperature increase, and snowmelt is increasing significantly in some regions (Fig. 7c). The grids with significant changes in snowmelt from 1951 to 2017 were selected to analyze the changes in air temperature, precipitation and snowfall (Fig. 15). In the regions where snowmelt changed significantly, the temperature generally increased (although not all significantly). Precipitation decreased (increased) significantly in many regions where snowmelt increased (decreased) significantly. The regions with significant changes in snowmelt are relatively consistent with the regions with snowfall changes. There are no grids where snowfall increased significantly and snowmelt decreased significantly. In a few grid cells, snowfall decreased significantly and the snowmelt increased significantly. These grids are too few and can be ignored (Table S2). Compared with the total annual precipitation, the change in snowfall has more influence on snowmelt. Tan et al. (2019) analyzed the relationship between snow cover days and precipitation in China and found that snow cover days were highly correlated with winter precipitation but were not correlated with spring precipitation. In global climate models, there is more uncertainty about precipitation than temperature (Woldemeskel et al., 2016). Many assessments of precipitation from climate models were performed at the annual scale (e.g., Woldemeskel et al., 2016; Ahmed et al., 2019; Yue et al., 2019). Assessing precipitation from climate models using multiple timescales or seasons may allow a more accurate prediction of snowfall and snowmelt changes.

Figure 15Trends of the annual snowmelt, precipitation, snowfall and air temperature based on the Mann–Kendall method in China during the 1951–2017 period. The meanings of the numbers in the legend are shown in Table S2.
As snow cover formation and snowmelt are closely related to the temperature threshold of 0 ∘C, temperature change near 0 ∘C is more likely to trigger a drastic change in snowmelt. This may partly explain the spatial distribution of snowmelt changes in China. In Northern Xinjiang and Northeast China, the main stable snow cover regions in China, the changes in snowmelt from 1951 to 2017 were not significant, and the future projections suggest that the changes in snowmelt in these regions will not be drastic. In these two regions, the snow season temperatures are well below freezing point (Qin et al., 2006), and the snowmelt trend depends on the snowfall trend rather than the temperature trend. There is no reason for snowmelt to change significantly when precipitation does not change significantly and temperature is still to remain well below freezing in those two regions. Therefore, in Northern Xinjiang and Northeast China, snowmelt is unlikely to change significantly when precipitation does not change significantly and the temperature remains well below freezing. In Southeast China, the snowmelt decreased significantly from 1951 to 2017, and the model projects that snowmelt will decrease further under RCP2.6, RCP4.5 and RCP8.5. The climate in this region is warm, with average monthly temperatures near 0 ∘C in winter (Zeng et al., 2016). Precipitation types are sensitive to temperature increase, and under climate change, less precipitation falls as snow and snowmelt decreases. With the high elevation and low temperature, the Tibetan Plateau experienced the most complex changes in snowmelt from 1951 to 2017. Temperature significantly increased in the Tibetan Plateau, and the annual precipitation increased in most areas of the region (Kuang and Jiao, 2016). This study shows that the snowmelt in the Tibetan Plateau increased significantly from 1951 to 2017. High elevations tend to be colder and therefore can tolerate more warming (Livneh and Badger, 2020). The increased precipitation in the Tibetan Plateau may have offset the decrease in snowfall caused by the temperature increase, and precipitation may be a more influential control on snowmelt in that region than temperature. The results of the CMIP5 models show that the snowmelt in the Tibetan Plateau may decrease in the future. In this region, further warming could cause the temperature threshold for snow formation to be reached, resulting in less snowfall and snowmelt at medium and low elevations, and the temperature may become a more influential control on snowmelt.
5.3 Impact of snowmelt change on regional water supply
China's three main stable snow cover regions (Northern Xinjiang, Northeast China and the Tibetan Plateau) are located in three different climate areas (TCZ, TMZ and MPZ, respectively). Besides these three regions, the part of Southeast China (mainly the Huaihe River basin and the lower reaches of the Yangtze River) that is in the SMZ also has relatively high snowmelt (Fig. 7a). In the following, we examine these four regions to shed light on the potential regional water supply problems that may be associated with changes in snowmelt under climate change.
5.3.1 Northern Xinjiang
Northern Xinjiang is located in the TCZ, and snowmelt is an important source of fresh water in this region (Chen et al., 2020; Wu et al., 2021). This study shows that between 1951 and 2017 the mean annual snowmelt runoff ratios in the third-level basins in Northern Xinjiang are above 10 % and exceeded 30 % in some basins. Although the annual snowmelt showed a significant increasing trend from 1951 to 2017, the increase was mainly in November. Because of the earlier onset of snowmelt under climate warming, the monthly snowmelt increased in March and decreased significantly in April. The snowmelt runoff ratios in April are generally more than 30 % and also show a significant decreasing trend. March and April are times of plant and crop cultivation, and the water requirements for agricultural irrigation therefore increase sharply in these months. The shift of the snowmelt time may reduce the water that is available for agriculture because of the mismatch between snowmelt and crop growing (Notarnicola, 2020) and, therefore, introduce agricultural risks to the Northern Xinjiang.
5.3.2 Northeast China
In Northeast China, the runoff in March and April is mainly generated from snowmelt. From 1951 to 2017, snowmelt in March increased while that in April decreased significantly. The snowmelt runoff ratios in the basins in Northeast China are generally about 10 %, and the importance of snowmelt as a water resource in this region may be less than in Northern Xinjiang. However, because of the cold and long winter, snow plays a role as a natural reservoir to store water in winter, and melting snow releases water in spring, which can influence agriculture by affecting soil moisture (Qi et al., 2020). Snowmelt is vital for the seasonal water supply in Northeast China, which is an important region for agricultural production in China. Because of the changes in snowmelt documented in this study, changes in water resource allocation in spring should be considered to meet the demands of spring crop planting.
5.3.3 Tibetan Plateau
The Tibetan Plateau is known as the water tower of Asia, since many of the continent's major rivers originate there (e.g., the Yangtze, Yellow, Indus, Mekong, Brahmaputra, Salween and Ganges rivers). The western and northern parts of the Tibetan Plateau are the source of many arid inland rivers such as the Hotan and Heihe rivers. Additionally, the Tibetan Plateau contains arid inland basins (e.g., the Qiangtang inland basin). These waters from the Tibetan Plateau have been sustaining life, agricultural, and industrial water usage for nearly 40 % of the world's population (Xu et al., 2008). Due to its high elevation and low temperature, the mean annual snowmelt runoff ratios in the basins of the Tibetan Plateau are generally greater than 10 %. Snowmelt contributes to runoff every month, and in some months, there is no rainfall to generate runoff. The snowmelt in the Tibetan Plateau showed an increasing trend from 1951 to 2017, and as the temperature is projected to rise further in the future, it is likely that both the snowmelt and snowmelt runoff ratio will decrease in the near future. Other studies have similarly concluded that the snowmelt and snowmelt runoff ratio in the Tibetan Plateau will decline in the future (Qin et al., 2020; Kraaijenbrink et al., 2021). The Tibetan Plateau and its surrounding downstream areas are projected to experience declines in the share of water from snowmelt and will thus require increases in alternative water supplies.
5.3.4 Southeast China
Southeast China is located in the SMZ, where precipitation is relatively high. The snowfall in winter is high, resulting in a large amount of snowmelt in this region. However, due to this region's high precipitation, snowmelt contributes relatively little to its water resources, with the snowmelt runoff ratios being less than 2 % in most basins. Although climate change has caused a significant decrease in snowmelt in this region, and this trend is projected to continue in the future, the impact on the water supply is likely to be much smaller than in other regions of China. The increased frequency and intensity of flooding that is projected to be caused by climate change is a major concern for this region (Qin and Lu, 2014).
5.4 Uncertainties and limitations
The snowmelt simulation reported in this study was largely driven by the climatology data set of WorldClim, using delta spatial downscaling, and any uncertainties in the data set were likely to propagate to the snowmelt simulation. Many studies showed that, although the WorldClim data were adequate for air temperatures, there were large errors in its precipitation data, especially in mountainous areas with complex topography and high elevations (Beck et al., 2020; Bobrowski et al., 2021). Although the downscaled data set generated by the bilinear interpolation method containing detailed topographic information, and the effects of distance to the nearest coast and satellite-derived covariates, is of high quality, there is still a gap between the downscaled data and the observed data, especially in the mountainous areas (Peng et al., 2019; Ding and Peng, 2020). Uncertainties in the CMIP5 models (Woldemeskel et al., 2016) and the downscaling method (Lima et al., 2021) may introduce uncertainties in the assessments of future changes in snowmelt.
As the results of this study are based on simple temperature index model simulations, the uncertainty arising from the model parameterization needs to be addressed. There are three important parameters in the model, namely the threshold temperatures for the separation of rainfall and snowfall (Train and Tsnow), the degree–day factors (DDFs) and the ratio of snow sublimation to snow accumulation (k). Although Train and Tsnow were derived from observations at meteorological stations, errors and uncertainties may have been increased when the values were interpolated into the grid. The DDF was estimated using an empirical method that depends on the snow density observed at meteorological stations. Due to the uneven distribution of meteorological stations, especially few and sparse meteorological stations in the Tibetan Plateau, and the uncertainties introduced by the spatial interpolation of data from meteorological stations (Zhang and Ma, 2018), the errors of these parameters may have led to the uncertainty in the snowmelt calculation. Additionally, snow sublimation is very difficult quantify by measurement or modeling (Stigter et al., 2018). Due to the limited data availability and the complexity of snow sublimation, this study used the ratio of snow sublimation to snow accumulation to simplify the calculation of the sublimation. However, this ratio can vary considerably, both spatially and temporally, having been estimated to vary between 0.1 % and 90 % around the world (Stigter et al., 2018). The simplified calculation of snow sublimation and the failure to consider the monthly variability of this parameter may have increased the uncertainty of the snowmelt calculation.
Moreover, there are many glaciers in West China, and there are differences in the processes and parameters of glacier melting and snow melting (Terink et al., 2015; Armstrong et al., 2018). In this study, snowmelt was not clearly distinguished in the glacier area, which is another source of uncertainty in the snowmelt calculation.
In addition to snowmelt, the snowmelt runoff ratio is another important research object in this study. We estimated this ratio using . However, this method may underestimate the ratio because snowmelt is more effective at generating catchment runoff than rainfall (Li et al., 2017; Jenicek and Ledvinka, 2020).
A simple temperature index model was used to calculate a time series of monthly snowmelt at a resolution of 0.5′ (approximately 1 km) in China for the 1951–2017 period. The mean annual snowmelt in China is 2.41×10¹¹ m3 yr−1, and the mean annual snowmelt in Northern Xinjiang, Northeast China and the Tibetan Plateau is approximately 0.18×10¹¹, 0.42×10¹¹ and 1.15×10¹¹ m3 yr−1, respectively. From 1951 to 2017, the annual snowmelt increased significantly in the Tibetan Plateau and decreased significantly in North, Central and Southeast China. There was a decreasing trend in snowmelt in China, although this trend is not statistically significant. In West China, the mean annual snowmelt runoff ratio is more than 10 % in almost all third-level basins, except for those in the Taklimakan Desert. In basins in North and Northeast China, the snowmelt runoff ratio is generally more than 5 %, whereas in basins in South China it is less than 2 %. The Sen's slope shows that, from 1951 to 2017, the annual snowmelt runoff ratio decreased in most third-level basins in China; where this decrease is significant is mainly distributed in central Inner Mongolia, the southern slopes of the Tianshan mountains and South China.
Under RCP2.6, RCP4.5 and RCP8.5, the snowmelt in China shows a significant decreasing trend from 2006 to 2099, and the projected decrease in snowmelt in the near future (2011–2040; mid-future – 2041–2070; far future – 2071–2099) is 10.4 % (15.8 %; 13.9 %), 12.0 % (17.9 %; 21.1 %) and 11.7 % (24.8 %; 36.5 %), respectively, compared to the reference period (1981–2010). Among China's three main stable snow cover regions, the Tibetan Plateau is projected to experience the largest decrease in snowmelt in the future, followed by Northeast China; the snowmelt in the Northern Xinjiang is not projected to change significantly in the future. Under the three RCPs, the projected mean annual snowmelt runoff ratios in the third-level basins in the different future periods are less than those in the reference period, except for a few basins in Xinjiang and North China, with the largest decrease projected to occur in the Tibetan Plateau.
This study also investigated the spatial variability in snowmelt changes caused by changes in temperature and precipitation. It found that in low temperature regions (which can tolerate more warming), the snowmelt change was mainly influenced by precipitation, whereas in warm regions, the snowmelt change was most sensitive to temperature increases. The spatial variability in snowmelt changes may lead to the regional differences in the impact of snowmelt on water supply.
Although some uncertainties were introduced by the model principles, driving data and parameterization and other factors, this study is the first attempt to quantify snowmelt and its changes in China. Given the importance of snowmelt, the results have important implications for future research on snow–hydrology–climate interactions and contribute to water resource management planning under climate change.
The spatial resolution with 0.5′, including monthly minimum, maximum and mean temperatures (Tmin, Tmax and Ta) and precipitation, are available from Zenodo in the Network Common Data Format at https://doi.org/10.5281/zenodo.3114194 (Peng, 2019a), for precipitation, and https://doi.org/10.5281/zenodo.3185722 (Peng, 2019b), for air temperatures. The air temperature, snowfall, snow depth and snow density observation data are available from the China Meteorological Administration (http://data.cma.cn/, China Meteorological Data Service Centre, 2019). The snow depth data set derived from passive microwave remote sensing data is available from the National Tibetan Plateau Data Center (https://doi.org/10.11888/Geogra.tpdc.270194, Che and Dai, 2015). The snow water equivalent data set derived from passive microwave remote sensing data is available from the National Cryosphere Desert Data Center (https://doi.org/10.12072/ncdc.I-SNOW.db0002.2020, Jiang et al., 2020). The CMIP5 data set is distributed by the Inter-Sectoral Impact Model Intercomparison Project on its own website (http://www.isi-mip.org, Hempel et al., 2013). The third-level basins data set is available from the Resource and Environment Science and Data Center (https://www.resdc.cn/, Resource and Environment Science and Data Center, 2020).
The supplement related to this article is available online at: https://doi.org/10.5194/hess-26-305-2022-supplement.
RC initiated the study. YY, RC and GL developed the methodology. YY performed all of the analyses. YY and ZL prepared the input meteorological data. GL and XW prepared the CMIP5 model data. YY prepared the paper, with contributions from RC.
The contact author has declared that neither they nor their co-authors have any competing interests.
Publisher's note: Copernicus Publications remains neutral with regard to jurisdictional claims in published maps and institutional affiliations.
The authors would like to acknowledge the data from the Network Common Data Form, China Meteorological Administration, National Tibetan Plateau Data Center, National Cryosphere Desert Data Center, Resource and Environment Science and Data Center and Inter-Sectoral Impact Model Intercomparison Project. The authors would like to thank Xiongfeng Li, for providing the snow cover classification in China, and Chuntan Han, for providing the rain/snow separation threshold temperatures in China. We would like to thank the editor (Yi He) and the two anonymous reviewers, for their insightful and constructive comments that significantly improved the paper.
This research has been supported by the National Key Research and Development Program of China (grant no. 2019YFC1510505), the National Natural Science Foundation of China (grant no. 41690141), the Joint Grant from Chinese Academy of Sciences and People's Government of Qinghai Province on Sanjiangyuan National Park (grant no. LHZX-2020-11), and the National Natural Science Foundation of China (grant no. 41901084).
This paper was edited by Yi He and reviewed by two anonymous referees.
Ahmed, K., Sachindra, D. A., Shahid, S., Demirel, M. C., and Chung, E.-S.: Selection of multi-model ensemble of general circulation models for the simulation of precipitation and maximum and minimum temperature based on spatial assessment metrics, Hydrol. Earth Syst. Sci., 23, 4803–4824, https://doi.org/10.5194/hess-23-4803-2019, 2019.
Armstrong, R. L., Rittger, K., Brodzik, M. J., Racoviteanu, A., Barrett, A. P., Khalsa, S. S., Raup, B., Hill, A. F., Khan, A. L., Wilson, A. M., Kayastha, R. B., Fetterer, F., and Armstrong, B.: Runoff from glacier ice and seasonal snow in High Asia: separating melt water sources in river flow, Reg. Environ. Change, 19, 1249–1261, https://doi.org/10.1007/s10113-018-1429-0, 2018.
Barnett, T. P., Adam, J. C., and Lettenmaier, D. P.: Potential impacts of a warming climate on water availability in snow-dominated regions, Nature, 438, 303–309, https://doi.org/10.1038/nature04141, 2005.
Barnhart, T. B., Tague, C. L., and Molotch, N. P.: The counteracting effects of snowmelt rate and timing on runoff, Water Resour. Res., 56, e2019WR026634, https://doi.org/10.1029/2019wr026634, 2020.
Beck, H. E., Wood, E. F., McVicar, T. R., Zambrano-Bigiarini, M., Alvarez-Garreton, C., Baez-Villanueva, O. M., Sheffield, J., and Karger, D. N.: Bias correction of global high-resolution precipitation climatologies using streamflow observations from 9372 catchments, J. Climate, 33, 1299–1315, https://doi.org/10.1175/jcli-d-19-0332.1, 2020.
Berghuijs, W. R., Woods, R. A., and Hrachowitz, M.: A precipitation shift from snow towards rain leads to a decrease in streamflow, Nat. Clim. Change, 4, 583–586, https://doi.org/10.1038/nclimate2246, 2014.
Bin, C., Qiu, Y., Shi, L., Chu, D., and Zhu, J.: Comparative validation of snow depth algorithms using AMSR-E passive microwave data in China (in Chinese), Journal of Glaciology and Geocryology, 35, 801–813, 2013.
Bloschl, G., Hall, J., Viglione, A., Perdigao, R. A. P., Parajka, J., Merz, B., Lun, D., Arheimer, B., Aronica, G. T., Bilibashi, A., Bohac, M., Bonacci, O., Borga, M., Canjevac, I., Castellarin, A., Chirico, G. B., Claps, P., Frolova, N., Ganora, D., Gorbachova, L., Gul, A., Hannaford, J., Harrigan, S., Kireeva, M., Kiss, A., Kjeldsen, T. R., Kohnova, S., Koskela, J. J., Ledvinka, O., Macdonald, N., Mavrova-Guirguinova, M., Mediero, L., Merz, R., Molnar, P., Montanari, A., Murphy, C., Osuch, M., Ovcharuk, V., Radevski, I., Salinas, J. L., Sauquet, E., Sraj, M., Szolgay, J., Volpi, E., Wilson, D., Zaimi, K., and Zivkovic, N.: Changing climate both increases and decreases European river floods, Nature, 573, 108–111, https://doi.org/10.1038/s41586-019-1495-6, 2019.
Bobrowski, M., Weidinger, J., and Schickhoff, U.: Is new always better? Frontiers in global climate datasets for modeling treeline species in the Himalayas, Atmosphere, 12, 543, https://doi.org/10.3390/atmos12050543, 2021.
Chang, J., Wei, Y., Yuan, X., Liao, H., and Yu, B.: The nonlinear impacts of global warming on regional economic production: an empirical analysis from China, Weather Clim. Soc., 12, 759–769, https://doi.org/10.1175/wcas-d-20-0029.1, 2020.
Che, T. and Dai, L.: Long-term series of daily snow depth dataset in China (1979–2020), National Tibetan Plateau Data Center [data set], https://doi.org/10.11888/Geogra.tpdc.270194, 2015.
Che, T., Li, X., Jin, R., Armstrong, R., and Zhang, T.: Snow depth derived from passive microwave remote-sensing data in China, Ann. Glaciol., 49, 145–154, https://doi.org/10.3189/172756408787814690, 2008.
Chen, H., Chen, Y., Li, W., and Li, Z.: Quantifying the contributions of snow/glacier meltwater to river runoff in the Tianshan Mountains, Central Asia, Global Planet. Change, 174, 47–57, https://doi.org/10.1016/j.gloplacha.2019.01.002, 2019.
Chen, W., Ding, J., Wang, J., Zhang, J., and Zhang, Z.: Temporal and spatial variability in snow cover over the Xinjiang Uygur Autonomous Region, China, from 2001 to 2015, PeerJ, 8, e8861, https://doi.org/10.7717/peerj.8861, 2020.
Chen, X., Liang, S., Cao, Y., and He, T.: Distribution, attribution, and radiative forcing of snow cover changes over China from 1982 to 2013, Clim. Change, 137, 363–377, https://doi.org/10.1007/s10584-016-1688-z, 2016.
China Meteorological Data Service Centre: Daily Data From Surface Meteorological Stations In China, available at: http://data.cma.cn/, last access: 27 December 2019.
Dai, L. and Chen, T.: The spatio-temporal distribution of snow density and its influence factors from 1999 to 2008 in China (in Chinese), Journal of Glaciology and Geocryology, 32, 861–866, 2010.
Dai, L., Che, T., Wang, J., and Zhang, P.: Snow depth and snow water equivalent estimation from AMSR-E data based on a priori snow characteristics in Xinjiang, China, Remote Sens. Environ., 127, 14–29, https://doi.org/10.1016/j.rse.2011.08.029, 2012.
Ding, Y. and Peng, S.: Spatiotemporal trends and attribution of drought across China from 1901–2100, Sustainability, 12, 477, https://doi.org/10.3390/su12020477, 2020.
Ficklin, D. L., Letsinger, S. L., Stewart, I. T., and Maurer, E. P.: Assessing differences in snowmelt-dependent hydrologic projections using CMIP3 and CMIP5 climate forcing data for the western United States, Hydrol. Res., 47, 483–500, https://doi.org/10.2166/nh.2015.101, 2016.
Girons Lopez, M., Vis, M. J. P., Jenicek, M., Griessinger, N., and Seibert, J.: Assessing the degree of detail of temperature-based snow routines for runoff modelling in mountainous areas in central Europe, Hydrol. Earth Syst. Sci., 24, 4441–4461, https://doi.org/10.5194/hess-24-4441-2020, 2020.
Han, C., Cheng, R., Liu, J., Yang, Y., and Qing, W.: A discuss of the separating solid and liquid precipitations (in Chinese), Journal of Glaciology and Geocryology, 32, 249–256, 2010.
Han, Z., Long, D., Han, P., Huang, Q., Du, M., and Hou, A.: An improved modeling of precipitation phase and snow in the Lancang River Basin in Southwest China, Sci. China Technol. Sc., 64, 1513–1527, https://doi.org/10.1007/s11431-020-1788-4, 2021.
Hargreaves, G. H. and Samani, Z. A.: Reference crop evapotranspiration from temperature, Appl. Eng. Agric., 1, 96–99, https://doi.org/10.13031/2013.26773, 1985.
Hempel, S., Frieler, K., Warszawski, L., Schewe, J., and Piontek, F.: A trend-preserving bias correction – the ISI-MIP approach, Earth Syst. Dynam., 4, 219–236, https://doi.org/10.5194/esd-4-219-2013, 2013.
Hock, R.: Temperature index melt modelling in mountain areas, J. Hydrol., 282, 104–115, https://doi.org/10.1016/s0022-1694(03)00257-9, 2003.
Immerzeel, W. W., van Beek, L. P. H., and Bierkens, M. F. P.: Climate change will affect the Asian water towers, Science, 328, 1382–1385, https://doi.org/10.1126/science.1183188, 2010.
Immerzeel, W. W., van Beek, L. P., Konz, M., Shrestha, A. B., and Bierkens, M. F.: Hydrological response to climate change in a glacierized catchment in the Himalayas, Clim. Change, 110, 721–736, https://doi.org/10.1007/s10584-011-0143-4, 2012.
Immerzeel, W. W., Lutz, A. F., Andrade, M., Bahl, A., Biemans, H., Bolch, T., Hyde, S., Brumby, S., Davies, B. J., Elmore, A. C., Emmer, A., Feng, M., Fernandez, A., Haritashya, U., Kargel, J. S., Koppes, M., Kraaijenbrink, P. D. A., Kulkarni, A. V., Mayewski, P. A., Nepal, S., Pacheco, P., Painter, T. H., Pellicciotti, F., Rajaram, H., Rupper, S., Sinisalo, A., Shrestha, A. B., Viviroli, D., Wada, Y., Xiao, C., Yao, T., and Baillie, J. E. M.: Importance and vulnerability of the world's water towers, Nature, 577, 364–369, https://doi.org/10.1038/s41586-019-1822-y, 2020.
Jenicek, M. and Ledvinka, O.: Importance of snowmelt contribution to seasonal runoff and summer low flows in Czechia, Hydrol. Earth Syst. Sci., 24, 3475–3491, https://doi.org/10.5194/hess-24-3475-2020, 2020.
Jiang, L., Wang, P., Zhang, L., Yang, H., and Yang, J.: Improvement of snow depth retrieval for FY3B-MWRI in China, Sci. China Earth Sci., 57, 1278–1292, https://doi.org/10.1007/s11430-013-4798-8, 2014.
Jiang, L., Yang, J., Dai, L., Li, X., Qiu, Y., Wu, S., and Li, Z.: 25 km daily snow water equivalent dataset in China from 1980 to 2020, National Cryosphere Desert Data Center [data set], https://doi.org/10.12072/ncdc.I-SNOW.db0002.2020, 2020.
Jost, G., Dan Moore, R., Smith, R., and Gluns, D. R.: Distributed temperature-index snowmelt modelling for forested catchments, J. Hydrol., 420–421, 87–101, https://doi.org/10.1016/j.jhydrol.2011.11.045, 2012.
Ke, C.-Q., Li, X.-C., Xie, H., Ma, D.-H., Liu, X., and Kou, C.: Variability in snow cover phenology in China from 1952 to 2010, Hydrol. Earth Syst. Sci., 20, 755–770, https://doi.org/10.5194/hess-20-755-2016, 2016.
Kendall, M. G.: Rank Correlation Methods (4th ed.), Charles Griffin, London, 1975.
Kraaijenbrink, P. D. A., Stigter, E. E., Yao, T., and Immerzeel, W. W.: Climate change decisive for Asia's snow meltwater supply, Nat. Clim. Change, 11, 591–597, https://doi.org/10.1038/s41558-021-01074-x, 2021.
Kuang, X. and Jiao, J. J.: Review on climate change on the Tibetan Plateau during the last half century, J. Geophys. Res.-Atmos., 121, 3979–4007, https://doi.org/10.1002/2015jd024728, 2016.
Li, D., Wrzesien, M. L., Durand, M., Adam, J., and Lettenmaier, D. P.: How much runoff originates as snow in the western United States, and how will that change in the future?, Geophys. Res. Lett., 44, 6163–6172, https://doi.org/10.1002/2017gl073551, 2017.
Li, H., Zhang, Y., Li, X., Yang, D., and Hao, X.: Tracing snowmelt paths in an integrated hydrological model for understanding seasonal snowmelt contribution at basin scale, J. Geophys. Res.-Atmos., 124, 8874–8895, https://doi.org/10.1029/2019JD030760, 2019.
Li, J., Chen, Y. D., Zhang, L., Zhang, Q., and Chiew, F. H. S.: Future changes in floods and water availability across China: linkage with changing climate and uncertainties, J. Hydrometeorol., 17, 1295–1314, https://doi.org/10.1175/jhm-d-15-0074.1, 2016.
Li, S., Liu, M., Adam, J. C., Pi, H., Su, F., Li, D., Liu, Z., and Yao, Z.: Contribution of snow-melt water to the streamflow over the Three-River headwater region, China, Remote Sens., 13, 1585, https://doi.org/10.3390/rs13081585, 2021.
Li, X., Liang, S., Zhao, K., Wang, J., Che, T., and Li, Z.: Snow cover classification based on climate variables and its distribution characteristics in China (in Chinese), Journal of Glaciology and Geocryology, 42, 62–71, 2020.
Li, Z., Chen, Y., Li, Y., and Wang, Y.: Declining snowfall fraction in the alpine regions, Central Asia, Sci. Rep., 10, 3476, https://doi.org/10.1038/s41598-020-60303-z, 2020.
Lima, C. H. R., Kwon, H., and Kim, Y.: A Bayesian Kriging model applied for spatial downscaling of daily rainfall from GCMs, J. Hydrol., 597, 126095, https://doi.org/10.1016/j.jhydrol.2021.126095, 2021.
Liu, G., Chen, R., and Wang, X.: Spatial and temporal variability in positive degree–day in Western China under climate change, Atmosphere, 12, 443, https://doi.org/10.3390/atmos12040443, 2021.
Liu, Y., Xu, J., Lu, X., and Nie, L.: Assessment of glacier- and snowmelt- driven streamflow in the arid middle Tianshan Mountains of China, Hydrol. Process., 34, 2750–2762, https://doi.org/10.1002/hyp.13760, 2020.
Livneh, B. and Badger, A. M.: Drought less predictable under declining future snowpack, Nat. Clim. Change, 10, 452–458, https://doi.org/10.1038/s41558-020-0754-8, 2020.
Ma, N., Yu, K., Zhang, Y., Zhai, J., Zhang, Y., and Zhang, H.: Ground observed climatology and trend in snow cover phenology across China with consideration of snow-free breaks, Clim. Dynam., 55, 2867–2887, https://doi.org/10.1007/s00382-020-05422-z, 2020.
Mankin, J. S., Viviroli, D., Singh, D., Hoekstra, A. Y., and Diffenbaugh, N. S.: The potential for snow to supply human water demand in the present and future, Environ. Res. Lett., 10, 114016, https://doi.org/10.1088/1748-9326/10/11/114016, 2015.
Mann, H. B.: Nonparametric tests against trend, Econometrica, 13, 245–259, https://doi.org/10.2307/1907187, 1945.
Musselman, K. N., Clark, M. P., Liu, C., Ikeda, K., and Rasmussen, R.: Slower snowmelt in a warmer world, Nat. Clim. Change, 7, 214–219, https://doi.org/10.1038/nclimate3225, 2017.
Notarnicola, C.: Observing snow cover and water resource changes in the high mountain Asia region in comparison with global mountain trends over 2000–2018, Remote Sens., 12, 3913, https://doi.org/10.3390/rs12233913, 2020.
Orsolini, Y., Wegmann, M., Dutra, E., Liu, B., Balsamo, G., Yang, K., de Rosnay, P., Zhu, C., Wang, W., Senan, R., and Arduini, G.: Evaluation of snow depth and snow cover over the Tibetan Plateau in global reanalyses using in situ and satellite remote sensing observations, The Cryosphere, 13, 2221–2239, https://doi.org/10.5194/tc-13-2221-2019, 2019.
Peng, S.: High-spatial-resolution monthly precipitation dataset over China during 1901–2017 (Version V 1.0), Northwest A & F University, Zenodo [data set], https://doi.org/10.5281/zenodo.3114194, 2019a.
Peng, S.: High-spatial-resolution monthly temperatures dataset over China during 1901–2017 (Version V 1.0), Northwest A & F University, Zenodo [data set], https://doi.org/10.5281/zenodo.3185722, 2019b.
Peng, S., Ding, Y., Liu, W., and Li, Z.: 1 km monthly temperature and precipitation dataset for China from 1901 to 2017, Earth Syst. Sci. Data, 11, 1931–1946, https://doi.org/10.5194/essd-11-1931-2019, 2019.
Pulliainen, J., Luojus, K., Derksen, C., Mudryk, L., Lemmetyinen, J., Salminen, M., Ikonen, J., Takala, M., Cohen, J., Smolander, T., and Norberg, J.: Patterns and trends of Northern Hemisphere snow mass from 1980 to 2018, Nature, 581, 294–298, https://doi.org/10.1038/s41586-020-2258-0, 2020.
Qi, W., Feng, L., Liu, J., and Yang, H.: Snow as an important natural reservoir for runoff and soil moisture in Northeast China, J. Geophys. Res.-Atmos., 125, e2020JD033086, https://doi.org/10.1029/2020jd033086, 2020.
Qin, D., Liu, S., and Li, P.: Snow cover distribution, variability, and response to climate change in Western China, J. Climate, 19, 1820–1833, https://doi.org/10.1175/jcli3694.1, 2006.
Qin, X. S. and Lu, Y.: Study of climate change impact on flood frequencies: a combined weather generator and hydrological modeling approach, J. Hydrometeorol., 15, 1205–1219, https://doi.org/10.1175/jhm-d-13-0126.1, 2014.
Qin, Y., Abatzoglou, J. T., Siebert, S., Huning, L. S., AghaKouchak, A., Mankin, J. S., Hong, C., Tong, D., Davis, S. J., and Mueller, N. D.: Agricultural risks from changing snowmelt, Nat. Clim. Change, 10, 459–465, https://doi.org/10.1038/s41558-020-0746-8, 2020.
Rajkumari, S., Chiphang, N., Kiba, L. G., Bandyopadhyay, A., and Bhadra, A.: Development and application of a spatially distributed snowmelt runoff model for limited data condition, Arab. J. Geosci., 12, 488, https://doi.org/10.1007/s12517-019-4661-0, 2019.
Resource and Environment Science and Data Center: Spatial distribution of third-level basins in China, available at: https://www.resdc.cn/, last access: 15 July 2020.
Sen, P. K.: Estimates of the regression coefficient based on Kendall's Tau, J. Am. Stat. Assoc., 63, 1379–1389, https://doi.org/10.1080/01621459.1968.10480934, 1968.
Sexstone, G. A., Clow, D. W., Fassnacht, S. R., Liston, G. E., Hiemstra, C. A., Knowles, J. F., and Penn, C. A.: Snow sublimation in mountain environments and Its sensitivity to forest disturbance and climate warming, Water Resour. Res., 54, 1191–1211, https://doi.org/10.1002/2017wr021172, 2018.
Sexstone, G. A., Penn, C. A., Liston, G. E., Gleason, K. E., Moeser, C. D., and Clow, D. W.: Spatial variability in seasonal snowpack trends across the Rio Grande headwaters (1984-2017), J. Hydrometeorol., 21, 2713–2733, https://doi.org/10.1175/jhm-d-20-0077.1, 2020.
Skaugen, T., Luijting, H., Saloranta, T., Vikhamar-Schuler, D., and Müller, K.: In search of operational snow model structures for the future-comparing four snow models for 17 catchments in Norway, Hydrol. Res., 49, 1929–1945, https://doi.org/10.2166/nh.2018.198, 2018.
Stigter, E. E., Litt, M., Steiner, J. F., Bonekamp, P. N. J., Shea, J. M., Bierkens, M. F. P., and Immerzeel, W. W.: The importance of snow sublimation on a Himalayan glacier, Front. Earth Sci., 6, 108, https://doi.org/10.3389/feart.2018.00108, 2018.
Svoma, B. M.: Difficulties in determining snowpack sublimation in complex terrain at the macroscale, Adv. Meteorol., 2016, 1–10, https://doi.org/10.1155/2016/9695757, 2016.
Tan, X., Wu, Z., Mu, X., Gao, P., Zhao, G., Sun, W., and Gu, C.: Spatiotemporal changes in snow cover over China during 1960–2013, Atmos. Res., 218, 183–194, https://doi.org/10.1016/j.atmosres.2018.11.018, 2019.
Terink, W., Lutz, A. F., Simons, G. W. H., Immerzeel, W. W., and Droogers, P.: SPHY v2.0: Spatial Processes in HYdrology, Geosci. Model Dev., 8, 2009–2034, https://doi.org/10.5194/gmd-8-2009-2015, 2015.
Vano, J. A.: Implications of losing snowpack, Nat. Clim. Change, 10, 388–389, https://doi.org/10.1038/s41558-020-0760-x, 2020.
Vormoor, K., Lawrence, D., Schlichting, L., Wilson, D., and Wong, W. K.: Evidence for changes in the magnitude and frequency of observed rainfall vs. snowmelt driven floods in Norway, J. Hydrol., 538, 33–48, https://doi.org/10.1016/j.jhydrol.2016.03.066, 2016.
Wake, L. M. and Marshall, S. J.: Assessment of current methods of positive degree–day calculation using in situ observations from glaciated regions, J. Glaciol., 61, 329–344, https://doi.org/10.3189/2015JoG14J116, 2017.
Wang, C. and Li, D.: Spatial-temporal variations of snow cover days and the maximum depth of snow cover in China during recent 50 years (in Chinese), Journal of Glaciology and Geocryology, 34, 247–256, 2012.
Wang, Y. and Zheng, Z.: Spatial representativeness analysis for snow depth measurements of meteorological stations in Northeast China, J. Hydrometeorol., 21, 791–805, https://doi.org/10.1175/jhm-d-19-0134.1, 2020.
Warszawski, L., Frieler, K., Huber, V., Piontek, F., Serdeczny, O., and Schewe, J.: The Inter-Sectoral Impact Model Intercomparison Project (ISI-MIP): project framework, P. Natl. Acad. Sci. USA, 111, 3228–3232, https://doi.org/10.1073/pnas.1312330110, 2014.
Woldemeskel, F. M., Sharma, A., Sivakumar, B., and Mehrotra, R.: Quantification of precipitation and temperature uncertainties simulated by CMIP3 and CMIP5 models, J. Geophys. Res.-Atmos., 121, 3–17, https://doi.org/10.1002/2015jd023719, 2016.
Wu, X., Wang, X., Liu, S., Yang, Y., Xu, G., Xu, Y., Jiang, T., and Xiao, C.: Snow cover loss compounding the future economic vulnerability of western China, Sci. Total Environ., 755, 143025, https://doi.org/10.1016/j.scitotenv.2020.143025, 2021.
Xu, X., Lu, C., Shi, X., and Gao, S.: World water tower: An atmospheric perspective, Geophys. Res. Lett., 35, L20815, https://doi.org/10.1029/2008gl035867, 2008.
Yang, J., Jiang, L., Wu, S., Wang, G., Wang, J., and Liu, X.: Development of a snow depth estimation algorithm over China for the FY-3D/MWRI, Remote Sens., 11, 977, https://doi.org/10.3390/rs11080977, 2019.
Yang, J. W., Jiang, L. M., Lemmetyinen, J., Luojus, K., Takala, M., Wu, S. L., and Pan, J. M.: Validation of remotely sensed estimates of snow water equivalent using multiple reference datasets from the middle and high latitudes of China, J. Hydrol., 590, 125499, https://doi.org/10.1016/j.jhydrol.2020.125499, 2020.
Yang, Y., Chen, R., Han, C., and Liu, Z.: Evaluation of 18 models for calculating potential evapotranspiration in different climatic zones of China, Agr. Water Manage., 244, 106545, https://doi.org/10.1016/j.agwat.2020.106545, 2021.
You, Q., Wu, T., Shen, L., Pepin, N., Zhang, L., Jiang, Z., Wu, Z., Kang, S., and AghaKouchak, A.: Review of snow cover variation over the Tibetan Plateau and its influence on the broad climate system, Earth-Sci. Rev., 201, 103043, https://doi.org/10.1016/j.earscirev.2019.103043, 2020.
Yuan, Z., Yan, D., Yang, Z., Yin, J., Zhang, C., and Yuan, Y.: Projection of surface water resources in the context of climate change in typical regions of China, Hydrolog. Sci. J., 62, 283–293, https://doi.org/10.1080/02626667.2016.1222531, 2017.
Yue, T. X., Zhao, N., Fan, Z. M., Li, J., Chen, C. F., Lu, Y. M., Wang, C. L., Gao, J., Xu, B., Jiao, Y. M., and Wilson, J. P.: Methods for simulating climate scenarios with improved spatiotemporal specificity and less uncertainty, Global Planet. Change, 181, 102973, https://doi.org/10.1016/j.gloplacha.2019.05.013, 2019.
Zeng, B., Yan, C., and Yu, L.: Analysis of winter temperature in South China during 1960–2009 (in Chinese), Plateau and Mountain Meteorology Research, 36, 46–52, 2016.
Zhang, D., Cong, Z., Ni, G., Yang, D., and Hu, S.: Effects of snow ratio on annual runoff within the Budyko framework, Hydrol. Earth Syst. Sci., 19, 1977–1992, https://doi.org/10.5194/hess-19-1977-2015, 2015.
Zhang, Y. and Ma, N.: Spatiotemporal variability of snow cover and snow water equivalent in the last three decades over Eurasia, J. Hydrol., 559, 238–251, https://doi.org/10.1016/j.jhydrol.2018.02.031, 2018.
Zhang, Y., Ishikawa, M., Ohata, T., and Oyunbaatar, D.: Sublimation from thin snow cover at the edge of the Eurasian cryosphere in Mongolia, Hydrol. Process., 22, 3564–3575, https://doi.org/10.1002/hyp.6960, 2008.
Zhang, Y., Hao, Z., Xu, C., and Lai, X.: Response of melt water and rainfall runoff to climate change and their roles in controlling streamflow changes of the two upstream basins over the Tibetan Plateau, Hydrol. Res., 51, 272–289, https://doi.org/10.2166/nh.2019.075, 2020.
Zhao, Q., Ding, Y., Wang, J., Gao, H., Zhang, S., Zhao, C., Xu, J., Han, H., and Shangguan, D.: Projecting climate change impacts on hydrological processes on the Tibetan Plateau with model calibration against the glacier inventory data and observed streamflow, J. Hydrol., 573, 60–81, https://doi.org/10.1016/j.jhydrol.2019.03.043, 2019.
Zhong, K., Zheng, F., Xu, X., and Qin, C.: Discriminating the precipitation phase based on different temperature thresholds in the Songhua River Basin, China, Atmos. Res., 205, 48–59, https://doi.org/10.1016/j.atmosres.2018.02.002, 2018.
Zhou, S., Che, T., and Dai, L.: Based on the type of ground site representative of snow remote sensing products precision evaluation (in Chinese), Remote Sensing Technology and Application, 32, 228–237, 2017.
Zhu, G., Lu, L., Su, Y., Wang, X., Cui, X., Ma, J., He, J., Zhang, K., and Li, C.: Energy flux partitioning and evapotranspiration in a sub-alpine spruce forest ecosystem, Hydrol. Process., 28, 5093–5104, https://doi.org/10.1002/hyp.9995, 2014.
Zhu, L., Zhang, Y., Wang, J., Tian, W., Liu, Q., Ma, G., Kan, X., and Chu, Y.: Downscaling snow depth mapping by fusion of microwave and optical remote-sensing data based on deep learning, Remote Sens., 13, 584, https://doi.org/10.3390/rs13040584, 2021.