the Creative Commons Attribution 4.0 License.
the Creative Commons Attribution 4.0 License.
 | 20 May 2022
On the links between sub-seasonal clustering of extreme precipitation and high discharge in Switzerland and Europe
Alexandre Tuel
Bettina Schaefli
Jakob Zscheischler
Olivia Martius
River discharge is impacted by the sub-seasonal (weekly to monthly) temporal structure of precipitation. One example is the successive occurrence of extreme precipitation events over sub-seasonal timescales, referred to as temporal clustering. Its potential effects on discharge have received little attention. Here, we address this topic by analysing discharge observations following extreme precipitation events either clustered in time or occurring in isolation. We rely on two sets of precipitation and discharge data, one centred on Switzerland and the other over Europe. We identify “clustered” extreme precipitation events based on the previous occurrence of another extreme precipitation within a given time window. We find that clustered events are generally followed by a more prolonged discharge response with a larger amplitude. The probability of exceeding the 95th discharge percentile in 5 d following an extreme precipitation event is in particular up to twice as high for situations where another extreme precipitation event occurred in the preceding week compared to isolated extreme precipitation events. The influence of temporal clustering on discharge decreases as the clustering window increases; beyond 6–8 weeks the difference in discharge response with non-clustered events is negligible. Catchment area, streamflow regime and precipitation magnitude also modulate the response. The impact of clustering is generally smaller in snow-dominated and large catchments. Additionally, particularly persistent periods of high discharge tend to occur in conjunction with temporal clusters of precipitation extremes.
- Article
(11250 KB) - Full-text XML
- BibTeX
- EndNote


Extreme precipitation accumulations over relatively short sub-seasonal time windows can increase water levels in rivers and lakes and consequently lead to floods. Such accumulations can result from persistence in precipitation, either as moderate precipitation stretching over many successive days or as several extreme precipitation episodes separated by a few days or weeks (Merz and Blöschl, 2003), referred to as temporal clusters of extreme precipitation (TCEP) (Kopp et al., 2021; Tuel and Martius, 2021a). The accumulated precipitation brings soils to saturation, preventing subsequent precipitation from infiltrating into the soil and directing it instead to river or overland flow (Paschalis et al., 2014). Considering that extreme precipitation events can lead to flash floods (Doswell et al., 1996), mass movement (Guzzetti et al., 2007; Panziera et al., 2016) or landslides (Bevacqua et al., 2021a), their temporal clustering and the associated soil moisture increase may exacerbate these impacts (Khanal et al., 2019). TCEP, which can be considered a temporally compounding event (Zscheischler et al., 2020), was linked to several major floods across Europe over the last few decades: in central Europe during summer 2013 (Grams et al., 2014), in the UK during winter 2013/2014 (Priestley et al., 2017), or in Switzerland in the autumn of 1993, 2000 and 2002 (Barton et al., 2016). The recent western European floods of summer 2021 were also associated with the successive occurrence of several extreme precipitation events from mid-June to mid-July (Kreienkamp et al., 2021).
Quantifying the relevance of TCEP for high discharge levels is therefore important to properly characterise flood risk, improve forecasts, support process-based calibration of rainfall-runoff models (Cullmann et al., 2008; Brunner et al., 2021) and develop informed storylines for impact assessment (Sillmann et al., 2021). To our knowledge, the impact of sub-seasonal TCEP on discharge has not been explicitly investigated, except briefly in the case of Switzerland by Tuel and Martius (2021b) and of the Rhine River basin by Khanal et al. (2019). Both argued that TCEP increased the likelihood and duration of high discharge events compared to precipitation extremes occurring in isolation.
The study of the influence of the temporal structure of precipitation on the catchment-scale hydrologic response is one of the foundations of runoff response analysis and flood frequency estimation. Accordingly, there is an important body of literature studying the theoretical interplay of temporal and spatial rainfall structure on the streamflow response (e.g. Rodriguez-Iturbe and Eagleson, 1987; Woods and Sivapalan, 1999; Viglione et al., 2010; Zhu et al., 2018). Past work has however generally focused on single events. Similarly, empirical or numerical analyses of observed events often analyse how discharge is affected by precipitation over short time windows only (e.g. Paschalis et al., 2014; Froidevaux et al., 2015; Keller et al., 2018). Additionally, antecedent soil moisture is one of the key controls on the streamflow response to rainfall and on flood generation (Blöschl et al., 2017; Berghuijs et al., 2019). Antecedent soil moisture strongly modulates the influence of the temporal structure of intense precipitation on the discharge response (Nied et al., 2014, 2017; Keller et al., 2018; Khanal et al., 2019), and it is itself influenced by the temporal structure of precipitation. High antecedent soil moisture, which favours a larger discharge response, typically results from long-duration precipitation (which can involve TCEP events) but sometimes also from snowmelt (Berghuijs et al., 2019).
In parallel, several studies investigated the tendency for extreme precipitation to cluster in time over sub-seasonal timescales, from regional scales (Barton et al., 2016; Yang and Villarini, 2019; Tuel and Martius, 2021b) to global scales (Kopp et al., 2021; Tuel and Martius, 2021a), as well as the role of TCEP in extreme precipitation accumulations. Over Europe, possible drivers of TCEP include temporal clustering in extratropical cyclones, particulary in winter (Mailier et al., 2006; Vitolo et al., 2009; Pinto et al., 2013), persistence in large-scale teleconnection patterns (Yang and Villarini, 2019), recurrent Rossby waves (Ali et al., 2021), and tropical forcing and blocking (Barton et al., 2016). The explicit impacts of TCEP on discharge and floods have however mainly been discussed for case studies of major flood events only. Barton et al. (2016) discovered that TCEP caused the Lake Maggiore floods of autumn 1993 and 2000 by bringing large amounts of precipitation at intervals that were too short for the lake level to decrease between events. The central European floods of summer 2013 (Grams et al., 2014) as well as the UK floods of winter 2013/2014 (Priestley et al., 2017) were also connected to TCEP. Tuel and Martius (2021b) conducted a more systematic analysis of the relationships between TCEP and high discharge over Switzerland. They found in particular that TCEP led to a higher probability of high discharge than non-clustered precipitation extremes.
How the impact of TCEP evolves with the timescale of clustering remains however unexplored. Each extreme precipitation event can in principle be associated with a clustering timescale, depending on the lapse of time since the previous extreme event. Tuel and Martius (2021b) only looked at 3-week clusters, analysing together extreme precipitation events at the beginning and end of the clusters. There is also interest in going beyond the borders of Switzerland to consider a larger number of catchments that cover more diverse climates and whose precipitation and discharge series are less correlated. Here, we quantify the effects of TCEP on discharge in Switzerland and Europe, specifically on the occurrence and temporal persistence of high discharge. We classify extreme precipitation events according to their clustering timescale and analyse the sensitivity of results to that timescale as well as to catchment area and to extreme precipitation magnitude. Our analysis relies on two sets of precipitation and discharge data, one for Switzerland, also used by Tuel and Martius (2021b), and one for Europe. We take a forward and backward approach (e.g. Zscheischler et al., 2014), analysing on the one hand the characteristics of discharge following clustered and non-clustered extreme precipitation events and on the other hand the frequency of TCEP preceding particularly persistent high discharge periods.
2.1 Data
2.1.1 Catchments and discharge data
We use two discharge datasets in this study. The first consists of daily discharge data for 96 small- to medium-sized gauged catchments (14–1700 km2, with an average area of 294 km2) distributed across Switzerland (Fig. 1a). These catchments cover most of Switzerland's climates and range in mean elevation from 500 to 2700 m a.s.l. The data are collected and distributed by Switzerland's Federal Office for the Environment (FOEN). Among all available catchments, we selected a subset of them based on several criteria: at least 10 years of common data coverage with the precipitation data (RhiresD, 1961–2019; see Sect. 2.1.2), no major lakes, no significant human influence on discharge, and no detected non-stationarity in annual discharge maxima series (as determined by the FOEN). This set of catchments, with a few exceptions, was also used by Muelchi et al. (2021) and Tuel and Martius (2021b).

Figure 1Map of (a) FOEN catchments across Switzerland and (b) GRDC catchments across Europe analysed in this study. Shading indicates mean catchment elevation.
The second dataset consists of daily discharge data for Europe, taken from the Global Runoff Data Centre (GRDC) dataset. We selected all available gauges (amounting to 637 in total) in the 12∘ W–38∘ E/28∘ N–72∘ N domain. We required catchments to have an area of 50 000 km2 or less to exclude very large catchments, a minimum of 10 years of overlap between discharge and precipitation data (EOBS, 1950–2019; see Sect. 2.1.2) and no significant trend in annual discharge maxima series as determined with a Mann–Kendall test. In the end we retained 500 catchments, ranging from 9 to 2886 m a.s.l. in mean elevation (calculated from 30 arcsec GTOPO30 data) and from 10 to 48 550 km2 in area (Fig. 1b).
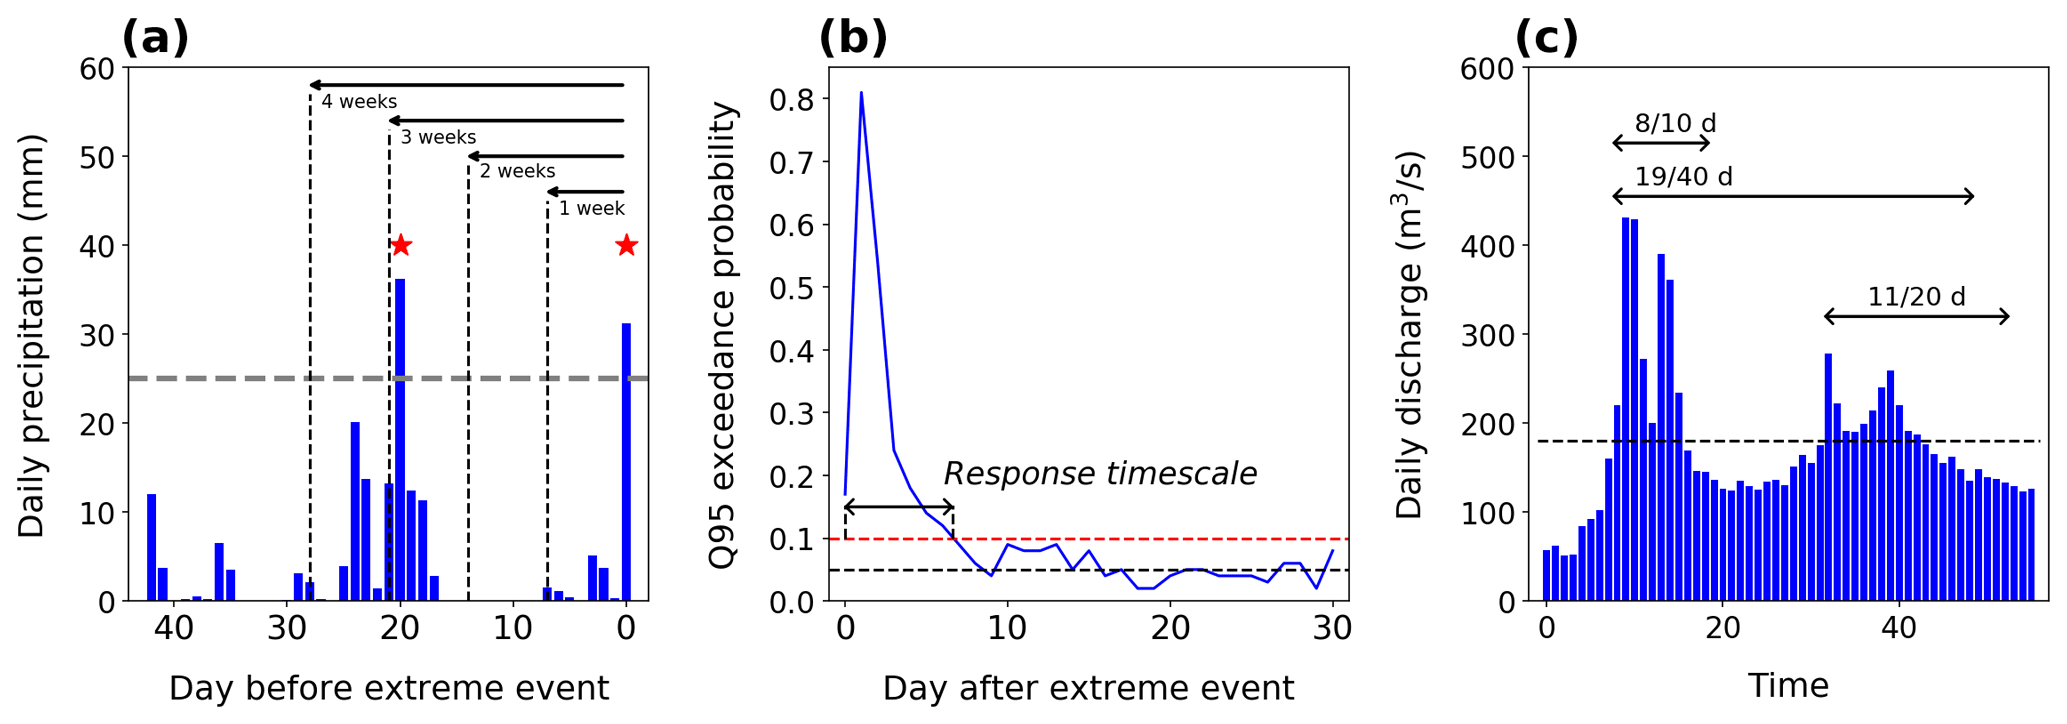
Figure 2Metrics used to quantify the effects of TCEP on high discharge. (a) Clustering categories for precipitation extremes illustrated on an example daily precipitation time series (blue). Extreme events (above the 99th daily percentile, horizontal dashed line) are indicated by red stars. To determine the clustering category for the event at t=0, we look for antecedent events in progressively longer time windows (1, 2, 3, 4, 6, and 8 weeks) (Sect. 2.2.1) and choose the smallest window containing another extreme event. In this case, it would be the 3-week window. (b) Illustration of the definition of the discharge response timescale (Sect. 2.2.2). The high-discharge probability threshold of 0.1 is shown by the horizontal red line and the baseline high-discharge probability (0.05) by the horizontal black dashed line. (c) Identification of persistent high-discharge periods (Sect. 2.2.3) illustrated on an example daily discharge time series (blue). Moving windows of various lengths L are applied to select periods with a minimum number N of high-discharge days (larger than the 95th daily percentile, horizontal dashed line): in order, (L,N) is equal to (40,20), (20,10), (10,5), and (10,1). Here, the two periods with 8 out of 10 and 11 out of 20 extreme days would be selected.
2.1.2 Precipitation
Reference precipitation data for Switzerland come from the daily 2×2 km RhiresD dataset, available from 1961 to the present. We use data until 2019 only. RhiresD is obtained by spatially interpolating data from a high-density station network covering the whole of Switzerland. Additional details on this dataset can be found on the dedicated MeteoSwiss web page at https://www.meteoswiss.admin.ch/home/climate/swiss-climate-in-detail/raeumliche-klimaanalysen.html (last access: 19 May 2022). For European precipitation, we use the daily EOBS version 21.0e dataset at 0.25∘ resolution (Haylock et al., 2008) over the 1950–2019 period. EOBS is also the result of a spatial interpolation of measurements across the station network of the European Climate Assessment & Dataset (ECA&D). The gridded precipitation data are averaged for each catchment: RhiresD for all FOEN catchments across Switzerland and EOBS for all GRDC catchments across Europe.
2.2 Methods
For each catchment, we conduct the analysis over the period for which both discharge and precipitation data are available. This means that daily discharge and precipitation percentiles are calculated over different time periods depending on the catchment.
2.2.1 Precipitation and discharge extremes
As in Tuel and Martius (2021b), for each catchment, we define precipitation extremes on a monthly basis as days when catchment-averaged precipitation exceeds its 99th percentile for the corresponding month. All January days are thus compared to the January 99th percentile of daily accumulated precipitation. This removes the seasonal dependence in extreme precipitation magnitude and leads to a constant rate of extreme precipitation occurrence across the year. This step is motivated by the fact that high discharge is shaped not only by precipitation, but also by seasonally dependent surface conditions like snow and vegetation cover, soil saturation or evaporative demand (Paschalis et al., 2014; Nied et al., 2017). Consequently, the seasonal cycles of extreme precipitation and discharge magnitude are often dephased, with the highest discharge not necessarily occurring after the heaviest precipitation events (Tuel and Martius, 2021b).
The persistence of individual weather systems over timescales of 1–2 d leads to short-term dependence in the occurrence of extreme precipitation events. To remove this dependence, we apply a runs declustering procedure (Coles, 2001) in which extreme events separated by less than 2 d (Barton et al., 2016; Tuel and Martius, 2021b) are merged into a single event.
For each catchment, we then classify precipitation extremes into different categories based on their degree of sub-seasonal temporal clustering (Fig. 2a). For each extreme event, we look for the previous event closest in time by exploring progressively longer time windows of n weeks (). We choose the first (i.e. shortest) window that contains the closest previous event. All remaining events are declared to be “non-clustered” and are put together in a separate category. For simplicity and also because it only has a minor effect on the results, we analyse the n=5 and n=6 categories together as well as the n=7 and n=8 categories. Results will thus be shown for . Note that these categories do not intersect: each extreme event belongs to one and one only.
We use the 95th percentile of daily discharge to define high discharge days for all catchments. Hereafter we will not mention the 95th percentile and simply refer to “high discharge” for simplicity. Unlike for precipitation, this percentile is fixed throughout the year and calculated on the entire available time series, because impacts of discharge extremes are more related to their absolute rather than relative magnitude. We choose a lower percentile threshold compared to precipitation to capture the majority of high discharge events associated with extreme precipitation events because discharge is influenced by factors other than precipitation. Potential long-term trends in extreme daily precipitation or discharge percentiles are not taken into account.
2.2.2 Effects of temporal clustering in extreme precipitation on discharge
We quantify the effect of temporal clustering of precipitation extremes on discharge by considering several simple metrics. For each catchment and each clustering category, we calculate for each day following extreme precipitation events:
-
daily discharge percentiles averaged across all events in the corresponding clustering category;
-
daily high discharge probabilities;
-
daily high discharge odds ratios.
In practice, we limit the analysis to 60 d after extreme precipitation events, beyond which we do not find a noticeable discharge response. The odds ratio compares the odds of high discharge given the occurrence of a precipitation extreme to the odds of high discharge given the absence of a precipitation extreme. With p1 the probability of high discharge given that a precipitation extreme occurred and p2 the probability of high discharge given that a precipitation extreme did not occur, the odds ratio is equal to (Wilks, 2019). It measures the strength of the link between the occurrence of extreme precipitation and that of high discharge but not its absolute magnitude. For the latter, it is more relevant to consider the high discharge probability after precipitation extremes.
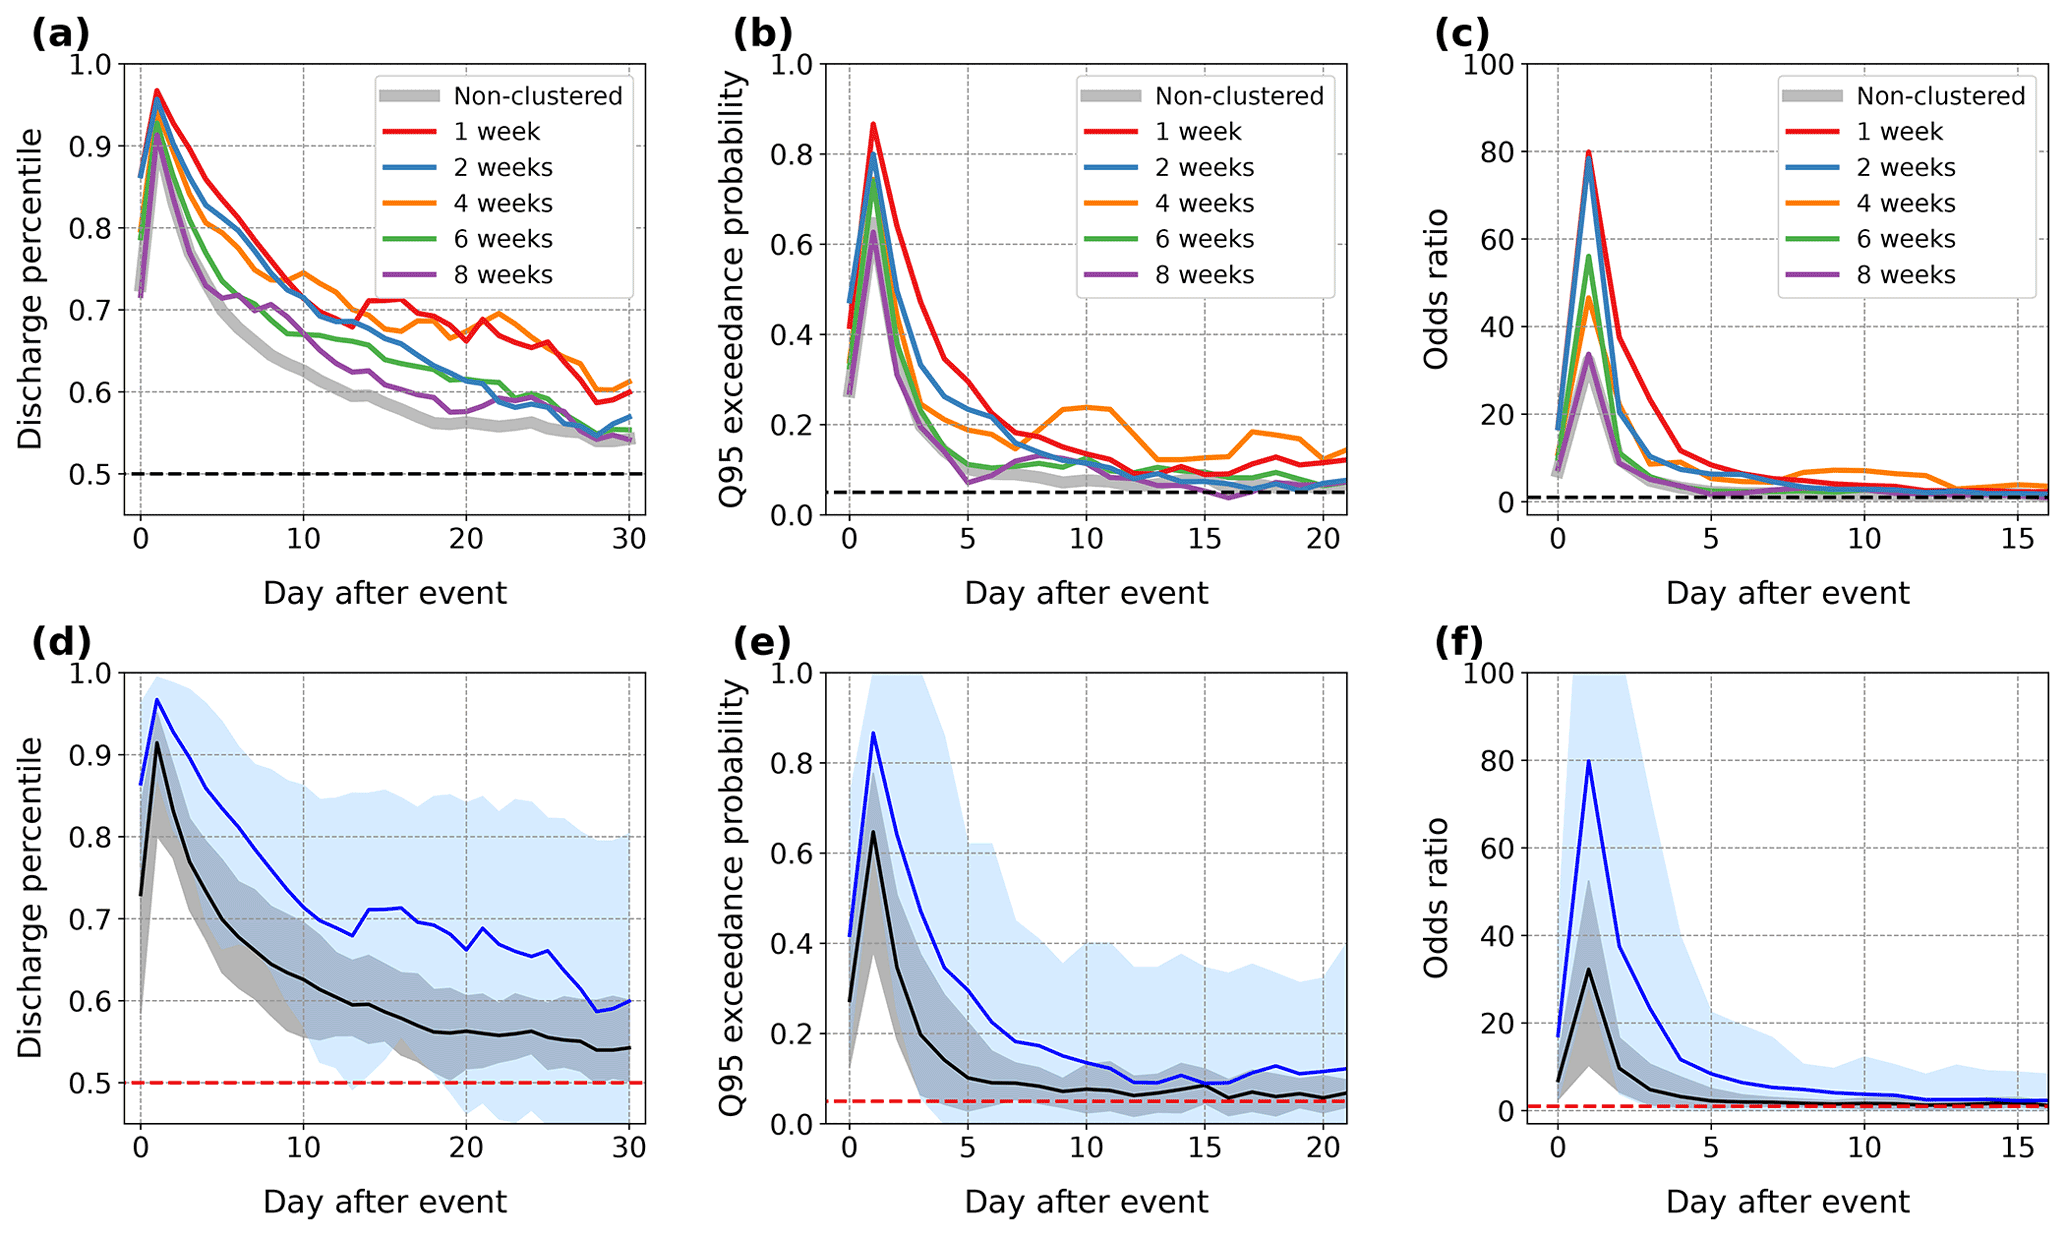
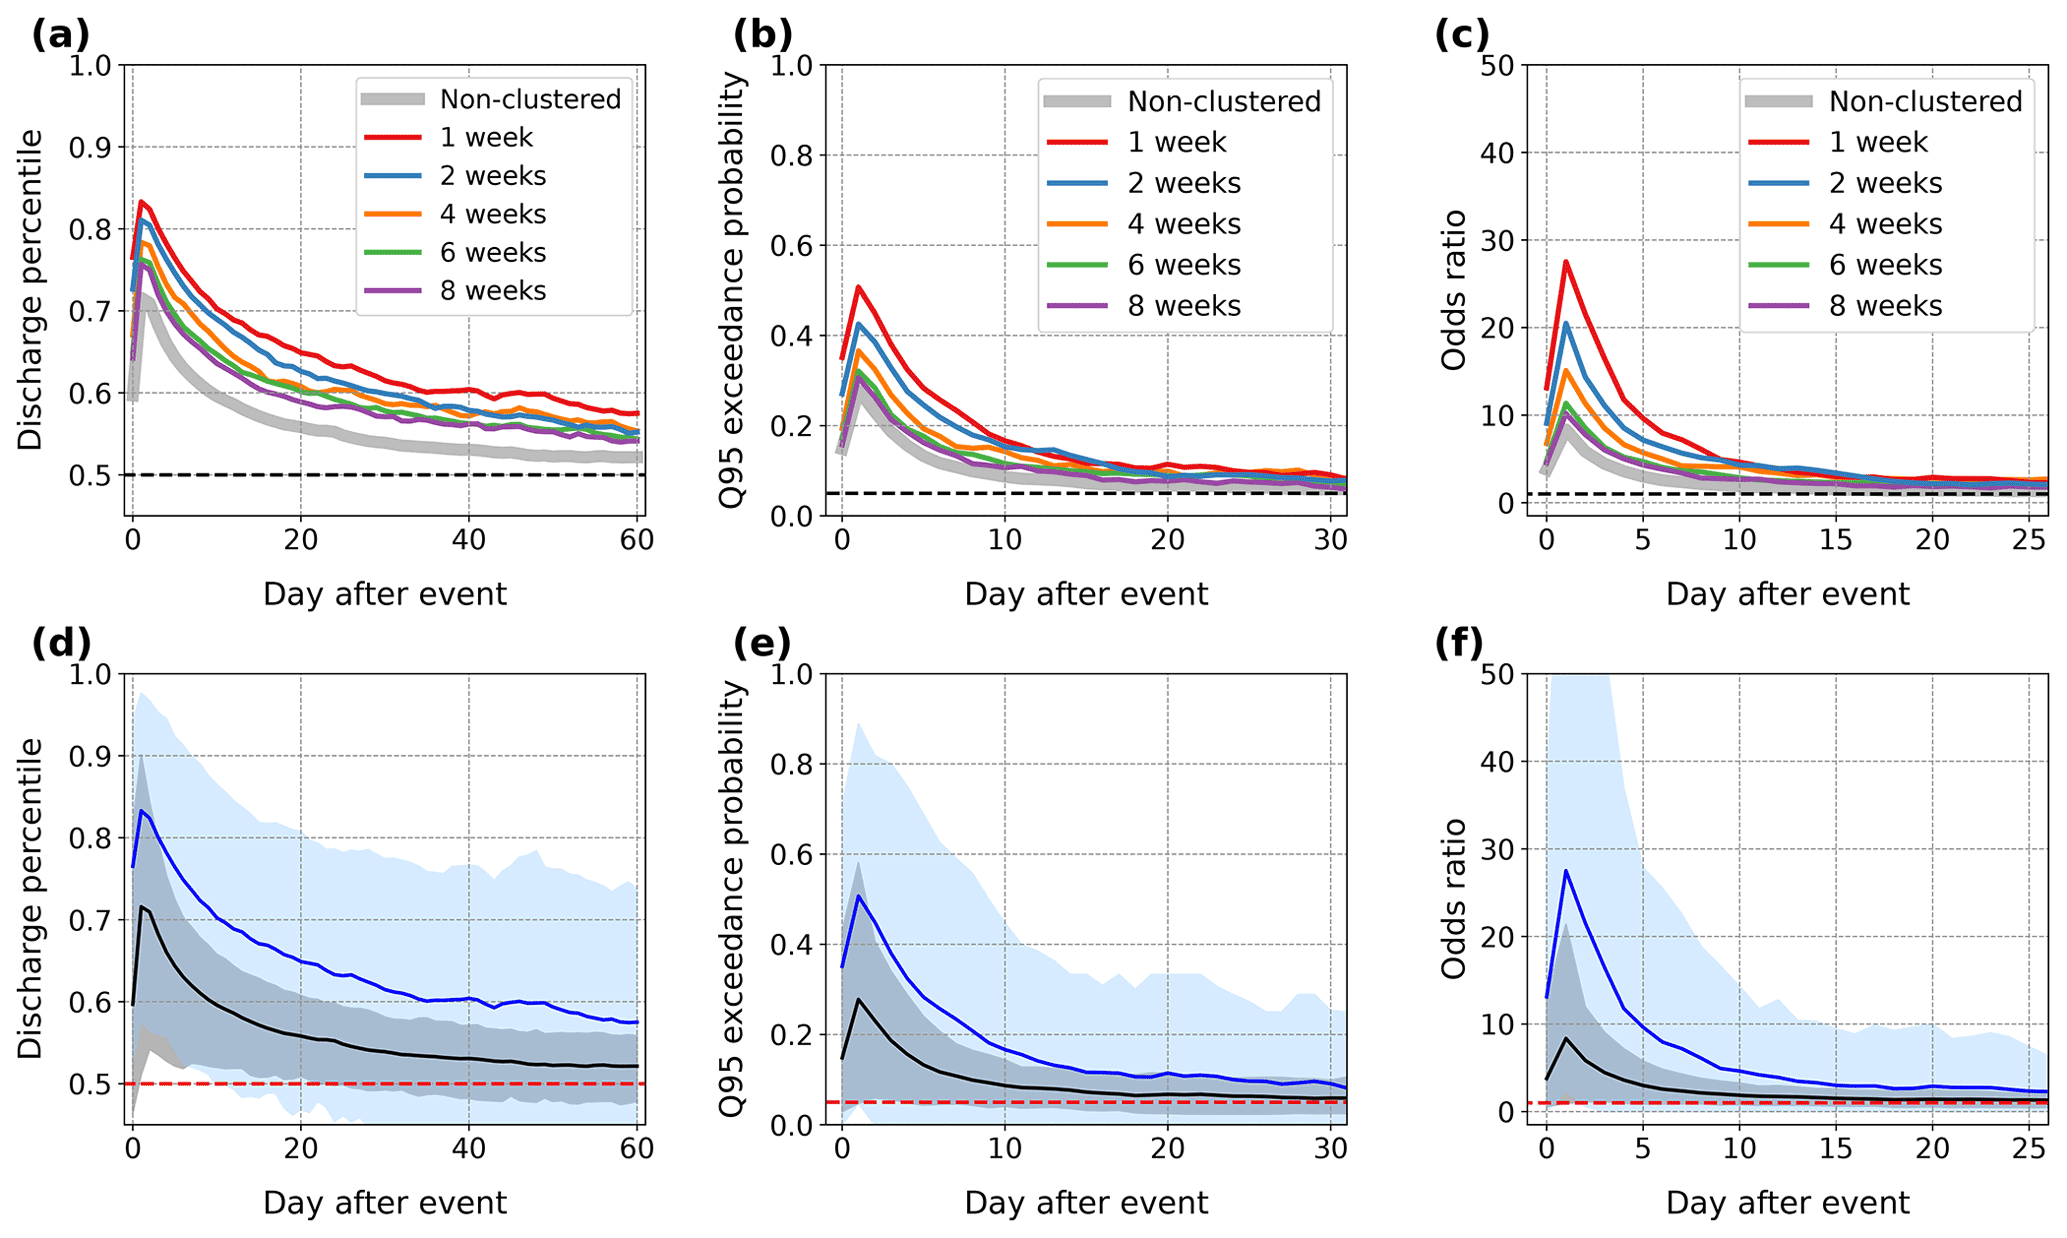
Figure 3Daily average (a) discharge percentile, (b) probability of high discharge (defined as the exceedance of the respective 95th daily discharge percentile), and (c) odds ratio of high discharge, averaged across FOEN catchments with a mean elevation of 1500 m or less, for the different clustering categories of extreme precipitation. Black dashed lines indicate baseline values of 0.5 for discharge percentiles in (a), 0.05 for high discharge probability in (b), and 1 for odds ratios in (c). (d–f) Same as (a–c) but for the non-clustered (black) and 1-week clustered (blue) categories only, with the 95 % range of values across catchments shown in light grey and blue shadings, respectively. Baseline values are shown by horizontal red dashed lines as in (a–c).
We also calculate mean high discharge probability and odds ratio values over a 5 d window following extreme precipitation events. This time window captures the bulk of the discharge response to extreme precipitation for almost all catchments (see the Results section), though our results remain approximately the same for timescales between 3 and 10 d. Finally, we define a high discharge response timescale as the time window during which the probability of high discharge continuously remains above 10 % in the 30 or 60 d following an extreme precipitation event (Fig. 2b). This probability is exceeded on at least one day after extreme precipitation events for almost all catchments, and so the response timescale is almost always longer than 1 d. The 10 % threshold may seem small, but it still corresponds to a doubling of the baseline probability. In addition, because the data have a daily resolution, we can only detect differences in high discharge response timescales, between clustered and non-clustered precipitation extremes, of at least 1 d. Hence we need to select a threshold low enough so that the difference will be at least 1 d (otherwise it would not be detected). For these reasons we selected the 10 % threshold.

Finally, because the phase of the precipitation and its magnitude impact the discharge response to precipitation extremes, we also analyse the Swiss results as function of catchment elevation – a rough proxy for the influence of snow – and of extreme precipitation magnitude. We separate Swiss catchments into two groups (one with mean elevation below 1500 m, the other above 1500 m) and average the results for each group. Discharge in high-elevation catchments is typically snow- or glacier-dominated, and we expect the discharge response to precipitation extremes to differ with elevation. We do not investigate the influence of elevation in the European data, first because it covers a much narrower range of elevations (only 10 catchments have a mean elevation higher than 1500 m), second because mean elevations are less representative of the elevation distribution in larger catchments, and third because, unlike in Switzerland, the presence of snow is dictated by other catchment characteristics (chiefly latitude). We also explore the sensitivity to the event magnitudes: for this we separate extreme precipitation events in each catchment into two groups based on their absolute magnitude (bottom and top halves) and average the results across catchments for each group separately.
2.2.3 Persistent high discharge periods and precipitation characteristics
Following Tuel and Martius (2021b), we identify periods of persistent high discharge at sub-seasonal timescales as periods of 10 to 40 d when discharge exceeds its 95th percentile at least half of the time. In practice, we look for L-day periods with at least N high discharge days, with . We also consider an additional category, , to characterise non-persistent high discharge events. We proceed as follows (Fig. 2c): starting with the largest L value (L=40), we apply an L-day moving average to the binary series and select the period with the largest event total. The beginning of the period is defined as the first high discharge day within the L-day window. Non-zero values during that period are then set to zero, and the search is repeated as long as new periods are found. We then move on to the next largest L value and repeat the process. The procedure ensures that all identified periods belong to only one (L,N) category. Note that, depending on the values of L and N, no periods may be found in some catchments.
To characterise precipitation before and during the persistent high discharge periods, we then calculate for each catchment and each (L,N) the average cumulative precipitation percentile and number of extreme precipitation events over various time windows, 0–2, 3–7 and 7–21 d before the events, as well as during the events themselves, from day 0 (beginning of events) to day L−1. This choice of time windows follows Froidevaux et al. (2015), who analysed the distribution of precipitation before annual discharge peaks across Switzerland. The cumulative precipitation percentiles are calculated with respect to all periods of the same length as observed persistent high discharge periods. Their statistical significance is assessed with a Monte Carlo approach. For each catchment and (L,N) category, assuming we observe m periods of persistent high discharge, we generate 1000 random samples of m periods occurring within ± 20 calendar days of observed high discharge periods, calculate cumulative precipitation percentiles for these random periods and obtain their 90th percentile. Observed percentiles are then said to be significant if they exceed this value.
3.1 Effects of temporal clustering in extreme precipitation on discharge
3.1.1 Switzerland
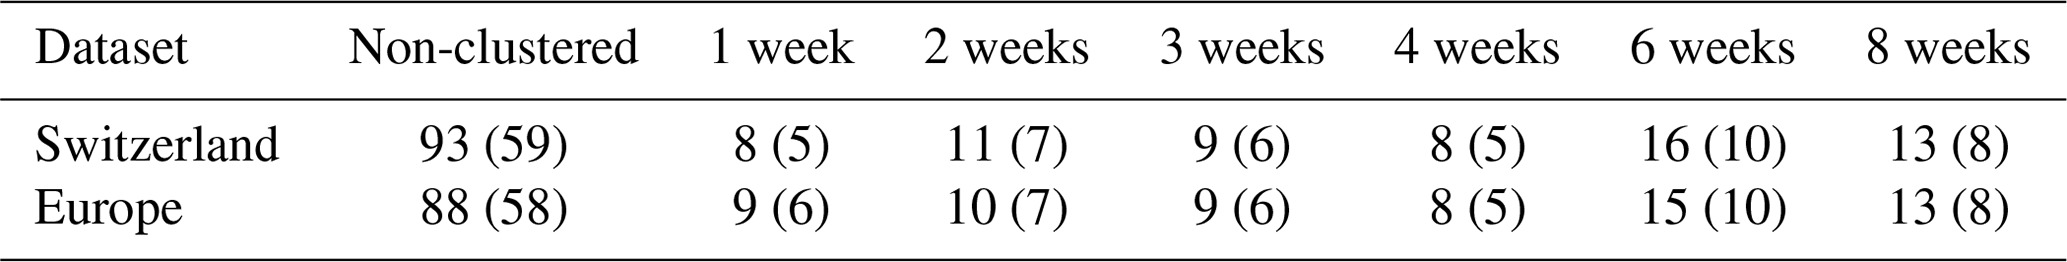
We begin with the results for the selected Swiss catchments. Table 1 indicates the average number of extreme precipitation events in each clustering category. Non-clustered events (i.e. not preceded by another event in the previous 8 weeks) account for about 60 % of all extreme precipitation events, while each subsequent category represents between 5 % and 10 % of events. We show the per-day distribution of discharge percentile, high discharge probability and odds ratio after clustered and non-clustered extreme precipitation events, averaged across catchments with a mean elevation lower than 1500 m (Fig. 3) and higher than 1500 m (Fig. 4). The discharge response is mainly confined to the first 20 d following the extreme precipitation event (day 0) (Fig. 3). Peak response occurs on day 1, with average discharge percentiles of 0.9 and higher. Most catchments already exhibit a substantial response on day 0, likely because of their relatively small size (on average 300 km2). After the peak, discharge slowly recedes back to its baseline level (50th percentile) reached on average after 30 d (Fig. 3a).
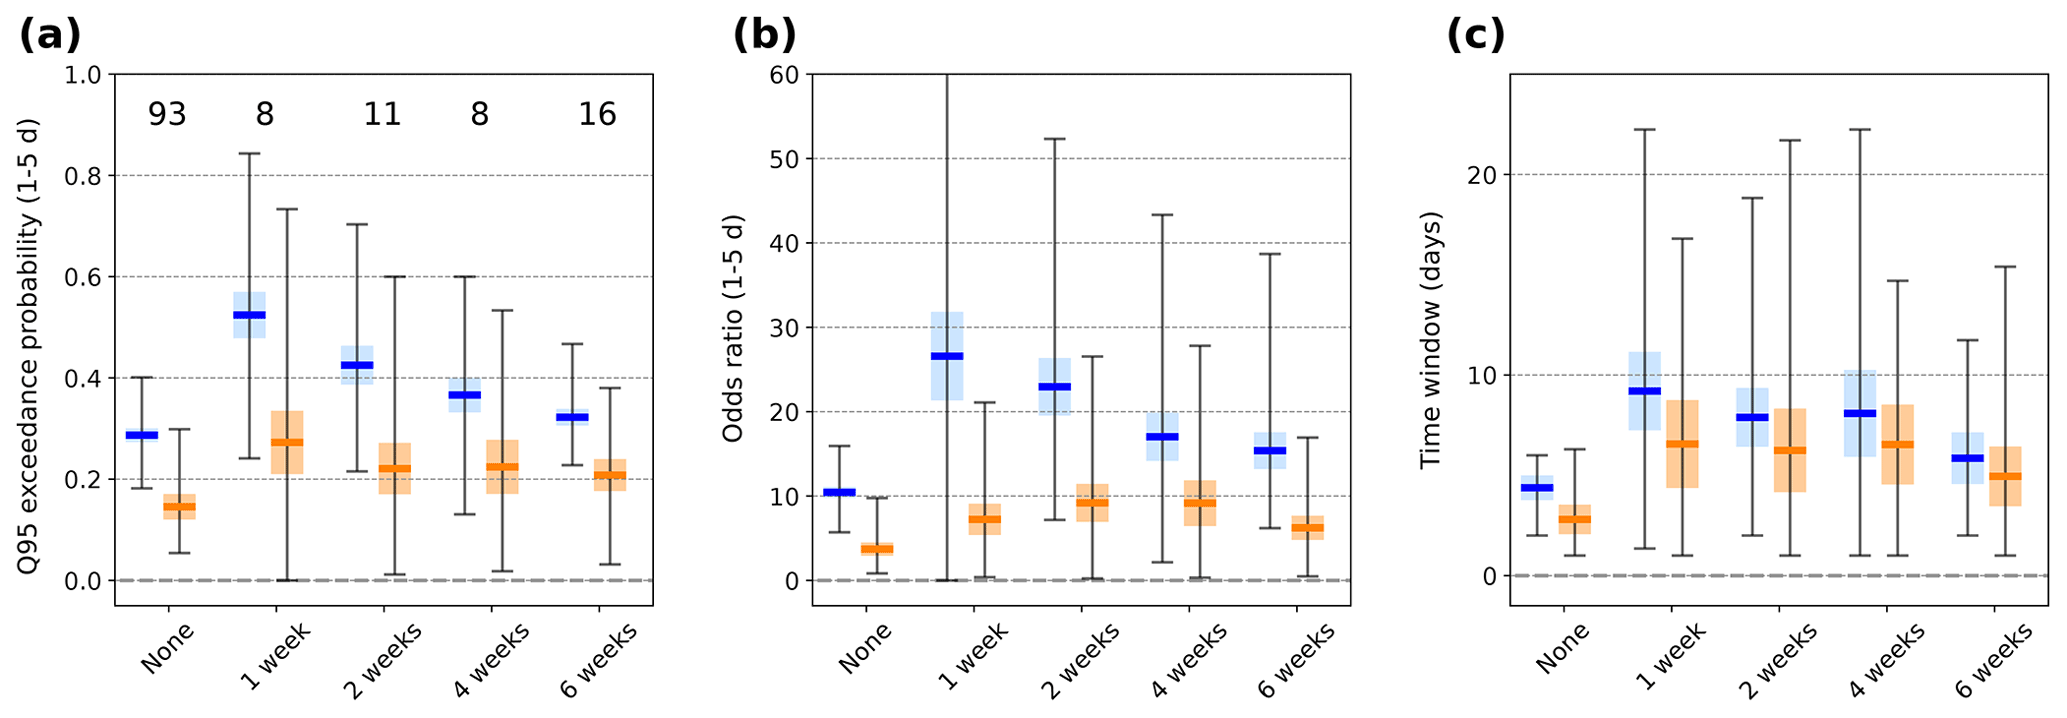
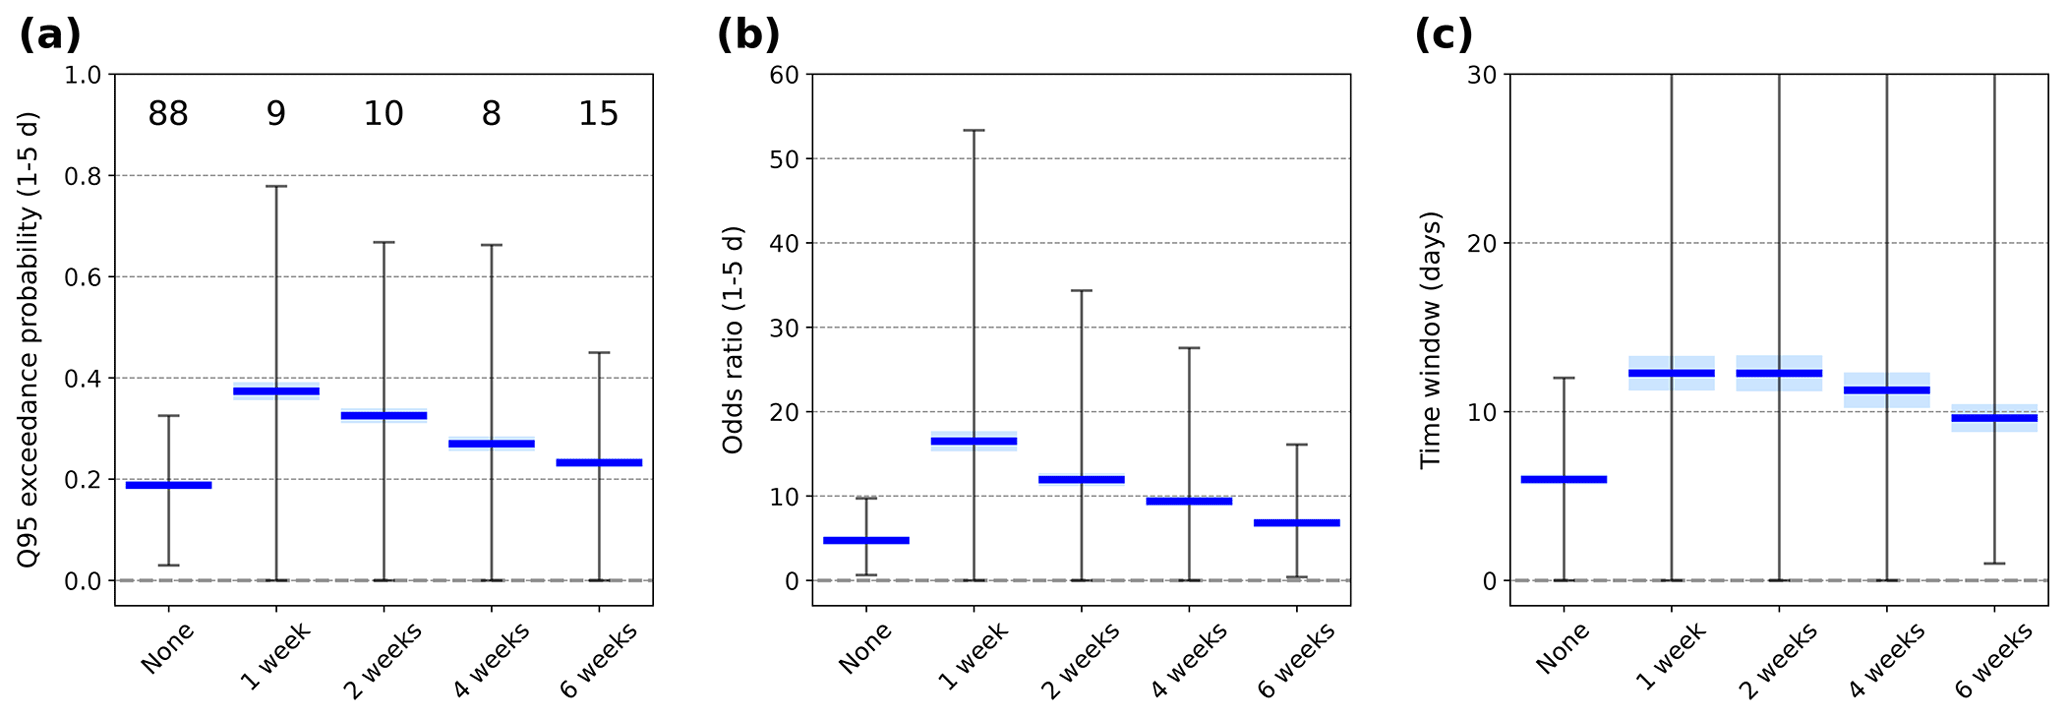
Figure 5Boxplot of (a) high discharge probability and (b) high discharge odds ratio averaged over days 1–5 following the occurrence of an extreme precipitation event (day 0) for FOEN catchments with mean elevation lower (blue) and higher (orange) than 1500 m and various clustering categories. Numbers at the top in (a) indicate the average number of extreme events in the respective categories. (c) Boxplot of the response timescale, defined in Sect. 2.2.2, for FOEN catchments and various clustering categories.
Table 1Distribution of extreme precipitation events across clustering categories in the Swiss (RhiresD/FOEN) and European (EOBS/GRDC) data: number of events averaged across all catchments and corresponding percentage (in parentheses) relative to the total number of events.
Clustering generally enhances the discharge response. It leads to a higher discharge peak (Fig. 3a) and high discharge likelihood (Fig. 3b) on day 1 and to a larger discharge response afterwards. Clustering at the 1–2-week window has the strongest impact on discharge, and the influence of clustering weakens as the window increases (Fig. 5). During the first 5 d in particular, the probability and odds ratio of high discharge are significantly larger for 1-week clustered events than non-clustered events (Figs. 3d, e and 5) (where the significance of the difference between responses to clustered and non-clustered extremes is assessed with a two-sample t test). The peak odds ratio is notably more than twice as large on average, and the 1–5 d odds ratio is almost twice as large (Fig. 5b). Even for the 4-week clustering timescale, the odds ratio remains 30 % larger than in the non-clustered case (Fig. 3c). We do find some discrepancies, however – for instance, the discharge response around days 1–2 is larger after 6-week than 4-week clustered events (Fig. 3).
Discharge after clustered events remains higher than after non-clustered ones for at least 10 d, which translates into longer response timescales (as defined in Sect. 2.2.2). The probability of high discharge remains above 0.1 for an average of 4 d after non-clustered events but for more than 5 d for clustered events in the cluster length categories up to 4 weeks (Fig. 5c). Results for the 8-week clustering window are generally indistinguishable from the non-clustered category.
Regardless of the clustering category, the discharge response is weaker at high elevations (Fig. 4). Extreme daily discharge values are much less common right after precipitation events: peak probabilities and odds ratio are reduced by a factor of 2–3 compared to the low-elevation catchments. The impact of clustering is also less pronounced when compared to the non-clustered category (Fig. 4d–f). The peak response still occurs on day 1, but day 0 values are proportionately higher than at low elevations (compare the first rows of Figs. 3 and 4). High-elevation catchments are, on average, not much smaller than low-elevation catchments, but they have a less dense vegetation cover, with shallower soils and steeper slopes, which might lead to a quicker onset of overland flow (via infiltration excess or saturation excess) as well as to faster subsurface flow (Carrillo et al., 2011) and thus explain the faster discharge response.
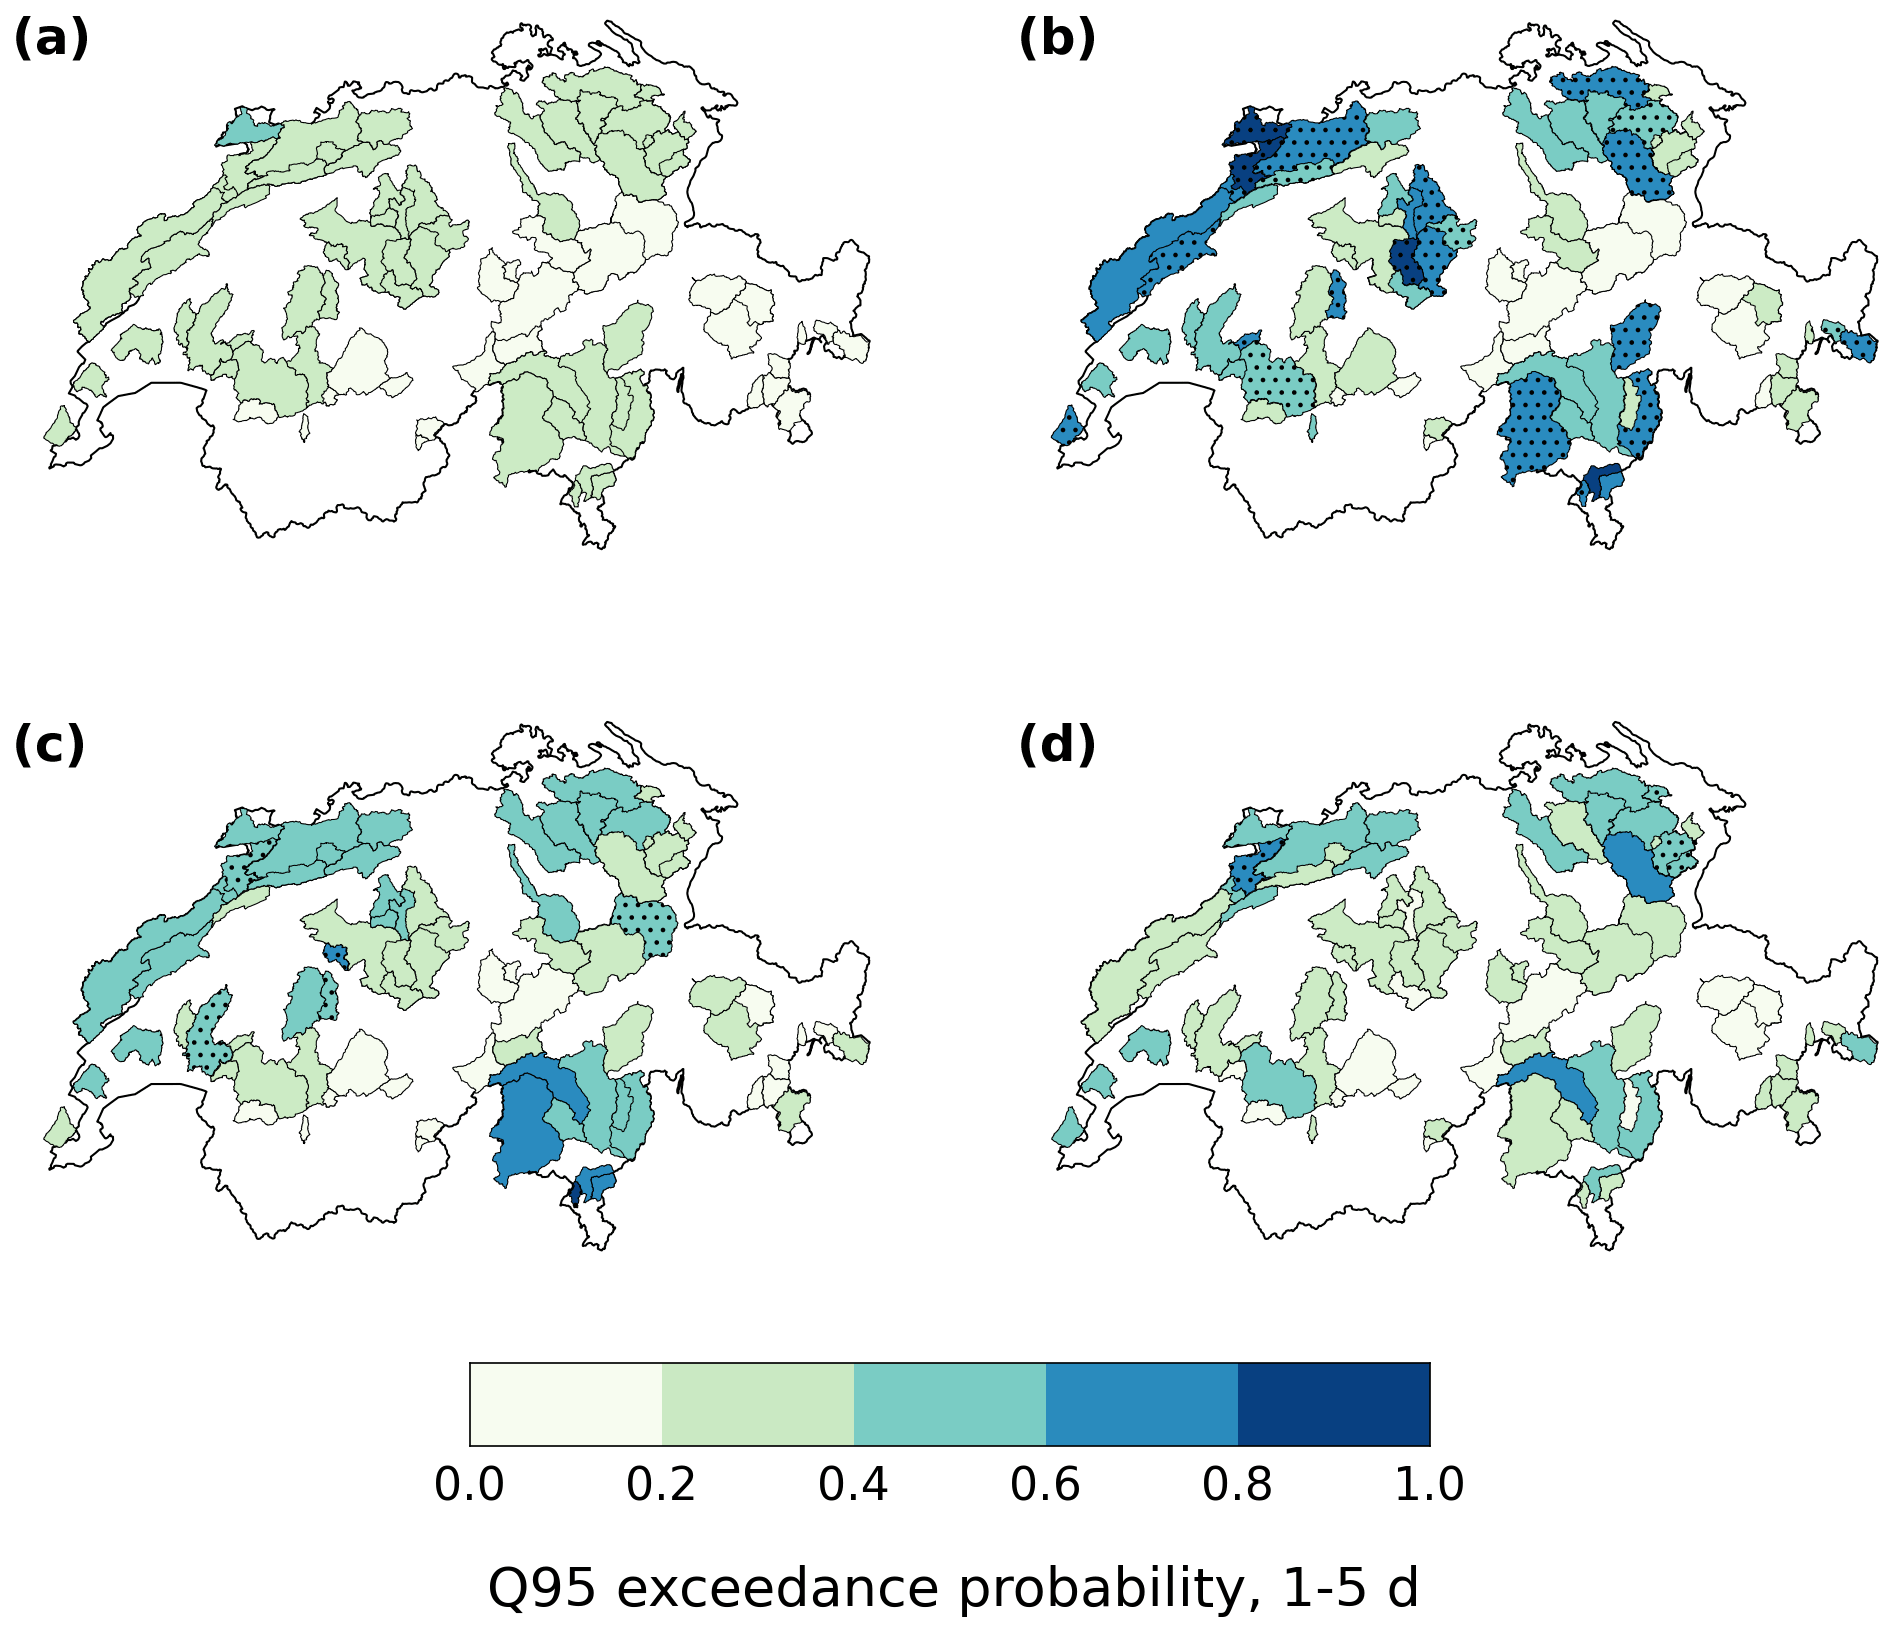
Figure 6Average high discharge probability on days 1–5 following an extreme precipitation event for (a) non-clustered, (b) 1-week clustered, (c) 2-week clustered, and (d) 4-week clustered events in the Swiss data. Hatching in panels (b–d) indicates catchments where values are significantly different from those in panel (a) at a 10 % level.
Because clustered event categories contain on average substantially fewer events than the non-clustered one (Table 1), associated results generally exhibit more variability. Additionally, given that Switzerland covers a relatively small area, the same heavy-precipitation events often affect several catchments at the same time. The samples used to obtain the curves in Figs. 3 and 4 are thus not independent. We notice for instance an increase in average discharge percentiles (and also in high discharge probability) around days 15–25 for the 1- and 4-week categories in Fig. 3a, b. They result from heavy precipitation that occurred simultaneously over many catchments after a few events in the 1- and 4-week categories and are not a delayed response to the initial extreme precipitation on day 0.
The influence of clustering on discharge extremes also varies in space, beyond the effect of elevation (Figs. 6 and A1). Some regions, like the Jura (northwest) or southern Switzerland, exhibit larger 1–5 d high discharge probabilities than others with similar elevation. This holds to some extent already for non-clustered extremes but is more striking at clustering timescales of 1 and 2 weeks (Fig. 6). The difference in high discharge probability between non-clustered and 1-week clustered events is even statistically significant for several catchments in these two regions, despite the small event number in the 1-week category (Fig. 6b). For the Jura, this particular regional effect can be related to karst effects (Malard et al., 2016) (see Sect. 4.4). In terms of odds ratio, regional contrasts unrelated to elevation differences are less prominent. The largest odds ratios are found over much of northern Switzerland, including the Jura, but no so much in southern Switzerland (Fig. A1).
3.1.2 Europe
Results for the European-wide data are consistent with the ones over Switzerland (Figs. 7 and 8). Because the distribution of catchment areas has a much wider range and the average catchment area is larger than in the Swiss FOEN dataset, the recession and response timescales are on average much longer than in Figs. 3 and 4 (Fig. 8c). The magnitude of the maximum discharge response is smaller for all considered metrics. In particular, the peak probability of high discharge is about 0.35 after non-clustered events (0.55 after 1-week clustered events) (Fig. 7b) compared to 0.65 (and 0.9) in the Swiss results (Fig. 3b). Yet because the response lasts on average longer, 1–5 d average high discharge probabilities and odds ratios are similar to the Swiss values (Figs. 5a, b and 8a, b).
Extreme event categories contain, on average, about as many events in the European data as they do in the Swiss data. However, since we average over 5 times more catchments and since the precipitation and discharge series of these catchments are more independent than in the Swiss data, the curves are overall smoother (compare Figs. 3a–c and 7a–c). The influence of clustering is also more strictly decreasing with increasing length of the clustering window.
Figure 9 shows the spatial variability of the results. Although GRDC catchments are far from covering all of Europe, we can see some general tendencies. The discharge response to extreme events, whether clustered or non-clustered, is proportionately weaker at higher latitudes (Scandinavia) where snowmelt-driven floods are more common (Berghuijs et al., 2019). The largest high discharge probabilities are found over central Europe, the United Kingdom and Ireland and, to some extent, the Iberian Peninsula.
3.2 Persistent high discharge periods and temporal clustering
We now turn to the analysis of precipitation before and during high discharge periods. Most high discharge periods, whether persistent or not, are preceded by intense precipitation (90th percentile or higher) on the 3 preceding days (Fig. 10a). Still, accumulated precipitation tends to be larger before persistent periods than before non-persistent ones, except at high elevations. The difference is largest for the most persistent periods (compare panels a and c), especially in the Jura and southern Switzerland (not shown). Note that, although we select a 90 % significance level in Fig. 10, precipitation accumulations lower than the percentile can still be significant, because we assess the significance by comparing to periods at the same time of the year as the periods of analysis.
Precipitation accumulations during high discharge periods are by contrast very different between persistent and non-persistent periods (Fig. 10b). Small precipitation accumulations characterise non-persistent periods, whereas persistent periods are associated with high event precipitation totals, except at high elevations.
The large precipitation accumulations both before and during persistent high discharge periods often result from TCEP (Fig. 10c). More than half of periods in 22 Swiss catchments are associated with TCEP. Typically, one precipitation extreme occurs in the first 3 d before the event, and another, sometimes more, occurs during the event itself. Overall, the connection to TCEP is weaker for less persistent high discharge periods. Admittedly, the time window used to calculate TCEP frequency depends on the value of L, and higher TCEP frequencies should be expected for larger values of L. Nevertheless, L is the same between non-persistent and the shorter persistent events, and TCEP frequencies are overall larger for the latter.
Results for Europe are qualitatively similar (Fig. A6). Fewer significant values are detected compared to Switzerland, but this may possibly result from the larger average catchment size. The probability of high discharge in large catchments is more sensitive to the exact timing and location of extreme precipitation, and catchment-average precipitation series as we use here may be less relevant. We notice in particular that the smallest catchments, located mainly in the United Kingdom and Ireland and central Europe, generally exhibit significant accumulations. Catchments across Scandinavia also exhibit few if any significant values.
Understanding the relationship between precipitation clustering and discharge extremes is important as precipitation clustering characteristics are expected to be affected by climate change (Tuel and Martius, 2021a). For wintertime in a warmer climate in Europe, for instance, we expect an increase in cumulative precipitation from clusters that are however composed of fewer extreme precipitation events in each cluster (Bevacqua et al., 2020). Our analysis makes the case for a significant influence of temporal clustering in extreme precipitation on the likelihood and temporal persistence of discharge extremes. Clustered precipitation extremes are followed, on average, by higher discharge values that persist over longer periods than non-clustered precipitation extremes. The shortest clustering timescales (1–2 weeks between successive precipitation extremes) appear to have the most impact, with the influence of clustering progressively decreasing as the timescale increases. Our results remain very similar if we remove the baseflow component from the discharge series (Fig. A8). The main difference is that the response tends to be slightly larger and longer when baseflow is removed.
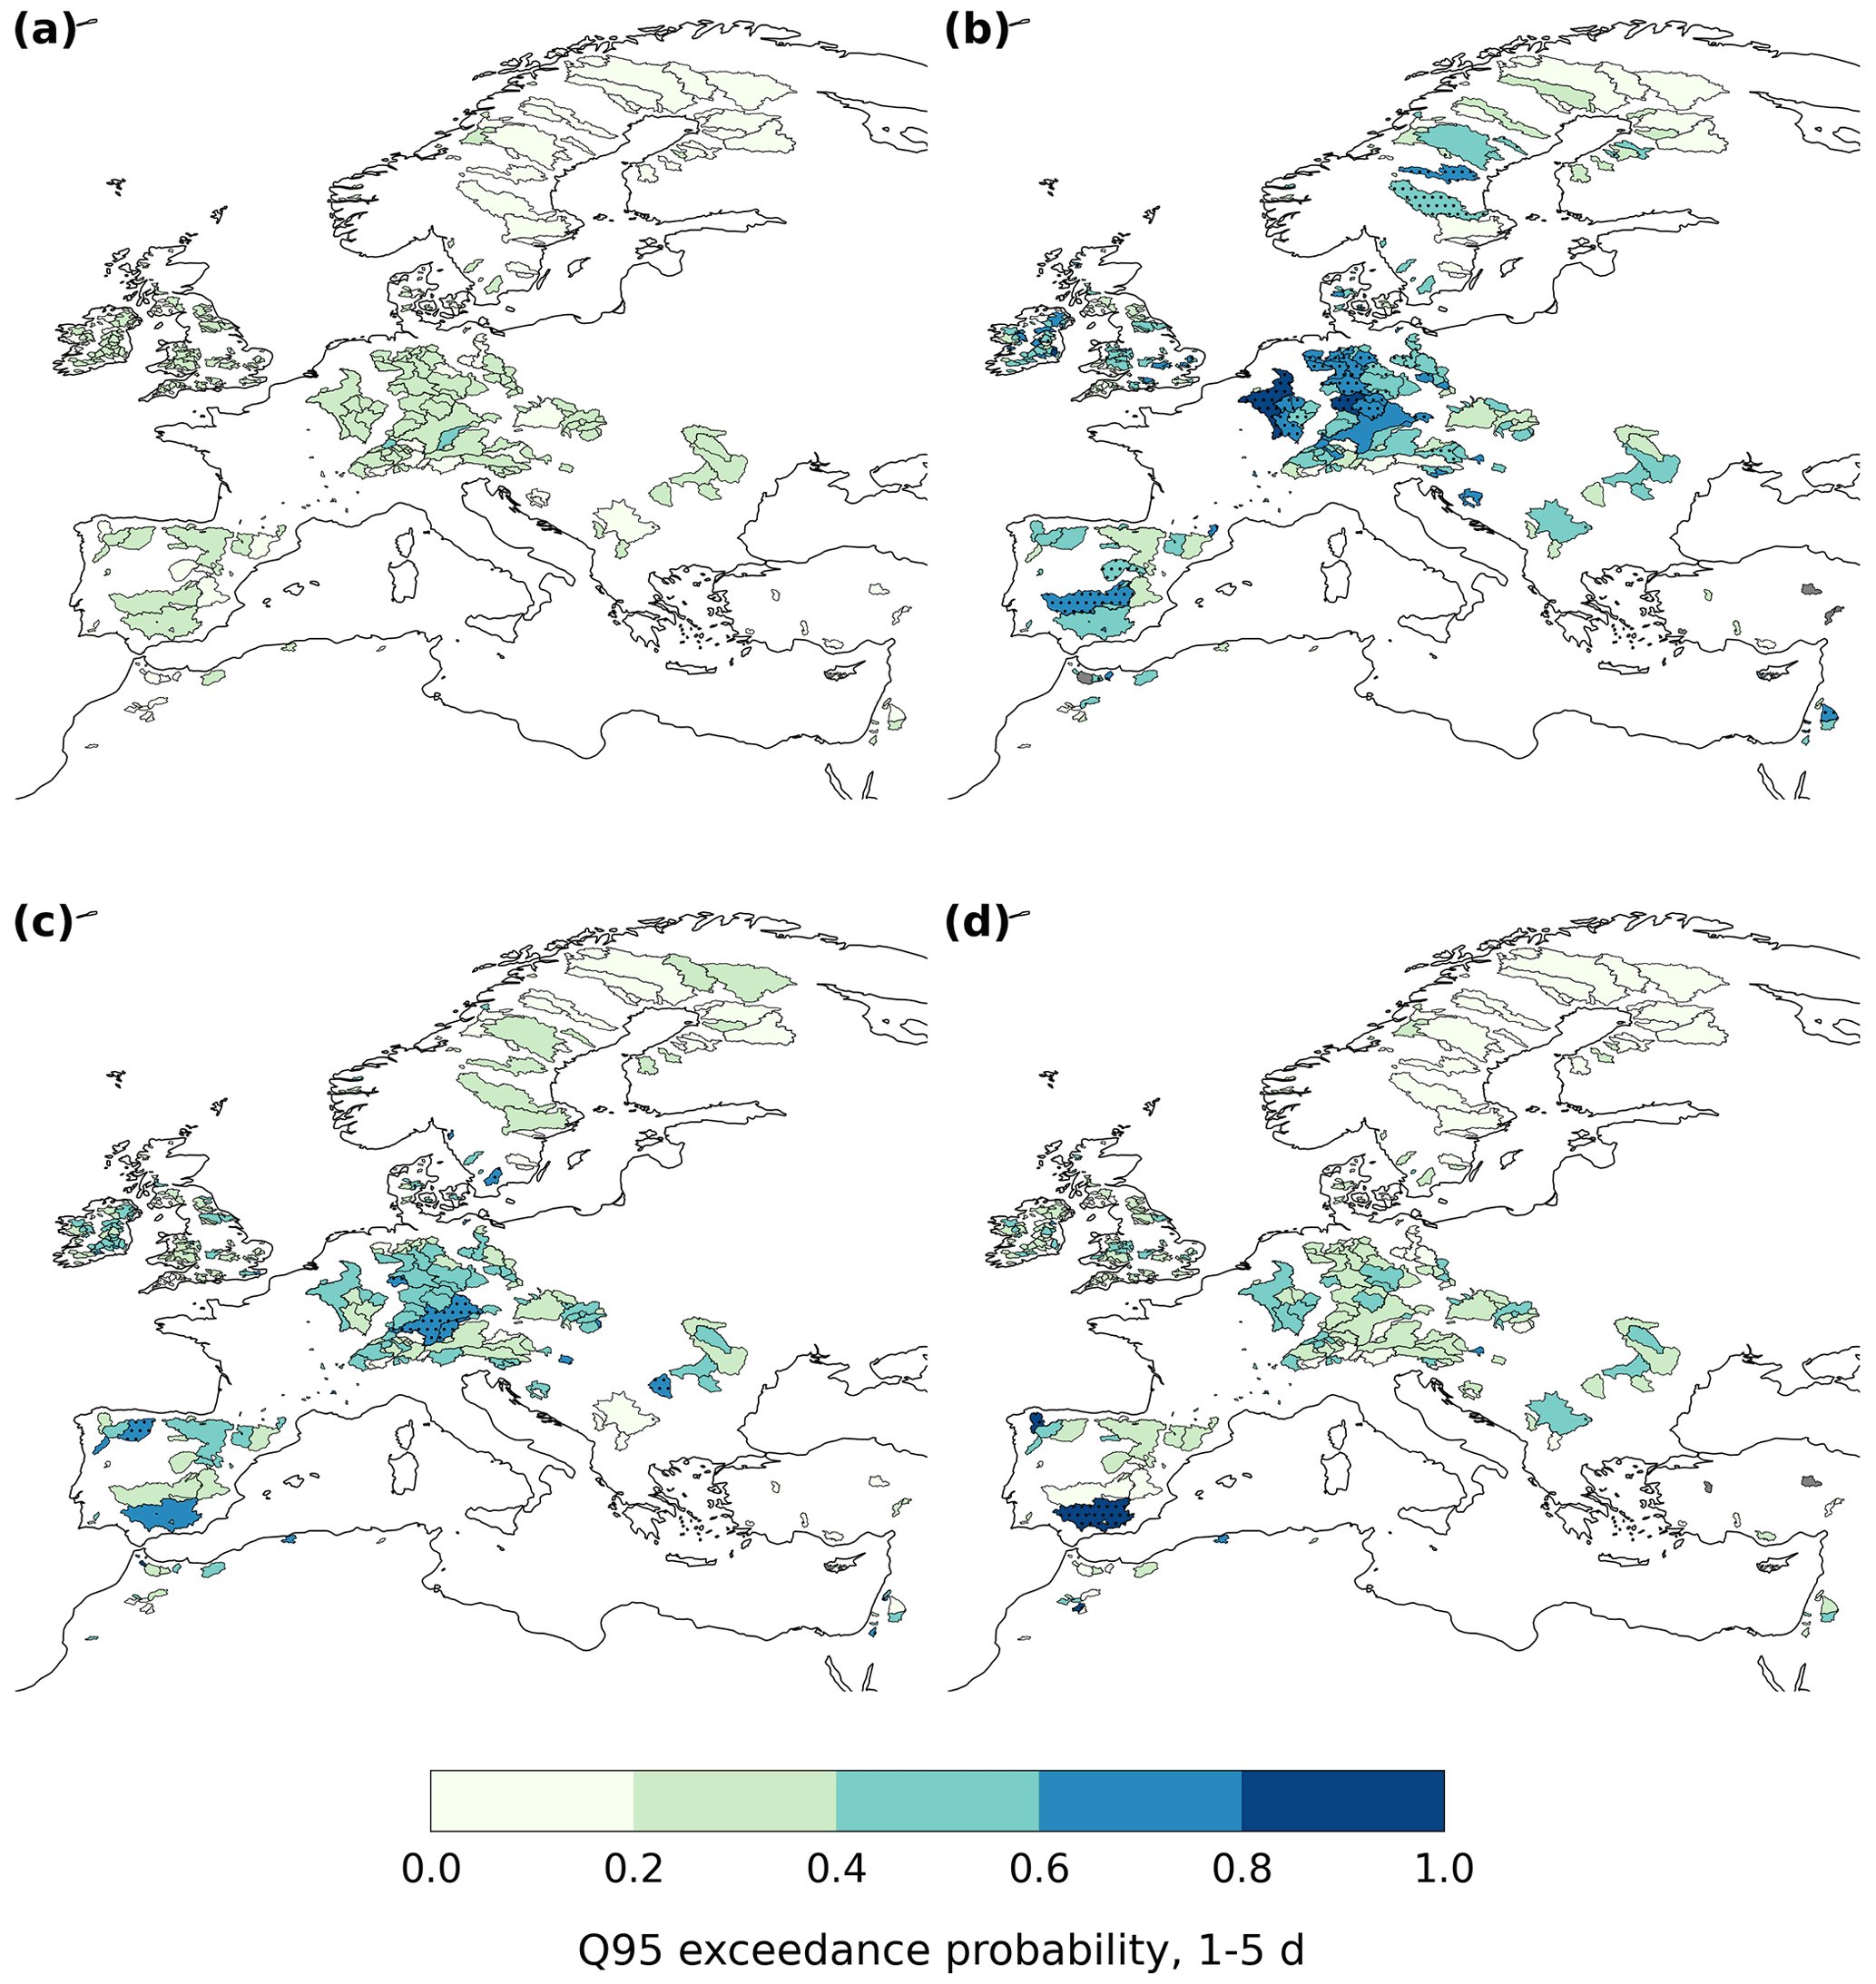
Figure 9Same as Fig. 6 but for the European data.
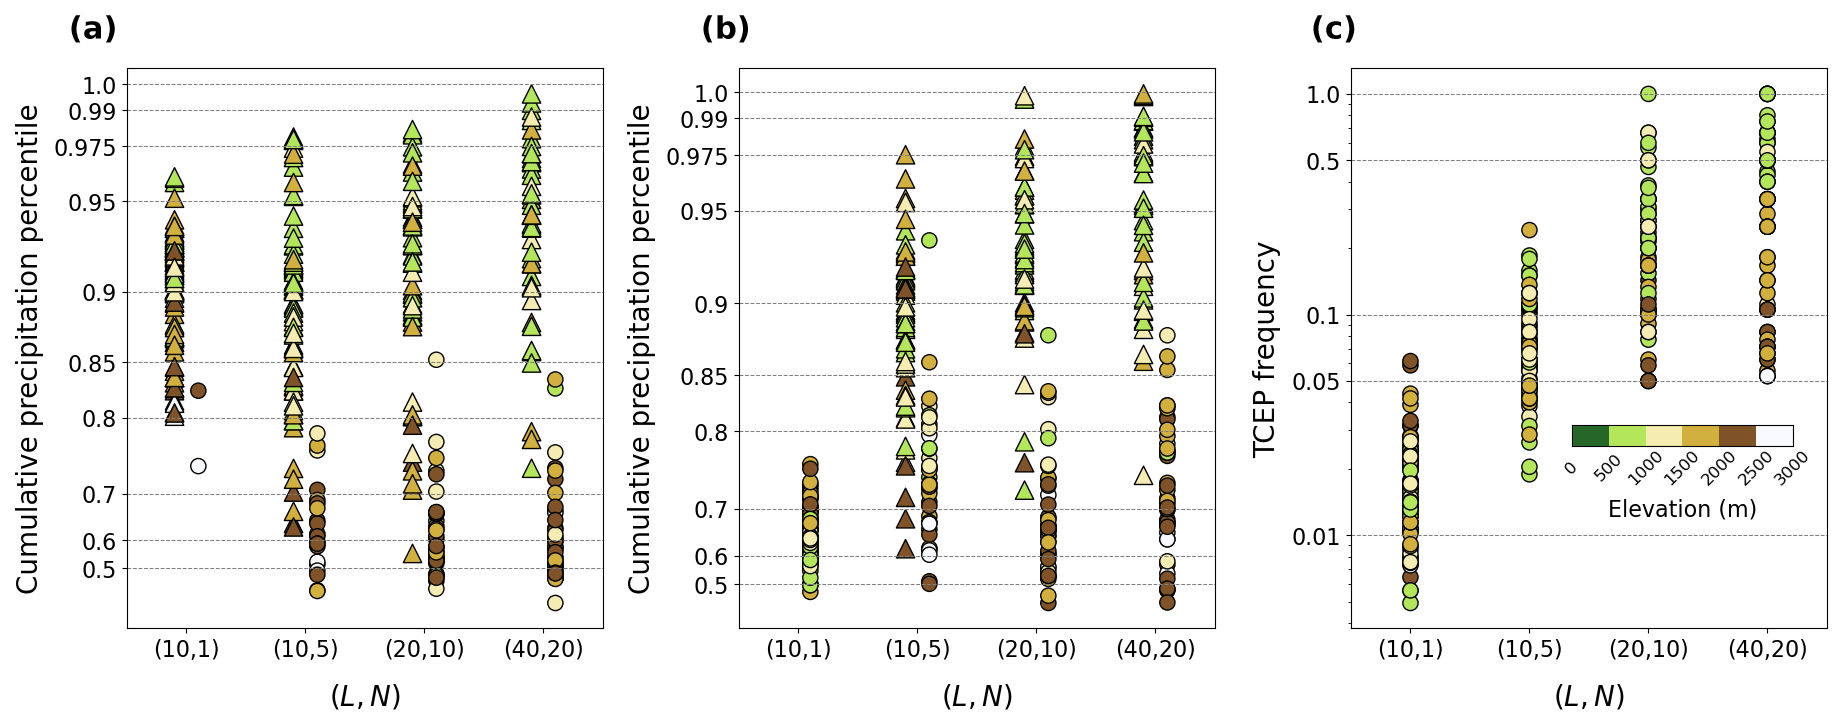
Figure 10(a) Average percentile of cumulative precipitation during days 0–2 before and (b) during persistent high discharge periods and (c) fraction of high discharge periods with two or more extreme precipitation events (TCEP) between day 2 before to the end of the period, averaged by catchment for the Swiss data. Values are coloured according to catchment-mean elevation to highlight the difference between high- and low-elevation catchments. In panels (a–b), triangles (circles) indicate values that are (are not) statistically significant at a 10 % confidence level (Sect. 2.2.3).
A detailed process-based analysis is beyond the scope of this paper; nevertheless, we propose that soil moisture memory at sub-seasonal to seasonal timescales (Wu and Dickinson, 2004; Seneviratne et al., 2006) plays an important role in explaining the effects of clustering on discharge. The role of soil moisture pre-conditioning for the likelihood of extreme runoff and discharge has indeed been discussed extensively (Nied et al., 2014, 2017; Paschalis et al., 2014; Khanal et al., 2019). Soil moisture increases following the first extreme precipitation event, and the short window of time to the next event is not sufficient for soil moisture to decrease back to its initial value. The runoff coefficient during the subsequent extreme event is thus higher, which increases the likelihood of high discharge. A longer period between events means more opportunity for soil moisture to decline, hence the weakening effect of clustering as the clustering window increases (e.g. Fig. 3).
The role of the pre-conditioning through soil moisture is likely to vary across the year. In winter, soils are more likely to be saturated, so that the discharge response to small clustering windows may not be significantly higher. However, to explore the seasonality in TCEP impact on discharge, one would have to take into account seasonality in discharge and extreme precipitation magnitude (Figs. A2–A5), in TCEP frequency (Tuel and Martius, 2021a, b) and in surface conditions. All these factors make for a complex analysis which goes beyond the aim of the present study and would likely require hydrological modelling, since at seasonal timescales clustered events might be too few to obtain robust statistical results.
4.1 Snow-dominated catchments
Clustering has a significant impact on discharge for the vast majority of analysed catchments, covering a wide range of spatial scales and hydroclimates, with the notable exception of high-elevation catchments in Switzerland and high-latitude catchments in the European data where the effects of precipitation extremes – let alone clustering – on discharge are seldom significant. In Switzerland, elevation is a direct proxy for the influence of snowmelt and glacier melt. High discharge at high elevations occurs primarily in summer, at the time of maximum snowmelt and glacier melt (Figs. 1a and A3c). Similarly, high discharge in Scandinavian catchments occurs most often in conjunction with spring snowmelt (Blöschl et al., 2017; Berghuijs et al., 2019) (Fig. A5), whereas extreme precipitation magnitude is relatively small in this season compared to summer and autumn (Fig. A4). This does not imply that precipitation extremes and TCEP have no influence on discharge but rather that their influence is masked by the seasonality in high discharge, dominated by snowmelt. To detect that influence, “local” discharge percentiles could be used instead in the same way as precipitation. The interpretation in terms of impacts would nonetheless be different. Note also that the GRDC dataset includes almost no catchments along the Norwegian coast, where floods are less driven by snowmelt and more by extreme precipitation events (Hegdahl et al., 2020; Berghuijs et al., 2019). The link between discharge and TCEP in such catchments would thus probably be much higher than for the snow-dominated catchments in the rest of Scandinavia.
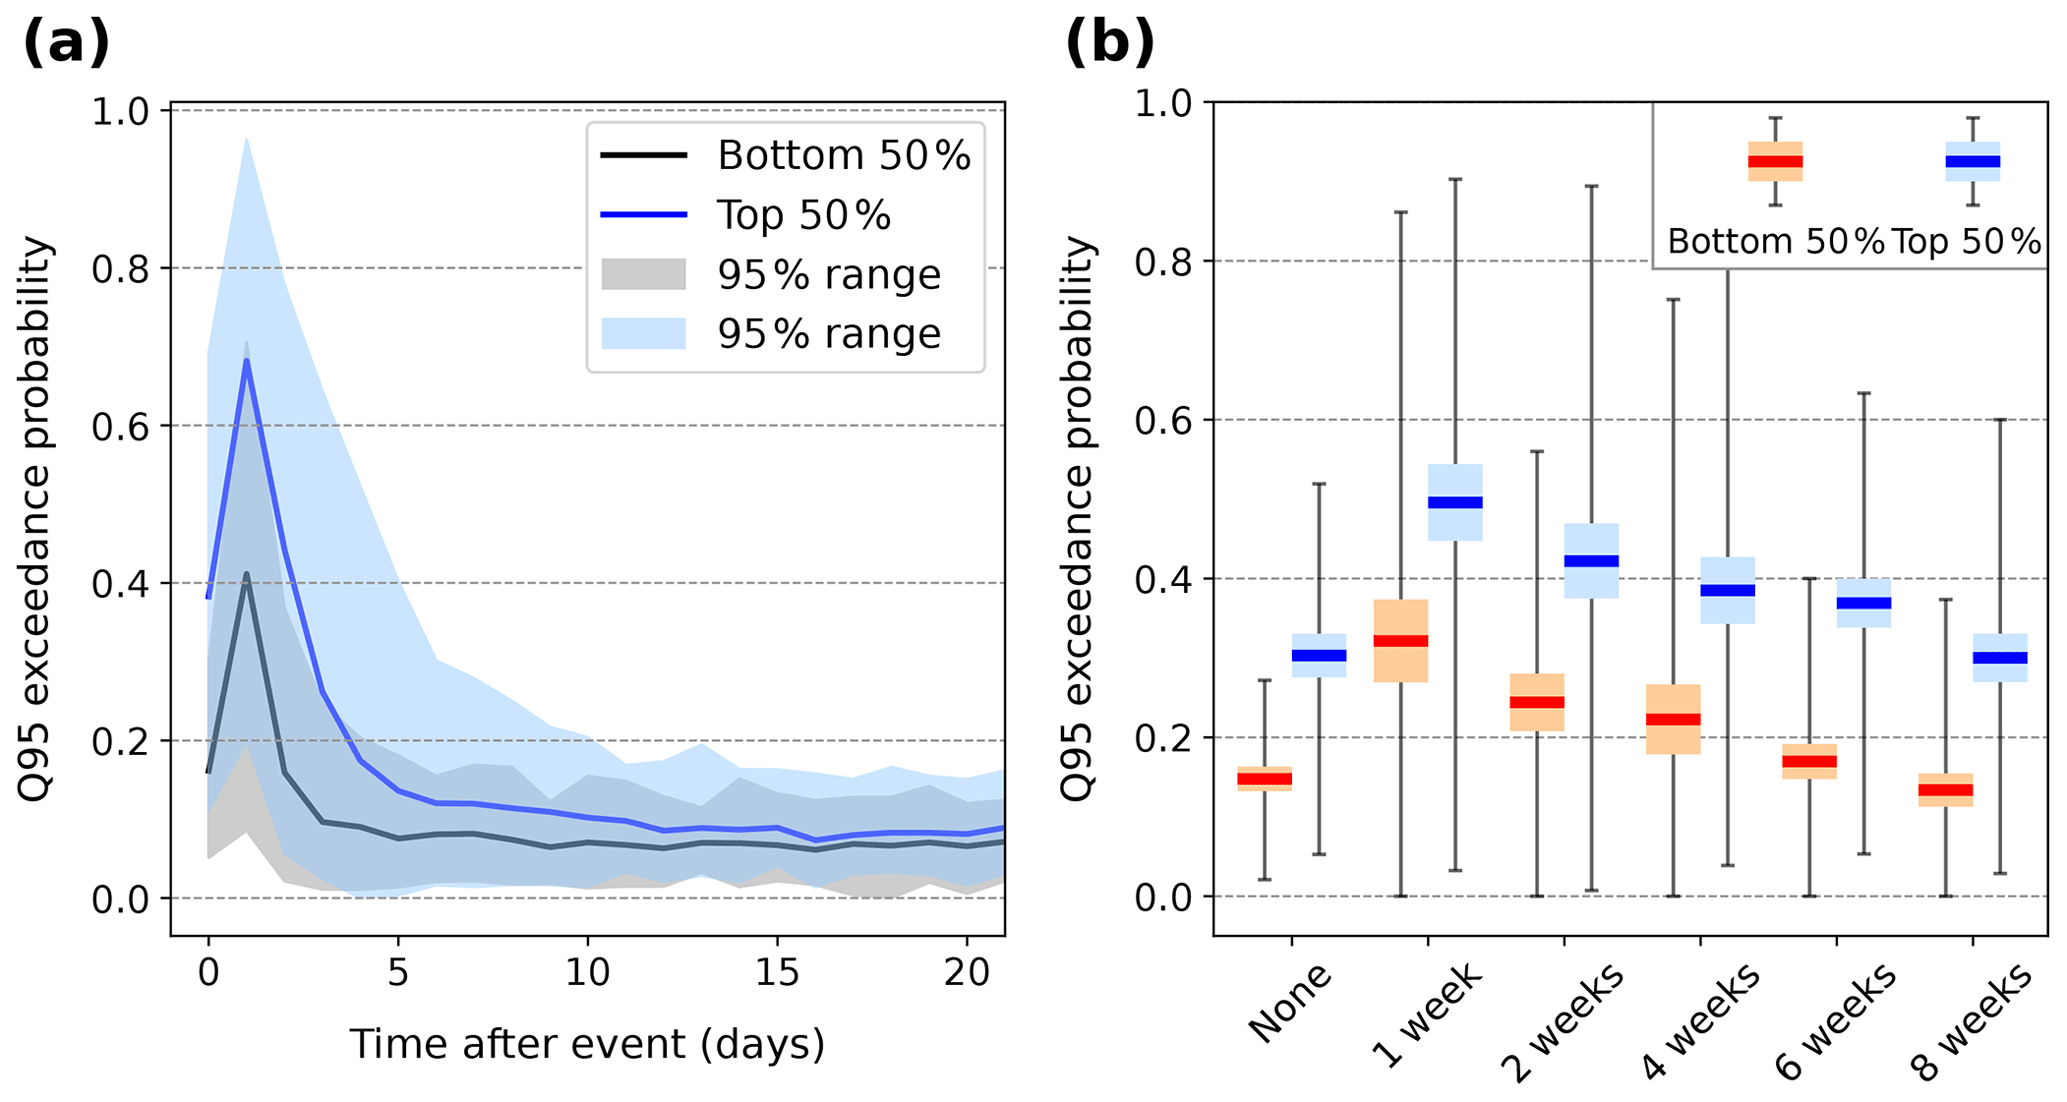
Figure 11(a) Daily probability of high discharge following an extreme precipitation event (both clustered and non-clustered) averaged across Swiss catchments, separated between intense (top 50 %, blue) and weak (bottom 50 %, black) events based on their absolute magnitude. The 95 % range of values across catchments is shown in light blue and black shadings, respectively. (b) Boxplot of high discharge probability averaged over days 1–5 following the occurrence of an extreme precipitation event (day 0), separated between intense and weak extremes, for various clustering categories, averaged over all Swiss catchments.
4.2 Extreme precipitation magnitude
To define precipitation extremes, we chose monthly-varying percentiles, and so far we have analysed extreme precipitation events regardless of their magnitude. Separating events for each catchments into two groups based on their magnitude (Sect. 2.2.2) and pooling clustered and non-clustered extreme events together, we find that the discharge response clearly scales with the magnitude of the precipitation (Fig. 11a). This tendency occurs in all clustering groups, but the difference is smaller, in relative terms, for the 1- and 2-week categories than for others (Fig. 11b). It cannot simply be explained by differences in precipitation magnitudes between clustering categories (Fig. A7). Surface conditions probably play a role: soil moisture is more likely to be high before 1- and 2-week clustered events than before other events. Consequently, even (relatively) low precipitation amounts can generate a large discharge response. By contrast, when soils are dry, the infiltration capacity may be larger. This nevertheless remains speculation, and a detailed understanding would require taking into account seasonal variability as mentioned above. The heaviest extreme precipitation indeed generally occurs in summer and autumn (Fig. A2), when surface conditions are often less conducive to high runoff coefficients (extensive vegetation cover, large evapotranspiration) than in winter (reduced vegetation cover, frozen/saturated soils). Likewise, for some catchments, TCEP events occur in the season with the largest precipitation extremes, like in southern Switzerland, which can bias the result since clustered events will also tend to be the heaviest.
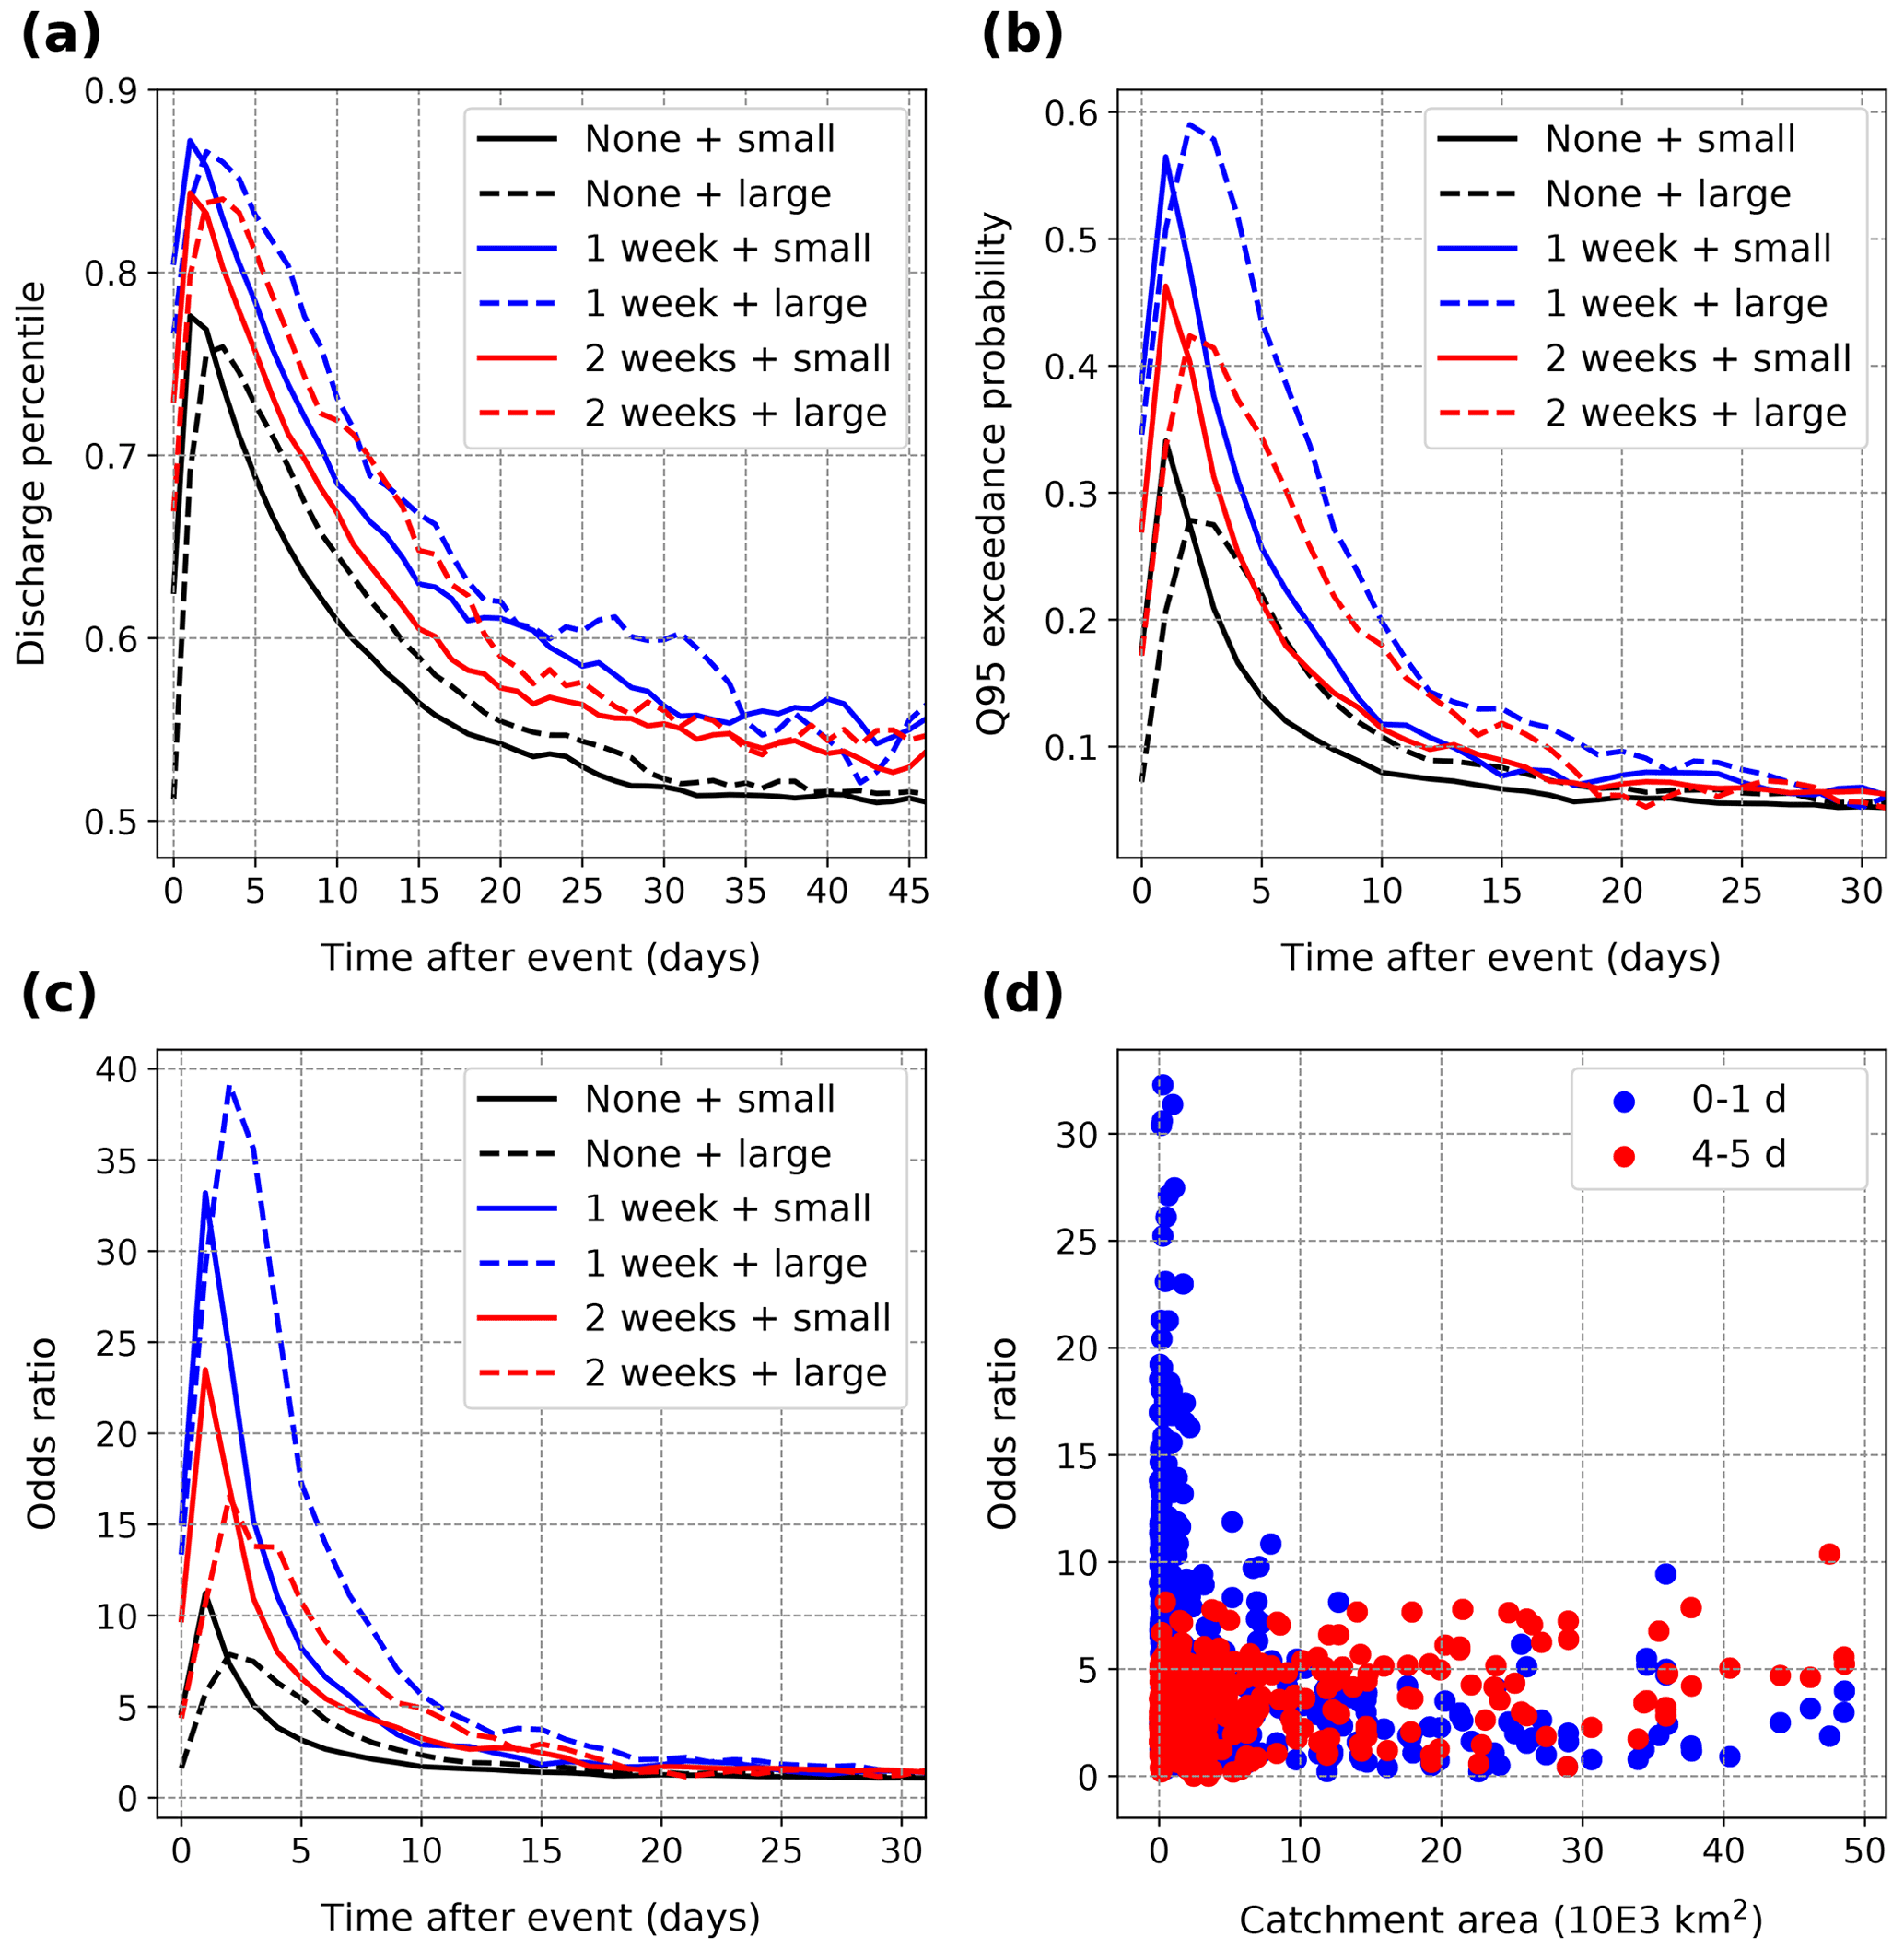
Figure 12Daily average (a) discharge percentile, (b) probability of high discharge and (c) odds ratio of high discharge, averaged across “small” (area ≤ 10 000 km2, solid lines) and “large” (area ≥ 10 000 km2, dashed lines) catchments in the European data, for non-clustered (black), 1-week (blue) and 2-week (red) clustered events. (d) Average high discharge odds ratio from days 0–1 (blue) and days 4–5 (red) following an extreme precipitation event against the catchment area.
4.3 Catchment area and response timescale
Another aspect of the results which we did not explore is the influence of catchment area. Given the small range of catchment areas (14–1700 km2) in the Switzerland dataset, the daily resolution of the discharge data is too coarse to detect a significant effect. The Europe-wide GRDC dataset, by contrast, covers a much wider range of catchment areas (10–50 000 km2). Again, a simple approach to the problem is to separate catchments between “small” and “large” ones. We use an arbitrary 10 000 km2 threshold to make the distinction; this leaves 417 catchments classified as “small” and 83 as “large”. In large catchments, the peak discharge response to extreme precipitation events occurs later (by 1–2 d on average) than in small catchments and tends to be lower (Fig. 12a). Recession timescales are also longer and, as a consequence, large high discharge probabilities persist for much longer (Fig. 12b). All clustering categories show the same pattern. There is quite a lot of variability in the results across catchments but, overall, only small catchments have large odds ratios within the first two days following an extreme precipitation event, while a few days later odds ratios in large catchments are bigger (Fig. 12d). Large catchments have a wider distribution of travel times to the outlet, which smooths the discharge response and leads to a smaller peak on average (Fig. 12a). In addition, precipitation extremes in large catchments are less likely to extend over the whole catchment than in small ones. They are therefore less likely to drive high discharge in catchments with an area beyond 10 000 km2. The soil moisture memory argument is also less valid for clustered extremes, since two extreme events may occur over different parts of the catchment. However, precipitation extremes are expected to have a larger spatial footprint in a warmer climate (Bevacqua et al., 2021b), such that larger catchments might also experience very fast response times in the future.
4.4 Link to high discharge processes
Temporal clustering in extreme precipitation generally leads to a larger discharge response over a longer period of time compared to non-clustered events. Still, the impact of clustering on discharge varies significantly across catchments in both the Switzerland- and Europe-wide data (Figs. 6 and 9). At first order, the influence of snow and catchment area can explain some of this variability. Yet in Switzerland, at least, some differences do not seem related to catchment elevation or area. Like Tuel and Martius (2021b), we find that the effects of clustering are larger in northwestern and southern Switzerland (Fig. 6b, c). These two regions are already more sensitive to non-clustered extreme precipitation events (Fig. 6a). Extreme precipitation magnitude is by far the highest in southern Switzerland, regardless of the season (Frei and Schär, 1998; Umbricht et al., 2013; Piaget, 2015). It reaches its peak in the autumn, which coincides with peak discharge as well (Figs. A2 and A3). High discharge in this region is thus likely driven by infiltration excess (Aschwanden and Weingartner, 1985; Helbling et al., 2006; Diezig and Weingartner, 2007), even in the absence of clustering. The large response to clustering (Fig. 6b, c) in this region may then simply reflect the larger magnitude of precipitation extremes.
The situation is different in northwestern Switzerland (Jura mountains). There, high discharge occurs primarily during winter (Fig. A3a), in conjunction with frozen or saturated soils (Aschwanden and Weingartner, 1985; Helbling et al., 2006) but not with the largest precipitation extremes (Fig. A2a). Average catchment elevation is rather low (Fig. 1a) and liquid precipitation and snowmelt not uncommon in winter. The Jura is a region that shows strong karst effects (where soluble limestone rocks dominate, leading to high permeability and complex subsurface flows) (Malard et al., 2016), which are known to lead to complex interactions between surface and subsurface flow (White, 2002). It is unclear, however, why this interplay would lead to higher sensitivity to precipitation extremes and clustering.
Across Europe, differences in discharge sensitivity to precipitation extremes and to clustering, beyond the likely influence of snow discussed above, are less straightforward to interpret. The spatial coverage of the catchment ensemble is very uneven, which makes it difficult to identify robust spatial patterns. A more detailed analysis taking into account extreme precipitation magnitude and seasonality and clustering seasonality (Tuel and Martius, 2021a) is needed to better interpret our results.
We focused here on the link between precipitation clustering and high discharge. Still, whether high discharge translates into a flood, particularly a disastrous one, depends on other factors related to the exposure and vulnerability of human systems, like the presence of infrastructure and its management or the performance of early warning systems (Merz et al., 2021). The most disastrous floods tend to result from compounding effects between hazards, exposure and vulnerability. Because disastrous floods remain quite rare and may cover large areas, the role played by TCEP in triggering such floods may be easier to quantify with cross-catchment analyses rather than by focusing on each catchment individually.
In this study, we quantified the effects of TCEP at sub-seasonal timescales on the occurrence and temporal persistence of high discharge in Switzerland and Europe. Our results across Europe confirm those of Tuel and Martius (2021b) for Switzerland: clustering leads to a larger and more persistent discharge response, thus increasing the likelihood of high discharge compared to extreme precipitation events occurring in isolation. In addition, temporal clustering plays an important role in triggering periods of particularly persistent high discharge. These conclusions apply to the majority of analysed catchments, though catchment sensitivity to clustering varies with area, precipitation magnitude and discharge regimes. Despite its uneven spatial coverage across Europe, GRDC could be used to further analyse the sensitivity of the TCEP response to discharge regimes and to detect potential spatial patterns.
By classifying precipitation extremes according to their timescale of clustering, we also find that clustering appears to be most relevant for high discharge at the 1–2-week timescale, beyond which its influence decreases. TCEP is therefore a critical driver of the occurrence and persistence in high discharge across all studied regions. Key for risk mitigation is thus improving our understanding of where and why TCEP is likely to occur. We focused here on high and extreme discharge values. However, very extreme discharge is by definition rare, and catchment-scale analyses may fail to select a sufficient number of events to obtain statistically significant links to TCEP. Starting instead from historical flood events may help to highlight how TCEP modulates extreme discharge and flood risk in a more robust way.
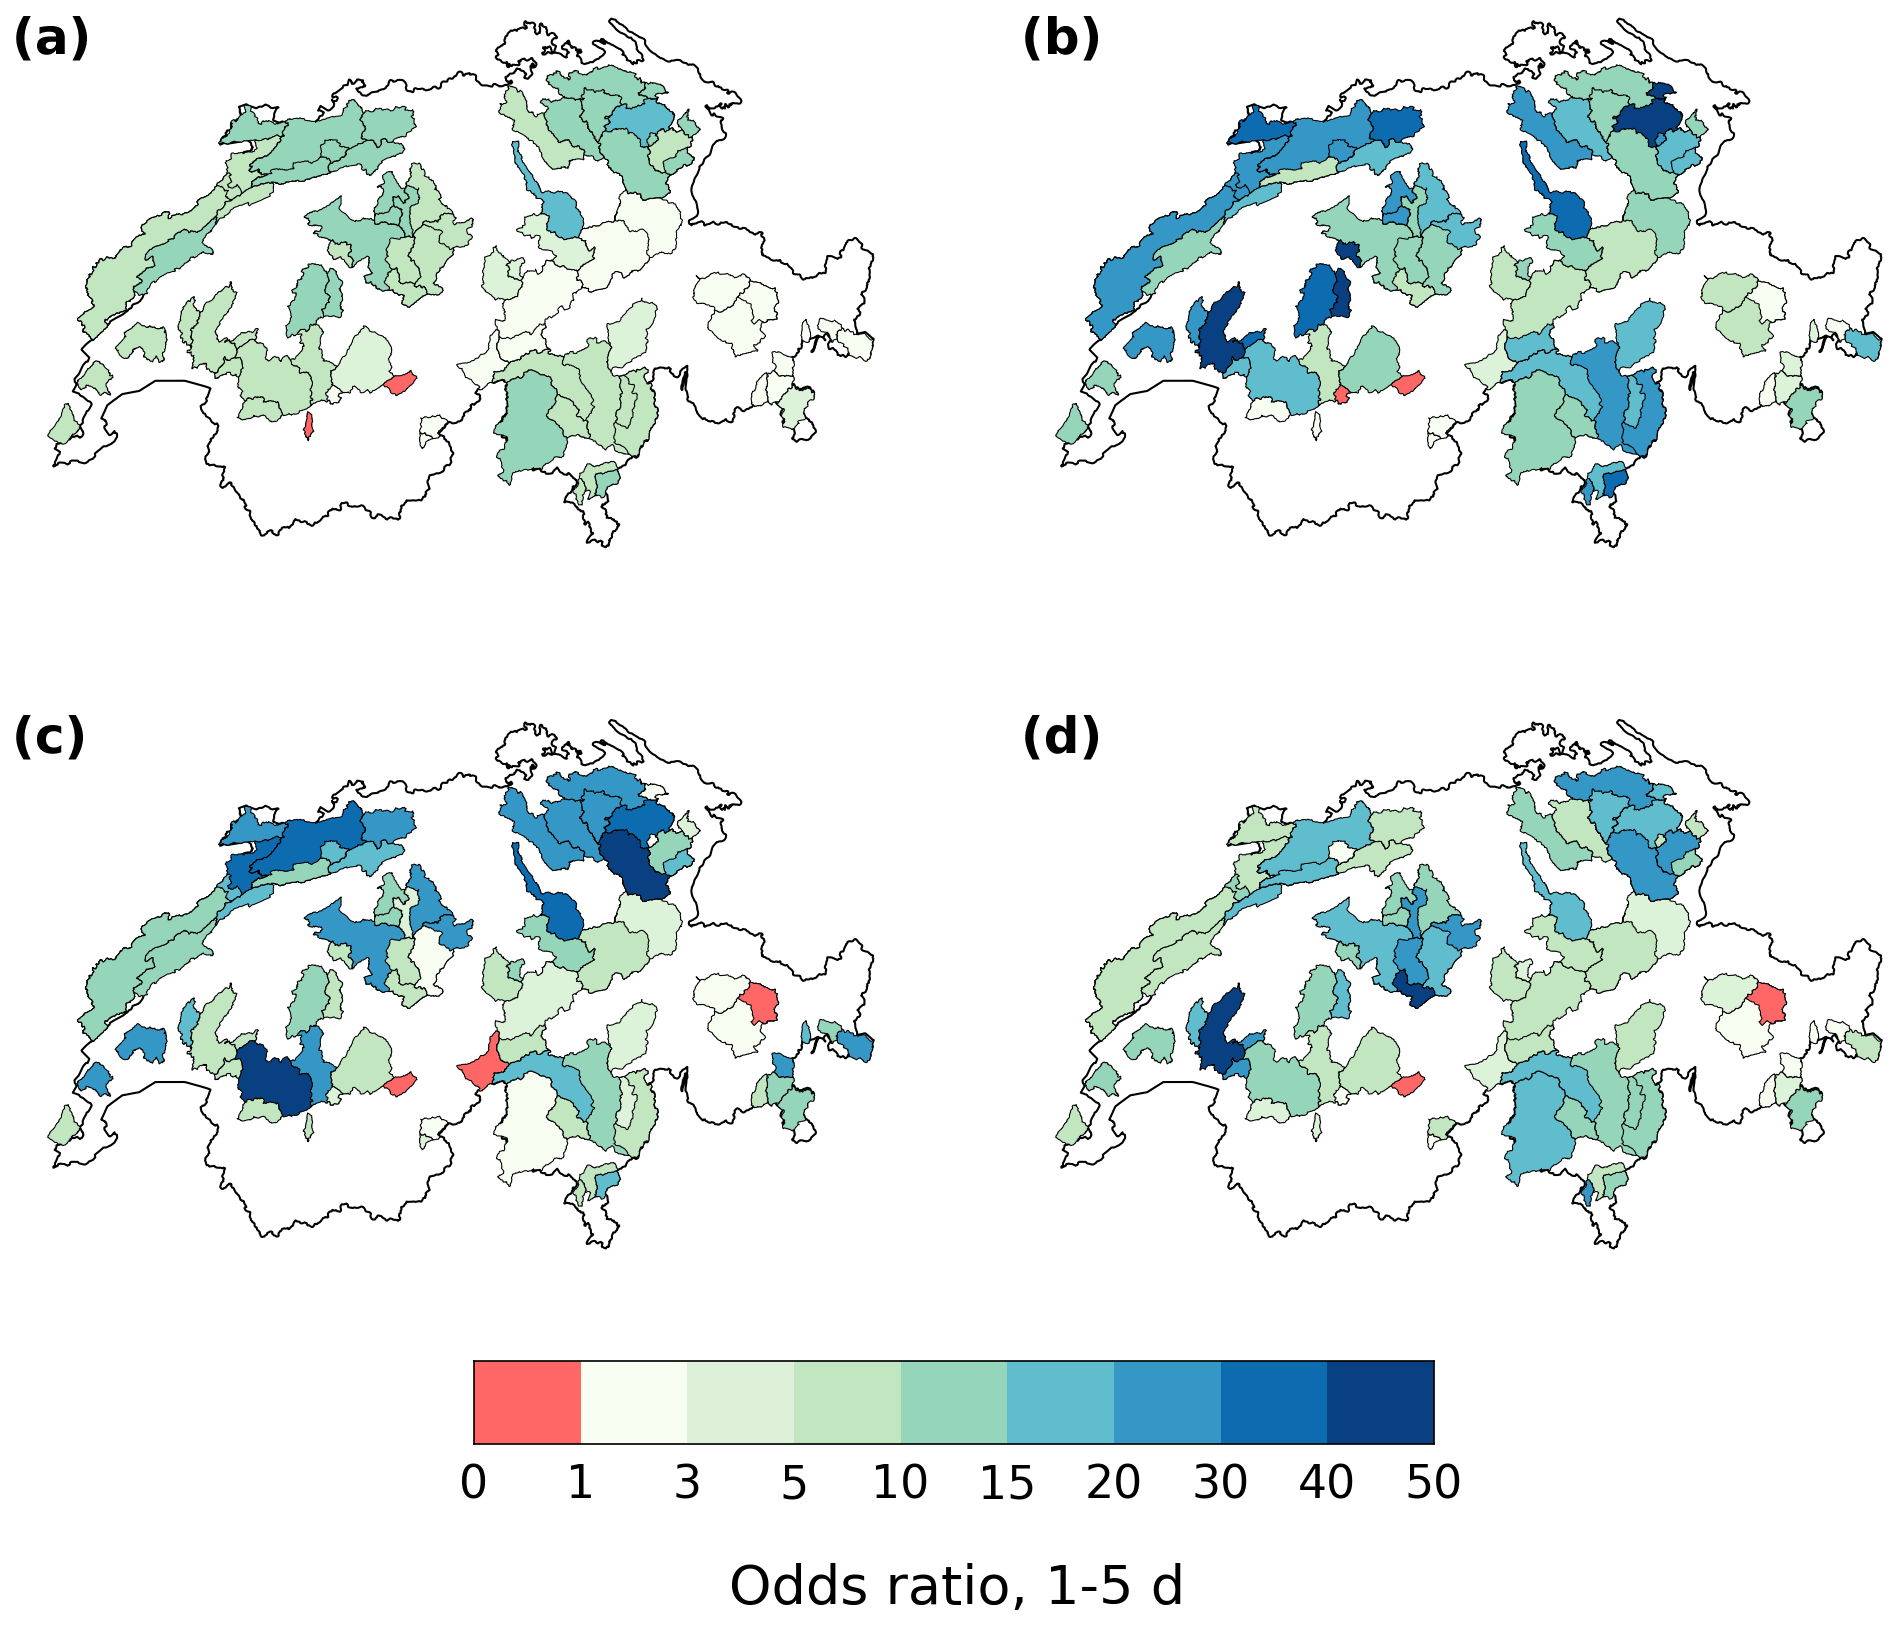
Figure A1Average high discharge odds ratio on days 1–5 following an extreme precipitation event, for (a) non-clustered, (b) 1-week clustered, (c) 2-week clustered and (d) 4-week clustered events, in the Swiss data.
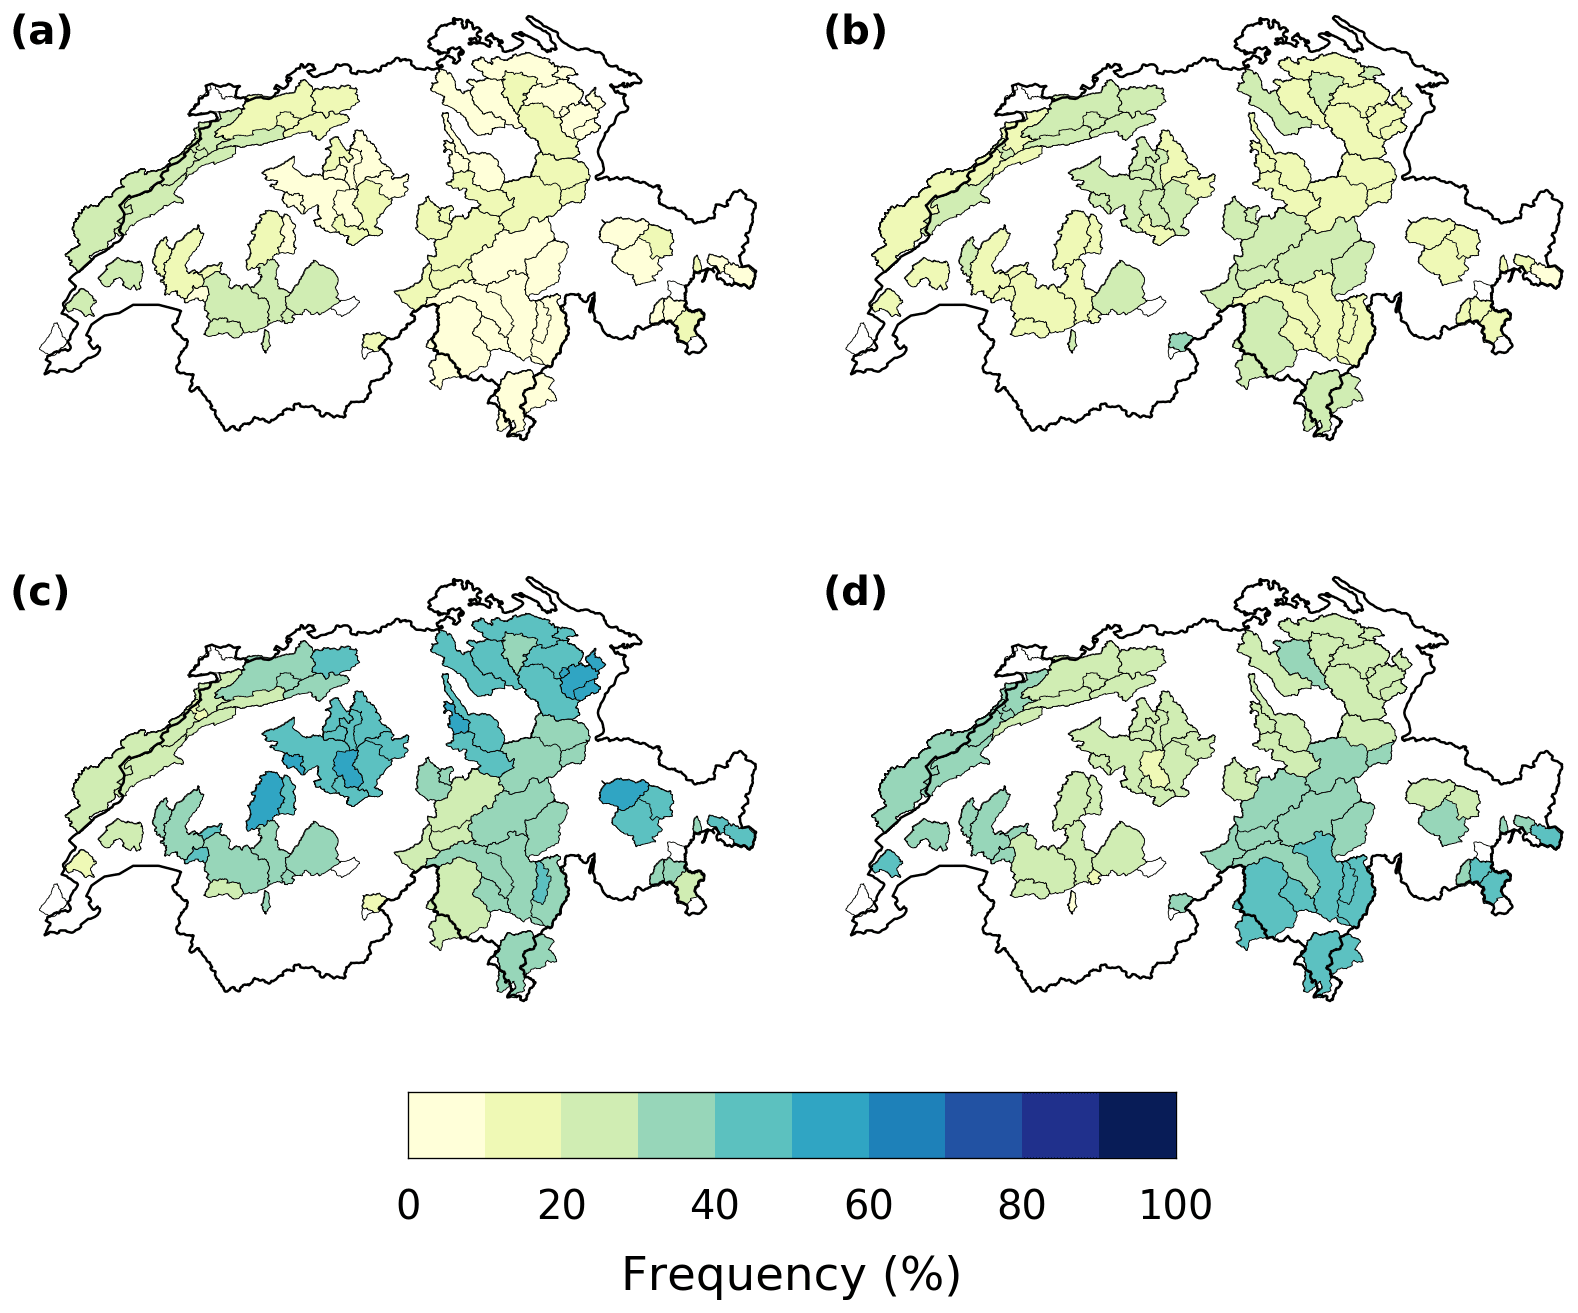
Figure A2Seasonal frequency of exceedance of the annual 99th daily precipitation percentile in Switzerland (RhiresD/FOEN data): (a) DJF, (b) MAM, (c) JJA and (d) SON.
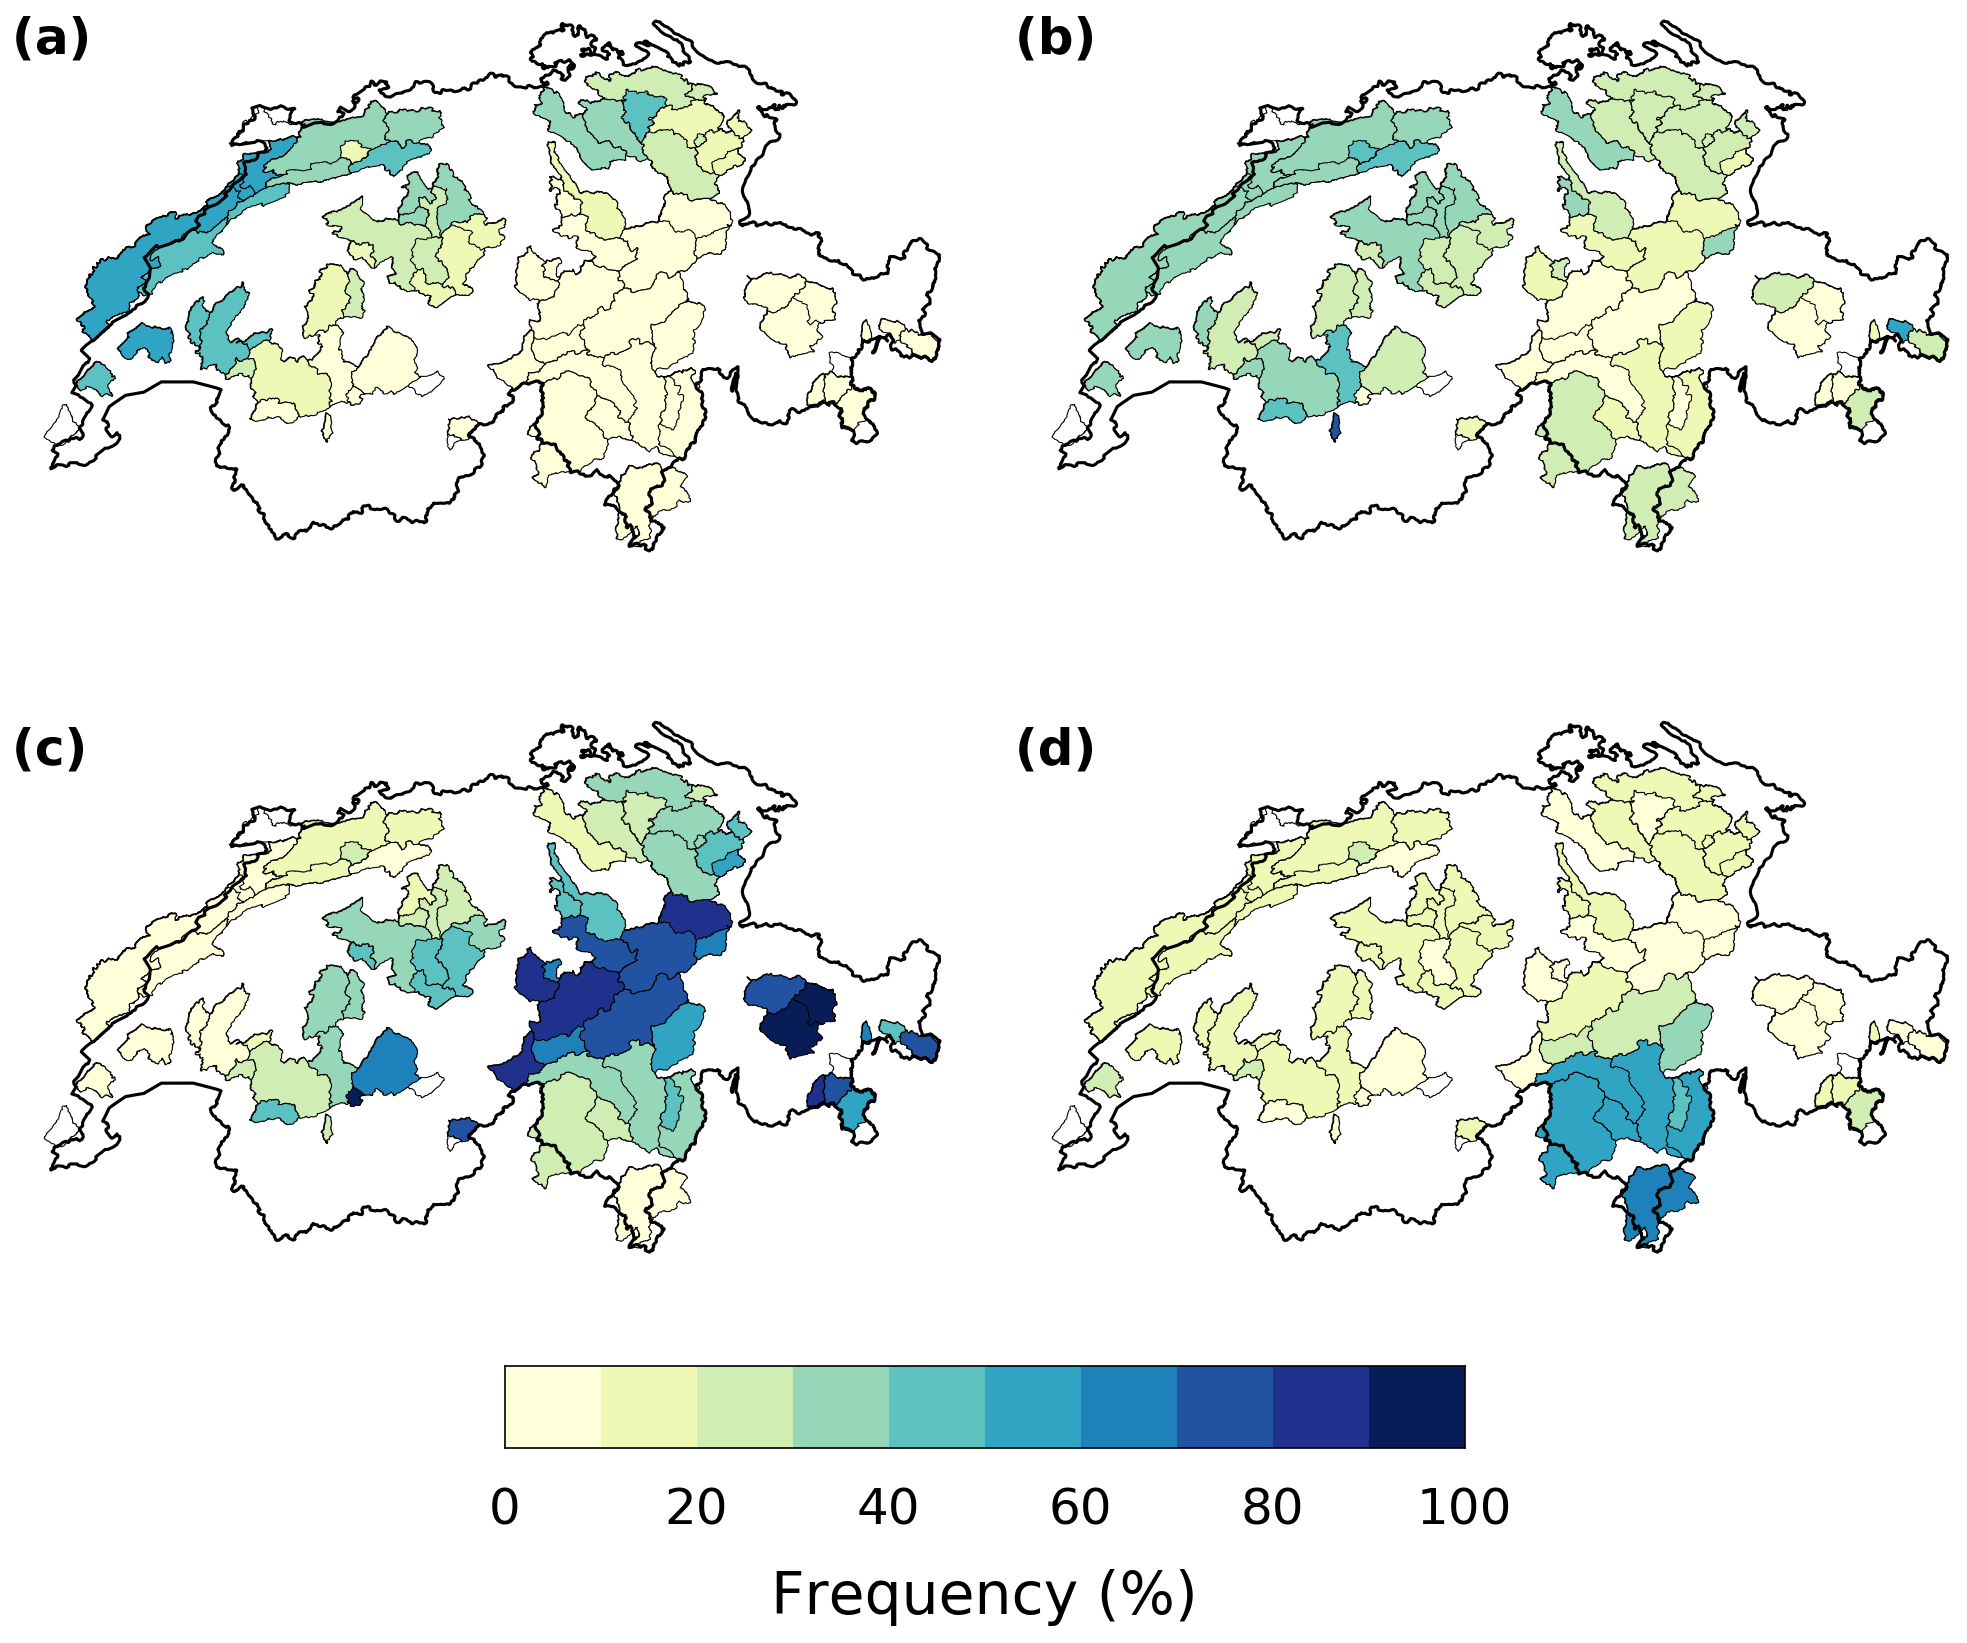
Figure A3Seasonal frequency of exceedance of the annual 95th daily discharge percentile in Swiss catchments: (a) DJF, (b) MAM, (c) JJA and (d) SON.
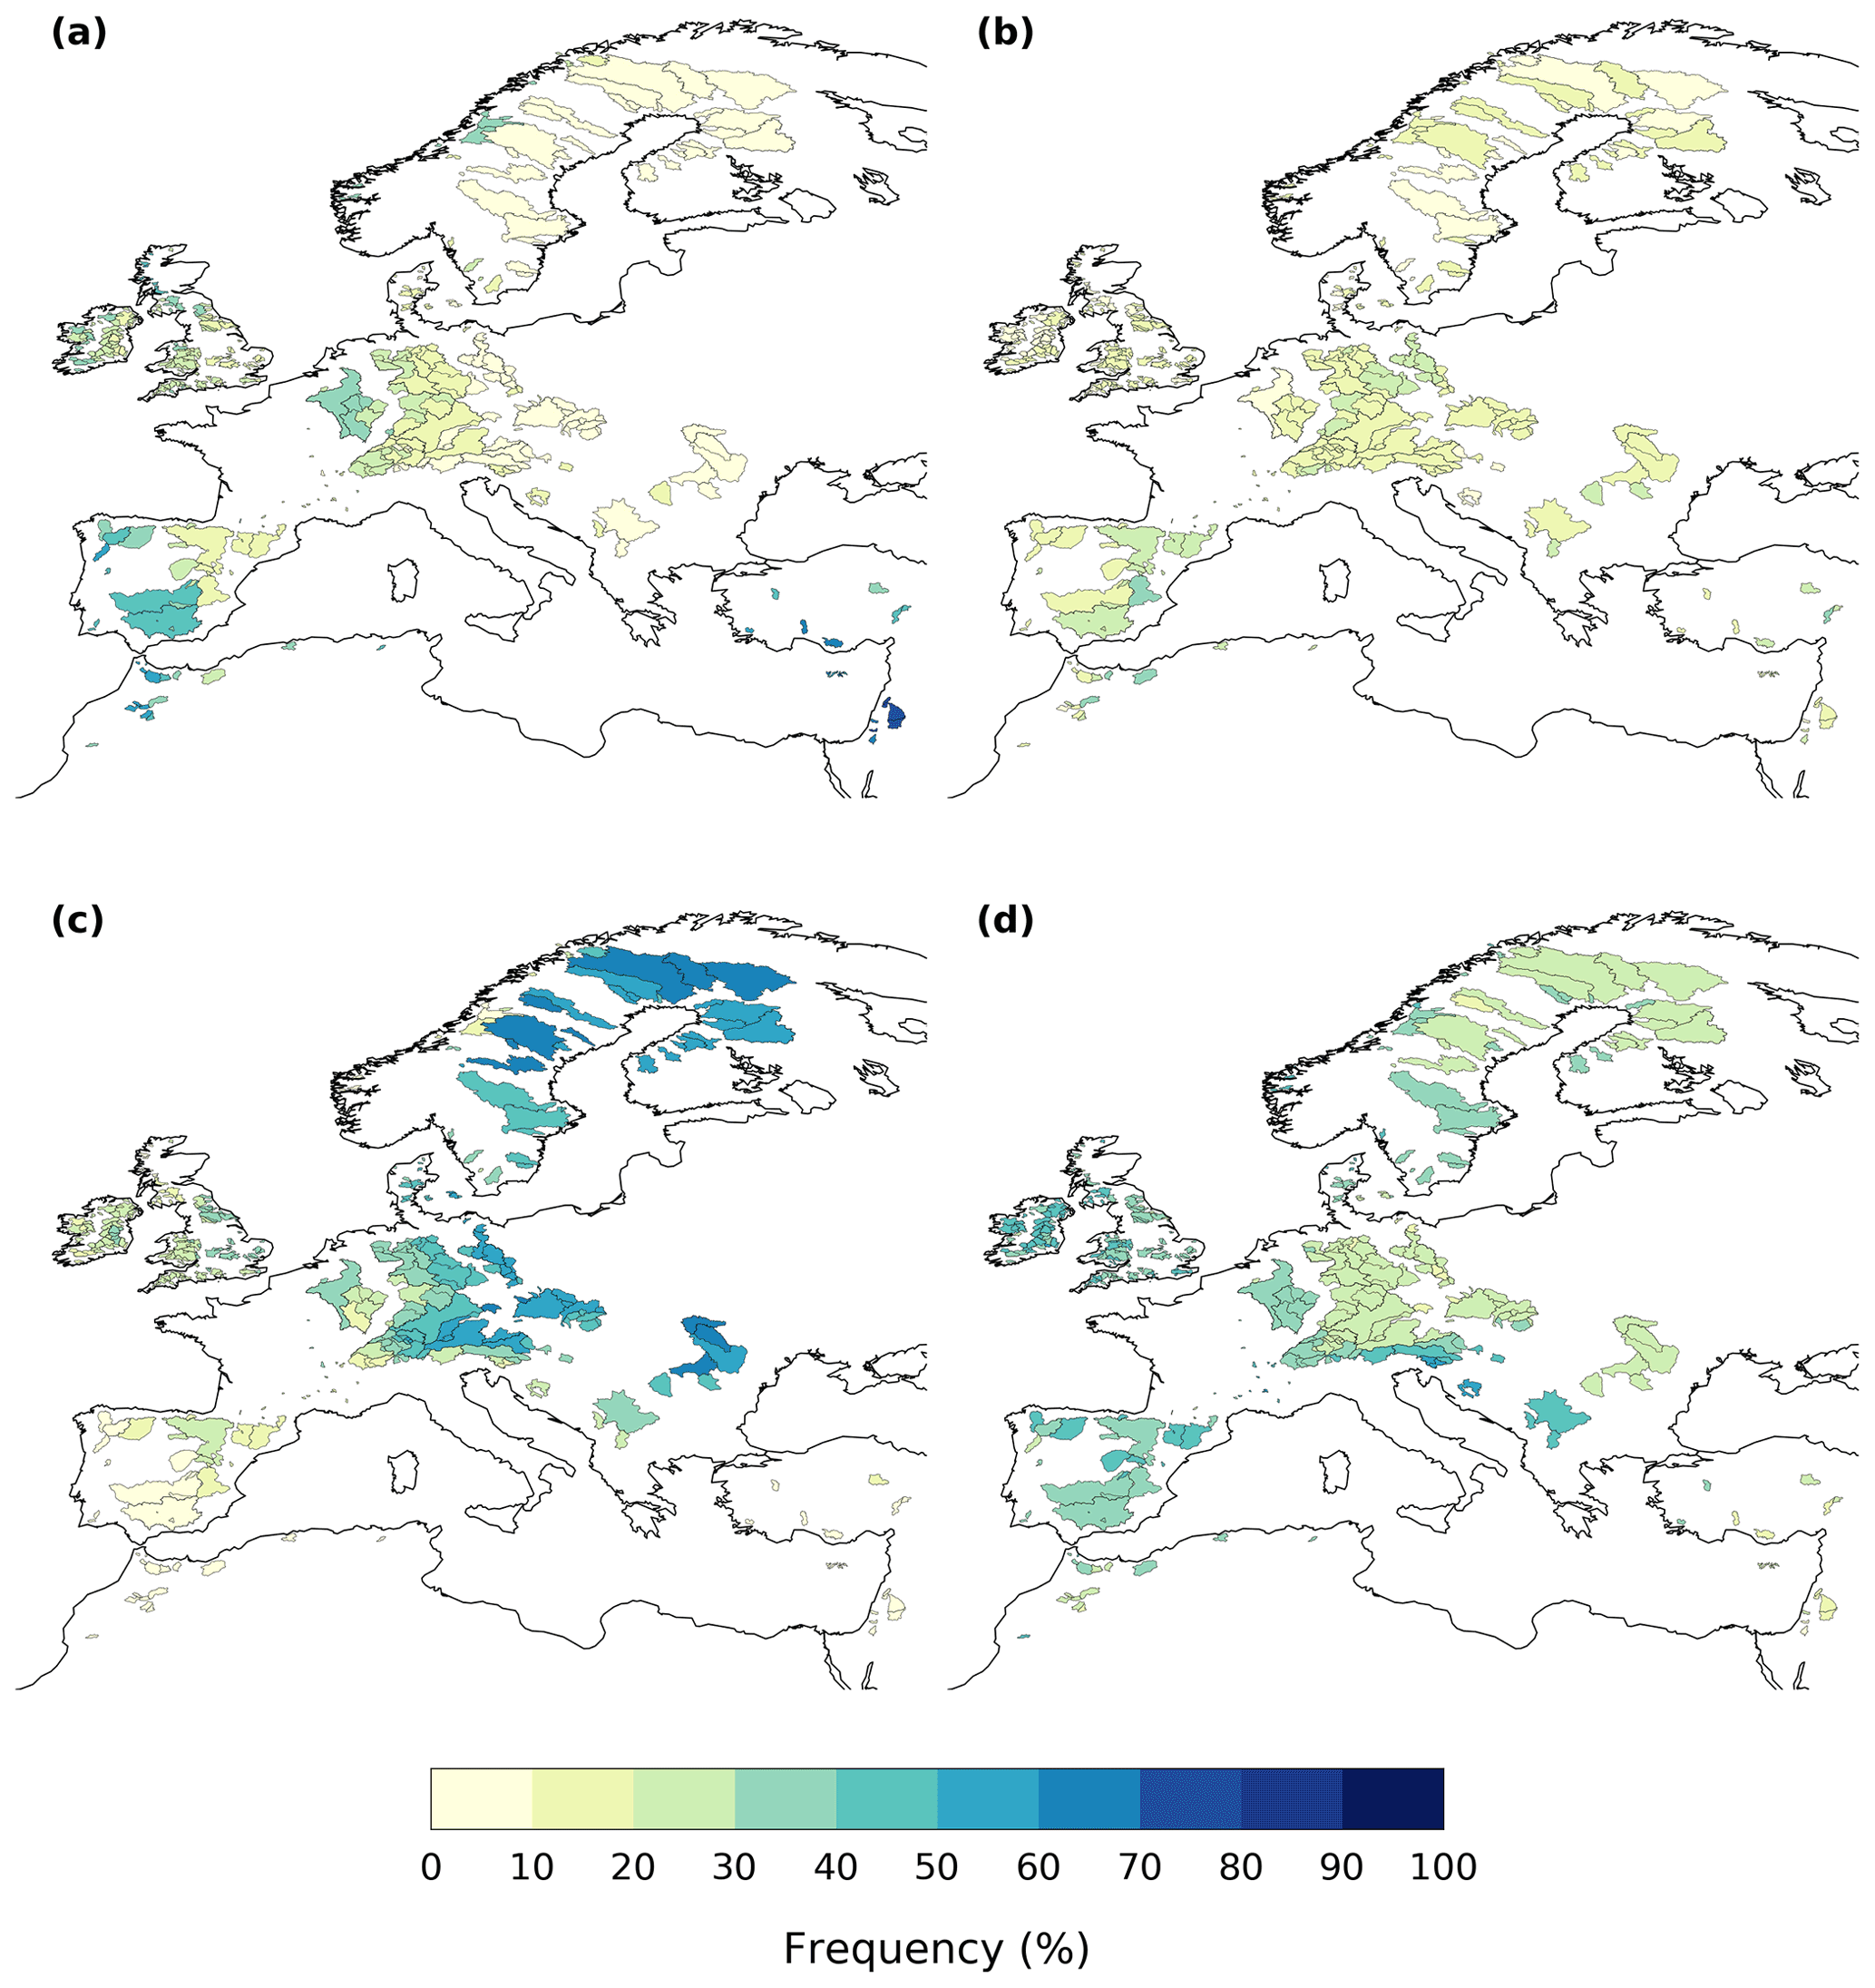
Figure A4Seasonal frequency of exceedance of the annual 99th daily precipitation percentile in Europe (EOBS/GRDC data): (a) DJF, (b) MAM, (c) JJA and (d) SON.
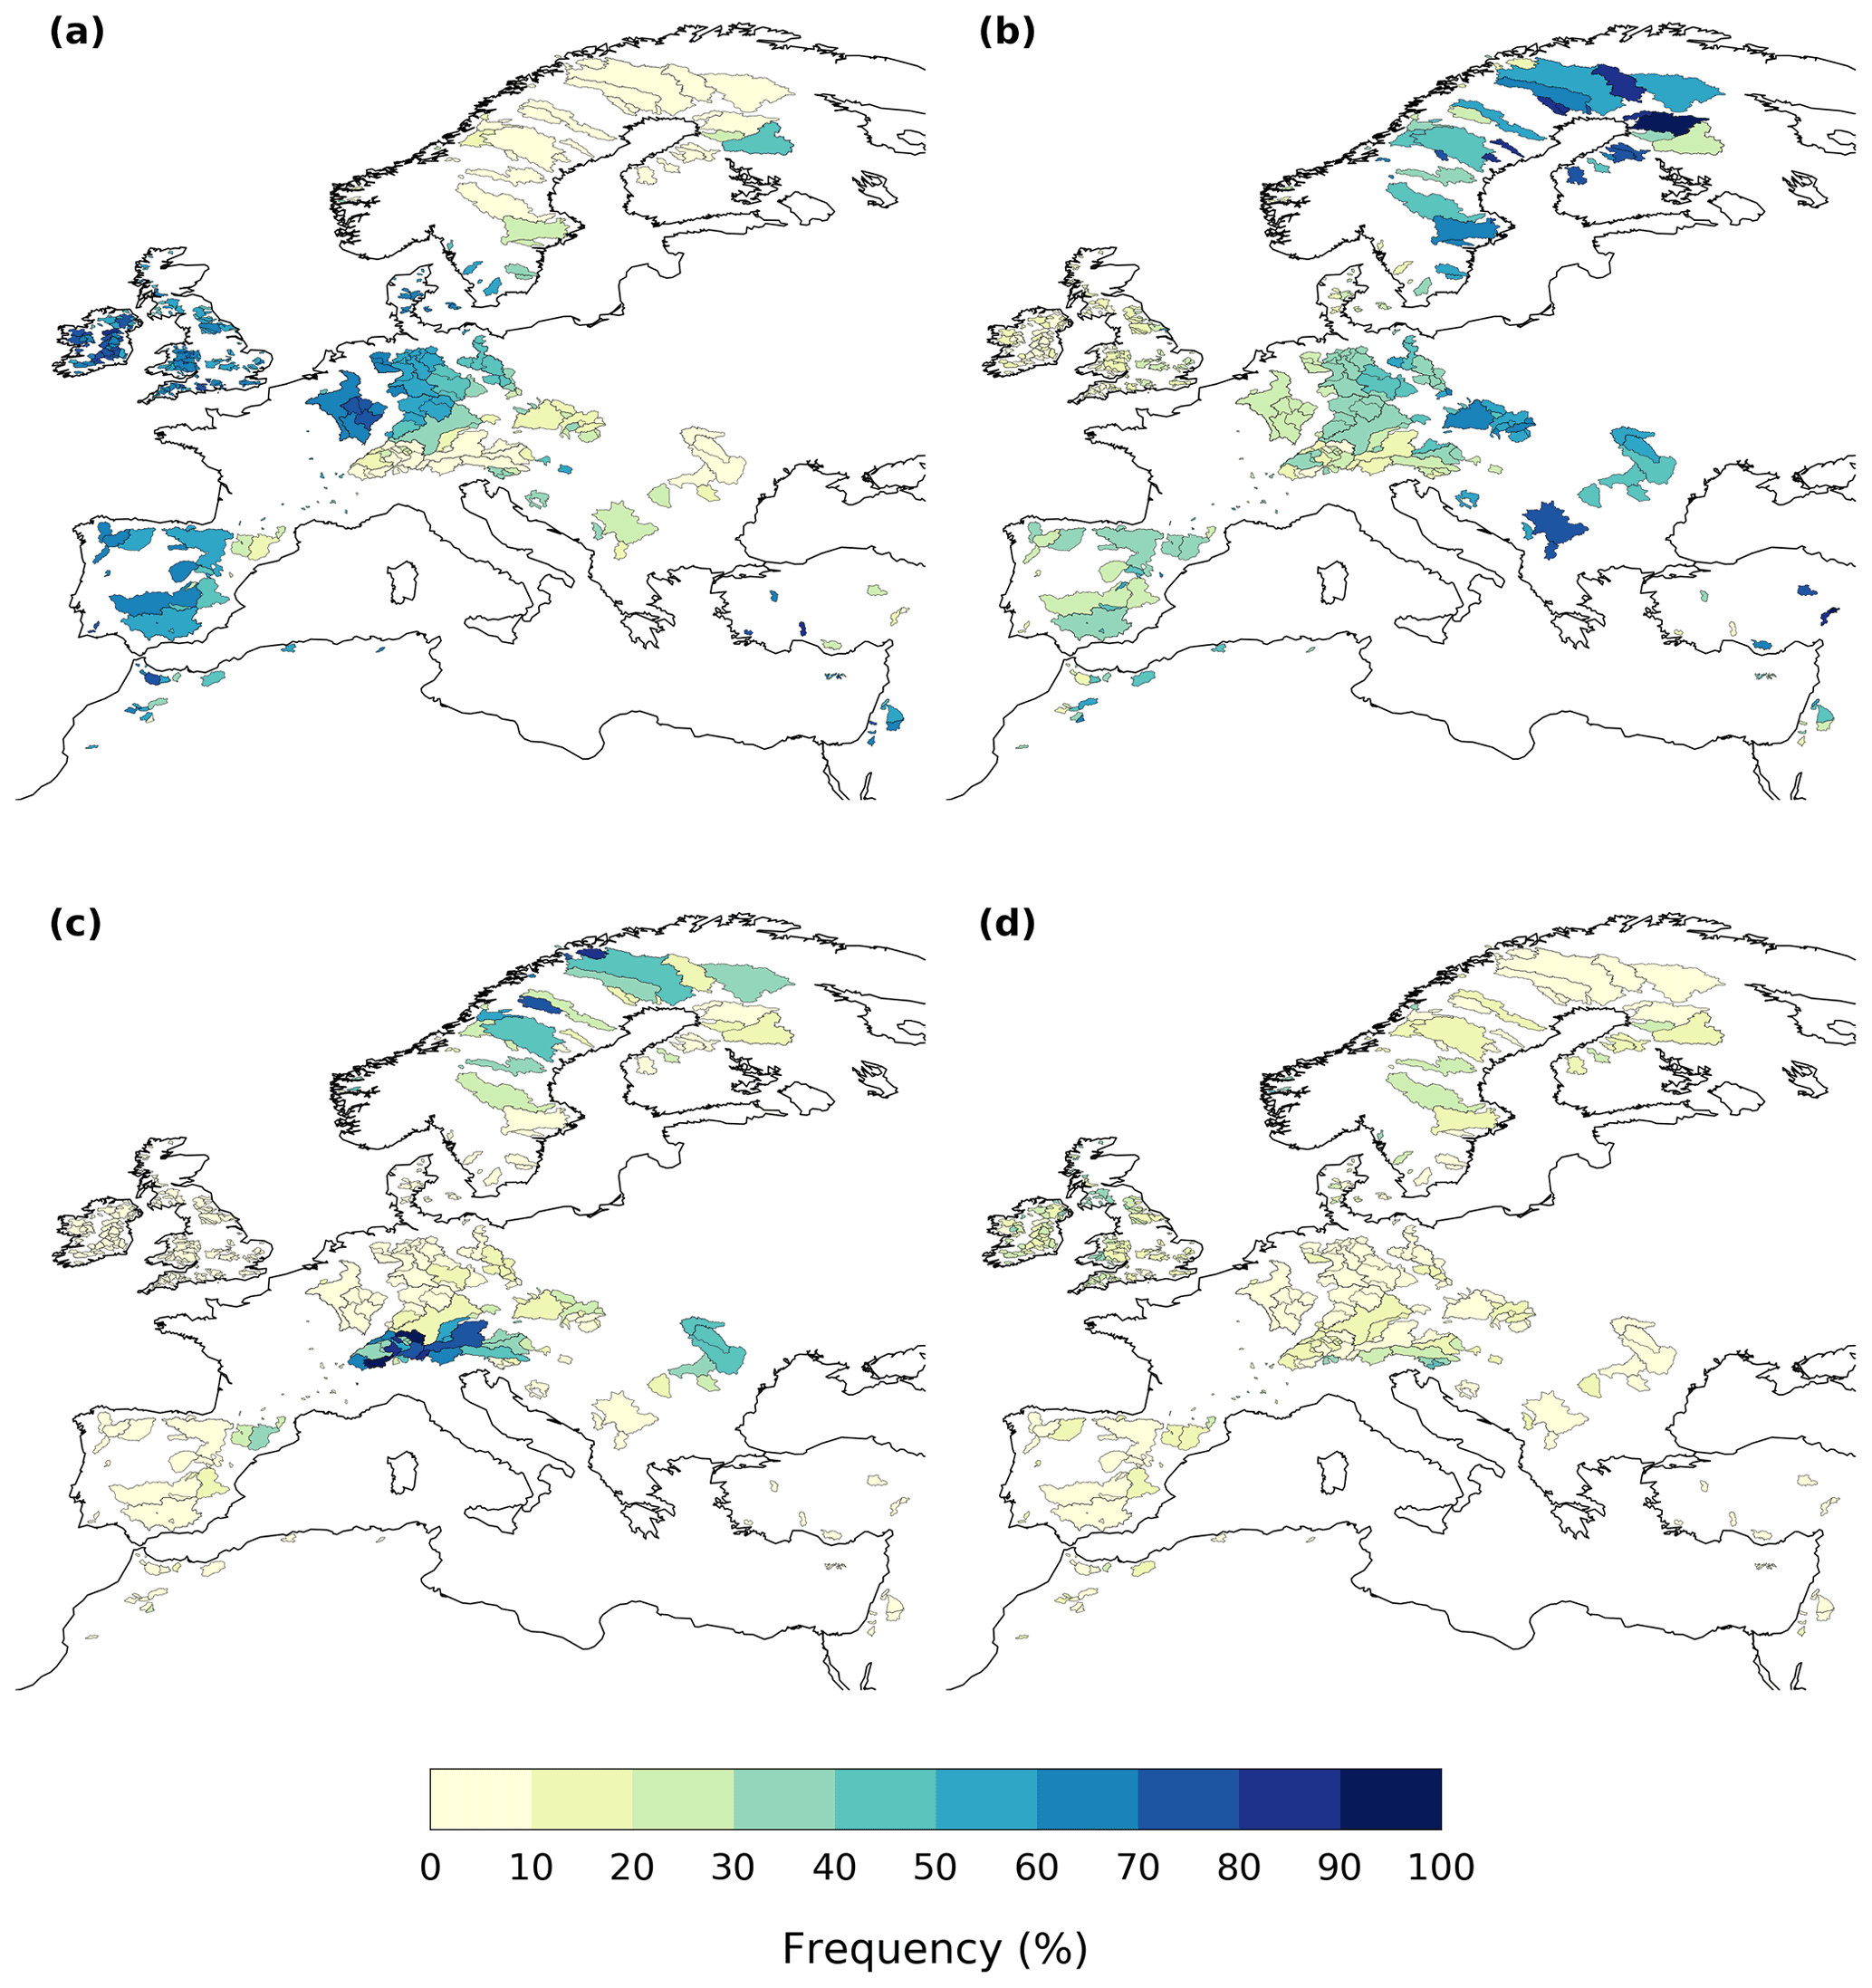
Figure A5Seasonal frequency of exceedance of the annual 95th daily discharge percentile in European catchments: (a) DJF, (b) MAM, (c) JJA and (d) SON.
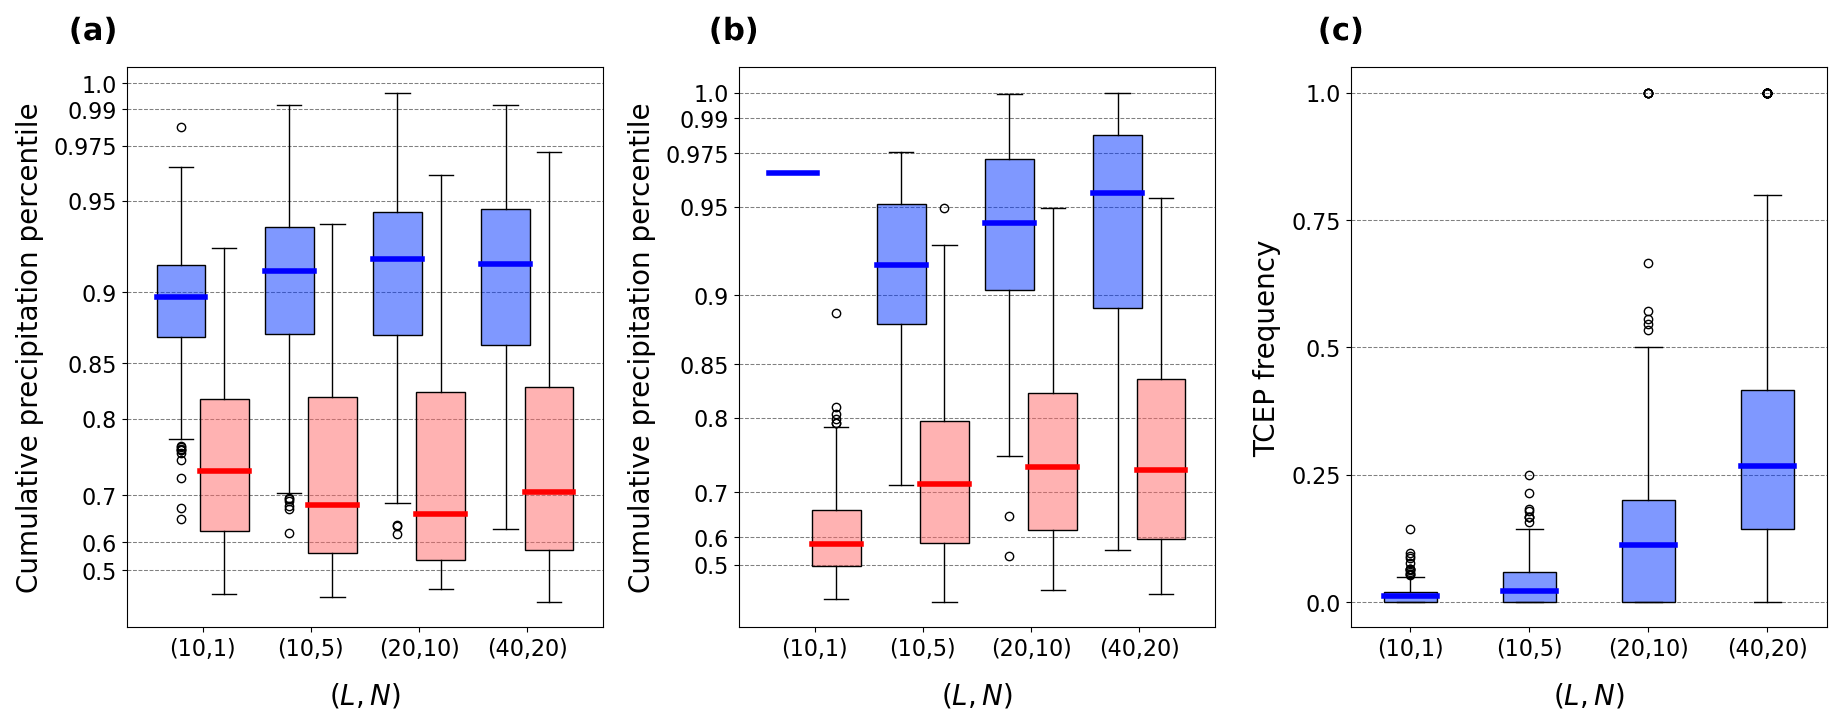
Figure A6(a) Average percentile of cumulative precipitation during days 0–2 before and (b) during persistent high discharge periods and (c) fraction of high discharge periods with two or more extreme precipitation events (TCEPs) between day 2 before to the end of the period, averaged by catchment for the European data. In panels (a–b), blue (red) shading indicates values that are (are not) statistically significant at a 10 % confidence level (see methods).
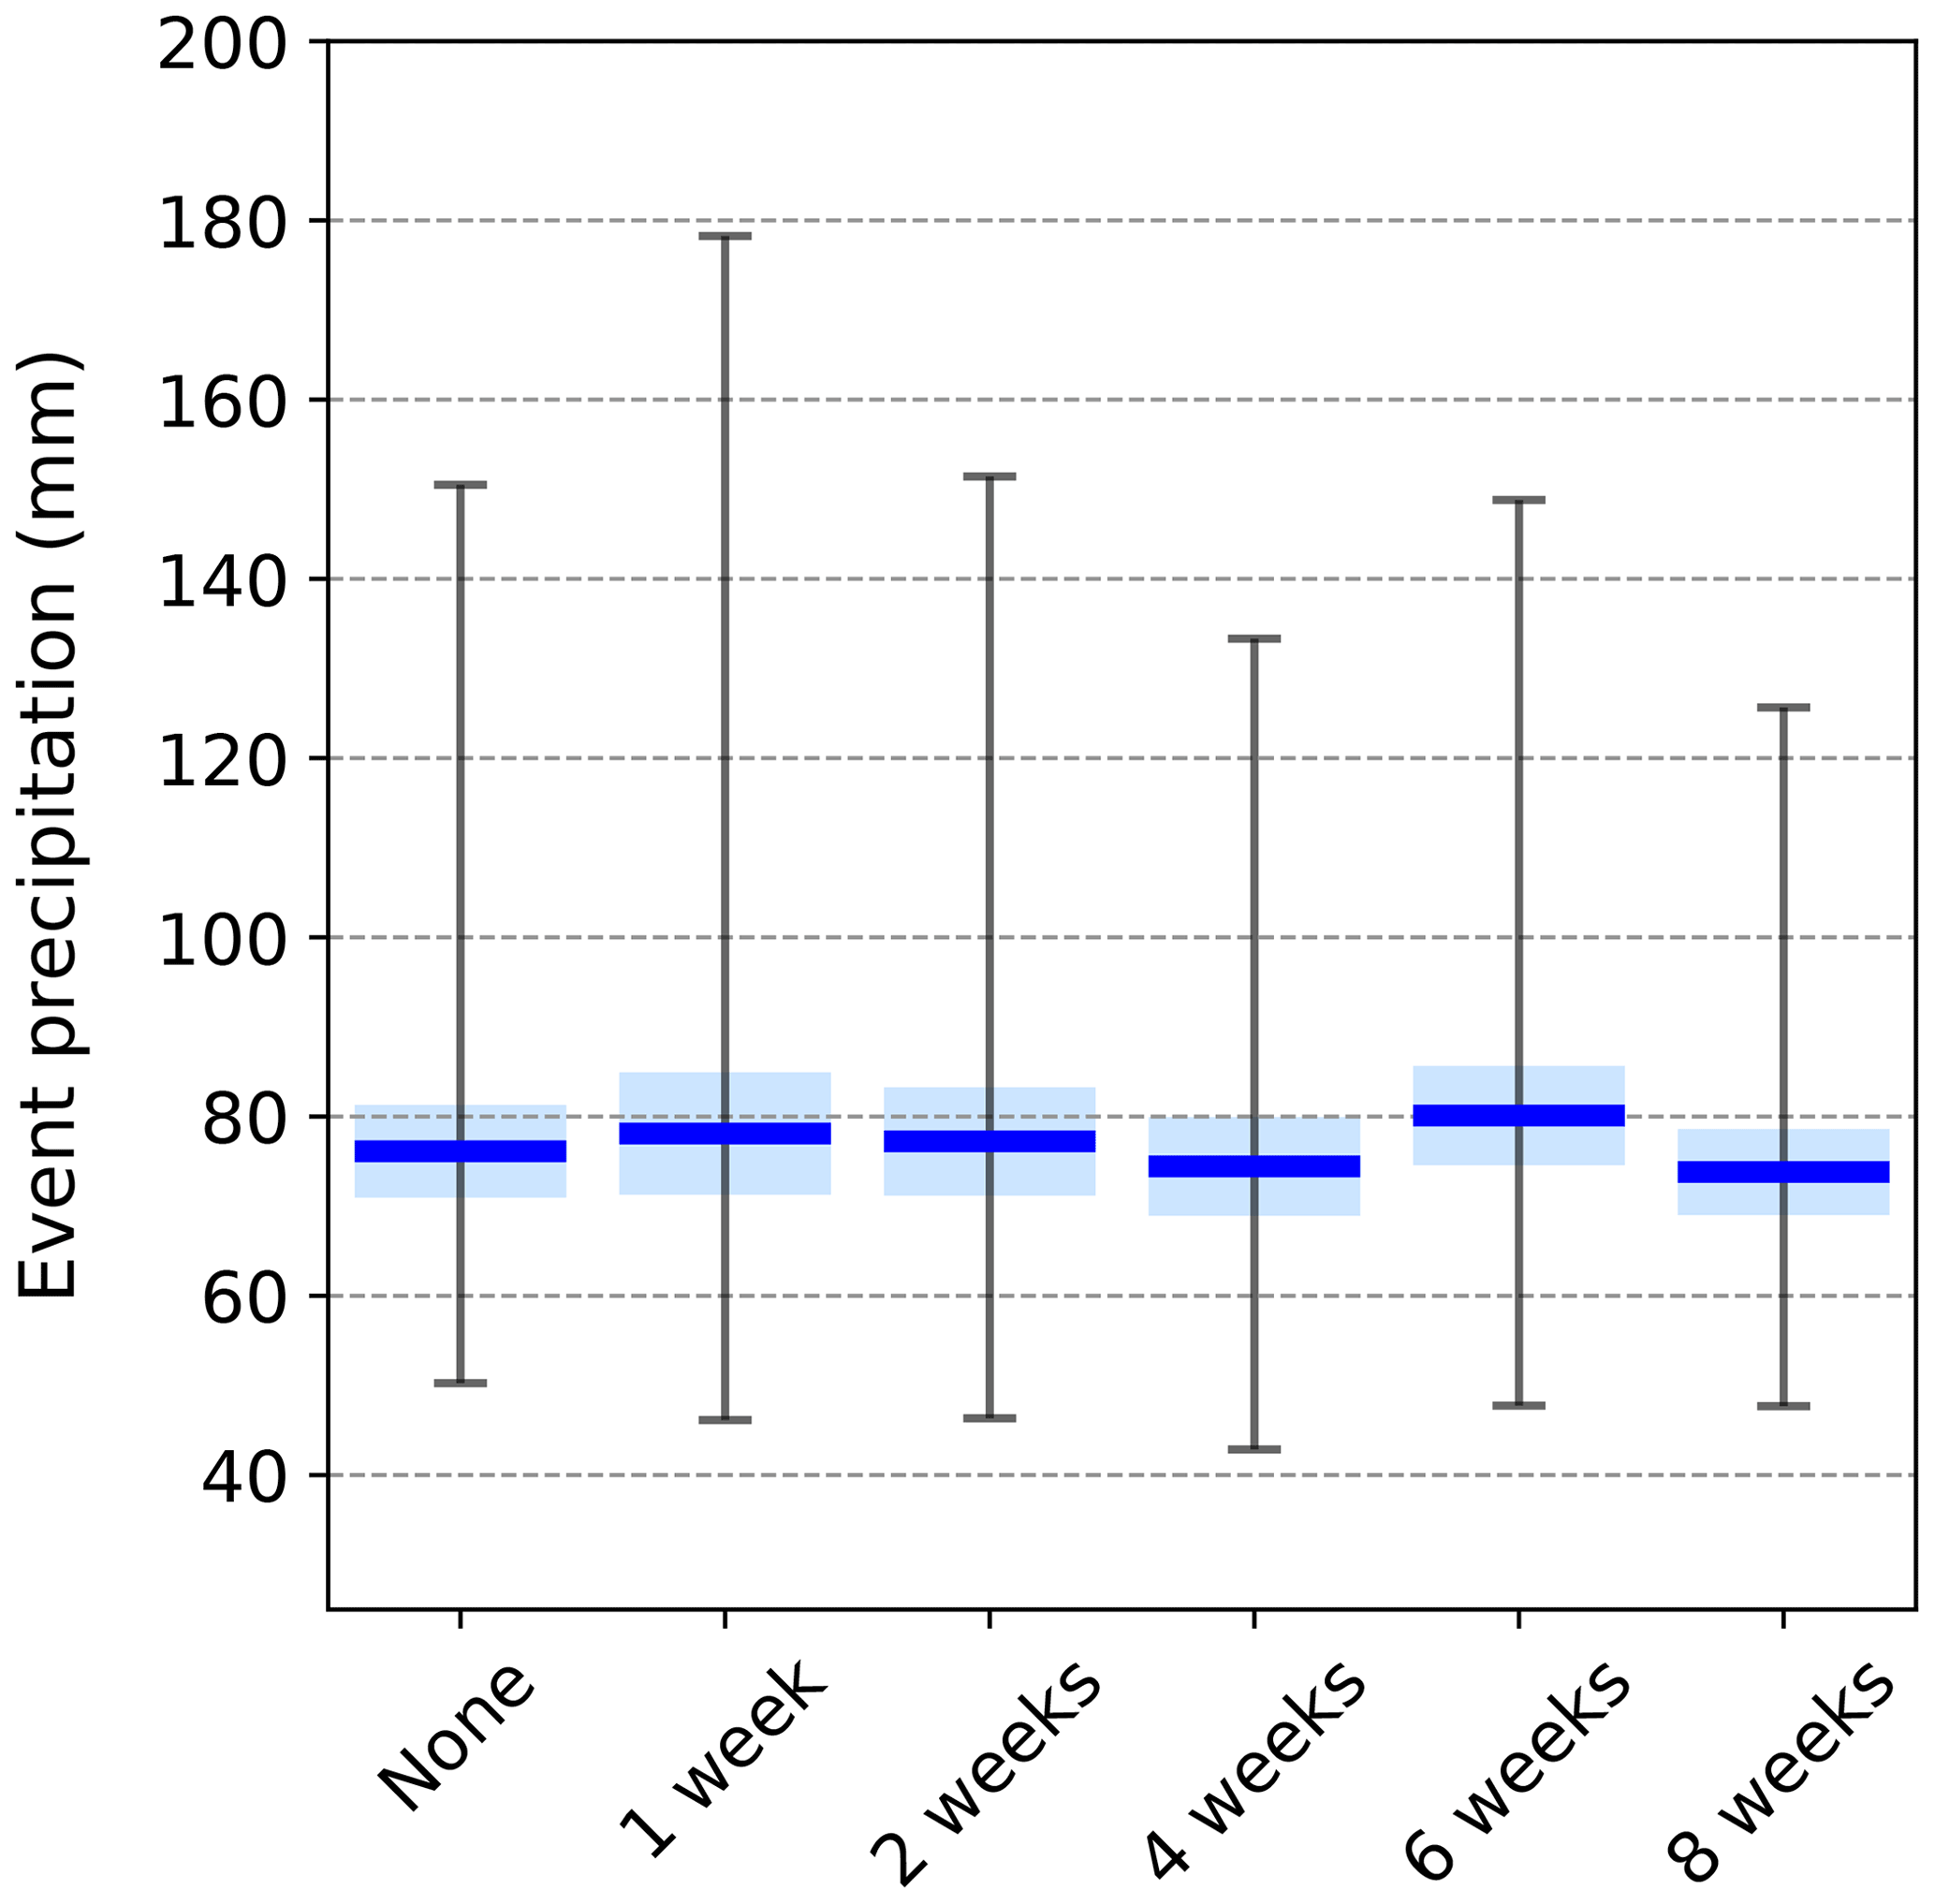
Figure A7Boxplot of extreme precipitation event magnitude (total precipitation from 1 d before to 1 d after the event) as a function of clustering category in the Swiss data.
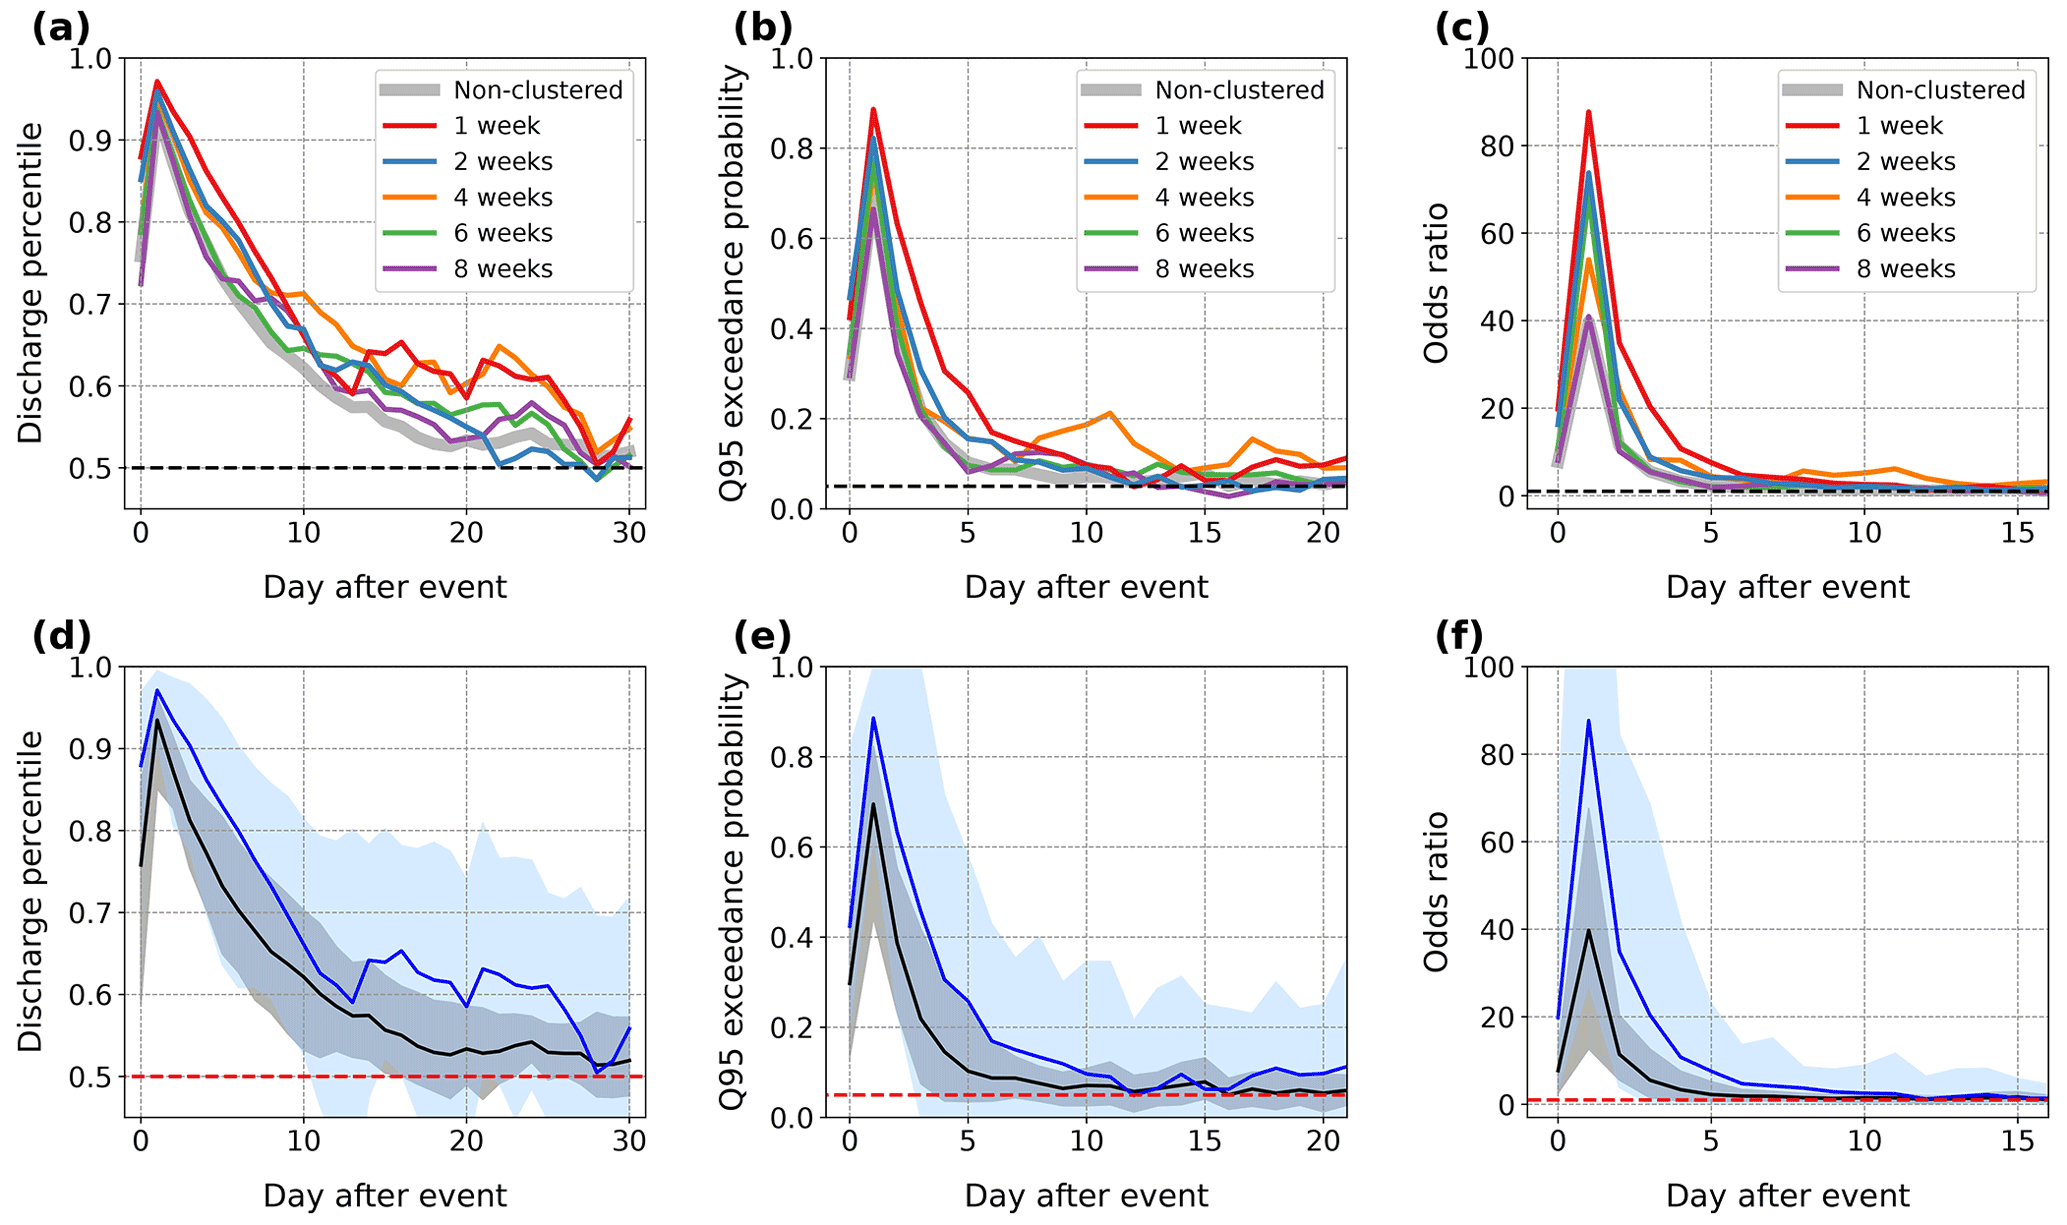
Figure A8Daily average (a) discharge percentile, (b) probability of high discharge (defined as the exceedance of the respective 95th daily discharge percentile) and (c) odds ratio of high discharge, averaged across Swiss catchments with a mean elevation of 1500 m or less, for the different clustering categories of extreme precipitation. Here the original discharge data (after removing the baseflow) were used. Black dashed lines indicate baseline values of 0.5 for discharge percentiles in (a), 0.05 for high discharge probability in (b) and 1 for odds ratios in (c). (d–f) Same as (a–c) but for the European data.
The R code to reproduce the results of this study is available at https://doi.org/10.5281/zenodo.6563559 (Tuel, 2021).
RhiresD is provided by MeteoSwiss, the Swiss Federal Office of Meteorology and Climatology. Switzerland discharge data were obtained from Switzerland's Federal Office for the Environment. The EOBS dataset (Haylock et al., 2008) can be downloaded from https://doi.org/10.24381/cds.151d3ec6 (ECMWF, 2022). We thank the Global Runoff Data Centre, 56068 Koblenz, Germany, for making available GRDC data at https://portal.grdc.bafg.de/ (Federal Institute of Hydrology, 2022). GTOPO30 data (https://doi.org/10.5066/F7DF6PQS) can be downloaded through the EarthExplorer at https://earthexplorer.usgs.gov/ (United States Geological Service, 2022).
AT designed the research, implemented the code, analysed the data and provided the figures. OM designed and supervised the research. BS and JZ both contributed to designing the research and to interpreting the results. All the authors discussed the results and contributed to the manuscript.
At least one of the (co-)authors is a member of the editorial board of Hydrology and Earth System Sciences. The peer-review process was guided by an independent editor, and the authors also have no other competing interests to declare.
Publisher's note: Copernicus Publications remains neutral with regard to jurisdictional claims in published maps and institutional affiliations.
The authors are grateful to the Swiss Federal Office of the Environment (FOEN) and Regula Mülchi for the Swiss river discharge data.
Olivia Martius was supported by the Swiss Science Foundation (grant no. 178751). Jakob Zscheischler was supported by the Swiss National Science Foundation (grant no. 179876) and the Helmholtz Initiative and Networking Fund (Young Investigator Group COMPOUNDX (grant no. VH-NG-1537)).
This paper was edited by Carlo De Michele and reviewed by three anonymous referees.
Ali, S. M., Martius, O., and Röthlisberger, M.: Recurrent Rossby Wave Packets Modulate the Persistence of Dry and Wet Spells Across the Globe, Geophys. Res. Lett., 48, e2020GL091452, https://doi.org/10.1029/2020GL091452, 2021. a
Aschwanden, H. and Weingartner, R.: Die Abflussregimes der Schweiz, Publikation Gewässerkunde, Geographisches Institut der Universität Bern, Bern, 65, 272 pp., https://doi.org/10.7892/boris.133660, 1985. a, b
Barton, Y., Giannakaki, P., von Waldow, H., Chevalier, C., Pfahl, S., and Martius, O.: Clustering of Regional-Scale Extreme Precipitation Events in Southern Switzerland, Mon. Weather Rev., 144, 347–369, https://doi.org/10.1175/MWR-D-15-0205.1, 2016. a, b, c, d, e
Berghuijs, W. R., Harrigan, S., Molnar, P., Slater, L. J., and Kirchner, J. W.: The Relative Importance of Different Flood-Generating Mechanisms Across Europe, Water Resour. Res., 55, 4582–4593, https://doi.org/10.1029/2019WR024841, 2019. a, b, c, d, e
Bevacqua, E., Zappa, G., and Shepherd, T. G.: Shorter cyclone clusters modulate changes in European wintertime precipitation extremes, Environ. Res. Lett., 15, 124005, https://doi.org/10.1088/1748-9326/abbde7, 2020. a
Bevacqua, E., De Michele, C., Manning, C., Couasnon, A., Ribeiro, A. F. S., Ramos, A. M., Vignotto, E., Bastos, A., Blesić, S., Durante, F., Hillier, J., Oliveira, S. C., Pinto, J. G., Ragno, E., Rivoire, P., Saunders, K., van der Wiel, K., Wu, W., Zhang, T., and Zscheischler, J.: Guidelines for studying diverse types of compound weather and climate events, Earth's Future, 9, e2021EF002340, https://doi.org/10.1029/2021EF002340, 2021a. a
Bevacqua, E., Shepherd, T. G., Watson, P. A., Sparrow, S., Wallom, D., and Mitchell, D.: Larger spatial footprint of wintertime total precipitation extremes in a warmer climate, Geophys. Res. Lett., 48, e2020GL091990, https://doi.org/10.1029/2020GL091990, 2021b. a
Blöschl, G., Hall, J., Parajka, J., Perdigão, R. A. P., Merz, B., Arheimer, B., Aronica, G. T., Bilibashi, A., Bonacci, O., Borga, M., Čanjevac, I., Castellarin, A., Chirico, G. B., Claps, P., Fiala, K., Frolova, N., Gorbachova, L., Gül, A., Hannaford, J., Harrigan, S., Kireeva, M., Kiss, A., Kjeldsen, T. R., Kohnová, S., Koskela, J. J., Ledvinka, O., Macdonald, N., Mavrova-Guirguinova, M., Mediero, L., Merz, R., Molnar, P., Montanari, A., Murphy, C., Osuch, M., Ovcharuk, V., Radevski, I., Rogger, M., Salinas, J. L., Sauquet, E., Šraj, M., Szolgay, J., Viglione, A., Volpi, E., Wilson, D., Zaimi, K., and Živković, N.: Changing climate shifts timing of European floods, Science, 357, 588–590, https://doi.org/10.1126/science.aan2506, 2017. a, b
Brunner, M. I., Melsen, L. A., Wood, A. W., Rakovec, O., Mizukami, N., Knoben, W. J. M., and Clark, M. P.: Flood spatial coherence, triggers, and performance in hydrological simulations: large-sample evaluation of four streamflow-calibrated models, Hydrol. Earth Syst. Sci., 25, 105–119, https://doi.org/10.5194/hess-25-105-2021, 2021. a
Carrillo, G., Troch, P. A., Sivapalan, M., Wagener, T., Harman, C., and Sawicz, K.: Catchment classification: hydrological analysis of catchment behavior through process-based modeling along a climate gradient, Hydrol. Earth Syst. Sci., 15, 3411–3430, https://doi.org/10.5194/hess-15-3411-2011, 2011. a
Coles, S.: An Introduction to Statistical Modeling of Extreme Values, Springer Series in Statistics, Springer London, London, https://doi.org/10.1007/978-1-4471-3675-0, 2001. a
Cullmann, J., Krauße, T., and Philipp, A.: Enhancing flood forecasting with the help of processed based calibration, Phys. Chem. Earth, 33, 1111–1116, https://doi.org/10.1016/j.pce.2008.03.001, 2008. a
Diezig, R. and Weingartner, R.: Hochwasserprozesstypen: Schlüssel zur Hochwasserabschätzung, Wasser und Abfall, 4, 18–26, 2007. a
Doswell, C. A., Brooks, H. E., and Maddox, R. A.: Flash Flood Forecasting: An Ingredients-Based Methodology, Weather Forecast., 11, 560–581, https://doi.org/10.1175/1520-0434(1996)011<0560:FFFAIB>2.0.CO;2, 1996. a
ECMWF: E-OBS daily gridded meteorological data for Europe from 1950 to present derived from in-situ observations, CDS [data set], doi10.24381/cds.151d3ec6, 2022. a
Federal Institute of Hydrology (BfG): Global Runoff Data Centre, https://portal.grdc.bafg.de/applications/public.html?publicuser=PublicUser#dataDownload/Subregions, last access: 19 May 2022. a
Frei, C. and Schär, C.: A precipitation climatology of the Alps from high-resolution rain-gauge observations, Int. J. Climatol., 18, 873–900, https://doi.org/10.1002/(SICI)1097-0088(19980630)18:8<873::AID-JOC255>3.0.CO;2-9, 1998. a
Froidevaux, P., Schwanbeck, J., Weingartner, R., Chevalier, C., and Martius, O.: Flood triggering in Switzerland: the role of daily to monthly preceding precipitation, Hydrol. Earth Syst. Sci., 19, 3903–3924, https://doi.org/10.5194/hess-19-3903-2015, 2015. a, b
Grams, C. M., Binder, H., Pfahl, S., Piaget, N., and Wernli, H.: Atmospheric processes triggering the central European floods in June 2013, Nat. Hazards Earth Syst. Sci., 14, 1691–1702, https://doi.org/10.5194/nhess-14-1691-2014, 2014. a, b
Guzzetti, F., Peruccacci, S., Rossi, M., and Stark, C. P.: Rainfall thresholds for the initiation of landslides in central and southern Europe, Meteorol. Atmos. Phys., 98, 239–267, https://doi.org/10.1007/s00703-007-0262-7, 2007. a
Haylock, M. R., Hofstra, N., Klein Tank, A. M. G., Klok, E. J., Jones, P. D., and New, M.: A European daily high-resolution gridded data set of surface temperature and precipitation for 1950–2006, J. Geophys. Res., 113, D20119, https://doi.org/10.1029/2008JD010201, 2008. a, b
Hegdahl, T. J., Engeland, K., Mueller, M., and Sillmann, J.: An Event-Based Approach to Explore Selected Present and Future Atmospheric River-Induced Floods in Western Norway, J. Hydrometeorol., 21, 2003–2021, https://doi.org/10.1175/JHM-D-19-0071.1, 2020. a
Helbling, A., Kan, C., and Vogt, S.: Dauerregen, Schauer oder Schmelze-welche Ereignisse lösen in der Schweiz die Jahreshochwasser aus?, Wasser Energie Luft, 98, 249–254, 2006. a, b
Keller, L., Rössler, O., Martius, O., and Weingartner, R.: Delineation of flood generating processes and their hydrological response, Hydrol. Process., 32, 228–240, https://doi.org/10.1002/hyp.11407, 2018. a, b
Khanal, S., Lutz, A. F., Immerzeel, W. W., Vries, H. d., Wanders, N., and Hurk, B. v. d.: The Impact of Meteorological and Hydrological Memory on Compound Peak Flows in the Rhine River Basin, Atmosphere, 10, 171, https://doi.org/10.3390/atmos10040171, 2019. a, b, c, d
Kopp, J., Rivoire, P., Ali, S. M., Barton, Y., and Martius, O.: A novel method to identify sub-seasonal clustering episodes of extreme precipitation events and their contributions to large accumulation periods, Hydrol. Earth Syst. Sci., 25, 5153–5174, https://doi.org/10.5194/hess-25-5153-2021, 2021. a, b
Kreienkamp, F., Philip, S. Y., Tradowsky, J. S., Kew, S. F., Lorenz, P., Arrighi, J., Belleflamme, A., Bettmann, T., Caluwaerts, S., Chan, S. C., Ciavarella, A., Cruz, L. D., de Vrie, H., Demuth, N., Ferrone, A., Fischer, E. M., Fowler, H. J., Goergen, K., Heinrich, D., Henrichs, Y., Lenderink, G., Kaspar, F., Nilson, E., Otto, F. E. L., Ragone, F., Seneviratne, S. I., Singh, R. K., Skålevåg, A., Termonia, P., Thalheimer, L., van Aalst, M., den Bergh, J. V., de Vyver, H. V., Vannitsem, S., van Oldenborgh, G. J., Schaeybroeck, B. V., Vautard, R., Vonk, D., and Wanders, N.: Rapid attribution of heavy rainfall events leading to the severe flooding in Western Europe during July 2021, Tech. rep., World Weather Attribution, https://www.worldweatherattribution.org/wp-content/uploads/Scientific-report-Western-Europe-floods-2021-attribution.pdf (last access: 19 May 2022), 2021. a
Mailier, P. J., Stephenson, D. B., Ferro, C. A. T., and Hodges, K. I.: Serial Clustering of Extratropical Cyclones, Mon. Weather Rev., 134, 2224–2240, https://doi.org/10.1175/MWR3160.1, 2006. a
Malard, A., Sinreich, M., and Jeannin, P.-Y.: A novel approach for estimating karst groundwater recharge in mountainous regions and its application in Switzerland, Hydrol. Process., 30, 2153–2166, https://doi.org/10.1002/hyp.10765, 2016. a, b
Merz, B., Blöschl, G., Vorogushyn, S., Dottori, F., Aerts, J. C. J. H., Bates, P., Bertola, M., Kemter, M., Kreibich, H., Lall, U., and Macdonald, E.: Causes, impacts and patterns of disastrous river floods, Nature Reviews Earth & Environment, 83, 976–980, https://doi.org/10.1038/s43017-021-00195-3, 2021. a
Merz, R. and Blöschl, G.: A process typology of regional floods, Water Resour. Res., 39, 1340, https://doi.org/10.1029/2002WR001952, 2003. a
Muelchi, R., Rössler, O., Schwanbeck, J., Weingartner, R., and Martius, O.: An ensemble of daily simulated runoff data (1981–2099) under climate change conditions for 93 catchments in Switzerland (Hydro-CH2018-Runoff ensemble), Geosci. Data J., 00, 1–12, https://doi.org/10.1002/gdj3.117, 2021. a
Nied, M., Pardowitz, T., Nissen, K., Ulbrich, U., Hundecha, Y., and Merz, B.: On the relationship between hydro-meteorological patterns and flood types, J. Hydrol., 519, 3249–3262, https://doi.org/10.1016/j.jhydrol.2014.09.089, 2014. a, b
Nied, M., Schröter, K., Lüdtke, S., Nguyen, V. D., and Merz, B.: What are the hydro-meteorological controls on flood characteristics?, J. Hydrol., 545, 310–326, https://doi.org/10.1016/j.jhydrol.2016.12.003, 2017. a, b, c
Panziera, L., Gabella, M., Zanini, S., Hering, A., Germann, U., and Berne, A.: A radar-based regional extreme rainfall analysis to derive the thresholds for a novel automatic alert system in Switzerland, Hydrol. Earth Syst. Sci., 20, 2317–2332, https://doi.org/10.5194/hess-20-2317-2016, 2016. a
Paschalis, A., Fatichi, S., Molnar, P., Rimkus, S., and Burlando, P.: On the effects of small scale space-time variability of rainfall on basin flood response, J. Hydrol., 514, 313–327, https://doi.org/10.1016/j.jhydrol.2014.04.014, 2014. a, b, c, d
Piaget, N.: Meteorological characterizations of extreme precipitation and floods in Switzerland, Doctoral thesis, ETH Zürich, https://doi.org/10.3929/ethz-a-010542049, 2015. a
Pinto, J. G., Bellenbaum, N., Karremann, M. K., and Della-Marta, P. M.: Serial clustering of extratropical cyclones over the North Atlantic and Europe under recent and future climate conditions, J. Geophys. Res.-Atmos., 118, 12476–12485, https://doi.org/10.1002/2013JD020564, 2013. a
Priestley, M. D. K., Pinto, J. G., Dacre, H. F., and Shaffrey, L. C.: The role of cyclone clustering during the stormy winter of 2013/2014, Weather, 72, 187–192, https://doi.org/10.1002/wea.3025, 2017. a, b
Rodriguez-Iturbe, I. and Eagleson, P. S.: Mathematical models of rainstorm events in space and time, Water Resour. Res., 23, 181–190, https://doi.org/10.1029/WR023i001p00181, 1987. a
Seneviratne, S. I., Koster, R. D., Guo, Z., Dirmeyer, P. A., Kowalczyk, E., Lawrence, D., Liu, P., Mocko, D., Lu, C.-H., Oleson, K. W., and Verseghy, D.: Soil Moisture Memory in AGCM Simulations: Analysis of Global Land-Atmosphere Coupling Experiment (GLACE) Data, J. Hydrometeorol., 7, 1090–1112, https://doi.org/10.1175/JHM533.1, 2006. a
Sillmann, J., Shepherd, T. G., van den Hurk, B., Hazeleger, W., Martius, O., Slingo, J., and Zscheischler, J.: Event-Based Storylines to Address Climate Risk, Earth's Future, 9, e2020EF001783, https://doi.org/10.1029/2020EF001783, 2021. a
Tuel, A.: Temporal clustering of precipitation extremes and streamflow, Zenodo [code], https://doi.org/10.5281/zenodo.6563559, 2021. a
Tuel, A. and Martius, O.: A global perspective on the sub-seasonal clustering of precipitation extremes, Weather and Climate Extremes, 33, 100348, https://doi.org/10.1016/j.wace.2021.100348, 2021a. a, b, c, d, e
Tuel, A. and Martius, O.: A climatology of sub-seasonal temporal clustering of extreme precipitation in Switzerland and its links to extreme discharge, Nat. Hazards Earth Syst. Sci., 21, 2949–2972, https://doi.org/10.5194/nhess-21-2949-2021, 2021b. a, b, c, d, e, f, g, h, i, j, k, l, m
Umbricht, A., Fukutome, S., Liniger, M. A., Frei, C., and Appenzeller, C.: Seasonal variation of daily extreme precipitation in Switzerland, Tech. rep., MeteoSwiss, 97, 122, https://www.meteoschweiz.admin.ch/home/service-und-publikationen/publikationen.subpage.html/de/data/publications/2013/6/seasonal-variation-of-daily-extreme-precipitation-in-switzerland.html (last access: 19 May 2022), 2013. a
United States Geological Service (USGS): USGS Earth Explorer, https://earthexplorer.usgs.gov/, last access: 19 May 2022. a
Viglione, A., Chirico, G. B., Woods, R., and Blöschl, G.: Generalised synthesis of space-time variability in flood response: An analytical framework, J. Hydrol., 394, 198–212, https://doi.org/10.1016/j.jhydrol.2010.05.047, 2010. a
Vitolo, R., Stephenson, D. B., Cook, I. M., and Mitchell-Wallace, K.: Serial clustering of intense European storms, Meteorol. Z., 18, 411–424, https://doi.org/10.1127/0941-2948/2009/0393, 2009. a
White, W. B.: Karst hydrology: recent developments and open questions, Eng. Geol., 65, 85–105, https://doi.org/10.1016/S0013-7952(01)00116-8, 2002. a
Wilks, D.: Statistical Methods in the Atmospheric Sciences, 4th edn., Elsevier, https://doi.org/10.1016/C2017-0-03921-6, 2019. a
Woods, R. and Sivapalan, M.: A synthesis of space-time variability in storm response: Rainfall, runoff generation, and routing, Water Resour. Res., 35, 2469–2485, https://doi.org/10.1029/1999WR900014, 1999. a
Wu, W. and Dickinson, R. E.: Time Scales of Layered Soil Moisture Memory in the Context of Land-Atmosphere Interaction, J. Climate, 17, 2752–2764, https://doi.org/10.1175/1520-0442(2004)017<2752:TSOLSM>2.0.CO;2, 2004. a
Yang, Z. and Villarini, G.: Examining the capability of reanalyses in capturing the temporal clustering of heavy precipitation across Europe, Clim. Dynam., 53, 1845–1857, https://doi.org/10.1007/s00382-019-04742-z, 2019. a, b
Zhu, Z., Wright, D. B., and Yu, G.: The Impact of Rainfall Space-Time Structure in Flood Frequency Analysis, Water Resour. Res., 54, 8983–8998, https://doi.org/10.1029/2018WR023550, 2018. a
Zscheischler, J., Michalak, A. M., Schwalm, C., Mahecha, M. D., Huntzinger, D. N., Reichstein, M., Berthier, G., Ciais, P., Cook, R. B., El-Masri, B., Huang, M., Ito, A., Jain, A., King, A., Lei, H., Lu, C., Mao, J., Peng, S., Poulter, B., Ricciuto, D., Shi, X., Tao, B., Tian, H., Viovy, N., Wang, W., Wei, Y., Yang, J., and Zeng, N.: Impact of large-scale climate extremes on biospheric carbon fluxes: An intercomparison based on MsTMIP data, Global Biogeochem. Cy., 28, 585–600, https://doi.org/10.1002/2014GB004826, 2014. a
Zscheischler, J., Martius, O., Westra, S., Bevacqua, E., Raymond, C., Horton, R. M., van den Hurk, B., AghaKouchak, A., Jézéquel, A., Mahecha, M. D., Maraun, D., Ramos, A. M., Ridder, N. N., Thiery, W., and Vignotto, E.: A typology of compound weather and climate events, Nature Reviews Earth & Environment, 1, 333–347, https://doi.org/10.1038/s43017-020-0060-z, 2020. a