the Creative Commons Attribution 4.0 License.
the Creative Commons Attribution 4.0 License.
 | 12 May 2022
Flood generation: process patterns from the raindrop to the ocean
Günter Blöschl
This article reviews river flood generation processes and flow paths across space scales. The scale steps include the pore, profile, hillslope, catchment, regional and continental scales, representing a scale range of a total of 10 orders of magnitude. Although the processes differ between the scales, there are notable similarities. At all scales, there are media patterns that control the flow of water and are themselves influenced by the flow of water. The processes are therefore not spatially random (as in thermodynamics) but organized, and preferential flow is the rule rather than the exception. Hydrological connectivity, i.e. the presence of coherent flow paths, is an essential characteristic at all scales. There are similar controls on water flow and thus on flood generation at all scales but with different relative magnitudes. Processes at lower scales affect flood generation at larger scales, not simply as a multiple repetition of pore-scale processes but through interactions which cause emergent behaviour of process patterns. For this reason, when modelling these processes, the scale transitions need to be simplified in a way that reflects the relevant structures (e.g. connectivity) and boundary conditions (e.g. groundwater table) at each scale. In conclusion, it is argued that upscaling as the mere multiple application of small-scale process descriptions will not capture the larger-scale patterns of flood generation. Instead, there is a need to learn from observed patterns of flood generation processes at all spatial scales.


The importance of research on flood generation processes cannot be overestimated. Numerous recent floods in the last years in Europe and worldwide have highlighted that floods continue to be one of the most serious threats to humankind (Merz et al., 2021). Major recent events include the July 2021 flood in Germany with more than 200 fatalities and a flood at the same time in China's Henan province with more than 300 fatalities; the July 2020 flood in Bangladesh where the monsoon season was one of the worst on record; the more local June 2016 flood in Simbach, Bavaria; and the June 2013 flood in central Europe, all with enormous economic damage. While, previously, much of the flood planning and management has been based on empirical approaches, these are no longer sufficient. This is because better accuracy is required than simple extrapolations from observations permit and because any changes in the flood characteristics, be it through climate, land use or river works, can be much more reliably predicted when explicitly accounting for the flood generation processes (Blöschl et al., 2015).
The purpose of this article is to review our present understanding of flood generation processes across space scales. The focus is on the land phase of the processes, i.e. on what happens to extreme rainfall when it falls on the ground. At each scale, the mechanisms of runoff generation are discussed, as are the processes that control the flow paths and thus the magnitude of the floods. A sound understanding of these processes will assist in building more reliable models of floods and their probabilities and ultimately enhance the robustness of flood management methods.
Let us take one step back and conceptually envisage the fate of one raindrop when it falls on the ground. Obviously, its flow path will depend on where it falls. Depending on the surface characteristics, it may infiltrate into the soil, remain on the soil surface until it evaporates, or else run off on the surface. The raindrop may in fact not even reach the ground and get intercepted in the canopy of the vegetation, or it may fall as snow when it is cold. The raindrop, if not evaporated, will start its journey to the ocean, either at low speed in the subsurface where resistance is high or on the surface where it quickly reaches a stream or – as is often the case – as a mix of the two.
So far, so good. In flood generation one is interested in the effect of many raindrops on the flow of water in the streams and on the land surface, so, again, thinking conceptually, the task seems easy. There is “only” a need to follow the path of each and every raindrop to the ocean, and the cumulative effect of all of them will give an exact representation of the water cycle, including flooding. Alas, there are too many drops. For example, the 2013 Danube flood at Vienna had a volume (including baseflow) of 9.5×10⁹ m 3. (Blöschl et al., 2013), which, assuming a raindrop diameter of 1 mm, gives a total of 2×10¹⁹ drops. If one needed only 1 s to simulate the path of a drop on a computer, the total computation time would be 6×10¹¹ years; i.e. the simulations would be finished at a time when the state of the universe will be rather uncertain. So this is clearly not feasible, apart from observational difficulties. Alternatives are needed, and they involve some kind of aggregation, which leads us to the following question: “how do raindrops aggregate to form a flood?”
Hydrology has first fully realized this to be a problem with the advent of digital computers (Sivapalan and Blöschl, 2017). The classical treatment of this question is Allan Freeze's “Blueprint for a physically-based model” (Freeze and Harlan, 1969) where they conclude that “The level of development is not adequate to permit the construction of complete physically-based, hydrologic response models at this time” and “simplification of the model is needed […] while maintaining physical relevance of the controlling hydrological parameters.” (Freeze and Harlan, 1969, pp. 255–256). Since then the aggregation problem has also become known as the “scale issue” and has given rise to numerous initiatives and publications, among them a series of workshops on the topic in Caracas, Venezuela; Princeton, United States; Robertson, Australia; and Krumbach, Austria (Rodriguez-Iturbe and Gupta, 1983; Gupta et al., 1986; Kalma and Sivapalan, 1995; Blöschl et al., 1997).
A key element in understanding how best to scale from the point scale to large areas is the nature of hydrological variability. Again, a classic is the paper of Dooge (1986), who, drawing on Weinberg (1975), suggests that variability may fall into three types: (i) organized simplicity (which can be treated analytically, e.g. by the methods of mechanics), (ii) unorganized complexity (which can be treated statistically, e.g. by the methods of thermodynamics) and (iii) organized complexity (the treatment of which is difficult). Dooge (1986, p. 49S) notes that “Most problems arising in catchment hydrology fall in the category of complex systems with some degree of organization” which means the difficult one. The discussion on the degree to which spatial organization and patterns need to be represented in catchment and subsurface hydrology (as opposed to a purely statistical treatment as in thermodynamics) has not subsided since then (Western et al., 2001; Rajaram, 2016).
A related issue is the interpretation of variability on which, too, no last word has been spoken in hydrology. Specifically, the question is whether randomness and thus uncertainty are inherent in the processes (so there is no way of reducing them, and a probabilistic treatment is unavoidable) or simply a reflection of a lack of knowledge (so more accurate measurements will allow a deterministic treatment). Two contrasting opinions on the subject are the following. The first, in the context of a new hydrological blueprint, suggests that uncertainty is inherent in the processes: “a probability based theoretical scheme for building process-based models of uncertain hydrological systems, thereby unifying hydrological modelling and uncertainty assessment” (Montanari and Koutsoyiannis, 2012; p. 1). The second, more pragmatic, interprets it as a lack of knowledge: “It should be noted that the possibility of using, in the treatment of a real process, schemes of well determined or of only stochastically definite processes stands in no relation to the question whether the real process is itself determined or random.” (Kolmogoroff, 1931; p. 417). The concept of “Digital Twins” (Rigon et al., 2022) may perhaps provide further opportunities for testing alternative conceptualizations of variability and uncertainty.
While these considerations seem to highlight the challenges of connecting the scales, there is perhaps also a positive side to it, drawing on the opportunities of scale research. As Blöschl (2001, p. 711) remarked, “Given that scale issues are common to all of the hydrologic subdisciplines (and indeed far beyond them), scaling work may perhaps reveal its greatest potential as an umbrella under which a rich spectrum of concepts, tools, and measurement techniques covering a range of areas can be unified.” Such concepts may include characteristic scales, hydrological similarity and co-evolution; tools may include those that combine heterogeneous pieces of knowledge; and measurement techniques may exploit patterns of qualitative data sources; and they may all contribute to catalysing the collaboration among hydrologists in diverse fields (Blöschl et al., 2019).
We now turn to the more concrete question of how floods are generated. Given that the scale issues are of paramount importance, we will deal with flood generation separately at different space scales, starting from the pore scale (at a characteristic length of 1 mm) and moving up to the profile, hillslope, catchment, regional and continental scales, covering a scale range of a total of 10 orders of magnitude (Fig. 1). We will review the mechanisms of flood generation at each scale with the ultimate purpose of linking them across scales. Fortunately, there is a very rich body of hydrological literature on the processes at each scale, although their linkages have been studied less.
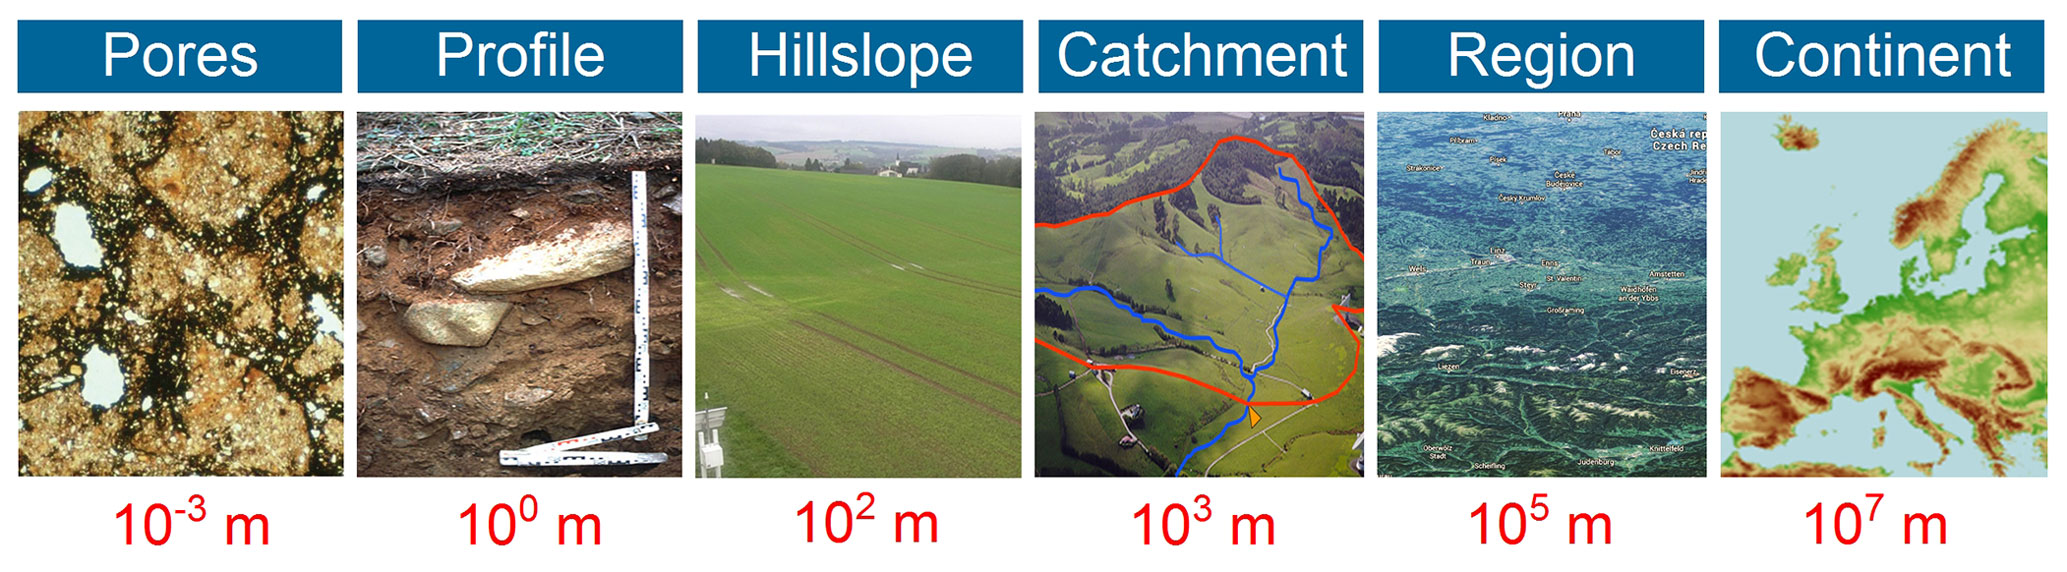
Figure 1Scale transitions across 10 orders of magnitude.
At the pore scale we are in the domain of soil physics which has a mature theory of water movement in unsaturated soils under the influence of gravity and capillary forces between water and the soil grains (e.g. Jury and Horton, 2004) as well as of infiltration (Smith et al., 2002). Much has been said about the overwhelming spatial variability of soil characteristics (e.g. Bierkens et al., 2000), but, even at one single point, there is enormous complexity. Clay minerals for example, important components of many soils, may have diverse shapes and tend to change their form and size very significantly as they become wet or dry out (Tessier, 1990), leading to soil swelling and shrinking. The implication of this is that traditional theories of water flow no longer apply, but attempts at accounting for swelling and shrinking exist. For example, Tuller and Or (2003) have modelled the changes in volume and pore space induced by the swelling and shrinking behaviour of clay minerals for predicting the permeability of clayey soils as a function of soil suction. An even more daunting task is the understanding of water–soil–water feedbacks, i.e. the phenomenon that the moisture state will modify the hydraulic characteristics of the soil, which will modify the flow and thus moisture, which will modify the hydraulic characteristics and so forth. If plants interact with the water and the soil characteristics, these feedbacks become even more complex (Alaoui et al., 2018)
The swelling and shrinking processes of the soil, while operative at the scale of micrometres, can become very relevant at larger scales, visible to the naked eye, and a major determinant of infiltration and flood generation. An example is shown in Fig. 2, where water flowing overland infiltrates into the shrinkage cracks, giving rise to preferential water movement in the soil and reducing the amount of runoff generated locally. One would expect that, for small storms, these cracks will reduce flood peaks, while, when they are filled with water, flood discharges may abruptly increase.
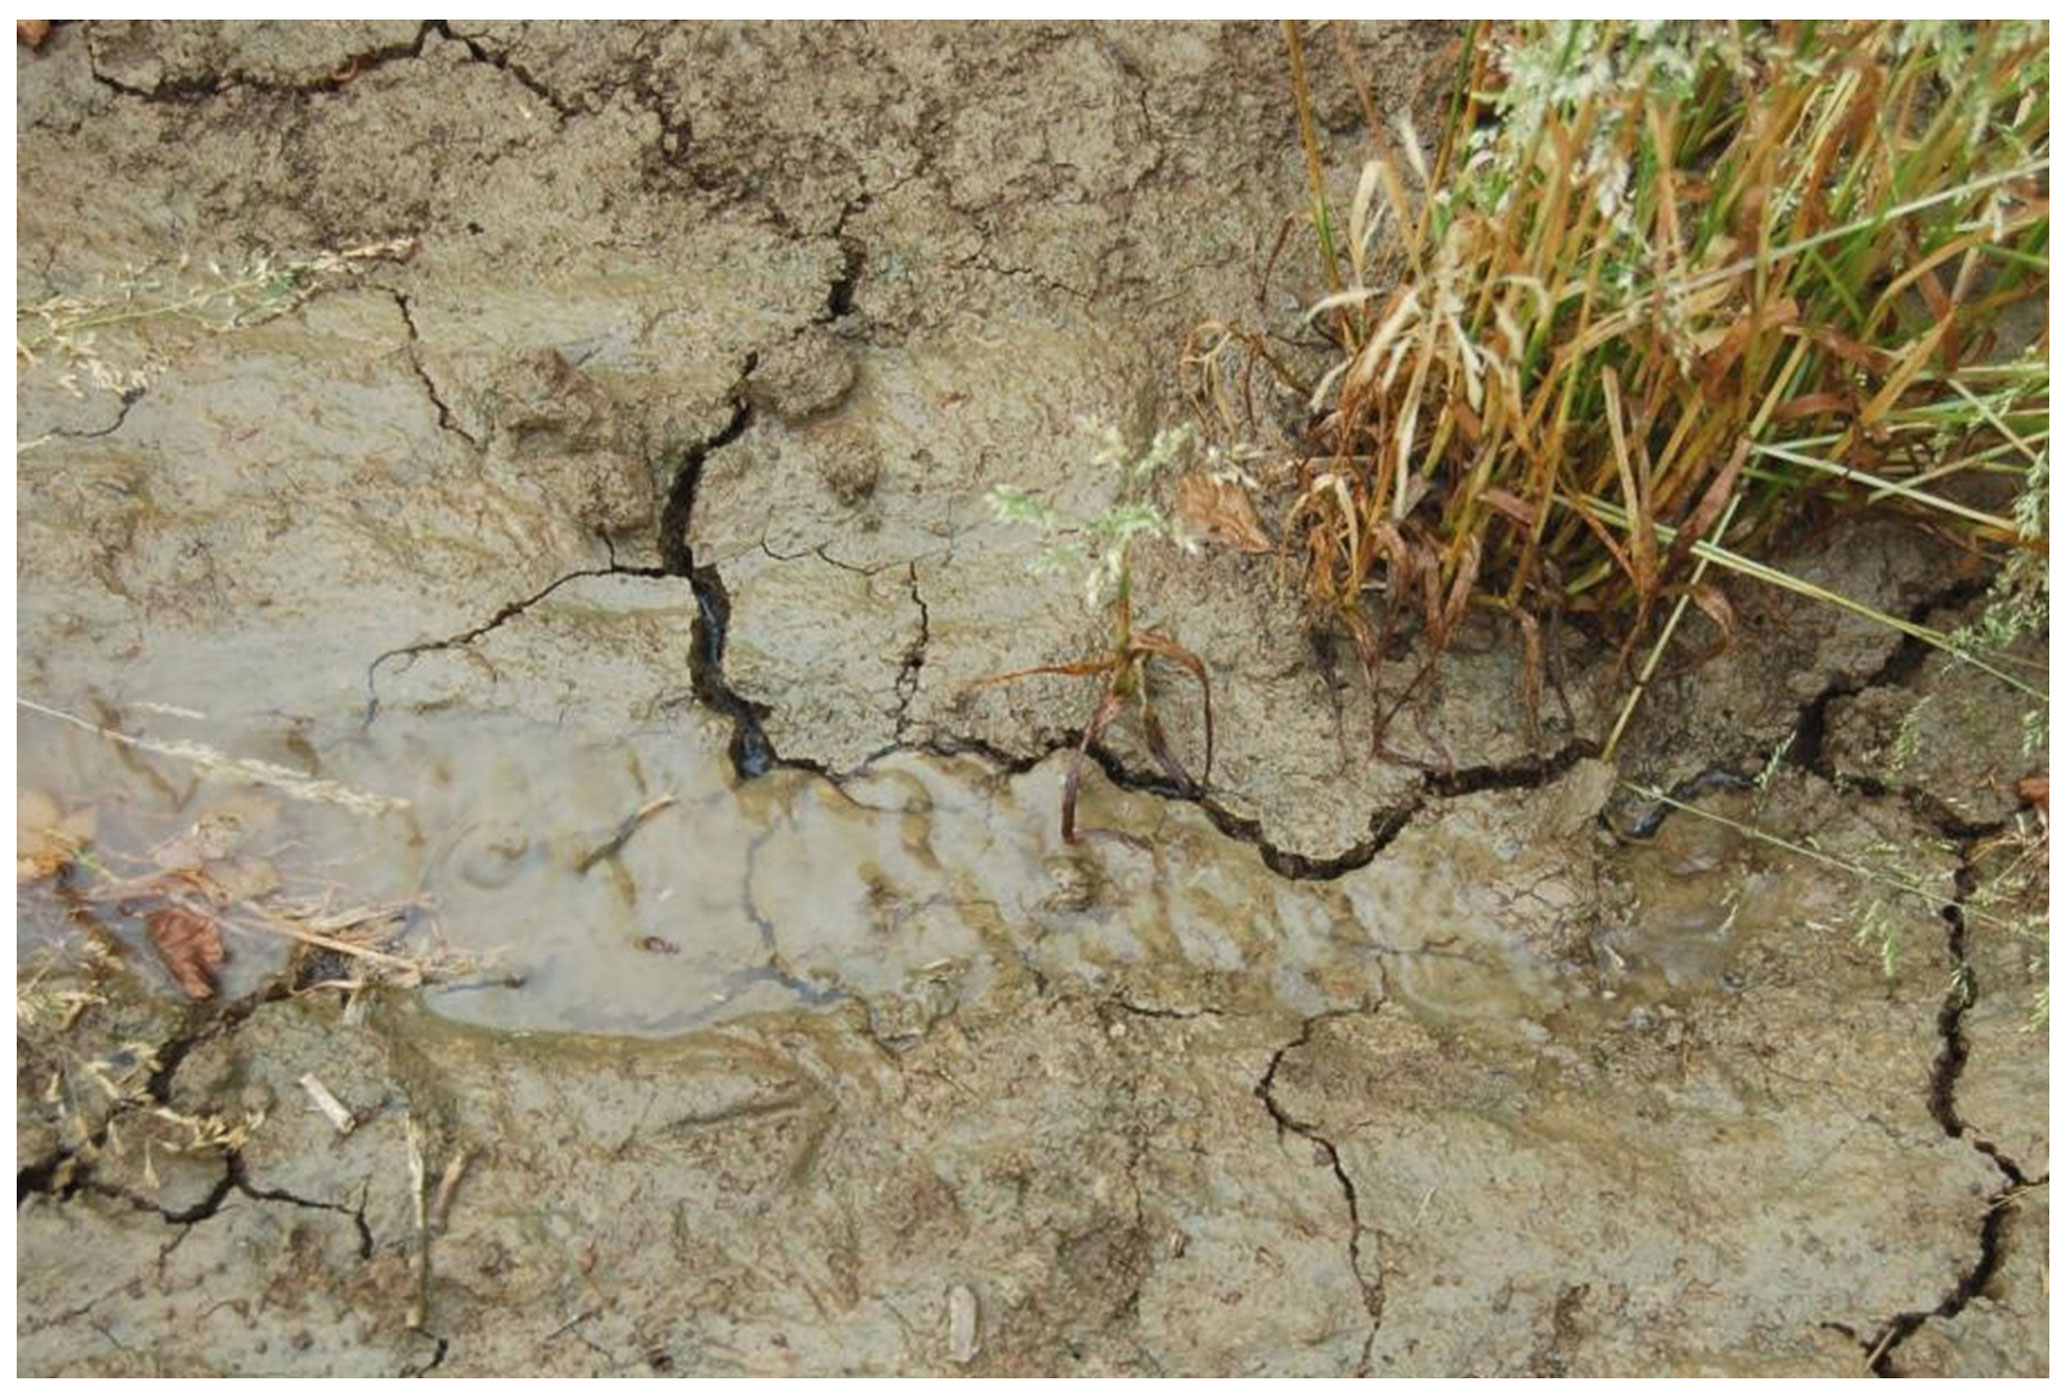
Figure 2Shrinkage cracks in the Hydrological Open Air Laboratory (HOAL), Lower Austria, which will lead to preferential infiltration. Photo: Alexander Eder.
At the soil profile scale, there is, again, established theory, and the dominant paradigm is Richards' equation (Richards, 1931), which combines Darcy's law with mass balance for representing the vertical flow of water in the soil matrix and thus infiltration on the soil surface. Its physical basis (i.e. Darcy's law) is sometimes used as a justification for a widespread use in hydrology, and one could even say it is occasionally idolized as a “sacred cow”. Notwithstanding all its favourable properties, one has to remember that it is only applicable to some soils, and, perhaps more importantly, it represents only one out of many processes controlling runoff generation. Not only do the issues discussed at the pore scale also apply here, but additional phenomena also occur at the profile scale not captured by Richards' equation.
Based on dye-tracing experiments carried out at 14 field sites in Switzerland, Flury et al. (1994, p. 1945) noted the following: “The spatial structure of flow patterns showed remarkable differences. In most soils, water bypassed the soil matrix.” Preferential flow is thus the rule rather than the exception (Fig. 3). Macropores and soil layers tend to contribute to the preferential nature of the flow, as does the varying moisture state. Based on simulations, Zehe et al. (2007) explored the effect of initial soil moisture on the occurrence of vertical preferential flow and found that at intermediate soil moisture, when a transition between matrix and preferential flow occurs, flow becomes very sensitive to small-scale soil moisture variations. Thus, “it seems that small uncertainties can easily amplify under certain conditions and will limit predictability.” (Blöschl and Zehe, 2005, p. 3923).

Figure 3Preferential infiltration. Dye flow patterns observed at the Weiherbach irrigation site, Germany. From Zehe et al. (2007).
The analysis at the profile scale considers one point in the landscape at a time and thus treats runoff generation as a local phenomenon, usually referred to as the infiltration excess runoff generation mechanism attributable to Robert Horton (Horton, 1933). In reality, spatial connections of the processes are often important, so a treatment at the hillslope scale is appropriate. The classical contribution here is that of Dunne and Black (1970), who have highlighted the relevance of saturation excess runoff generation based on field observations in the Sleepers river watershed in Vermont. They note that “… overland flow generated by the mechanism described by Horton did not occur. […] When the water table rose to the surface of the ground, however, overland flow was generated on small areas of the hillside.” (Dunne and Black, 1970, p. 478). Since the water table is controlled, among other factors, by the lateral subsurface redistribution, this is no longer a local mechanism. A similarly spatial process was observed on the Panola hillslope in Georgia: “When connectivity was achieved, the instantaneous subsurface stormflow rate increased more than fivefold compared to before the subsurface saturated areas were connected to the trench face.” (Tromp-van Meerveld and McDonnell, 2006, p. 1). In this case, the critical process is saturation near the bedrock–soil interface, as opposed to surface saturation in the case of saturation excess runoff.
A term mentioned in the Panola study is “flow connectivity”, representing the presence of coherent flow paths along the hillslope. Traditionally, connectivity had mainly been studied in fractured rocks (e.g. Andersson and Dverstorp, 1987), and it is only in the 1990s that it has received increased attention in catchment hydrology (e.g. Western et al., 1998, 2001; Grayson and Blöschl, 2001). Of key relevance has been the recognition in hydrology (although long known to pedology, Milne, 1935; Jenny, 1941) that the soil characteristics are organized along a hillslope and that this organization is critically important for runoff generation. Here, again, feedbacks can occur between the soil structure and flow but this time modulated by animal activity. An example is the role of earthworms. In some climates, there is a tendency for larger soil moisture at the foot of a hillslope, which favours the presence of earthworms and thus increases the number of earthworm holes, which in turns increases the flow conductivity, with repercussions on soil moisture (Zehe et al., 2010).
Flow connectivity and feedbacks can also be very relevant in the context of sediment movement. As overland flow concentrates along rills, in particular in agricultural landscapes, erosion is enhanced (because shear stress is proportional to flow depth; Biron et al., 2004), which leads to a deeper incision of rills and therefore more flow concentration. While traditional stream gauge measurements are not very good at capturing these connectivity patterns, novel techniques such as terrestrial or aerial video images can provide detailed pattern information (Silasari et al., 2017; Deng et al., 2020). As an example, Fig. 4 shows the saturation patterns in the HOAL. As the saturation area exceeds 80 m2, the flow paths connect, and runoff from the hillslope starts abruptly.
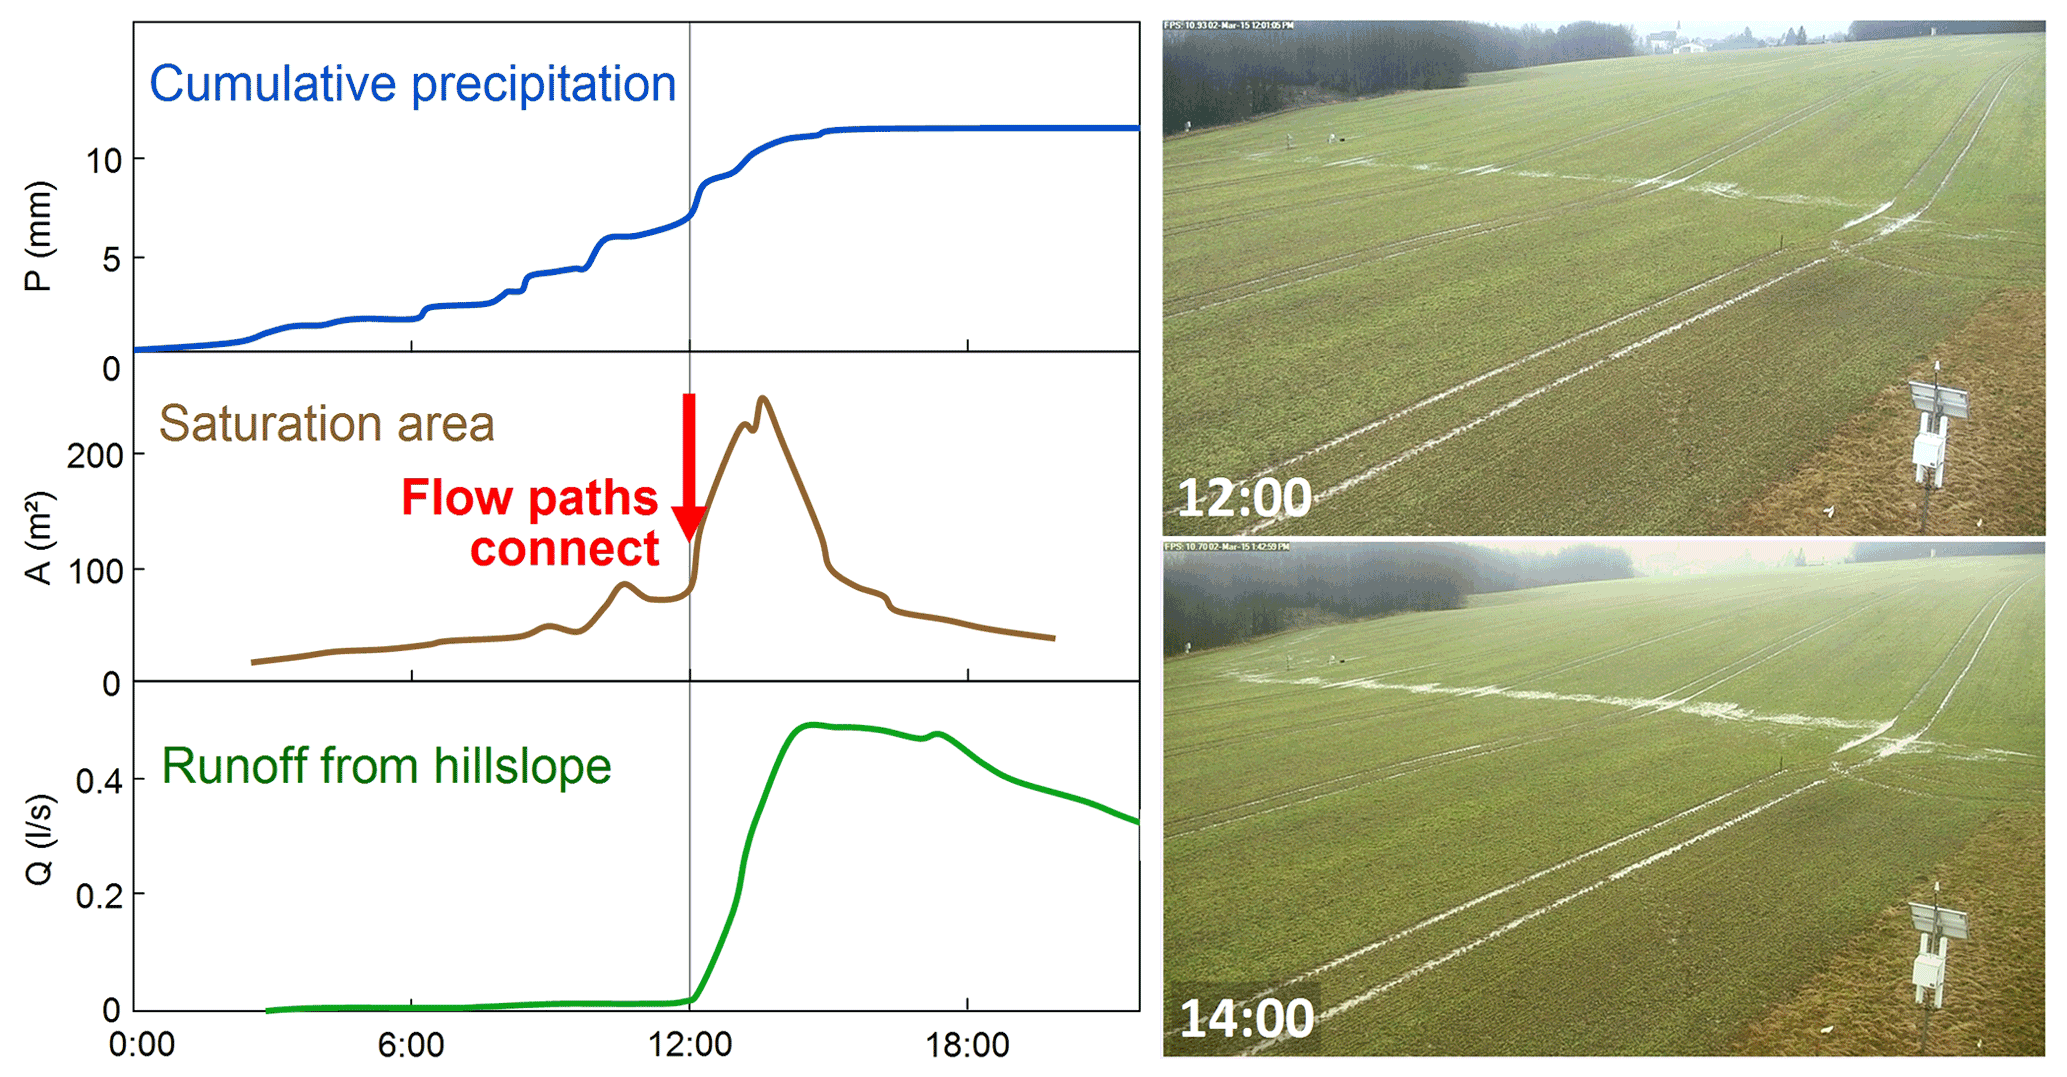
Figure 4Connectivity of overland flow on 2 March 2015 in the Hydrological Open Air Laboratory (HOAL), Lower Austria. Left: observations of precipitation (at a rain gauge), saturation area (from an analysis of the videos) and runoff (at a flume). Right: video images of the saturation patterns. From Silasari et al. (2017).
A catchment is of course composed of many hillslopes, but how the flood generation responses of many hillslopes combine exactly has been the subject of a long debate in hydrology. At one end of the spectrum is again the blueprint of Freeze and Harlan (1969), which describes the processes on each hillslope in a detailed way, to subsequently combine them to catchment response, an approach sometimes called “upward”. At the other end of the spectrum is the “downward” approach that views catchments as organized complex systems, in the sense of Dooge (1986), that co-evolve (Sivapalan and Blöschl, 2015) and “develop features of spatial organization, including surface or sub-surface drainage patterns, as a by-product of this evolution.“ (Savenije and Hrachowitz, 2017, p. 1107). If the latter is true, flood generation should no longer by treated as a boundary value problem (as in Freeze and Harlan, 1969) because “models that fail to account for patterns and the associated feedbacks miss a critical element of how systems at the interface of atmosphere, biosphere and pedosphere function.” (Savenije and Hrachowitz, 2017, p. 1107). So how do we reconcile these views? Sivapalan (2003, p. 1040) suggests the following: “One way to achieve this reconciliation is to focus on common concepts, features or patterns that have physical meanings that transcend the range of scales in question, and which are easily scalable.” Common concepts are, for example, travel time distributions. Additionally, instead of analysing a single catchment in detail, comparing many catchments with contrasting characteristics may be useful for understanding the controls in a holistic way, an approach known as comparative hydrology (Gaál et al., 2012).
Experimental basins provide evidence of how the hillslope responses combine to that of an entire catchment. One example is the 66 ha Hydrological Open Air Laboratory (HOAL), where streamflow is observed at 13 flumes, along with numerous other hydrological variables. The moisture observations of Fig. 5 show that the spatial patterns differ between winter and summer, with a stronger spatial organization in winter because of the higher relevance of lateral redistribution of water, in line with studies in Tarrawarra, Australia, for example (Grayson et al., 1997). The HOAL is particularly interesting as it features different runoff generation mechanisms within a rather limited area, including runoff generation through overland flow (partly infiltration excess during high-intensity storms in summer, partly saturation excess during winter), runoff generation via tile drains (with very fast response times of less than an hour, even though the drain pipes are about 60 cm below ground) and runoff from permanently saturated areas (local wetlands) (Blöschl et al., 2016). Soil moisture is a major control on runoff generation in this catchment, as illustrated in Fig. 6, but the peak flow–soil moisture relationship depends very much on the runoff generation mechanism – threshold-type behaviour for the overland flow mechanism and more gradual for the other mechanisms, and the total outflow of the catchment is a mix of these processes. The threshold behaviour observed in the HOAL is not an exception. For example, a similar relationship was found by Penna et al. (2011) in a catchment in the Italian Dolomites. In order to explain the non-linear runoff generation in a spatial context, various theoretical studies have explored the aggregation of hillslope response in the spirit of these observations, accounting for the space–time covariance of precipitation and soil moisture by an upward approach (Woods and Sivapalan, 1999; Viglione et al., 2010). These studies assist in generalizing the understanding of the scaling behaviour beyond individual case studies.
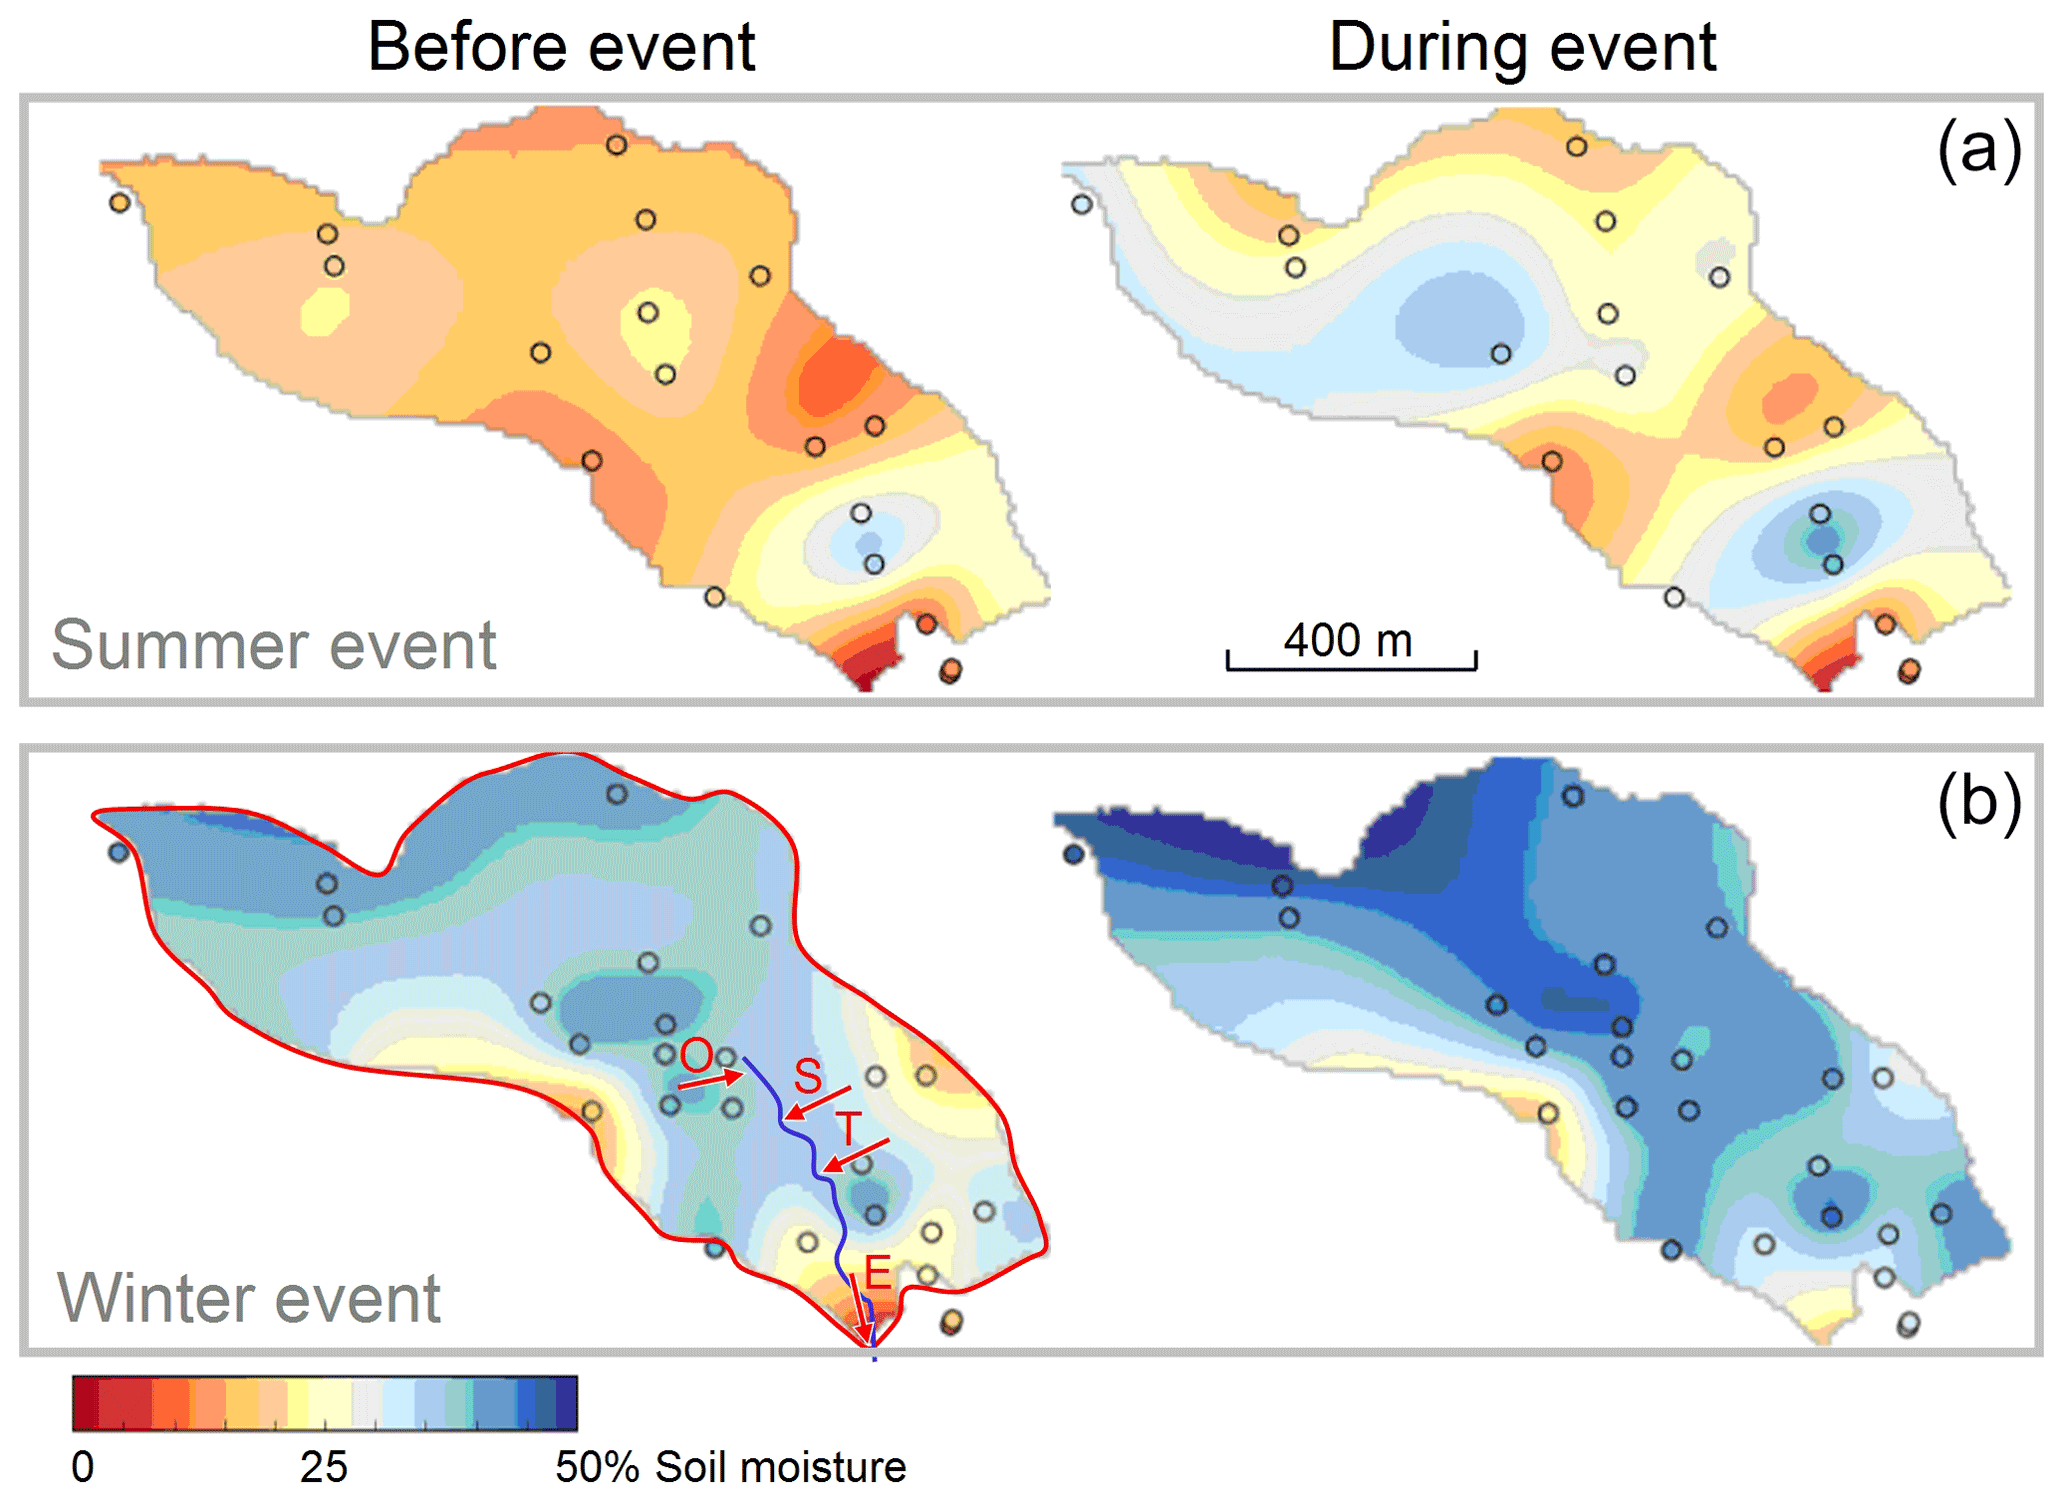
Figure 5Soil moisture patterns in the Hydrological Open Air Laboratory (HOAL), Lower Austria. (a) A summer event (9 and 10 August 2014). (b) A winter event (6 and 7 December 2014). Note the more pronounced spatial organization of soil moisture in winter, in particular during the event. Bottom left shows the flumes used in Fig. 6: O (overland flow), T (tile drains), S (saturation area) and E (entire catchment). See Blöschl et al. (2016) for details.

Figure 6Non-linear runoff generation in the Hydrological Open Air Laboratory (HOAL), Lower Austria. Scaled peak runoff of events plotted against scaled soil moisture at the beginning of these events. Each point represents one event. The panels refer to the flumes shown in Fig. 5, which represent different runoff generation mechanisms. From Vreugdenhil et al. (2022).
At the regional scale, the comparative, diagnostic approach to identifying flood generation processes is particularly powerful. For example, Thompson et al. (2011, p. 1) “suggest that the spatial patterns of vegetation may offer a lens through which to investigate scale dependence of hydrology”. Analysing various regions in the United States, they found that the organization of vegetation imposes spatial dependence in areally averaged hydrologic variables such as soil moisture and the partitioning of flow paths. Theirs is an example of the downward approach that harmonizes with the identification of spatial organization in catchments viewed as complex systems (Savenije and Hrachowitz, 2017). The findings are directly relevant to scale effects in flood generation, given that soil moisture is a key control at all scales (Western et al., 2002). A similar comparative approach, albeit with a stronger focus on climatic controls, identifies flood types such as snowmelt floods, rain-on-snow floods, flash floods and synoptic floods. An example is shown in Fig. 7. The patterns of the frequency of types could not easily be inferred from other variables such as topography. For example, rain-on-snow floods are most frequent in the north of Austria, and this is related to the seasonal interplay of snowmelt processes and soil moisture that differs from other regions. The more frequent flash floods in the east are related to the higher frequency of convective storms and the faster catchment response times (Gaál et al., 2012). The typology approach has recently been extended to also include processes related to infiltration and runoff routing (Tarasova et al., 2019, 2020). The importance of these typologies for understanding flood generation derives from the process similarity of events pertaining to the same class, e.g. similarity in terms of the transition to extreme events and in terms of changes of flood processes with time (Merz et al., 2021; Blöschl et al., 2015).
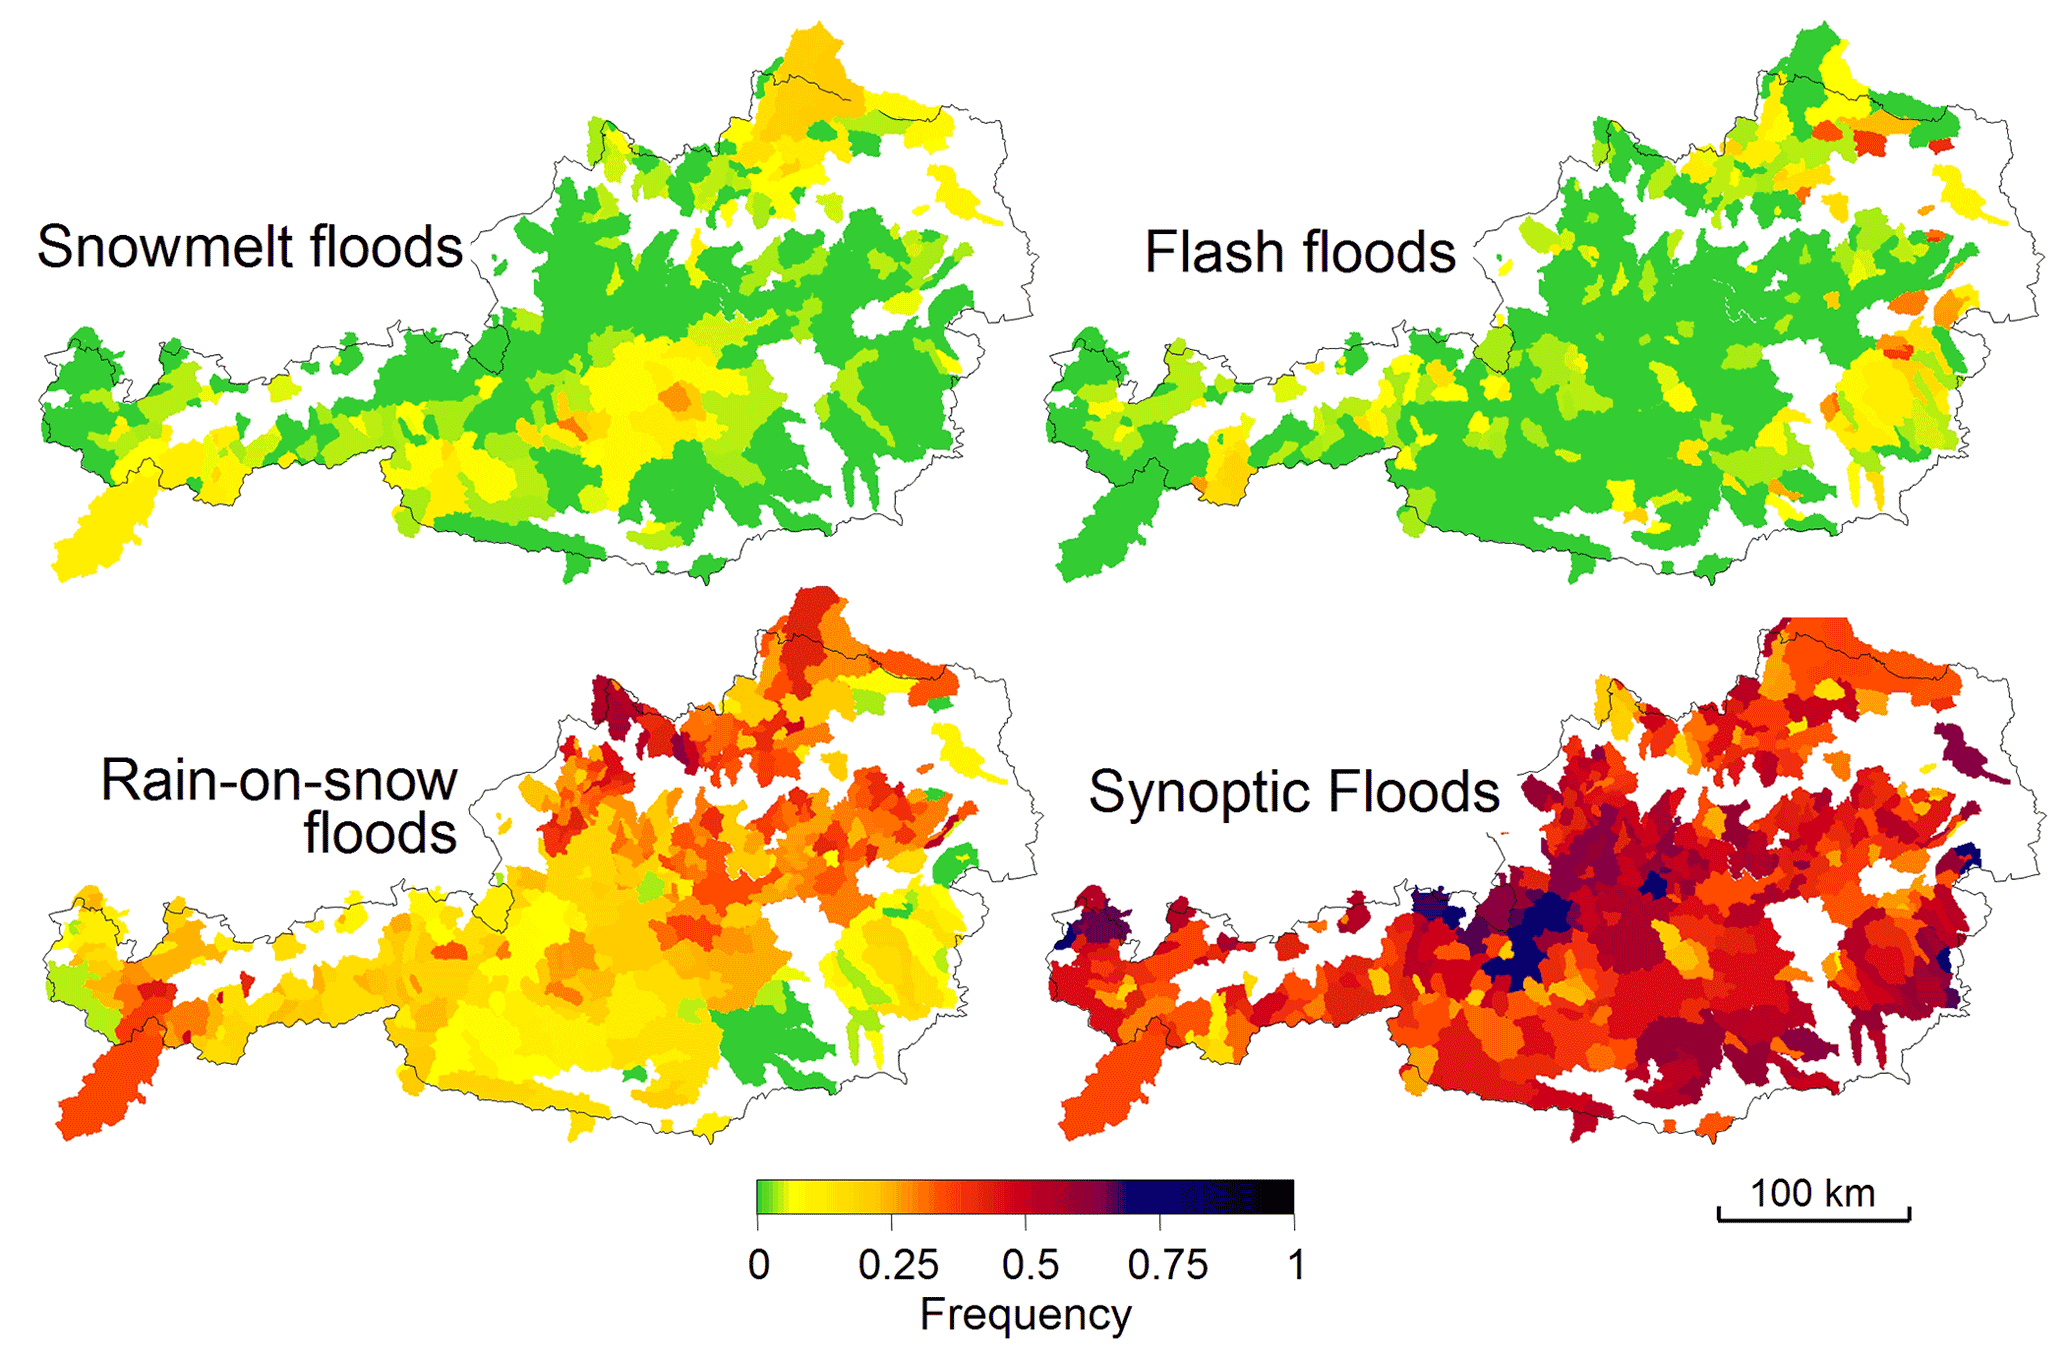
Figure 7Frequency of regional flood process types in Austria based on observed maximum annual peak discharges of 12 000 events classified according to their type. Each polygon represents a gauged catchment. From Merz and Blöschl (2003).
Similar to the other scales, the aggregation processes at the regional scale are complex. Figure 8 shows the spatial flood hydrograph pattern of the June 2013 flood in the Danube basin as an example. The flood response of the Bavarian Danube in the northwest of the basin is delayed, and the runoff coefficient at Hofkirchen is only 0.27 because of the highly permeable subsurface, while the Inn in the southwest exhibits a faster response, and the runoff coefficient at Schärding is around 0.5 because of shallower soils, steeper terrain and higher rainfall (Blöschl et al., 2013). The Upper Inn shows very little flood runoff, and the flood wave built up through tributaries in Bavaria. The confluence of the Inn at Schärding with the Bavarian Danube at Hofkirchen resulted in a characteristic, combined shape of the flood wave at Achleiten, where the fast and slow contributions of the Inn and Danube are clearly visible. During the propagation of the flood wave along the Austrian Danube, it changed shape due to retention in the flood plains. It can be appreciated that the spatial patterns of runoff controlled by precipitation, some snowmelt, soil characteristics and soil moisture are aggregated and modulated as the flood wave propagates through the stream network. Understanding these patterns is extremely important, both for flood forecasting and for flood risk mapping (e.g. Vorogushyn et al., 2010; Viglione et al., 2013; Merz et al., 2014; Nester et al., 2015).
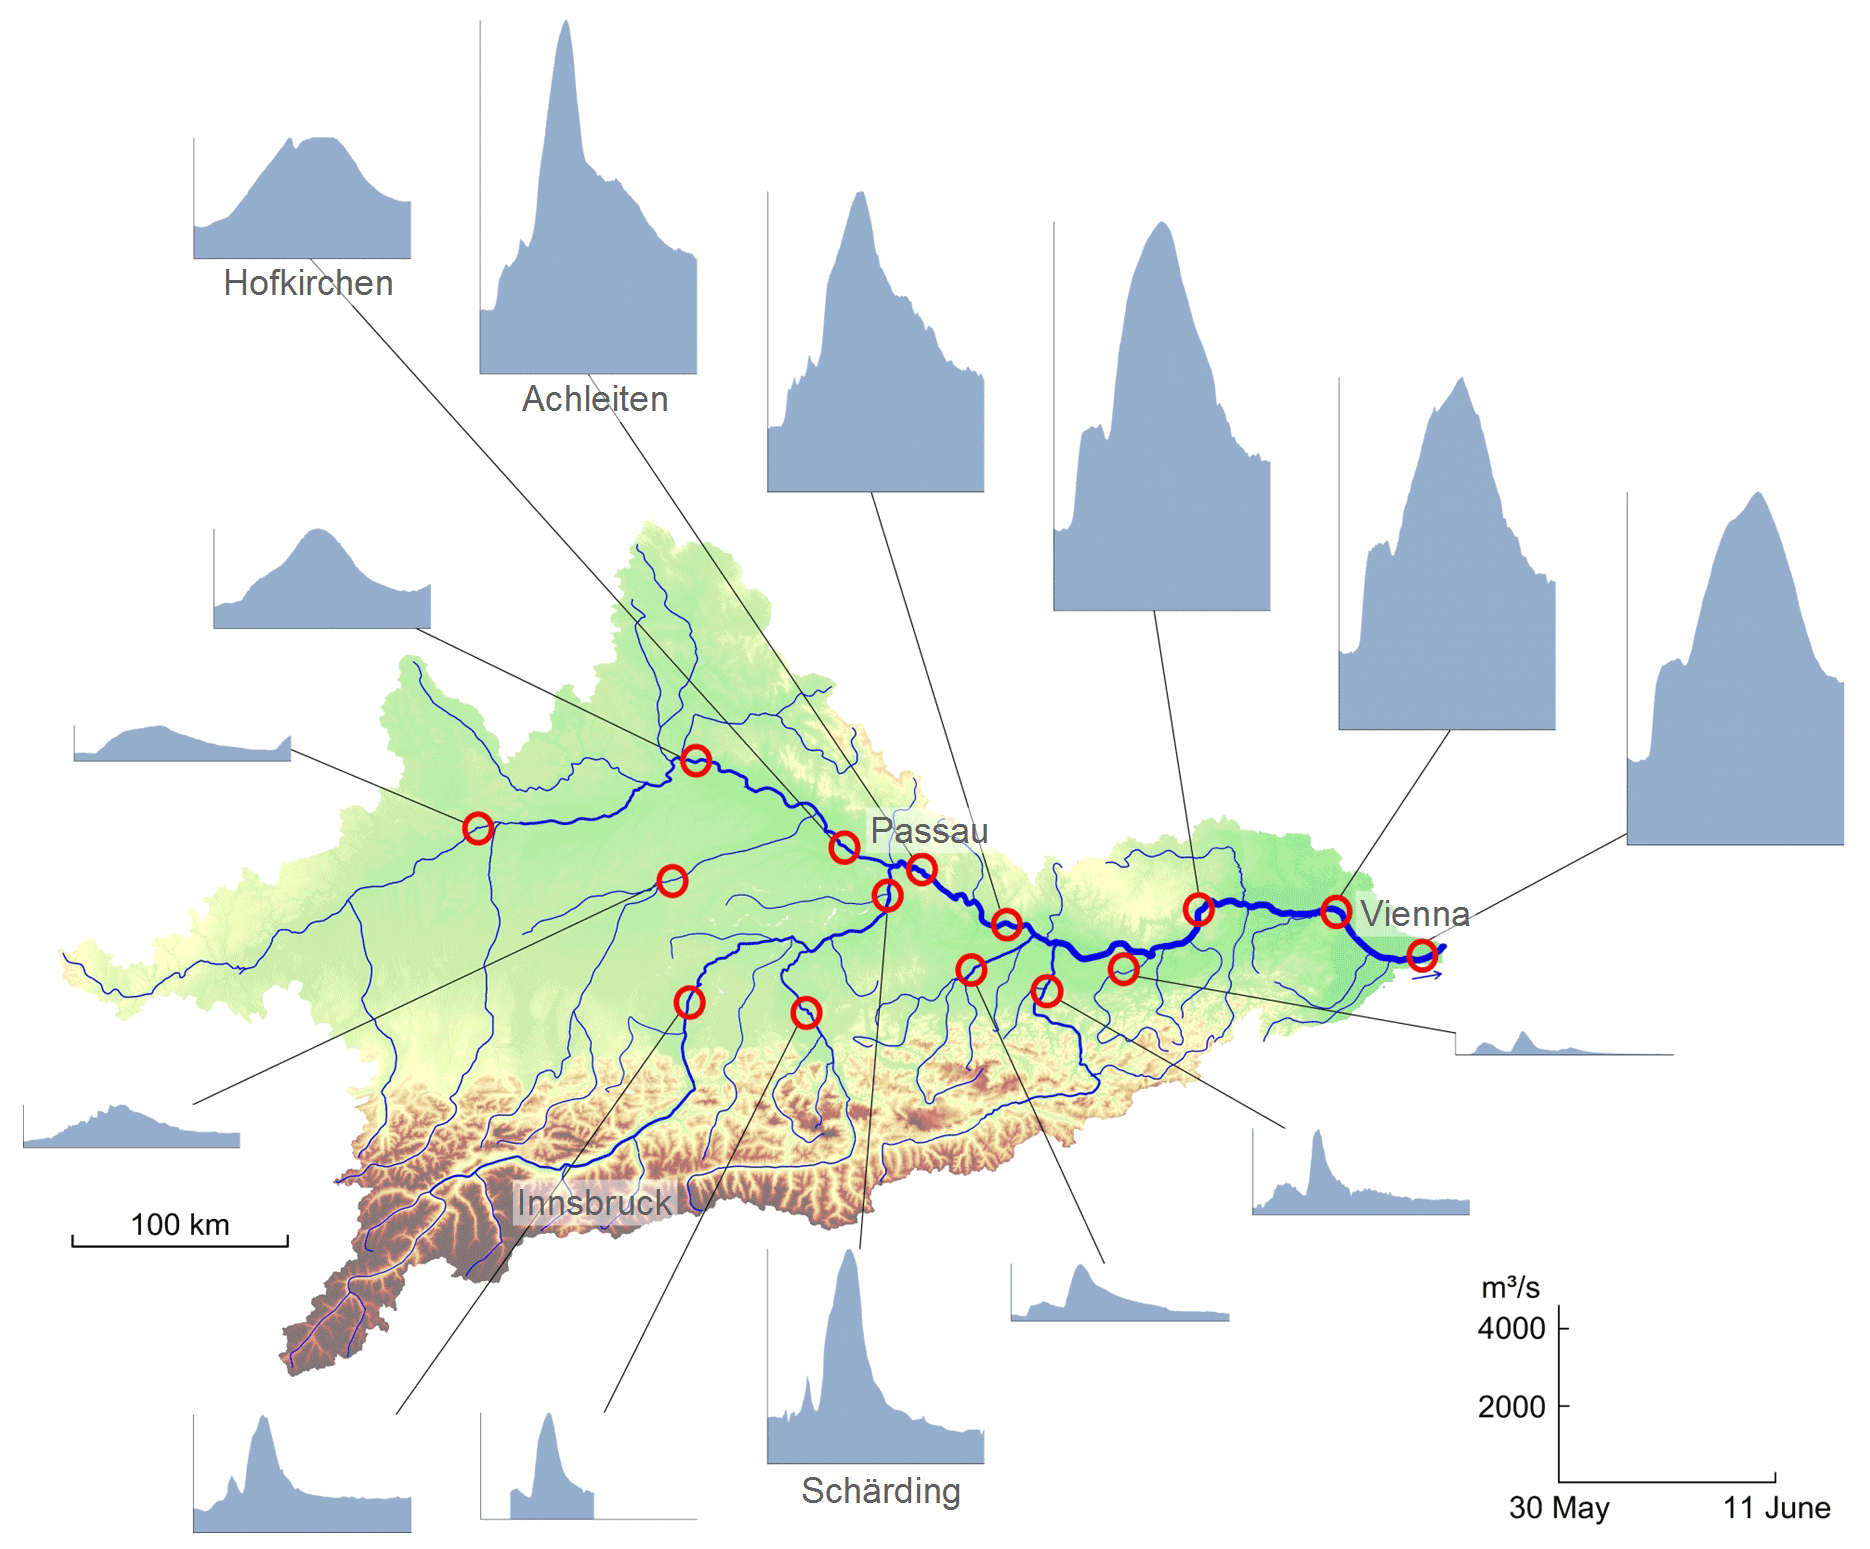
Figure 8Spatial flood hydrograph pattern of the 2013 event in the Danube basin upstream of Vienna, Austria. Red circles indicate the stream gauges. The scale shown on the bottom right relates to all hydrographs (light blue areas). From Blöschl et al. (2013).
As one moves up in scale to an entire continent, one could – similarly as at other aggregate scales – view flood generation simply as the sum of the processes in many pores, profiles, hillslopes, catchments and regions. This upward view (in the spirit of Freeze's blueprint) has given rise to the hyperresolution modelling paradigm at continental and global scales (Wood et al., 2011; Bierkens et al., 2015; O'Neill et al., 2021). There is much to be said in favour of these models as they codify existing system knowledge, and modern computer resources permit simulations at resolutions of hundreds or even tens of metres globally. On the other hand, Sivapalan (2018, p. 1674) noted that “ [upward] reductionist type models are best suited to represent `known' knowledge, and are at their weakest to reveal `unknown' knowledge [..]; vice versa for [downward] […] models”. Complexities such as preferential flow, connectivity and media–flow interactions are rarely codified at each scale they can be observed, let alone their summary effect at the continental scale modulated by cross-scale feedbacks. Hydrologists have been sorely aware of these scale issues since the 1980s. Ways forward may include downward diagnostics, i.e. learning from observed patterns not only at small scales, but also at the continental scale, in order to capture the summary effect of all these interactions on runoff generation.
Meteorology has a longer tradition of continental-scale (and global-scale) diagnostics. At the continental scale, the structure of the stream network tends to become less important, and, instead, the atmospheric situation controls the movement and direction of cyclones, the intensity of the rainfall they produce and thus the flood characteristics. Classifying cyclone tracks based on air pressure and other data allows those cyclones to be identified that are most prone to producing regional floods. For example, Vb tracks (van Bebber, 1891) that propagate from northern Italy to Poland tend to produce the highest precipitation rates in central Europe, such as those responsible for the June 2003 flood (Fig. 8). Figure 9 illustrates that, in the Ore mountains, the 20-year maximum annual daily precipitation during Vb events is 62 mm d−1, while it ranges between 20 and 35 mm d−1 for other event types (Hofstätter et al., 2016, 2018). Superposition of the polar and the subtropical jet stream over the western Mediterranean has been identified as a main feature triggering Vb cyclones (Hofstätter and Blöschl, 2019). It appears that connectivity is also important at the continental scale, e.g. through preferential pathways of flood-generating cyclones; in the particular case of Vb events through the connection of the eddy-driven polar jet stream and the subtropical jet stream over the western Mediterranean; and through the role of teleconnections (e.g. as quantified by the North Atlantic Oscillation (NAO) and Arctic Oscillation (AO) indices in affecting flood-relevant cyclones; Hofstätter and Blöschl, 2019). Another example of connectivity in the atmosphere is atmospheric rivers (Kim et al., 2021).
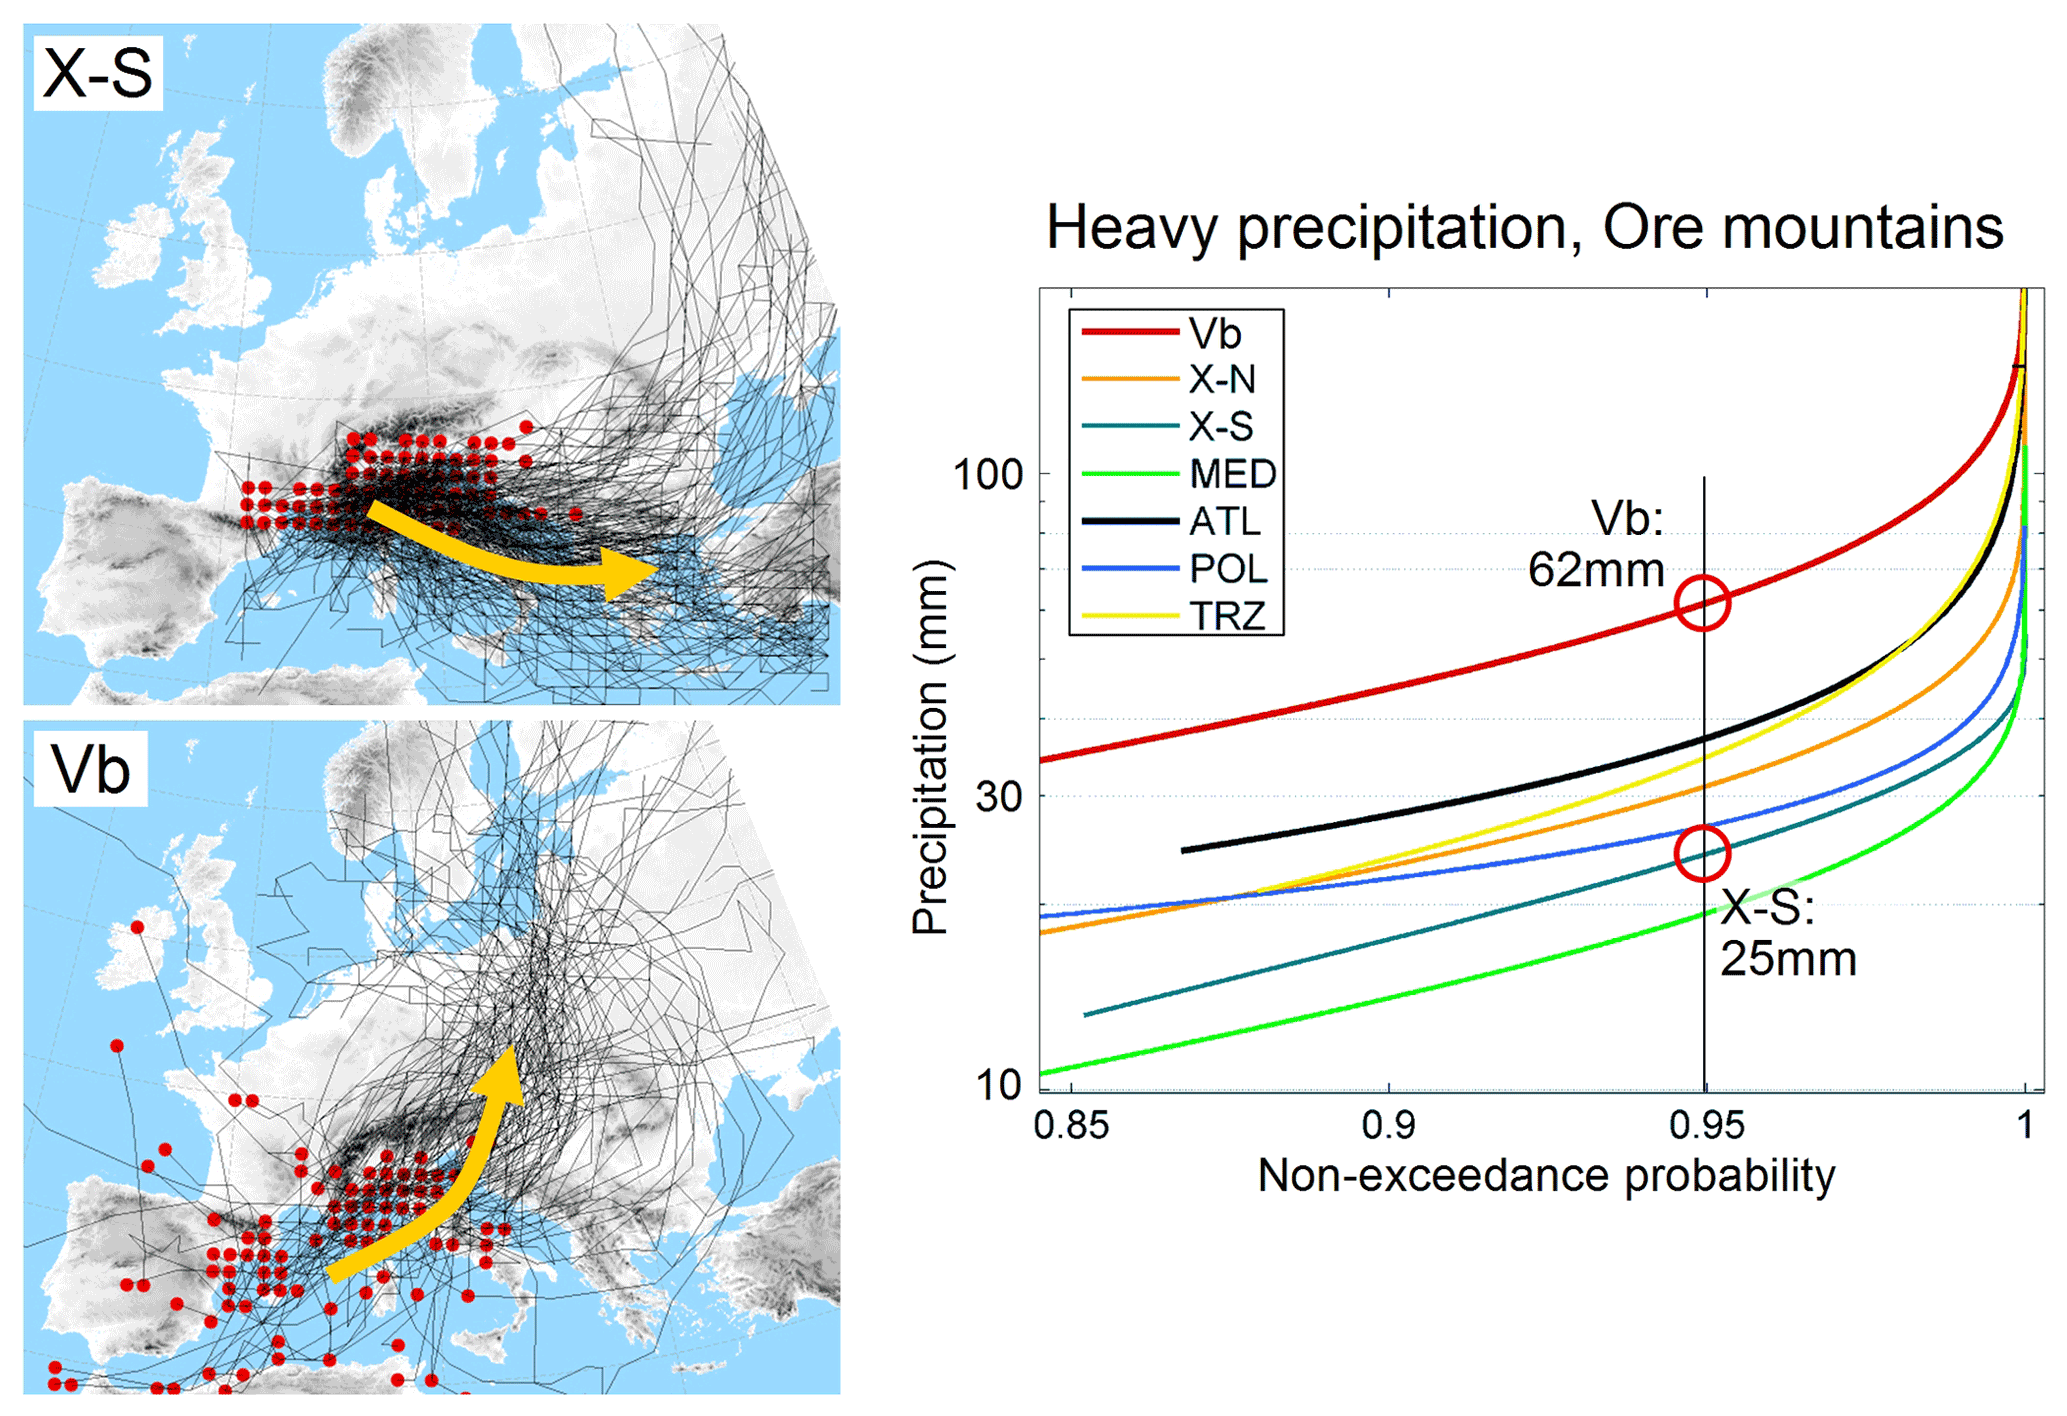
Figure 9Storm tracks of cyclone types and associated heavy precipitation in the Ore mountains, for 2500 cyclone events. From information in Hofstätter et al. (2018).
A classification of flood generation mechanisms similar to that of Fig. 7 can also be performed at the continental scale. For example, Kemter et al. (2020) showed that synoptic rainfall is particularly important in the Alps and the Carpathians, soil moisture excess in the Atlantic climate of western Europe, and snowmelt in the north and east of Europe. Rain-on-snow has some relevance in the midlands of central Europe.
A simple, but very efficient, diagnostic of these runoff generation processes at the continental scale is the timing of the year floods occur, which is illustrated in Fig. 10a. In Europe, the timing of the floods varies gradually from winter floods in the west to spring floods in the east because of increasing continentality (distance from the Atlantic) and from winter floods in the south to spring floods in the north because of the increasing influence of snowmelt. The effect of snow storage and melt in the Alps and the Carpathians (summer floods) is superimposed on this spatial pattern. The spatial pattern in Fig. 10a is quite different from that of the individual drivers, as illustrated for the case of extreme precipitation (Fig. 10b). This is because of the interplay between the seasonality of event precipitation, snowmelt, soil moisture and evaporation.
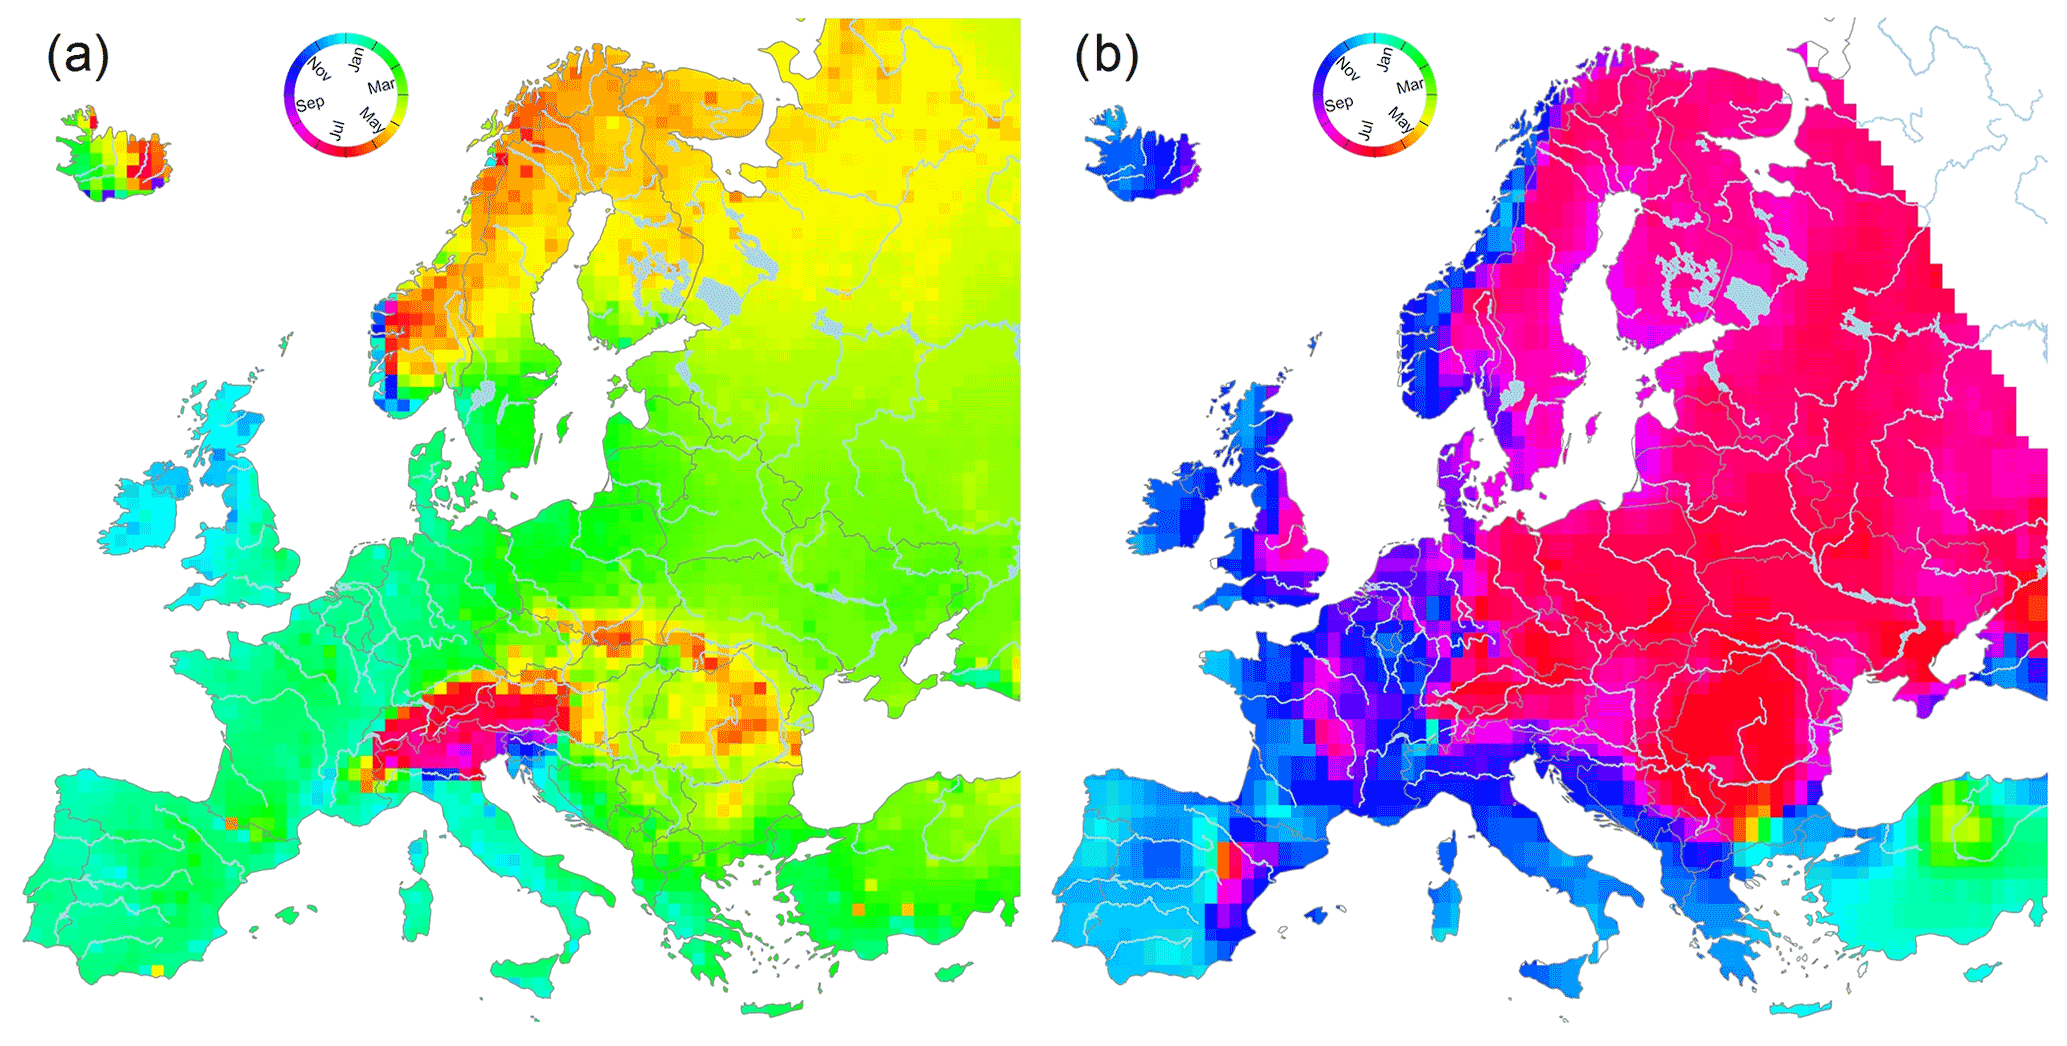
Figure 10(a) Observed average timing of river floods in Europe based on maximum annual discharge series 1960–2020 from 4062 stream gauges. Light blue: winter floods; green to yellow: spring floods; orange to red: summer floods; purple to dark blue: autumn floods. (b) Similar maps but for 7 d maximum annual precipitation based on E-OBS data. Redrawn from Blöschl et al. (2017).
Hydrologists are not commonly used to interpreting observed patterns at the continental scale, but there is a lot to be learned from them, also for small-scale studies. For example, one notes that the west coasts of the European islands and peninsulas (e.g. UK, Denmark, Iberia, Italy, and Greece) all tend to have earlier flood occurrence by 1 month than the respective east coasts, a finding that also suggests similarities between the relative magnitudes of flood generation processes at the catchment scale. Comparative hydrology (Sivapalan, 2018) exploits these similarities and helps avoid being “frogs in the well” (as the Chinese saying goes) and instead see the bigger picture that is also valuable in a local context.
This paper has reviewed flood generation processes across scales with a focus on spatial process patterns. Understanding these processes is not only of scientific interest, but also has enormous practical importance for risk management purposes, including flood forecasting and flood risk assessment in a changing climate. Examples of the latter include flood design, which has benefitted from the use of process patterns such as those in Fig. 6 (runoff generation) and Fig. 7 (flood types) in the flood frequency hydrology approach (Merz and Blöschl, 2008) recommended in the German and Austrian flood estimation standards (DWA, 2012; ÖWAV, 2019); flood forecasting, which has benefitted from using observed snow and soil moisture patterns, as well as preferential flow representations in the soil (Blöschl et al., 2008; Blöschl, 2008); and risk assessment of spring contamination, which has benefited from observed patterns of evidence on surface runoff (Reszler et al., 2018).
The observed process patterns discussed here show that there is remarkable similarity of the flood generation mechanisms between the scales from the pores to the continent. At all scales, processes are not random (as in thermodynamics), but they exhibit organized structures that control the flow of water. There is often an interplay between the structure (e.g. soil characteristics and topography) and the flow characteristics (e.g. flow velocity). For example, overland flow is controlled by the rills on the surface, but they themselves are created by overland flow. Remarkably, there is preferential water flow at all scales – flow in pores and macropores in the soil, rills on the land surface, preferential flow paths in aquifers, rivers in the landscape and atmospheric storm tracks that transport moisture in a preferential way. Connectivity is important as it controls whether flow paths connect and thus the overall behaviour of the system. While the controls on flood generation are similar at all scales, their relative magnitudes differ between scales.
Given all this process complexity, an obvious question is how these scales can be linked, e.g. through upscaling. From the discussion it seems to be clear that processes at all scales affect flood generation at the continental scale in some way. Additionally, large-scale processes possess emergent behaviour. They are not simply the multiple reoccurrence of pore-scale processes. This is reminiscent of the very different behaviour of groups of people compared to that of individuals (studied respectively in sociology and psychology). Groups mainly behave differently because people interact and talk to each other. In the domain of hydrology, these interactions are feedbacks: feedbacks between processes (such as flow and structure), feedbacks between places (such as the subsurface and the surface) and feedbacks between scales. Often, a small number of people play a disproportionally large role in influencing the group's opinion, e.g. influencers in social networks (Langner, 2013), and this phenomenon is similar to the effect of preferential flow on flood generation at higher scales. Without capturing preferential flow, it will thus be difficult representing runoff generation across scales.
In modelling these processes, simplifications of the scale transitions are needed that reflect the respective structures (e.g. connectivity) and the boundary conditions (e.g. groundwater table). Upscaling by a million-fold repetition of pore-scale process will unlikely give the right patterns at the continental scale because of emergent behaviour. On the other hand, we can learn from observed patterns at all scales in a downward way. As Dunne (1998, p. 24) put it, “When formulating a particular problem, the scale must be chosen judiciously to maximize its utility. This challenges the belief that only progressively finer-scale studies are really “scientific” and “rigorous” and that `scaling up' from some presumably fundamental understanding is the only way to solve problems in hydrology.” It is hoped that scientific curiosity will push hydrologists further to learn about processes from observed patterns at all scales, to better understand how floods are generated as water moves from the raindrop to the ocean.
No datasets were used in this article.
The author is a member of the editorial board of Hydrology and Earth System Sciences. The peer-review process was guided by an independent editor, and the author also has no other competing interests to declare.
Publisher's note: Copernicus Publications remains neutral with regard to jurisdictional claims in published maps and institutional affiliations.
This article is an outgrowth from the John Dalton Medal Lecture I gave at the General Assembly of the European Geosciences Union in April 2019. Over the years, my own ideas I have presented here have benefitted immensely from interactions with numerous friends and collaborators, who I would like to thank most cordially. These include the co-authors with whom I have published the most: Juraj Parajka, Alberto Viglione, Ralf Merz, Murugesu Sivapalan, Jürgen Komma, Robert Kirnbauer, Alberto Montanari, Magdalena Rogger, Rodger B. Grayson, Dieter Gutknecht, José L. Salinas, Hubert H. G. Savenije, Gregor Laaha, Jan Szolgay, Bruno Merz, Christian Reszler, Andrew W. Western, Marco Borga, Wolfgang Wagner, Gemma Carr, Thomas Nester, Jon O. Skøien, Alfred Paul Blaschke, Attilio Castellarin, Andreas H. Farnleitner, Silvia Kohnová, Erwin Zehe, Giovanni B. Chirico, Giugliano DiBaldassarre, Peter Strauss, Matthias Zessner, Miriam Bertola, Alexander Eder, Klaus Haslinger, Michael Hofstätter, Andrea Kiss, David Lun, Borbála Szeles, Mariette Vreugdenhil, Jürgen Waser, Berit Arheimer, Theresa Blume, Korbinian Breinl, Andreas Buttinger-Kreuzhuber, Xiaofei Chen, Patrick Hogan, Linda Kuil, Rui A. P. Perdigão, Wolfgang Schöner, Elena Szolgayová, Sergiy Vorogushyn, Christian Bucher, Christophe Cudennec, Ladislav Gaál, Julia Hall, Demetris Koutsoyiannis, Philipp Stadler, András Bárdossy, Helge Bormann, Julia Derx, Mike Exner-Kittridge, Alexia Fürnkranz-Prskawetz, Hoshin V. Gupta, Kamila Hlavčová, Josef Jansa, Thomas R. Kjeldsen, Daniel P. Loucks, Herbert Pirkl, Elena Toth, Rui Tong, Peter Valent, Thorsten Wagener, Ross Woods, Marlies H. Barendrecht, Luigia Brandimarte, Wouter Buytaert, Ximing Cai, Pierluigi Claps, Uwe Ehret, Hannes Flühler, Raphael Fuchs, Eric Gaume, Alexander Gelfan, Eduard Gröller, David Gustafsson, Peter Haas, Bernd Hansjürgens, Stefan Hasenauer, Laszlo Holko, Hartmut M. Holländer, Herwig Hölzel, Zsolt Horváth, Markus Hrachowitz, Günter Humer, Bernhard Kohl, Philipp Kraft, Heidi Kreibich, Upmanu Lall, Lai-yung Ruby Leung, Neil Macdonald, D. Scott Mackay, Thomas A. McMahon, Luis Mediero, Anna M Michalak, Franz Nobilis, Markus Oismüller, Tommaso Picciafuoco, Lenka Plavcová, Harihar Rajaram, Georg Reischer, Graham Sander, Eric Sauquet, Regina Sommer, Veena Srinivasan, Eleni Yeshaneh, Abdallah Alaoui, Emmanouil Anagnostou, Heiko Apel, Stacey Archfield, Alfred Becker, Keith Beven, Anicet R. Blanch, Dietrich Borchardt, Rudolf Brázdil, Martine Broer, Serena Ceola, Vincent Chaplot, Francis H. S. Chiew, Martin Clark, Jean Dominique Creutin, Alessio Domeneghetti, Marcela Doubková, Alexandru Dumitrescu, Gerhard Glatzel, David C. Goodrich, Shaun Harrigan, Denis Hughes, Graham Jewitt, Denny Kollanur, Zdeněk Kostka, Zbigniew W. Kundzewicz, Gerhard Kuschnig, Christian Leibundgut, Jeff McDonnell, Neil McIntyre, Pavol Miklánek, Peter Molnar, Vahid Naeimi, Lukas Nemeth, Martin Pfaundler, Ulrike Piock-Ellena, Helmut Rechberger, Hrvoje Ribičić, Dan Rosbjerg, Benjamin Schindler, Stanislaus Schymanski, Klaus Scipal, Rasmi Silasari, Mojca Šraj, Hermann Stadler, Gheorghe Stancalie, Annegret Thieken, Sally E. Thompson, Peter A. Troch, Robert Vertessy, Julia Vierheilig, David J. Wilson, and Hessel Winsemius.
This paper was edited by Alberto Guadagnini and reviewed by three anonymous referees.
Alaoui, A., Rogger, M., Peth, S., and Blöschl, G.: Does soil compaction increase floods? A review, J. Hydrol., 557, 631–642, https://doi.org/10.1016/j.jhydrol.2017.12.052, 2018.
Andersson, J. and Dverstorp, B.: Conditional simulations of fluid flow in three-dimensional networks of discrete fractures, Water Resour. Res., 23, 1876–1886, 1987.
Bierkens, M., Finke, P., and De Willigen, P.: Upscaling and downscaling methods for environmental research, Kluwer Academic, ISBN 9780792363392 - 190, 2000.
Bierkens, M. F. P., Bell, V. A., Burek, P., Chaney, N., Condon, L. E., David, C. H., de Roo, Ad, Döll, P., Drost, N., Famiglietti, J. S., Flörke, M., Gochis, D. J., Houser, P., Hut, R., Keune, J., Kollet, S., Maxwell, R. M., Reager, J. T., Samaniego, L., Sudicky, E., Sutanudjaja, E. H., van de Giesen, N., Winsemius, H., and Wood, E. F.: Hyper-resolution global hydrological modelling: what is next? “Everywhere and locally relevant”, Hydrol. Process., 29, 310–320, 2015.
Biron, P. M., Robson, C., Lapointe, M. F., and Gaskin, S. J.: Comparing different methods of bed shear stress estimates in simple and complex flow fields, Earth Surf. Proc. Land., 29, 1403–1415, 2004.
Blöschl, G.: Scaling in hydrology, Hydrol. Process., 15, 709–711, 2001.
Blöschl, G.: Flood warning – on the value of local information, International Journal of River Basin Management, 6, 41–50, 2008.
Blöschl, G. and Zehe, E.: On hydrological predictability, Hydrol. Process., 19, 3923–3929, 2005.
Blöschl, G., Sivapalan, M., Gupta, V. K., Beven, K., and Lettenmaier, D.: Special section on scale problems in hydrology, Water Resour. Res., 33, 2881–2999, 1997.
Blöschl, G., Reszler, C., and Komma, J.: A spatially distributed flash flood forecasting model, Environ. Modell. Softw., 23, 464–478, 2008.
Blöschl, G., Nester, T., Komma, J., Parajka, J., and Perdigão, R. A. P.: The June 2013 flood in the Upper Danube Basin, and comparisons with the 2002, 1954 and 1899 floods, Hydrol. Earth Syst. Sci., 17, 5197–5212, https://doi.org/10.5194/hess-17-5197-2013, 2013.
Blöschl, G., Gaál, L., Hall, J., Kiss, A., Komma, J., Nester, T., Parajka, J., Perdigão, R.A.P, Plavcová, L., Rogger, M. Salinas, J. L., and Viglione, A.: Increasing river floods: fiction or reality?, Wiley Interdisciplinary Reviews: Water, 2, 329–344, 2015.
Blöschl, G., Blaschke, A. P., Broer, M., Bucher, C., Carr, G., Chen, X., Eder, A., Exner-Kittridge, M., Farnleitner, A., Flores-Orozco, A., Haas, P., Hogan, P., Kazemi Amiri, A., Oismüller, M., Parajka, J., Silasari, R., Stadler, P., Strauss, P., Vreugdenhil, M., Wagner, W., and Zessner, M.: The Hydrological Open Air Laboratory (HOAL) in Petzenkirchen: a hypothesis-driven observatory, Hydrol. Earth Syst. Sci., 20, 227–255, https://doi.org/10.5194/hess-20-227-2016, 2016.
Blöschl, G., Hall, J., Parajka, J., Perdigão, R. A. P., Merz, B., Arheimer, B., Aronica, G. T., Bilibashi, A., Bonacci, O., Borga, M., Canjevac, I., Castellarin, A., Chirico, G. B., Claps, P., Fiala, K., Frolova, N., Gorbachova, L., Gül, A., Hannaford, J., Harrigan, S., Kireeva, M., Kiss, A., Kjeldsen, T. R., Kohnová, S., Koskela, J. J., Ledvinka, O., Macdonald, N., Mavrova-Guirguinova, M., Mediero, L., Merz, R., Molnar, P., Montanari, A., Murphy, C., Osuch, M., Ovcharuk, V., Radevski, I., Rogger, M., Salinas, J. L., Sauquet, E., Šraj, M., Szolgay, J., Viglione, A., Volpi, E., Wilson, D., Zaimi, K., and Živkovic, N.: Changing climate shifts timing of European floods, Science, 357, 588–590, 2017.
Blöschl, G., Bierkens, M. F.P., Chambel, A., et al.: Twenty-three Unsolved Problems in Hydrology (UPH) – a community perspective, Hydrolog. Sci. J., 64, 1141–1158, https://doi.org/10.1080/02626667.2019.1620507, 2019.
Deng, J., Yin, H., Kong, F., Chen, J., Dronova, I., and Pu, Y.: Determination of runoff response to variation in overland flow area by flow routes using UAV imagery, J. Environ. Manage., 265, 109868, https://doi.org/10.1016/j.jenvman.2019.109868, 2020.
Dooge, J. C.: Looking for hydrologic laws, Water Resour. Res., 22, 46S–58S, 1986.
Dunne, T.: Wolman Lecture: hydrologic science in landscapes on a planet in the future, Hydrologic Sciences: Taking Stock and Looking Ahead, 10–43, 1998.
Dunne, T. and Black, R. D.: An experimental investigation of runoff production in permeable soils, Water Resour. Res., 6, 478–490, 1970.
DWA: Estimation of flood probabilities. Guideline DWA-M 552, in German [Ermittlung von Hochwasserwahrscheinlichkeiten], German Association for Water, Wastewater and Waste (DWA) Hennef, Germany, ISBN 978-3-942964-25-8, 2012.
Flury, M., Flühler, H., Jury, W. A., and Leuenberger, J.: Susceptibility of soils to preferential flow of water: A field study, Water Resour. Res., 30, 1945–1954, 1994.
Freeze, R. A. and Harlan, R. L.: Blueprint for a physically-based, digitally-simulated hydrologic response model, J. Hydrol., 9, 237–258, 1969.
Gaál, L., Szolgay, J., Kohnová, S., Parajka, J., Merz, R., Viglione, A., and Blöschl, G.: Flood timescales: Understanding the interplay of climate and catchment processes through comparative hydrology, Water Resour. Res., 48, W04511, https://doi.org/10.1029/2011WR011509, 2012.
Grayson, R. and Blöschl, G.: Spatial processes, organisation and patterns, in: Spatial patterns in catchment hydrology, edited by: Grayson, R. and Blöschl, G, Cambridge University Press, 3–16, ISBN 9780521633161, 2001.
Grayson, R. B., Western, A. W., Chiew, F. H., and Blöschl, G.: Preferred states in spatial soil moisture patterns: local and non-local controls, Water Resour. Res., 33, 2897–2908, 1997.
Gupta, V. K., Rodríguez-Iturbe I., and Wood, E. F.: Scale Problems in Hydrology, Runoff Generation and Basin Response, D. Reidel Publ., 246 pp., ISBN 978-90-277-2258-4, 1986.
Hofstätter, M. and Blöschl G.: Vb cyclones synchronized with the Arctic-/North Atlantic Oscillation, J. Geophys. Res.-Atmos., 124, 3259–3278, https://doi.org/10.1029/2018JD029420, 2019.
Hofstätter, M., Chimani, B., Lexer, A., and Blöschl, G.: A new classification scheme of European cyclone tracks with relevance to precipitation, Water Resour. Res., 52, 7086–7104, https://doi.org/10.1002/2016WR019146, 2016.
Hofstätter, M., Lexer, A., Homann, M., and Blöschl, G.: Large-scale heavy precipitation over central Europe and the role of atmospheric cyclone track types, Int. J. Climatol., 38, e497–e517, https://doi.org/10.1002/joc.5386, 2018.
Horton, R. E.: The role of infiltration in the hydrologic cycle, EOS T. Am. Geophys. Un., 14, 446–460, 1933.
Jenny, H.: Factors of soil formation – a system of quantitative pedology, McGraw-Hill, New York, 281 pp., ISBN 0-486-68128-9, 1941.
Jury, W. A. and Horton, R.: Soil physics, John Wiley & Sons, ISBN 978-0-471-05965-3, 2004.
Kalma, J. D. and Sivapalan, M.: Scale issues in hydrological modelling, edited by: Kalma, J. D. and Sivapalan, M., John Wiley and Sons, 489 pp., ISBN 978-0-471-95847-5, 1995.
Kemter, M., Merz, B., Marwan, N., Vorogushyn, S., and Blöschl, G.: Joint trends in flood magnitudes and spatial extents across Europe, Geophys. Res. Lett., 47, e2020GL087464, https://doi.org/10.1029/2020GL087464, 2020.
Kim, J., Moon, H., Guan, B., Waliser, D. E., Choi, J., Gu, T. Y., and Byun, Y. H.: Precipitation characteristics related to atmospheric rivers in East Asia, Int. J. Climatol., 41, E2244–E2257, 2021.
Kolmogoroff, A.: Über die analytischen Methoden in der Wahrscheinlichkeitsrechnung, Math. Ann., 104, 415–458, 1931.
Langner, S., Hennigs, N., and Wiedmann, K.-P.: Social persuasion: targeting social identities through social influencers, J. Consum. Mark., 30, 31–49, https://doi.org/10.1108/07363761311290821, 2013.
Merz, B., Aerts, J., Arnbjerg-Nielsen, K., Baldi, M., Becker, A., Bichet, A., Blöschl, G., Bouwer, L. M., Brauer, A., Cioffi, F., Delgado, J. M., Gocht, M., Guzzetti, F., Harrigan, S., Hirschboeck, K., Kilsby, C., Kron, W., Kwon, H.-H., Lall, U., Merz, R., Nissen, K., Salvatti, P., Swierczynski, T., Ulbrich, U., Viglione, A., Ward, P. J., Weiler, M., Wilhelm, B., and Nied, M.: Floods and climate: emerging perspectives for flood risk assessment and management, Nat. Hazards Earth Syst. Sci., 14, 1921–1942, https://doi.org/10.5194/nhess-14-1921-2014, 2014.
Merz, R. and Blöschl, G.: A process typology of regional floods, Water Resour. Res., 39, 1340, https://doi.org/10.1029/2002WR001952, 2003.
Merz, R. and Blöschl, G.: Flood frequency hydrology: 1. Temporal, spatial, and causal expansion of information, Water Resour. Res., 44, W08432, https://doi.org/10.1029/2007WR006744, 2008.
Merz, B., Blöschl, G., Vorogushyn, S., Dottori, F., Aerts, J. C., Bates, P., Bertola, M., Kemter, M., Kreibich, H., Lall, U., and Macdonald, E.: Causes, impacts and patterns of disastrous river floods, Nature Reviews Earth & Environment, 2, 592–609, 2021.
Milne, G.: Some suggested units of classification and mapping, particularly of East African soils. Soil Research, Supplements to the Proceedings of the International Society of Soil Science, 4, 183–198, 1935.
Montanari, A. and Koutsoyiannis, D.: A blueprint for process-based modeling of uncertain hydrological systems, Water Resour. Res., 48, W09555, https://doi.org/10.1029/2011WR011412, 2012.
Nester, T., Komma, J., and Blöschl, G.: Real time flood forecasting in the Upper Danube basin, J. Hydrol. Hydromech., 64, 404–414, https://doi.org/10.1515/johh-2016-0033, 2015.
O'Neill, M. M. F., Tijerina, D. T., Condon, L. E., and Maxwell, R. M.: Assessment of the ParFlow–CLM CONUS 1.0 integrated hydrologic model: evaluation of hyper-resolution water balance components across the contiguous United States, Geosci. Model Dev., 14, 7223–7254, https://doi.org/10.5194/gmd-14-7223-2021, 2021.
ÖWAV: Rainfall-runoff modelling, Guideline 220 [Niederschlag-Abfluss-Modellierung], Austrian Water and Waste Management Association (ÖWAV), Vienna, Austria, https://www.oewav.at/Publikationen?current=372330&mode=form (last access: 10 May 2022), 2019 (in German).
Penna, D., Tromp-van Meerveld, H. J., Gobbi, A., Borga, M., and Dalla Fontana, G.: The influence of soil moisture on threshold runoff generation processes in an alpine headwater catchment, Hydrol. Earth Syst. Sci., 15, 689–702, https://doi.org/10.5194/hess-15-689-2011, 2011.
Rajaram, H.: Debates – Stochastic subsurface hydrology from theory to practice: Introduction, Water Resour. Res., 52, 9215–9217, https://doi.org/10.1002/2016WR020066, 2016.
Reszler, C., Komma, J., Stadler, H., Strobl, E., and Blöschl, G.: A propensity index for surface runoff on a karst plateau, Hydrol. Earth Syst. Sci., 22, 6147–6161, https://doi.org/10.5194/hess-22-6147-2018, 2018.
Rigon, R., Formetta, G., Bancheri, M., Tubini, N., D'Amato, C., David, O., and Massari, C.: HESS Opinions: Participatory Digital Earth Twin Hydrology systems (DARTHs) for everyone: a blueprint for hydrologists, Hydrol. Earth Syst. Sci. Discuss. [preprint], https://doi.org/10.5194/hess-2021-644, in review, 2022.
Richards, L. A.: Capillary conduction of liquids through porous mediums, Physics, 1, 318–333, 1931.
Rodriguez-Iturbe, I. and Gupta, V. K.: Scale problems in hydrology, J. Hydrol., 65, 1–257, 1983.
Savenije, H. H. G. and Hrachowitz, M.: HESS Opinions ”Catchments as meta-organisms – a new blueprint for hydrological modelling”, Hydrol. Earth Syst. Sci., 21, 1107–1116, https://doi.org/10.5194/hess-21-1107-2017, 2017.
Silasari, R., Parajka, J., Ressl, C., Strauss, P., and Blöschl, G.: Potential of time-lapse photography for identifying saturation area dynamics on agricultural hillslopes, Hydrol. Process., 31, 3610–3627, https://doi.org/10.1002/hyp.11272, 2017.
Sivapalan, M.: Process complexity at hillslope scale, process simplicity at the watershed scale: is there a connection?, Hydrol. Process., 17, 1037–1041, 2003.
Sivapalan, M.: From engineering hydrology to Earth system science: milestones in the transformation of hydrologic science, Hydrol. Earth Syst. Sci., 22, 1665–1693, https://doi.org/10.5194/hess-22-1665-2018, 2018.
Sivapalan, M. and Blöschl, G.: Time scale interactions and the coevolution of humans and water, Water Resour. Res., 51, 6988–7022, https://doi.org/10.1002/2015WR017896, 2015.
Sivapalan, M. and Blöschl, G.: The growth of hydrological understanding: Technologies, ideas, and societal needs shape the field, Water Resour. Res., 53, 8137–8146, https://doi.org/10.1002/2017WR021396, 2017.
Smith, R. E., Smettem, K. R., Broadbridge, P., and Woolhiser, D. A.: Infiltration theory for hydrologic applications, Water Resources Monograph Series Vol. 15, American Geophysical Union, ISBN 978-0-875-90319-4, 2002.
Tarasova, L., Merz, R., Kiss, A., Basso, S., Blöschl, G., Merz, B., Viglione, A., Plötner, S., Guse, B., Schumann, A., Fischer, S., Ahrens, B., Anwar, F., Bárdossy, A., Bühler, P., Haberlandt, U., Kreibich, H., Krug, A., Lun, D., Müller-Thomy, H., Pidoto, R., Primo, C., Seidel, J., Vorogushyn, S., and Wietzke, L.: Causative classification of river flood events, Wiley Interdisciplinary Reviews: Water, 6, e1353, https://doi.org/10.1002/wat2.1353, 2019.
Tarasova, L., Basso, S., Wendi, D., Viglione, A., Kumar, R., and Merz, R.: A process-based framework to characterize and classify runoff events: The event typology of Germany, Water Resour. Res., 56, e2019WR026951, https://doi.org/10.1029/2019WR026951, 2020.
Tessier, D.: Behaviour and Microstructure of Clay Minerals, in: Soil Colloids and Their Associations in Aggregates, edited by: De Boodt, M. F., Hayes, M. H. B., Herbillon, A., De Strooper, E. B. A., and Tuck, J. J., NATO ASI Series, vol. 214, Springer, Boston, MA, https://doi.org/10.1007/978-1-4899-2611-1_14, 1990.
Thompson, S. E., Harman, C. J., Troch, P. A., Brooks, P. D., and Sivapalan, M.: Spatial scale dependence of ecohydrologically mediated water balance partitioning: A synthesis framework for catchment ecohydrology, Water Resour. Res., 47, W00J03, https://doi.org/10.1029/2010WR009998, 2011.
Tromp-van Meerveld, H. J. and McDonnell, J. J.: Threshold relations in subsurface stormflow: 2. The fill and spill hypothesis, Water Resour. Res., 42, W02411, https://doi.org/10.1029/2004WR003800, 2006.
Tuller, M. and Or, D.: Hydraulic functions for swelling soils: pore scale considerations, J. Hydrol., 272, 50–71, 2003.
van Bebber, W. J.: Die Zugstrassen der barometrischen Minima nach den Bahnenkarten der Deutschen Seewarte für den Zeitraum 1875–1890, Meteorol. Z., 8, 361–366, 1891.
Viglione, A., Chirico, G. B., Woods, R., and Blöschl, G.: Generalised synthesis of space–time variability in flood response: An analytical framework, J. Hydrol., 394, 198–212, 2010.
Viglione, A., Merz, R., Salinas, J. L., and Blöschl, G.: Flood frequency hydrology: 3. A Bayesian analysis, Water Resour. Res., 49, 675–692, https://doi.org/10.1029/2011WR010782, 2013.
Vorogushyn, S., Merz, B., Lindenschmidt, K. E., and Apel, H.: A new methodology for flood hazard assessment considering dike breaches, Water Resour. Res., 46, W08541, https://doi.org/10.1029/2009WR008475, 2010.
Vreugdenhil, M., Szeles, B., Silasari, R., Salinas, J. L., Strauss, P., Oismueller, M., Hogan, P., Wagner, W., and Blöschl, G.: Nonlinear controls on event runoff generation in a small agricultural catchment, in review, 2022.
Weinberg, G. M.: An Introduction to General Systems Thinking, Wiley-Interscience, New York, ISBN 978-0-932633-49-1, 1975.
Western, A. W., Blöschl, G., and Grayson, R. B.: How well do indicator variograms capture the spatial connectivity of soil moisture?, Hydrol. Process., 12, 1851–1868, 1998.
Western, A. W., Blöschl, G., and Grayson, R. B.: Toward capturing hydrologically significant connectivity in spatial patterns, Water Resour. Res., 37, 83–97, 2001.
Western, A. W., Grayson, R. B., and Blöschl, G.: Scaling of soil moisture: A hydrologic perspective, Annual Rev. Earth Pl. Sc., 30, 149–180, 2002.
Wood, E. F., Roundy, J. K., Troy, T. J., Van Beek, L. P. H., Bierkens, M. F., Blyth, E., de Roo, A., Döll, P., Ek, M., Famiglietti, J., Gochis, D., van de Giesen, N., Houser, P., Jaffé, P. R., Kollet, S., Lehner, B., Lettenmaier, D. P., Peters-Lidard, C., Sivapalan, M., Sheffield, J., Wade, A., and Whitehead, P.: Hyperresolution global land surface modeling: Meeting a grand challenge for monitoring Earth's terrestrial water, Water Resour. Res., 47, W05301, https://doi.org/10.1029/2010WR010090, 2011.
Woods, R. and Sivapalan, M.: A synthesis of space-time variability in storm response: Rainfall, runoff generation, and routing, Water Resour. Res., 35, 2469–2485, 1999.
Zehe, E., Blume, T., and Blöschl, G. The principle of “maximum energy dissipation”: a novel thermodynamic perspective on rapid water flow in connected soil structures, Philos. T. R. Soc. B, 365, 1377–1386, 2010.
Zehe, E., Elsenbeer, H., Lindenmaier, F., Schulz, K., and Blöschl, G.: Patterns of predictability in hydrological threshold systems, Water Resour. Res., 43, W07434, https://doi.org/10.1029/2006WR005589, 2007.
- Abstract
- Introduction
- How do raindrops aggregate to form a flood?
- The pore scale: 10−3 m
- The profile scale: 100 m
- The hillslope scale: 102 m
- The catchment scale: 103 m
- The regional scale: 105 m
- The continental scale: 107 m
- Conclusions
- Data availability
- Competing interests
- Disclaimer
- Acknowledgements
- Review statement
- References