the Creative Commons Attribution 4.0 License.
the Creative Commons Attribution 4.0 License.
 | 19 Apr 2022
Recent decrease in summer precipitation over the Iberian Peninsula closely links to reduction in local moisture recycling
Yubo Liu
Monica Garcia
Chi Zhang
The inherently dry summer climate of the Iberian Peninsula (IP) is undergoing drought exacerbated by more intense warming and reduced precipitation. Although many studies have studied changes in summer climate factors, it is still unclear how the changes in moisture contribution from the sources lead to the decrease in summer precipitation. This study investigates the differences in the IP precipitationshed from 1980 to 1997 and 1998 to 2019 using the Water Accounting Model-2layers with ERA5 data, and assesses the role of local moisture recycling and external moisture in reducing summer precipitation. Our findings indicate that the moisture contributions from the local IP, and from the west and the east of the precipitationshed, contributed 1.7, 3.6 and 1.1 mm per month less precipitation after 1997 than before 1997, accounting for 26 %, 57 % and 17 % of the main source supply reduction, respectively. The significant downward trend of the IP local moisture recycling closely links to the disappearance of the wet years after 1997 as well as the decrease in local contribution in the dry years. Moreover, the feedback between the weakened local moisture recycling and the drier land surface can exacerbate the local moisture scarcity and summer drought.
- Article
(3744 KB) - Full-text XML
- BibTeX
- EndNote


The Iberian Peninsula (IP) is located in the Mediterranean basin, which is among the global “hotspots” of climate change. The IP precipitation is characterized by the diverse climatic regimes and high spatial variability as a consequence of its geographic position between the Atlantic Ocean and the Mediterranean Sea and its orographic configuration. In responding to climate change with frequent heatwaves and above-average warming, the IP is experiencing widespread decreases in precipitation, especially in summer (Brogli et al., 2019; Cramer et al., 2018; Rajczak and Schär, 2017). This reduction in summer precipitation is a major driver of water resource depletion and the evolution of drought (Lopez-Bustins and Lemus-Canovas, 2020; Páscoa et al., 2021; Teuling et al., 2013). To clarify the reason for the decrease in summer precipitation, it is necessary to explain the changes in moisture contribution from the sources, such as local moisture recycling and external sources.
Analysis of source supply and transportation in the hydrological cycle has become one efficient way to understand well regional precipitation. With the introduction of the concept of precipitationshed (Keys et al., 2012, 2014), which better reveals the contribution from upwind evaporation sources to the precipitation in downwind sink region, it is more scientific and systematic to explain the precipitation variations by using the fluctuations of moisture contribution as a precursor. Given the importance of studying the source of precipitation, that is, precipitationshed, a variety of methods have been developed and adopted, including physical isotope analysis (Bonne et al., 2014), and numerical analytical models, either online methods running in parallel with climate models (Damián and Gonzalo, 2018; Stohl and James, 2004, 2005), or offline “posteriori models” (van der Ent and Savenije, 2011; van der Ent et al., 2010, 2013). Furthermore, the local moisture recycling, which describes the local precipitation–evaporation feedback relationship, has been proposed to further differentiate regional local and external contributions to the designated area. Although the mechanisms of these studies are different, they all emphasize that the constantly changing source–sink relationship of atmospheric moisture is an essential part of climate change research as global change continues.
Gimeno et al. (2010) comprehensively investigated the atmospheric moisture sources of the IP precipitation at different scales, and identified the tropical–subtropical North Atlantic corridor, the surrounding Mediterranean Sea and the local IP as important moisture regions. The high precipitation in the cold season is mainly dominated by westerly wind regimes. The mid-latitude atmospheric dynamics, such as the baroclinic synoptic-scale perturbations from the Atlantic and the polar jet stream, as well as the high moisture supply from an Atlantic “tropospheric river”, seem to be responsible for the abundant precipitation during the cold season (Cortesi et al., 2013; Ulbrich et al., 2015; Zhu and Newell, 1998). Compared with the rainy winter, the summer with very low precipitation receives less attention. The subtropical location under the descending air extending from the North Atlantic subtropical high controls low summer precipitation over the IP, and local convective events increase the importance of local moisture recycling during summer (Serrano et al., 1999). Accordingly, the summer IP precipitation, with a significant proportion of the locally recycled moisture, is completely different from the winter IP precipitation that is dominated by the distant external moisture.
In recent decades, the increasing severity of summer drought in the IP, which is closely related to precipitation variations, has attracted more attention. Several mechanisms, including soil–atmosphere interactions (Boé and Terray, 2014), cloud processes (Lenderink et al., 2007; Tang et al., 2012) and large-scale circulation changes (Boé et al., 2009; Brogli et al., 2019; Kröner et al., 2017), have been found to be potentially important for this complex summer climate change, and also appear to have an impact on the precipitation reduction. Such anomaly of summer precipitation in the sink is inevitably linked to source changes, but there is still a lack of knowledge about how source moisture contributes to precipitation decline. Therefore, tracing the precipitationshed of the IP and quantifying the moisture contributions can provide us with a new perspective to analyze the changes in IP precipitation. This study aims to evaluate the moisture contribution of the local moisture recycling and external sources to the reduced summer precipitation over the IP. It can provide a scientific reference for the prediction and management of droughts that may be caused by precipitation reduction from the perspective of source moisture contribution.
2.1 Study area
The IP is located in southwestern Europe at midlatitudes of the Northern Hemisphere. It covers Portugal and the mainland of Spain. The geographic location of IP is shown in Fig. 1a (36–44∘ N, 10∘ W–3∘ E) in a transition zone between midlatitude and subtropical atmospheric circulation regimes. It has a complex topography, surrounded by the Atlantic Ocean and Mediterranean Sea, and is elevated in the middle and northeast. The topographic and coastal processes affect water vapor transport, forming a spatial precipitation gradient from the northwest to the southeast. Extracted from the land–sea mask provided by the European Centre for Medium-range Weather Forecasts (ECMWF), the red outline area composed of multiple single 1×1∘ grids is our study area of the IP.
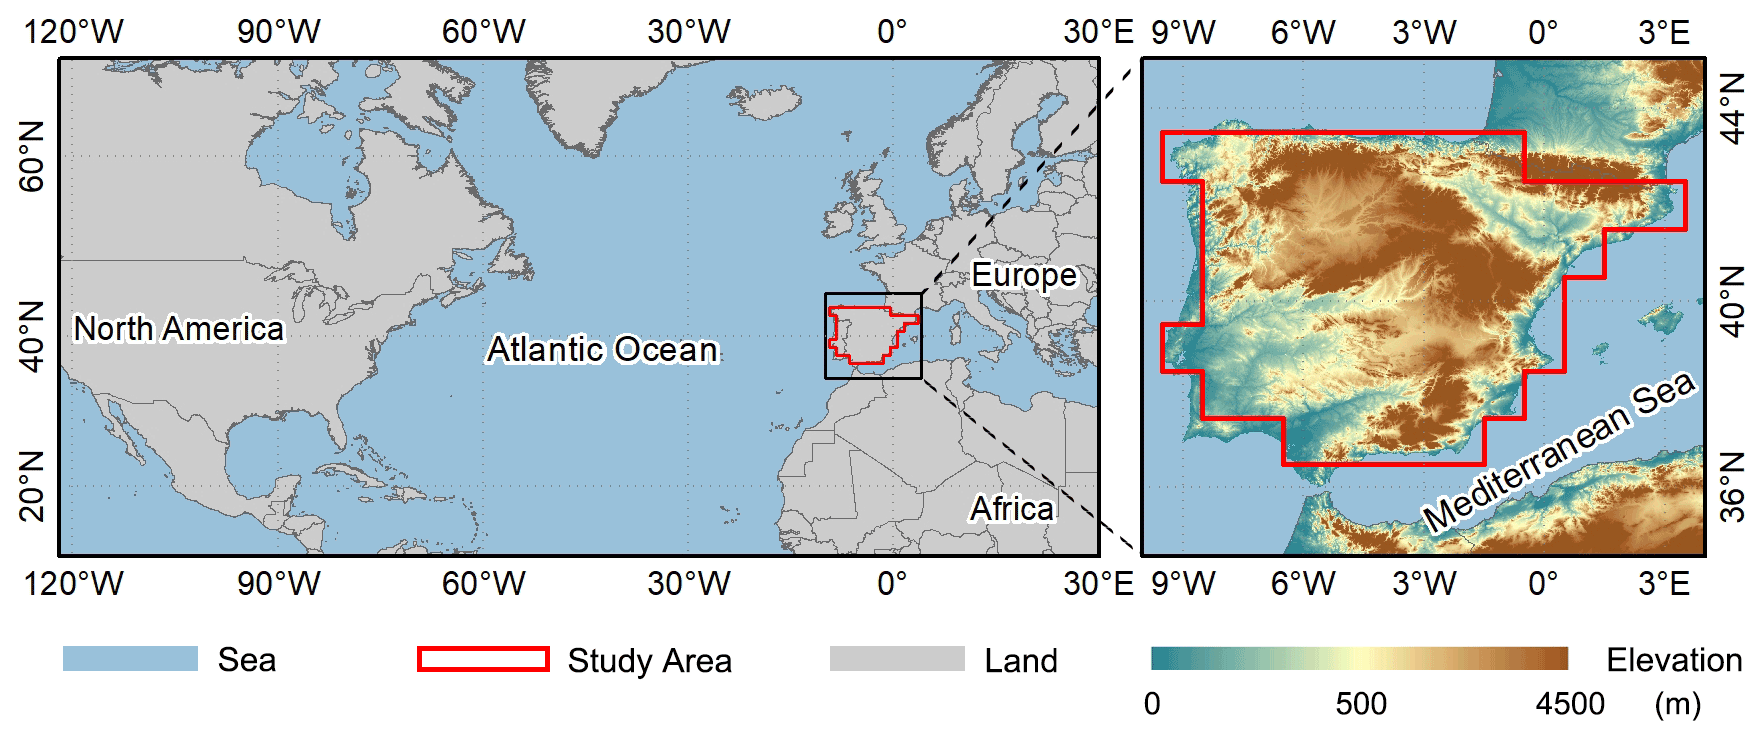
Figure 1Map of the IP (the area enclosed by the red line) on a grid of as the target region.
2.2 Data
The newest reanalysis data held in the ECMWF data archive, the ERA5 dataset downloaded from the Copernicus Climate Change Service (C3S) Climate Data Store (CDS), is used in this study (Hersbach et al., 2020). The variables include surface pressure, precipitation, evaporation, total column water and vertical integrated eastward and northward atmospheric water fluxes (including cloud liquid water flux, cloud frozen water flux and water vapor flux) on a single level, as well as the horizontal components of wind fields and specific humidity at the lowest 23rd pressure levels (200–1000 hPa). The time resolution and spatial resolution selected for these data are 1 h and 1×1∘, respectively. This dataset covers the period from 1980 to 2019. Compared with the old version reanalysis data (e.g., ERA-Interim or ERA-40), ERA5 combines vast amounts of historical observations into global estimates using more advanced modeling and data assimilation systems (Hersbach et al., 2020).
As the ERA5 precipitation is a global forecast dataset with some uncertainties, its reliability in the IP region needs to be verified. Therefore, an observational gridded dataset generated from a dense network of stations over the IP, named the Iberia01 (Herrera et al., 2019), is used to verify the accuracy of the ERA5 precipitation data. The Iberia01 provides the daily precipitation for the period of 1971–2015 at 0.1×0.1∘.
2.3 Model and methods
2.3.1 Water Accounting Model-2layers
Water Accounting Model-2layers (WAM-2layers) is an offline Eulerian method tracking the moisture cycle forwards or backwards that quantifies the source–sink relations (van der Ent et al., 2013, 2014). Its backward algorithm was used in this study to trace the precipitationshed of the IP. The model of WAM-2layers is an updated version of the original WAM. The water vapor balance equation in the WAM-2layers algorithm maintains the premise that the atmosphere is well mixed, but compared with the previous model, it takes the stratification of the atmosphere into consideration. Thus, when the algorithm is applied to a specific region, the calculation is as follows:
where W is the atmospheric moisture storage, or namely, precipitable water; t is time; u and v are the wind components in x (zonal) and y (meridional) direction, respectively; E is evaporation; P is precipitation; FV is the vertical moisture transport between the bottom and top layers; α is a residual term, which results from the ERA5 data assimilation and the coarser resolution scheme in the model calculation (van der Ent et al., 2014); the subscript “l” represents the portion in layer “l” (either the bottom layer or the top layer); and the subscript “r” represents the tagged portion provided by the source region.
Based on the assumption of a well-mixed atmosphere (Burde, 2010; Goessling and Reick, 2013), the moisture contribution, that is, the tagged evaporation Er, can be calculated considering that the ratio of tagged to total atmospheric water storage is equal to the ratio of tagged to total evaporation, as shown in Eq. (2). Considering that the proposed retention time of atmospheric moisture is about 7–10 d (Numaguti, 1999), we set the backtracking time as 1 month longer for summer precipitation to make sure that more than 90 % of the precipitation can be redistributed to the surface (Zhang et al., 2017).
The main moisture source supplying IP summer precipitation is defined as the 90th percentile precipitationshed in this study. It is further divided into subregions to evaluate the role of the contribution from each area, such as the local moisture recycling, which demonstrates the contribution of local evaporation to the IP precipitation, and the external advection moisture, which describes the non-local evaporation contribution to the IP precipitation. The contribution ratio (CR) of a subregion (A) is defined as the proportion of the moisture contribution from it to the total contribution from the main source region (MS), which is calculated as the following Eq. (3). The precipitation recycling ratio of the IP can be substituted with the IP local contribution ratio CRIP.
2.3.2 Significance test
The slope significance of trend fitting and the significance of the difference in the means are tested using Student t test in this study. Additionally, the moving t test, as a method of mutation analysis, is used to detect whether and when the sample mean in the IP precipitation series changed significantly. The precipitation series is divided into two non-overlapping adjacent segments of length n years before and after the reference year, to compare changes in the mean (Maasch, 1988),
where and denote the respective means of two segments, and and are their variances.
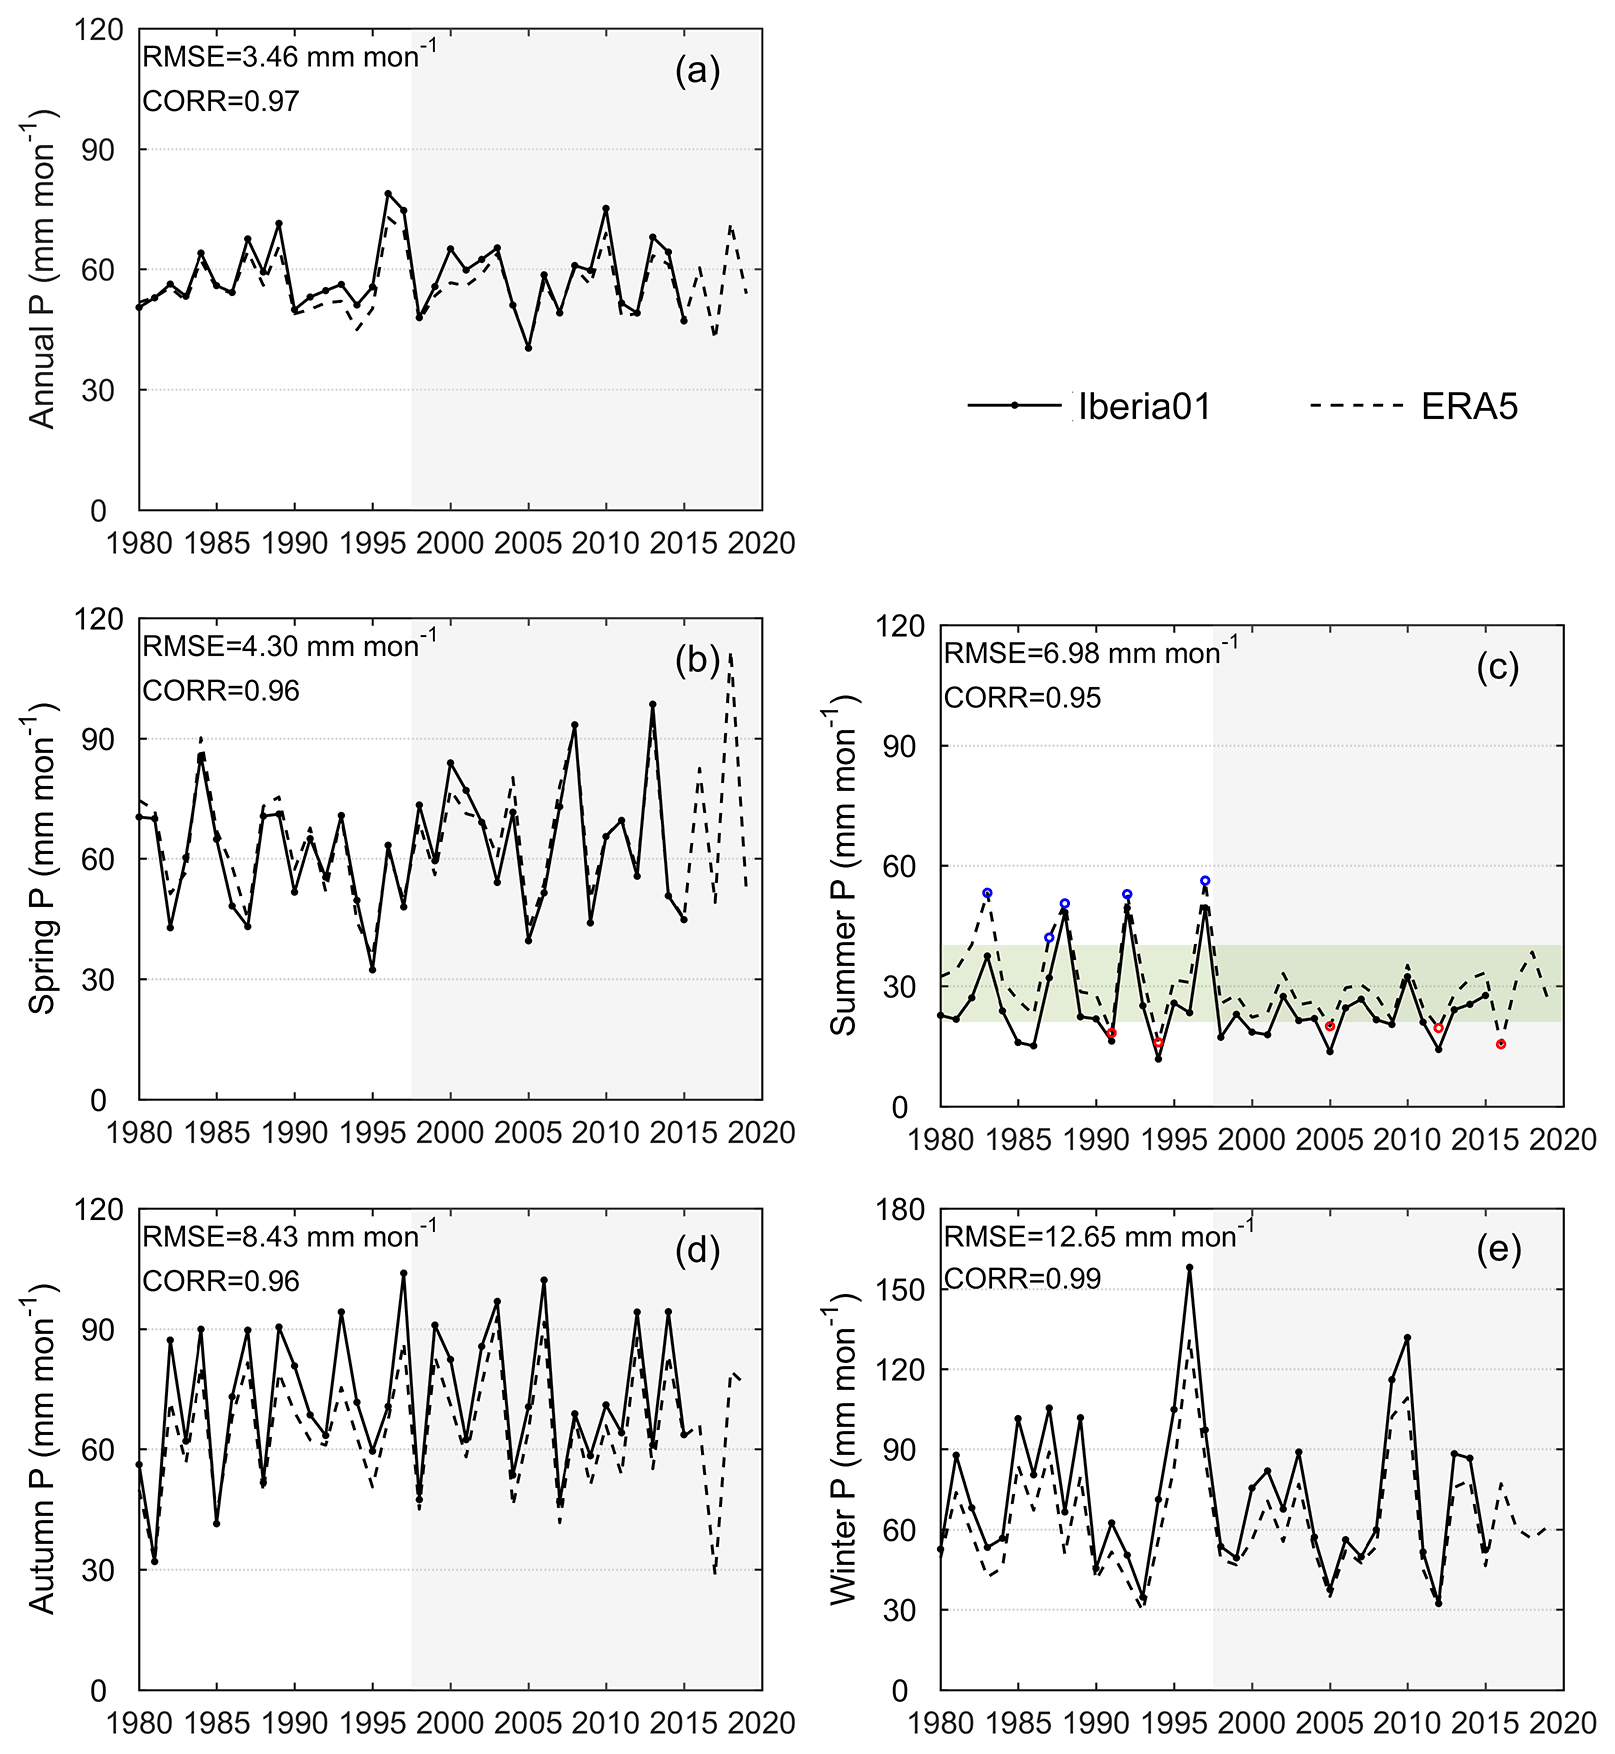
Figure 2Variations of IP (a) annual precipitation, (b) spring (March, April and May), (c) summer (June, July and August), (d) autumn (September, October and November) and (e) winter (December, January and February) during 1980–2019. The white shading is for the period 1980–1997 and the gray shading is for the period 1998–2019. The green shading covers the interval of one standard deviation of summer precipitation. The years with summer ERA5 precipitation exceeding the range of the green shading interval are circled in blue and red.
3.1 Evaluation and variation of precipitation data
The precipitation time series of the ERA5 and the Iberia01 data are shown in Fig. 2. The fluctuations and variations of the ERA5 precipitation data are in good agreement with the observed data on both annual and seasonal scales, together with all correlation coefficients higher than 0.95. The average annual precipitation over the IP is about 55.66 mm per month from ERA5 and 58.07 mm per month from Iberia01, respectively. Compared with the observed data, the reanalysis data slightly underestimates the IP precipitation with the root mean square error (RMSE) of 3.4 mm per month on the annual scale. The comparison of seasonal precipitation shows that the ERA5 is lower than the observed Iberia01 value in the rainy seasons (both winter and autumn), but higher in the dry summer. The RMSE between the two datasets of seasonal precipitation is in the range of 4.30–12.65 mm per month. Since the Iberia01 data is the grid data interpolated from observation site data (Herrera et al., 2019), some of the deviations between the ERA5 and the Iberia01 precipitation can be partially affected by the interpolation process rather than solely the result of the error generated by the reanalysis process. In general, the ERA5 precipitation data shows the characteristics of IP precipitation reasonably well and thus is suitable for studying the changes.
Only in summer, the mutation analysis results of the two sets of precipitation data, the Iberia01 (T value: 1.83) and the ERA5 (T value: 1.86), both show statistically significant changes at the 0.1 level in the year 1997. Accordingly, the entire 40-year period is divided into two periods, 1980–1997 and 1998–2019, to compare the difference in summer precipitation between the two periods. The average summer precipitation is 34.89 and 27.17 mm per month before and after 1997, respectively. Compared with 1980–1997, the average summer precipitation during 1998–2019 decreases by 7.72 mm (22.13 %) in the whole study area. On the grid scale, almost all grids have less precipitation after 1997, and more than half of all grids show the statistically significant reductions (Fig. 3). However, this change is unevenly distributed in space, as shown by the greater reduction in the grids on the northeastern IP that can even exceed 10 mm per month.
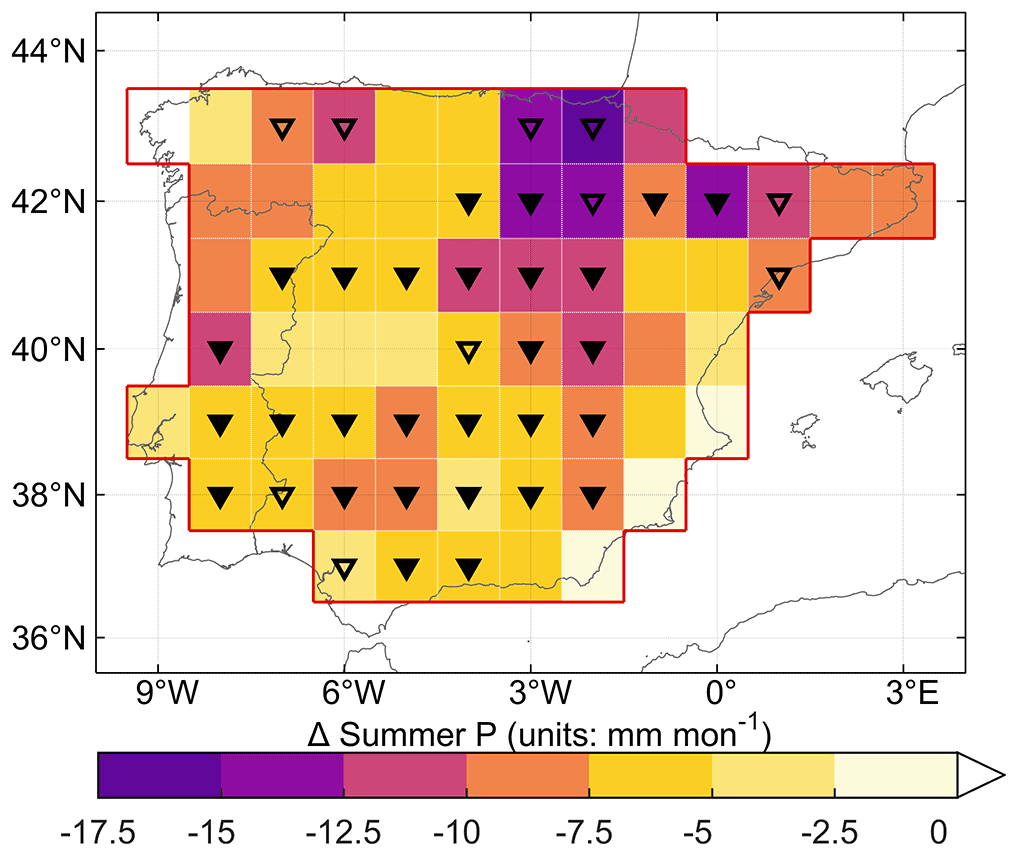
Figure 3The difference of average summer precipitation over the IP between 1998–2019 and 1980–1997 (average of 1998–2019 minus average of 1980–1997). The triangles indicate that the differences are significant at the 0.05 (solid) and 0.1 (hollow) levels.
For summer precipitation, the dry years (1991, 1994, 2005, 2012 and 2016) and the wet years (1983, 1987, 1988, 1992 and 1997) are selected, which are circled in Fig. 2c. A wet year is defined as the year in which the precipitation is more than one standard deviation above the average precipitation, and similarly, the precipitation in a dry year is lower than a standard deviation range. Accordingly, the division of time period also applies to the precipitation series of the dry and wet years. It is specifically observed that the dry years are distributed in both periods, with the average precipitation of 17.15 and 18.34 mm per month before and after 1997, whereas the wet years occur before 1997 with an average of 51.03 mm per month but disappear after 1997.
3.2 Changes in summer precipitationshed and regional contributions
From 1980 to 2019, the average value of the IP summer precipitation is about 30.64 mm per month. More than 93 % of this summer precipitation has been tracked by the global surface through modeling, averaging 28.53 mm per month. The climatology of the moisture contribution during the 40 years is shown in Fig. 4a. The moisture contribution to the IP generally decreases as its distance to IP increases. Although the precipitationshed of the IP summer precipitation is global in scope, the contribution of the area far away is too negligible to be considered. Therefore, the 90th precipitationshed enclosed by the black line in Fig. 4 is given full attention as the main moisture source region in the following text. The main moisture source of the IP covers not only the local grids in the study region, but also several of non-local land and oceanic areas. Due to the dominance of the westerlies in the tropical–subtropical North Atlantic corridor (Gimeno et al., 2010), most of the non-local source grids are located in the North American land and the North Atlantic Ocean west of the study area, which jointly form a relatively stable atmospheric basin in the global atmospheric moisture networks (Zhang et al., 2020) under the influence of the summer anticyclonic structure (Fig. 4a). The other source grids are located east of the North Atlantic Ocean and the IP, which is the downwind zone for water vapor transport, covering Western Europe and the Mediterranean. These eastern regions with positive atmospheric moisture divergence provide a net water flux to the atmosphere, moisten the air parcels flowing towards the surrounding land and become the main short-term moisture sources affecting the IP, especially the eastern IP (Gimeno et al., 2010; Vázquez et al., 2020). Hence, the main moisture sources are divided into the three partial regions of the local IP, the west and the east by the boundary of the study area and the eastern boundary of the Atlantic Ocean (red and blue lines in Fig. 4), and the contribution of each region to the IP precipitation can be quantified and compared.
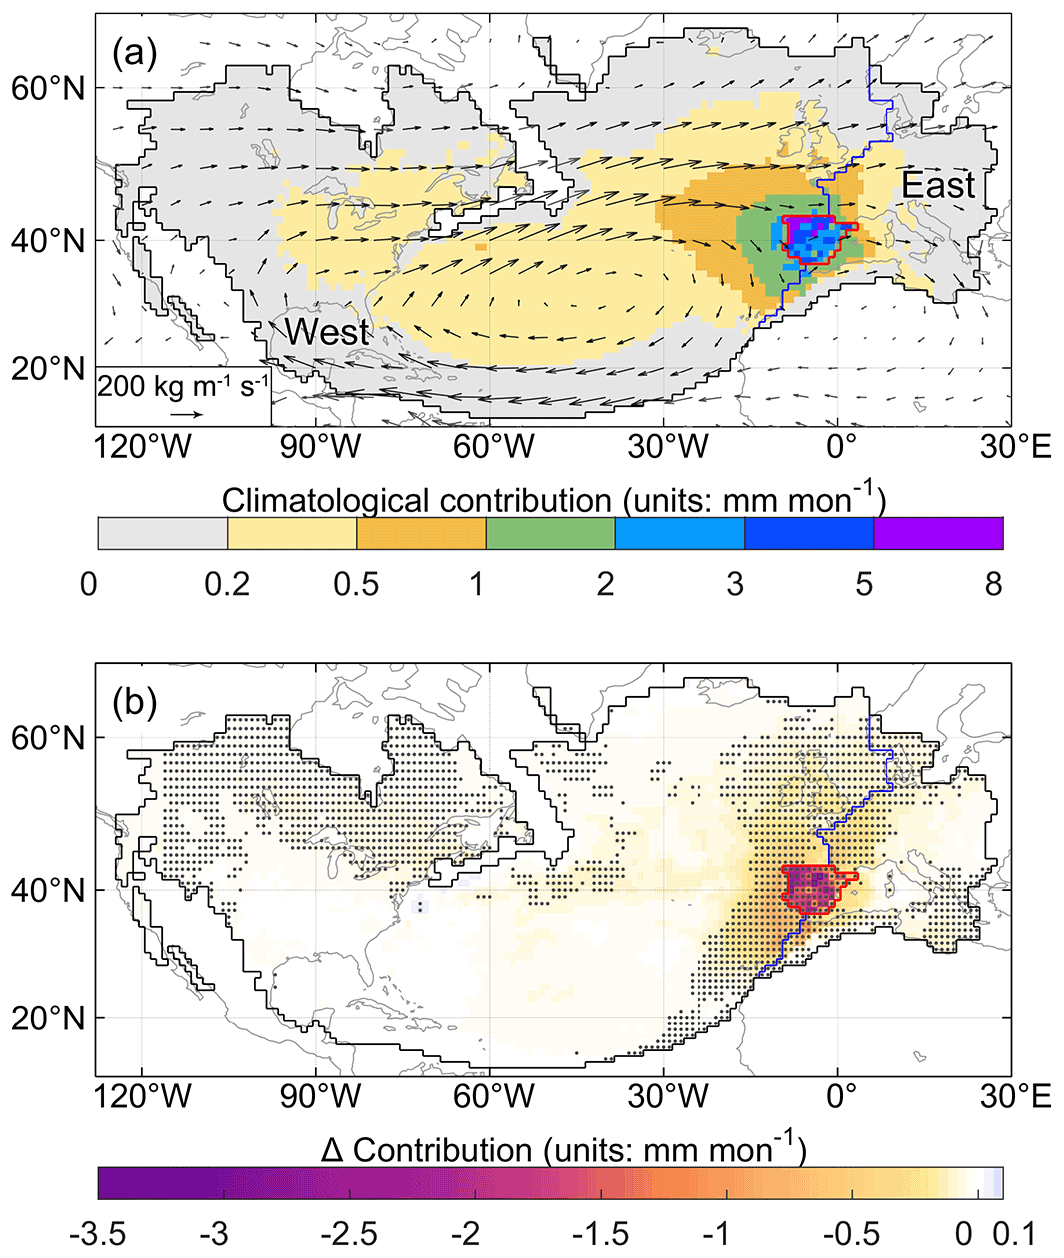
Figure 4(a) Climatological 90th precipitationshed of the IP sink region and moisture contribution to the IP summer precipitation from 1980 to 2019. The black outlines show the 90th precipitationshed boundary during the 40 years. The vectors represent the climatological monthly water vapor flux. The red line encloses the study area, and the blue line divides the precipitationshed excluding the IP into the west (left area) and the east (right area) regions. (b) Differences in the moisture contribution in the 90th precipitationshed between 1998–2019 and 1980–1997 (average of 1998–2019 minus average of 1980–1997). The dots indicate 0.1 significance of the difference.
Affected by the transport distance, the grids with high contribution are located in and around the target IP region, with the maximum values for grids in the northwest corner of the IP. The local IP contributes 3.46 mm per month average summer precipitation, with the precipitation recycling ratio of around 13.26 % during the 40 years. The west, as the largest subregion of the precipitationshed, contributes the most summer precipitation of 19.38 mm per month and occupies 76.06 % of the tracked precipitation on average, while the east region, which is in an unfavorable downwind position in the summer circulation, provides only 2.81 mm per month summer precipitation, accounting for 10.68 %.
The difference in moisture contribution obtained from the 1998–2019 period minus the 1980–1997 period is shown in Fig. 4b. Almost all grid contributions show a decrease after 1997. The grids with a large moisture contribution decline are mainly concentrated in the IP, with the maximum reduction exceeding an average of 3 mm per month (more than 50 % of its climatological moisture contribution). Compared with other non-local source grids, the grids with higher contributions along the east coast of the North Atlantic near the IP also have a slight but significant reduction in contribution.
Due to the uneven distribution of grid contribution reduction in space, the area of different percentile precipitationsheds differs in the two periods. The areas with different colors in the distribution map of Fig. 5 represent the precipitationshed boundaries at different percentiles in the two periods. During 1998–2019, the precipitationshed boundary of each percentile extends westward in varying degrees compared with those before 1997. The top decile of the contribution is still in the western half of the IP. In the North Atlantic, the westward expansion of the western boundary of the precipitationsheds is conspicuous, especially the 45th and 60th percentile precipitationsheds shown in orange and green color in Fig. 5a and b. This westward extension implies that the significant and substantial reduction in the contribution of the local grids and its surrounding grids results in a decrease in the proportion of these areas. Therefore, for the same percentile of the precipitationshed, only a smaller area concentrated by high-contribution grids is sufficient before 1997. However, a larger area is required for the same proportion after 1997.

Figure 5Different percentile precipitationsheds during the two periods (a) 1980–1997 and (b) 1998–2019. The proportion of the cumulative contribution to the IP precipitation from all areas enclosed by the contour line is the percentile indicated by the corresponding color.
Figure 6a shows the quantified precipitation contributed by the local IP, the west and the east regions. The negative slopes in Fig. 6a indicate that the summer precipitation contributed by these three regions has a downward trend, especially significant for the IP and the west with slopes of −0.59 and −1.28 mm per month per decade. These decreasing trends cause a 6.38 mm per month difference in precipitation from the main source region in the two periods, which explains 82.64 % of the total reduction in the IP summer precipitation (7.72 mm per month). In terms of the difference in the average values of each region, the precipitation contributed by the local IP, the west and the east significantly decreases from 4.38, 21.37 and 3.41 mm per month in 1980–1997 to 2.71, 17.76 and 2.32 mm per month in 1998–2019, respectively. Of the difference in the main source supply between the two periods, 26.32 %, 56.53 % and 17.15 % are due to the contribution decline from the local IP, the west and the east, respectively.
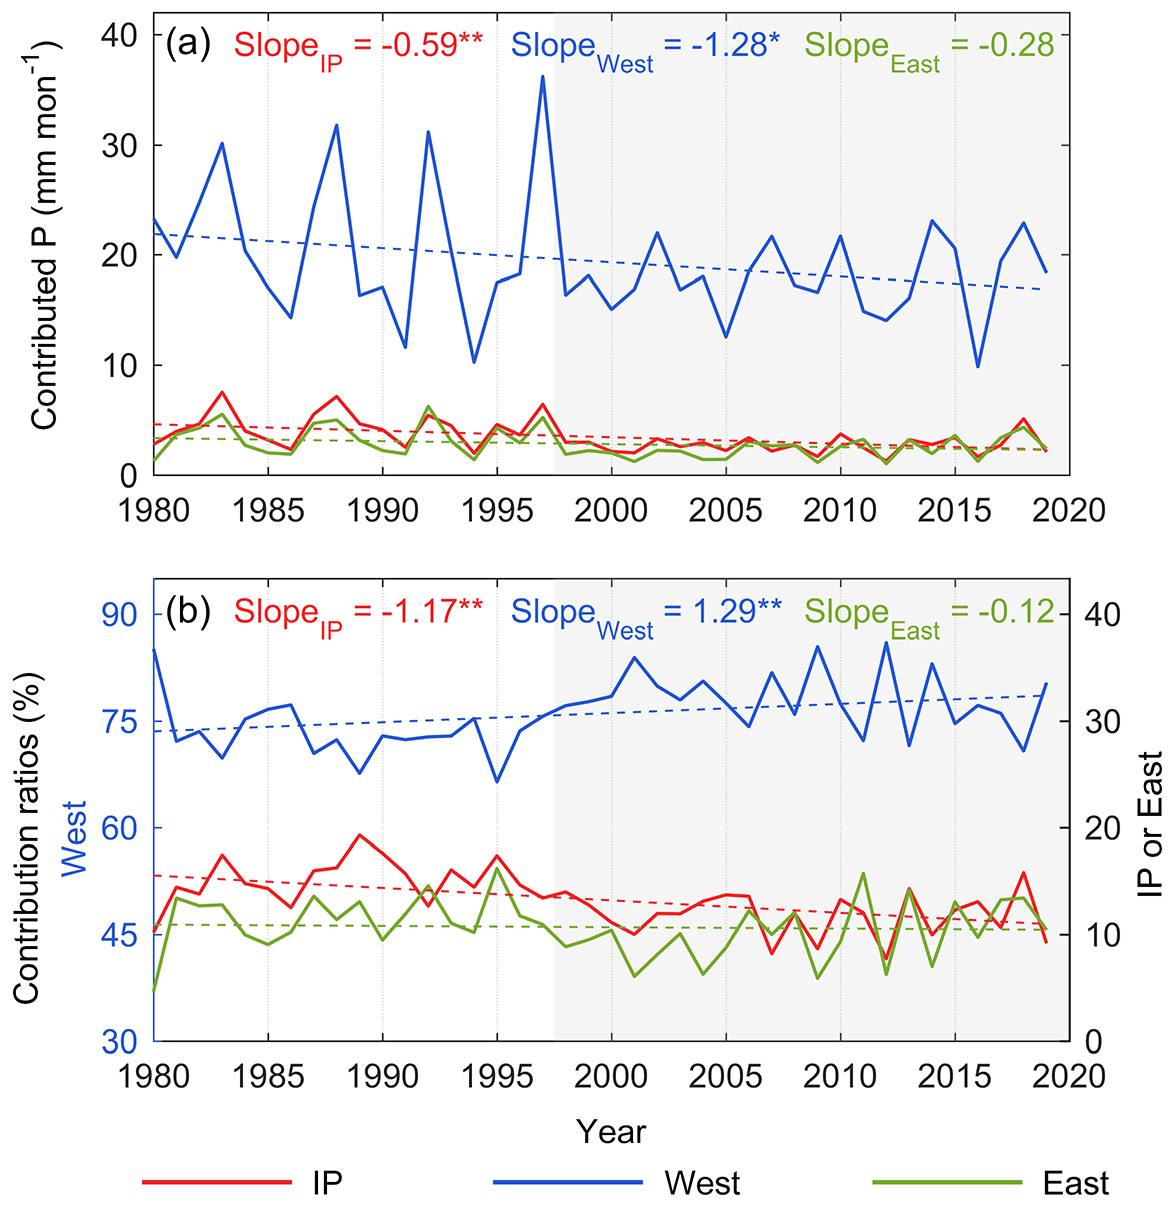
Figure 6Variations of (a) contributed precipitation (unit of the slope: mm per month per decade) and (b) contribution ratios (unit of the slope: % per decade) from the IP, the west and the east regions during 1980–2019 summer. ** and * represent 0.05 and 0.1 significance levels of the trend.
The variation and trend of the contribution ratio of each region are shown in Fig. 6b. The proportion of contributions from the local IP and the east shows a decreasing trend throughout the 40 years with the slope of −1.17 % per decade and −0.12 % per decade, which is consistent with the decreasing trends of their absolute contributions. Conversely, although the precipitation contributed by the west shows a decreasing trend, its proportion is significantly increasing and the slope is 1.29 % per decade. The average contribution ratios of the local IP and the east decrease from 15.05 % and 11.49 % before 1997 to 11.79 % and 10.02 % after 1997, while the ratio of the west increases from 73.46 % to 78.19 %.
3.3 Differences in wet years and dry years
The dry years (1991, 1994, 2005, 2012 and 2016) and the wet years (1983, 1987, 1988, 1992 and 1997) are selected as described in Sect. 3.1. Of the two divided periods, all the wet years only occur before 1997, while the dry years are distributed in both periods with no decrease in its average value. This represents that although the average summer precipitation after 1997 is reduced significantly compared with the previous period, there is no decrease in the valley value of the precipitation series. Thus, the disappearance of the wet years during 1998–2019 caused by the decrease in the precipitation series peaks directly reflects the recent decrease in the IP summer precipitation.
During the entire 40 years, differences in moisture contribution within the 90th precipitationshed of the IP summer precipitation between the wet and dry years are shown in Fig. 7a. In the dry years, the significant reduction in the moisture contribution from all grids in the main source region induces much lower precipitation than in the wet years. On the grid scale, the larger declines primarily happened in the local IP, and the grids with the largest drop, close to 9 mm per month, are mainly concentrated in the west and the north of the IP. In each source region, an average of 6.41, 30.74 and 5.34 mm per month of the summer IP precipitation is provided from the local IP, the west and the east in the wet years, with 15.15 % recycling ratio, 72.19 % and 12.66 % contribution ratio; while in the dry years, the average precipitation contributed from each region is 1.92, 11.66 and 1.40 mm per month, accounting for 12.93 %, 77.70 % and 9.37 %, respectively. All three regions contribute more to summer precipitation in the wet years than in the dry years, and compared with the dry years, the contribution ratios of the local IP and the east in the wet years are also higher. The disappearance of the wet years after 1997, compared with those before 1997, exacerbates the decline in contributions from all three sources, due to the high moisture supply in the wet years. The decrease in the frequency of the wet years with a higher local moisture recycling ratio and a higher contribution ratio of the east leads to an increase in the proportion of the summer precipitation originating from the remaining other region, namely the west, during the same period.
Table 1Trends of contributions from the IP, the west and the east to annual and seasonal precipitation, and the trends of their contribution ratios.
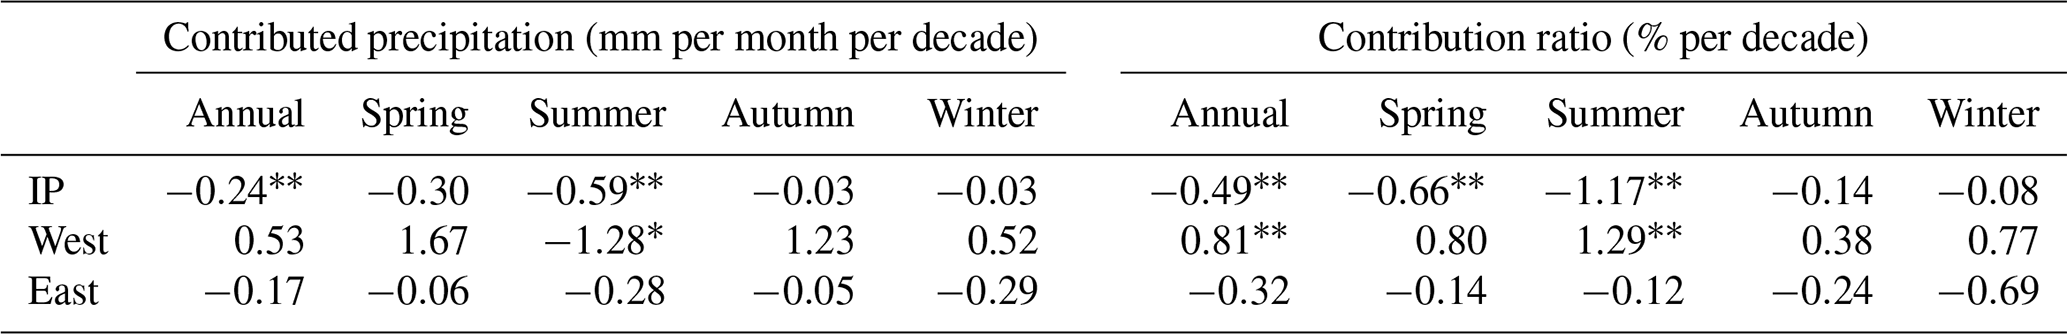
and * represent 0.05 and 0.1 significance levels of the trend.
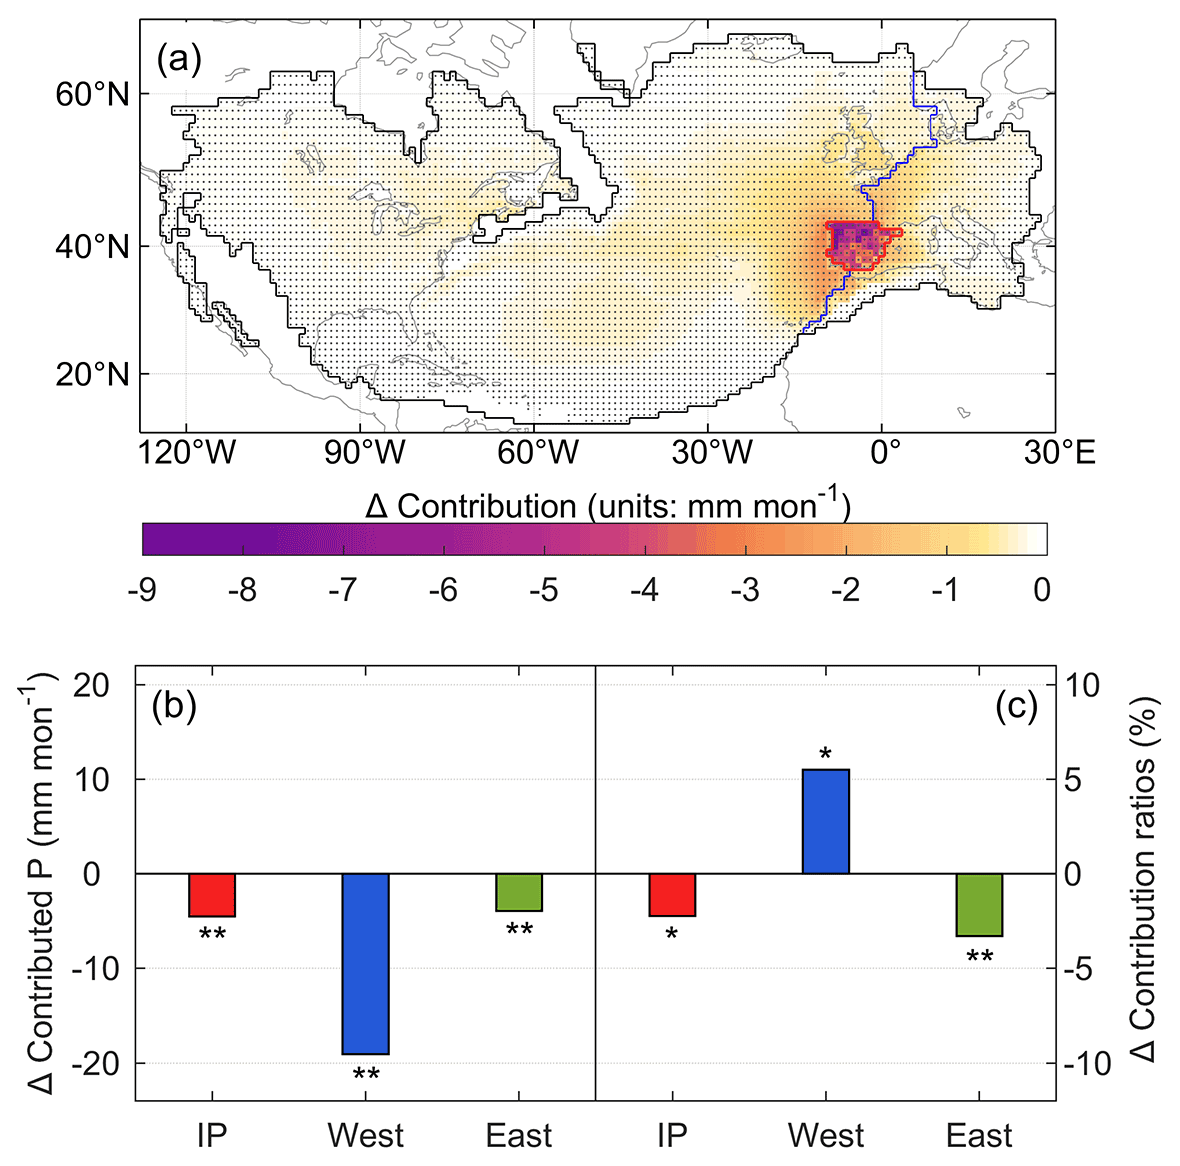
Figure 7(a) Differences in the moisture contribution in the 90th precipitationshed between the dry years and the wet years (average of the dry years minus average of the wet years). The dots indicate 0.1 significance of the difference. The changes in (b) average precipitation contributed from each region and (c) their average contribution ratios between the dry years and the wet years. ** and * represent 0.05 and 0.1 significance levels of the difference.
The dry years in the two periods have been divided and compared with each other, and the differences between the two periods are shown in Fig. 8. From the distribution of differences, the grids with reduced moisture contribution are mainly located in the IP and the east region, and the southern part of the IP has the largest decrease (Fig. 8a). Mainly dominated by these negatively changing grids, both the absolute contribution and the contribution ratio of the local IP and the east have dropped significantly, with 0.53 and 0.42 mm per month decrease in contributed precipitation and 3.58 % and 2.81 % contribution ratio reduction, respectively (Fig. 8b and c). For the west region, however, it raises the moisture contribution to the summer precipitation by 1.22 mm per month in the dry years after 1997, causing a 6.39 % increase in its contribution ratio. Despite the dry years with no decrease precipitation between the two periods, the decrease in the local moisture recycling is still noticeable.
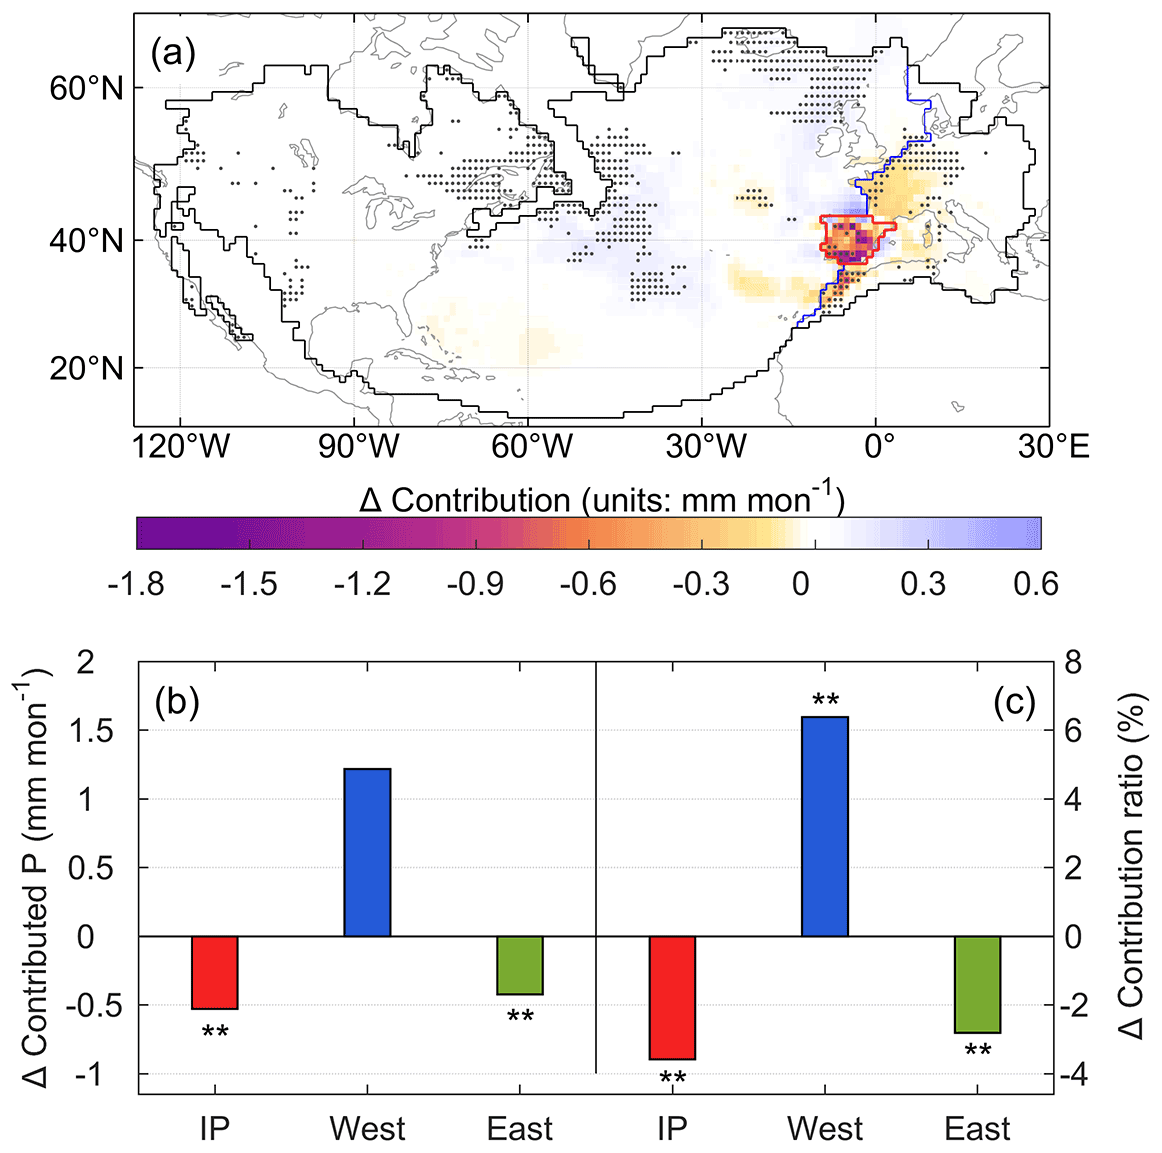
Figure 8(a) Differences in the moisture contribution in the 90th precipitationshed in the dry years between 1998–2019 and 1980–1997 (average of 1998–2019 minus average of 1980–1997). The dots indicate 0.1 significance of the difference. The changes in (b) average precipitation contributed from each region and (c) their average contribution ratios in the dry years between 1998–2019 and 1980–1997. ** and * represent 0.05 and 0.1 significance levels of the difference.
The trends in the contribution from the three source regions, the local, the west and the east regions, to all seasonal and annual precipitation over the past 40 years are listed in Table 1. In general, the decreasing trend maintained by the local IP and the east region are closely related to the drought in the Mediterranean basin (Ribeiro et al., 2020; Russo et al., 2019), and the increasing proportion of the west can be explained by the increasingly important role of the oceanic moisture in terrestrial precipitation (Gimeno et al., 2020; Vicente-Serrano et al., 2018). The simultaneous decrease in the moisture contribution from all three regions is responsible for the significant decrease in only the summer precipitation series among all seasonal or annual precipitation. In particular, the local moisture recycling ratio in summer is obviously way down, differentiating the reduced summer precipitation from the other seasons. It is worth highlighting that this significant decrease in recent summer precipitation over the IP in this study is based on a short record (1980–2019) from ERA5, while a long-term assessment of precipitation (1850–2018) from multiple sources still lacks a statistically significant decreasing trend (Peña-Angulo et al., 2020). Nevertheless, the changes in the recent four decades still show the significant influence of the local moisture recycling, especially on the trend of summer precipitation and variation of summer wet and dry years.
The remarkable decrement of summer precipitation can be attributed to the simultaneous and large reduction in contributions from all three source regions. Moisture transport from the west region contributing to the IP precipitation is mainly through the tropical–subtropical North Atlantic corridor. In summer, air masses from the west in this transportation process, as it gets closer to the destination, gradually shift from a net supply to a net uptake of the IP precipitation (Gimeno et al., 2010). In this case, the stronger land–sea contrast caused by the warming land surface makes the advected air mass from the Atlantic experience more drying and a decrease in the contribution from the west (Cramer et al., 2018; Kröner et al., 2017). In addition, the extension of Hadley circulation makes the IP more strongly affected by subsidence, generating higher static stability (Brogli et al., 2019). This results in a lower frequency of extreme heavy precipitation characterized by the presence of a cutoff low at mid-levels and an easterly moisture flow from the Mediterranean Sea (Merino et al., 2016). However, the ocean warming patterns and thermodynamics can promote precipitation in cold seasons (Brogli et al., 2019), just as shown by the increasing contributed precipitation from the west in autumn and winter in Table 1. It suggests that the drivers leading to less summer precipitation do not generally cause a similar change in the precipitation in the other seasons.
In terms of the total contribution from the three subregions, the west region dominates more of the reduction in the IP precipitation due to its wide coverage with a large number of grids. Nevertheless, in the local IP, which is much smaller than the west, the high contribution per grid, the difference between the two periods and the consistent decline of the precipitation recycling ratio make the role of the local contribution variation worth emphasizing. As an important indicator to describe the interaction between the surface and atmospheric processes, the change in the precipitation recycling ratio takes into account changes in both precipitation and the contribution of local evaporation (Goessling and Reick, 2011; Zhang, 2020). For the IP, its significant reduction in local moisture contribution is most likely due to the weakening of local evaporation (Fig. 9), with a correlation coefficient of 0.64 between evaporation and the locally contributed precipitation. In summer, soil moisture and the recycling process driven by evaporation are regarded as an active source of moisture (Jung et al., 2010; Vicente-Serrano et al., 2014), leading to a positive correlation between soil moisture and precipitation. As a result, during those dry summers, the declining precipitation causes the shortage of soil water supply, the limitation of soil water evaporation capacity and the consequent reduction in surface evaporation (García-Valdecasas Ojeda et al., 2020; Ruosteenoja et al., 2018). The IP precipitation can be further reduced due to this weakening of the local moisture recycling. This continuous feedback of the interactions of soil moisture evaporation and precipitation can exacerbate the water resource depletion and summer drought, especially in dry years. Thus, despite the ongoing emphasis on the significance of the ocean as a moisture source, consistent changes in the local moisture contribution or proportion with reduced precipitation require more attention.
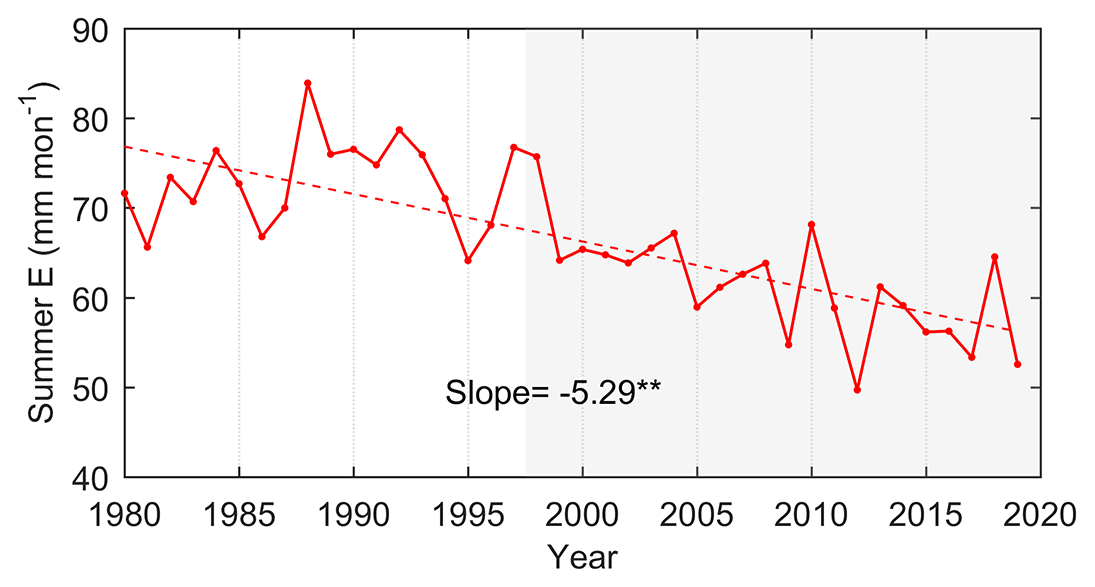
Figure 9Time series of the IP summer evaporation from the ERA5 during 1980–2019 (unit of the slope: mm per month per decade). represents the 0.05 significance level of the trend.
Decreasing summer precipitation over the IP could lead to an escalation of drought, especially with the high temperature and low rainfall characteristics of Mediterranean climate. In this study, using the reanalysis data ERA5 and WAM-2layers model, we investigated how changes in moisture contribution from the sources, including the IP, the west and the east, affect the reduction in summer precipitation between 1980–1997 and 1998–2019. The major findings attribute the decreasing precipitation to the changes in moisture contribution at sources and highlight their importance, which are summarized below.
The reduction in contribution to IP summer precipitation is mainly concentrated in the IP and its neighboring grids. The local IP grids show the greatest reduction, and the surrounding grids show a slight but significant decrease.
Compared with the summer of 1980–1997, the IP and the east contributed 1.7 and 1.1 mm per month less IP precipitation during 1998–2019, accounting for 26 % and 17 % of the main source supply reduction, respectively. Meanwhile, the importance of the vast west region was clearly shown by reducing the IP precipitation by 3.6 mm per month, representing 57 % of the decrease in precipitation originating from main sources.
The contributions from the local IP and the east keep declining during the 40 years. In particular, the significant reduction in the local moisture recycling, reflected in the disappearance of the wet years after 1997 and the reduction in local contributions in the dry years, suggests a close link with the decrease in summer precipitation.
Code and data used in this paper are available from the corresponding author upon a reasonable request.
MG and QT designed the study. YL performed the analysis and calculation. CZ contributed to the application of the model in this study. YL prepared the paper draft, and all co-authors reviewed and edited the paper.
The contact author has declared that neither they nor their co-authors have any competing interests.
Publisher's note: Copernicus Publications remains neutral with regard to jurisdictional claims in published maps and institutional affiliations.
This article is part of the special issue “Analysis of atmospheric water vapour observations and their uncertainties for climate applications (ACP/AMT/ESSD/HESS inter-journal SI)”. It is not associated with a conference.
This study was partly funded by the National Natural Science Foundation of China (grant nos. 41730645 and 41701033) and the Strategic Priority Research Program of Chinese Academy of Sciences (grant no. XDA20060402). The authors would like to thank the EU and Innovation Fund Denmark (IFD) for funding within the framework of the FORWARD collaborative international consortium financed through the ERA-NET co-fund WaterWorks2015 integral part of the 2016 joint activities developed by the “Water Challenges for a Changing World” joint program initiative (Water JPI).
This research has been supported by the National Natural Science Foundation of China (grant nos. 41730645 and 41701033), the Chinese Academy of Sciences (grant no. XDA20060402), and the Water Challenges for a Changing World Joint Program Initiative.
This paper was edited by Marloes Penning de Vries and reviewed by Jolanda Theeuwen and one anonymous referee.
Boé, J. and Terray, L.: Land–sea contrast, soil-atmosphere and cloud-temperature interactions: interplays and roles in future summer European climate change, Clim. Dynam., 42, 683–699, https://doi.org/10.1007/s00382-013-1868-8, 2014.
Boé, J., Terray, L., Cassou, C., and Najac, J.: Uncertainties in European summer precipitation changes: role of large scale circulation, Clim. Dynam., 33, 265–276, https://doi.org/10.1007/s00382-008-0474-7, 2009.
Bonne, J. L., Masson-Delmotte, V., Cattani, O., Delmotte, M., and Steen-Larsen, H. C.: The isotopic composition of water vapour and precipitation in Ivittuut, Southern Greenland, Atmos. Chem. Phys., 14, 4419–2014, https://doi.org/10.5194/acp-14-4419-2014, 2014.
Brogli, R., Sørland, S. L., Kröner, N., and Schär, C.: Causes of future Mediterranean precipitation decline depend on the season, Environ. Res. Lett., 14, 114017, https://doi.org/10.1088/1748-9326/ab4438, 2019.
Burde, G. I.: Bulk recycling models with incomplete vertical mixing. Part I: Conceptual framework and models, J. Climate, 19, 1461–1472, https://doi.org/10.1175/jcli3687.1, 2010.
Cortesi, N., Trigo, R. M., Gonzalez-Hidalgo, J. C., and Ramos, A. M.: Modeling monthly precipitation with circulation weather types for a dense network of stations over Iberia, Hydrol. Earth Syst. Sci., 17, 665–678, https://doi.org/10.5194/hess-17-665-2013, 2013.
Cramer, W., Guiot, J., Fader, M., Garrabou, J., Gattuso, J.-P., Iglesias, A., Lange, M. A., Lionello, P., Llasat, M. C., Paz, S., Peñuelas, J., Snoussi, M., Toreti, A., Tsimplis, M. N., and Xoplaki, E.: Climate change and interconnected risks to sustainable development in the Mediterranean, Nat. Clim. Change, 8, 972–980, https://doi.org/10.1038/s41558-018-0299-2, 2018.
Damián, I.-C. and Gonzalo, M. M.: A new moisture tagging capability in the Weather Research and Forecasting model: formulation, validation and application to the 2014 Great Lake-effect snowstorm, Earth Syst. Dynam., 9, 167–185, https://doi.org/10.5194/esd-9-167-2018, 2018.
García-Valdecasas Ojeda, M., Yeste, P., Gámiz-Fortis, S. R., Castro-Díez, Y., and Esteban-Parra, M. J.: Future changes in land and atmospheric variables: An analysis of their couplings in the Iberian Peninsula, Sci. Total Environ., 722, 137902, https://doi.org/10.1016/j.scitotenv.2020.137902, 2020.
Gimeno, L., Nieto, R., Trigo, R. M., Vicente-Serrano, S. M., and López-Moreno, J. I.: Where does the Iberian Peninsula moisture come from? An answer based on a Lagrangian approach, J. Hydrometeorol., 11, 421–436, https://doi.org/10.1175/2009JHM1182.1, 2010.
Gimeno, L., Nieto, R., and Sorí, R.: The growing importance of oceanic moisture sources for continental precipitation, npj Clim. Atmos. Sci., 3, 27, https://doi.org/10.1038/s41612-020-00133-y, 2020.
Goessling, H. F. and Reick, C. H.: What do moisture recycling estimates tell us? Exploring the extreme case of non-evaporating continents, Hydrol. Earth Syst. Sci., 15, 3217–3235, https://doi.org/10.5194/hess-15-3217-2011, 2011.
Goessling, H. F. and Reick, C. H.: On the “well-mixed” assumption and numerical 2-D tracing of atmospheric moisture, Atmos. Chem. Phys., 13, 5567–5585, https://doi.org/10.5194/acp-13-5567-2013, 2013.
Herrera, S., Cardoso, R. M., Soares, P. M., Espírito-Santo, F., and Gutiérrez, J.: Iberia01: a new gridded dataset of daily precipitation and temperatures over Iberia, Earth Syst. Sci. Data, 11, 1947–1956, https://doi.org/10.5194/essd-11-1947-2019, 2019.
Hersbach, H., Bell, B., Berrisford, P., Hirahara, S., Horányi, A., Muñoz-Sabater, J., Nicolas, J., Peubey, C., Radu, R., Schepers, D., Simmons, A., Soci, C., Abdalla, S., Abellan, X., Balsamo, G., Bechtold, P., Biavati, G., Bidlot, J., Bonavita, M., De Chiara, G., Dahlgren, P., Dee, D., Diamantakis, M., Dragani, R., Flemming, J., Forbes, R., Fuentes, M., Geer, A., Haimberger, L., Healy, S., Hogan, R. J., Hólm, E., Janisková, M., Keeley, S., Laloyaux, P., Lopez, P., Lupu, C., Radnoti, G., de Rosnay, P., Rozum, I., Vamborg, F., Villaume, S., and Thépaut, J.-N.: The ERA5 global reanalysis, Q. J. Roy. Meteorol. Soc., 146, 1999–2049, https://doi.org/10.1002/qj.3803, 2020.
Jung, M., Reichstein, M., Ciais, P., Seneviratne, S. I., Sheffield, J., Goulden, M. L., Bonan, G., Cescatti, A., Chen, J., de Jeu, R., Dolman, A. J., Eugster, W., Gerten, D., Gianelle, D., Gobron, N., Heinke, J., Kimball, J., Law, B. E., Montagnani, L., Mu, Q., Mueller, B., Oleson, K., Papale, D., Richardson, A. D., Roupsard, O., Running, S., Tomelleri, E., Viovy, N., Weber, U., Williams, C., Wood, E., Zaehle, S., and Zhang, K.: Recent decline in the global land evapotranspiration trend due to limited moisture supply, Nature, 467, 951–954, https://doi.org/10.1038/nature09396, 2010.
Keys, P. W., van der Ent, R. J., Gordon, L. J., Hoff, H., Nikoli, R., and Savenije, H. H. G.: Analyzing precipitationsheds to understand the vulnerability of rainfall dependent regions, Biogeosciences, 9, 733–746, https://doi.org/10.5194/bg-9-733-2012, 2012.
Keys, P. W., Barnes, E. A., van der Ent, R. J., and Gordon, L. J.: Variability of moisture recycling using a precipitationshed framework, Hydrol. Earth Syst. Sci., 18, 3937–3950, https://doi.org/10.5194/hess-18-3937-2014, 2014.
Kröner, N., Kotlarski, S., Fischer, E., Lüthi, D., Zubler, E., and Schär, C.: Separating climate change signals into thermodynamic, lapse-rate and circulation effects: theory and application to the European summer climate, Clim. Dynam., 48, 3425–3440, https://doi.org/10.1007/s00382-016-3276-3, 2017.
Lenderink, G., van Ulden, A., van den Hurk, B., and van Meijgaard, E.: Summertime inter-annual temperature variability in an ensemble of regional model simulations: analysis of the surface energy budget, Climatic Change, 81, 233–247, https://doi.org/10.1007/s10584-006-9229-9, 2007.
Lopez-Bustins, J. A. and Lemus-Canovas, M.: The influence of the Western Mediterranean Oscillation upon the spatio-temporal variability of precipitation over Catalonia (northeastern of the Iberian Peninsula), Atmos. Res., 236, 104819, https://doi.org/10.1016/j.atmosres.2019.104819, 2020.
Maasch, K. A.: Statistical detection of the mid-Pleistocene transition, Clim. Dynam., 2, 133–143, https://doi.org/10.1007/BF01053471, 1988.
Merino, A., Fernández-Vaquero, M., López, L., Fernández-González, S., Hermida, L., Sánchez, J. L., García-Ortega, E., and Gascón, E.: Large-scale patterns of daily precipitation extremes on the Iberian Peninsula, Int. J. Climatol., 36, 3873–3891, https://doi.org/10.1002/joc.4601, 2016.
Numaguti, A.: Origin and recycling processes of precipitating water over the Eurasian continent: Experiments using an atmospheric general circulation model, J. Geophys. Res.-Atmos., 104, 1957–1972, https://doi.org/10.1029/1998JD200026, 1999.
Páscoa, P., Russo, A., Gouveia, C. M., Soares, P. M. M., Cardoso, R. M., Careto, J. A. M., and Ribeiro, A. F. S.: A high-resolution view of the recent drought trends over the Iberian Peninsula, Weather Clim. Extrem., 32, 100320, https://doi.org/10.1016/j.wace.2021.100320, 2021.
Peña-Angulo, D., Vicente-Serrano, S. M., Domínguez-Castro, F., Murphy, C., Reig, F., Tramblay, Y., Trigo, R. M., Luna, M. Y., Turco, M., Noguera, I., Aznárez-Balta, M., García-Herrera, R., Tomas-Burguera, M., and El Kenawy, A.: Long-term precipitation in Southwestern Europe reveals no clear trend attributable to anthropogenic forcing, Environ. Res. Lett., 15, 094070, https://doi.org/10.1088/1748-9326/ab9c4f, 2020.
Rajczak, J. and Schär, C.: Projections of future precipitation extremes over Europe: A multimodel assessment of climate simulations, J. Geophys. Res.-Atmos., 122, 10773–10800, https://doi.org/10.1002/2017JD027176, 2017.
Ribeiro, A. F. S., Russo, A., Gouveia, C. M., and Pires, C. A. L.: Drought-related hot summers: A joint probability analysis in the Iberian Peninsula, Weather Clim. Extrem., 30, 100279, https://doi.org/10.1016/j.wace.2020.100279, 2020.
Ruosteenoja, K., Markkanen, T., Venäläinen, A., Räisänen, P., and Peltola, H.: Seasonal soil moisture and drought occurrence in Europe in CMIP5 projections for the 21st century, Clim. Dynam., 50, 1177–1192, https://doi.org/10.1007/s00382-017-3671-4, 2018.
Russo, A., Gouveia, C. M., Dutra, E., Soares, P. M. M., and Trigo, R. M.: The synergy between drought and extremely hot summers in the Mediterranean, Environ. Res. Lett., 14, 014011, https://doi.org/10.1088/1748-9326/aaf09e, 2019.
Serrano, A., García, J. A., Mateos, V. L., Cancillo, M. L., and Garrido, J.: Monthly modes of variation of precipitation over the Iberian Peninsula, J. Climate, 12, 2894–2919, 1999.
Stohl, A. and James, P.: A Lagrangian analysis of the atmospheric branch of the global water cycle. Part I: Method description, validation, and demonstration for the August 2002 flooding in Central Europe, J. Hydrometeorol., 5, 656–678, https://doi.org/10.1175/1525-7541(2004)005<0656:ALAOTA>2.0.CO;2, 2004.
Stohl, A. and James, P.: A Lagrangian analysis of the atmospheric branch of the global water cycle. Part II: Moisture transports between earth's ocean basins and river catchments, J. Hydrometeorol., 6, 961–984, https://doi.org/10.1175/JHM470.1, 2005.
Tang, Q., Leng, G., and Groisman, P. Y.: European hot summers associated with a reduction of cloudiness, J. Climate, 25, 3637–3644, https://doi.org/10.1175/JCLI-D-12-00040.1, 2012.
Teuling, A. J., Van Loon, A. F., Seneviratne, S. I., Lehner, I., Aubinet, M., Heinesch, B., Bernhofer, C., Grünwald, T., Prasse, H., and Spank, U.: Evapotranspiration amplifies European summer drought, Geophys. Res. Lett., 40, 2071–2075, https://doi.org/10.1002/grl.50495, 2013.
Ulbrich, U., Christoph, M., Pinto, J. G., and Corte-Real, J.: Dependence of winter precipitation over Portugal on NAO and baroclinic wave activity, Int. J. Climatol., 19, 379–390, https://doi.org/10.1002/(SICI)1097-0088(19990330)19:4<379::AID-JOC357>3.0.CO;2-8, 2015.
van der Ent, R. J. and Savenije, H. H. G.: Length and time scales of atmospheric moisture recycling, Atmos. Chem. Phys., 11, 1853–1863, https://doi.org/10.5194/acp-11-1853-2011, 2011.
van der Ent, R. J., Savenije, H. H. G., Schaefli, B., and Steele-Dunne, S. C.: Origin and fate of atmospheric moisture over continents, Water Resour. Res., 46, W09525, https://doi.org/10.1029/2010WR009127, 2010.
van der Ent, R. J., Tuinenburg, O. A., Knoche, H. R., Kunstmann, H., and Savenije, H. H. G.: Should we use a simple or complex model for moisture recycling and atmospheric moisture tracking?, Hydrol. Earth Syst. Sci., 17, 4869–4884, https://doi.org/10.5194/hess-17-4869-2013, 2013.
van der Ent, R. J., Wang-Erlandsson, L., Keys, P. W., and Savenije, H. H. G.: Contrasting roles of interception and transpiration in the hydrological cycle –Part 2: Moisture recycling, Earth Syst. Dynam., 5, 471–489, https://doi.org/10.5194/esd-5-471-2014, 2014.
Vázquez, M., Nieto, R., Liberato, M. L. R., and Gimeno, L.: Atmospheric moisture sources associated with extreme precipitation during the peak precipitation month, Weather Clim. Extrem., 30, 100289, https://doi.org/10.1016/j.wace.2020.100289, 2020.
Vicente-Serrano, S. M., Azorin-Molina, C., Sanchez-Lorenzo, A., Morán-Tejeda, E., Lorenzo-Lacruz, J., Revuelto, J., López-Moreno, J. I., and Espejo, F.: Temporal evolution of surface humidity in Spain: recent trends and possible physical mechanisms, Clim. Dynam., 42, 2655–2674, https://doi.org/10.1007/s00382-013-1885-7, 2014.
Vicente-Serrano, S. M., Nieto, R., Gimeno, L., Azorin-Molina, C., Drumond, A., El Kenawy, A., Dominguez-Castro, F., Tomas-Burguera, M., and Peña-Gallardo, M.: Recent changes of relative humidity: regional connections with land and ocean processes, Earth Syst. Dynam., 9, 915–937, https://doi.org/10.5194/esd-9-915-2018, 2018.
Zhang, C.: Moisture source assessment and the varying characteristics for the Tibetan Plateau precipitation using TRMM, Environ. Res. Lett., 15, 104003, https://doi.org/10.1088/1748-9326/abac78, 2020.
Zhang, C., Tang, Q., and Chen, D.: Recent changes in the moisture source of precipitation over the Tibetan Plateau, J. Climate, 30, 1807–1819, https://doi.org/10.1175/JCLI-D-15-0842.1, 2017.
Zhang, Y., Huang, W., Zhang, M., Tian, Y., Wang, G., and Zhong, D.: Atmospheric Basins: Identification of Quasi-Independent Spatial Patterns in the Global Atmospheric Hydrological Cycle Via a Complex Network Approach, J. Geophys. Res.-Atmos., 125, e2020JD032796, https://doi.org/10.1029/2020JD032796, 2020.
Zhu, Y. and Newell, R. E.: A proposed algorithm for moisture fluxes from atmospheric rivers, Mon. Weather Rev., 126, 725–735, https://doi.org/10.1175/1520-0493(1998)126<0725:Apafmf>2.0.Co;2, 1998.