the Creative Commons Attribution 4.0 License.
the Creative Commons Attribution 4.0 License.
 | 15 Mar 2022
The Mesoamerican mid-summer drought: the impact of its definition on occurrences and recent changes
Iris T. Stewart
Kenneth Joseph
Hugo G. Hidalgo
The mid-summer drought, veranillo or canícula, is a phenomenon experienced in many areas, including Mexico, Central America, and the Caribbean. It generally is experienced as reduced rainfall in July–August, in the middle of the typical rainy season (May–September). Many past studies have attempted to quantify changes in mid-summer drought characteristics during the recent past or for future climate projections. To do this, objective definitions of a mid-summer drought's occurrence, strength, and duration have been developed by many researchers. In this effort we adopt a recent set of definitions and examine the impact of varying these on the characterization of mid-summer droughts and the detected changes over the past 4 decades. We find the selection of a minimum intensity threshold has a dramatic effect on the results of both the area considered as experiencing a mid-summer drought and the changes detected in the recent historical record. The intensity chosen can affect both the magnitude and direction of changes reported in the recent observed record. Further, we find that the typical mid-summer drought pattern may not be occurring during the time it has historically; whether examining past or future changes or developing improved seasonal forecasts, the non-stationarity of its timing should be accommodated.
- Article
(3747 KB) - Full-text XML
- BibTeX
- EndNote


In many parts of Mexico and Central America (usually on the Pacific slope) there is a well-defined summer rainy season, often marked by early and late peak periods separated by a brief period of reduced rainfall. This reduced rainfall event, which typically persists for 2–4 weeks in July–August, is often referred to as the mid-summer drought (MSD) in the climate science community. In Central America it is referred to by locally distinct names, such as the veranillo or canícula (Magaña et al., 1999; Maldonado et al., 2016). Variability in different characteristics of the MSD is well established (García-Oliva and Pazos, 2021) and can have important agricultural and economic consequences for the region, especially in the area denoted as the Central American Dry Corridor (Hidalgo et al., 2019; Stewart et al., 2021).
While in specific locations an MSD definition may be defined historically using specific dates, such as 15 July–15 August, the regional variability in those dates and their inflexibility for representing change in MSD timing make their use in studies such as ours impractical (Alfaro, 2002; Curtis, 2004; Magaña et al., 1999). In many regions of Central America, the timing and magnitude of the early and late rainy periods are critical for a first and possible second planting season; subsistence farmers who mostly rely on rain-fed agricultural practices must time their planting and harvesting to anticipate the end of the MSD and the arrival of a second peak of rainfall. How the presence of an MSD pattern and its timing, intensity, and duration are affected by climate variability and change therefore is intimately tied to the agricultural cycle and farmer livelihoods.
Because of this regional importance, there have been many studies of the MSD, both examining the recent observational record to detect trends in its characteristics (e.g., Anderson et al., 2019) and looking toward the future to discern what a disrupted climate might produce (e.g., Corrales-Suastegui et al., 2020; Maurer et al., 2017; Rauscher et al., 2008; Vichot-Llano et al., 2021). When considering either current or future MSD characteristics and metrics to evaluate these, most studies adopt at least some of the methods established by Karnauskas et al. (2013) using monthly gridded data or Alfaro (2014) using daily station data, including the timing, intensity, and duration of the MSD. However, the details in the definitions of what constitutes an MSD pattern and the quantification of MSD characteristics are less consistently defined. Some measures of past changes, as well as future projections, can be significantly affected by subtle changes in definitions of the MSD. For example, the definition of the timing when rainfall minima and maxima need to occur will affect whether a given year or location is counted as experiencing an MSD. In addition, temporal and spatial scales play a role in determining the existence of an MSD pattern. Zhao and Zhang (2021) found the existence of an MSD signal in some locations in Central America and Mexico dependent on whether a method used daily or monthly data.
An understanding of where in the study region an MSD pattern exists, and how it has been impacted by recent climate variability and change, has been elusive. This is at least partly due to limited mathematical descriptions of the phenomenon and to the lack of an exploration of the effects of variation of the parameters used for the determination of whether an MSD phenomenon is present. In addition, any assumption about how frequently an MSD pattern must be identified to declare a given area as being dominated by MSD is arbitrary yet will impact the area considered as having an MSD as well as the area where climate change might have affected the presence of characteristics of the MSD. Therefore, the impact of the mathematical definition as well as that of climatic change on MSD extent must be explored jointly.
A recent study (Anderson et al., 2019) used pentadal precipitation data from the quasi-global CHIRPS dataset, covering Guatemala, Honduras, Nicaragua, and El Salvador. For 1981–2018 they found significant trends in the duration of the MSD in many locations, but most other MSD characteristics did not show discernible trends. As Anderson et al. (2019) note, there may be a disconnect between statistically significant changes in objectively defined MSD conditions and the experience and understanding of the phenomenon by smallholder farmers, especially in the northern part of their domain in Guatemala and Mexico. The importance of extending a study domain of the MSD into more of Mexico is supported by recent studies characterizing its influence in the historical record (Perdigón-Morales et al., 2018) and potential changes in a disrupted climate in the northern, water-limited, and primarily agricultural regions of Mesoamerica (Corrales-Suastegui et al., 2020; Stewart et al., 2021). However, we are not aware of a study that has examined the sensitivity of the MSD spatial and temporal extent to its definition, and the impact the definition has on the presence of changes during the warming trends throughout Central America over the past 4 decades (on the order of 0.8 ∘C per decade, Stewart et al., 2021).
In this effort, we build on the past work to improve an objective, mathematical definition of the MSD that includes measures to evaluate the magnitude and timing of the phenomenon and to characterize the variability, trends, and changes in the spatial domain with an MSD pattern during the recent historical record. In particular, we (1) use an expanded domain, as compared to previous studies, that includes Central America and Mexico and that potentially exhibits MSD characteristics, (2) use daily data rather than monthly or pentadal aggregated data to characterize the MSD with finer precision, (3) build on past work to refine definitions of MSD characteristics and spatial extent, and (4) explore the effect of parameter variability in the MSD definition on the magnitude, direction, and changes during the recent observational record (1981–2020), which includes the warmest years in the observational record. Our work is motivated by the need for better understanding of past changes that align with smallholder experience, for seasonal forecasts of specific MSD features, and for projections on how the MSD may change through the 21st century.
We use precipitation-based definitions of the MSD, consistent with many past studies (Alfaro, 2014; Anderson et al., 2019; Karnauskas et al., 2013). The primary data source we use is the gridded daily precipitation product of the Climate Hazards group Infrared Precipitation with Stations (CHIRPS) v.2.0 dataset (Funk et al., 2015), aggregated to 0.25∘ (approximately 25 km) as described by Stewart et al. (2021). The data were aggregated to reduce data volumes and facilitate exploration of the influence of different MSD definitions. To verify that this aggregation does not affect the results of this analysis, Fig. A1 and Table A1 show results for a reduced area in Central America using data at both the original CHIRPS resolution and the aggregated resolution, with consistent results at both scales.
CHIRPS is developed by the Climate Hazards Group at the University of California, Santa Barbara, and the US Geological Survey Earth Resources Observation and Science Center. Daily, monthly, and seasonal products are built around blending satellite cold cloud duration observations and improved interpolation techniques of high-resolution, long period-of-record precipitation estimates. CHIRPS forms the basis for the US Agency for International Development's Famine Early Warning Systems Network. We use the CHIRTS dataset for the limited temperature analysis in this paper (Funk et al., 2019).
In some recent studies, the inclusion of temperature in the analysis of the MSD has been recognized as important due to the vulnerability of the affected areas to soil moisture (Romero et al., 2020), reflecting the water deficit and warmer temperatures experienced by farmers. This was a motivation in one study for the use of a “hydrologic satisfaction” threshold (MAGFOR, 2010) to define the intensity of an MSD episode. For changes in the recent observed record in the study region, however, the influence of temperature variability on changes in drought indices is much smaller than that of precipitation changes (Stewart et al., 2021). For this reason, we only consider precipitation-based definitions for the MSD, though projections of future changes, when temperature changes will become more pronounced, should consider alternate definitions that include accounting for temperature increases.
To define whether an MSD occurs in any year and quantify its important features, we started with the method of Anderson et al. (2019) and modified it to work with our daily dataset. For each calendar year of daily precipitation data we follow these steps: (1) smooth the data using two passes of a 31 d triangular filter; (2) locate the minimum (which must be an inflection point) between 1 June and 31 August (window 1); (3) check that the minimum from step 2 is also the minimum between 1 May and 31 October (window 2); (4) locate the highest peak between 1 January and the minimum date; (5) locate the highest peak between the minimum date and 31 December; (6) if the two peaks from steps 4 and 5 are not within the 1 May to 31 October period, the year is not an MSD; (7) if those two peaks are not separated by a defined minimum duration (e.g., 15 d), the year is not an MSD; (8) if the average of the maxima minus minimum is not greater than a defined minimum intensity (e.g., 3 mm), the year is not classified as an MSD. The order in which these constraints are applied to the data and the magnitude of the parameter values matter. Figure 1 presents a flowchart illustrating these steps.
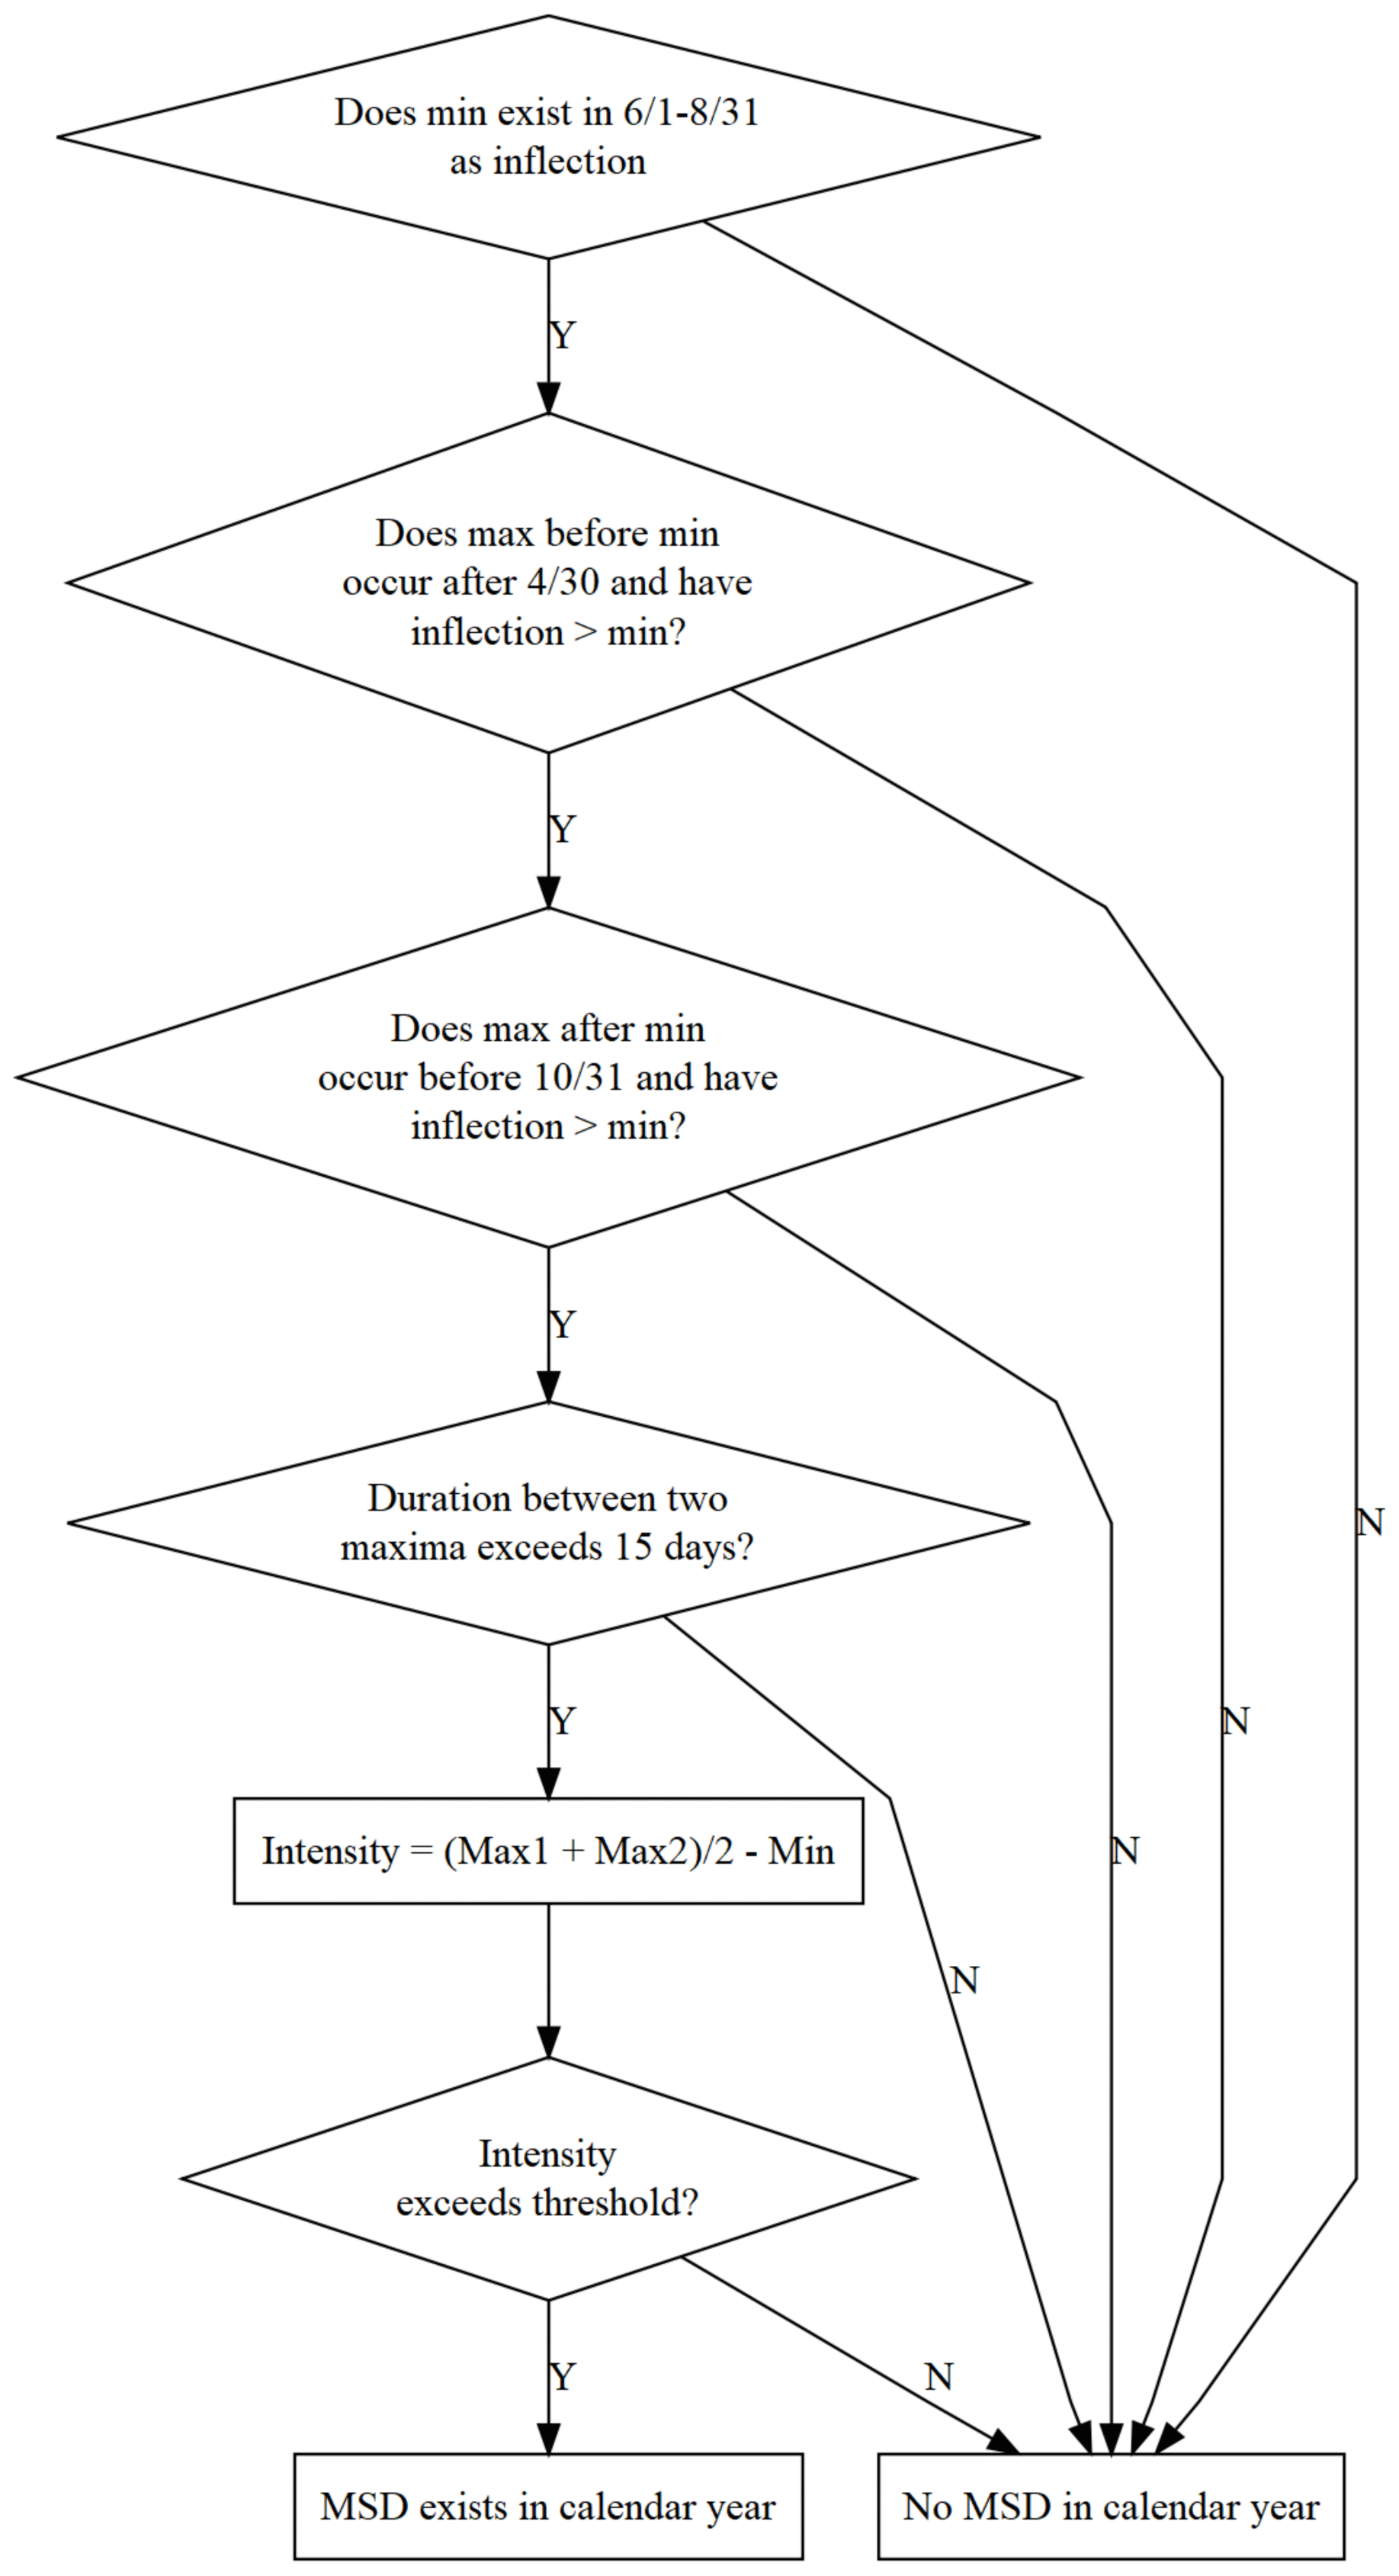
Figure 1The steps used to determine for each calendar year whether a location experiences an MSD.
Finally, to define whether a location is classified as having an MSD, a threshold is defined for the percentage of years with an MSD according to the definition above. Anderson et al. (2019) set this at 33 out of 38 years (87 %), since they used a 38-year precipitation record (1981–2018). This study uses as a baseline that 80 % of the years must exhibit an MSD for it to be classified as an MSD cell.
To explore how the definition of the MSD affects the changes in MSD over the recent past, we divide the study period into two 20-year periods, namely, (1981–2000) and (2001–2020), and compare average MSD conditions between the earlier and later periods. Especially since these periods are shorter than the recommended 30-year length for establishing a climate normal (WMO, 2017), they should not be interpreted as definitely quantifying changes in the MSD. Rather, these are used principally to illustrate the influence variations in MSD definitions have on the detection of shifts in MSD characteristics or locations.
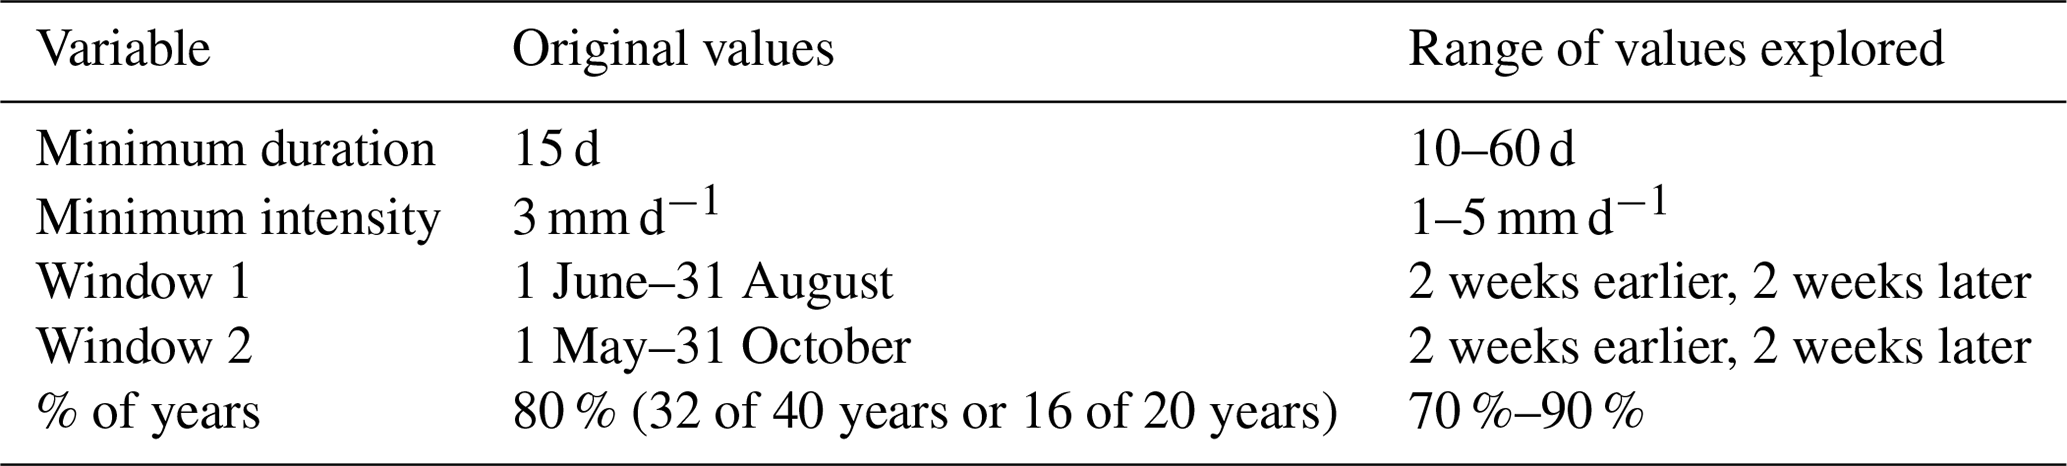
Our “original” values for these characteristics are summarized in Table 1. These are designed to reproduce as closely as possible the methods of Anderson et al. (2019). These values are later varied to explore their influence on the extent of cells characterized as having an MSD and the impact on detected changes between 1981–2000 and 2001–2020.
Table 1Variable values for key components of the MSD definition.
These original values are adjusted to assess the influence of specific definitions on the determination of whether an MSD exists in a location and whether statistically significant changes have occurred over the recent historical record.
Statistical tests consist of comparing the proportions of MSD years in a 20-year period using Fisher's exact test (Mehta and Patel, 1983) and comparing the central tendency of statistics between two 20-year groups using a Wilcoxon (Mann–Whitney) signed-rank test (Helsel et al., 2020). Statistical significance is evaluated at a 5 % level (α=0.05).
The Mesoamerican region of Central America and Mexico is a region with very distinct but spatially highly variable climatic patterns. Figure 2a shows the climatological precipitation pattern across the study domain. The CHIRPS data in this figure have been aggregated spatially and temporally (to monthly averages). Figure 2a illustrates the tremendous variability in climate that exists in the region, from wet tropical climates to cold arid regions in Mexico's highlands. Despite these differences, many regions are characterized by a highly seasonal climate, with a pronounced spring dry season followed by a summer (June–September) rainy season with monthly precipitation of 400–500 mm or more. A clear dip in July–August precipitation associated with an MSD pattern is apparent in many of the grid boxes of the domain.
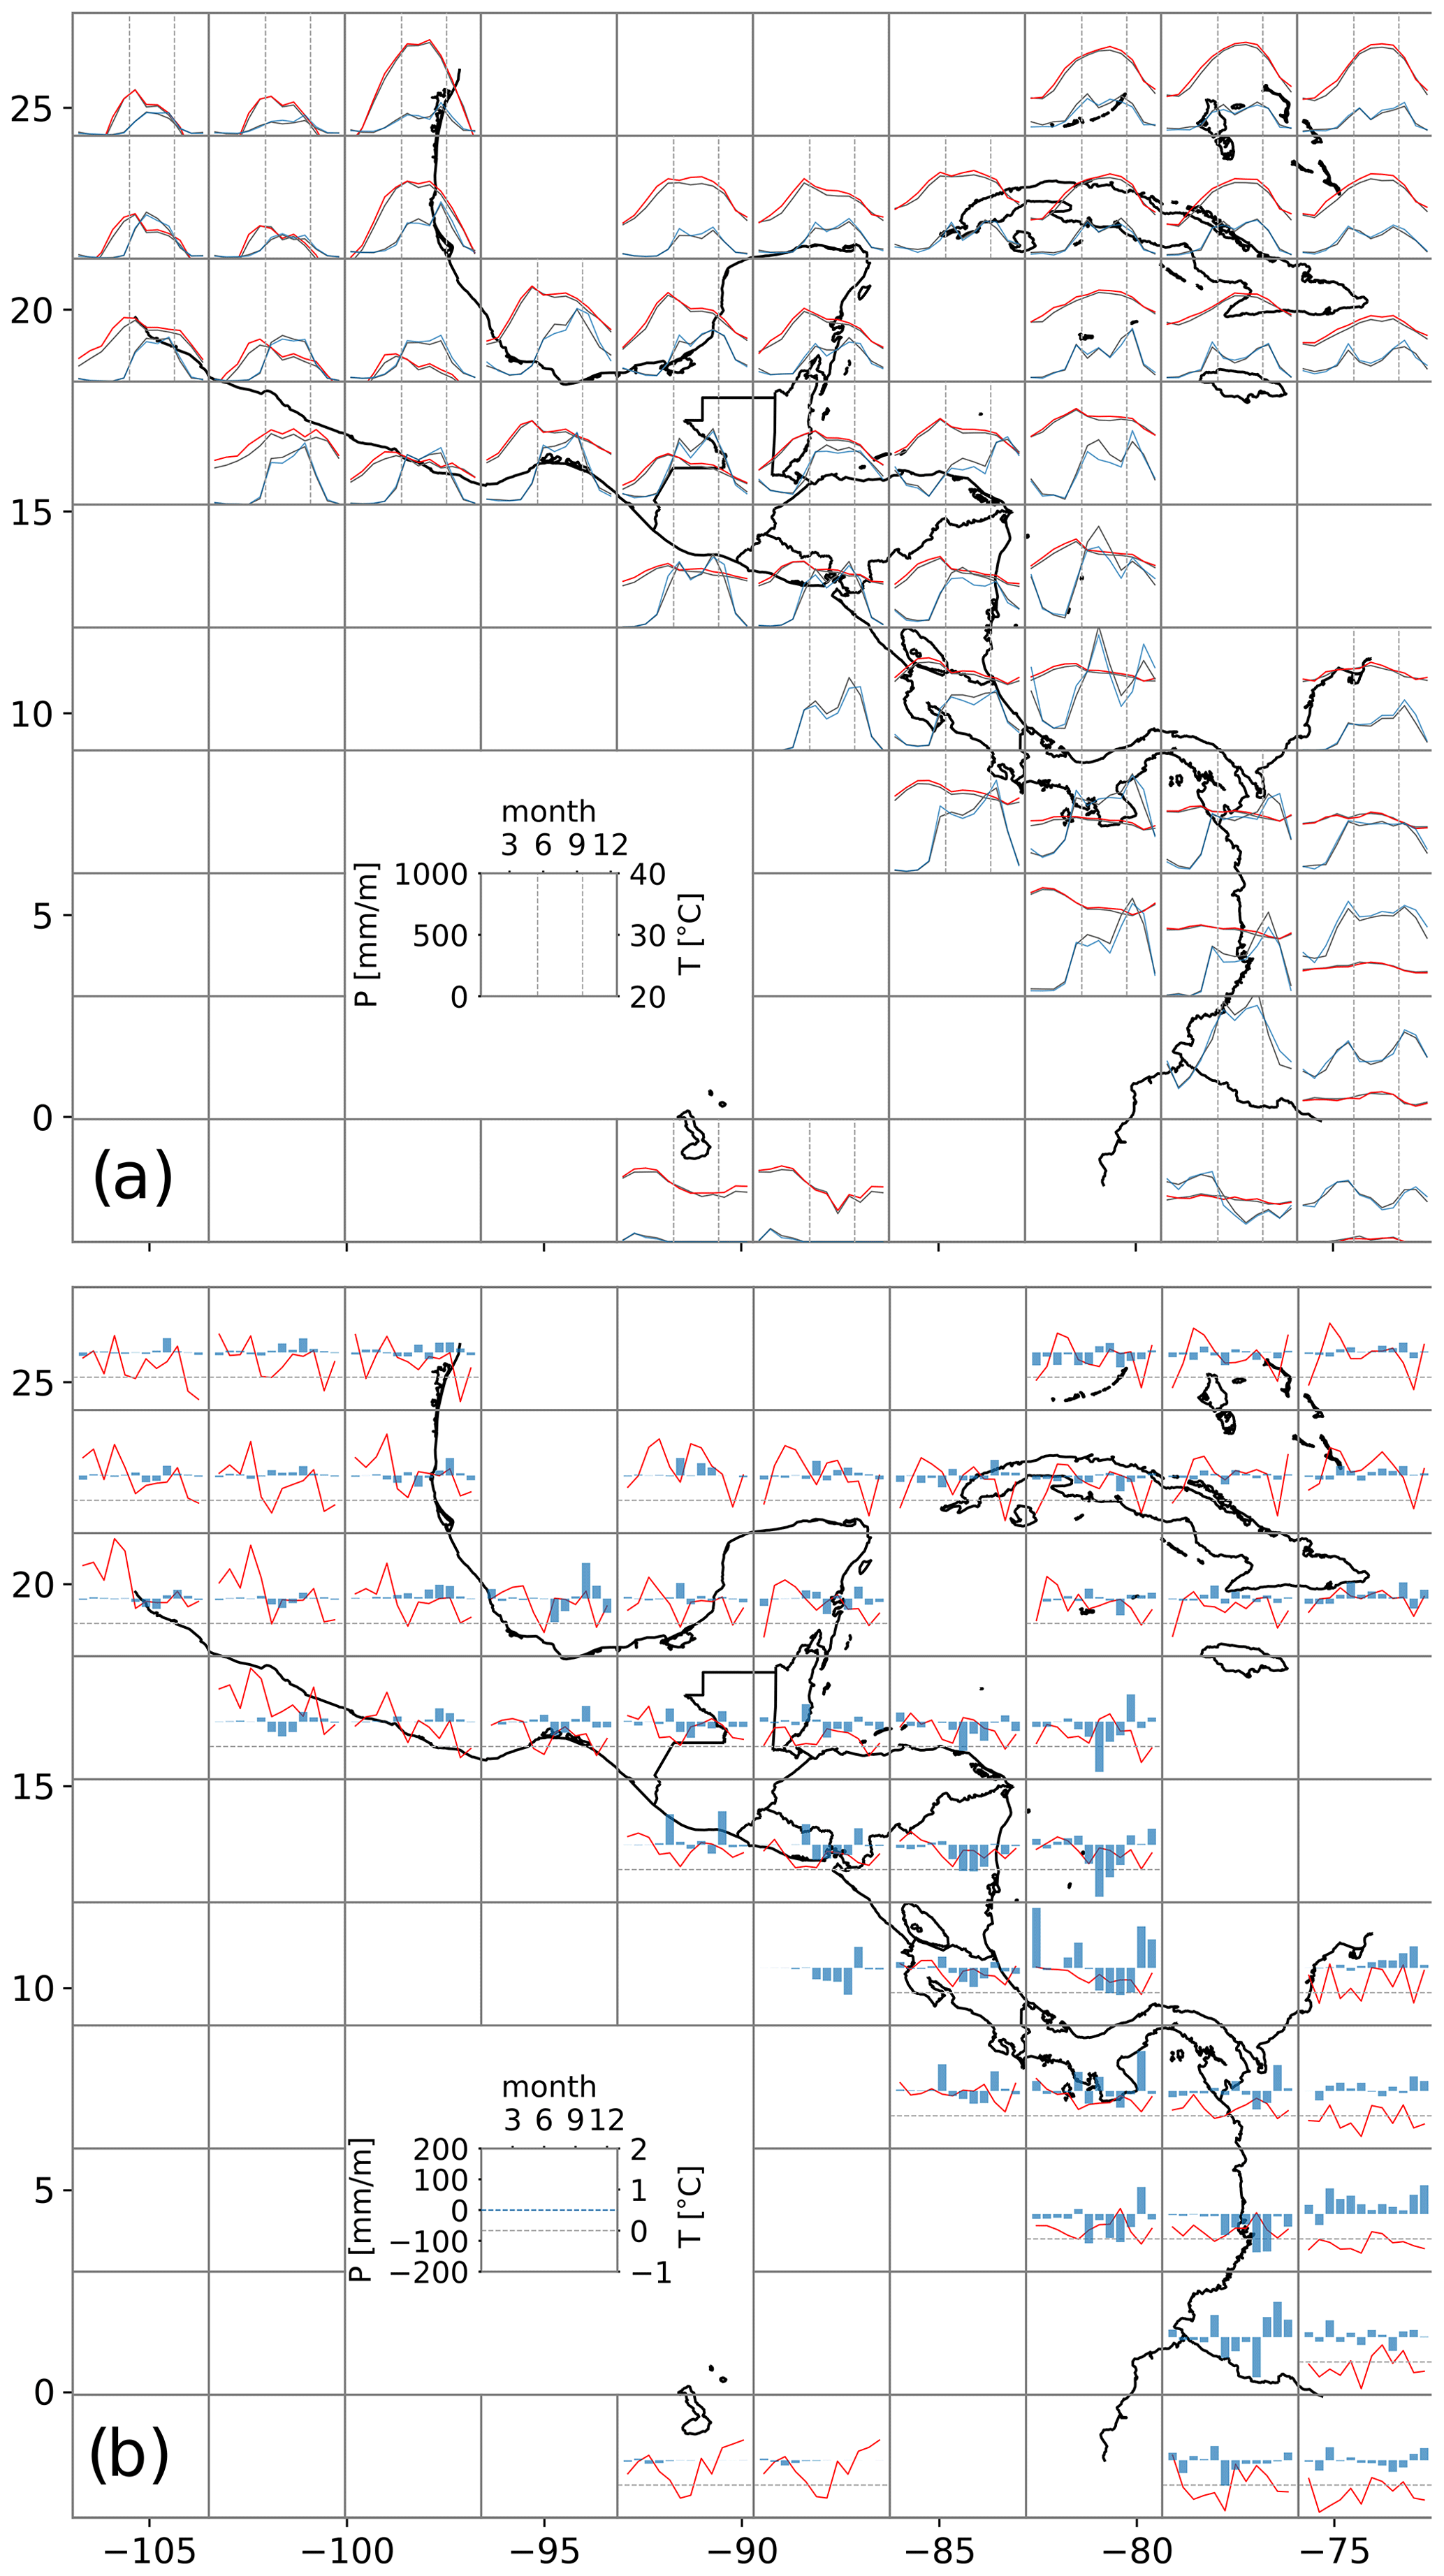
Figure 2The study area with (a) climatological patterns of monthly precipitation (blue) and temperature (red) for the 1981–2020 period and (b) changes between the early (1981–2000) and later (2001–2020) parts of the study periods, based on the CHIRPS (precipitation) and CHIRTS (temperature) datasets.
There are parts of Mexico and the Caribbean, regions excluded from many prior MSD studies, which have exhibited the canonical MSD pattern in the past (Perdigón-Morales et al., 2018). While warmer temperatures during the summer months prevail for the northern parts of the study area, the seasonal cycle of temperature is muted for areas closer to the Equator and/or to the coast, as would be expected, and with a few exceptions for high-elevation regions in the domain, temperatures remain well above freezing throughout the year. In Fig. 2b the precipitation changes between the early (1981–2000) and late (2001–2020) records vary widely across the domain. Particularly in Honduras, Nicaragua, and Costa Rica a decline is evident in precipitation in the wet season, including the July–August period of the MSD. Warming on the order of 1–2 ∘C has generally taken place throughout the domain. Observed temperature increases are variable month to month, though changes are broadly positive and statistically significant, both seasonally and annually. Less significant warming is observed in September–November (Fig. 2b; Stewart et al., 2021).
Applying our original definition of the MSD as defined in Table 1 and Fig. 1 yields Fig. 3.

Figure 3Number of years out of 20 with an MSD in (a) the early period (1981–2000) and (b) the late period (2001–2020). Circles in panel (b) indicate the difference in proportions of MSD years in the two periods is statistically significant based on Fisher's exact test.
In Fig. 3, two-thirds of the grid cells with statistically significant changes in the number of years with an MSD are locations that are dominated by an MSD in the early period but not in the late period, based on the original values of the MSD definition in Table 1. Aside from some areas on the Caribbean side of Mexico where MSD years have become more frequent, most of the significant changes are concentrated in the southern part of the domain (especially Panama), suggesting a change in precipitation seasonality in southern Central America. This is explored further below.
Summing MSD presence over the early and late periods of study results in Fig. 4, which (by design) closely resembles that of Anderson et al. (2019). Figure 4 shows that most of the pixels that are classified as experiencing an MSD pattern exhibit this throughout the past 4 decades. Expansion of the area with an MSD occurs in the northern part of the domain, mostly in Mexico's Yucatan Peninsula. Areas with MSD in the early period but not in the later period appear generally toward the southern part of the domain, especially evident in Panama. More intense drying of the northern part of Central America, with intensification of the MSD, has been identified as potentially indicative of a southern shift in the summer location of the Intertropical Convergence Zone (ITCZ) (Rauscher et al., 2011; Hidalgo et al., 2013), also an anticipated impact of climate disruption on this region (Rauscher et al., 2008). The regions classified as MSD in the late but not early period also coincide largely with the areas showing significant trends for greater MSD intensity (Fig. A2), due in part to an increase in the magnitude of the precipitation peaks, especially the first peak (Figs. A3 and A4), and a decline in the intervening minimum (Fig. A5).
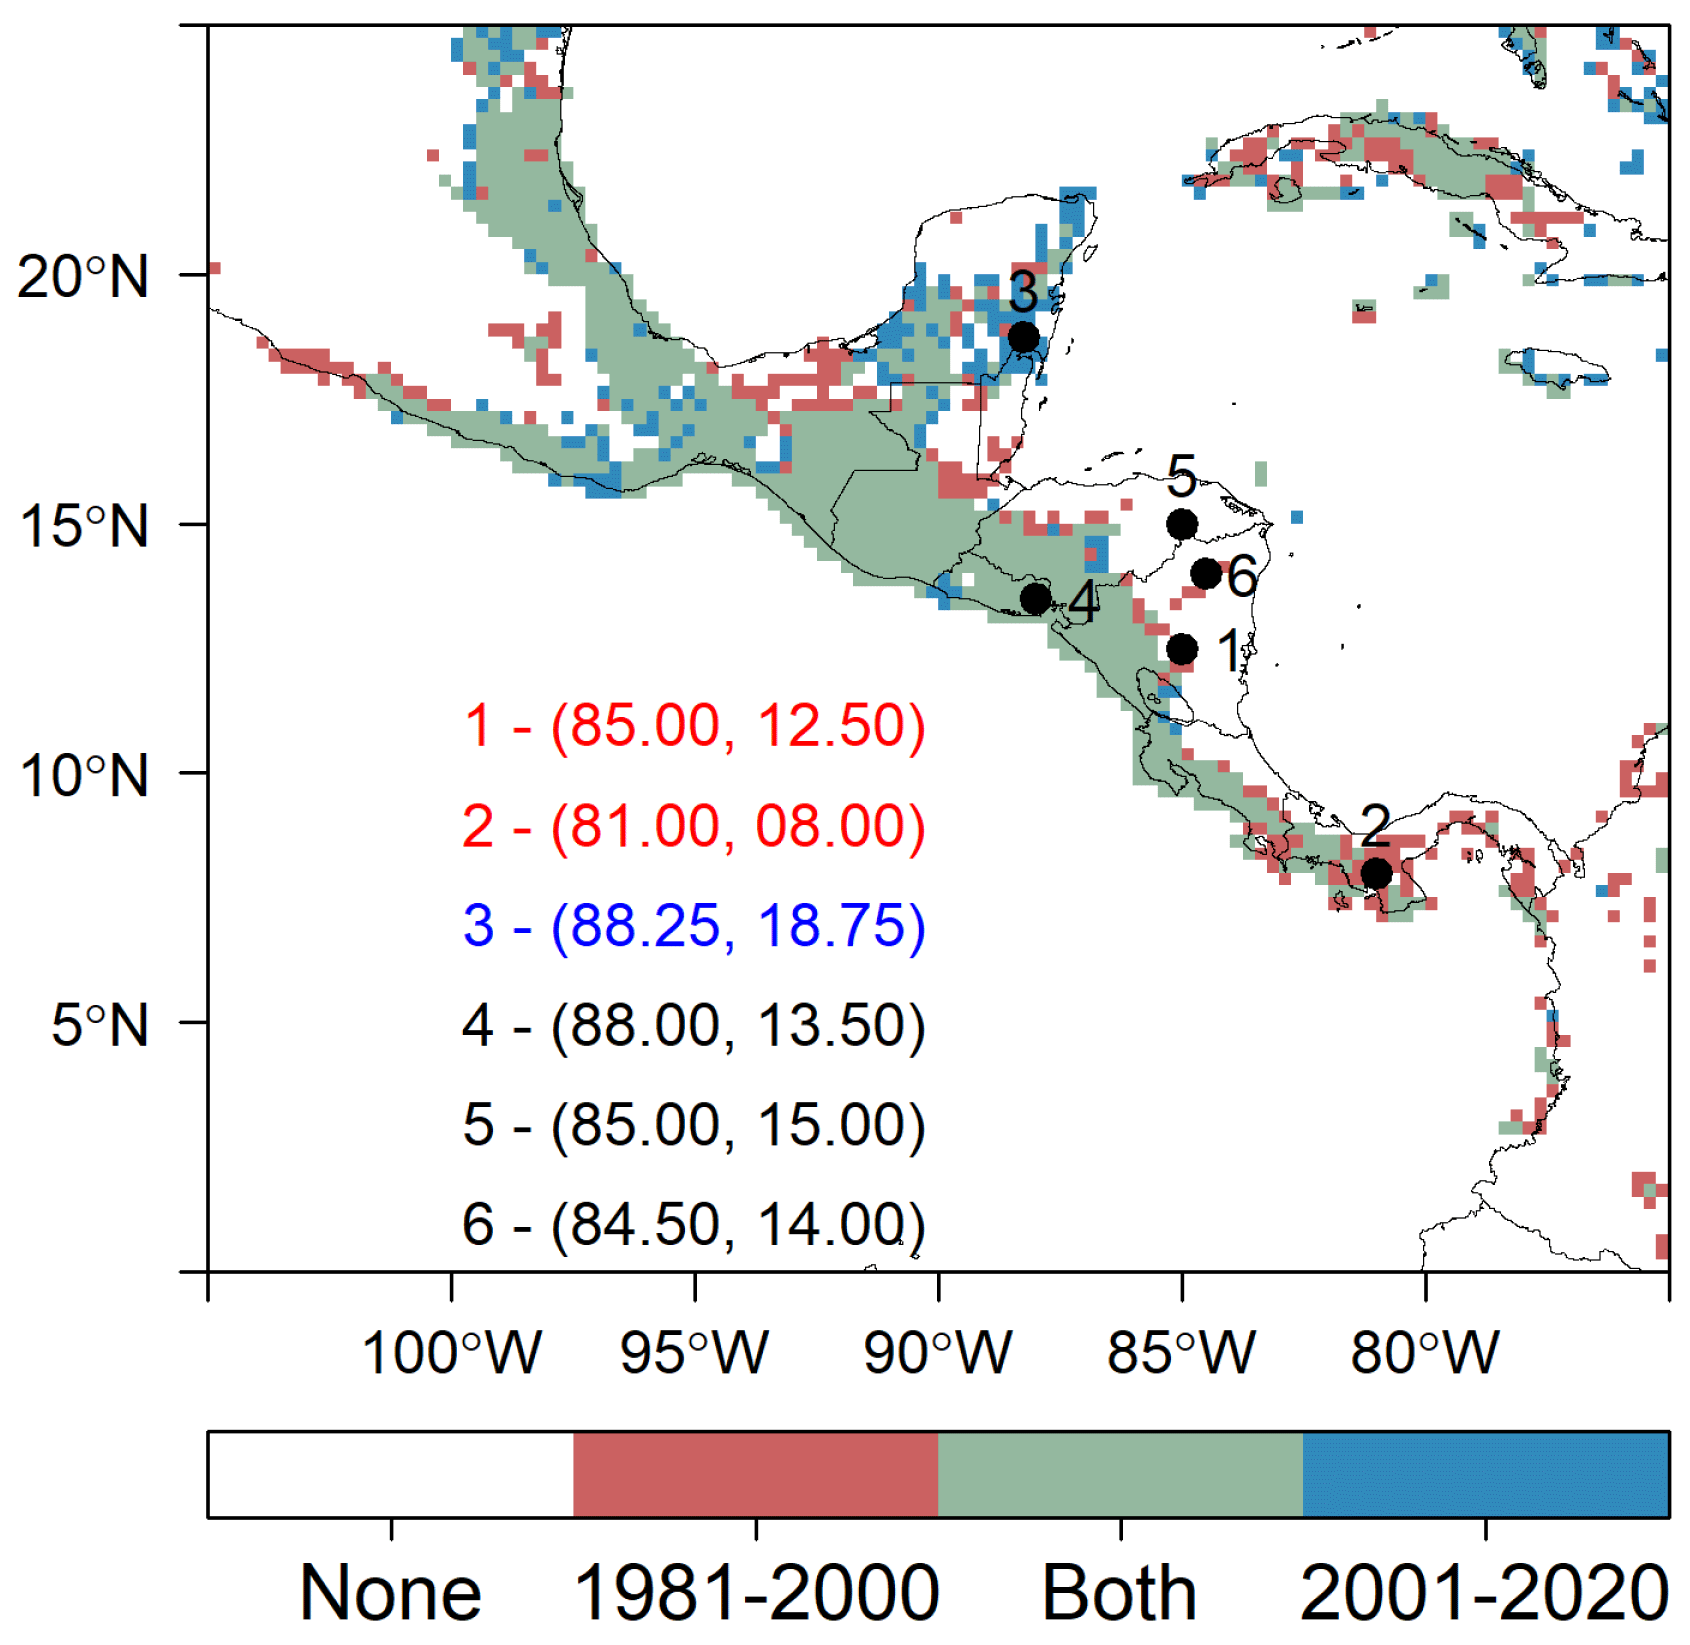
Figure 4Occurrence and change in the occurrence of the MSD using the original definition of the MSD (Table 1 and Fig. 1). Shading indicates pixels with an MSD for the early (1981–2000), late (2001–2020), or both periods. Also shown are specific points used in subsequent examples or discussion, selected to show a variety of MSD characteristics and different changes between the early and late periods.
While Mexico and Central America are often the focus of MSD studies, our analysis using consistent criteria demonstrates that the phenomenon is also widely present in the Caribbean, as shown by others (e.g., Almazroui et al., 2021), though the driving mechanisms for the MSD are distinct from the rest of the domain (Curtis and Gamble, 2008). For the portions of the Caribbean included in Fig. 4 there are few areas showing a tendency for increased MSD occurrence, though many do see a continuing MSD classification for both the early and late periods.
For illustration of the types of details encountered by the classification scheme in any year, Fig. 5 shows for different locations (identified in Fig. 4) a sample of several time series of precipitation, after applying the smoothing described above. This also shows the outcome of applying the criteria as to whether an MSD exists in the year depicted.
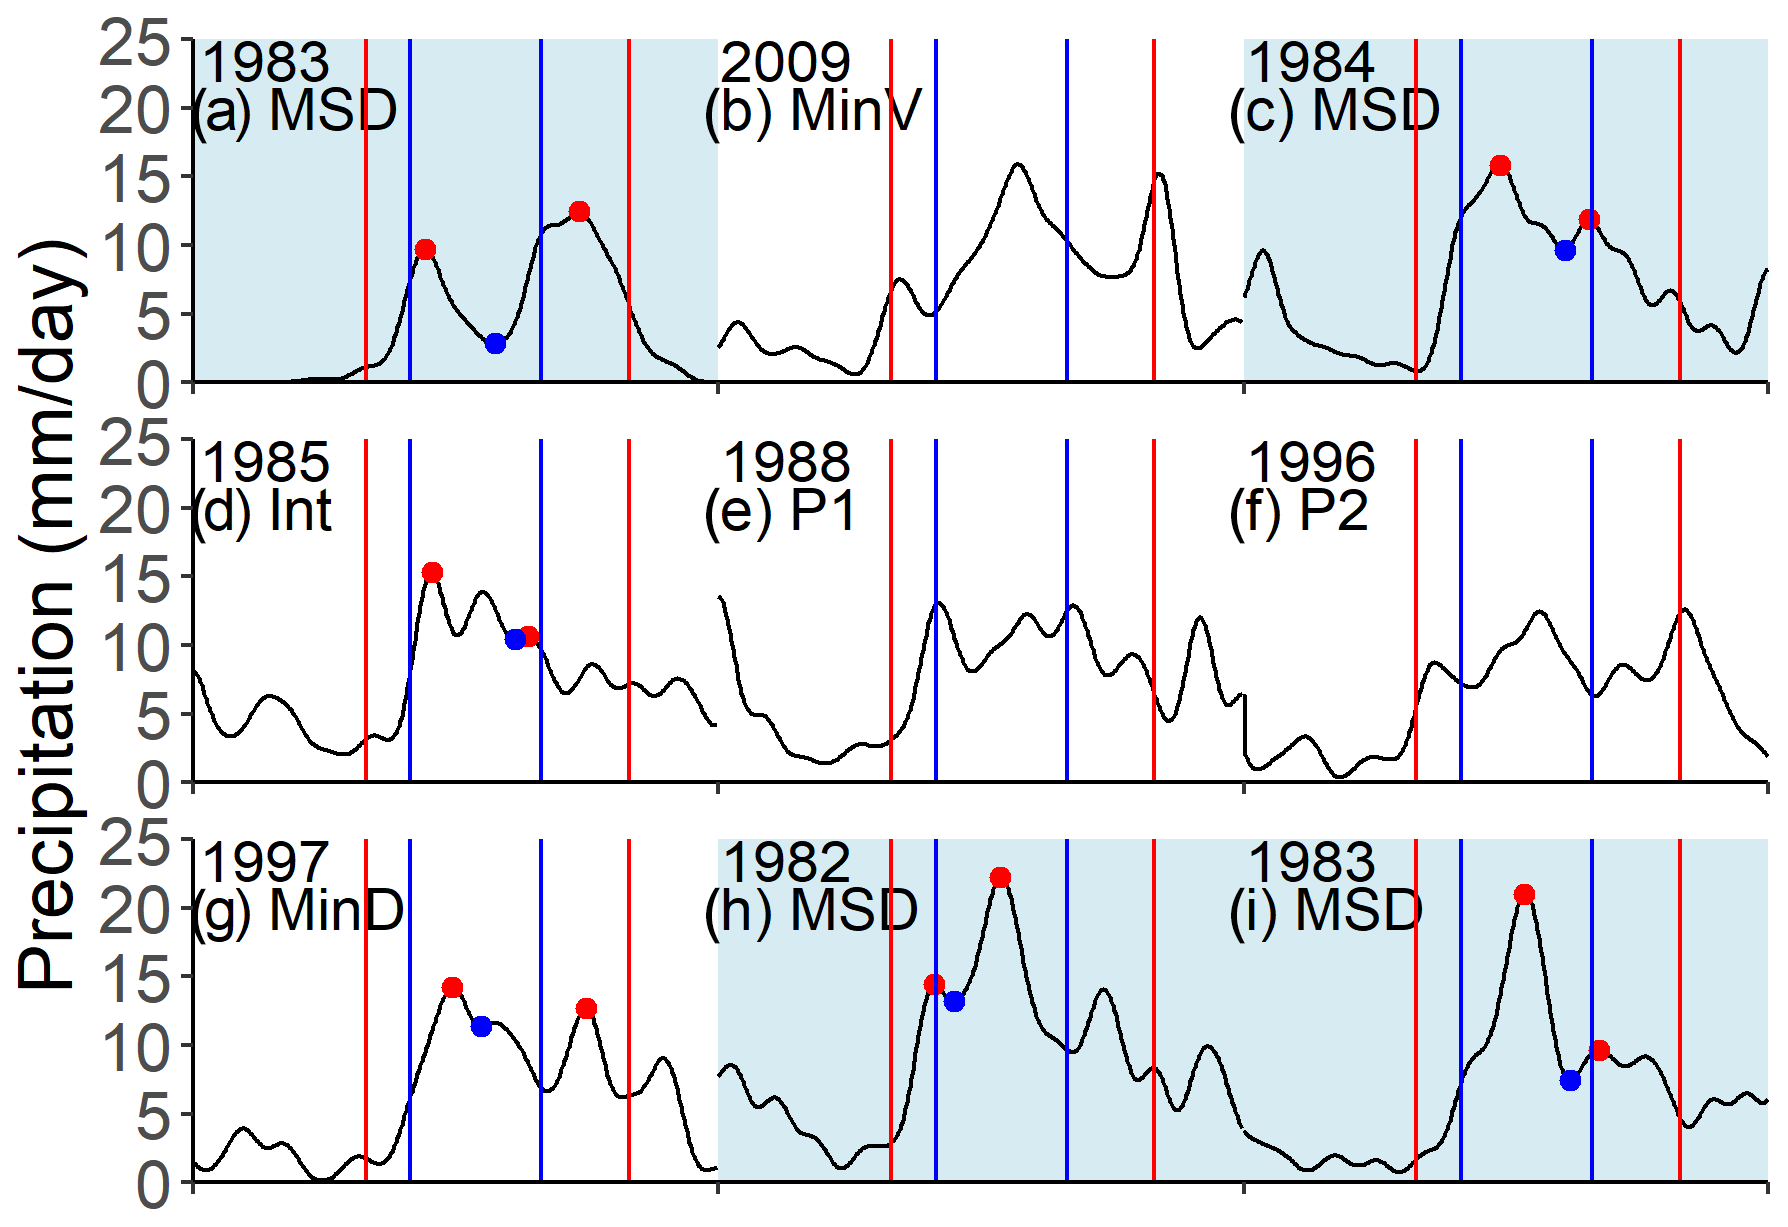
Figure 5Daily precipitation time series for the year indicated in the upper left corner of each panel. Blue shading indicates the year is classified as an MSD using our original definition (Table 1 and Fig. 1). Key time windows from Table 1 are indicated by vertical lines: blue lines correspond to window 1, in which a minimum is identified, red lines to window 2, in which peaks must occur. Red dots indicate first and second maxima and blue dots mark the minimum if they meet MSD criteria. Examples shown are (a) a canonical MSD pattern at point 4, (b) no minimum in window 1 at point 6, (c) a high minimum at point 5 but still an MSD, (d) insufficient intensity at point 5, (e) an early peak outside window 2 at point 6, (f) a second peak outside window 2 at point 6, (g) a lower minimum occurring in window 2 at point 5, and (h, i) a high variation in peaks at point 5.
Figure 5 shows that, in most cases, even after smoothing the precipitation signal remains noisy. While the canonical MSD pattern (Fig. 5a) is what is often depicted in the literature (e.g., Anderson et al., 2019; Karnauskas et al., 2013), MSD years can have a wide variety of shapes in the precipitation record (Fig. 5c, h, and i). Years that might appear to be an MSD may fail one or more criteria (Fig. 5d, f, and g). These examples highlight the potential sensitivity of MSD classification to the details of its definition. Similar problems can arise when defining the MSD using alternative methods or even for the date of onset or demise of the rainy season. Several criteria have been developed for these two purposes, with advantages and drawbacks (e.g., Alfaro, 2014; Maldonado et al., 2016; Bombardi et al., 2017).
To explore the characteristics affecting the classification of certain locations as having an MSD, we explore three points. Specifically, we examine points that either are classified as having an MSD in the early period (1981–2000) but not in the later period (2001–2020) or vice versa. Figure 6 illustrates the 20-year average conditions at points 1, 2, and 3 (Fig. 4).
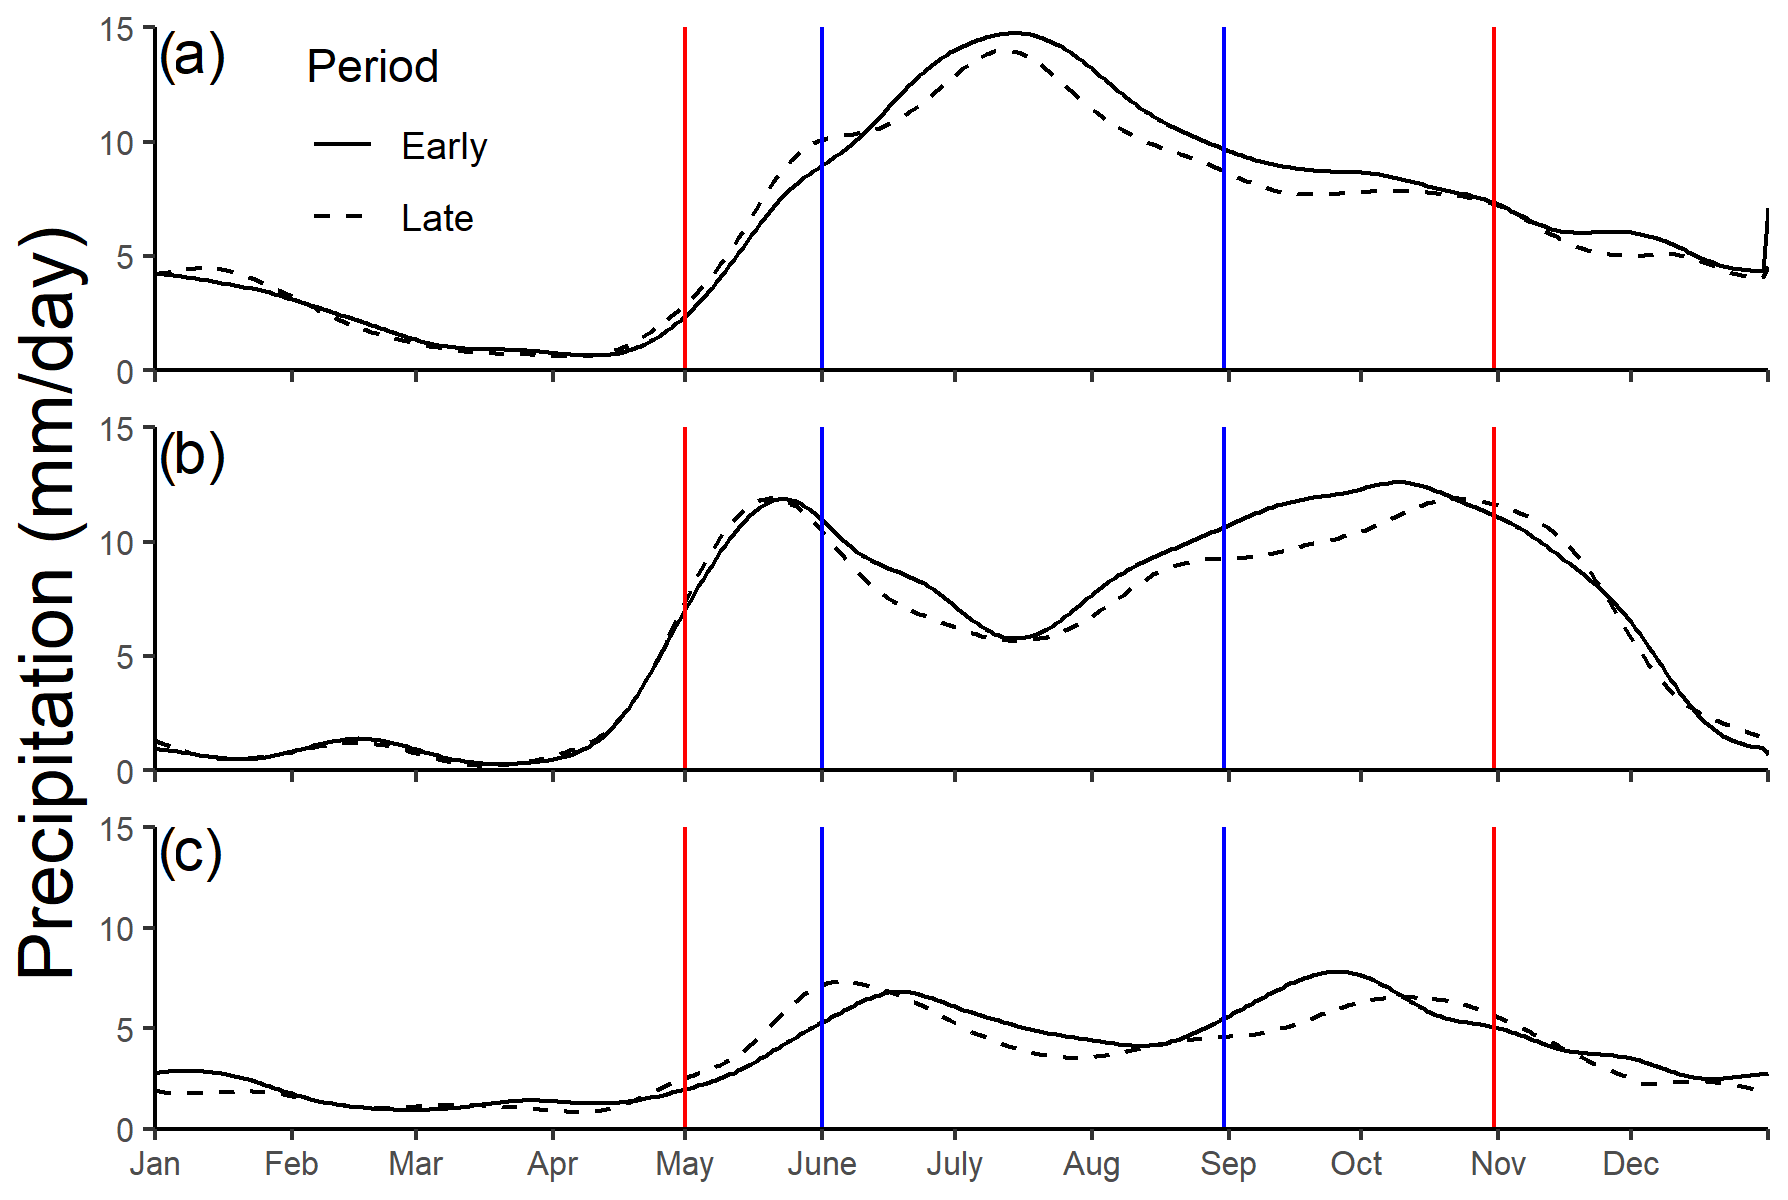
Figure 6Twenty-year average precipitation (mm d−1) pattern at (a) point 1 with MSD in 1981–2000 but not 2001–2020, (b) point 2 with MSD in 1981–2000 but not 2001–2020, and (c) point 3 with MSD in 2001–2020 but not 1981–2000. As with Fig. 5, key time windows are indicated by vertical lines.
While Fig. 6 shows relatively subtle changes in average precipitation between the 20-year periods at all three points, underlying these are more systematic changes that affect the MSD classification. Point 1 does not show an MSD signal at all in the average precipitation for either period in Fig. 6a. This is because the typical pattern of precipitation has a single larger peak falling near the center of the 1 June–31 August window (in which a search is done for a minimum), with the minimum occurring closer to the extreme dates of this window and occurring with equal frequency before and after the larger peak, similarly to Fig. 5h and i. Point 1 shows an overall reduction in precipitation for the later period, especially from June through October. The declining precipitation produces smaller peaks resulting in a declining intensity (in years classified as an MSD), from 4.8 mm in 1981–2000 to 3.7 mm in 2001–2020, reducing the number of years satisfying the MSD criteria from 16 of 20 years in 1981–2000 to 9 in 2001–2020.
The average precipitation pattern for point 2 shows a more typical MSD pattern for both periods. Similarly to point 1, the 1981–2000 period is classified as having an MSD, while 2001–2020 is not. However, the changes are much more subtle, with the MSD years having nearly the same intensity for both periods (7.9 and 8.1 mm d−1 for the early and late periods, respectively). At point 2, Fig. 6b shows the shift of the second peak to slightly later in the season, which is the important change at this location. For 1981–2000, 18 of 20 years are classified as MSD, while 2021–2020 has 15 years of MSD, falling just below the threshold of 16 years required for an MSD location. In every case for both periods, the cause of a year not being an MSD is the second peak slightly outside the 1 October window required by the definition. Thus, at this location it is the timing of the second rainfall pulse that changes the MSD classification.
Table 2Columns (a)–(c): total number of MSD grid cells (percent change from original in parentheses) with different values of criteria used to define an MSD for the early period (1981–2000), late period (2001–2020), and both periods. Changes in the total number of MSD pixels between the periods are shown in column (d).

Similarly to point 2, point 3 (Fig. 6c) shows an average shift in the second precipitation peak to later in the season for 2001–2020 compared to 1981–2000, with a slight reduction in the magnitude of the second peak. However, point 3 shows the opposite effect, with 13 of 20 years classified as MSD for 1981–2000, increasing to 18 for 2001–2020, showing a dramatic increase in the number of years satisfying the definition of an MSD. Average statistics do not explain the difference, with durations of 105 d for 1981–2000 and 107 d for 2001–2020; intensity is relatively constant, at 7.4 mm for 1981–2000 and 7.1 mm for 2001–2020. In 1981–2020 the dominant cause of failing to meet the MSD criteria is peak precipitation occurring outside of the established MSD windows, often in December–January. There is no evident reduction in average rainfall during December–January in Fig. 6c, nor is there a significant reduction at this location in December–February rainfall detected in a prior study (Stewart et al., 2021), so the effect is limited to peak events, but it has a strong impact on MSD classification.
As the values of the different criteria for classifying an MSD vary, there are changes in the number of MSD grid cells and where the MSD occurs. Table 2 provides a summary of how the number of grid cells varies, and the following figures illustrate changes in the location of the MSD.
Since the precipitation values are smoothed with a 31 d filter, durations shorter than this have no effect on the classification of MSD grid cells. Thus, while we imposed a minimum 15 d duration as our original definition, changing this to 30 d would have no effect on results. Imposing a stricter requirement for longer durations reduces the number of MSD grid cells by about 12 % for durations of up to 50 d but does not substantially change the differences in MSD extent between the two periods from the original. The general insensitivity of MSD classification to the minimum duration is consistent with the majority of significant trends in duration being positive (Fig. A6) and focused on grid cells on the Pacific side that are classified as MSD cells for both periods. Duration definitions of 60 and more days unsurprisingly reduce the number of cells exhibiting an MSD pattern by 30 % and more. An MSD of that length is also inconsistent with the nature of the phenomenon as described by smallholder farmers and prior studies.
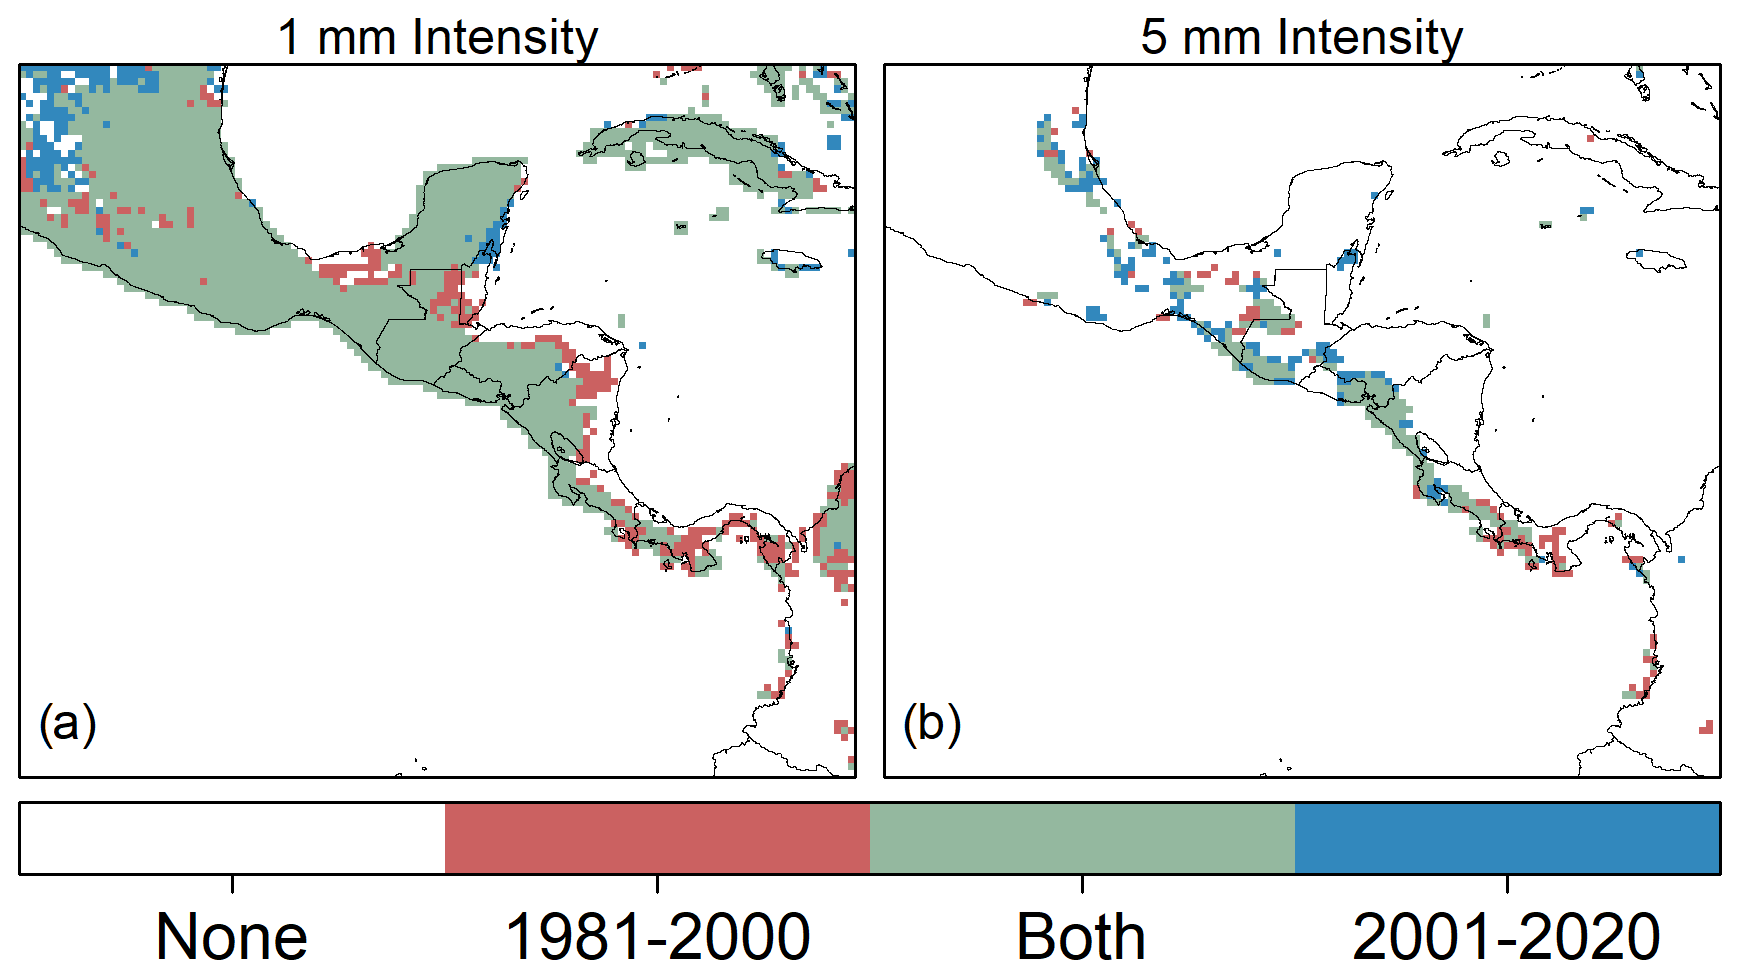
Figure 7Pixels showing MSD by varying from the original definition the minimum required intensity from (a) 1 mm and (b) 5 mm.
Figure 7 shows the effect of varying the intensity criterion of the original MSD definition (3 mm) between 1 and 5 mm. Allowing the low intensity threshold for an MSD classifies nearly the entire domain as having an MSD, with the exceptions being only along the Caribbean side of Central America and most of Colombia. Requiring a more extreme 5 mm intensity for an MSD classification limits zones with MSD to a relatively thin band along the Pacific side of Central America. This larger intensity threshold excludes some areas, such as northern Nicaragua, where the MSD is a well-known phenomenon, indicating that a higher intensity threshold may not be appropriate.
Figure 7 also shows the same spatial pattern of changing MSD grid cells as Fig. 4, with isolated areas in the northern part of the domain changing from not experiencing an MSD to being classified as an MSD in the latter half of the study period. Figure 8 highlights the changes between 1981–2000 and 2001–2020 in total MSD grid cells for the domain. The highest threshold isolates only those grid cells that experience the most intense MSD and also reveals an increase in MSD area. Thus, areas that have historically experienced lower-intensity MSD events have contracted in spatial extent over the last 4 decades. Conversely, areas with historically high-intensity MSD events have expanded.
As was illustrated in Fig. 5, peaks or minima can fall outside of the defined windows by only a day or two and cause a year to not be classified as an MSD. To explore this, we varied the dates of the windows by shifting them all uniformly 2 weeks earlier and 2 weeks later. The results are shown in Table 2 and Fig. 9. By shifting the dates earlier (Fig. 9a) there is a dramatic reduction in the area with an MSD, and the later period sees a steeper reduction, increasing the magnitude of the reduction in MSD area between the two periods. Shifting the dates later (Fig. 9b) increases the area classified as having an MSD for both periods, with 3 times the increase in area from the early to the later period compared to shifting the dates earlier. This indicates that a more extensive MSD exists later in the season in general and that there has been a shift in the last 40 years toward a later MSD.
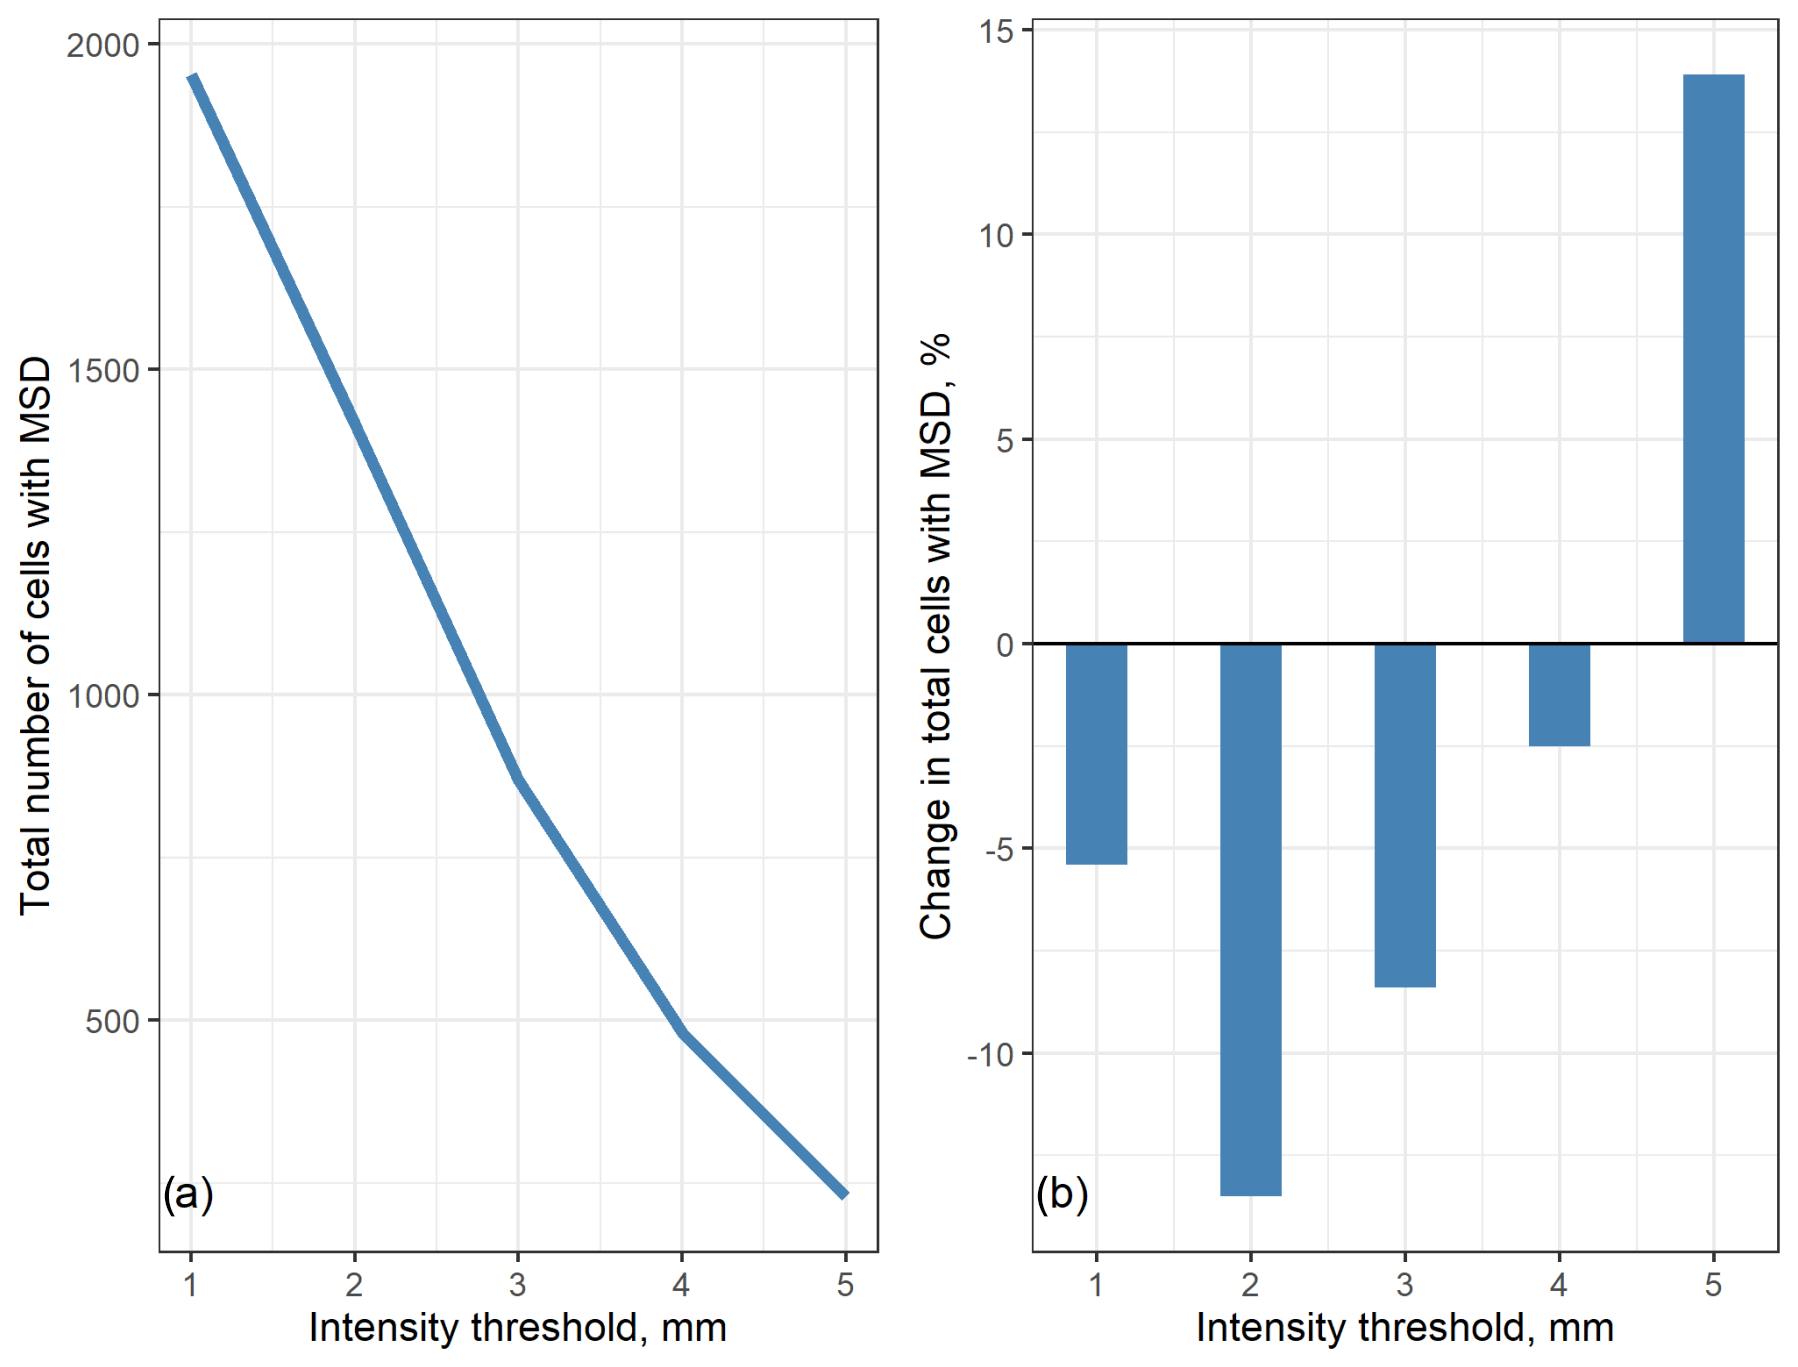
Figure 8(a) Total number of MSD pixels (only those classified as MSD in both periods) and (b) change in the number of pixels classified as experiencing an MSD between 1981–2000 and 2001–2020.

Figure 9Pixels with an MSD using the original definition varying the dates associated with the windows for the minimum and peaks from (a) 2 weeks earlier to (b) 2 weeks later.
Finally, the effect of modifying the number of years any grid cell must have an MSD to be classified as a location with an MSD is shown in Table 2 and Fig. 10. Adopting a looser (70 %) or stricter (90 %) requirement for an MSD grid cell changes the extent but has little effect on the spatial patterns during each period or the changes between the two periods.
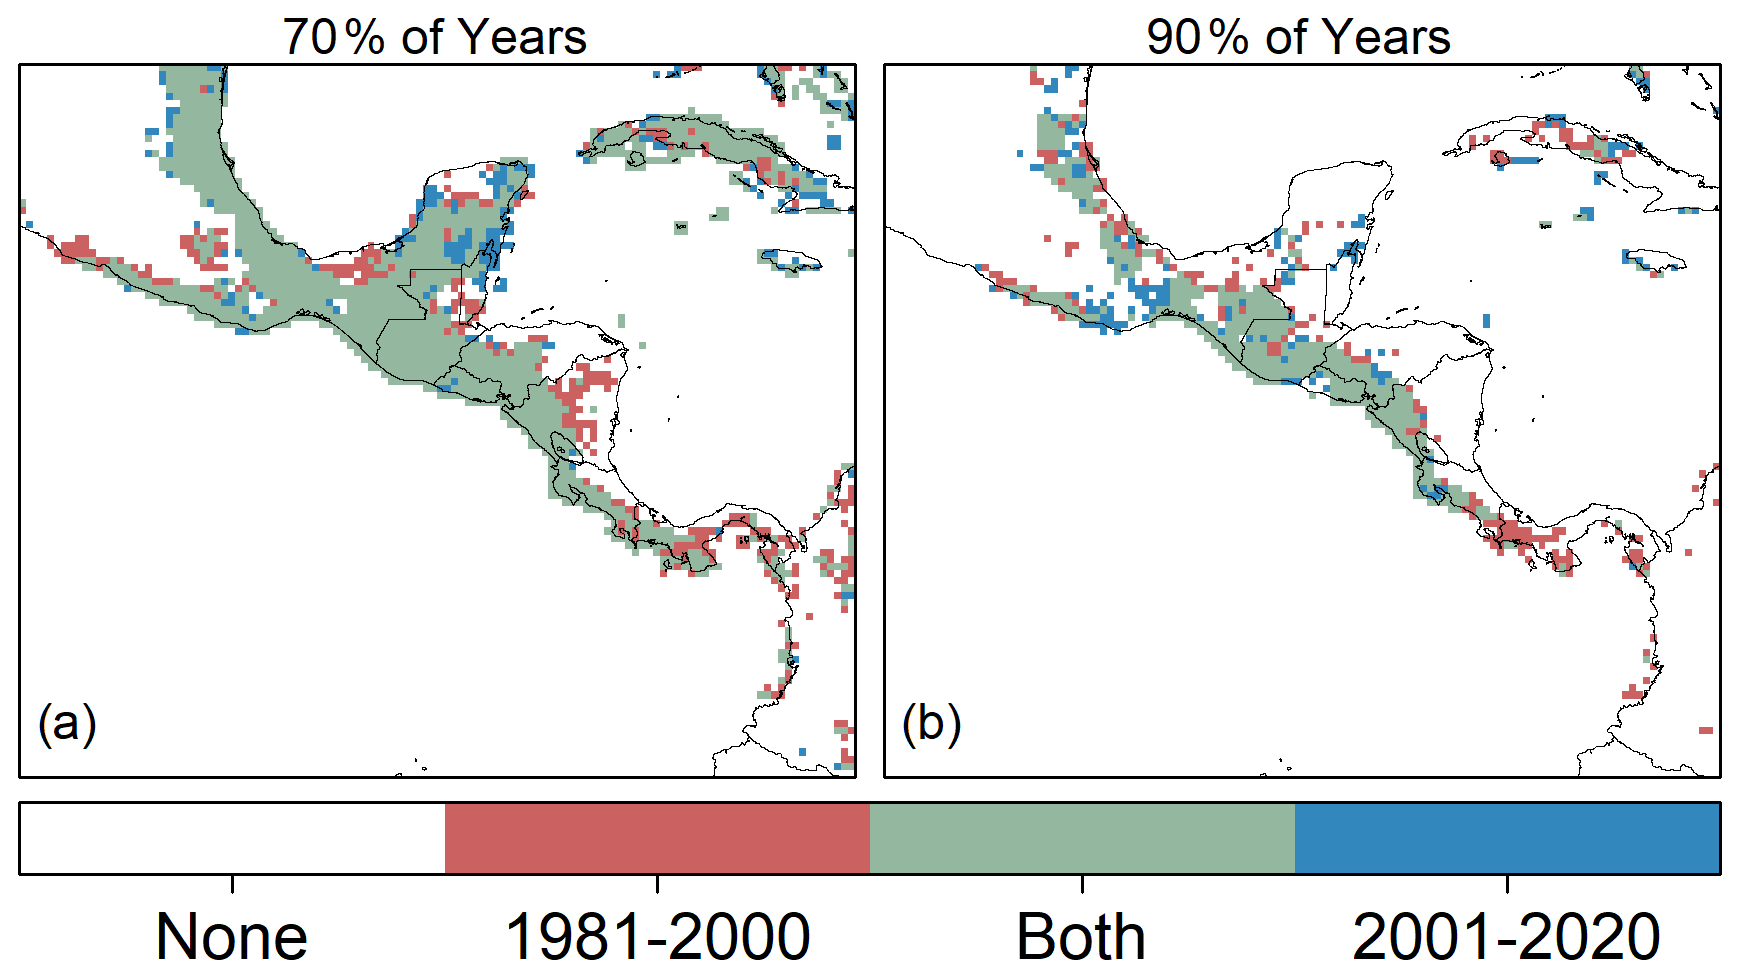
Figure 10Pixels with an MSD by varying the original definition so that a cell must have an MSD in at least (a) 70 % of years and (b) 90 % of years.
The Mesoamerican MSD is typically defined by a set of precipitation characteristics. As studies explore the existence of historical trends or future projections of characteristics of the MSD, understanding the impact of decisions regarding the MSD definition is essential since these can affect results. We found that seasonal variability can cause individual years with detectable MSD signals to be indiscernible in a climatological average, highlighting the importance of assessing individual events for the presence of an MSD.
We examined the four precipitation characteristics defining the dry period between two peaks, centered in July and August: duration (the time between peaks), intensity (the level of decline between the two peaks), the timing (the dates defining windows within which the minimum and peaks must occur), and consistency (the percentage of years with a defined MSD occurring). Of these four, the two with the greatest impact on results were intensity and timing.
The application of a minimum intensity has a dramatic effect on the results of both the area considered as having an MSD and the changes in the recent historical record. Our results suggest that the intensity chosen can affect both the magnitude and direction of changes in the recent observed record. The regions with MSD of greatest intensity show a net increase in area, while areas with a characteristically lower-intensity MSD are decreasing in extent. This may reflect the increases in more extreme precipitation levels in the region, resulting in an intensified MSD, something projected as the climate continues to warm (Maloney et al., 2014; Vichot-Llano et al., 2021).
The original timing established for defining the Mesoamerican MSD definition was that a minimum precipitation should occur in the 1 June–31 August window and that a peak inflection should exist on either side of it within the 1 May–31 October window. Shifting these dates 2 weeks earlier dramatically reduced the area with an MSD, and shifting them 2 weeks later increased the area. In addition, shifting the dates in either direction had a strong influence on the observed change in MSD extent between 1981–2000 and 2001–2020, suggesting a change in precipitation timing to later in the year, so the typical MSD pattern may not be occurring during the time it has historically. MSD timing, and its accurate prediction, is a challenge that could benefit socio-economic sectors throughout the study region (Alfaro et al., 2018). Thus, whether examining past or future changes in MSD or developing improved seasonal forecasts, the non-stationarity of MSD timing should be accommodated.
These results suggest that for studies of historical or future changes in MSD for this region, studies should be conducted for different levels of MSD intensity and timing to capture differing impacts as these characteristics vary across the domain. A greater understanding of the impact of the objective definition of the MSD on changes in the timing, intensity, and frequency of occurrence of the MSD pattern, and their relative importance to smallholder agriculture, may support assessments of climate change impacts connected to the MSD and the development of adaptation strategies.
While including temperature effects on MSD determination will become important as effects are projected later in the 21st century, this study includes only precipitation characteristics, since temperature effects are secondary for the recent historical period on which we focus. MSD classification will be affected by ongoing larger-scale changes in hydroclimate; for example, with increasing aridity (Karmalkar et al., 2011; Hidalgo et al., 2013), reduced or delayed seasonal peak precipitation could lead to a year being a non-MSD year despite prevailing intense drought conditions.
Table A1Summary of percent of grid cells with MSD and the change between the early and late periods, based on the original MSD definition.
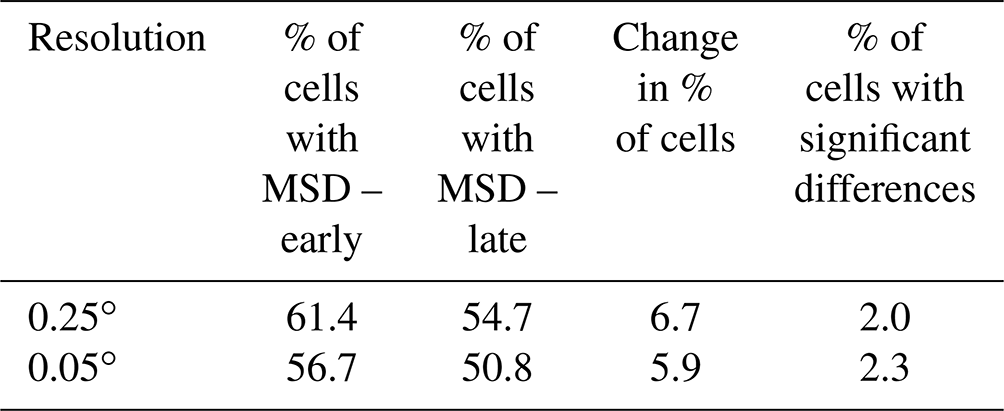
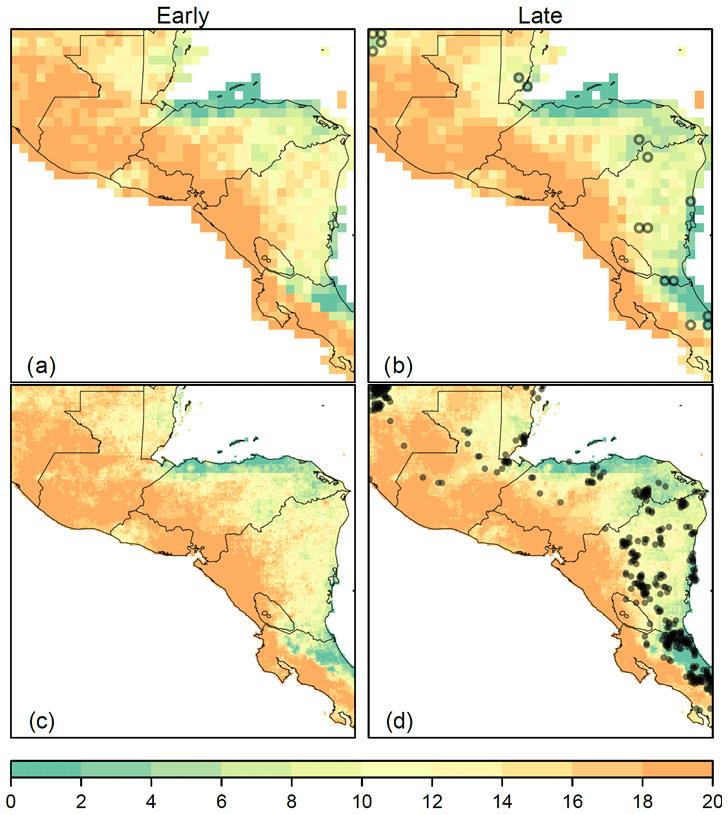
Figure A1Number of years out of 20 with an MSD in the early and late periods using 0.25∘ aggregated data (a, b) and an original CHIRPS resolution of 0.05∘ (c, d). Circles in panel (b) indicate the difference in proportions of MSD years in the two periods is statistically significant based on Fisher's exact test.
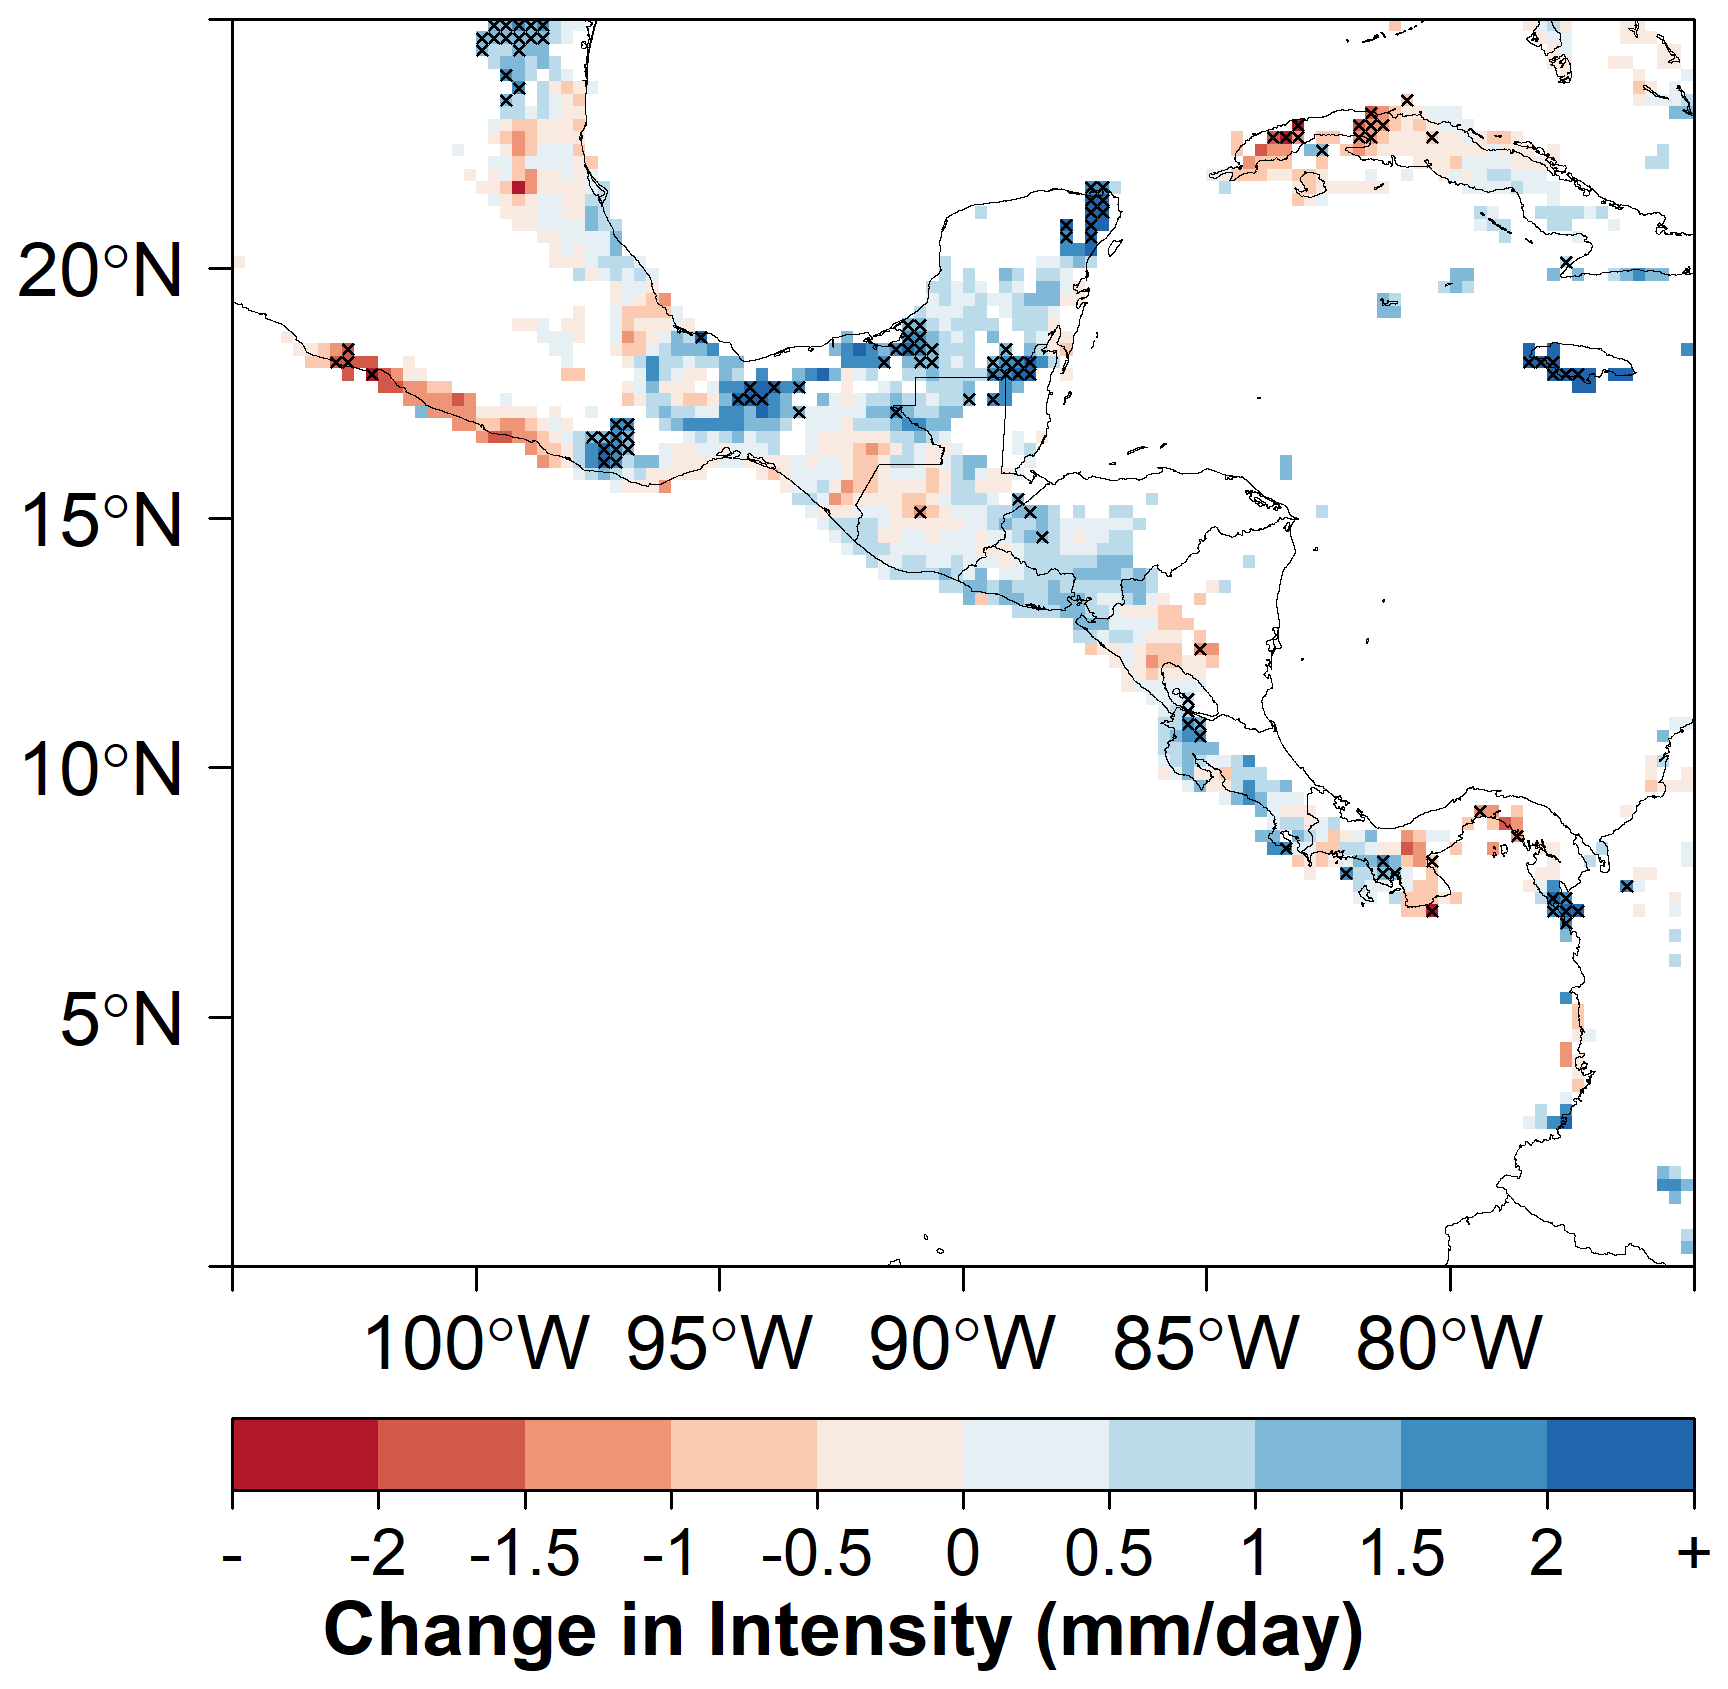
Figure A2The change in MSD intensity between the early (1981–2000) and late (2001–2020) periods. Grid cells marked with an “X” show statistically significant changes.
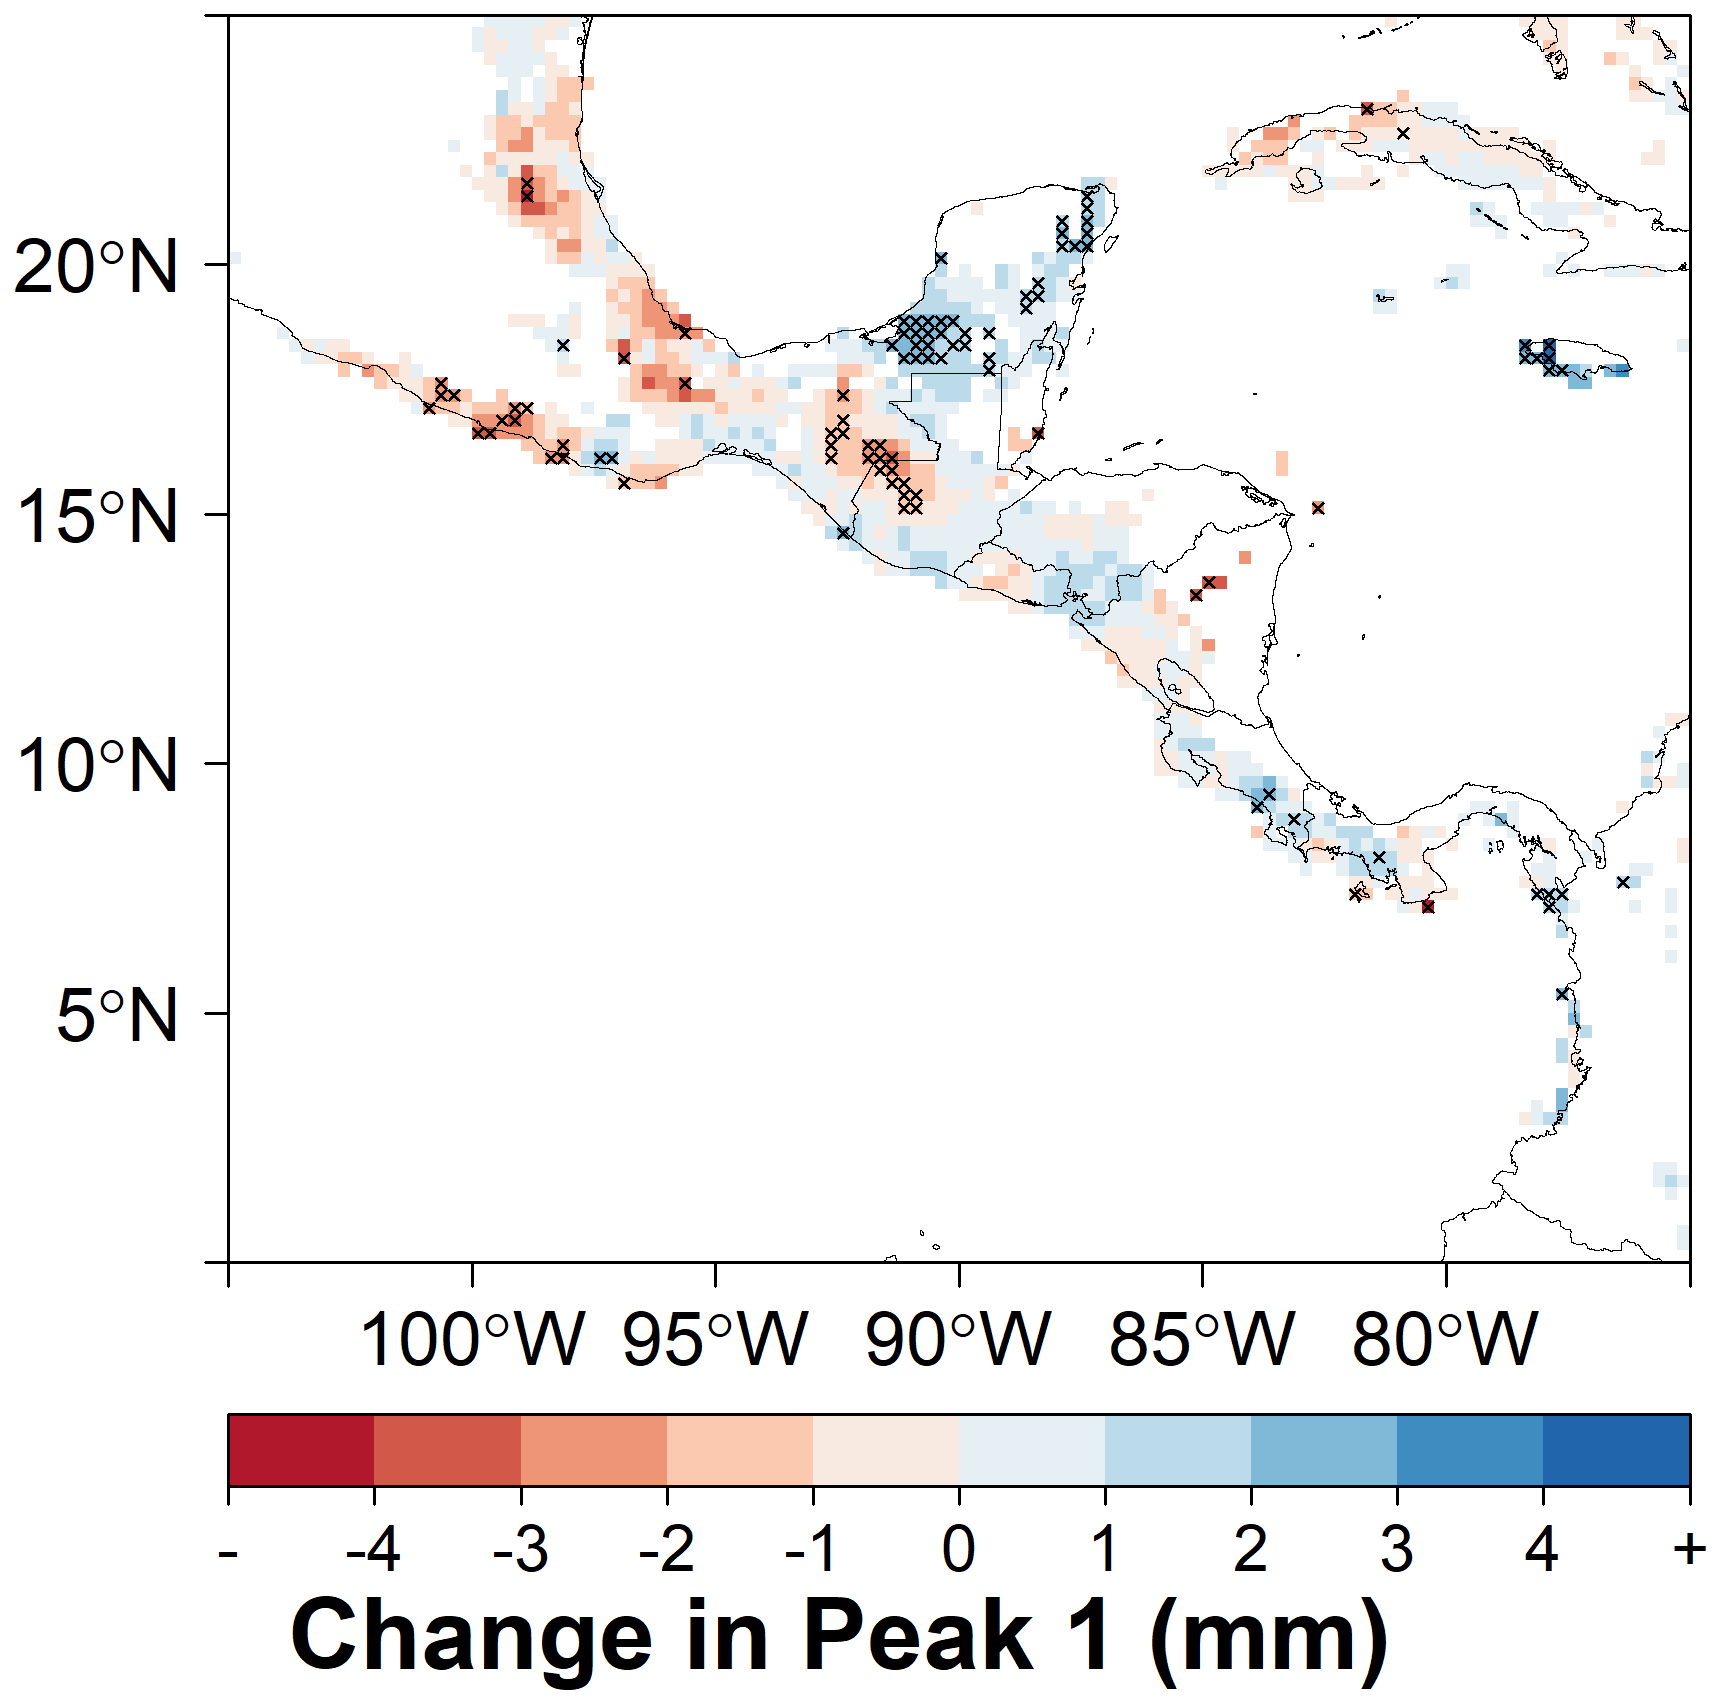
Figure A3The change in magnitude of the first peak MSD between the early (1981–2000) and late (2001–2020) periods. Grid cells marked with an “X” show statistically significant changes.
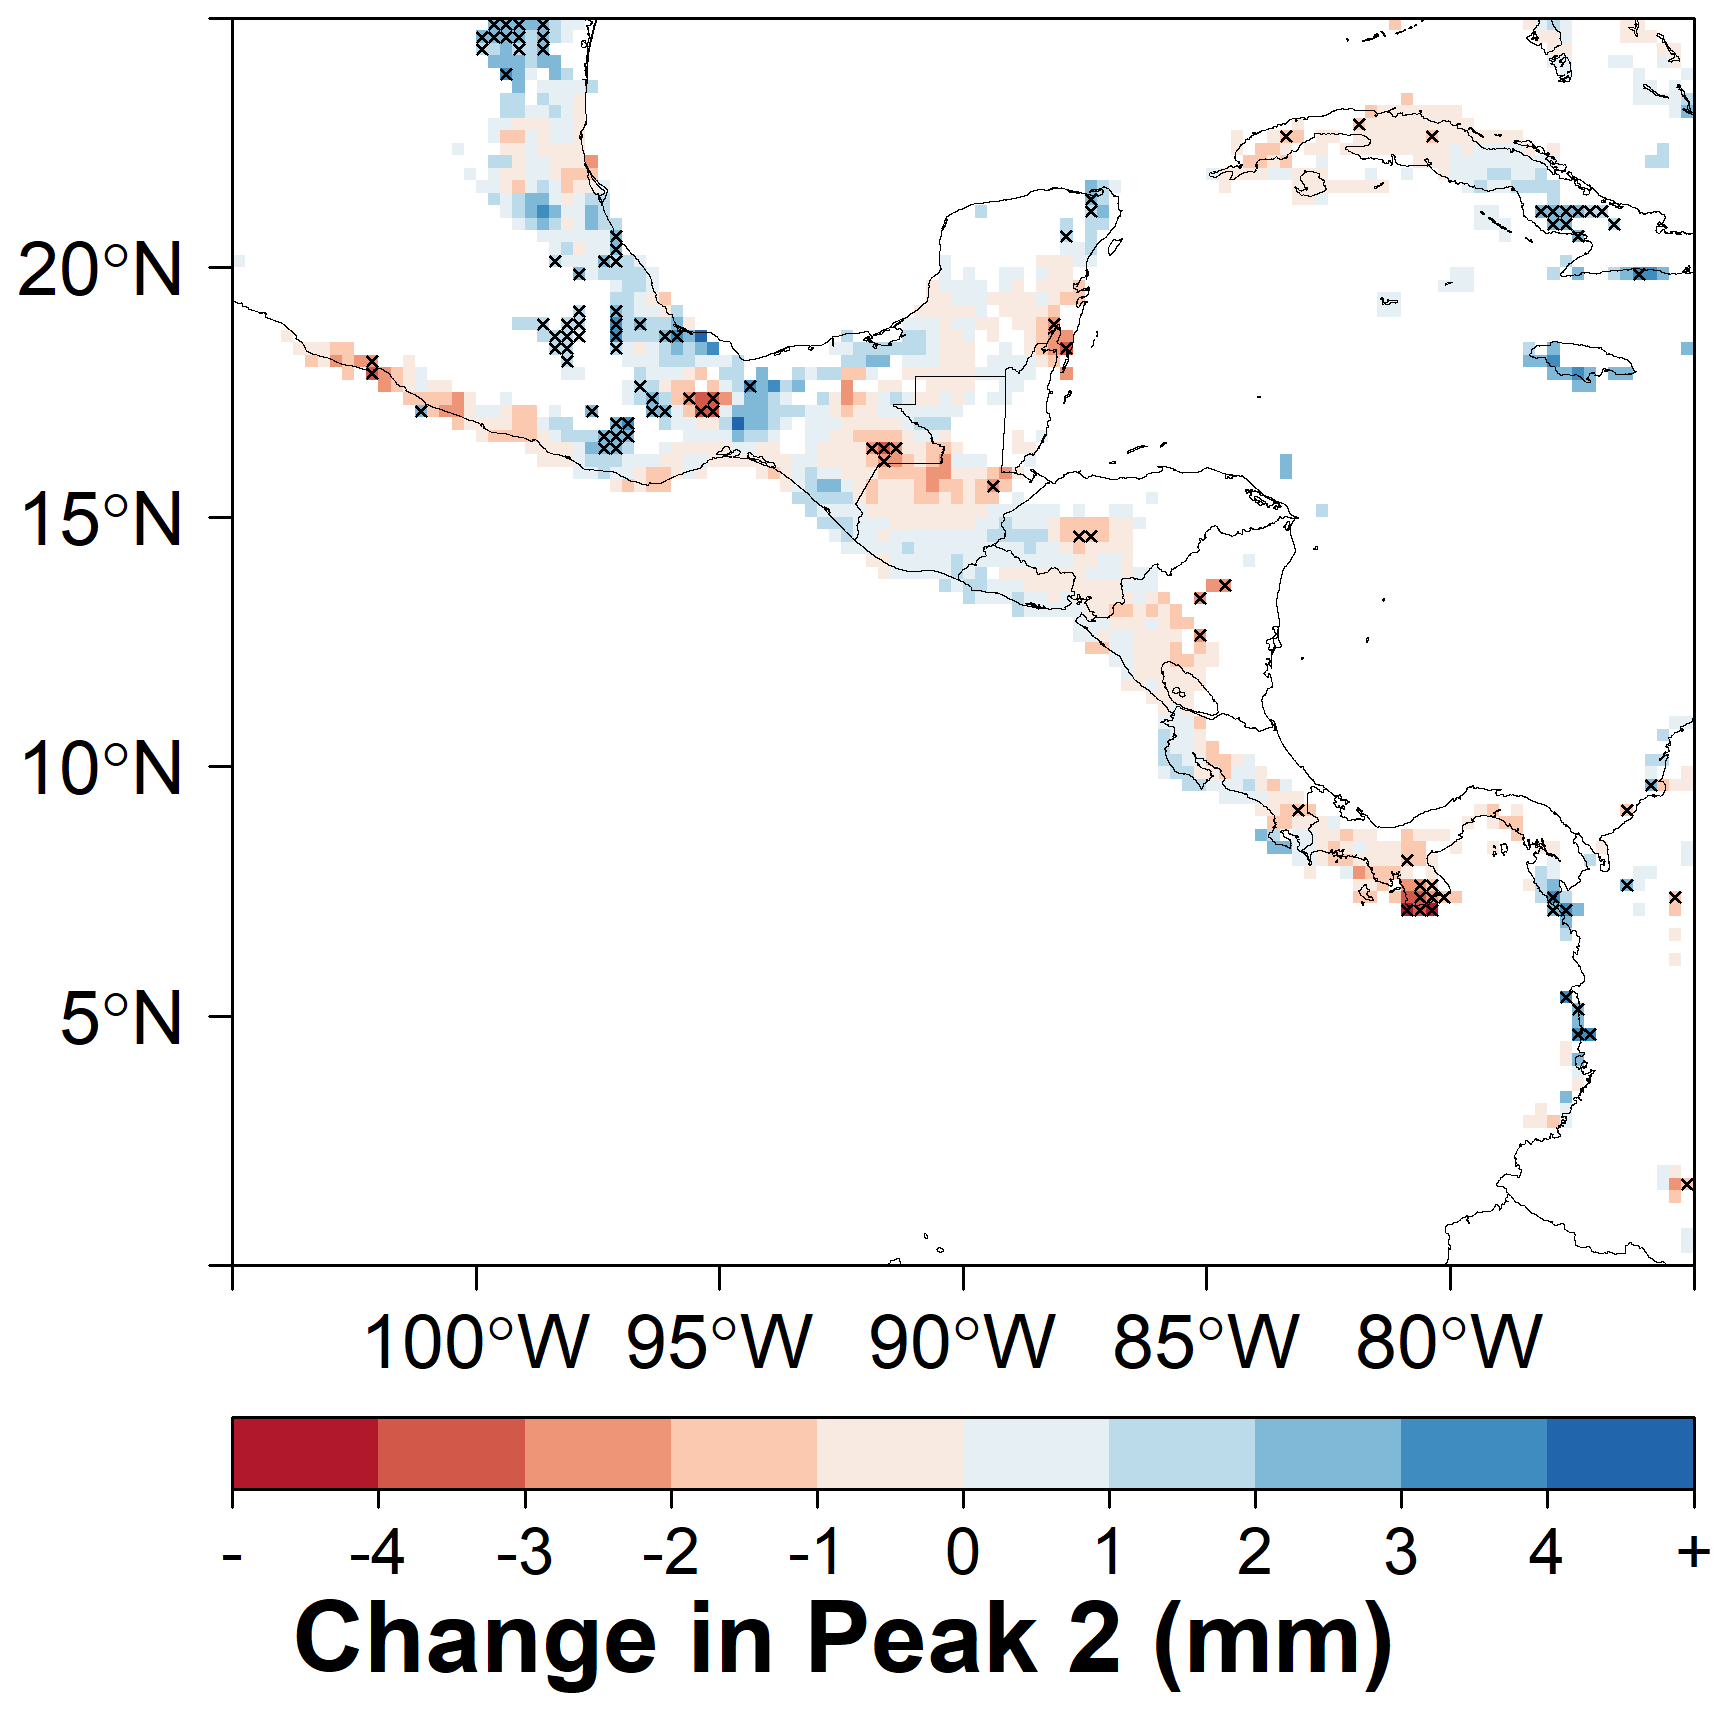
Figure A4The change in magnitude of the second peak MSD between the early (1981–2000) and late (2001–2020) periods. Grid cells marked with an “X” show statistically significant changes.
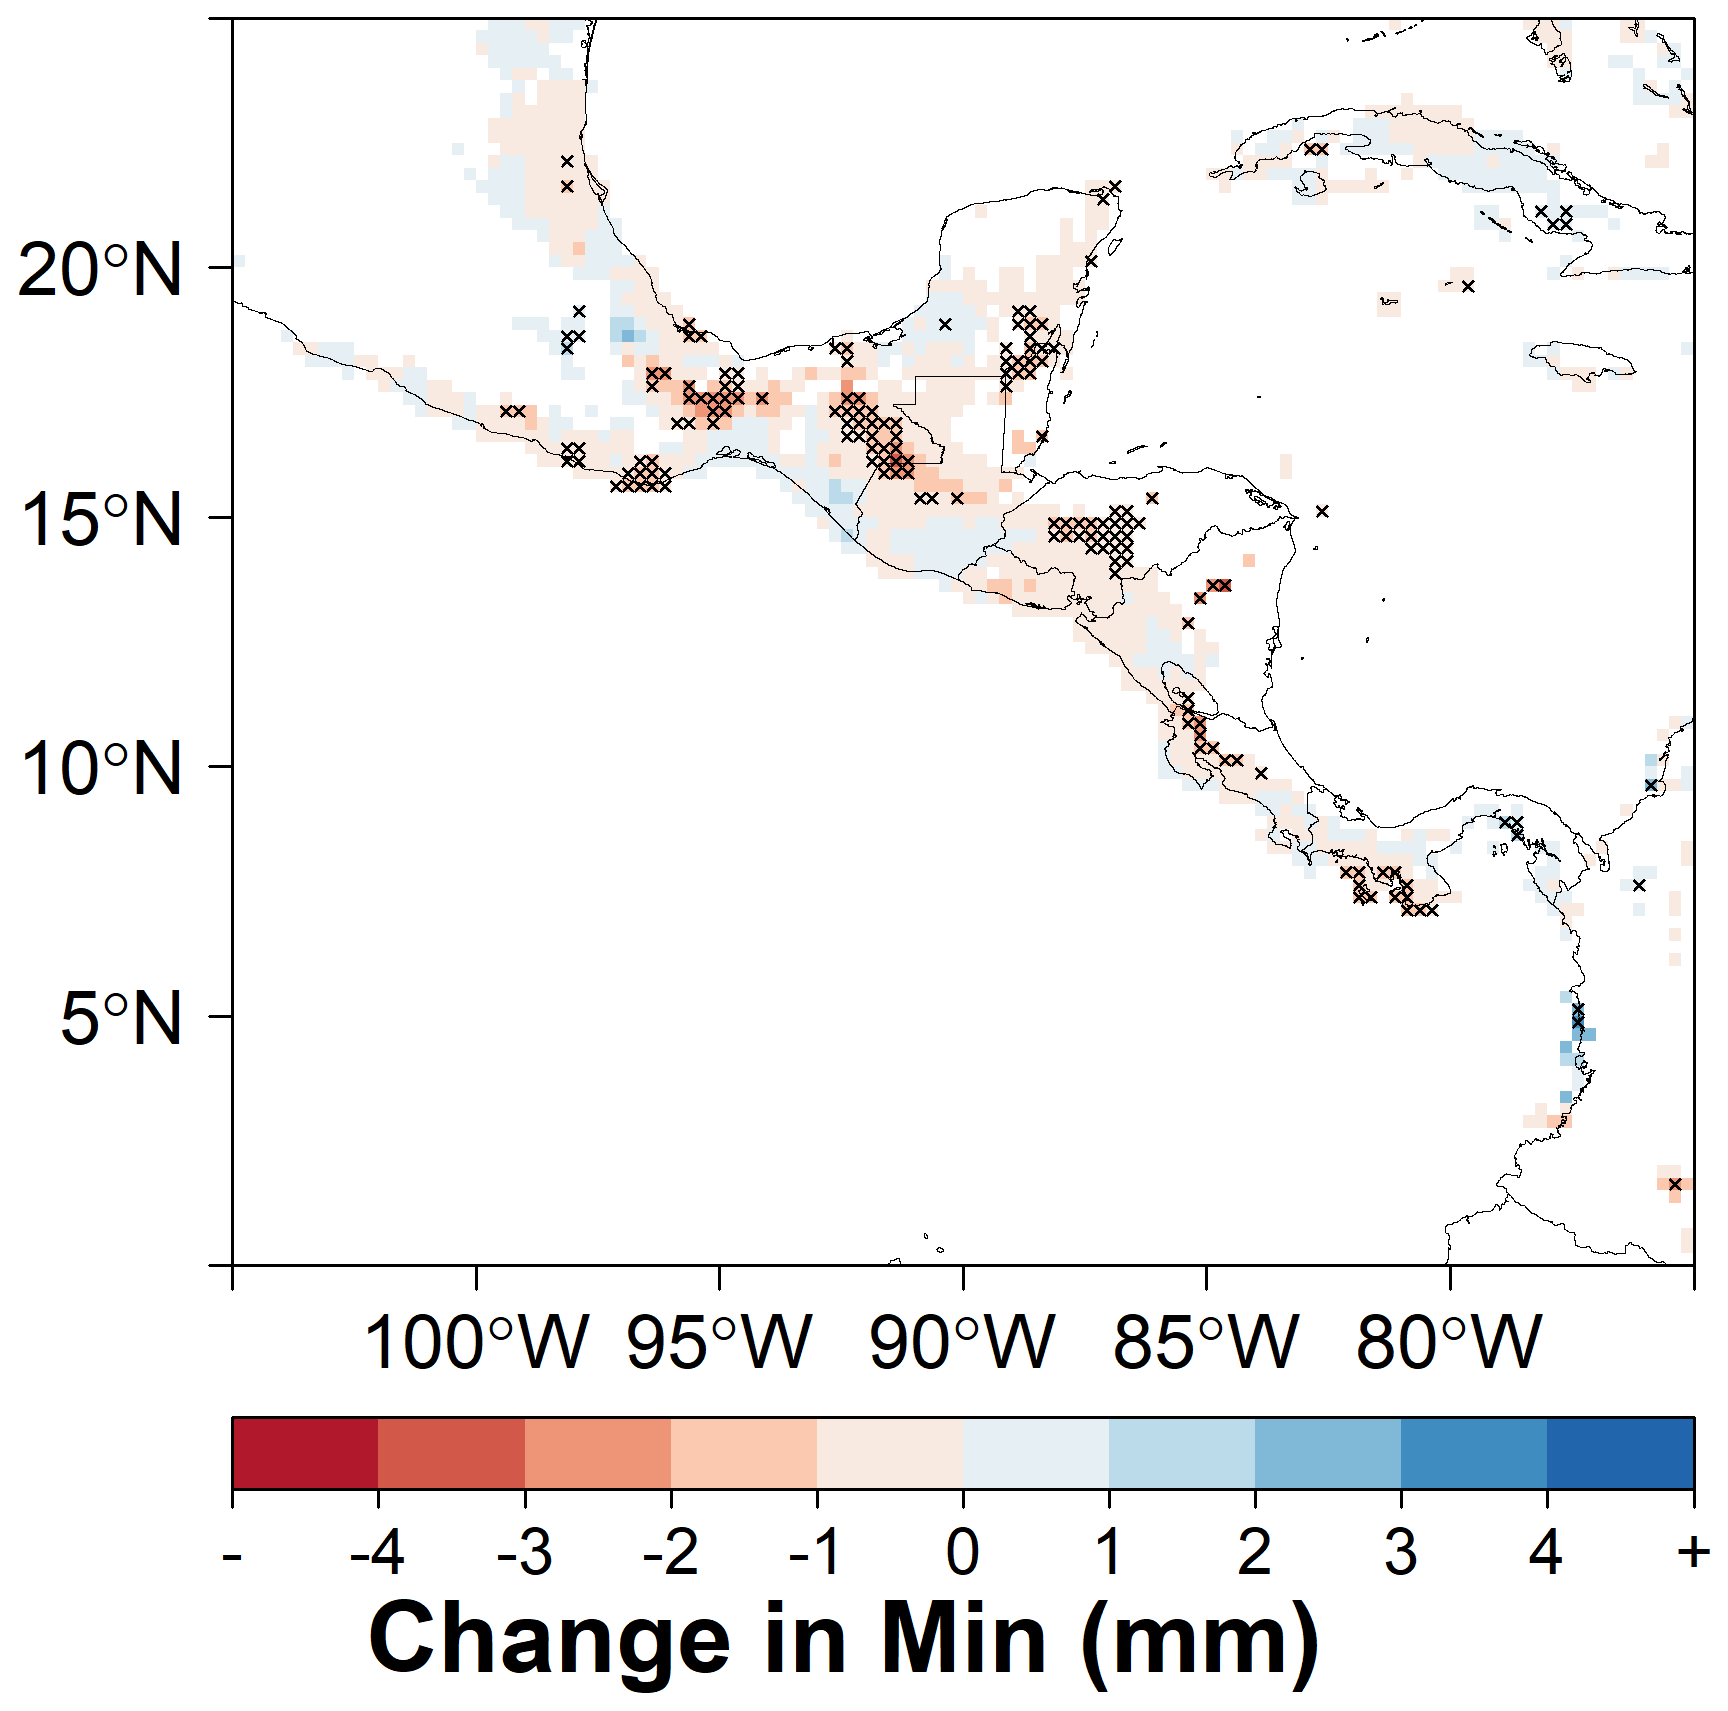
Figure A5The change in MSD minimum between the early (1981–2000) and late (2001–2020) periods. Grid cells marked with an “X” show statistically significant changes.
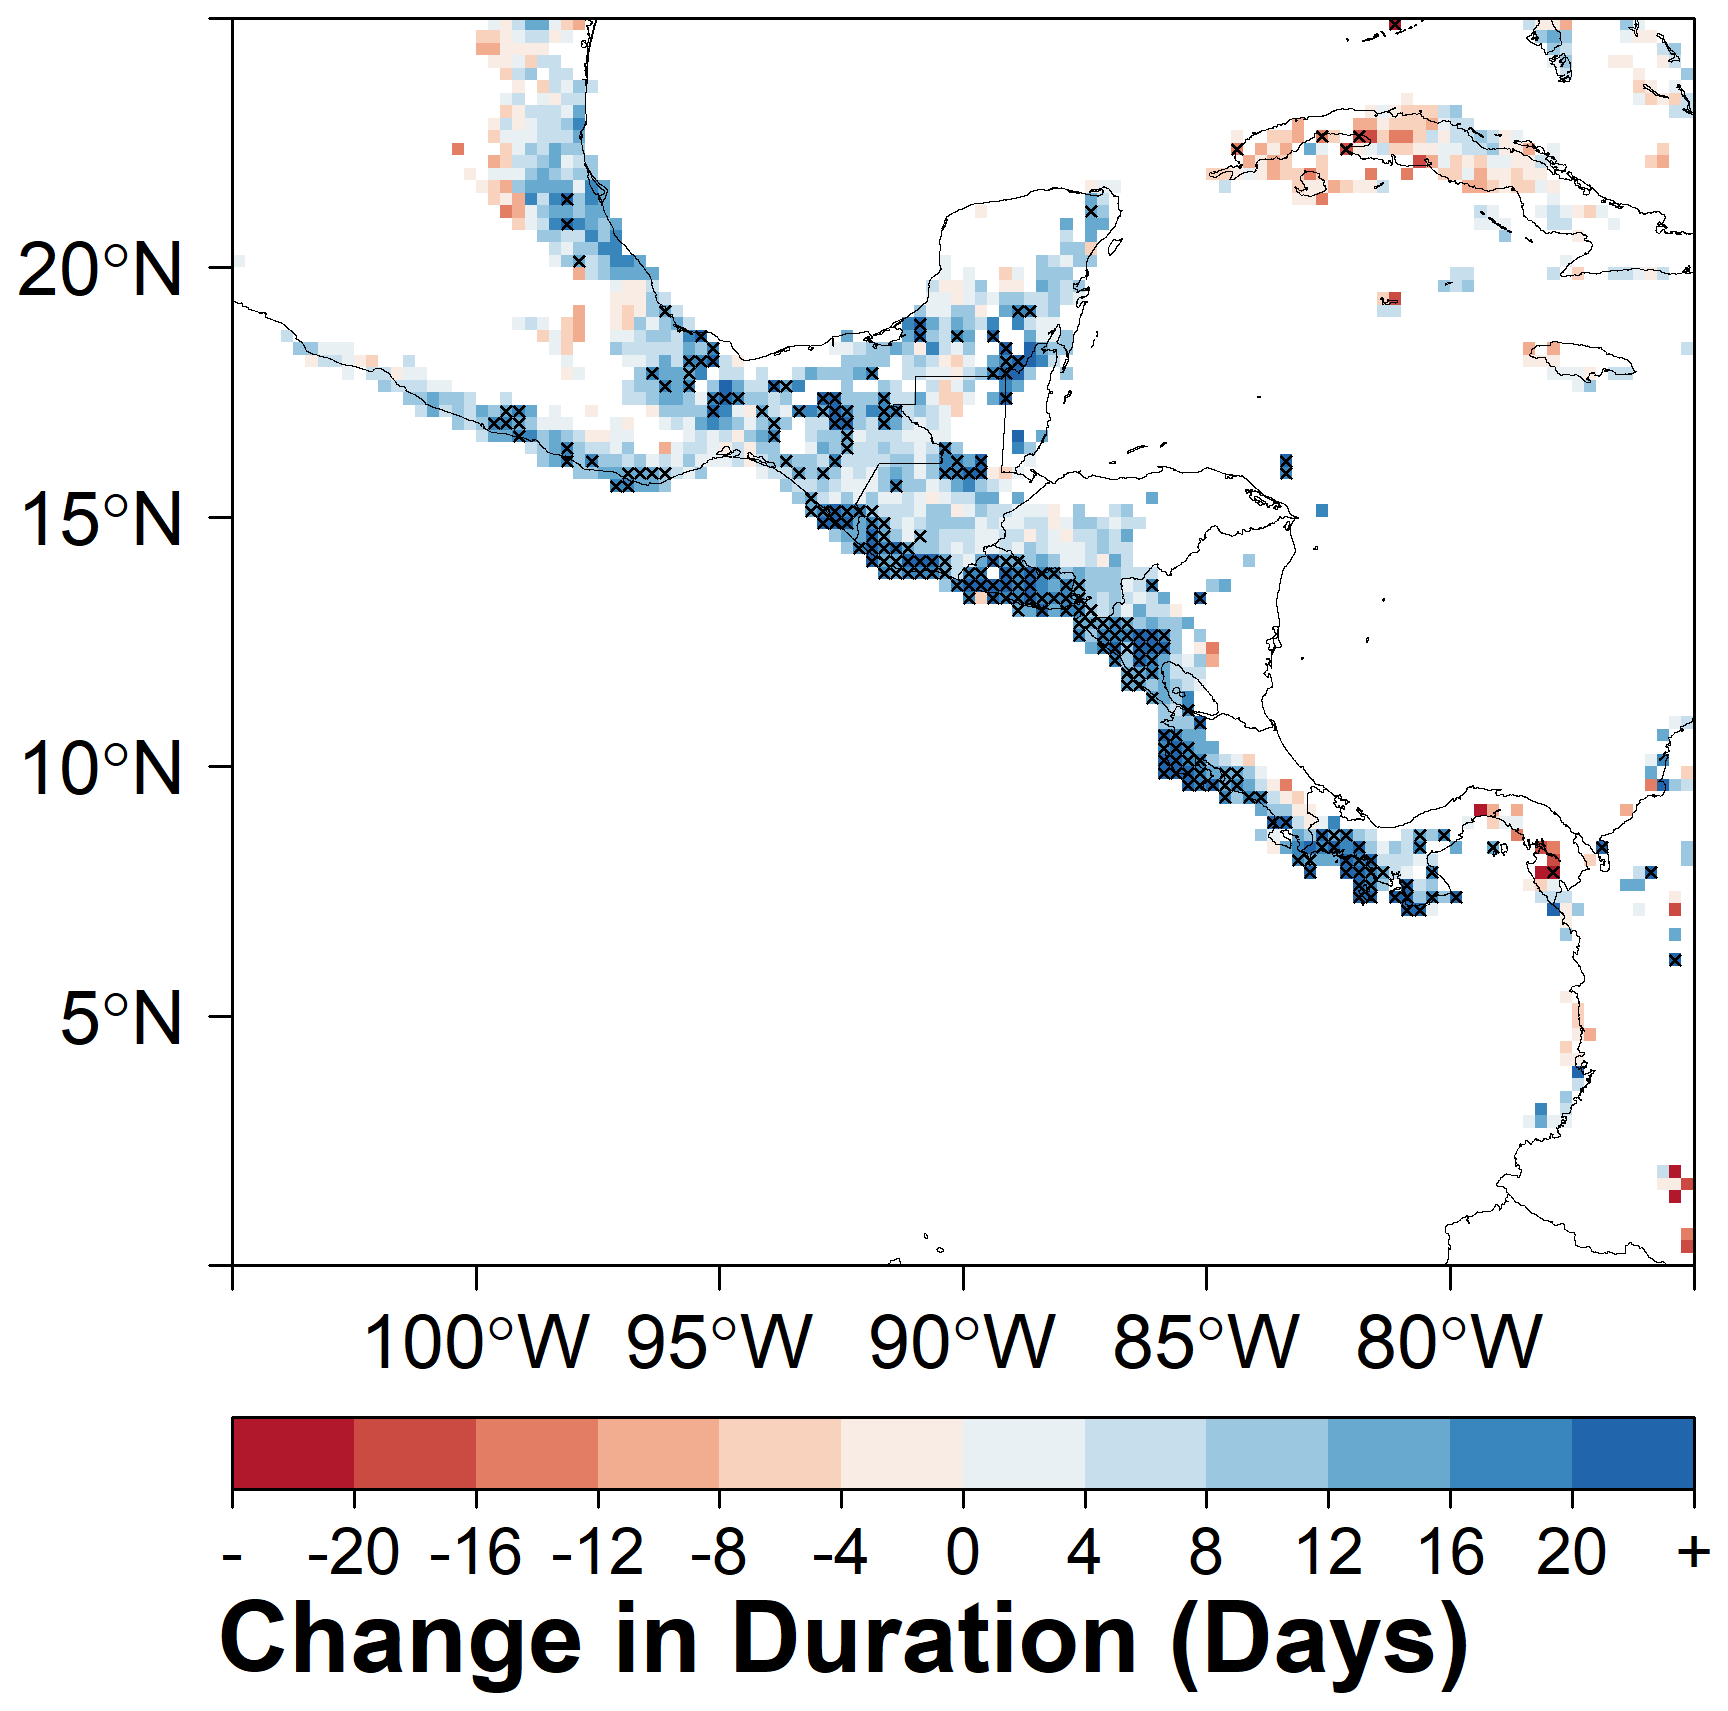
Figure A6The change in MSD duration between the early (1981–2000) and late (2001–2020) periods. Grid cells marked with an “X” show statistically significant changes.
All code was written in the programming language R. A documented package with these functions is under development. All data sets used in this work are publicly available as detailed in the references cited in the Methods and Data section.
EPM and ITS conceptualized the project goals and methodology, provided data curation, performed formal analysis and investigation, obtained funding, and wrote and revised the manuscript. KJ conducted investigations, developed the code, and prepared visualizations. HGH conducted formal analysis and contributed to writing, reviewing, and editing.
The contact author has declared that neither they nor their co-authors have any competing interests.
Publisher's note: Copernicus Publications remains neutral with regard to jurisdictional claims in published maps and institutional affiliations.
Our understanding of the midsummer drought greatly benefitted from discussions with director Raúl Díaz and coworkers at CII-ASDENIC and smallholder farmers in northern Nicaragua. Our work has also benefitted from details on their work shared by Anderson et al. (2019). We thank Sven Decker for his work on Fig. 2.
This research has been supported by US National Science Foundation grant BCS-1539795, DFG (German Research Foundation) grant STA 632/6-1 and grant 21286-AS-PS from the Environmental Justice and the Common Good Initiative at Santa Clara University.
This paper was edited by Marie-Claire ten Veldhuis and reviewed by two anonymous referees.
Alfaro, E.: Some Characteristics of the Precipitation Annual Cycle in Central America and their Relationships with its Surrounding Tropical Oceans, Tóp Meteorol. Ocean., 9, 88–103, 2002.
Alfaro, E. J.: Caracterización del “veranillo” en dos cuencas de la vertiente del Pacífico de Costa Rica, América Central, Rev. Biol. Trop. J. Trop. Biol. Conserv., 62, 1–15, https://doi.org/10.15517/rbt.v62i4.20010, 2014.
Alfaro, E. J., Chourio, X., Muñoz, Á. G., and Mason, S. J.: Improved seasonal prediction skill of rainfall for the Primera season in Central America, Int. J. Climatol., 38, e255–e268, https://doi.org/10.1002/joc.5366, 2018.
Almazroui, M., Islam, M. N., Saeed, F., Saeed, S., Ismail, M., Ehsan, M. A., Diallo, I., O'Brien, E., Ashfaq, M., Martínez-Castro, D., Cavazos, T., Cerezo-Mota, R., Tippett, M. K., Gutowski, W. J., Alfaro, E. J., Hidalgo, H. G., Vichot-Llano, A., Campbell, J. D., Kamil, S., Rashid, I. U., Sylla, M. B., Stephenson, T., Taylor, M., and Barlow, M.: Projected Changes in Temperature and Precipitation Over the United States, Central America, and the Caribbean in CMIP6 GCMs, Earth Syst. Environ., 5, 1–24, https://doi.org/10.1007/s41748-021-00199-5, 2021.
Anderson, T., Anchukaitis, K., Pons, D., and Taylor, M.: Multiscale trends and precipitation extremes in the Central American Midsummer Drought, Environ. Res. Lett., 14, 124016, https://doi.org/10.1088/1748-9326/ab5023, 2019.
Bombardi, R. J., Pegion, K. V., Kinter, J. L., Cash, B. A., and Adams, J. M.: Sub-seasonal Predictability of the Onset and Demise of the Rainy Season over Monsoonal Regions, Front. Earth Sci., 5, 14, https://doi.org/10.3389/feart.2017.00014, 2017.
Corrales-Suastegui, A., Fuentes-Franco, R., and Pavia, E. G.: The mid-summer drought over Mexico and Central America in the 21st century, Int. J. Climatol., 40, 1703–1715, https://doi.org/10.1002/joc.6296, 2020.
Curtis, S.: Diurnal cycle of rainfall and surface winds and the mid-summer drought of Mexico/Central America, Clim. Res., 27, 1–8, 2004.
Curtis, S. and Gamble, D. W.: Regional variations of the Caribbean mid-summer drought, Theor. Appl. Climatol., 94, 25–34, https://doi.org/10.1007/s00704-007-0342-0, 2008.
Funk, C., Peterson, P., Landsfeld, M., Pedreros, D., Verdin, J., Shukla, S., Husak, G., Rowland, J., Harrison, L., Hoell, A., and Michaelsen, J.: The climate hazards infrared precipitation with stations – a new environmental record for monitoring extremes, Sci. Data, 2, 150066, https://doi.org/10.1038/sdata.2015.66, 2015.
Funk, C., Peterson, P., Peterson, S., Shukla, S., Davenport, F., Michaelsen, J., Knapp, K. R., Landsfeld, M., Husak, G., and Harrison, L.: A High-Resolution 1983–2016 T max Climate Data Record Based on Infrared Temperatures and Stations by the Climate Hazard Center, J. Climate, 32, 5639–5658, 2019.
García-Oliva, L. C. and Pazos, E.: The mid-summer drought spatial variability over Mesoamerica, Atmósfera, 34, 227–232, https://doi.org/10.20937/ATM.52790, 2021.
Helsel, D. R., Hirsch, R. M., Ryberg, K. R., Archfield, S. A., and Gilroy, E. J.: Statistical methods in water resources, US Geological Survey, Reston, VA, 458 pp., https://doi.org/10.3133/tm4A3, 2020.
Hidalgo, H. G., Amador, J. A., Alfaro, E. J., and Quesada, B.: Hydrological climate change projections for Central America, J. Hydrol., 495, 94–112, https://doi.org/10.1016/j.jhydrol.2013.05.004, 2013.
Hidalgo, H. G., Alfaro, E. J., Amador, J. A., and Bastidas, Á.: Precursors of quasi-decadal dry-spells in the Central America Dry Corridor, Clim. Dynam., 53, 1307–1322, https://doi.org/10.1007/s00382-019-04638-y, 2019.
Karmalkar, A., Bradley, R., and Diaz, H.: Climate change in Central America and Mexico: regional climate model validation and climate change projections, Clim. Dynam., 37, 605–629, https://doi.org/10.1007/s00382-011-1099-9, 2011.
Karnauskas, K. B., Seager, R., Giannini, A., and Busalacchi, A. J.: A simple mechanism for the climatological midsummer drought along the Pacific coast of Central America, Atmósfera, 26, 261–281, 2013.
Magaña, V., Amador, J. A., and Medina, S.: The Midsummer Drought over Mexico and Central America, J. Climate, 12, 1577–1588, https://doi.org/10.1175/1520-0442(1999)012<1577:TMDOMA>2.0.CO;2, 1999.
MAGFOR: Compendio de mapas: Uso Potencial de la Tierra, Nicaragua Ministerio Agropecuario y Forestal, Managua, Nicaragua, 148 pp., 2010.
Maldonado, T., Rutgersson, A., Alfaro, E., Amador, J., and Claremar, B.: Interannual variability of the midsummer drought in Central America and the connection with sea surface temperatures, Adv. Geosci., 42, 35–50, https://doi.org/10.5194/adgeo-42-35-2016, 2016.
Maloney, E. D., Camargo, S. J., Chang, E., Colle, B., Fu, R., Geil, K. L., Hu, Q., Jiang, X., Johnson, N., Karnauskas, K. B., Kinter, J., Kirtman, B., Kumar, S., Langenbrunner, B., Lombardo, K., Long, L. N., Mariotti, A., Meyerson, J. E., Mo, K. C., Neelin, J. D., Pan, Z., Seager, R., Serra, Y., Seth, A., Sheffield, J., Stroeve, J., Thibeault, J., Xie, S.-P., Wang, C., Wyman, B., and Zhao, M.: North American Climate in CMIP5 Experiments: Part III: Assessment of Twenty-First-Century Projections, J. Climate, 27, 2230–2270, https://doi.org/10.1175/JCLI-D-13-00273.1, 2014.
Maurer, E., Roby, N., Stewart-Frey, I., and Bacon, C.: Projected twenty-first-century changes in the Central American mid-summer drought using statistically downscaled climate projections, Reg. Environ. Change, 17, 2421–2432, https://doi.org/10.1007/s10113-017-1177-6, 2017.
Mehta, C. R. and Patel, N. R.: A Network Algorithm for Performing Fisher's Exact Test in r×c Contingency Tables, J. Am. Stat. Assoc., 78, 427–434, https://doi.org/10.2307/2288652, 1983.
Perdigón-Morales, J., Romero-Centeno, R., Pérez, P. O., and Barrett, B. S.: The midsummer drought in Mexico: perspectives on duration and intensity from the CHIRPS precipitation database, Int. J. Climatol., 38, 2174–2186, 2018.
Rauscher, S. A., Giorgi, F., Diffenbaugh, N. S., and Seth, A.: Extension and intensification of the Meso-American mid-summer drought in the twenty-first century, Clim. Dynam., 31, 551–571, https://doi.org/10.1007/s00382-007-0359-1, 2008.
Rauscher, S. A., Kucharski, F., and Enfield, D. B.: The Role of Regional SST Warming Variations in the Drying of Meso-America in Future Climate Projections, J. Climate, 24, 2003–2016, https://doi.org/10.1175/2010JCLI3536.1, 2011.
Romero, D., Alfaro, E., Orellana, R., and Hernandez Cerda, M.-E.: Standardized Drought Indices for Pre-Summer Drought Assessment in Tropical Areas, Atmosphere, 11, 1209, https://doi.org/10.3390/atmos11111209, 2020.
Stewart, I. T., Maurer, E. P., Stahl, K., and Joseph, K.: Recent evidence for warmer and drier growing seasons in climate sensitive regions of Central America from multiple global datasets, Int. J. Climatol., https://doi.org/10.1002/joc.7310, in press, 2021.
Vichot-Llano, A., Martinez-Castro, D., Bezanilla-Morlot, A., Centella-Artola, A., and Giorgi, F.: Projected changes in precipitation and temperature regimes and extremes over the Caribbean and Central America using a multiparameter ensemble of RegCM4, Int. J. Climatol., 41, 1328–1350, https://doi.org/10.1002/joc.6811, 2021.
WMO: WMO Guidelines on the Calculation of Climate Normals Report No. 1203, World Meteorological Organization, Geneva, Switzerland, 20 pp., 2017.
Zhao, Z. and Zhang, X.: Evaluation of methods to detect and quantify the bimodal precipitation over Central America and Mexico, Int. J. Climatol., 41, E897–E911, https://doi.org/10.1002/joc.6736, 2021.