the Creative Commons Attribution 4.0 License.
the Creative Commons Attribution 4.0 License.
 | 24 Feb 2021
Diagnosis toward predicting mean annual runoff in ungauged basins
Yuan Gao
Lili Yao
Ni-Bin Chang
Dingbao Wang
Prediction of mean annual runoff is of great interest but still poses a challenge in ungauged basins. The present work diagnoses the prediction in mean annual runoff affected by the uncertainty in estimated distribution of soil water storage capacity. Based on a distribution function, a water balance model for estimating mean annual runoff is developed, in which the effects of climate variability and the distribution of soil water storage capacity are explicitly represented. As such, the two parameters in the model have explicit physical meanings, and relationships between the parameters and controlling factors on mean annual runoff are established. The estimated parameters from the existing data of watershed characteristics are applied to 35 watersheds. The results showed that the model could capture 88.2 % of the actual mean annual runoff on average across the study watersheds, indicating that the proposed new water balance model is promising for estimating mean annual runoff in ungauged watersheds. The underestimation of mean annual runoff is mainly caused by the underestimation of the area percentage of low soil water storage capacity due to neglecting the effect of land surface and bedrock topography. Higher spatial variability of soil water storage capacity estimated through the height above the nearest drainage (HAND) and topographic wetness index (TWI) indicated that topography plays a crucial role in determining the actual soil water storage capacity. The performance of mean annual runoff prediction in ungauged basins can be improved by employing better estimation of soil water storage capacity including the effects of soil, topography, and bedrock. It leads to better diagnosis of the data requirement for predicting mean annual runoff in ungauged basins based on a newly developed process-based model finally.
- Article
(2924 KB) - Full-text XML
- BibTeX
- EndNote


Hydrologists have a long-standing interest in mean annual water balance modeling and prediction. The factors controlling mean annual runoff have been studied in literature. Mean climate has been identified as the first-order control on mean annual runoff and evaporation and it has been quantified by climate aridity index, which is defined as the ratio between the mean annual potential evapotranspiration (Ep) and precipitation (P) (Turc, 1954; Pike, 1964). Other controlling factors include the temporal variability of climate (Farmer et al., 2003; Troch et al., 2002; Fu and Wang, 2019), vegetation (Zhang et al., 2001; Donohue et al., 2007; Gentine et al., 2012; Li et al., 2013), soil (Atkinson et al., 2002; Yokoo et al., 2008; Li et al., 2014), and topography (Woods, 2003; Abatzoglou and Ficklin, 2017). Mean annual runoff or evaporation has been modeled as a function of climate aridity index, and the equation is usually called the Budyko equation (Budyko, 1958). The effects of other factors are represented by, including a parameter to Budyko equation (Fu, 1981; Yang et al., 2008; Wang and Tang, 2014). Among these factors, climate, including its mean and temporal variability, and soil water storage capacity including its mean and spatial variability, are dominant catchment characteristics controlling mean annual runoff, especially for those catchments dominated by saturation excess runoff generation (Milly, 1994).
Intra- and inter-annual climate variability introduces non-steady-state conditions to finer timescale water balances and the non-steady-state effect could propagate to the mean annual runoff. The effects of seasonal variations of precipitation and potential evaporation on long-term runoff have been studied in several studies. Milly (1994) showed that seasonality tends to increase mean annual runoff through a stochastic soil moisture model. The seasonality effects have been demonstrated through a top-down model by Hickel and Zhang (2006) and a classification study by Berghuijs et al. (2014). Mean annual water balance also receives impacts from climate variability at the inter-annual and daily timescales. Li (2014) showed that the inter-annual variability of precipitation and potential evaporation could increase the mean annual runoff up to 10 % based on a stochastic soil moisture model. Shao et al. (2012) found that daily precipitation with a larger variation potentially increases mean annual runoff especially in the catchments where infiltration excess runoff is prevalent. Yao et al. (2020) quantified the relative contribution of daily, monthly, and inter-annual climate variabilities to mean annual runoff and showed that the contribution decreases, on average, from monthly to inter-annual scales and then daily scale.
Soil water storage capacity is the maximum storage capacity from land surface to bedrock, which exerts a powerful control on mean annual runoff (Konapala and Mishra, 2016). A smaller soil water storage capacity creates favorable conditions for runoff generation, because the precipitation in excess of the available storage capacity would be lost as runoff directly, while catchments with a larger soil water storage capacity could hold more precipitation for evaporation (Sankarasubramanian and Vogel, 2002; Porporato et al., 2004; Chen et al., 2013). Soil water storage capacity is closely related to vegetation since the root structure of vegetation could affect soil water storage capacity significantly. Research has been conducted to reveal the role of soil water storage capacity through the linkage of vegetation and model parameter (Yang et al., 2008; Chen and Wang, 2015). Gerrits (2009) developed equations for transpiration and interception by considering the root zone and interception storage capacity as two of the most important catchment characteristics affecting evapotranspiration. In addition to the magnitude of the average soil water storage capacity, the spatial variability of soil water storage capacity within a catchment also influences precipitation partitioning at the event scale and further influences the cumulative runoff at the mean annual scale (Moore, 1985; Jothityangkoon et al., 2001; Gao et al., 2016). It has also been suggested that the spatial variability of soil water storage capacity could suppress the actual evaporation, because the maximum evaporation in areas with soil water storage capacity less than Ep will be smaller than Ep; therefore, the average evaporation over the entire catchment is smaller than Ep even though the average storage is greater than Ep, resulting in more runoff generation compared to the situation when the soil water storage capacity is spatially uniform (Yao et al., 2020).
Therefore, climate variability and soil water storage capacity need to be explicitly incorporated into the model for predicting mean annual runoff. The effect of climate variability could be taken into account by driving the model with daily precipitation and potential evaporation which are usually available. The spatial distribution of soil water storage capacity could be modeled by a distribution function, and it is usually modeled by the generalized Pareto distribution (Moore, 1985; Zhao, 1992). The distribution function includes two parameters, i.e., the shape parameter and the maximum storage capacity over the watershed. In ungauged basins, soil water storage capacity and its spatial variability need to be estimated directly from available data. Gao et al. (2014) adopted the mass curve technique, which has been used for designing the storage capacity of reservoir, to estimate the average water storage capacity of the root zone using precipitation and potential evaporation data. The shape parameter of the distribution function has been estimated from soil data (Huang et al., 2003). However, the estimated parameters from these methods bring much uncertainty in runoff estimation, and the two parameters of the generalized Pareto distribution are usually estimated by model calibration using observed streamflow data (Wood et al., 1992; Alipour and Kibler, 2018, 2019).
The objective of this paper is to develop a nonparametric mean annual water balance model for predicting mean annual runoff in ungauged basins, which has not yet been fully understood (Blöschl et al., 2013). The mean annual water balance model is forced by daily precipitation and potential evaporation; therefore, the climate variability at different timescales is represented explicitly in the climate input. The runoff generation is quantified by a distribution function for describing the spatial distribution of soil water storage capacity (Wang, 2018). The mean and the shape parameter of the distribution function need to be estimated from the available data in ungauged basins. Therefore, the model serves as a diagnosis tool for evaluating the data requirement for estimating soil water storage capacity. The mean soil water storage capacity is estimated from curve number and climate, because soil water storage capacity consists of the antecedent soil water storage and the potential maximum soil moisture retention which can be calculated through the Soil Conservation Service (SCS) curve number method. The estimation of the shape parameter is diagnosed in terms of the data requirement including soil, land surface topography, and bedrock topography. Section 2 introduces the new mean annual water balance model and the study watersheds. Results and discussion are presented in Sect. 3, followed by Sect. 4 for conclusions.
2.1 Mean annual runoff model
Climate variability is defined as the temporal variations of precipitation (P) and potential evapotranspiration (Ep), including their intra-monthly, intra-annual, and inter-annual variations. For example, the deviations of daily P or Ep from its monthly mean values are defined as the intra-monthly variations (Yao et al., 2020). As discussed in the introduction section, the mean annual runoff model takes daily precipitation and potential evaporation as inputs; therefore, climate variability is explicitly included in the model. The developed model calculates daily soil wetting (infiltration) and evaporation by tracking the soil water storage. Mean annual runoff is estimated by aggregating the daily values. The daily soil wetting is calculated using the concept of saturation excess runoff generation by modeling the spatial variability of soil moisture and soil water storage capacity. To facilitate the parameter estimation of storage capacity distribution in ungauged basins, the following distribution function is used for modeling the spatial distribution of storage capacity (Wang, 2018):
where F(C) is the cumulative distribution function (CDF), representing the fraction of the watershed area for which the soil water storage capacity is equal to or less than C; a is the shape parameter of the distribution and varies between 0 and 2; and Sb is the average soil water storage capacity over the watershed (i.e., the mean of the distribution). As shown in Wang (2018), this distribution function leads to the SCS curve number (SCS-CN) method when the initial storage is set to zero. Therefore, there is a linkage between Sb and the “potential maximum retention after runoff begins” in the SCS-CN method, denoted as SCN.
Daily soil wetting and runoff generation is computed as a function of daily precipitation (P), initial storage (S0), a, and Sb. As shown in Wang (2018), the average soil wetting (W) is computed by
where . Setting S0=0 and dividing P on both sides of Eq. (2), a Budyko-type equation, representing as a function of , is obtained (Wang and Tang, 2014), which has been used to model long-term soil wetting (Tang and Wang, 2017). Therefore, Eq. (2) can be interpreted as a non-steady-state Budyko equation which accounts for the effect of water storage. Daily evaporation (Ed) is computed as (Yao et al., 2020)
The first component on the right-hand side of Eq. (3), , is the percentage of storage, and the second component is the evaporation for the condition when the entire watershed is saturated, i.e., the spatial distribution of soil water storage is the same as that of storage capacity (Yao et al., 2020). Dividing by W+S0 on both sides, Eq. (3) represents as a function of , and the function is the same as the Budyko-type equation derived by Wang and Tang (2014). Mean annual evaporation ( is computed by aggregating the daily evaporation, and mean annual runoff () is computed as the difference of mean annual precipitation and evaporation:
where Y is the number of years, and Dy is the number of days in year y; y and d represent year y and day d, respectively. Note that the mean annual runoff includes surface runoff and baseflow, and both are impacted by climate variability (e.g., intra-annual variability) (Berghuijs et al., 2014; Fan et al., 2007).
This mean annual water balance model applies two non-steady-state Budyko-type equations at the daily scale: one for daily soil wetting and the other for daily evaporation. Runoff routing is not necessary since the model is prepared for long-term water balance analysis. As a result, the mean annual water balance model includes two parameters, i.e., the shape parameter (a) and the average soil water storage capacity (Sb). For studies where a one-parameter Budyko equation is applied to long-term scale directly, the effects of climate variability (seasonality, inter-annual variability, and daily storminess) on mean annual water balance are attributed to the single parameter of the Budyko equation (e.g., Fu, 1981; Zhang et al., 2001). This creates the challenge to estimate the single parameter in ungauged basins, whereas the mean annual water balance model used in this paper takes daily precipitation and potential evaporation as inputs, and the effects of climate variability are taken into account explicitly. To achieve the goal of predicting mean annual runoff in ungauged basins, a and Sb need to be estimated in ungauged basins.
2.2 Parameter estimation
2.2.1 Average soil water storage capacity
Under a given soil moisture condition, soil water storage capacity is the sum of actual water storage and the remaining (or effective) storage capacity. The effective storage capacity corresponding to the normal antecedent moisture condition defined in the SCS-CN method, SCN (mm), is computed as a function of CN (SCS, 1972; Bartlett et al., 2016):
where CN is the composite curve number based on land use and land cover (LULC) and hydrologic soil group (HSG) for each watershed. The LULC data can be obtained from the National Land Cover Database (Homer et al., 2015), and the HSG data can be extracted from the Gridded Soil Survey Geographic (gSSURGO) database with a spatial resolution of 10 m (USDA, 2014). In HSG, soils are assigned to one of the four groups (A, B, C, and D) and three dual classes (A/D, B/D, and C/D) according to the rate of infiltration when the soils are not protected by vegetation and receive precipitation from long-duration storms. For the cells characterized by dual classes, the CN value is calculated as the average of the two CN values corresponding to the two soil groups.
The average soil water storage capacity (Sb) is the sum of the actual storage under the normal condition () and its corresponding effective storage capacity:
The physical meaning of Sb is the mean value of the soil water storage capacity over a watershed which is defined as the maximum storage from land surface to bedrock in this study rather than the storage capacity from shallow soils. Since the “normal antecedent moisture” can be interpreted as the steady-state soil moisture condition, is the long-term average storage over the watershed. The values of for 59 MOPEX (MOdel Parameter Estimation Experiment) watersheds are estimated based on the long-term water balance model in Yao et al. (2020), and these watersheds do not include any watersheds studied in this paper. The long-term water balance model used in their study has a similar model structure but the two parameters, i.e., the mean value of the soil water storage capacity and its shape parameter in the distribution function, were obtained by model calibration. The ratio between and Sb is defined as the long-term storage ratio . It is found that the values of for all the watersheds were larger than 0.5. As shown in Fig. 1, has a linear relationship with the climate aridity index:
where Φ is the climate aridity index. Substituting Eqs. (6) and (7) into Eq. (8), one can estimate the average soil water storage capacity as a function of curve number and climate aridity index:
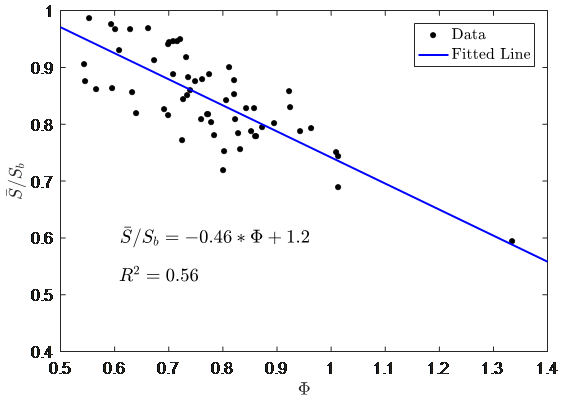
Figure 1The degree of saturation under long-term average climate versus climate aridity index (Φ).
2.2.2 Shape parameter
The spatial variability of storage capacity is determined by the spatial distribution of point-scale pore space across the watershed. The volume of soil pores at the point scale can be determined by soil thickness and porosity in different soil layers. The porosity (θs) for each layer is calculated from the soil bulk density:
where j denotes the jth soil layer; ρb(j) is the bulk density of the jth soil layer; and ρ is the particle density (2.65 g/cm3). After obtaining the porosity, the point-scale storage capacity can be calculated as the following equation (Huang et al., 2003):
where C is the point-scale soil storage capacity; n is the number of soil layers; and zj and θs(j) are the thickness and porosity of the jth soil layer, respectively. In the gSSURGO database, the soil thickness and bulk density for each layer are available for shallow soil from the land surface to ∼2 m soil depth.
The total soil thickness at each point is the elevation difference from land surface to fresh bedrock. However, the bedrock topography is difficult to obtain especially at the watershed scale. Alternatively, it is assumed that the spatial distribution of the actual soil water storage capacity is the same as the spatial distribution of water storage capacity computed from the gSSURGO database. In order to compare the shape parameter evaluated from the soil data with its counterparts evaluated from other methods, the point-scale storage capacity is normalized with the average storage capacity over the watershed, and Eq. (1) is rewritten as
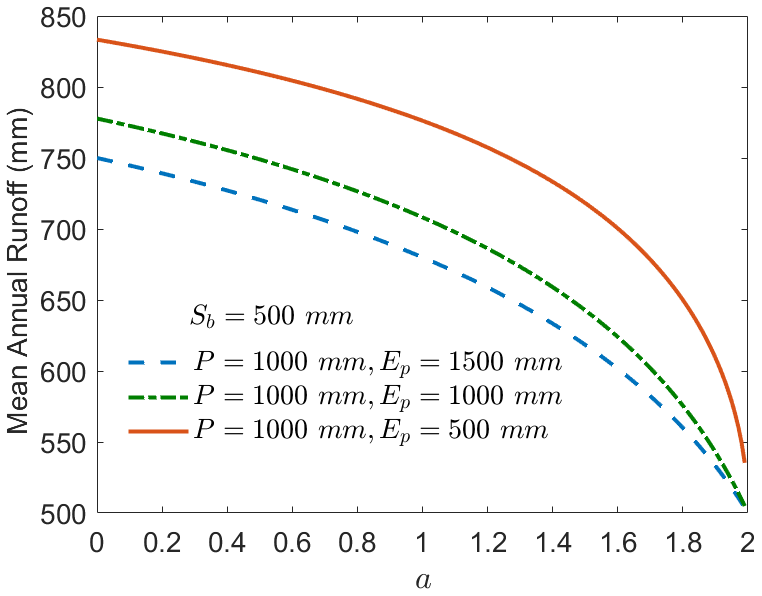
where x is the normalized storage capacity at the point scale; a is the shape parameter describing the spatial variability of soil water storage capacity. The shape parameter a is then estimated by fitting the point-scale storage capacity data obtained from Eq. (11). A nonlinear programming solver using the derivative-free method (i.e., MATLAB function “fminsearch”) was used to calculate the optimal shape parameter by minimizing the root mean square error (RMSE). To demonstrate the sensitivity of mean annual runoff to the value of shape parameter, Fig. 2 presents mean annual runoff versus shape parameter based on the mean annual water balance (Yao et al., 2020). It can be found that mean annual runoff decreases significantly as the shape parameter increases, especially when shape parameter approaches its upper limit (i.e., 2). The negative relationship between the mean annual runoff and the shape parameter can be attributed to the fact that the larger shape parameter indicates that less watershed area has small values of point-scale storage capacity (Wang, 2018), and more precipitation could be retained underground for evaporation.
2.3 Study watersheds
The estimations of mean annual runoff in 35 watersheds are diagnosed in this paper. The number 35 was determined due to the consideration of the data availability including soil (hydrologic soil group), land cover and land use, DEM, and the minimum snow effect and human activities (Wang and Hejazi, 2011), as well as to keep the efforts of gSSURGO data processing to a reasonable level while still having a sufficient number of samples for the watersheds. The drainage area of the watersheds varies from 2044 to 9889 km2. Table 1 shows the USGS (United States Geological Survey) gauge number and climate aridity index of these watersheds. The saturation excess is the dominated runoff generation in these watersheds. Daily precipitation and streamflow data during 1948–2003 are extracted from the MOPEX dataset (Duan et al., 2006), and the daily potential evaporation during this period is calculated based on the Hargreaves method (Hargreaves and Samani, 1985) by using the daily maximum, minimum, and mean temperature. The average soil water storage capacity and the shape parameter for these watersheds are estimated from the available data of climate, LULC, soil, and topography, and the predictions of mean annual runoff are diagnosed.
Table 1The USGS gauge stations, climate aridity index, the estimated potential maximum retention of curve number method (SCN), and the average soil water storage capacity (Sb) for the study watersheds.

3.1 Estimated average soil water storage capacity
The potential maximum retention (SCN) is calculated based on the average CN in each watershed (Table 1). The average CN is computed based on LULC and hydrologic soil group. For examples, Fig. 3a shows the LULC map for the Fox River watershed in Wisconsin, and Fig. 3d shows the LULC map for the Spoon River watershed in Illinois. The dominant land uses are agriculture (49 %) and forest (33 %) in the Fox River watershed and agriculture (77 %) and forest (15 %) in the Spoon River watershed. The hydrologic soil groups are shown in Fig. 3b (Fox River watershed) and Fig. 3e (Spoon River watershed). Given the same LULC, the hydrologic soil group D is more favorable for runoff generation compared with group A. The dominant hydrologic soil groups are group A (31 %) and group B (19 %) in the Fox River watershed and group C/D (49 %) and group B/D (20 %) in the Spoon River watershed. The calculated CN for each grid cell is shown in Fig. 3c (Fox River watershed) and Fig. 3f (Spoon River watershed). The average CN is 61.0 for the Fox River watershed and 78.1 for the Spoon River watershed. Since the Spoon River watershed has a higher percentage of agricultural land and lower soil permeability, its average CN is higher than that for the Fox River watershed. Correspondingly, the calculated SCN in the Fox River watershed (162 mm) is higher than that in Spoon River watershed (71 mm). The values of SCN over the study watersheds vary from 56 mm (Auglaize River watershed) to 182 mm (Chattahoochee River watershed) as shown in Table 1.
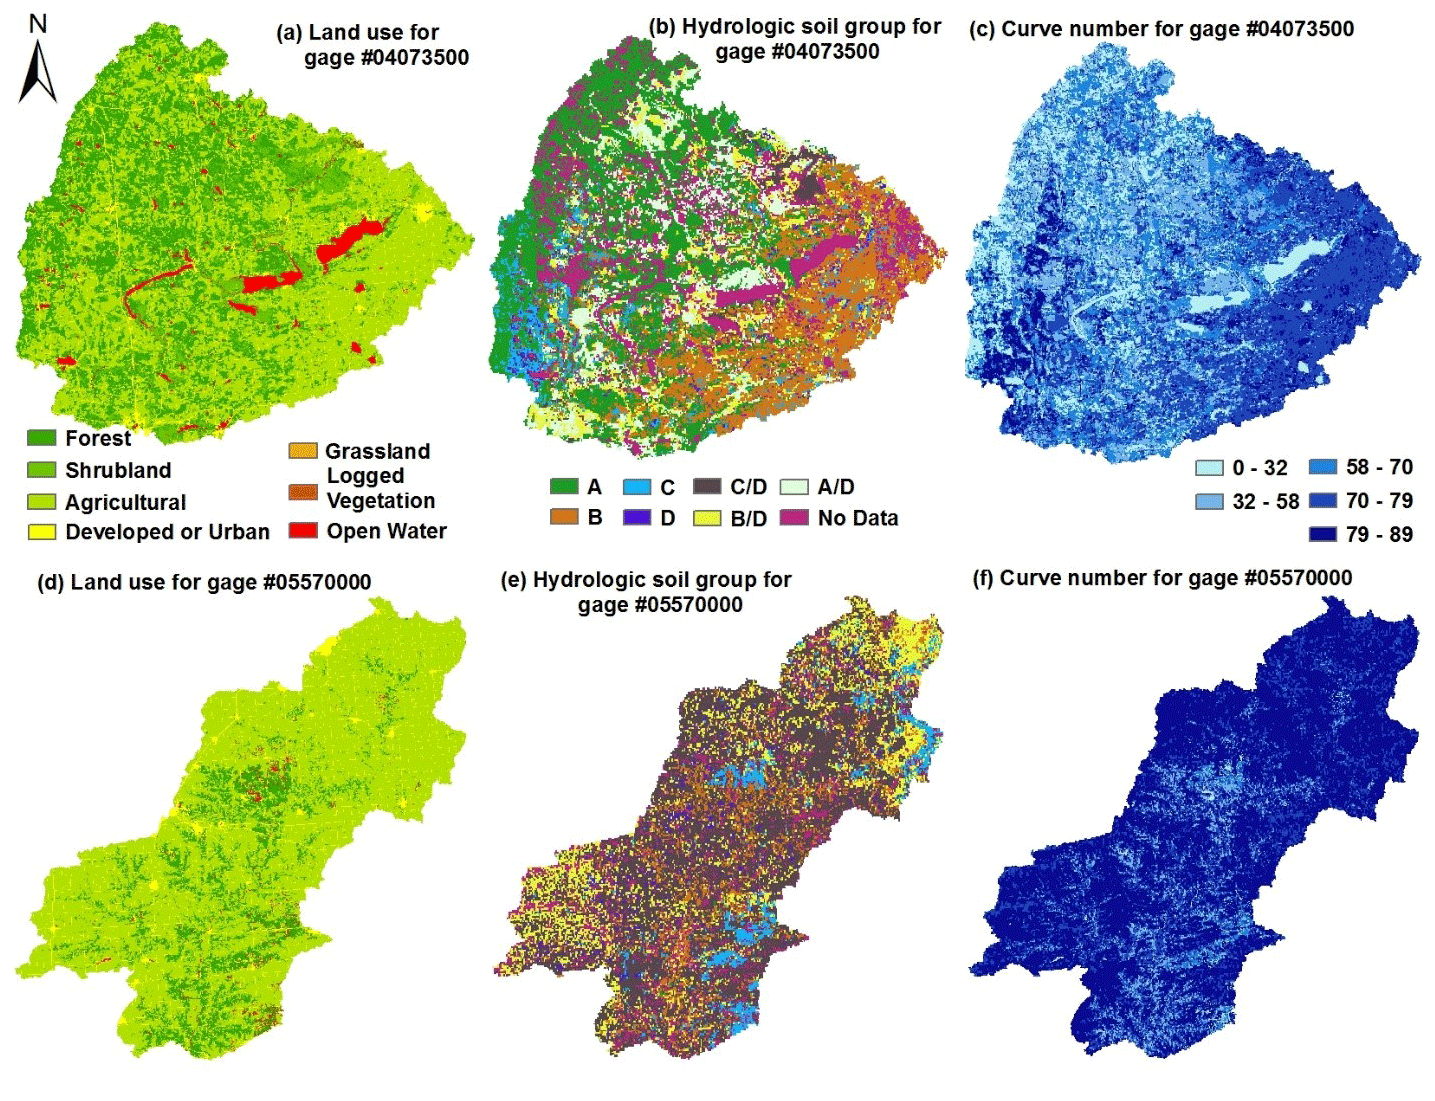
Figure 3The spatial distribution of land use and land cover for the Fox River watershed in Wisconsin (a) and the Spoon River watershed in Illinois (d), the hydrologic soil groups for Fox River watershed (b) and Spoon River watershed (e), and the curve numbers for Fox River watershed (c) and Spoon River watershed (f).
The average soil water storage capacity is estimated based on the computed SCN and climate aridity index shown in Eq. (8). For examples, the climate aridity index in the Fox River watershed is 1.12 which is the same as that in the Spoon River watershed. The estimated Sb is 721 mm in the Fox River watershed and 314 mm for the Spoon River watershed. As shown in Table 1, the estimated Sb varies from 177 mm (Chikaskia River watershed) to 1559 mm (Chattahoochee River watershed) over the study watersheds. Figure 4a shows the spatial distribution of the estimated Sb. Watersheds with higher Sb are mostly distributed in the eastern US, where the aridity index is relatively lower than that in the other watersheds.
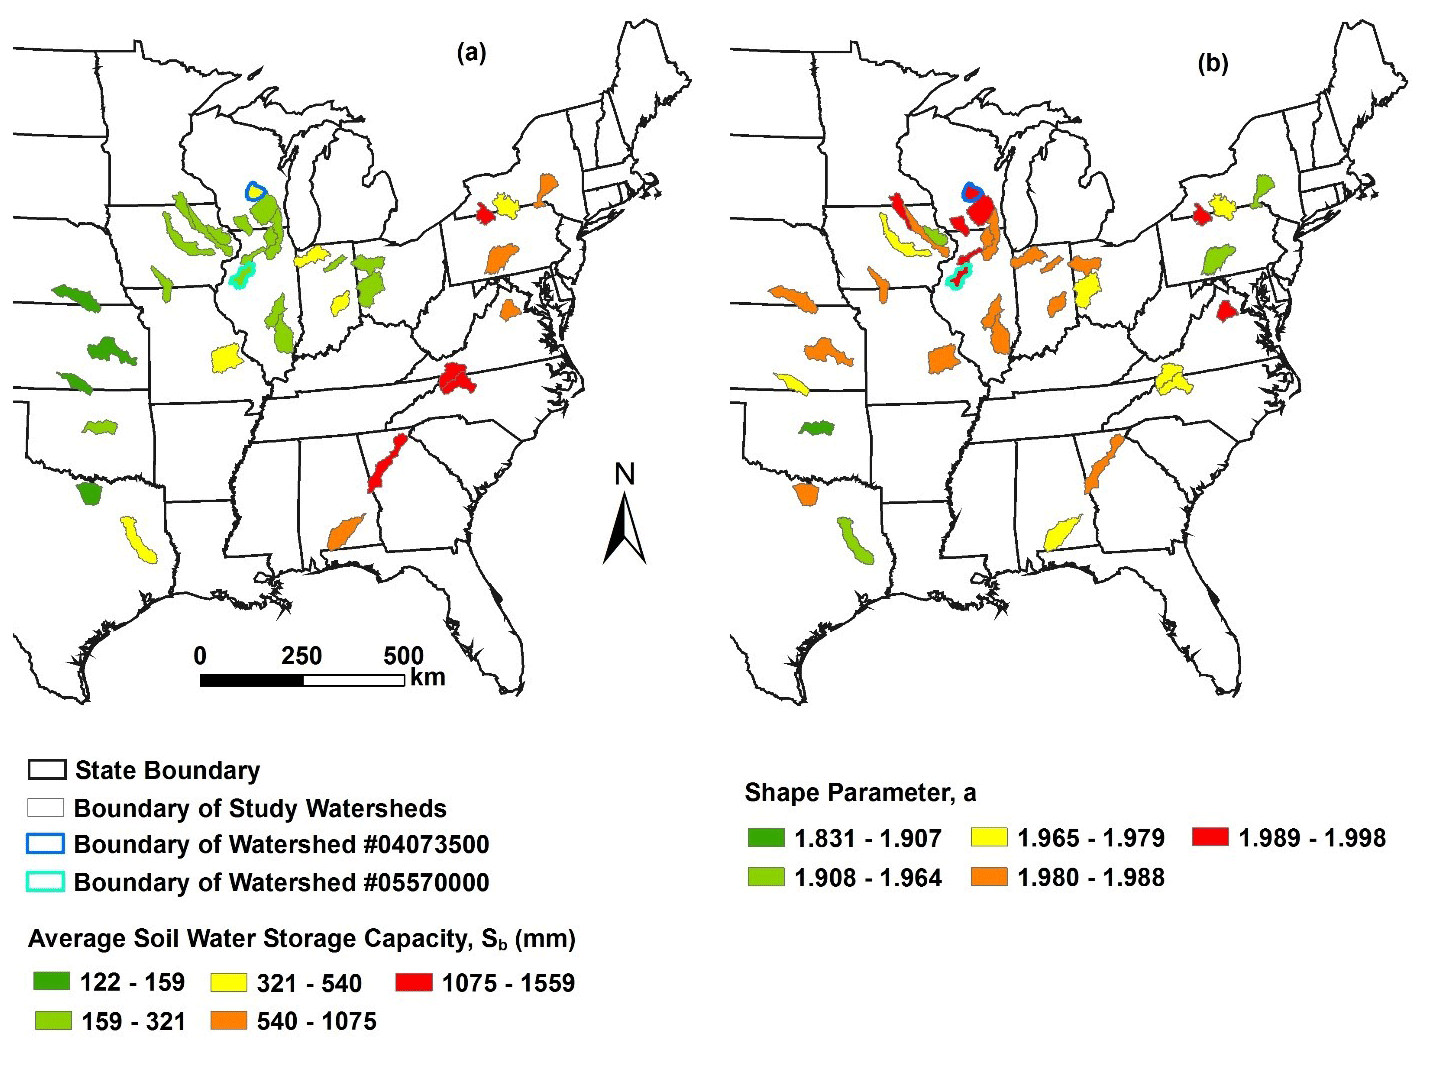
Figure 4The estimated average soil water storage capacity (Sb) as a function of SCN and climate aridity index (a) and shape parameter from soil data (b).
3.2 Estimated shape parameter
The shape parameter (a) for the distribution of soil water storage capacity is estimated based on the soil data in the gSSURGO database. For examples, the black circles in Fig. 5 show the normalized storage capacity for the Fox River watershed (Fig. 5a) and the Spoon River watershed (Fig. 5b) based on the soil data in the gSSURGO database. As shown in Fig. 5, the normalized CDF for both watersheds shows an S shape. The estimated shape parameter is 1.996 for the Fox River watershed (RMSE = 0.58) and 1.990 for the Spoon River watershed (RMSE = 1.27) by fitting to the soil data. A higher value of shape parameter indicates less spatial variability; therefore, the spatial variability in the Spoon River watershed is higher than that in the Fox River watershed. The mean value of RMSE for the 35 study watersheds is 0.06. Figure 4b shows the estimated shape parameters for the study watersheds, which vary from 1.830 to 1.998.
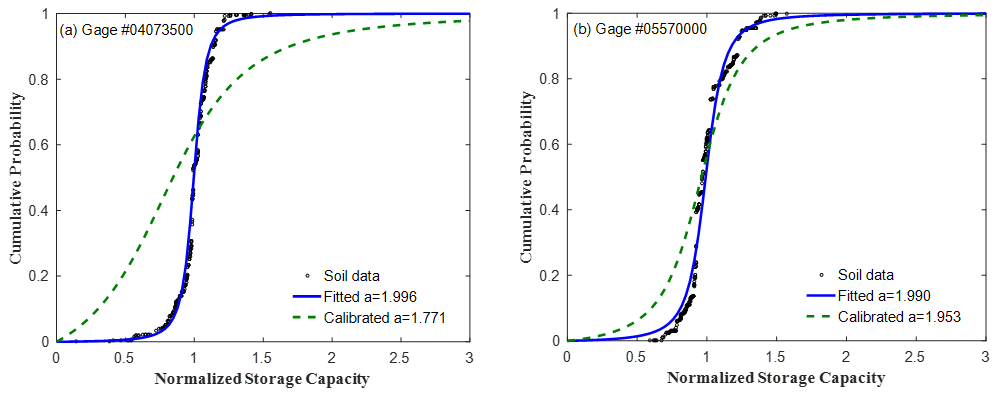
Figure 5The estimated shape parameter for the spatial distribution of soil water storage capacity based on soil data and the calibrated shape parameter based on mean annual water balance in the Fox River watershed (a) and the Spoon River watershed (b).
3.3 Diagnosing mean annual runoff prediction
The estimated values of Sb and a based on climate, LULC, and soil data are applied to the mean annual water balance model. The comparison of simulated and observed mean annual runoff for the study watersheds is shown in Fig. 6a. The RMSE for estimated mean annual runoff is 80 mm/yr. The water balance model captures 88.2 % of the mean annual runoff across the 35 study watersheds; therefore, the methods for estimating Sb and a based on the available data are promising for predicting annual runoff in ungauged basins.
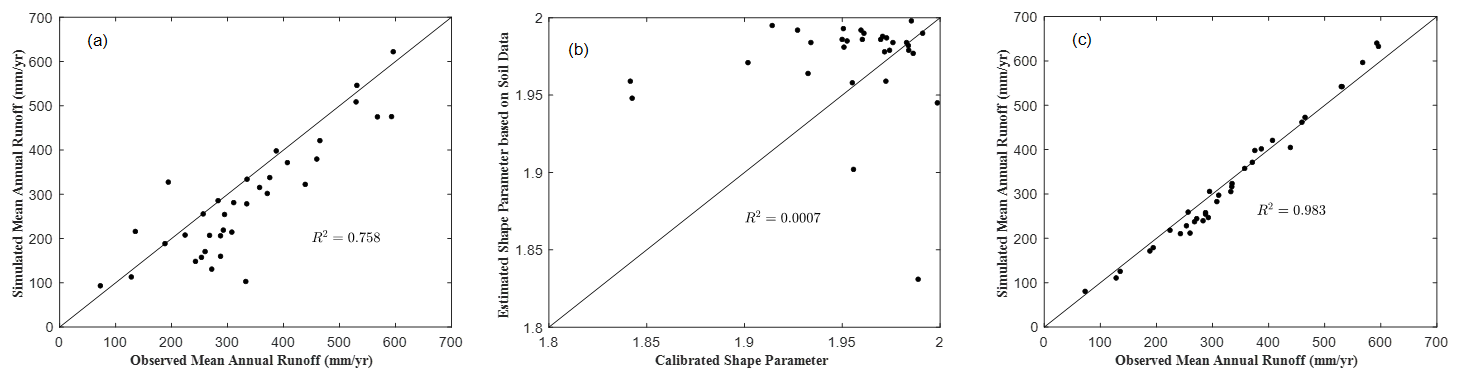
Figure 6(a) Observed versus simulated mean annual runoff using shape parameter based on soil data; (b) Soil data-based versus calibrated shape parameter; and (c) observed versus simulated mean annual runoff using shape parameter based on calibration.
The water balance model with the estimated values of Sb and a underestimates the mean annual runoff in some watersheds, and the relative underestimation error is 11.8 % on average among all the study watersheds. The underestimation of mean annual runoff could be due to the biased estimation of the shape parameter. As described in Sect. 3, the spatial variability of soil water storage capacity is assumed to be equal with the spatial variability of the pore space in the shallow soil. The pore space at the point scale is calculated through the porosity and soil thickness. The thickness of the shallow soil in the gSSURGO database is quite uniformly distributed across the watershed, i.e., around 2 m, whereas the actual soil thickness including the weathered bedrock is the elevation difference between the land surface and fresh bedrock, and it can be highly heterogeneous due to the variable land surface and bedrock topography over the watershed.
To diagnose the effect of land surface and bedrock topography on mean annual water balance, the shape parameter is calibrated using the observed streamflow. The streamflow data during 1948–2003 are divided into three periods: (1) the warm-up period (1948–1953), (2) the calibration period (1954–1973), and (3) the validation period (1974–2003). During the calibration, the estimated Sb based on CN is used, and a is the only free parameter to be calibrated. The calibration is conducted by minimizing the absolute error of the observed and simulated mean annual runoff through a global optimization method, i.e., the shuffled complex evolution method (Duan et al., 1992). As shown in Fig. 6b, most of the calibrated a values are smaller than the estimated a based on soil data only. The performance of predicted mean annual runoff (during the validation period) is improved with the calibrated shape parameter (Fig. 6c). The average of absolute error for the mean annual runoff is 7.1 %.
The overestimation of shape parameter based on the soil porosity data underestimates the area percentage of low soil water storage capacity compared with the calibrated one as shown in Fig. 5a for the Fox River watershed and Fig. 5b for the Spoon River watershed. The slope at the normalized soil water storage capacity around 1 for the estimated shape parameter is higher than that for the calibrated one. Therefore, the calibrated shape parameter indicates a larger spatial variability. The underestimation of catchment area with low soil water storage capacity could result from neglecting the effect of land surface and bedrock topography, which cannot be referred from the soil database (gSSURGO) where the point-scale soil thickness is around 2 m.
To explore the impact of land surface topography on the spatial distribution of soil water storage capacity, the soil data (i.e., porosity) are combined with the height above the nearest drainage (HAND) method proposed by Gao et al. (2019). HAND is the vertical elevation difference from a point to its nearest drainage point. The distribution of HAND was used for estimating the shape parameter of the spatial distribution of storage capacity. Therefore, the HAND method uses land surface topography data only for estimating the shape parameter. In our analysis, the porosity of the soil beyond the bottom layer in the soil database is assigned with the same value as the bottom layer. For example, if the HAND for a grid cell is 10.0 m and the porosity and depth of the bottom soil layer in the gSSURGO database is 0.2 and 2.0 m, respectively, then the porosity for the soil from 2.0 to 10.0 m depth is assigned with 0.2. Finally, the total volume of pores is calculated for each grid cell based on the soil porosity obtained from the gSSURGO database and the HAND value based on land surface topography.
The control of land surface topography on the hydrologic process has also been widely quantified through the topographic wetness index (TWI) of TOPMODEL (Beven and Kirkby, 1979). The spatial variability of soil storage capacity based on the TOPMODEL assumption has been demonstrated as a beneficial representation of the conceptual model (Sivapalan et al., 1997). Therefore, the heterogeneity of TWI in a watershed was proposed to be another surrogate of the heterogeneity of the soil storage capacity in this study, and the shape parameter estimated by fitting TWI against Eq. (12) through minimizing the root mean square error (RMSE) for the Maquoketa River in Iowa was compared with those obtained from other methods.
The dashed blue line in Fig. 7 shows the porosity-HAND-based CDF of normalized soil water storage capacity for the Maquoketa River in Iowa (gauge #05418500). The stream initiation threshold used for calculating HAND is 40 km2, which is 1 % of the maximum flow accumulation (Maidment, 2002). The threshold affects the value of HAND, but this is beyond the scope of this paper. The best fit value of a for the porosity-HAND-based CDF is 1.779, which overestimates the spatial variability of storage capacity compared with the calibrated shape parameter (a=1.905). This is due to the assumption of the HAND method that the bedrock between a specific point and its nearest drainage point is horizontal and intercepts with the channel bed. However, the bedrock topography may have various slopes in a watershed (Troch et al., 2002). Therefore, the true value of a (indicated by the calibrated one) potentially falls between the a obtained from soil data and the a based on soil and HAND. The bedrock topography from observation or models is needed to accurately estimate the shape parameter. The dashed dotted red line in Fig. 7 displays the CDF of the normalized soil storage capacity based on TWI, and the corresponding value of a is 1.967. The TWI-based a value also presents a larger spatial variability than that derived from soil data solely, confirming the importance of topography in determining the heterogeneity of soil water storage capacity. The deviation of the TWI-based a value from its calibrated counterpart could be due to the fact that the bedrock topography is not considered in TWI.
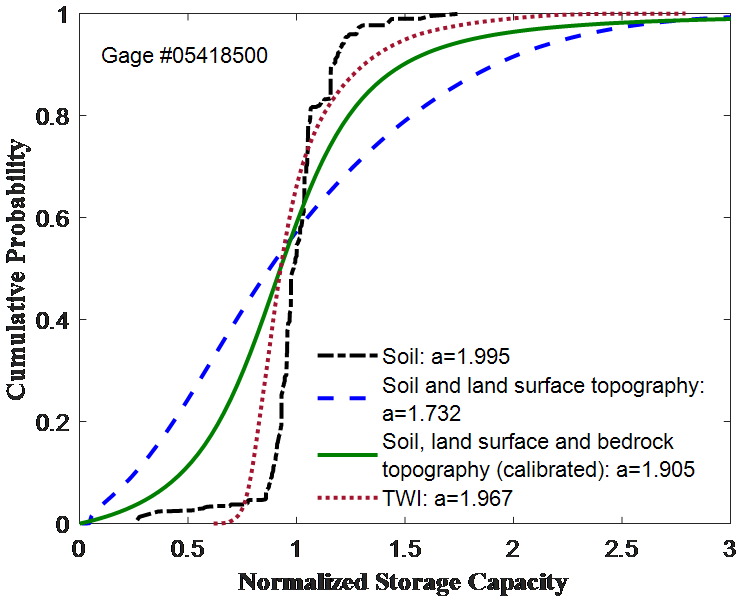
Figure 7The effects of soil, land surface topography, bedrock topography, and topographic wetness index (TWI) on the shape parameter of the spatial distribution of soil water storage capacity.
A mean annual water balance model based on the concept of saturation excess runoff generation is used for diagnosing the potential for nonparametric modeling of mean annual runoff in ungauged basins. The model takes the effect of climate variability into account explicitly since it is driven by daily precipitation and potential evapotranspiration at the daily time step. The distribution function, which leads to the SCS curve number method, is used for describing the spatial distribution of soil water storage capacity. The mean (i.e., average soil water storage capacity) and the shape parameter (i.e., the spatial variability of soil storage capacity over the watershed) of the distribution function can be estimated from the available data. Based on the linkage of the distribution function and the SCS curve number method, a new method based on the existing observed data of watershed characteristics is proposed for estimating the average soil water storage capacity. The average soil water storage capacity (Sb), as one of the parameters in the model, was estimated as a function of climate aridity index and curve number which is calculated based on land cover and soil data.
The developed mean annual water balance was applied to diagnose the estimation of shape parameter (a) in this study. The shape parameter, describing the spatial variation of soil water storage capacity, was first estimated based on the porosity and soil thickness data in the soil database (gSSURGO). The estimated values of a were tested in 35 watersheds. The results showed that the model with the estimated values of Sb and a underestimated the mean annual runoff by 11.8 % on average over all the study watersheds. The underestimation of runoff is mainly caused by the underestimation of the spatial heterogeneity of soil thickness over the watershed. The height above the nearest drainage (HAND) was then calculated as the total soil thickness for estimating the total volume of the pore space. The result showed that topography is of great importance for determining the spatial variability of soil water storage capacity. The estimated shape parameter from porosity-HAND overestimated the spatial variability of the storage capacity compared with the calibrated a, which may result from the assumed bedrock in the HAND method. The topographic wetness index (TWI)-based shape parameter further indicated the importance the topography including the land surface topography and bedrock topography. Future research will investigate alternative methods for better estimating the spatial variability of soil water storage capacity over watersheds and quantify the impacts of vegetation and climate variability (e.g., distribution of rainy days, the magnitude and the seasonality of climate variables).
The soil and land use and land cover data that support the findings of this study are openly available at https://websoilsurvey.sc.egov.usda.gov/App/WebSoilSurvey.aspx (Soil Survey Staff, 2021; Natural Resources Conservation Services, United States Department of Agriculture) and https://www.mrlc.gov/data?f%5B0%5D=category%3Aland%20cover&f%5B1%5D=region%3Aconus (NLCD, 2021; National Land Cover Database, United States Geological Survey), respectively.
Daily precipitation, streamflow, and temperature data are available from 1948 to 2003 through the MOPEX website at https://hydrology.nws.noaa.gov/pub/gcip/mopex/US_Data/ (Schaake, 2021).
DW designed the study; contributed to the methods, results, and discussion; and modified the text. YG quantified the parameters of the model and prepared the article with contributions from all co-authors. LY developed the model code, quantified the parameters, performed the simulations, and prepared the article with contributions from all co-authors. NBC contributed to the introduction and modified the text.
The authors declare that they have no conflict of interest.
This research was funded in part under award CBET-1804770 from the National Science Foundation (NSF) and Florida Department of Transportation (FDOT).
This research has been supported by the National Science Foundation (grant no. CBET-1804770) and the Florida Department of Transportation (grant no. BDV24TWO97702).
This paper was edited by Fuqiang Tian and reviewed by three anonymous referees.
Abatzoglou, J. T. and Ficklin, D. L.: Climatic and physiographic controls of spatial variability in surface water balance over the contiguous United States using the Budyko relationship, Water Resour. Res., 53, 7630–7643, https://doi.org/10.1002/2017WR020843, 2017.
Alipour, M. H. and Kibler, K. M.: A framework for streamflow prediction in the world's most severely data-limited regions: test of applicability and performance in a poorly-gauged region of China, J. Hydrol., 557, 41–54, https://doi.org/10.1016/j.jhydrol.2017.12.019, 2018.
Alipour, M. H. and Kibler, K. M.: Streamflow prediction under extreme data scarcity: a step toward hydrologic process understanding within severely data-limited regions, Hydrolog. Sci. J., 64, 1038–1055, https://doi.org/10.1080/02626667.2019.1626991, 2019.
Atkinson, S. E., Woods, R. A., and Sivapalan, M.: Cimate and landscape controls on water balance model complexity over changing timescales, Water Resour. Res., 38, 1314, https://doi.org/10.1029/2002WR001487, 2002.
Bartlett, M. S., Parolari, A. J., McDonnell, J. J., and Porporato, A.: Beyond the SCS-CN method: A theoretical framework for spatially lumped rainfall-runoff response, Water Resour. Res., 52, 4608–4627, https://doi.org/10.1002/2015WR018439, 2016.
Berghuijs, W. R., Sivapalan, M., Woods, R. A., and Savenije, H. H.: Patterns of similarity of seasonal water balances: A window into streamflow variability over a range of time scales, Water Resour. Res., 50, 5638–5661, https://doi.org/10.1002/2014WR015692, 2014.
Beven, K. J. and Kirkby, M. J.: A physically-based variable contributing area model of basin hydrology, Hydrolog. Sci. J., 24, 43–69, 1979.
Blöschl, P. G., Sivapalan, P. M., Wagener, P. T., Viglione, D. A., and Savenije, H. H.: Runoff Prediction in Ungauged Basins: Synthesis across Processes, Places and Scales, Cambridge University Press, Cambridge, UK, 2013.
Budyko, M. I.: The Heat Balance of the Earth's Surface, US Department of Commerce, Washington, DC, USA, 1958.
Chen, X. and Wang, D.: Modeling seasonal surface runoff and base flow based on the generalized proportionality hypothesis, J. Hydrol., 527, 367–379, https://doi.org/10.1016/j.jhydrol.2015.04.059, 2015.
Chen, X., Alimohammadi, N., and Wang, D.: Modeling interannual variability of seasonal evaporation and storage change based on the extended Budyko framework, Water Resour. Res., 49, 6067–6078, https://doi.org/10.1002/wrcr.20493, 2013.
Donohue, R. J., Roderick, M. L., and McVicar, T. R.: On the importance of including vegetation dynamics in Budyko's hydrological model, Hydrol. Earth Syst. Sci., 11, 983–995, https://doi.org/10.5194/hess-11-983-2007, 2007.
Duan, Q., Sorooshian, S., and Gupta, V.: Effective and efficient global optimization for conceptual rainfall-runoff models, Water Resour. Res., 28, 1015–1031, https://doi.org/10.1029/91WR02985, 1992.
Duan, Q., Schaake, J., Andreassian, V., Franks, S., Goteti, G., Gupta, H. V., Gusev, Y. M., Habets, F., Hall, A., Hay, L., Hogue, T., Huang, M., Leavesley, G., Liang, X., Nasonova, O. N., Noilhan, J., Oudin, L., Sorooshian, S., Wagener, T., and Wood, E. F.: Model parameter estimation experiment (MOPEX): an overview of science strategy and major results from the second and third workshops, J. Hydrol., 320, 3–17, https://doi.org/10.1016/j.jhydrol.2005.07.031, 2006.
Fan, Y., Miguez-Macho, G., Weaver, C. P., Walko, R., and Robock, A.: Incorporating water table dynamics in climate modeling: 1. Water table observations and equilibrium water table simulations, J. Geophys. Res., 112, D10125, https://doi.org/10.1029/2006JD008111, 2007.
Farmer, D., Sivapalan, M., and Jothityangkoon, C.: Climate, soil, and vegetation controls upon the variability of water balance in temperate and semiarid landscapes: Downward approach to water balance analysis, Water Resour. Res., 39, 1035, https://doi.org/10.1029/2001WR000328, 2003.
Fu, B. P.: On the calculation of the evaporation from land surface, Sci. Atmos. Sin., 5, 23–31, 1981 (in Chinese).
Fu, J. and Wang, W.: On the lower bound of Budyko curve: The influence of precipitation seasonality, J. Hydrol., 570, 292–303, https://doi.org/10.1016/j.jhydrol.2018.12.062, 2019.
Gao, H., Hrachowitz, M., Schymanski, S. J., Fenicia, F., Sriwongsitanon, N., and Savenije, H. H. G.: Climate controls how ecosystems size the root zone storage capacity at catchment scale, Geophys. Res. Lett., 41, 7916–7923, https://doi.org/10.1002/2014GL061668, 2014.
Gao, H., Hrachowitz, M., Sriwongsitanon, N., Fenicia, F., Gharari, S., and Savenije, H. H.: Accounting for the influence of vegetation and landscape improves model transferability in a tropical savannah region, Water Resour. Res., 52, 7999–8022, https://doi.org/10.1002/2016WR019574, 2016.
Gao, H., Birkel, C., Hrachowitz, M., Tetzlaff, D., Soulsby, C., and Savenije, H. H. G.: A simple topography-driven and calibration-free runoff generation module, Hydrol. Earth Syst. Sci., 23, 787–809, https://doi.org/10.5194/hess-23-787-2019, 2019.
Gentine, P., D'Odorico, P., Lintner, B. R., Sivandran, G., and Salvucci, G.: Interdependence of climate, soil, and vegetation as constrained by the Budyko curve, Geophys. Res. Lett., 39, L19404, https://doi.org/10.1029/2012GL053492, 2012.
Hargreaves, G. H. and Samani, Z. A.: Reference crop evapotranspiration from temperature, Appl. Eng. Agric., 1, 96–99, https://doi.org/10.13031/2013.26773, 1985.
Hickel, K. and Zhang, L.: Estimating the impact of rainfall seasonality on mean annual water balance using a top-down approach, J. Hydrol., 331, 409–424, https://doi.org/10.1016/j.jhydrol.2006.05.028, 2006.
Homer, C. G., Dewitz, J. A., Yang, L., Jin, S., Danielson, P., Xian, G., Coulston, J., Herold, N. D., Wickham, J. D., and Megown, K.: Completion of the 2011 National Land Cover Database for the conterminous United States-Representing a decade of land cover change information, Photogramm. Eng. Rem. S., 81, 345–354, 2015.
Huang, M., Liang, X., and Liang, Y.: A transferability study of model parameters for the variable infiltration capacity land surface scheme, J. Geophys. Res., 108, 8864, https://doi.org/10.1029/2003JD003676, 2003.
Jothityangkoon, C., Sivapalan, M., and Farmer, D. L.: Process controls of water balance variability in a large semi-arid catchment: downward approach to hydrological model development, J. Hydrol., 254, 174–198, https://doi.org/10.1016/S0022-1694(01)00496-6, 2001.
Konapala, G. and Mishra, A. K.: Three-parameter-based streamflow elasticity model: application to MOPEX basins in the USA at annual and seasonal scales, Hydrol. Earth Syst. Sci., 20, 2545–2556, https://doi.org/10.5194/hess-20-2545-2016, 2016.
Li, D.: Assessing the impact of interannual variability of precipitation and potential evaporation on evapotranspiration, Adv. Water Resour., 70, 1–11, https://doi.org/10.1016/j.advwatres.2014.04.012, 2014.
Li, D., Pan, M., Cong, Z., Zhang, L., and Wood, E.: Vegetation control on water and energy balance within the Budyko framework, Water Resour. Res., 49, 969–976, https://doi.org/10.1002/wrcr.20107, 2013.
Li, H. Y., Sivapalan, M., Tian, F., and Harman, C.: Functional approach to exploring climatic and landscape controls of runoff generation: 1. Behavioral constraints on runoff volume, Water Resour. Res., 50, 9300–9322, https://doi.org/10.1002/2014WR016307, 2014.
Maidment, D. R.: ArcHydro: GIS for Water Resources, ESRI Press, Redlands, CL, USA, 2002.
Milly, P. C. D.: Climate, soil water storage, and the average annual water balance, Water Resour. Res., 30, 2143–2156, https://doi.org/10.1029/94WR00586, 1994.
Moore, R. J.: The probability-distributed principle and runoff production at point and basin scales, Hydrolog. Sci. J., 30, 273–297, https://doi.org/10.1080/02626668509490989, 1985.
Multi-Resolution Land Characteristics Consortium. National Land Cover Database (NLCD), available at: https://www.mrlc.gov/data?f%5B0%5D=category%3Aland%20cover&f%5B1%5D=region%3Aconus, last access: 22 February 2021.
Pike, J. G.: The estimation of annual runoff from meteorological data in a tropical climate, J. Hydrol., 12, 2116–2123, https://doi.org/10.1016/0022-1694(64)90022-8, 1964.
Porporato, A., Daly, E., and Rodriguez-Iturbe, I.: Soil water balance and ecosystem response to climate change, Am. Nat., 164, 625–632, https://doi.org/10.1086/424970, 2004.
Sankarasubramanian, A. and Vogel, R. M.: Annual hydroclimatology of the United States, Water Resour. Res., 38, 1083, https://doi.org/10.1029/2001WR000619, 2002.
Schaake, J., Cong, S. Z., and Duan, Q. Y.: The US MOPEX data set, available at: https://hydrology.nws.noaa.gov/pub/gcip/mopex/US_Data/, last access: 22 February 2021.
SCS: Hydrology, National Engineering Handbook, Supplement A, Section 4, Chapter 10, Soil Conservation Service, US Department of Agriculture, Washington, DC, USA, 1972.
Shao, Q., Traylen, A., and Zhang, L.: Nonparametric method for estimating the effects of climatic and catchment characteristics on mean annual evapotranspiration, Water Resour. Res., 48, W03517, https://doi.org/10.1029/2010WR009610, 2012.
Sivapalan, M., Woods, R. A., and Kalma, J. D.: Variable bucket representation of TOPMODEL and investigation of the effects of rainfall heterogeneity, Hydrol. Process., 11, 1307–1330, 1997.
Soil Survey Staff, Natural Resources Conservation Service, United States Department of Agriculture, Web Soil Survey, available at: http://websoilsurvey.sc.egov.usda.gov/, last access: 22 February 2021.
Tang, Y. and Wang, D.: Evaluating the role of watershed properties in long-term water balance through a Budyko equation based on two-stage partitioning of precipitation, Water Resour. Res., 53, 4142–4157, https://doi.org/10.1002/2016WR019920, 2017.
Troch, P., Loon, E. V., and Hilberts, A.: Analytical solutions to a hillslope-storage kinematic wave equation for subsurface flow, Adv. Water Resour., 25, 637–649, https://doi.org/10.1016/S0309-1708(02)00017-9, 2002.
Turc, L.: Le bilan d'eau des sols: Relation entre les precipitations, l'evaporation et l'ecoulement, Ann. Agron., 5, 491–595, 1954.
USDA: Gridded Soil Survey Geographic (gSSURGO) Database User Guide, US Department of Agriculture, Natural Resources Conservation Service, Washington, DC, USA, 2014.
Wang, D.: A new probability density function for spatial distribution of soil water storage capacity leads to the SCS curve number method, Hydrol. Earth Syst. Sci., 22, 6567–6578, https://doi.org/10.5194/hess-22-6567-2018, 2018.
Wang, D. and Hejazi, M.: Quantifying the relative contribution of the climate and direct human impacts on mean annual streamflow in the contiguous United States, Water Resour. Res., 47, W00J12, https://doi.org/10.1029/2010WR010283, 2011.
Wang, D. and Tang, Y.: A one-parameter Budyko model for water balance captures emergent behavior in Darwinian hydrologic models, Geophys. Res. Lett., 41, 4569–4577, https://doi.org/10.1002/2014GL060509, 2014.
Wood, E. F., Lettenmaier, D. P., and Zartarian, V. G.: A land-surface hydrology parameterization with subgrid variability for general circulation models, J. Geophys. Res., 97, 2717–2728, https://doi.org/10.1029/91JD01786, 1992.
Woods, R.: The relative roles of climate, soil, vegetation and topography in determining seasonal and long-term catchment dynamics, Adv. Water Resour. Res., 37, 701–708, https://doi.org/10.1016/S0309-1708(02)00164-1, 2003.
Yang, H., Yang, D., Lei, Z., and Sun, F.: New analytical derivation of the mean annual water-energy balance equation, Water Resour. Res., 44, W03410, https://doi.org/10.1029/2007WR006135, 2008.
Yao, L., Libera, D. A., Kheimi, M., Sankarasubramanian, A., and Wang, D.: The Roles of Climate Forcing and Its Variability on Streamflow at Daily, Monthly, Annual, and Long‐Term Scales, Water Resour. Res., 55, e2020WR027111, https://doi.org/10.1029/2020WR027111, 2020.
Yokoo, Y., Sivapalan, M., and Oki, T.: Investigating the roles of climate seasonality and landscape characteristics on mean annual and monthly water balances, J. Hydrol., 357, 255–269, https://doi.org/10.1016/j.jhydrol.2008.05.010, 2008.
Zhang, L., Dawes, W. R., and Walker, G. R.: Response of mean annual evapotranspiration to vegetation changes at catchment scale, Water Resour. Res., 37, 701–708, https://doi.org/10.1029/2000WR900325, 2001.
Zhao, R. J.: The Xinanjiang model applied in China, J. Hydrol., 135, 371–381, https://doi.org/10.1016/0022-1694(92)90096-E, 1992.