the Creative Commons Attribution 4.0 License.
the Creative Commons Attribution 4.0 License.
 | 22 Dec 2021
Towards disentangling heterogeneous soil moisture patterns in cosmic-ray neutron sensor footprints
Daniel Rasche
Markus Köhli
Martin Schrön
Theresa Blume
Andreas Güntner
Cosmic-ray neutron sensing (CRNS) allows for non-invasive soil moisture estimations at the field scale. The derivation of soil moisture generally relies on secondary cosmic-ray neutrons in the epithermal to fast energy ranges. Most approaches and processing techniques for observed neutron intensities are based on the assumption of homogeneous site conditions or of soil moisture patterns with correlation lengths shorter than the measurement footprint of the neutron detector. However, in view of the non-linear relationship between neutron intensities and soil moisture, it is questionable whether these assumptions are applicable.
In this study, we investigated how a non-uniform soil moisture distribution within the footprint impacts the CRNS soil moisture estimation and how the combined use of epithermal and thermal neutrons can be advantageous in this case. Thermal neutrons have lower energies and a substantially smaller measurement footprint around the sensor than epithermal neutrons.
Analyses using the URANOS (Ultra RApid Neutron-Only Simulation) Monte Carlo simulations to investigate the measurement footprint dynamics at a study site in northeastern Germany revealed that the thermal footprint mainly covers mineral soils in the near-field to the sensor while the epithermal footprint also covers large areas with organic soils.
We found that either combining the observed thermal and epithermal neutron intensities by a rescaling method developed in this study or adjusting all parameters of the transfer function leads to an improved calibration against the reference soil moisture measurements in the near-field compared to the standard approach and using epithermal neutrons alone. We also found that the relationship between thermal and epithermal neutrons provided an indicator for footprint heterogeneity. We, therefore, suggest that the combined use of thermal and epithermal neutrons offers the potential of a spatial disaggregation of the measurement footprint in terms of near- and far-field soil moisture dynamics.
- Article
(4684 KB) - Full-text XML
- BibTeX
- EndNote


Soil moisture is a key variable in the hydrological cycle (e.g. Vereecken et al., 2008, 2014; Seneviratne et al., 2010), driving e.g. energy fluxes, groundwater recharge, runoff generation processes and biomass production, which, in turn, influence climatic variables on varying spatiotemporal scales (see e.g. Daly and Porporato, 2005; Vereecken et al., 2008; Seneviratne et al., 2010; Wang et al., 2018). Consequently, observations of soil moisture have a high importance for the estimation of landscape water balances and hydrological modelling. However, these applications would profit especially from field-scale observations covering several hectares. At this scale, the spatial (and temporal) resolution of satellite-derived soil moisture products is too coarse, and in situ soil moisture sensors would need to be installed in very large numbers due to the high spatial variability in soil moisture (Famiglietti et al., 2008; Vereecken et al., 2014; Babaeian et al., 2019). In agricultural areas, this in situ installation is additionally hampered by management practices such as ploughing, tillage and harvest (Stevanato et al., 2019).
Introduced about a decade ago, cosmic-ray neutron sensing (CRNS; e.g. Zreda et al., 2008; Desilets et al., 2010) partly overcomes these issues and allows for non-invasive soil moisture estimation at the field scale. It provides a representative spatially averaged soil moisture value across the instrument's measurement footprint (Schrön et al., 2018b) of approximately 12 ha. The resulting field-scale soil moisture products were successfully used for the calibration and validation of satellite-derived soil moisture products, as well as improved land surface and rainfall–runoff models (e.g. Holgate et al., 2016; Montzka et al., 2017; Iwema et al., 2017; Duygu and Akyürek, 2019; Dimitrova-Petrova et al., 2020). Combining soil moisture products of different spatial scales may overcome scale gaps, as exemplarily shown by Fersch et al. (2018). Roving CRNS devices (e.g. McJannet et al., 2017; Schrön et al., 2018a; Vather et al., 2019) and dense sensor networks (e.g. Fersch et al., 2020; Heistermann et al., 2021) pose further opportunities for covering even larger areas.
Cosmic-ray neutron sensing relies on a number of naturally occurring secondary cosmic-ray neutrons in the water-sensitive epithermal energy range from >0.2 eV to 1 MeV (Köhli et al., 2015), which are counted by a neutron detector above the soil surface. Neutrons in the epithermal energy range are highly sensitive to the amount of hydrogen in the surrounding area due to their energy loss by elastic scattering processes. As a result, an increase in hydrogen results in a decrease in epithermal neutrons counted by the instrument as the neutrons are slowed down more effectively. In turn, thermal neutrons have energies below 0.2 eV and show a more complex response to the dynamics of hydrogen and other elements. The interaction with hydrogen shows two competing effects. On the one hand, the thermal neutron abundance is positively correlated with the amount of hydrogen as more thermal neutrons are generated due to thermalization of epithermal neutrons. On the other hand, neutron absorption leads to a decrease in thermal neutrons with increasing hydrogen abundance (e.g. Hubert et al., 2016). As a consequence, thermal neutrons may show a similar response to variations in hydrogen and, thus, soil moisture (the largest terrestrial near-surface hydrogen storage). However, this response may be less distinct than the one of epithermal neutrons (Weimar et al., 2020), which are mainly driven by elastic scattering. An example for the more complex behaviour of thermal neutrons is the moderation optimum describing the amount of hydrogen at which the thermalization is most effective (Hubert et al., 2016).
The measurement footprint size of CRNS varies with air pressure, air humidity and soil moisture conditions and ranges from 130 to 240 m in radius, with a depth of 15 to 83 cm during wet and dry conditions, respectively (Köhli et al., 2015). Additionally, topographic features such as open water or strong topographic gradients may influence the footprint size (e.g. Köhli et al., 2015; Schattan et al., 2019; Mares et al., 2020).
Although neutrons in the epithermal energy range are the basis for deriving soil moisture contents, thermal neutrons remain the focus of CRNS research as they can provide valuable information for estimating biomass (e.g. Tian et al., 2016; Jakobi et al., 2018; Vather et al., 2020) or snow water equivalent (SWE; Bogena et al., 2020), e.g. by using the ratio of epithermal and thermal neutrons. Compared to epithermal neutrons, little is known about the behaviour of thermal neutrons. For instance, when thermal and epithermal neutrons are combined, a measurement footprint of a similar size is assumed for both energy ranges (e.g. Vather et al., 2020). However, the integration radius of thermal neutrons at the CRNS sensor can be expected to be much smaller (a footprint of approx. 35 m) compared to epithermal neutrons (200 m; see e.g. Bogena et al., 2020). This was recently confirmed by Jakobi et al. (2021), who estimated a radius of 43 to 48 m. Considering different footprint sizes of thermal and epithermal neutrons, a combination of both through calculating neutron ratios requires all hydrogen to be distributed homogeneously in the measurement footprints. As a result, uncertainties may arise when hydrogen is not distributed homogeneously in the footprints, as mentioned by Bogena et al. (2020), and this limits the applicability of combining thermal and epithermal neutrons. This may be of particular importance, as most studies with stationary CRNS assume quasi-homogeneous site conditions or spatial patterns of different soil moisture states and dynamics with correlation lengths smaller than the CRNS footprint. For instance, neutron transport modelling so far assumes homogeneous soil water distributions when characterizing footprint dynamics and weighting functions (e.g. Köhli et al., 2015; Schrön et al., 2017; Jakobi et al., 2021) or developing transfer functions for deriving soil moisture from epithermal neutron intensities (e.g. Desilets et al., 2010; Franz et al., 2013b; Andreasen et al., 2020; Köhli et al., 2021). However, different footprint sizes may offer the opportunity for a horizontal differentiation between near- and far-field soil moisture dynamics. Although previous studies confirmed the applicability of CRNS at heterogeneous study sites for deriving spatially averaged soil moisture time series (e.g. Franz et al., 2016; Sigouin et al., 2016; Schrön et al., 2017; Pang et al., 2021), approaches for the spatial disaggregation of CRNS-derived soil moisture values at heterogeneous observation sites have not yet been assessed in detail.
Against this background, this study investigates the footprint size and neutron dynamics of epithermal and thermal energies at a heterogeneous study site in the TERENO (TERrestrial ENvironmental Observatories) lowland observatory in northeastern Germany. Consisting of mineral soils in the near-field and partly surrounded by groundwater-influenced organic peatland soils in the far field, different approaches for a spatial disaggregation of the measurement footprint can be tested at this site. This is aided by the distinct hydraulic characteristics of organic peatland soils (e.g. Dettmann et al., 2014; Rezanezhad et al., 2016) and mineral soils which lead to different soil water dynamics and water contents.
Due to the general decrease in thermal neutron count rates with increasing soil moisture, but with a smaller integration radius, we hypothesize that Spearman's rank correlation coefficient between normalized thermal and epithermal neutron intensities can serve as measure for footprint heterogeneity. Second, we hypothesize that both adjusting the neutron transfer function to near-field soil moisture observations or a combination of the normalized epithermal and thermal neutron intensities allow for a spatial disaggregation of the measurement footprint by improving the estimation of near-field soil moisture. To test these hypotheses, we first set up Monte Carlo neutron transport simulations using the URANOS (Ultra RApid Neutron-Only Simulation) code (Köhli et al., 2015). This code is often used in CRNS research (e.g. Köhli et al., 2015, 2021; Schrön et al., 2017, 2018a, b; Schattan et al., 2019; Li et al., 2019; Weimar et al., 2020) to develop transfer functions and weighting procedures. In our study, we use it to identify the footprint size and dynamics of neutrons in the thermal and epithermal energy ranges under different soil moisture conditions at the heterogeneous study site. Second, we adjust the standard transfer function used for deriving soil moisture from neutron observations and apply a combination of observed thermal and epithermal neutrons in order to improve the calibration of CRNS-derived soil moisture estimates against reference soil moisture observations in the near-field. Finally, we illustrate the potential of deriving differentiated soil moisture dynamics under heterogeneous footprint conditions by either adjusting the transfer function or by adjusting the neutron signal.
2.1 Study site
The study site is located at the TERENO NE (Zacharias et al., 2011; Heinrich et al., 2018) in the lowlands of northeastern Germany (Fig. 1). The average annual temperature is 8.8 ∘C, and rainfall amounts to 591 mm per year at the Waren weather station, which is approx. 35 km away from the study site (station ID 5349; period 1981–2010; DWD – German Weather Service, 2020a, b). Geologically, the study site is situated on a glacial outwash plain south of a terminal moraine formed during the Pomeranian phase of the Weichselian glaciation (Börner, 2015). Within the outwash plain we still find non-eroded outcrops of glacial till of previous glaciation phases while fens formed subsequently in depressions and local sinks (Börner, 2015) due to rising temperatures and groundwater levels in the Holocene.
The CRNS site (site A) itself is located on a slightly elevated outcrop of Weichselian glacial till surrounded by peatland (Fig. 1). Dominating soil types in areas with glacial till are Cambisols formed on sandy loam, while the peatland areas are characterized by Histosols rich in clay and silt and low water table depths. Soil samples were taken from mineral and organic soils in depths from 0 to 30 cm, in 5 cm increments, at 21 random locations within a 200 m radius in February 2020 and were analysed to retrieve local soil properties. Within a 10, 10 to 50 and 50 to 200 m radius, 5, 6 and 10 samples were taken, respectively, thus matching the decreasing sensitivity of the neutron detector with increasing radius. The analyses revealed an average bulk density of 1.43 g cm−3 in areas with mineral soils and 0.29 g cm−3 in areas with organic soils. The site average bulk density calculated from all available samples is 1.11 g cm−3. Based on the material density of quartz (2.65 g cm−3), these values were used to estimate soil porosities of 89 % and 46 % for organic and mineral soils. The average percentage of soil organic matter determined from the loss-on-ignition analyses (550 ∘C, 24 h) revealed 0.70 g g−1 for organic soils and 0.02 g g−1 for mineral soils. A subsequent loss-on-ignition analysis (1000 ∘C, 24 h) revealed an average lattice water content of 0.03 g g−1 for organic soils and 0.001 g g−1 for mineral soils, respectively. Based on these soil samples, the average gravimetric water content in organic soils in the far field was 0.62 m3 m−3, while it was only 0.15 m3 m−3 for near-field mineral soils, thereby illustrating the two distinct soil moisture regimes at the study site. Regardless of the soil type, pasture is the prevailing type of land cover, mainly used for cattle grazing, while larger areas that are forested with Pinus sylvestris are found in greater distances of more than 1 km towards the east (Fig. 1). The observation site is one of three sites in the TERENO NE observatory equipped with a CRS1000 neutron detector (Hydroinnova LLC, USA) and also includes a weather station that permanently monitors the relative humidity, wind speed and temperature, as well as the long and short-wave solar radiation. Additionally, irregular monthly groundwater measurements are available. The other two CRNS observation sites (B and C; Fig. 1b) represent forest sites with a rather homogeneous distribution of soil moisture in the measurement footprint of the CRNS. Further details regarding site C can be found in Heidbüchel et al. (2016).
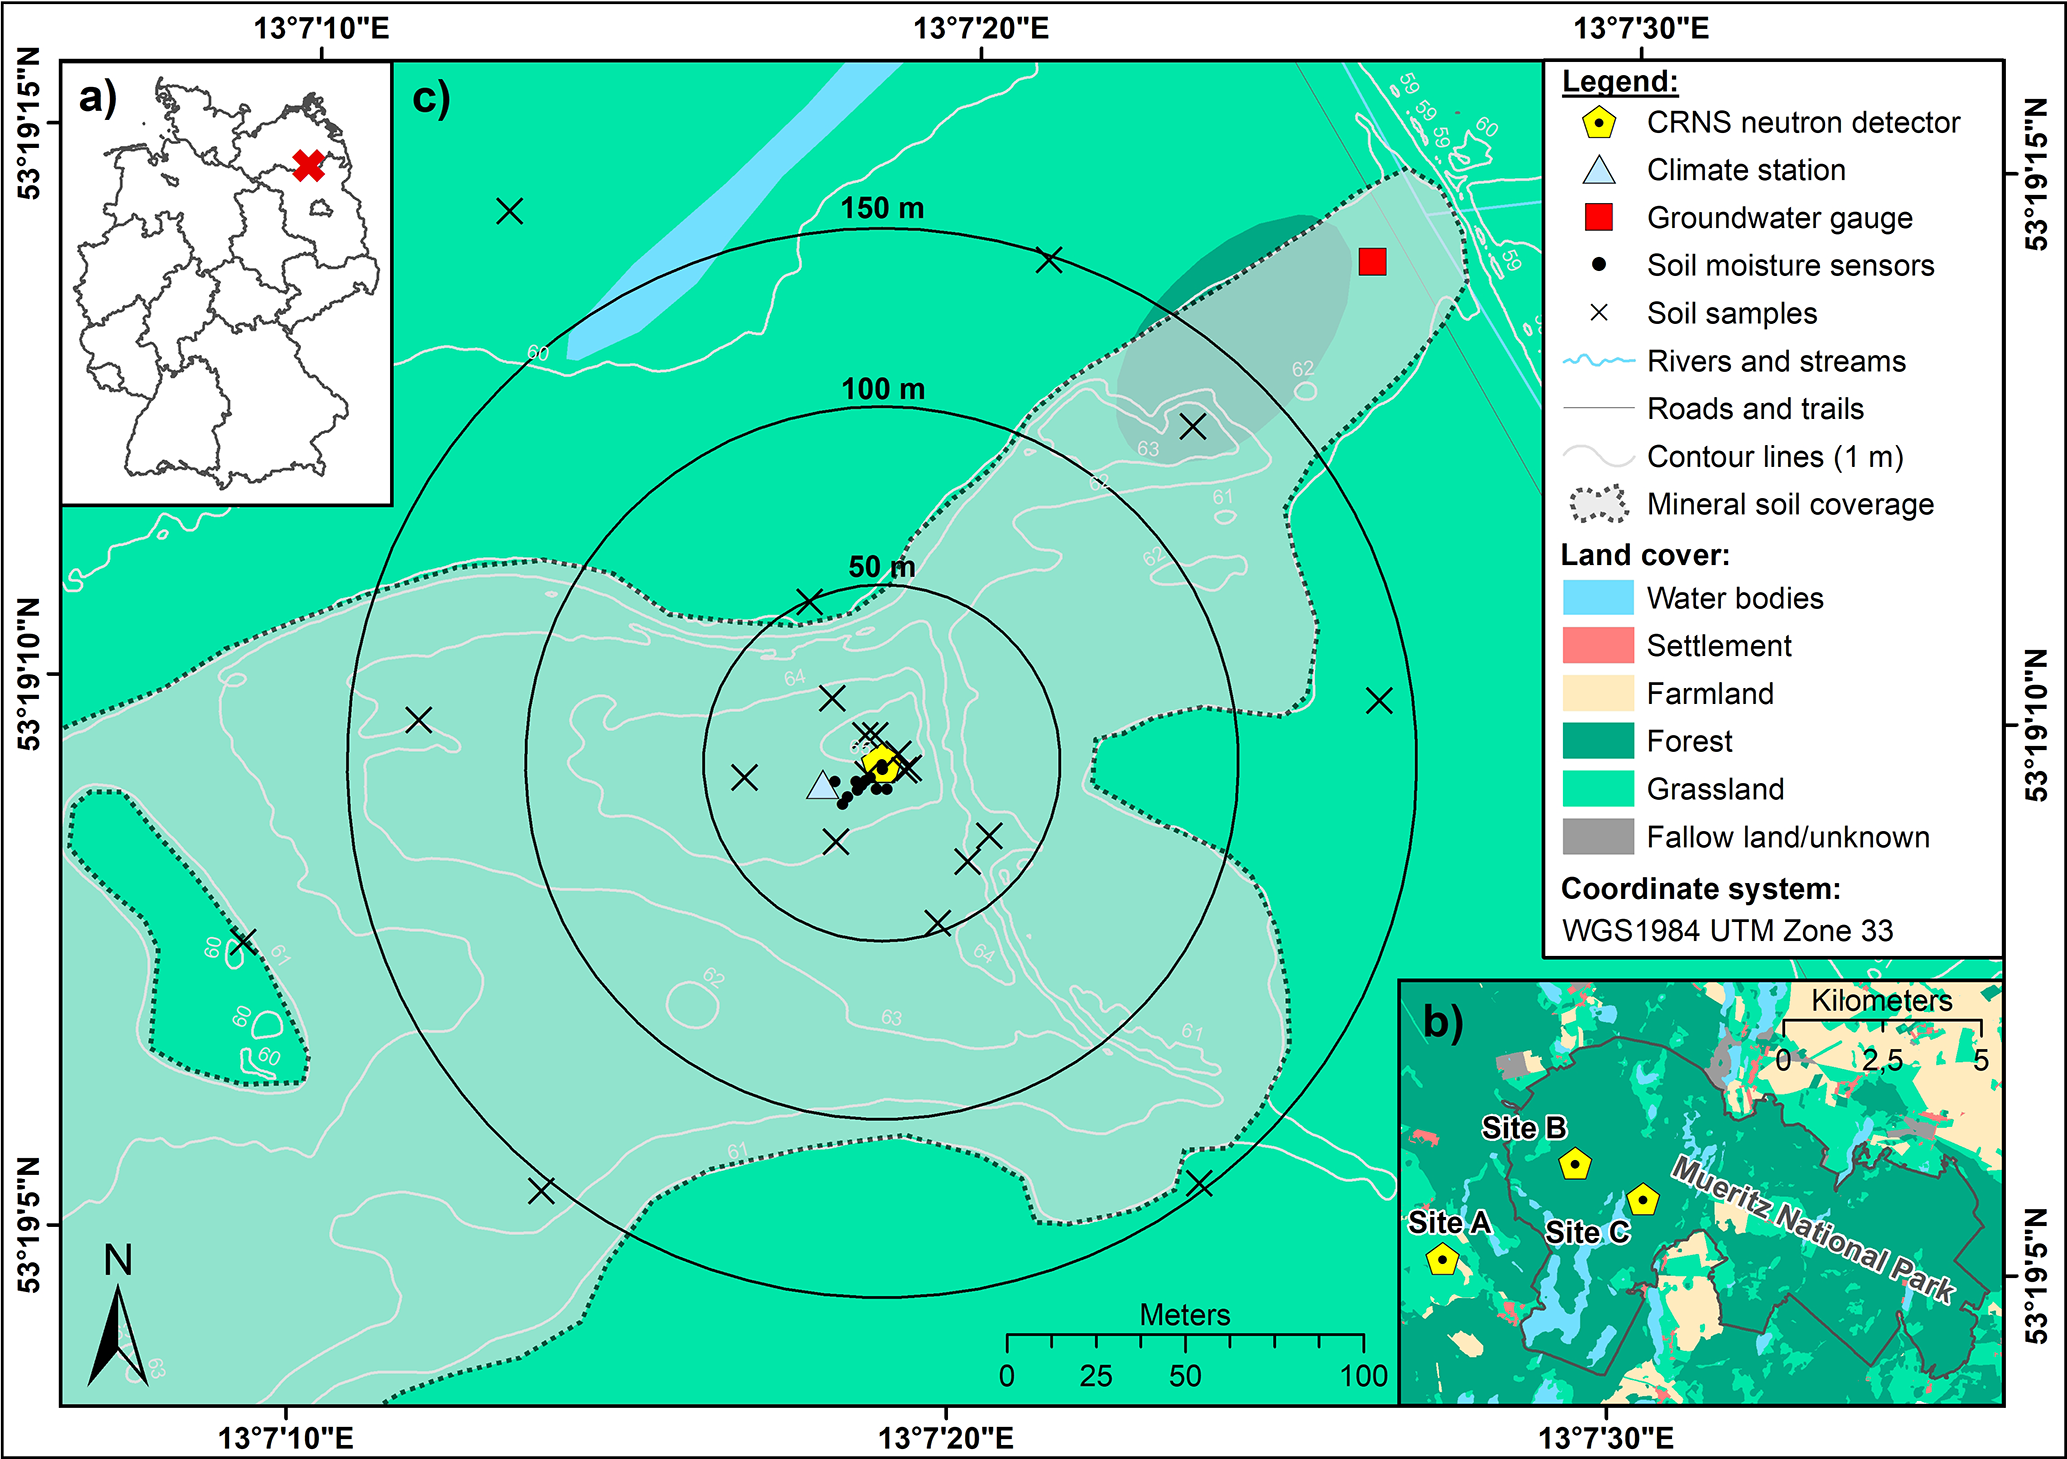
Figure 1The location of the study area and within Germany (a), the positions of all CRNS locations of the TERENO lowland observatory in the Mueritz National Park (b) and the heterogeneous CRNS observation site of this study (c). Sources: digital elevation model from LAIV-MV – State Agency for Interior Administration Mecklenburg-Western Pomerania, 2011; land cover from BKG – German Federal Agency for Cartography and Geodesy, 2018a; administrative units from BKG – German Federal Agency for Cartography and Geodesy, 2018b.
The neutron detectors are composed of two proportional counter tubes filled with 3He gas (see Zreda et al., 2012, and Schrön et al., 2018b, for a detailed description). There is one bare, unshielded, tube to detect neutrons in the thermal energy range and a second moderated counter tube shielded with a 2.5 cm high-density polyethylene housing to measure neutrons in the epithermal energy range. It should be noted that the bare counter tube may observe about 5 % of the epithermal neutrons, and the moderated tube observes up to 45 % of the thermal neutrons (Andreasen et al., 2016), which should be considered when comparing the different detector systems and the results of neutron transport simulations. The time series of in situ soil moisture point sensors of the two different types are available at the site. A total of six SMT-100 sensors (TRUEBNER GmbH, Germany) are installed, with two sensors each at 10, 20 and 30 cm depths. They record soil moisture at 10 min intervals. Time domain reflectometry (TDR) sensors (Campbell Scientific Ltd, UK) are installed at the same depths, with four sensors at 10 cm depth, three sensors at 20 cm and five sensors at 30 cm depth. The record interval for the TDR probes is 15 min. Measurements are converted to soil moisture by using the manufacturers' calibrations. All point sensors are installed within a 30 m radius around the neutron detector and, thus, only cover the near-field composed of mineral soils. Continuous reference observations from the far-field peatland soils are not available. Given the higher noise level of the TDR time series, but soil moisture dynamics that are very similar to the SMT-100 sensors in the respective soil depths, only SMT-100 data are used in the following analyses and presented in the paper. An identical processing procedure was used for the soil moisture time series from TDR soil moisture sensors (for results, see the Appendix).
2.2 Neutron simulations
In the present study, we apply the Monte-Carlo-based neutron transport model of URANOS (version v0.9 ω18; see Köhli et al., 2015, for details). By simulating 200 million source neutrons, we intend to estimate the influence of water content variations in areas with organic soils in the far field of the neutron detector on the neutron flux and footprint size of epithermal and thermal neutrons. The model set-up uses a simplified representation of soil distributions (Fig. 1) within a rectangular 900 by 900 m sized model domain, with a horizontal resolution of 1 m around the neutron detector. The following three simplifications had to be made in order to set up the model: a flat topography was assumed, soil porosities derived from field samples were assumed to be valid for the entire simulated soil column of 2 m depth and organic soils are only differentiated by their significantly higher porosities, while their chemical composition is equal to that of mineral soils. This last simplification is due to the limitations of the neutron transport model. Although these simplifications will hamper a direct comparison with observed neutron intensities as the hydrogen stored in soil organic matter or vegetation will reduce the footprint sizes and dampen the neutron intensity response to changes in soil water content under real-world conditions, the simulations will provide valuable information on the neutron intensity dynamics at the study site. All simulations were made with a single set of atmospheric boundary conditions, namely an assumed cutoff rigidity of 3 GeV, based on Andreasen et al. (2017a), an absolute humidity of 8.3 g m−3 and an atmospheric shielding depth of 1028.5 g cm−2. In the case of absolute humidity and atmospheric shielding depth, these values represent site averages derived from local measurements for the study period from 2015 to 2018.
To investigate the footprint variability caused by soil water changes in the peatland soils of the far field, we calculate the footprint radius as the 86 % quantile of distances (R86) to the detected neutron origins for thermal (0.001 to 0.2 eV) and epithermal (>0.2 eV to 0.01 MeV) neutrons. For detected epithermal neutrons, the distance to the point of the first soil contact is considered as being the point of origin, as secondary epithermal neutrons generated from nuclear evaporation processes in the soil are sensitive to hydrogen by elastic scattering (e.g. Köhli et al., 2015). In contrast, to our knowledge, the definition of the origin of detected thermal neutrons has not yet been assessed in detail. On the one hand, the point of thermalization (i.e. point where a neutron first reached an energy in the thermal range) may be a suitable definition of the origin because, as neutrons reach thermal energies, absorption adds to elastic scattering as a second important interaction process between neutrons and hydrogen, as well as matter in general. On the other hand, if thermal neutrons are generated from higher energetic epithermal neutrons, the amount of detected thermal neutrons may partly be influenced by the amount of epithermal neutrons and their origin. As a consequence, we apply and compare both options, i.e. the point of thermalization and the point of first soil contact, to define the origin of detected thermal neutrons and the resulting footprint radius. The measurement depth of epithermal and thermal neutrons is derived similarly. For thermal neutrons, the average measurement depth D86 is defined as the 86 % quantile of either the depth of the thermalization point or the maximum depth along the neutron transport path, while for epithermal neutrons we use only the latter.
It should be noted that the virtual detector in the simulations is significantly larger (9 m radius) than a real neutron detector; this is in order to enhance the count rate and decrease the computational time. However, this means that neutrons originating below the detector (i.e. originating within the 9 m radius) are considered to have a travel distance of 0 m. Furthermore, in this study, we consider an energy window for defining thermal and epithermal neutrons scattering in the virtual detector. Although detector response functions (see e.g. Köhli et al., 2018, 2021) mimic the sensitivity of a real neutron detector and would provide a more realistic neutron intensity, we deliberately decided to keep our model simple and general (also due to a lack of information on soil moisture dynamics and soil chemistry in the peatlands). We are, thus, not aiming at a detailed reproduction of field conditions but at more general understanding. Although different studies refer to different upper energy boundaries for thermal neutrons in simulation studies which depend on the specific neutron detector and applied shielding material, we decided to use the physical energy threshold in which thermal neutrons are in equilibrium with the energy of environmental nuclei and neutron absorption becomes a relevant process as a more general definition of thermal neutrons.
On the one hand, the simulation scenarios described in the following sections allow for the investigation of thermal and epithermal measurement footprint changes when soil moisture is either stable or dynamic in the near-field where the CRNS method is most sensitive. Additionally, we can derive potentially valuable information on neutron intensity variations when the water content varies at different rates in the near field and far field. This may be of particular importance at study sites influenced by peatland soils, as these are characterized by e.g. higher storage capacities. An overview of all simulation sets and the included simulation scenarios performed in the scope of this study can be found in Table 1.
2.2.1 Simulation set 1: static near-field soil moisture and variable far-field soil moisture
In the first simulation set that consists of seven neutron transport simulation scenarios, the simulated soil moisture was kept constant in the near-field mineral soil areas. The soil moisture in areas with peatland soils was altered for each scenario and ranges from 0.1 to 0.7 m3 m−3 across the entire soil column at a porosity of 89 %. During all scenarios, the soil moisture in areas with mineral soil remains constant at 0.1 m3 m−3 at a porosity of 46 % (Table 1). This fixed low water content in the near-field was chosen as the measurement radius from which detected thermal or epithermal neutrons originate can be expected to be largest at dry soil conditions (Köhli et al., 2015; Schrön et al., 2017). Therefore, the largest influence of far-field soil water dynamics on neutron count rates at the detector location can be expected at low soil moisture conditions in the near-field. Hence, simulating constant low near-field soil water contents and solely varying far-field soil water contents allows for the isolated investigation of the impact of peatland soil water variations on the observed neutron intensities and the corresponding footprint variations.
2.2.2 Simulation sets 2 and 3: varying soil moisture in both the near-field and far field
The second set of simulation scenarios included variations in soil moisture contents in the far field and in the near-field. All other simulation parameters remained equal to previous simulations. We simulate six simulation scenarios with an equal decrease in soil water contents in near-field mineral soils and far-field peatland soils. The highest soil moisture content simulated is 0.35 m3 m−3 for mineral soils and 0.70 m3 m−3 for peatland soils. These soil water contents are decreased in equal intervals of 0.05 m3 m−3 in both soils (Table 1). In the third set of simulations, we investigate the effect when soil moisture is reduced more strongly in peatland soils compared to mineral soils. Here, the soil moisture in peatland areas is reduced in 0.10 m3 m−3 intervals, from 0.70 to 0.20 m3 m−3, while soil moisture in the mineral soils is reduced from 0.35 to 0.10 m3 m−3 in 0.05 m3 m−3 intervals.
Table 1Overview of the different Monte-Carlo-based neutron transport simulation scenarios conducted within the different simulation sets. Near-field soil moisture refers to soil moisture in areas covered with mineral soils, while far-field soil moisture refers that in the peatland soils.

2.3 In situ neutron observations
2.3.1 Processing of measured neutron intensities
For our 4-year study period from January 2015 to December 2018, neutron intensities were aggregated from sub-hourly intervals to hourly values and smoothed by a 13 h moving average in order to reduce noise in the data (e.g. Bogena et al., 2013). Data gaps were caused by power cuts, technical issues or maintenance activities. Outliers were identified by a threshold of 4 times the standard deviation and were excluded from the analyses. Raw neutron observations were corrected for variations in atmospheric shielding depth or air pressure and primary neutron influx (e.g. Zreda et al., 2012). The standard correction procedure for air humidity is defined for neutrons in the epithermal energy range (Rosolem et al., 2013) and may not be valid for thermal neutrons. As a consequence, in this study, we corrected thermal and epithermal neutron intensities only for variations in atmospheric shielding depth and primary neutron influx in order to maintain comparability. It should be noted that the correction procedures applied to thermal and epithermal neutron intensities differ among previous studies (e.g. Andreasen et al., 2016; Jakobi et al., 2018) and illustrate the need for further research. To correct the raw neutron intensities for varying atmospheric shielding depths, air pressure values in hectopascals measured by the neutron detector are converted to atmospheric shielding depth in grams per squared centimetre by multiplication with 1.0194 s2 m−1 (Heidbüchel et al., 2016). The required reference value is the average atmospheric shielding depth for the 4-year study period, and the attenuation length (135.6 g cm−2) is adapted from Heidbüchel et al. (2016). The correction for variations in primary neutron flux is done using pressure- and efficiency-corrected primary neutron data from the Jungfraujoch neutron monitor in Switzerland (JUNG; http://www.nmdb.eu, last access: 21 December 2021). Again, the reference value is defined as the average influx during the study period. The corrected thermal (bare) and epithermal (moderated) neutron intensities for the study period are illustrated in Fig. 2.
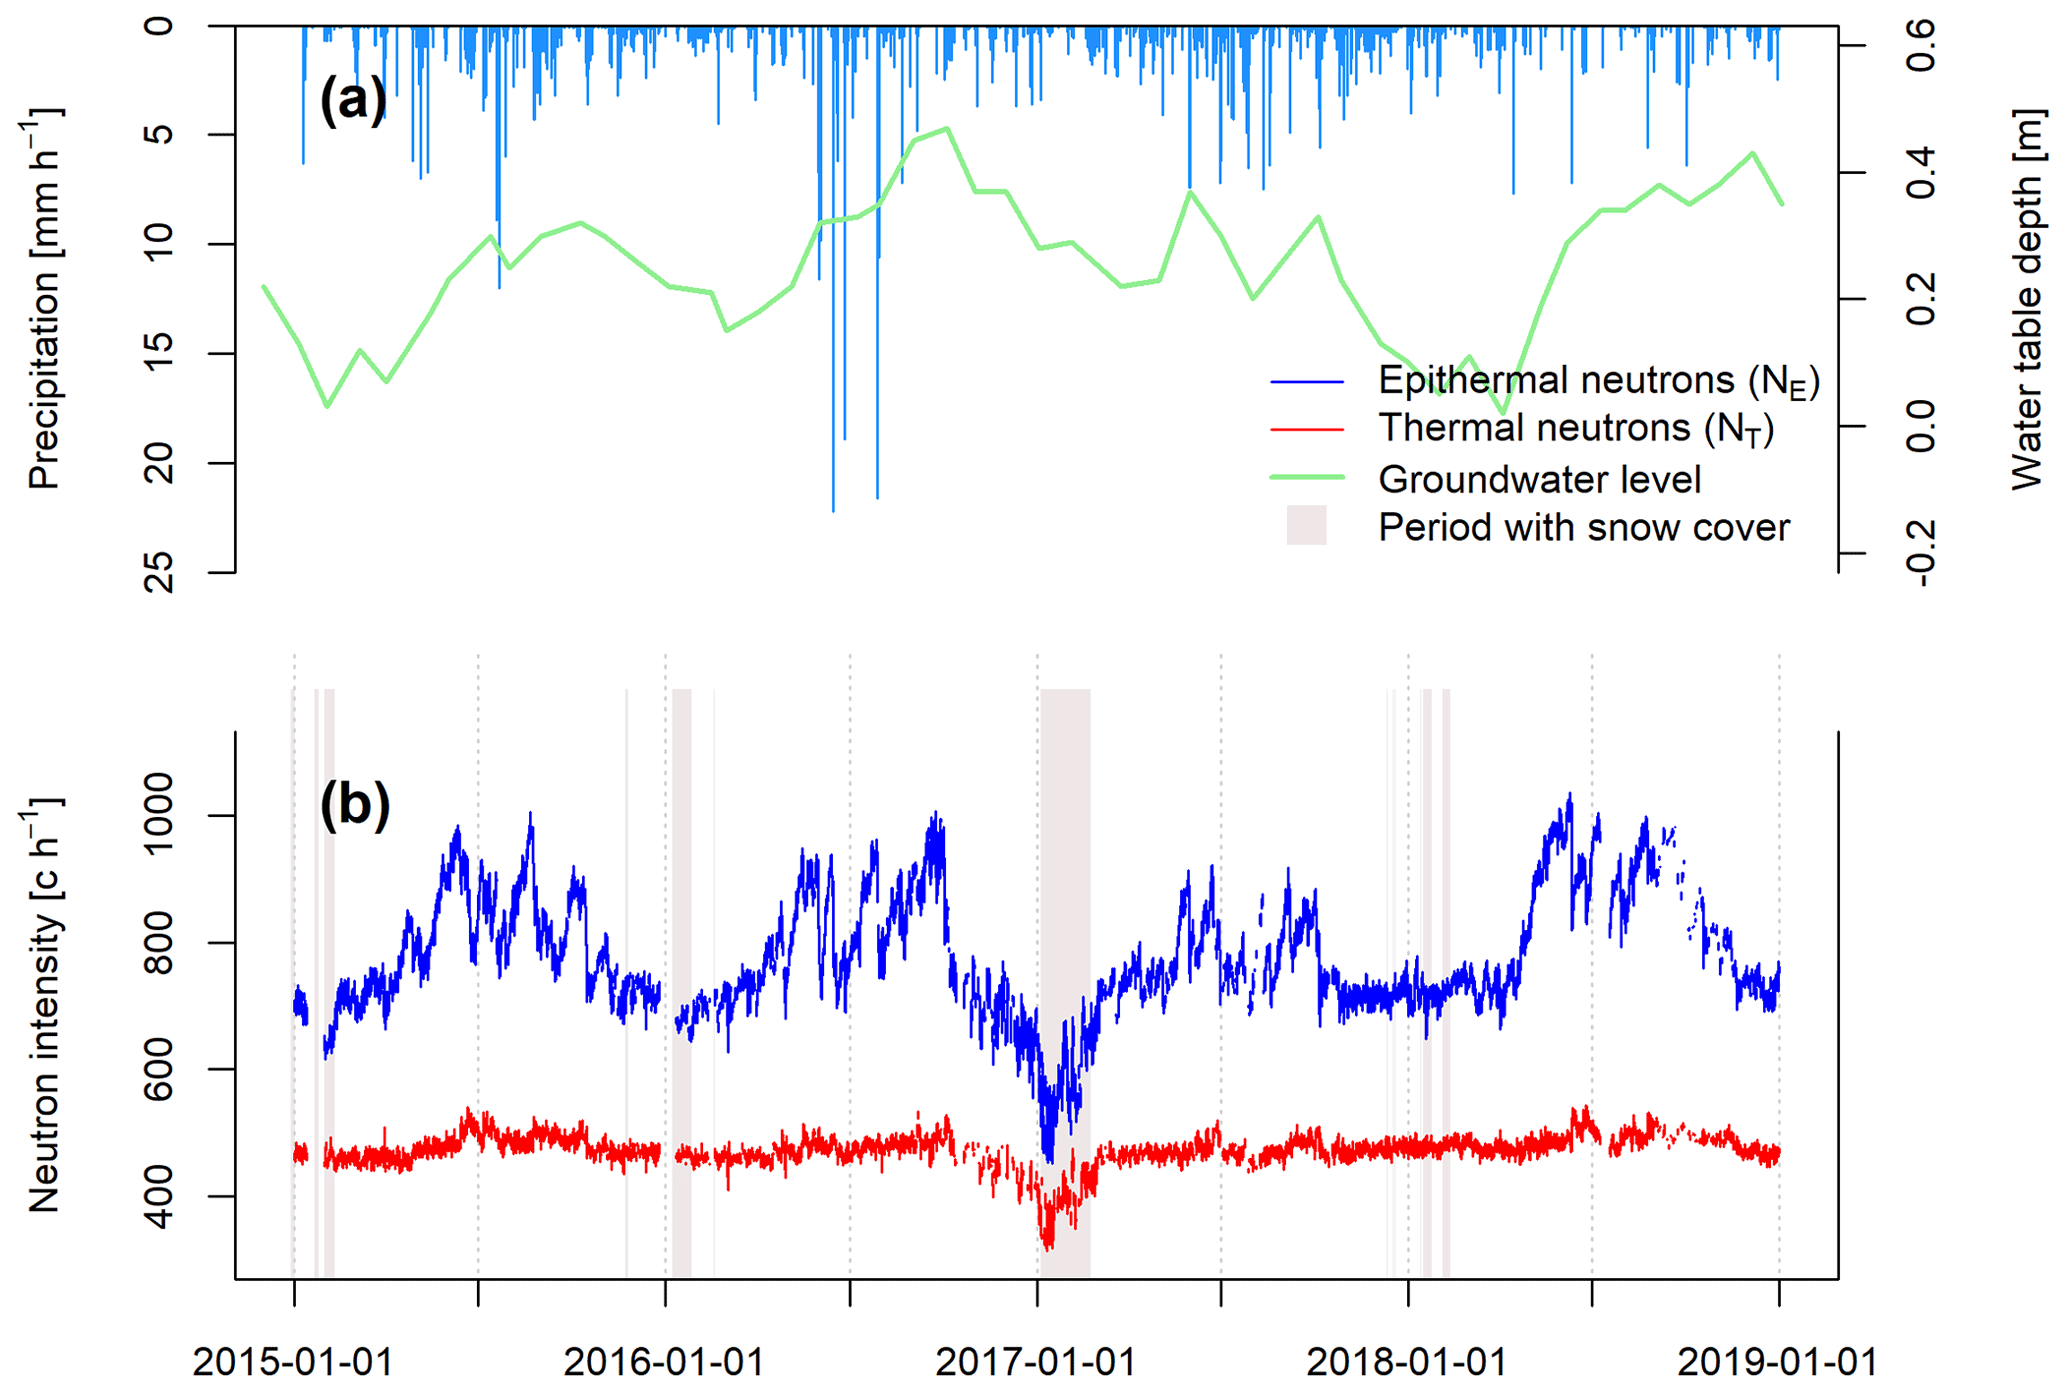
Figure 2Field observations for the period from January 2015 to December 2018, showing the (a) hourly rainfall and approximate monthly groundwater table depth in far-field peatland soils and (b) the corrected neutron intensities in the thermal (NT) and epithermal energy range (NE) (b).
Corrected epithermal neutron intensities can be converted to volumetric soil moisture θCRNS in cubic metres by cubic metre (m3 m−3), using the standard transfer function introduced by Desilets et al. (2010), as follows:
Here, a0 (0.0808), a1 (0.372) and a2 (0.115) are the shape-defining parameters of the hyperbolic transfer function. N describes the corrected neutron intensity, ρsoil is the average soil bulk density in the measurement footprint (kilograms per cubic metre; hereafter kg m−3), ρwater is the density of water in kg m−3, and N0 is a free calibration parameter describing the site-specific neutron intensity over dry soil at 0.0 m3 m−3. In this study, we used the revised standard transfer function recently introduced by Köhli et al. (2021), which provides a physical meaning for each of the shape-defining parameters from Eq. (1). The three variables in the revised transfer function (Eq. 2) can be calculated from the variables of the standard transfer function.
where, in the following,
The calibration procedure is performed for the entire time series of observed, corrected neutron intensities of epithermal neutrons NE. There are two possible options for deriving soil moisture based on the standard transfer function (Eq. 1). The first option requires Eq. (1) to be solved for N0 in order to approximate the calibration parameter. The calculated N0 is then used in Eq. (1). In the second procedure, the N0 parameter of Eq. (1) is calibrated iteratively against reference soil moisture measurements in order to derive the site-specific neutron intensity over dry soils N0.
We used the revised transfer function (Eqs. 2–5) and iteratively calibrated N0 because continuous in situ soil moisture measurements offer a high number of reference points. Regardless of which equation is used for deriving soil moisture values from neutron observations and the corresponding calibration option, reference soil moisture observations need to be weighted according to their depth and distance to the neutron detector in order to match the sensitivity regarding the origin of the epithermal neutrons (Schrön et al., 2017).
We weighed all available point sensor measurements per time step in order to derive a depth–distance weighted soil moisture time series after Schrön et al. (2017). The weighting approach takes e.g. soil moisture, bulk density (1.43 g cm−3), additional hydrogen pools (organic matter of 0.02 g g−1 and lattice water of 0.001 g g−1), air humidity and vegetation height (0.2 m) into account. Hourly time series of all SMT-100 soil moisture sensors at depths of 10, 20 and 30 cm for all snow-free periods from January 2015 to December 2018 were weighted accordingly. For SMT-100 probes, we also excluded soil moisture observations during soil temperatures below 0∘ C. Lastly, the N0 is iteratively adjusted to derive a soil moisture time series from the observed neutron intensities resulting in the highest goodness of fit, in terms of the highest Kling–Gupta efficiency (KGE; Gupta et al., 2009), compared to the weighted reference time series from the in situ sensors in the near-field. To assess the impact of the weighting on the calibration result, we also compare the depth–distance weighted calibration with a calibration based on the arithmetic mean of all available in situ sensors. This calibration approach is referred to as the standard calibration approach throughout the paper.
2.3.2 Improving the CRNS-derived soil moisture estimation
To achieve a better calibration result against the observations of the reference sensors in the near-field, we adjusted the shape of the transfer function by tuning the parameters a0, a1 and a2. The tuning of all shape-defining parameters was done in previous studies and resulted in a better goodness of fit between CRNS-derived soil moisture values and reference measurements (e.g. Rivera Villarreyes et al., 2011; Lv et al., 2014; Heidbüchel et al., 2016; Tan et al., 2020) and may be especially necessary at sites with binary soil moisture distributions (e.g. Franz et al., 2013a). In this study, we adjust parameters N0, a0, a1 and a2, using a Monte-Carlo-based approach, by testing 10 000 random combinations of the parameters and selecting the parameter set that produces the highest statistical goodness of fit in terms of the KGE. This approach will be referred to as alternative approach 1 in the following sections.
Furthermore, we tested a second approach in which we made use of the simultaneously recorded and corrected thermal neutron intensity NT to create a rescaled neutron time series NET, using Eq. (6) as follows:
Here, is the average of the sum of epithermal and thermal neutrons, while is the average of the epithermal neutron intensity only. The result from Eq. (6) is a neutron time series which averages the dynamics of thermal and epithermal neutron intensities and, thus, leads to a rescaled epithermal neutron time series NET, which now shows a different relationship with the reference soil moisture measurements characterized by a shallower slope compared to NE. The rescaled time series may be less influenced by peatland soil moisture variations due to the expected smaller footprint of thermal neutrons, while the more distinct intensity change of epithermal neutrons with soil moisture variations is at least partly conserved. More importantly, the slope of the functional relationship between soil moisture and the neutron intensity of NET becomes less steep due to the generally weaker response of thermal neutrons to soil moisture changes (e.g. Weimar et al., 2020). For our study site, especially the shallower slope could be used as a proxy to partly account e.g. for the stronger soil moisture changes expected to occur in far-field peatland areas. These would lead to changes that are too strong in epithermal neutron intensity and would hamper the standard approach for deriving near-field soil moisture estimates. We would like to note that, in this study, we did not consider using thermal neutrons alone as this would require a transfer function specifically designed to the response of thermal neutrons to changes in soil moisture.
The calibration was performed iteratively by adjusting N0 only. In terms of normalized neutron intensity dynamics, this equation is equal to summing the absolute epithermal and thermal neutron intensity, which would, consequently, lead to a much higher N0 after calibration. The latter approach will be referred to as alternative approach 2 for the remainder of the paper.
To test whether the CRNS-derived soil moisture from one of the alternative approaches 1 and 2 differs significantly from the traditional standard approach, using NE and calibrating N0 only, we performed a time series comparison based on bootstrapping residuals and the Wilcoxon rank sum test. First, the CRNS-derived soil moisture time series based on (i) NE and calibrating N0, (ii) NE and calibrating all parameters and (iii) NET and calibrating N0 were smoothed with a normal Nadaraya–Watson kernel regression smoother, using a large bandwidth of 1000 in order to achieve an intense smoothing effect. Based on the smoothing method applied, the seasonal variations in soil moisture remain, while short-term soil moisture changes, i.e. on the event scale, are removed. Missing values were excluded before applying the smoothing algorithm and reintroduced to the smoothed time series. Then the residuals were calculated between the smoothed and original soil moisture time series. Next, a random sample of 5000 residuals was generated and used to produce a random distribution of 5000 soil moisture values per time step for each of the smoothed time series of the three variants mentioned above. This is done to obtain a distribution of soil moisture values per time step of each CRNS-derived soil moisture time series which can be compared in the next step. For each time step, an unpaired Wilcoxon rank sum test was performed in order to determine time steps where significant differences (p<0.05) occur between the CRNS-derived soil moisture time series calculated with the classic approach and with the two alternative approaches.
In a first attempt to find a measure to characterize footprint heterogeneity, the Spearman rank correlation coefficients between normalized thermal and epithermal neutron counts were calculated for the study site and for the two nearby CRNS sites that are located in forested terrain (see Fig. 1) with rather homogeneous soil characteristics in their footprint. The neutron intensities of those two sites were corrected in the same way as described above. Unless otherwise stated, all calculations were performed in R statistical software (R Core Team, 2018) using, for instance, the hydroGOF package (Zambrano-Bigiarini, 2017) for calculating the goodness-of-fit parameters.
3.1 Simulated neutron response to soil moisture changes in the far-field peatland soils
The results of all neutron transport simulation scenarios with a constant soil moisture in mineral soils of the near-field reveal that the sensitive measurement footprint radius is distinctively smaller for thermal neutrons than for epithermal neutrons (Fig. 3). The footprint radius of epithermal neutrons decreases from 141 m in the 0.1 m3 m−3 scenario to 111 m in the 0.7 m3 m−3 scenario, with an average R86 of 122 m based on all simulation scenarios. In comparison, the thermal footprint radius is distinctively smaller but depends on the definition of a detected neutrons origin in the model domain. If the point of thermalization is considered as the point of origin, the thermal footprint only exhibits a minor change in simulation scenarios with increasing soil moisture in the peatland soils of the far field. It remains rather constant with a minimum and maximum R86 of 42 and 45 m, respectively (Fig. 3). The average footprint radius of thermal neutrons from all simulation scenarios is 44 m, and thus, the average epithermal footprint radius is 2.8 times larger than the thermal footprint radius. However, if the first soil contact is considered as the point of origin, then the thermal footprint is larger and decreases with increasing peatland soil moisture, from 107 to 81 m, with an average footprint radius of 88 m. Thus, the neutron transport simulations led to an average horizontal integration area of 0.6 and 2.4 ha for thermal neutrons, depending on which footprint definition is applied. The average horizontal integration area of epithermal neutrons has a size of 4.7 ha. The average integration depth D86 remains constant for thermal neutrons, with an average D86 of 0.27 m if the point of thermalization is considered as the origin, while it is distinctively larger if the maximum depth is used. Here, the average measurement depth increases to 0.52 m and is larger than the average measurement depth of epithermal neutrons, revealing a D86 of 0.31 m. Even though thermal neutrons show a smaller integration radius, the integration depth might be larger than that of epithermal neutrons.
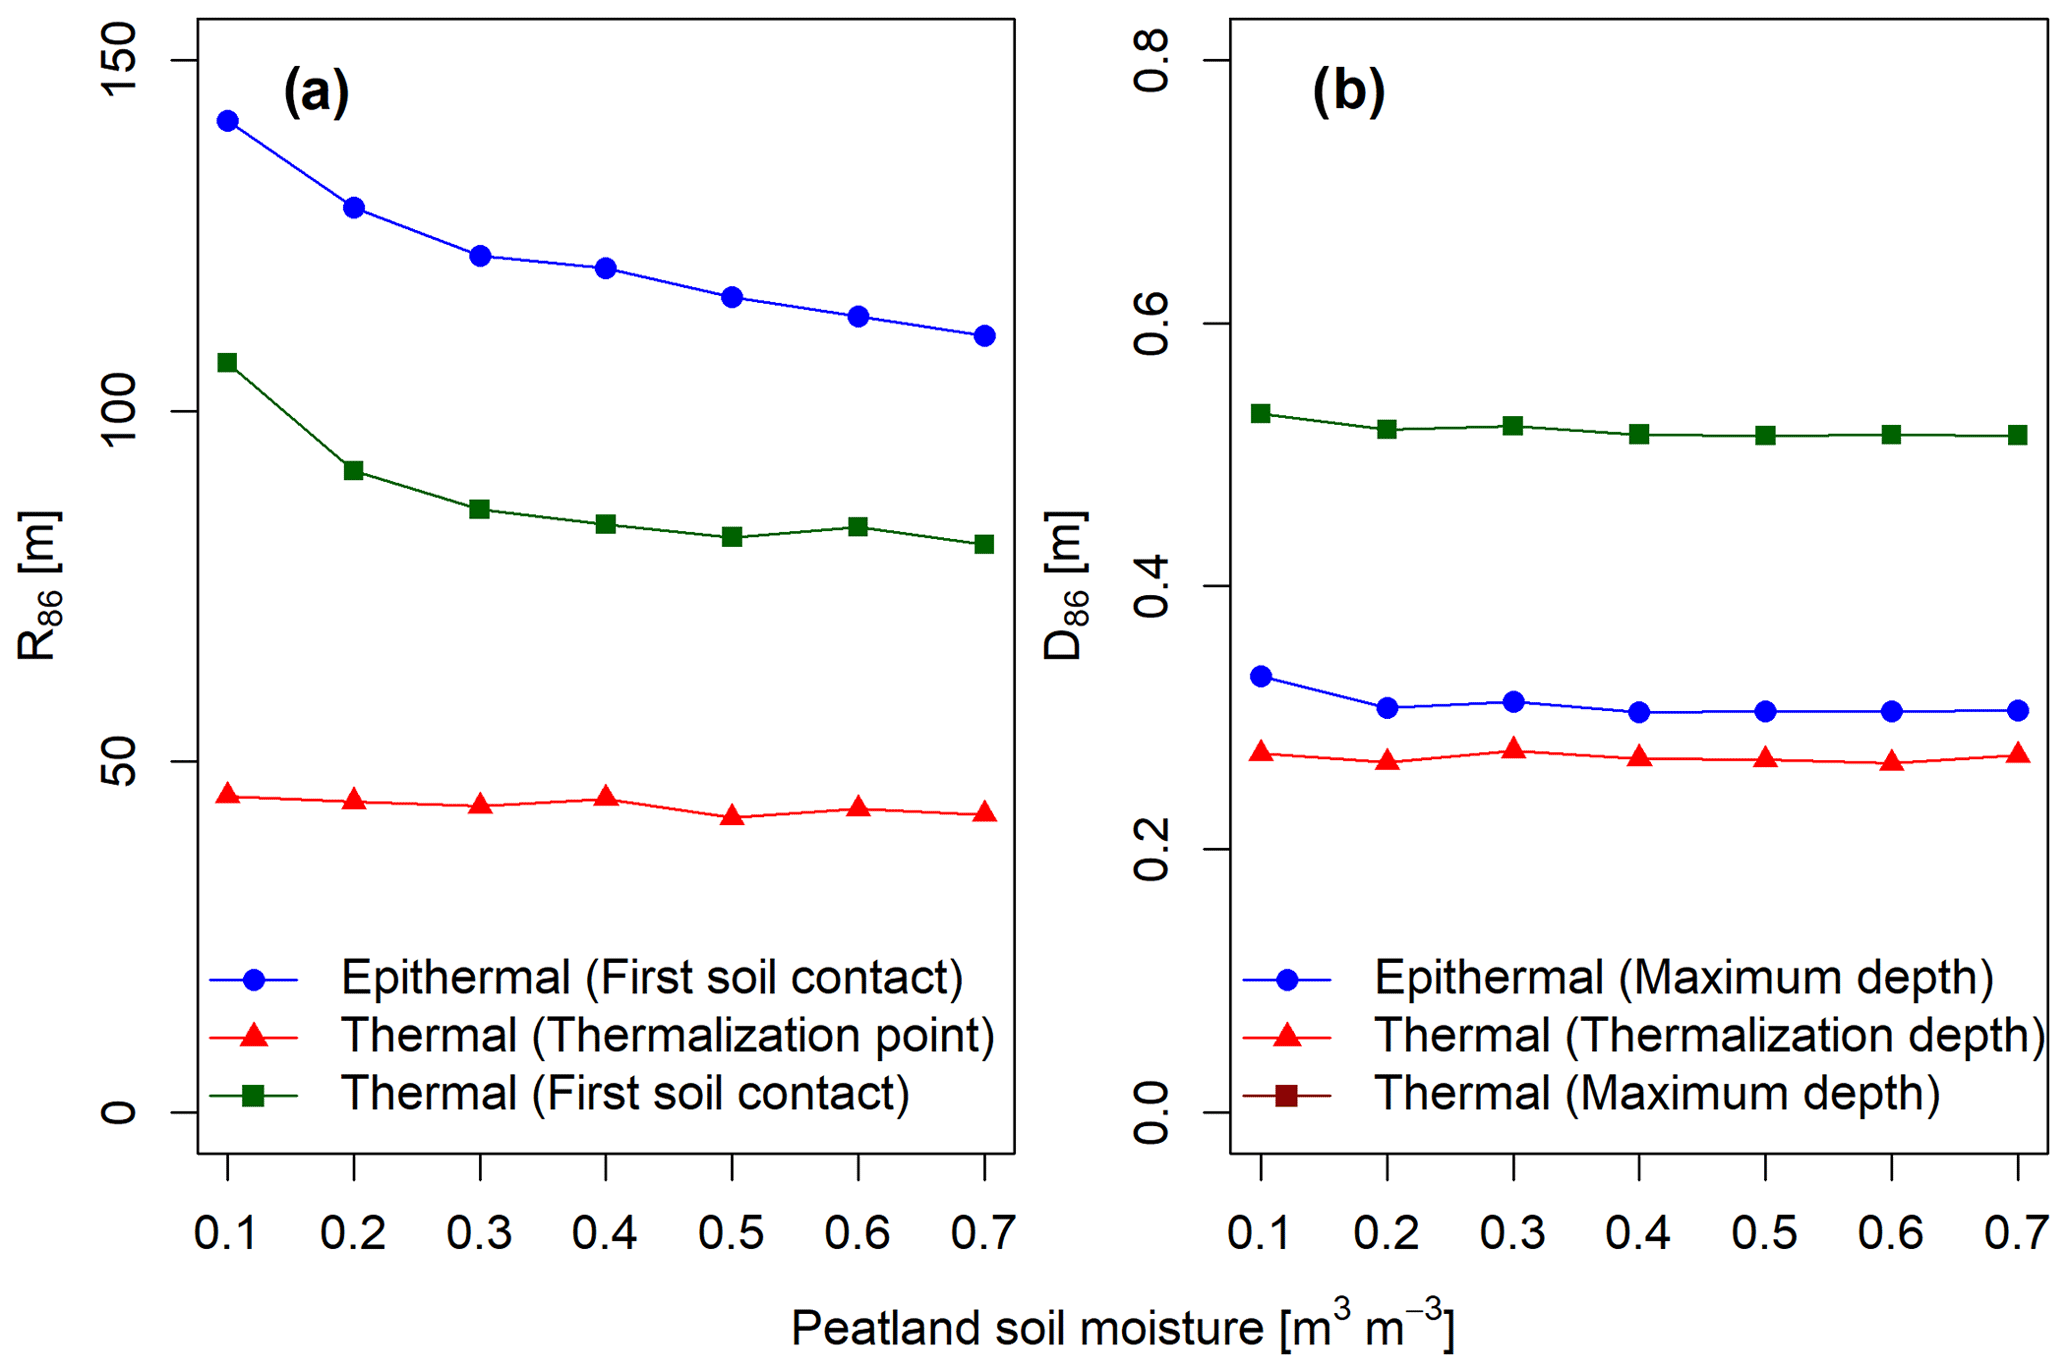
Figure 3Simulation results for the measurement footprint radius (a) and depth (b) of detected thermal and epithermal neutrons.
The number of neutrons detected by the virtual detector decreases with increasing soil moisture in the peatland soils (Fig. 4) during the different simulation scenarios from 0.1 to 0.7 m3 m−3. The total number of detected neutrons, i.e. of neutrons with any origin in the model domain, illustrates the decrease in detected epithermal and thermal neutrons with increasing peatland soil moisture and a generally lower number of detected thermal neutrons (Fig. 4). The number of detected epithermal neutrons decreases by 10.3 %, from about 27 700 to 24 800, in the 0.1 and 0.7 m3 m−3 scenario. The number of thermal neutrons detected decreases to a lesser degree, by 5.4 %, from about 25 200 to 23 800. Thus, the total number of epithermal neutrons decreases 1.9 times more than the number of thermal neutrons with increasing far-field soil moisture.
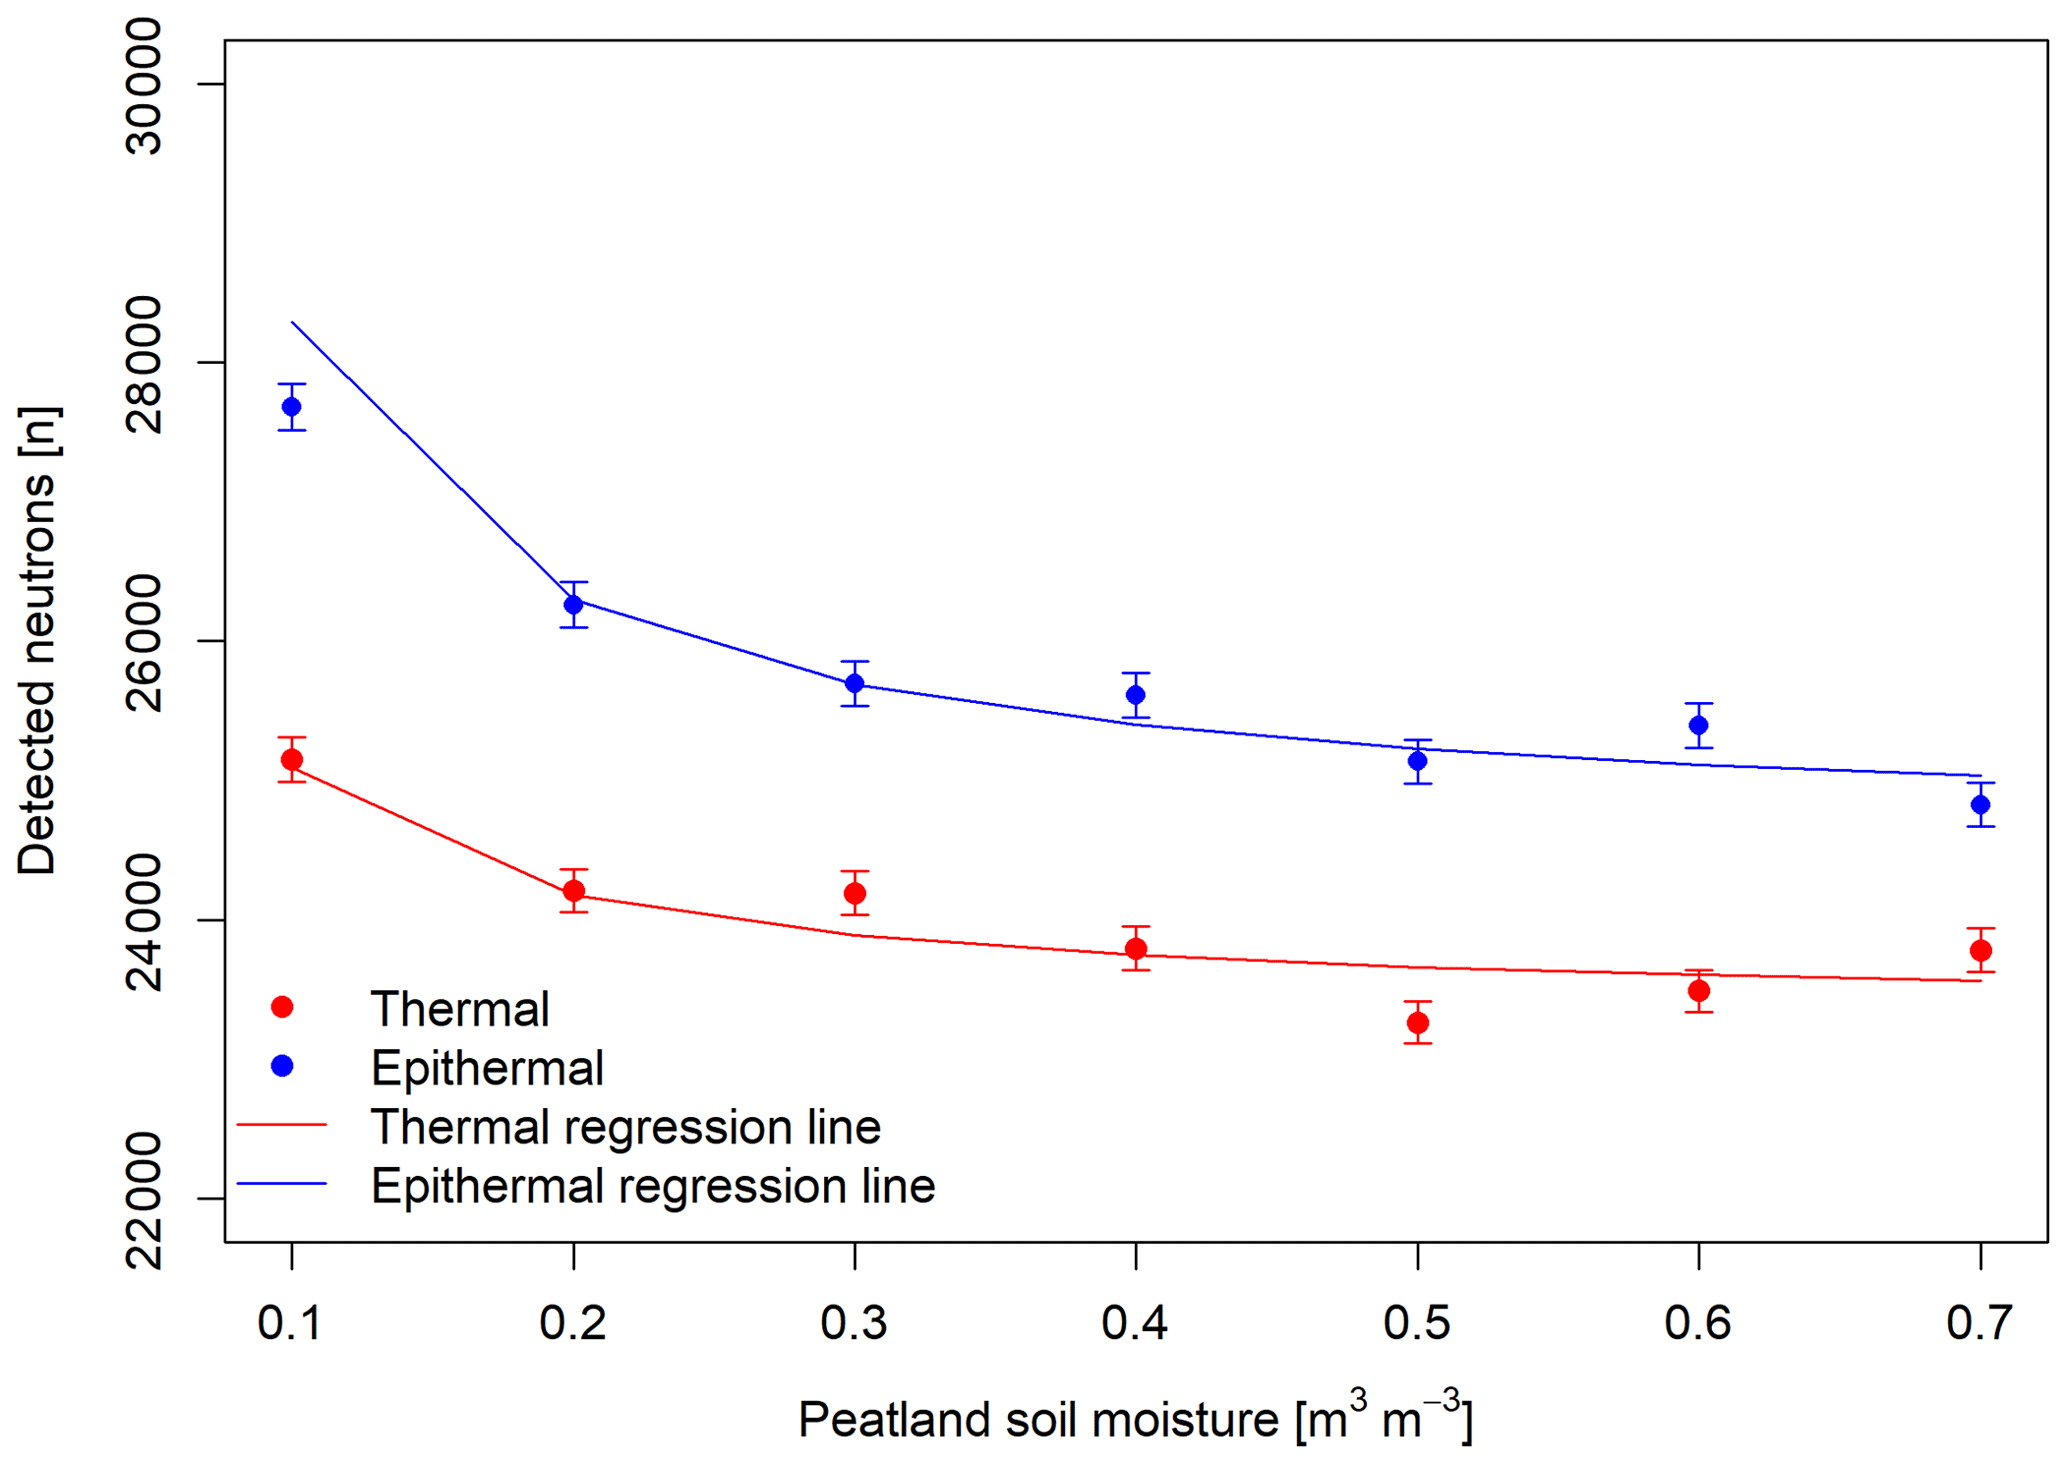
Figure 4The total number of neutrons in the thermal and epithermal energy range observed by the virtual detector per simulated peatland soil moisture.
The visible influence of far-field soil moisture variations on both epithermal and thermal neutrons raises the question of the impact on the fraction of detected neutrons, i.e. the fraction of detected neutrons originating from areas covered with peatland soils and minerals soils. We investigated the influence of peatland soil moisture variations in the far field on the fractional contribution to the total number of thermal neutrons when either the point of thermalization or the point of first soil contact is considered as being the origin of the specific neutron. The latter represents the position of the first soil contact of a neutron within its life cycle in the model domain, i.e. the position at which the simulated neutron had its first soil contact before it further slowed down and reached the virtual detector as a neutron with thermal energy. For detected epithermal neutrons, the fraction of neutrons with peatland origin decreases with increasing peatland soil moisture from 19 % to 12 % and contributes, on average, 14 % to the total number of detected epithermal neutrons (Fig. 5). For thermal neutrons, the fraction of neutrons originating from peatland areas depends on the definition of the point of origin. If the point of thermalization is used, then the average fraction of thermal neutrons originating from peatland areas is much lower at only 4 %. Furthermore, the fraction does not change with increasing peatland soil moisture. In contrast, if the point of first soil contact is used for thermal neutrons as well, then the contribution of thermal neutrons with peatland origin decreases from 14 % to 8 % with increasing soil moisture. On average, the contribution from peatland is 10 %.
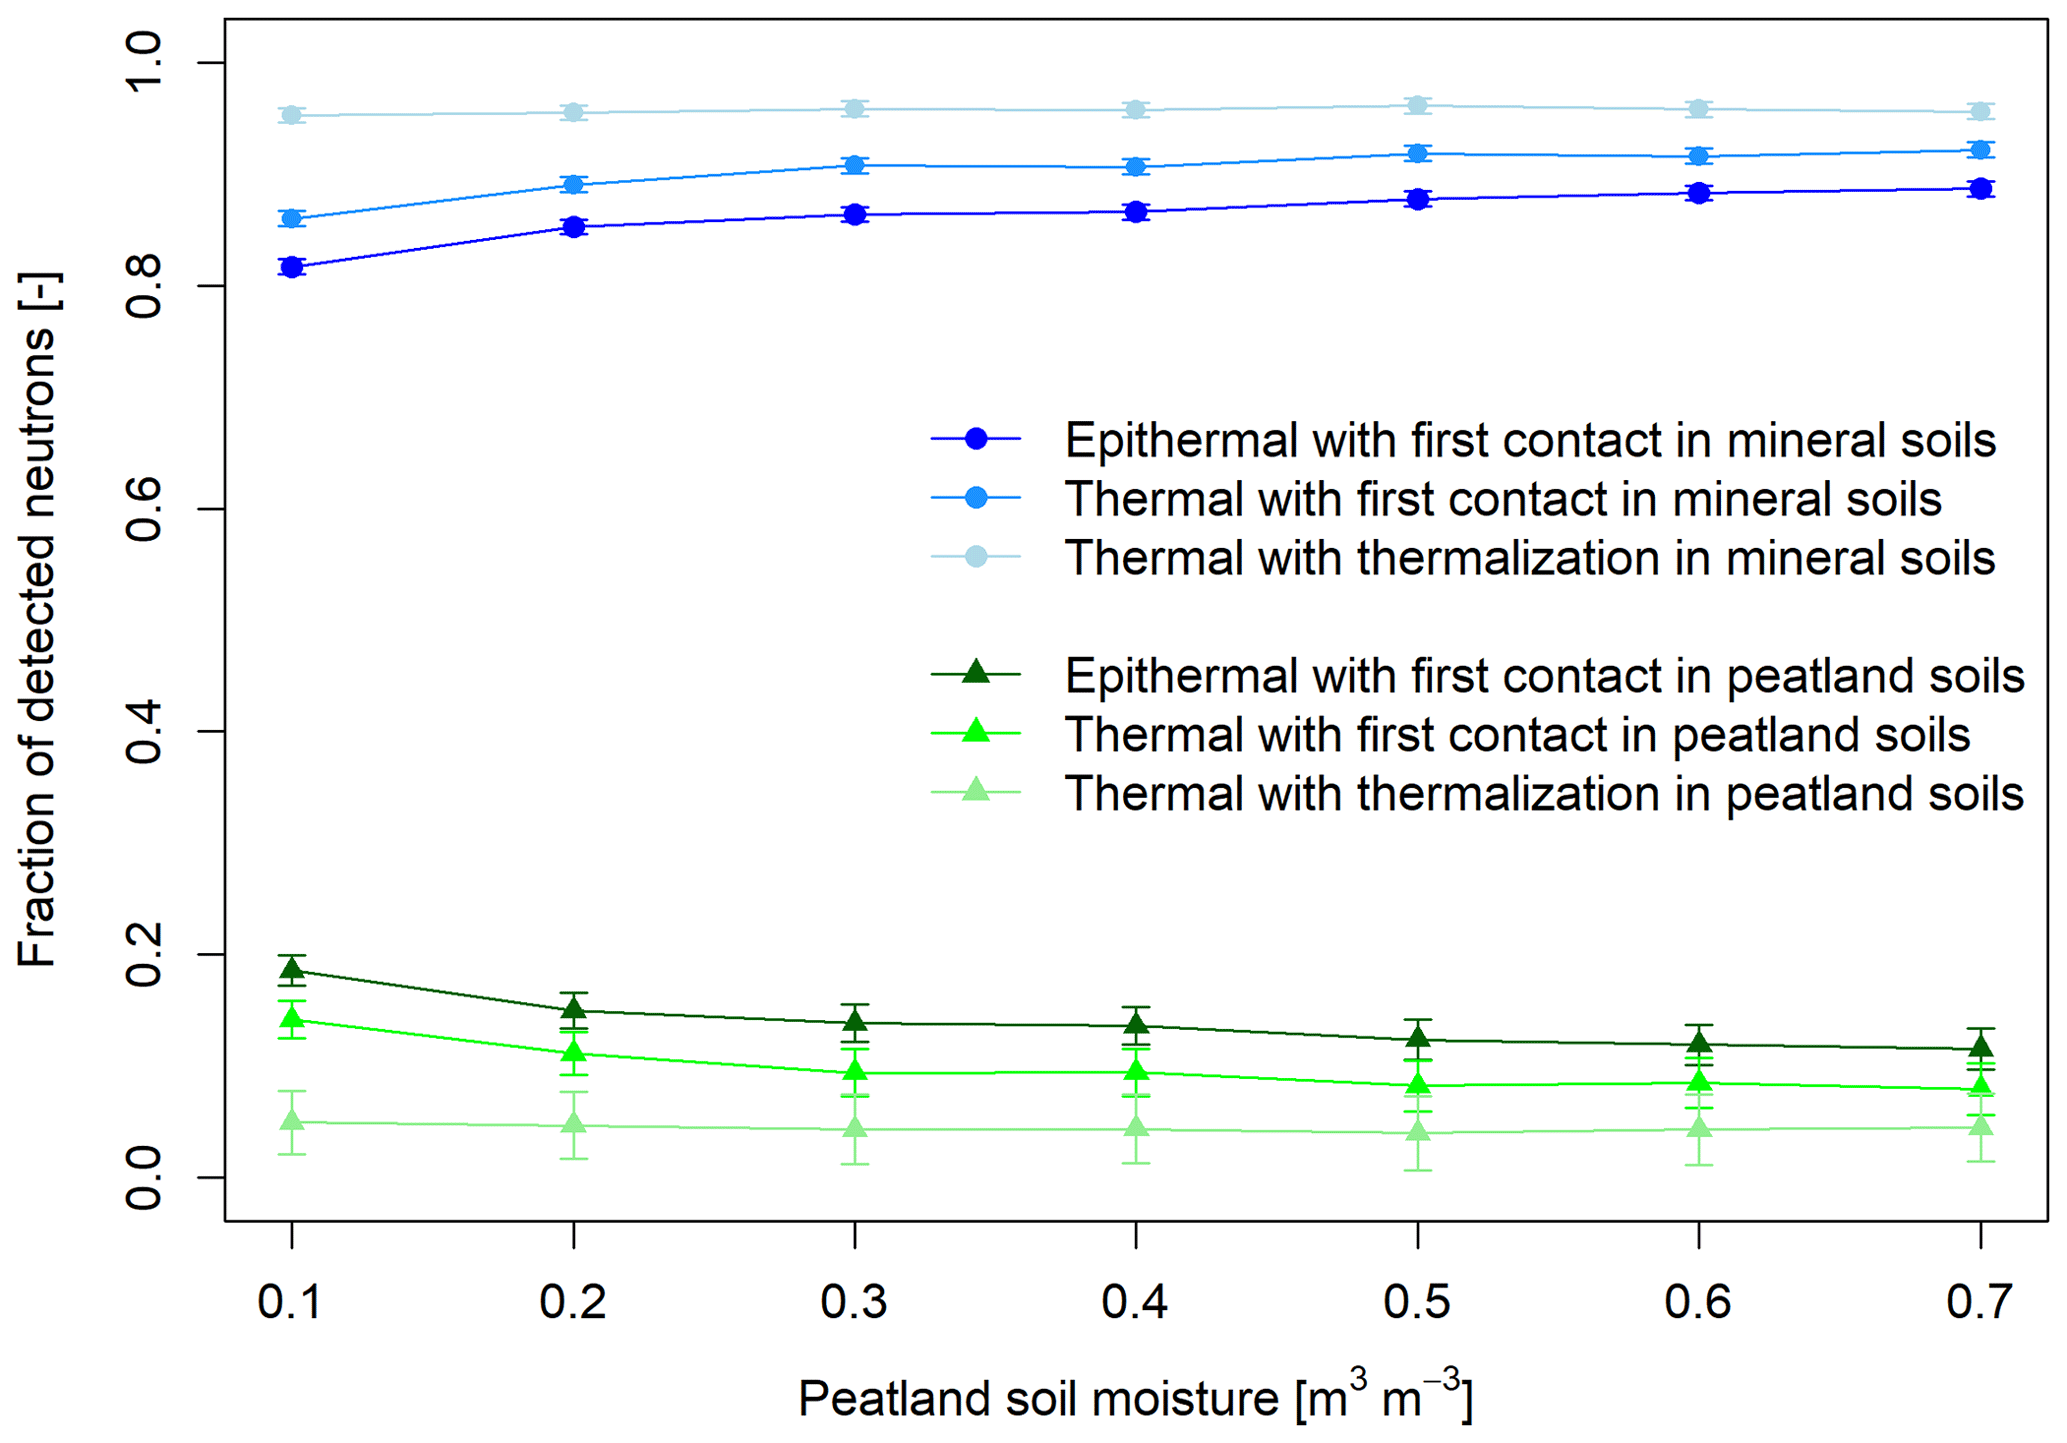
Figure 5The fraction of detected epithermal and thermal neutrons with increasing soil moisture originating from areas covered with peatland soils and mineral soils in the model domain. For epithermal neutrons, the point of origin is defined as the point of first soil contact, while for thermal neutrons, both calculations for the point of first contact and the point of thermalization are shown.
3.2 Simulated neutron response to soil moisture changes in both near-field mineral and far-field peatland soils
In addition to keeping soil moisture values in mineral soils of the near-field constant, we simulated a second set of scenarios where both near-field and far-field soil water contents were adjusted (Table 1). The results of the measurement radius and depth for the same decrease in soil moisture in areas covered with mineral soils and peatland soils can be found in Fig. 6. The epithermal R86 does not show a visible increase if soil moisture is reduced equally and reveals an average footprint radius of 117 m. An increase in the R86 can be observed when soil moisture is decreased by twice as much in the peatland soils compared to the decrease in the mineral soils. In this case, R86 increases from 118 to 128 m. A similar behaviour can be observed for thermal neutrons if the point of first soil contact is considered as the origin in the model domain. While in this case the R86 remains constant at 81 m if soil moisture is decreased equally in mineral and peatland soils, R86 increases from 80 to 92 m when soil moisture is reduced by twice as much in peatland compared to mineral soil areas. Similar to the simulation set described in the previous chapter where the soil moisture is kept constant in the near-field, the thermal R86 is much smaller and does not change with varying soil moisture when the point of thermalization is considered. It remains constant at an average value of 43 m for the simulation sets where soil moisture is decreased both equally and unequally.
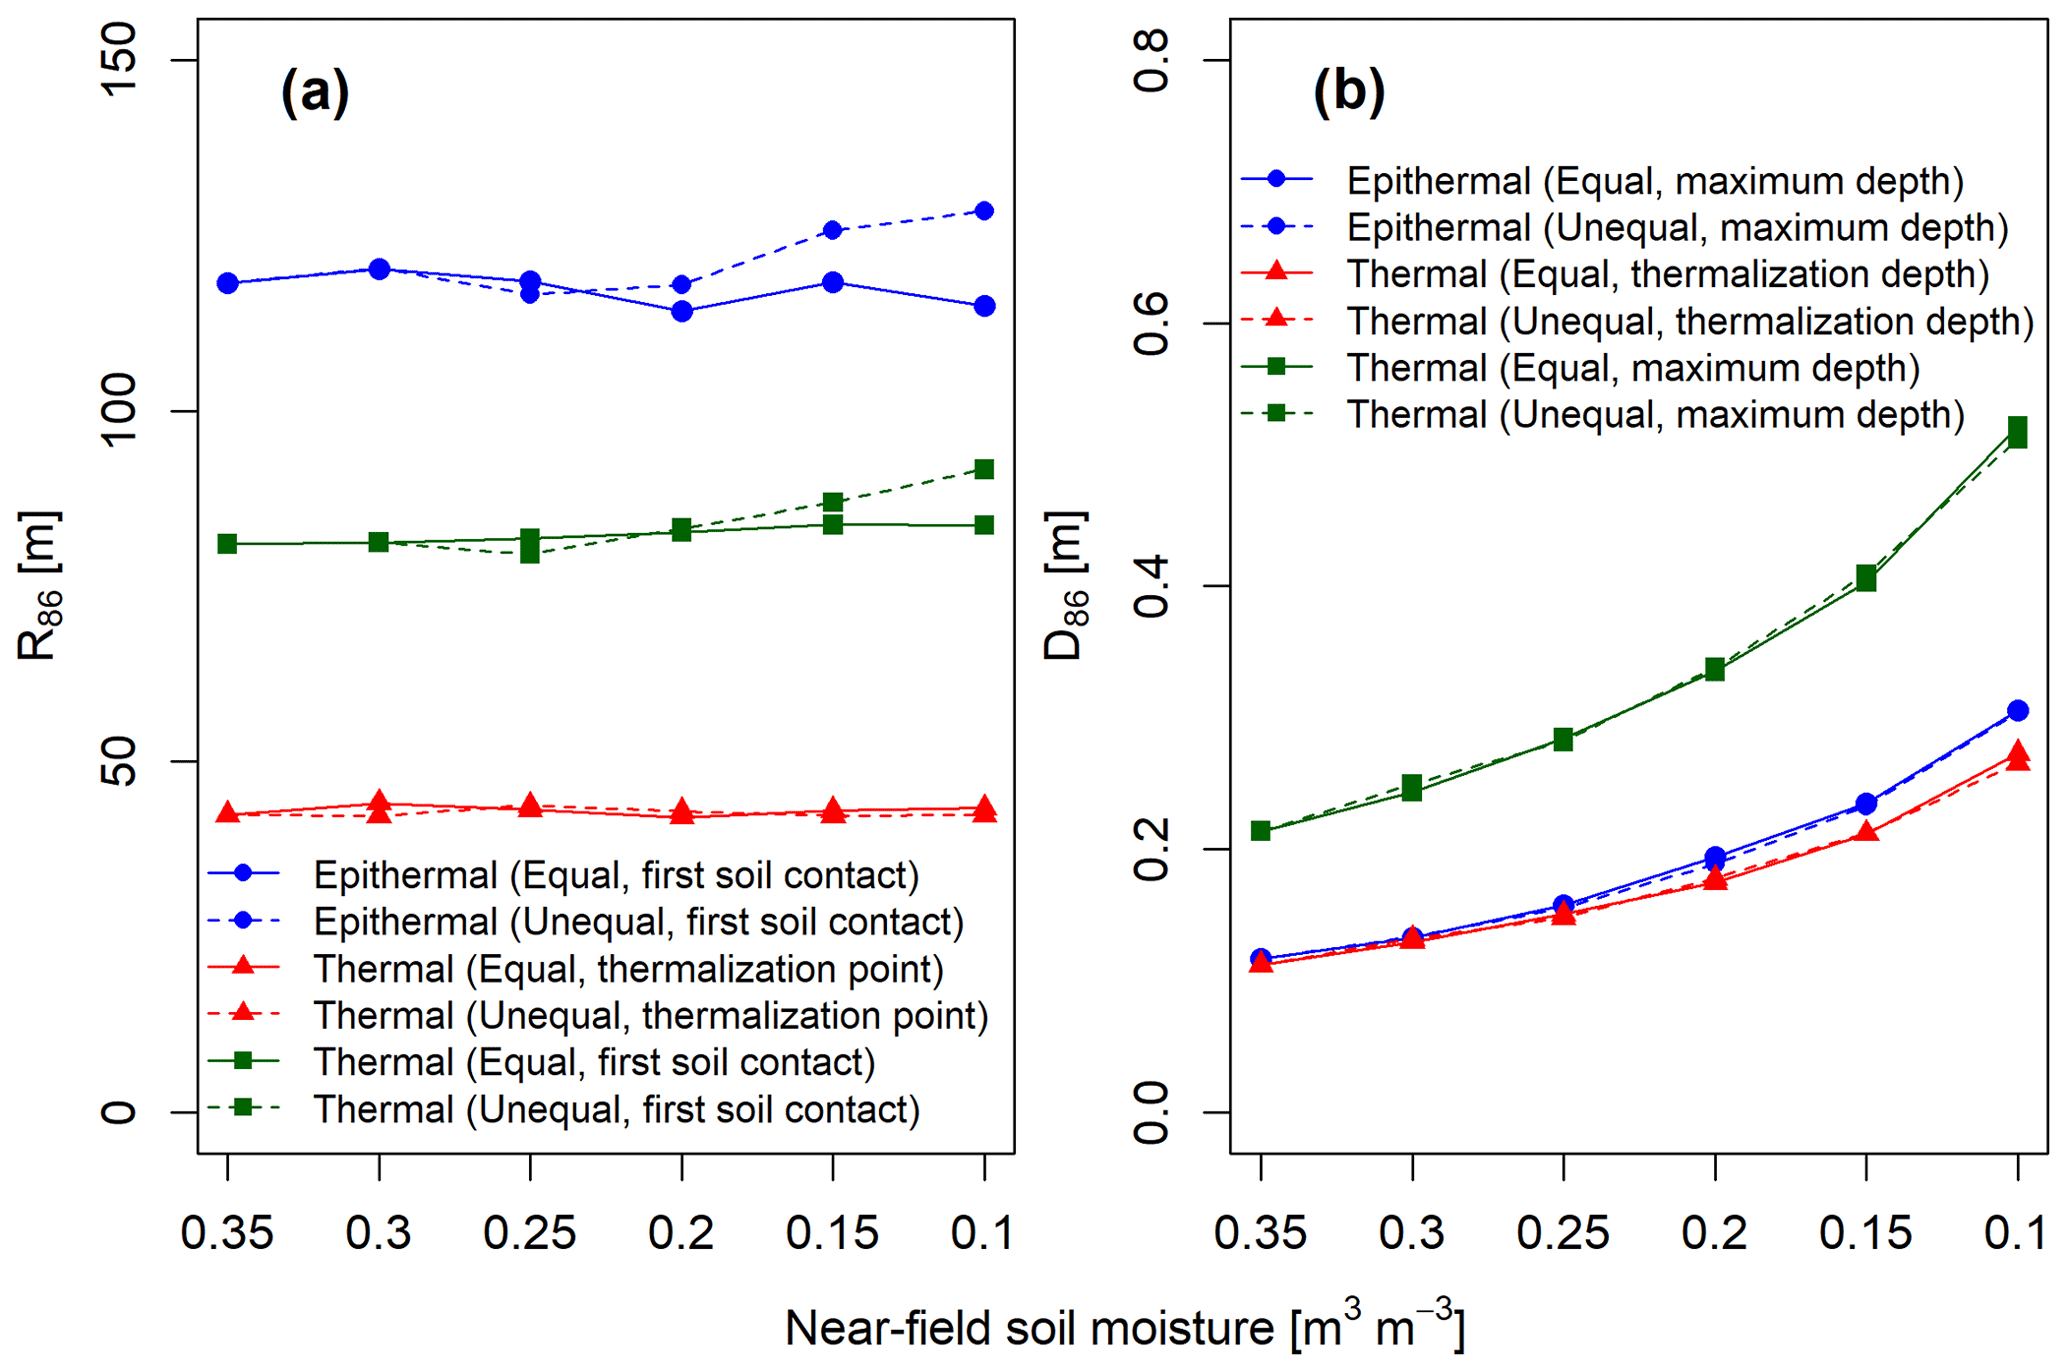
Figure 6The simulated measurement footprint radius R86 (a) and depth D86 (b) of thermal and epithermal neutrons when soil moisture in areas with mineral and peatland soils decreases by the same amount (solid lines) and when peatland soil moisture decreases twice as much (dashed lines).
Unlike for the previous scenarios with constant near-field soil moisture, the measurement depth varies noticeably in both neutron energy ranges when soil moisture is also reduced in the near-field of the neutron detector. The epithermal integration depth D86 increases from 0.12 to 0.3 m, while the thermal integration depth changes from 0.11 to 0.27 m if the depth of the point of thermalization is used to define the measurement depth. In contrast, if the thermal integration depth is calculated as it is done for epithermal neutrons, by using the maximum depth along the neutron transport path, then the thermal integration depth becomes much larger and exceeds the integration depth of epithermal neutrons. It increases from 0.21 to 0.52, if soil moisture is reduced equally, and to 0.51 m, if soil moisture is reduced unequally, in near-field mineral and far-field peatland soils.
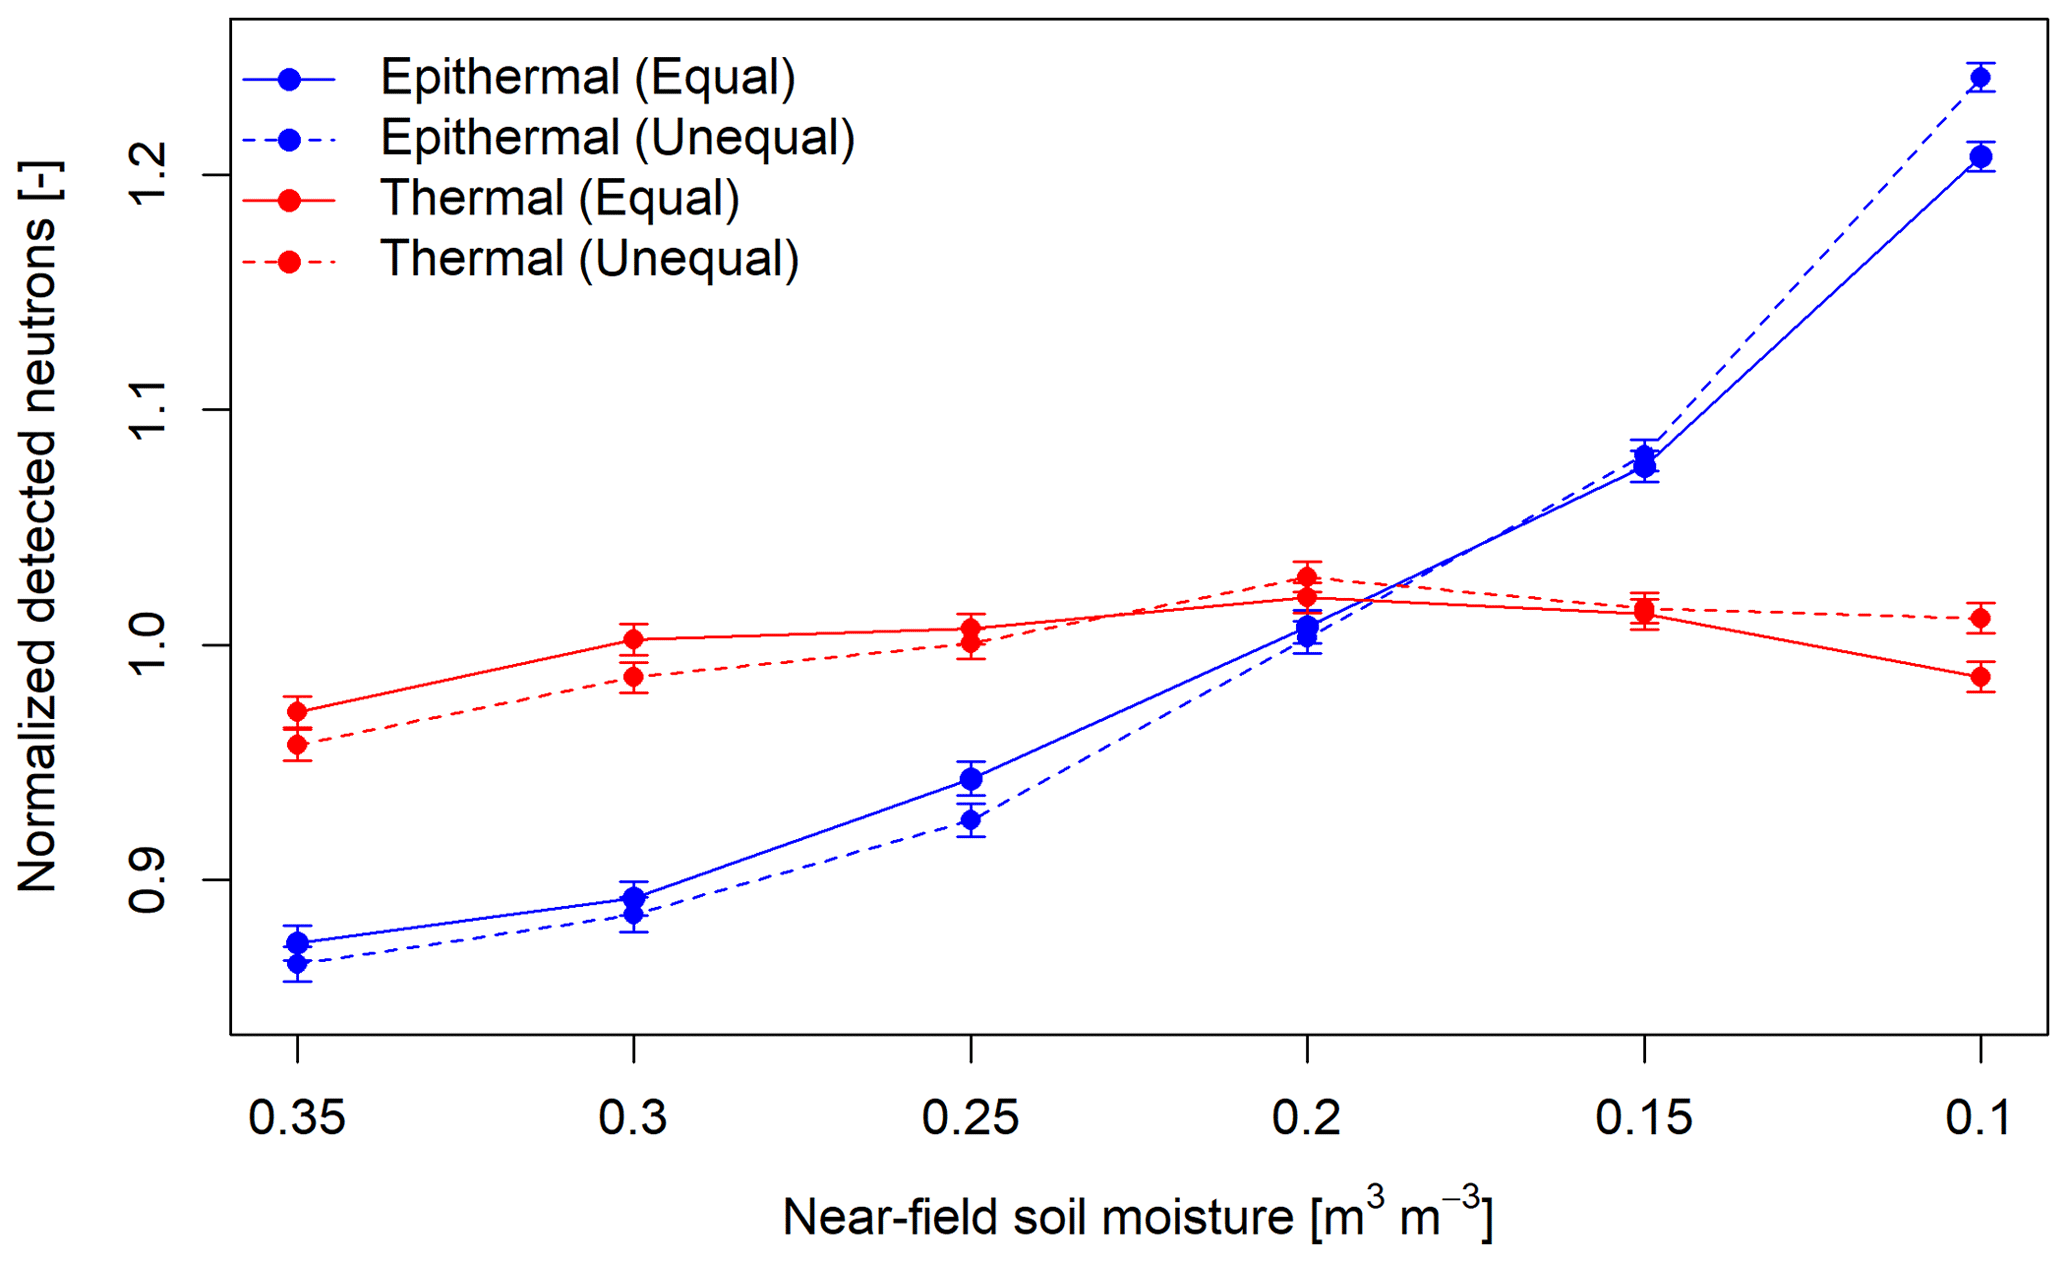
Figure 7The simulated normalized thermal and epithermal neutron response when soil moisture in areas covered with mineral and peatland soils decreases at equal intervals (solid lines) and when peatland soil moisture decreases twice as much (dashed lines).
A stronger increase in the detected epithermal neutrons normalized by the average detected neutrons of all simulation scenarios for sets 2 and 3, respectively, can be observed when soil water contents decrease twice as fast in peatland soils compared to mineral soils (Fig. 7). Simulated thermal neutrons exhibit a more complex behaviour because the number of thermal neutrons increases with decreasing soil moisture in the model domain when the general soil water content is high; however, when the overall soil moisture in the model domain is low, the detected thermal neutrons tend to either remain constant or even decrease if the soil moisture decrease is stronger in peatland soils. Overall, the thermal neutrons tend to increase with decreasing soil water content.
3.3 Relationship between thermal and epithermal neutron observations
Spearman's rank correlation coefficient is calculated between the normalized corrected hourly intensities of thermal and epithermal neutrons for the observation site (site A; Fig. 8a) and, for comparison, also at the two other nearby CRNS observation sites (sites B and C; Fig. 8b and c). The Spearman rank correlation coefficient for the other two sites is 0.95, showing a high correlation between the neutrons observed by the shielded (epithermal) and unshielded (thermal) counter tube. In contrast, the correlation coefficient at our main observation site is much lower, with only 0.58 (Fig. 8). Figure 8 illustrates the relationship between the relative observed neutron intensities in both energy ranges per study site. Apart from having higher Spearman's rank correlation coefficients, the point clouds for both sites that are assumed to have a more uniform soil moisture (Fig. 8b and c) are close to the 1:1 line, although a slight non-linearity is visible. In contrast, the scatterplot for site A (Fig. 8a) reveals a strong heteroscedasticity, with deviations occurring during high relative neutron count rates in the epithermal and thermal energy range.
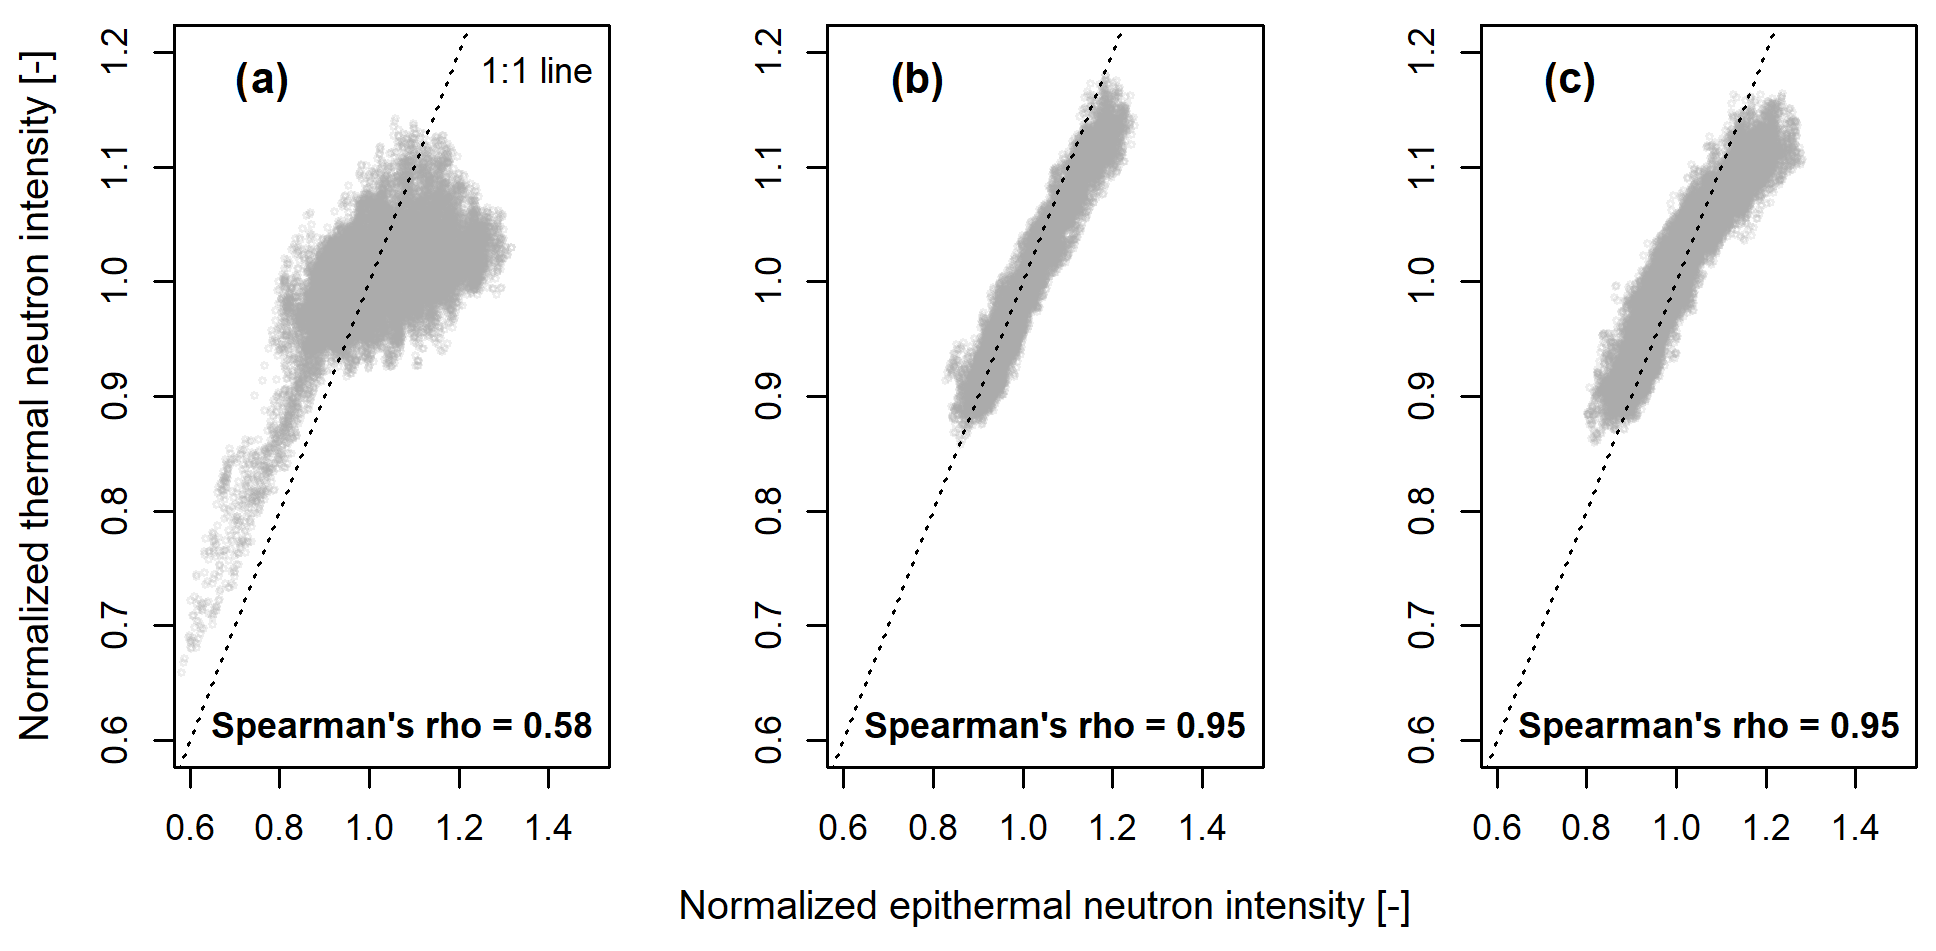
Figure 8Relationship between observed normalized thermal and epithermal neutron intensity at the three CRNS sites, namely (a) site A, the main study site, (b) site B (soil moisture assumed to be uniform) and (c) site C (soil moisture assumed to be uniform). Normalized intensities were calculated by dividing by the respective time series mean.
Adding the simulated normalized detected neutrons to the scatterplot of site A results in all simulated data points being located within the range of the observed values (Fig. 9). Data points of simulation sets 2 and 3 with varying near-field soil moisture cross the 1:1 line, while the data points of simulation set 1, where the near-field soil moisture was kept constantly low, remains on the right side of the 1:1 line.

Figure 9The relationship between normalized thermal and epithermal neutron intensities for in situ observations, and the relationship between the normalized detected epithermal and thermal neutrons for simulated data. The simulated values refer to the simulation set and scenarios summarized in Table 1. Simulated neutrons are normalized by the average number of detected neutrons of all simulations in the respective energy range.
3.4 Estimation of soil moisture from observed neutron intensities
We estimated the soil moisture time series from the CRNS signal with three different calibration approaches. We first applied the standard calibration approach by using the corrected epithermal neutron intensities (NE) and iteratively calibrating N0 in Eqs. (2)–(5). We then compared this standard approach to alternative approach 1, where NE is used but all parameters (N0, a0, a1, a2) from Eqs. (2)–(5) are adjusted. Last, we compare the standard calibration approach and alternative approach 1 with alternative approach 2. Here, we rescale the epithermal neutron intensity (NE) by calculating the normalized sum of the thermal and epithermal neutrons (NET), based on Eq. (6), and use the rescaled neutron intensities in Eqs. (2)–(5) by iteratively calibrating N0. The approaches are applied by using a depth–distance weighted reference soil moisture time series and the arithmetic average of the reference measurements, which result in the statistical goodness of fit presented in Table 2.
Table 2Statistical goodness of fit when calibrating Eqs. (2)–(5) with (applying) the three different calibration approaches.
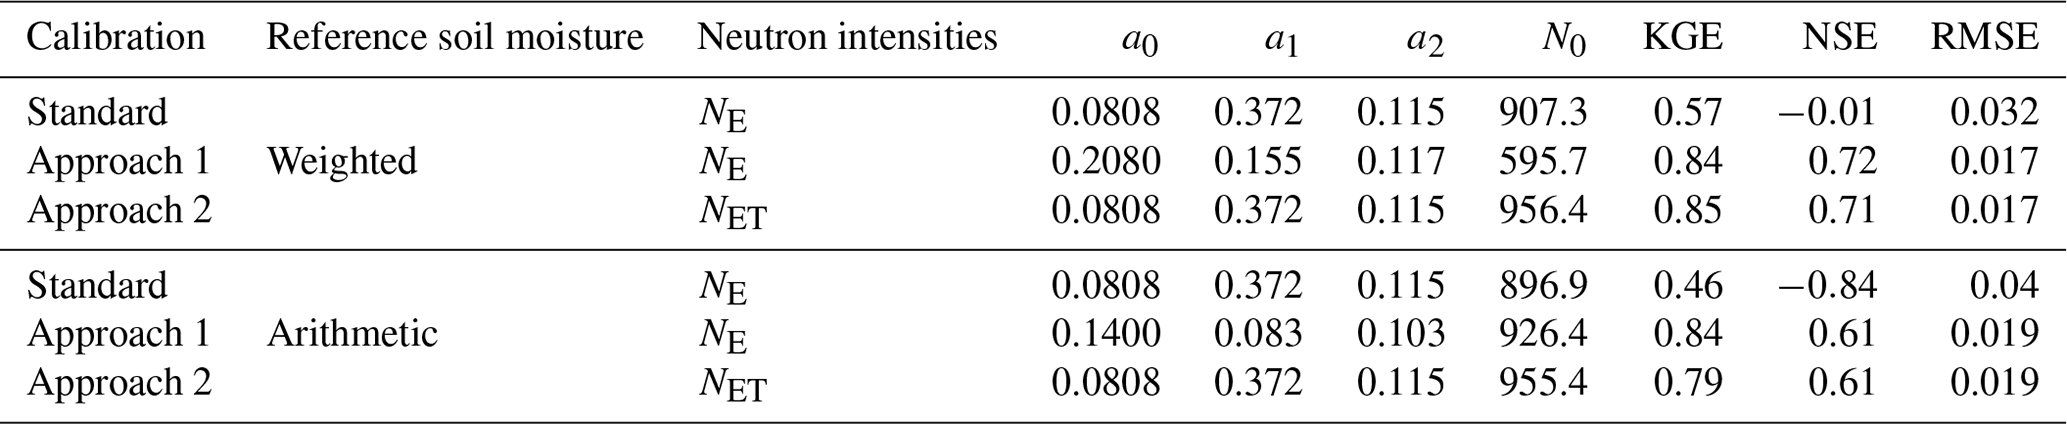
The calibration of the CRNS-derived soil moisture time series by iteratively adjusting N0, based on the standard calibration approach and a weighted reference soil moisture time series, results in a KGE of 0.57 (Table 2). When all variables are adjusted in alternative approach 1, the KGE can be increased to 0.84. Similarly, the KGE increases to 0.85 when alternative approach 2 with rescaled neutron intensities NET is applied. This improvement is also expressed by a higher Nash–Sutcliffe efficiency (NSE) and lower root mean square error (RMSE) for alternative approaches 1 and 2, either by using a rescaled neutron time series NET and only adjusting N0 or by using NE and tuning all the parameters. In contrast, using the arithmetic average reference soil moisture time series leads to a lower KGE of 0.46 compared to the calibration against a depth–distance weighted average with the standard calibration approach. However, the KGE again increases strongly if either alternative approach 1 or alternative approach 2 are optimized against the arithmetic average of reference soil moisture observations to generate a CRNS-derived soil moisture time series. The derived KGE increases to 0.84 and 0.79, respectively, which is close to the goodness of fit derived using the weighted reference soil moisture time series. Similarly, the additional goodness-of-fit parameters for NSE and RMSE improve when using alternative approaches 1 and 2 instead of the standard approach. In general, for alternative approaches 1 and 2, the calibration result in terms of the KGE improves by at least 0.25 over the 4-year study period when compared to the standard calibration approach (see also Fig. A1 and Table A1).
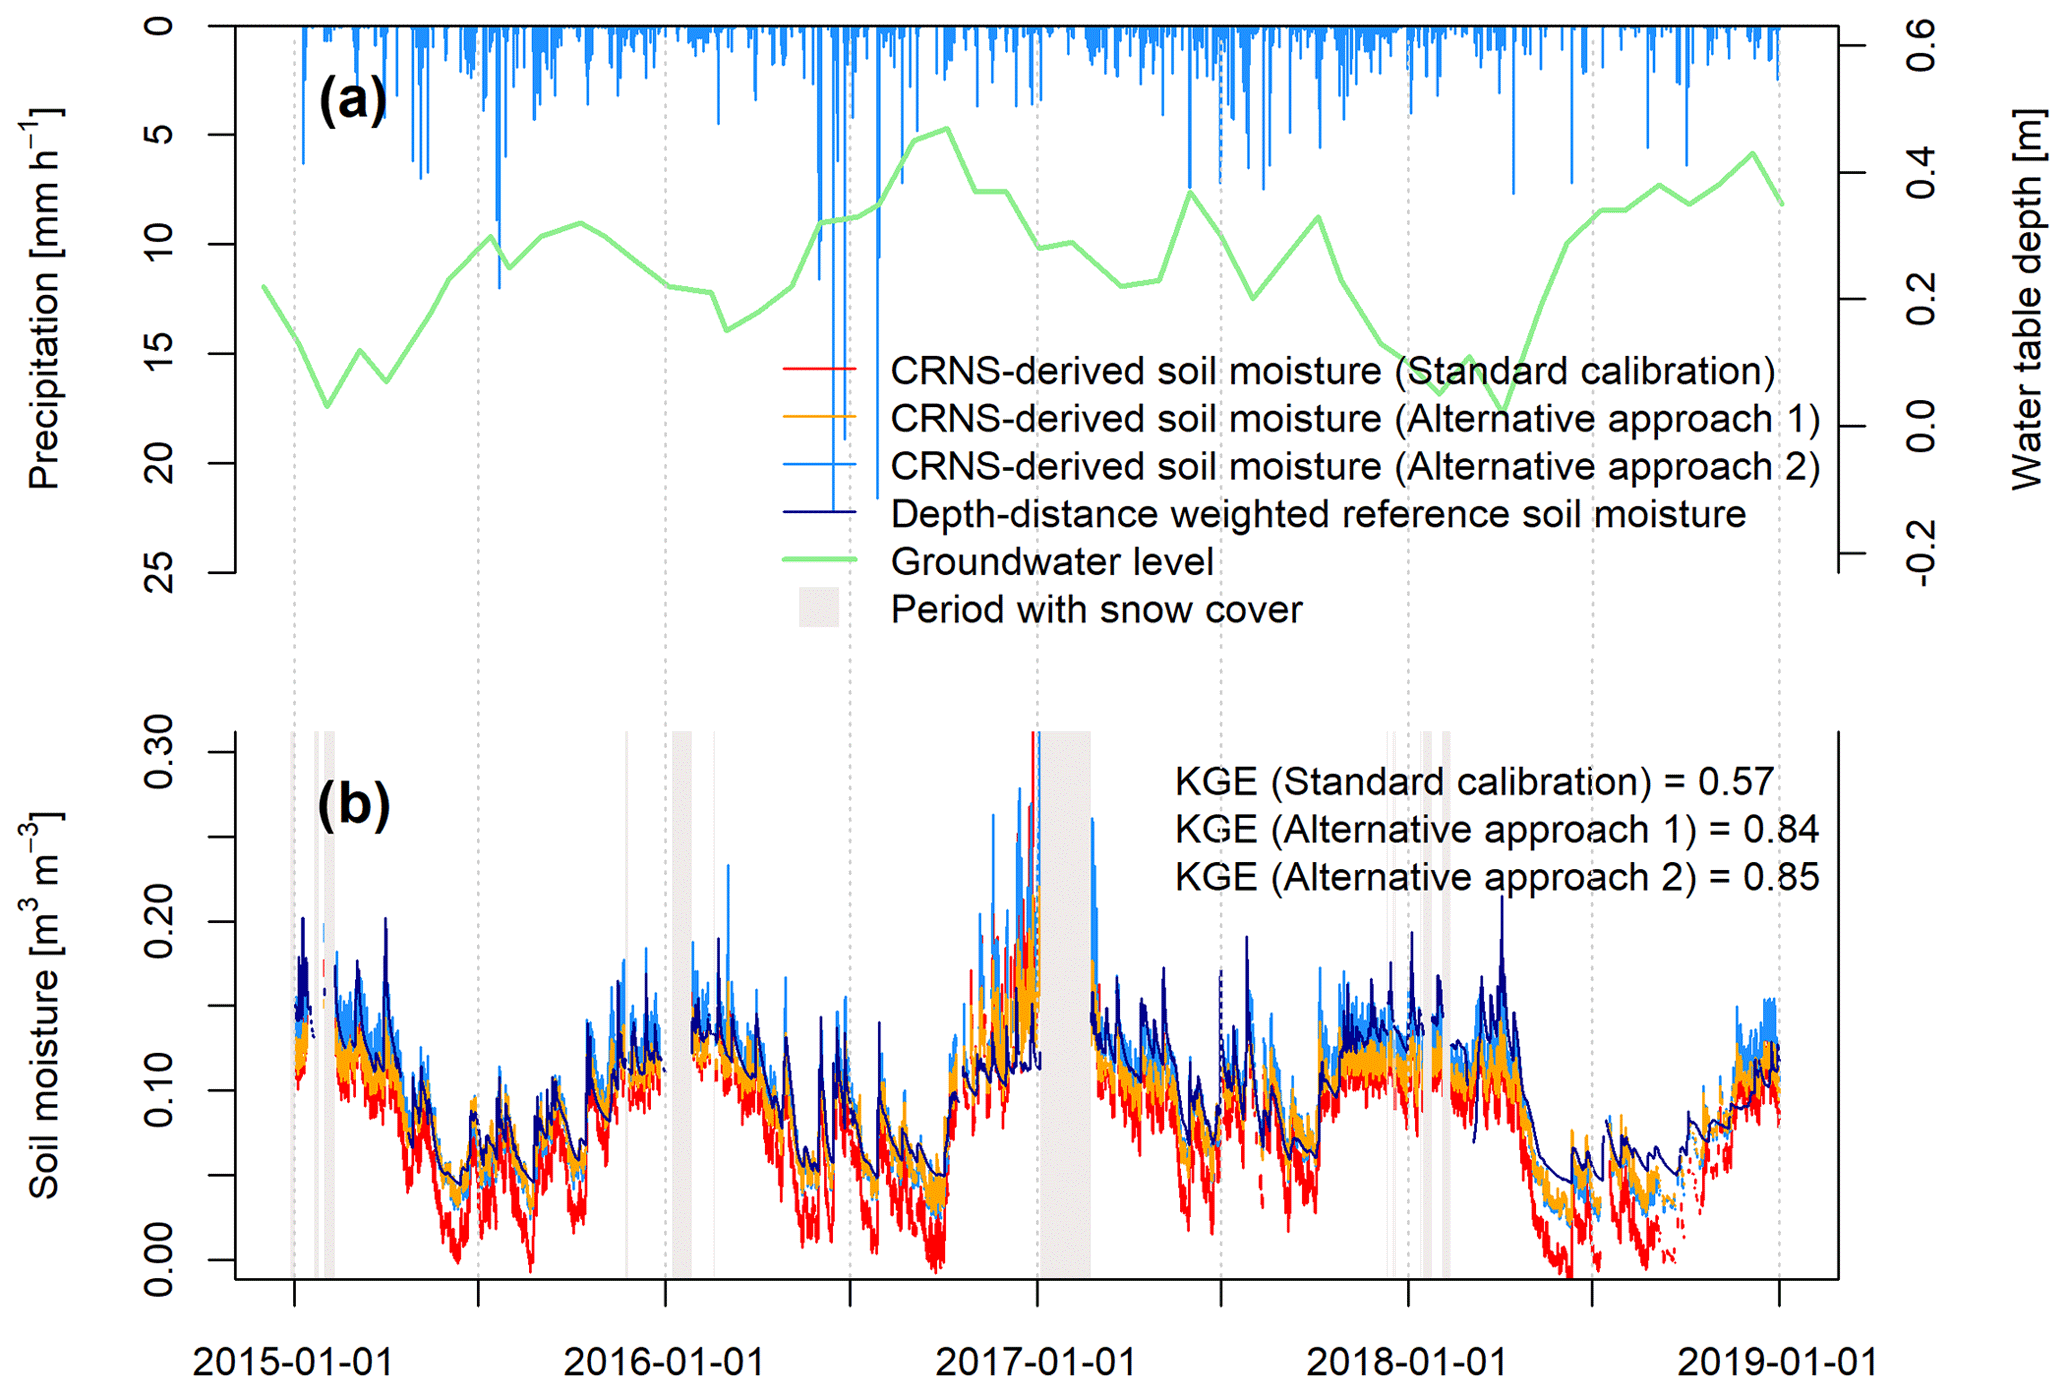
Figure 10On-site observed hourly rainfall sums (a) and CRNS-derived soil moisture time series based on the standard calibration approach, as well as calibration approaches 1 and 2, in comparison to the depth–distance weighted reference soil moisture time series derived from SMT-100 sensors (b).
The CRNS-derived soil moisture time series based on the three calibration approaches both over- and underestimate the dynamics of the weighted reference time series (Fig. 10). The largest differences from using the standard calibration approach to either tuning all parameters of the transfer function in alternative approach 1 or applying the rescaled NET in alternative approach 2 occur in summer periods when the weighted near-field reference soil moisture is generally low. In these periods, using NE in the standard calibration approach results in a distinct underestimation of the reference soil moisture, while both alternative calibration approaches produce a CRNS-derived soil moisture time series fitting the weighted reference more closely (Fig. 11). In contrast, differences between the CRNS-derived soil moisture time series and the reference time series are less pronounced in winter periods when the near-field reference soil moisture is high.
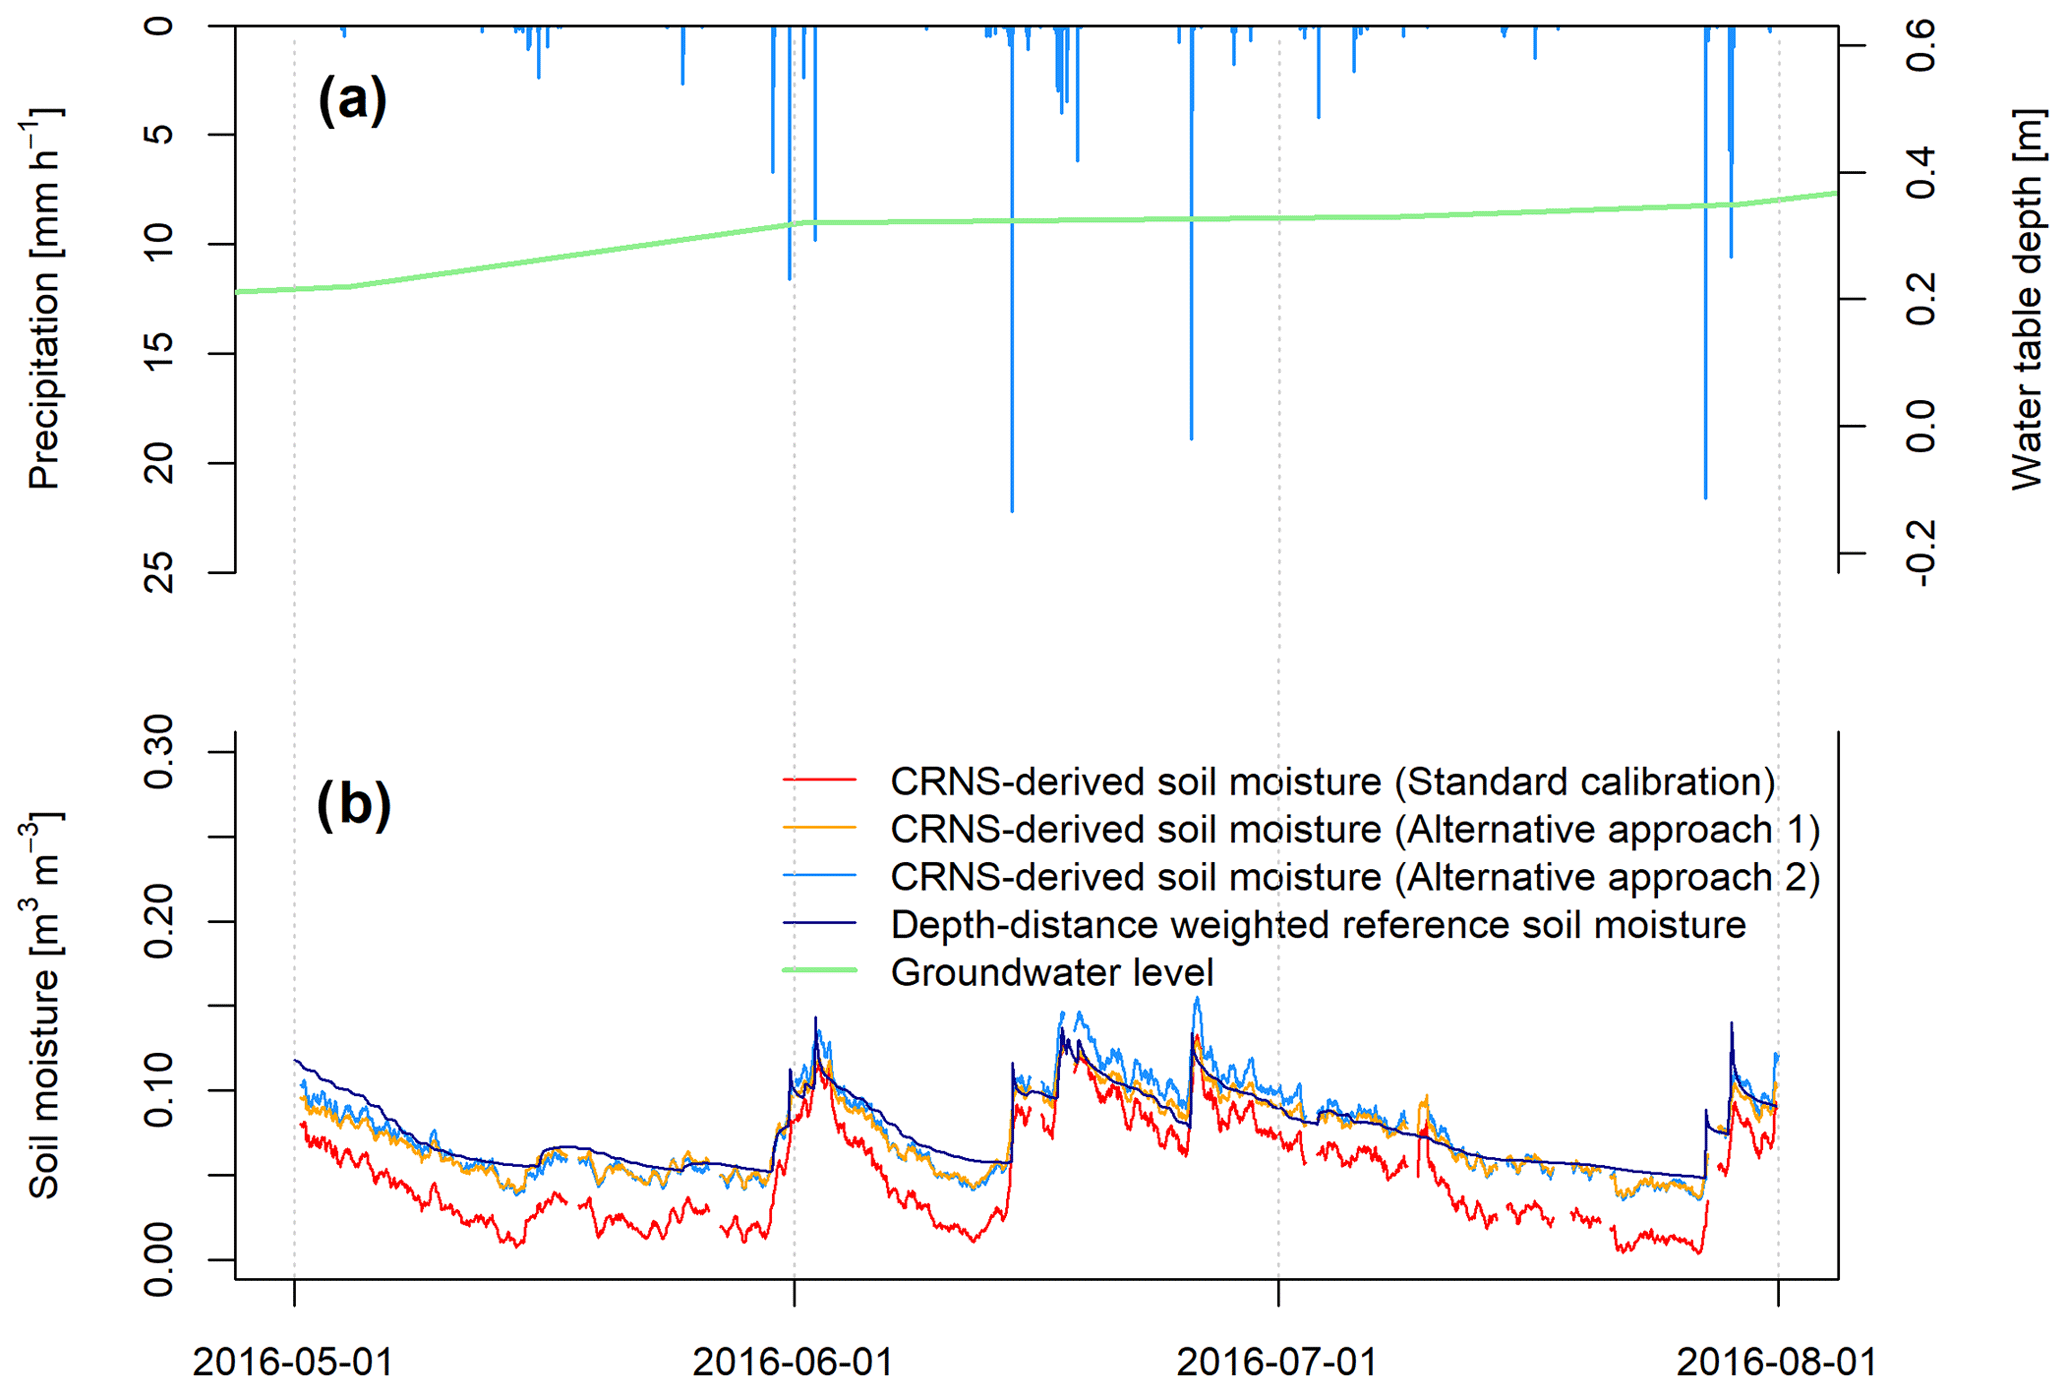
Figure 11On-site observed hourly rainfall sums (a) and CRNS-derived soil moisture time series, based on the standard calibration approach and alternative approaches 1 and 2, in comparison to the depth–distance weighted reference soil moisture time series derived from SMT-100 sensors (b) for a 3-month period in the summer of 2016.
Although differences between the CRNS-derived soil moisture time series vary seasonally, an overall closer fit to the weighted reference time series can be achieved when estimating soil moisture based on the two tested approaches for improving calibration against near-field reference measurements as previously illustrated by the statistical goodness-of-fit parameters. Last, we compared the CRNS-derived soil moisture time series based on the three calibration approaches. A bootstrapping of the residuals and subsequent Wilcoxon rank sum tests per time step revealed significant differences (p<0.05) between CRNS-derived soil moisture time series calculated from the standard calibration approach and the two alternative approaches tested for improving the calibration. For both alternative calibration approaches and both reference soil moisture time series, the CRNS-derived soil moisture time series are significantly different from the time series based on the standard calibration approach for at least 97 % of the time steps.
4.1 Neutron-energy-dependent variations in footprint size and neutron intensity
Our neutron transport simulations resulted in footprint radii of epithermal neutrons, which lie in the ranges reported by Köhli et al. (2015) and are shown in Schrön et al. (2017), for all simulation scenarios. In contrast, little is known about the measurement footprint radius of thermal neutrons. Previous studies assume a similarly sized footprint (e.g. Vather et al., 2020) or a significantly smaller measurement radius (e.g. Bogena et al., 2020). Our simulation results reveal that the derived measurement radii strongly depend on the definition of the point of origin of the thermal neutrons detected by the virtual neutron detector. If the point of thermalization is used to calculate the measurement radius R86, then the footprint radius has an average size of about 43–44 m and only exhibits a slight response to changes in soil moisture. This estimate comes close to what is stated in Bogena et al. (2020) and lies in the range of what was recently reported by Jakobi et al. (2021). In our simulations with constant soil moisture in near-field mineral soils, the fraction of detected neutrons being thermalized in areas covered with mineral soils and peatland soils remains constant, although soil moisture in peatland soils is altered (Fig. 5). This could lead to the interpretation that the footprint of thermal neutrons is too small to cover a significant portion of peatland soils, and thus, peatland soil moisture variations do not influence the simulated thermal neutron intensity. However, even if the footprint based on the point of thermalization is small, an influence of peatland soil moisture variations on the number of thermal neutrons reaching the virtual detector is visible (Fig. 4). As a consequence, the alternative definition may be more suitable. If the point of first soil contact is defined as the origin for both epithermal and thermal neutrons, then the thermal neutron footprint becomes twice as large (compared to using the point of thermalization as the origin). It then covers larger parts of peatland areas, and the fraction of detected thermal neutrons originating from peatland areas changes with varying peatland soil moisture. This definition better explains the variations visible in the detected thermal neutron intensity because the number of detected thermal neutrons generated from higher-energy neutrons with peatland soil contact is likely to vary with peatland soil moisture.
The average measurement depths of epithermal neutrons simulated here also lie in the range of the values reported in previous studies (Zreda et al., 2008; Köhli et al., 2015). For the case of constant soil moisture conditions in the highly sensitive near-field, the average measurement depth of epithermal neutrons only shows a slight decrease with increasing peatland soil moisture. In the scenarios with varying soil moisture contents in both the near-field and the far field, a change in the CRNS measurement depth is clearly visible. The integration depth of the thermal and epithermal neutrons shows a very similar response to soil moisture variations, with thermal neutrons having a slightly shallower D86 when based on the point of thermalization. In contrast, if the maximum depth along the neutron transport path is considered as the measurement depth, then the thermal neutron integration depth becomes nearly twice as deep (compared to epithermal neutrons). This observation might be explained in the following way: after a high-energy neutron enters the soil column, it is slowed down to an epithermal neutron. This epithermal neutron either leaves the soil or is further slowed down to a thermal neutron before then leaving the soil. The deeper in the soil an epithermal neutron is generated by a high-energy neutron, the more likely it will be thermalized before leaving the soil column. Consequently, thermal neutrons might contain information of soil moisture from even greater depths than epithermal neutrons (see Figs. 3 and 6). This would have implications for e.g. soil sampling campaigns for calibration as larger sampling depths might be required if thermal neutrons are of interest. However, little is known about the vertical and horizontal footprint dynamics of thermal neutrons in general, and care should be taken when interpreting the presented results based on a heterogeneous model domain and a narrow range of simulated boundary conditions. Further research is required to investigate the footprint of thermal neutrons for a homogeneous study site and under a wide range of boundary conditions to eventually derive weighting functions similar to those developed for epithermal neutrons during the past decade (e.g. Zreda et al., 2008; Franz et al., 2012; Köhli et al., 2015; Schrön et al., 2017; Scheiffele et al., 2020). Very recently, Jakobi et al. (2021) investigated the footprint of thermal neutrons and developed weighting functions based on the point of thermalization as the origin and generated first valuable conclusions to understand the footprint of thermal neutrons. However, as stated before, our study shows that the footprint of thermal neutrons seems to be larger than estimated, based on the point of thermalization, and that the point of first soil contact may be a better definition for assessing the footprint of thermal neutrons, which again illustrates the need for further research.
Besides the varying dimensions of the integration volume, epithermal and thermal neutrons show a different response to the simulated changes in peatland soil moisture. This applies to both the simulation set, with a constant near-field soil moisture, and to the simulation sets, with the soil moisture in the near-field and in the peatland soils changing at different degrees. In general, the total number of detected epithermal and thermal neutrons decreases with an increasing peatland soil moisture and, thus, with an increasing amount of hydrogen in the model domain. However, the response of epithermal and thermal neutrons to the different simulated soil moisture contents in mineral and peatland soils differs. Differences in the response of epithermal and thermal neutrons have also been observed in previous modelling studies (e.g. Andreasen et al., 2017b) for variations in soil moisture or liquid water layer thickness (e.g. Hubert et al., 2016). Thermal neutrons show a much smaller response to variations in hydrogen (Weimar et al., 2020), and they show a moderation optimum occurring just below 0.10 m3 m−3 soil moisture (Sato and Niita, 2006; Weimar et al., 2020). The latter is caused by the two competing processes influencing thermal neutron abundance, i.e. slowing down of epithermal neutrons (moderation) and absorption of thermal neutrons, for example, by hydrogen (e.g. Hubert et al., 2016).
Several assumptions need to be considered when interpreting the neutron transport simulation results presented here. In this study, a simplified model domain was created where topography was neglected. However, while topography may play a more important role in mountainous terrain (e.g. Schattan et al., 2019; Mares et al., 2020), smaller topographic gradients, as at our study site, are unlikely to have a considerable influence on footprint sizes (Köhli et al., 2015). Nevertheless, the slightly elevated position of the observation site compared to the surrounding peatland (Fig. 1) may cause slightly larger real-world footprint radii than those obtained from the simulations. Additional simplifications include the estimation of soil porosities based on the density of quartz and the use of the same soil chemistry for organic and mineral soils. The higher amount of hydrogen stored in the soil organic matter of the peatlands is likely to shift the simulation results towards lower ratios of epithermal and thermal neutrons, smaller footprint sizes in the real world and a shallower response of epithermal and thermal neutrons with changing soil water content in all simulations, for example. Last, we did not add a vegetation layer to the simulations as most of the study site is pasture and assumed to represent static sources of additional hydrogen. Nevertheless, the latter will likewise have a reducing influence on the general footprint size, as it can be exemplarily seen when applying the weighting functions developed by Köhli et al. (2015) and Schrön et al. (2017), which include a vegetation height parameter.
As a consequence of the simplifications and limitations of the neutron transport simulations, care needs to be taken when using the model results to explain the real-world observations.
4.2 Towards a quantification of footprint heterogeneity
The high correlation between thermal and epithermal neutron intensities at the more uniform sites and the low correlation at the heterogeneous site can be explained by the fact that both energy ranges have different footprint sizes, as indicated by Bogena et al. (2020) and partly supported by the neutron simulations shown here. The heterogeneous observation site has a lower correlation coefficient which indicates larger differences between the soil water contents and dynamics of the near-field and of far field with organic peatland soils. However, our simulations indicate that the thermal neutron intensity is influenced by far-field soil moisture changes occurring in areas covered with peatland soils. The scatterplot for our heterogeneous site A (in Fig. 8a) shows deviations from the narrow point cloud and, thus, the close non-linear relationship observed at study sites where soil moisture is more uniform in terms of absolute values and relative changes. The strongest deviations occur at high normalized intensities, leading to the heteroscedasticity observed and, in turn, the lower correlation coefficient. Adding the results from all simulations conducted in the scope of this study to the scatterplot with the observed values (Fig. 9) further illustrates this effect. The simulated intensities comprising different absolute soil moisture values for mineral soils of the near-field and peatland soils of the far field, as well as different soil water dynamics, are located in the area representing deviations from the relationship observed at the two homogeneous observation sites. In particular, the simulated normalized numbers of detected neutrons with low static near-field soil moisture and changing peatland soil moisture are located in the area of the scatterplot considered as having deviations. Under real-world conditions, this response may be expected during summer periods when mineral soil moisture contents reached a minimum, while peatland soil moisture continues to change due to e.g. high water storage capacities and the variations in shallow groundwater visible in Figs. 2 and 10.
Hence, a twofold influence may be considered. On the one hand, the total soil moisture content differs between the mineral soils of the near-field and the far-field peatland soils, leading to a different response of thermal and epithermal neutrons when soil water contents change in the near-field and the far field. On the other hand, the differences in the moisture content between the near-field and the far field may fluctuate over time and result in a varying influence on the observed neutron intensities in the two energy ranges.
Against this background, the simple Spearman rank correlation coefficient can serve as a first indicator for footprint heterogeneity in terms of soil moisture conditions in the near- and the far field of the neutron detector and could be used to characterize observation sites and select processing procedures accordingly. Detailed knowledge of the functional relationship between thermal and epithermal neutrons at heterogeneous observation sites poses great potential for an improved assessment of the footprint heterogeneity and the development of advanced indices. However, this requires further research regarding the relationship of the thermal and epithermal neutron intensities under changing soil moisture and with respect to different environmental factors such as soil chemistry. As study sites are always restricted to local boundary conditions, large-scale irrigation experiments using e.g. centre pivots (see also Franz et al., 2015) combined with neutron transport simulations could improve and extend the insights gained in this study regarding indicators for footprint heterogeneity and the definition of measurement footprints in general. Additionally, this may also require the need to develop transfer functions for thermal neutrons which are similar to those already available for estimating soil moisture from epithermal neutron intensities (e.g. Desilets et al., 2010; Franz et al., 2013b; Köhli et al., 2021).
4.3 Improving the estimation of near-field soil moisture
The calibration of neutron observations against the near-field reference soil moisture time series from in situ soil moisture sensors revealed an improvement of the calibration result in terms of the statistical goodness of fit when either all parameters of the transfer function are adjusted (N0, a0, a1 and a2) or the combination of thermal and epithermal neutrons based on Eq. (6) was used and only N0 was calibrated. Using the standard calibration approach, the calibration against a weighted average reference soil moisture time series resulted in a better KGE compared to a simple arithmetic average. This illustrates the positive effect of the weighting procedure developed by Köhli et al. (2015), and advanced by Schrön et al. (2017), to match the sensitivity of the CRNS.
Adjusting all parameters in alternative approach 1, instead of only calibrating N0, and combining the thermal and epithermal neutrons in the scope of alternative approach 2 leads to an improvement in the calibrated KGE by at least 0.25. As the analyses revealed a significant (p<0.05) difference between the CRNS-derived soil moisture based on the standard calibration approach and both alternative calibration approaches for at least 97 % of the data points of the time series, a significantly improved representation of the near-field soil moisture dynamics can be achieved by either adjusting all parameters (approach 1) or combining both neutron energy ranges (approach 2). However, this does not represent an uncertainty analysis that considers various statistical sources of uncertainty as was done in previous studies (e.g. Andreasen et al., 2017b; Baroni et al., 2018; Gugerli et al., 2019; Schattan et al., 2019; Jakobi et al., 2020).
In this study, reference soil moisture sensors were installed in the near-field of the CRNS only, and no information on far-field peatland soil moisture dynamics were available. Although this poses the largest limitation of this study, marked differences in soil water dynamics can be expected for mineral and peatland soils due to the distinct hydraulic behaviour of the latter (e.g. Rezanezhad et al., 2016). In addition, peatland areas at the study site are characterized by groundwater influence and potentially higher soil water content, as observed in the reference soil samples taken from mineral and peatland soils in February 2020 (Sect. 2.1). The obtained calibration results of CRNS-derived soil moisture time series clearly show an improvement in the representation of near-field soil moisture dynamics when accounting for these peatland soil moisture dynamics through alternative approaches 1 or 2.
The transfer function developed by Desilets et al. (2010), and revised by Köhli et al. (2021), was designed for a uniform soil water content within the measurement footprint. In the example presented in this study, the epithermal neutron response is stronger than the soil water changes observed in the mineral soils of the near-field, causing the underestimation of the near-field reference soil moisture during summer periods. Therefore, adjusting the shape-defining variables of Eqs. (2)–(5) in addition to the calibration parameter N0 alone in alternative approach 1 allows for the adjustment of the transfer function for the soil moisture dynamics of the near-field. Different studies already adjusted the shape-defining parameters of the standard calibration function (Eq. 1) (e.g. Heidbüchel et al., 2016) and achieved better calibration results compared to adjusting N0 only. However, the reasons for changing the physical meaning of Eqs. (1) or (2)–(5) by tuning all variables of the transfer function remain disputable. The results of this study shed more light on the potential reasons for an improved calibration against reference measurements by changing the shape of the transfer function. Distinct differences in soil moisture states and dynamics within the measurement footprint over time may lead to neutron responses deviating from the shape of the original transfer function (Eq. 1 or 2). This is in line with findings from previous studies (e.g. Lv et al., 2014; Heidbüchel et al., 2016). Nevertheless, care should be taken when tuning the shape-giving parameters to optimize the goodness of fit against different reference measurements. This can lead to different optimized values for the shape-giving parameters (N0, a0, a1 and a2), depending on the reference soil moisture time series (see also Table A1). This illustrates that the shape-giving parameters can be fitted to different reference measurements, and that the objective for the site-specific optimization needs to be considered. For example, optimizing for a site-specific areal average requires sufficient spatiotemporal coverage of reference measurements, while optimizing for reference soil moisture in defined parts of the footprint requires representative reference measurements from these areas.
In contrast, in alternative approach 2, we produced a rescaled neutron time series NET based on observed epithermal (NE) and thermal NT neutron intensities and, thus, adjusted the signal instead of the transfer function. As the thermal neutron response to soil water changes is generally weaker (Weimar et al., 2020), summing the observed normalized intensities of the thermal and epithermal neutrons, and rescaling them using Eq. (6), leads to a less steep slope of the functional relationship between the neutron intensity and reference soil moisture. Consequently, the rescaling approach presented here makes use of thermal neutrons (NT) as a proxy for a different response to soil water changes, leading to a rescaled neutron time series NET that is more similar to the epithermal neutron intensities NE if the entire measurement footprint has the lower soil water content and dampened dynamics of the near-field where the reference point sensors are installed. Hence, the second alternative approach tested in this study is suitable for a separation of the near- and far-field soil moisture at the heterogeneous observation site investigated.
Both approaches tested in this study allow for an improvement of the estimation of near-field soil moisture and illustrate the potential for separating the measurement footprint where approach 1 is generally applicable, while approach 2 may be most suitable at sites with conditions similar to those at the study site investigated. We would like to note that further instrumental adjustments based on additional shielding may also offer the potential to limit the measurement footprint. These include downward-looking detectors (Badiee et al., 2021) or side-looking devices (Francke et al., 2021). However, using a non-modified detector allows the possibility to also retrieve an area-averaged soil moisture time series in the entire footprint.
Several limitations need to be considered when assessing the improvement achieved with the different approaches tested in this study. Besides the horizontal footprint of the thermal neutrons being smaller than for epithermal neutrons, the integration depth can be considered to be different as well. This may complicate the joint interpretation and combination of both neutron energies and intensities. Additionally, the differing influences of other factors on thermal and epithermal neutron observations should be considered. In this study, raw thermal and epithermal neutron observations were corrected equally for the influence of variations in atmospheric shielding depth and incoming high-energy neutron radiation but not for variations in air humidity, as the latter was determined for epithermal neutrons only. The correction procedures applied to the observed thermal neutrons differ among other studies (e.g. Andreasen et al., 2016; Jakobi et al., 2018), and in addition to the need for detailed knowledge about the dynamics of the integration volume, further research is required concerning appropriate correction procedures for thermal neutrons to varying environmental conditions.
The neutron transport simulations performed here support previous studies that indicate a distinctively smaller horizontal measurement footprint of thermal compared to epithermal neutrons. However, the thermal neutron footprint radius strongly depends upon the definition of the origin of the detected neutrons. Our study suggests that the point of thermalization alone may not be suitable for characterizing the sensitive measurement footprint size, as detected thermal neutrons do vary with far-field soil moisture variations. Instead, as with epithermal neutrons, the point of first soil contact may be more suitable. In this case, the integration radius almost doubles but still remains smaller than that of epithermal neutrons. The integration depth also increases strongly – even surpassing that of epithermal neutrons.
The relationship between normalized observed thermal and epithermal neutron intensities is likely to differ between homogeneous and heterogeneous conditions and may be used to characterize the footprint heterogeneity. The simple Spearman rank correlation coefficient between the normalized thermal and epithermal neutron intensities proved to a be a suitable first indicator for the footprint heterogeneity, with lower values indicating a larger (and varying) difference between soil water contents in the near- and the far field.
Either adjusting all parameters of the transfer function or rescaling the observed epithermal neutron intensities by averaging the normalized dynamics of thermal and epithermal neutrons leads to a significant improvement in the calibration result against the reference soil moisture sensors in the near-field. This is achieved by changing the neutron intensity dynamics towards a more dampened response that would occur if the entire epithermal footprint had the lower soil moisture conditions and dampened dynamics of the near-field.
In conclusion, both approaches tested for improving the estimation of near-field soil moisture pose great value for the use of CRNS at study sites with heterogeneous soil water contents and dynamics. On the one hand, complementary observations of thermal and epithermal neutrons offer the opportunity to test for footprint heterogeneity using simple correlation measures. On the other hand, in addition to adjusting the transfer function, the thermal neutron intensity proved to be a useful proxy for rescaling the epithermal neutron intensities in order to improve the representation of near-field soil water time series at the study site. Several limitations of this study need to be considered and also illustrate the need for further research, especially regarding the general response of thermal neutrons to environmental conditions, suitable correction procedures for these phenomena and the behaviour of both neutron energies at study sites with heterogeneous distributions of soil water and pools of hydrogen in general. Nevertheless, this study illustrates the possibility of achieving a spatial disaggregation of soil moisture at heterogeneous study sites and the potential of using both neutron energies for improving CRNS-derived soil water estimates.
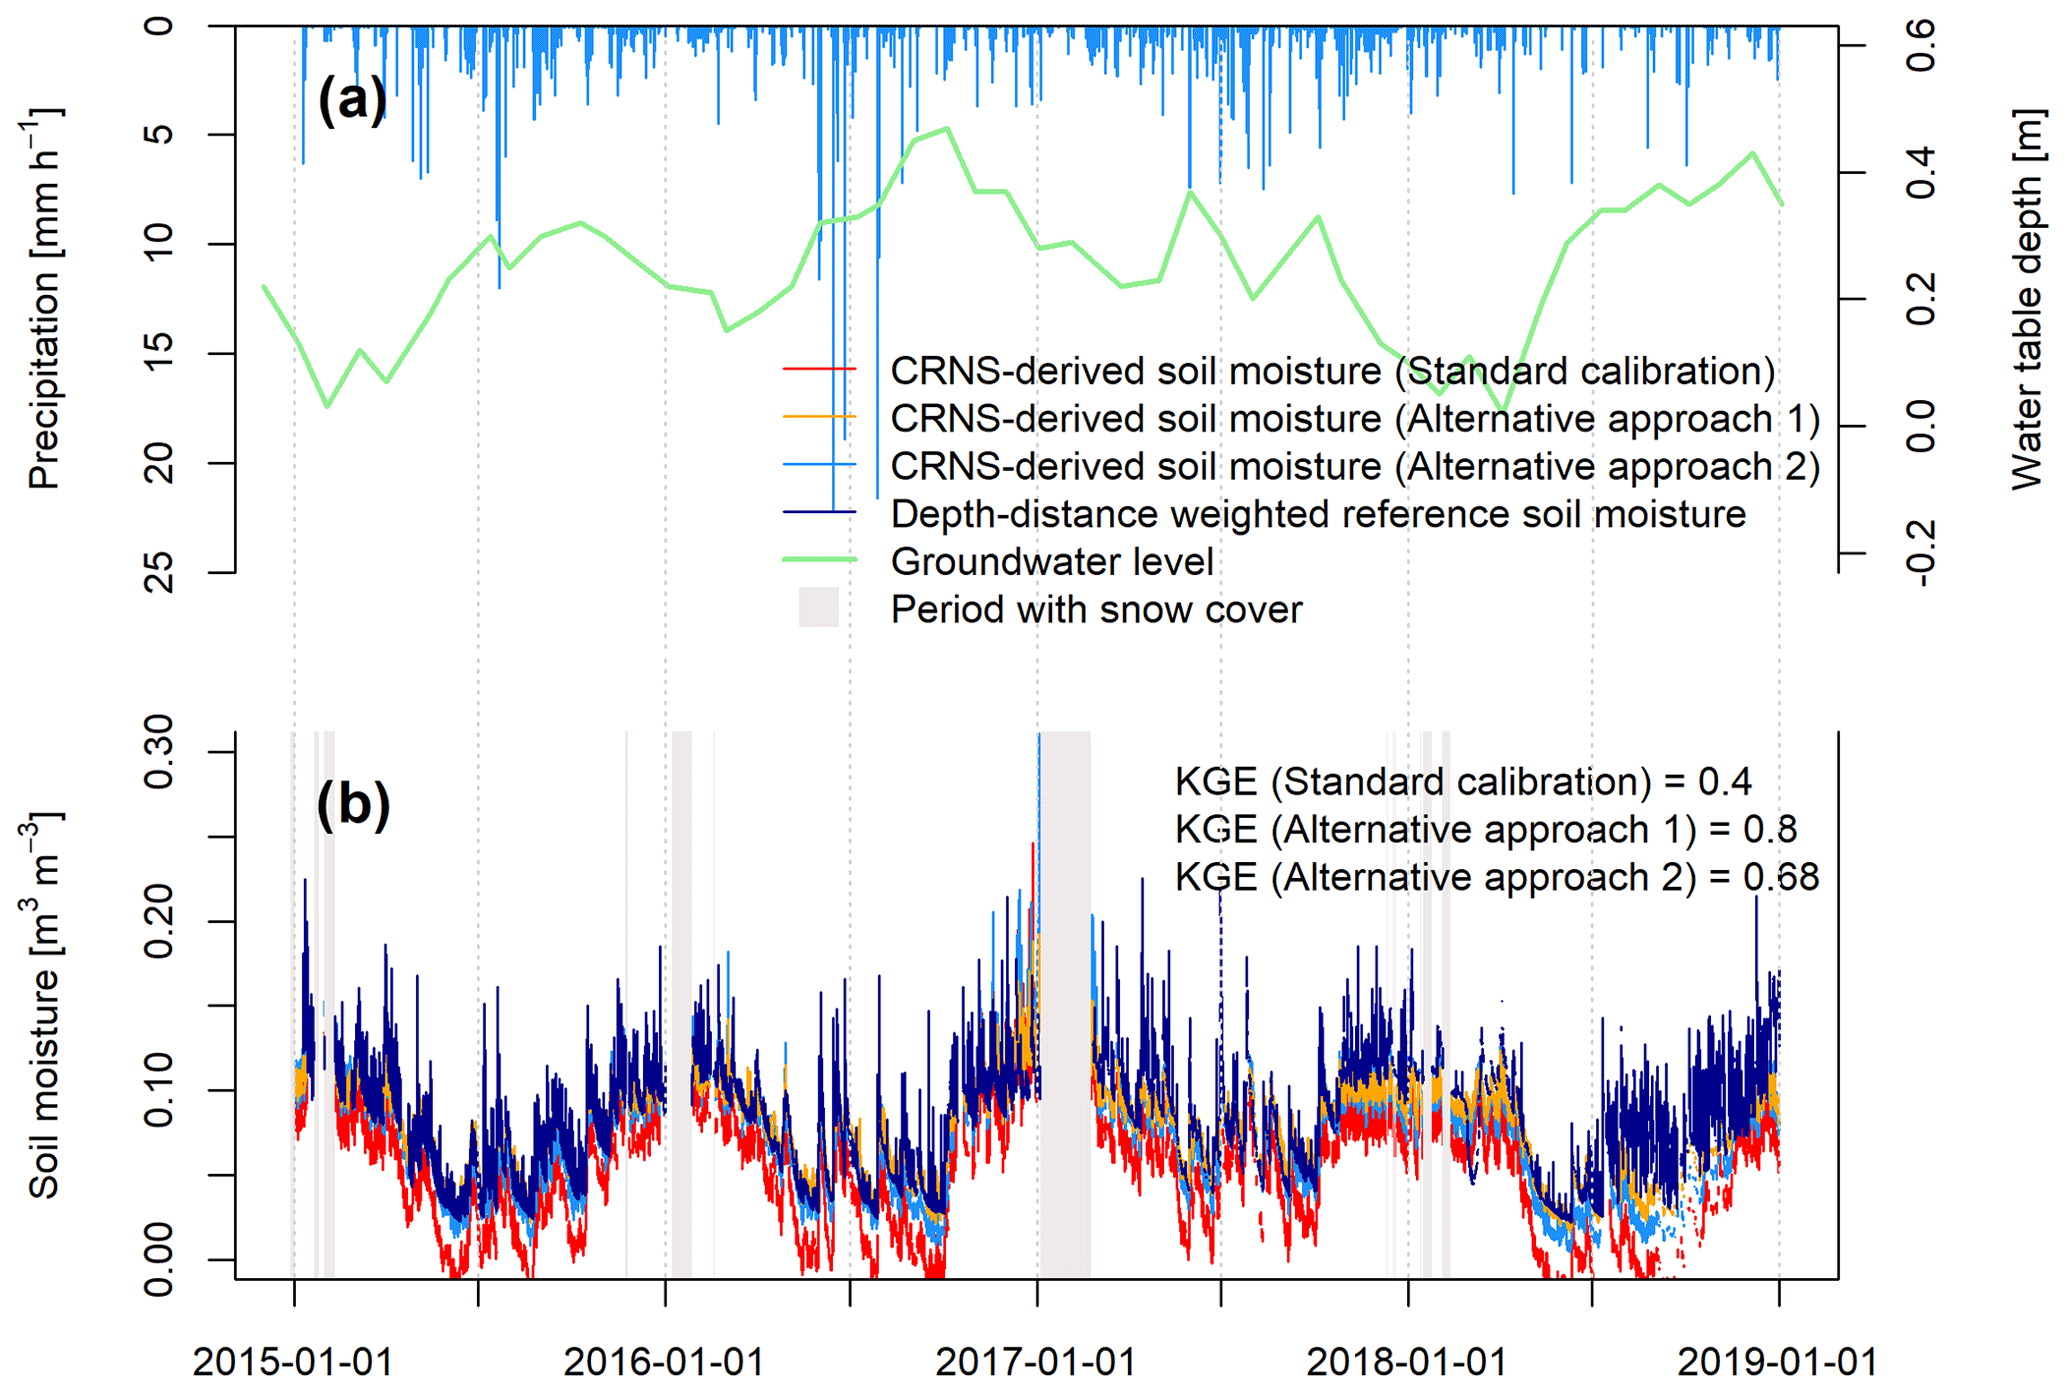
Figure A1On-site observed hourly rainfall sums (a) and CRNS-derived soil moisture time series based on the standard calibration approach and calibration approaches 1 and 2 in comparison to the depth–distance weighted reference soil moisture time series derived from TDR sensors (b).

Data sets of the CRNS sensors will be published through GFZ Data Services (https://dataservices.gfz-potsdam.de/portal/, last access: 22 December 2021) and will also be made available through the TERENO data portal (http://www.tereno.net, last access: 22 December 2021). Until then, the data sets are available from the authors upon request.
DR designed the study, performed the data analysis and wrote the paper. AG and TB designed the experimental network and contributed to the writing of the paper. MK and MS assisted with performing and analysing the neutron transport simulations and provided comments on the paper.
At least one of the (co-)authors is a member of the editorial board of Hydrology and Earth System Sciences. The peer-review process was guided by an independent editor, and the authors also have no other competing interests to declare.
Publisher's note: Copernicus Publications remains neutral with regard to jurisdictional claims in published maps and institutional affiliations.
This study was conducted as part of the research unit CosmicSense, funded by the German Research Foundation (Deutsche Forschungsgemeinschaft; grant no. DFG-FOR2694). We gratefully acknowledge the TERENO NE observatory, funded by the Helmholtz Association, and the technical support of Markus Morgner, Jörg Wummel and Stephan Schröder, who maintain the observation sites. In addition, we would like to thank the Stadtwerke Neustrelitz GmbH, for supplying the on-site time series of groundwater levels, and Peter Stüve and Paul Voit, for their assistance in the data acquisition, fieldwork and laboratory work. Furthermore, we would like to thank the Mueritz National Park and local landowners for their continuing support and collaboration. Last, we acknowledge the NMDB database (http://www.nmdb.eu, last access: 21 December 2021) founded under the European Union's FP7 programme (contract no. 213007), and the principal investigators of the individual neutron monitors, for providing data.
The article processing charges for this open-access publication were covered by the Helmholtz Centre Potsdam – GFZ German Research Centre for Geosciences.
This paper was edited by Nunzio Romano and reviewed by four anonymous referees.
Andreasen, M., Jensen, K. H., Zreda, M., Desilets, D., Bogena, H., and Looms, M. C.: Modeling cosmic ray neutron field measurements, Water Resour. Res., 52, 6451–6471, https://doi.org/10.1002/2015wr018236, 2016. a, b, c
Andreasen, M., Jensen, K. H., Desilets, D., Franz, T. E., Zreda, M., Bogena, H. R., and Looms, M. C.: Status and Perspectives on the Cosmic-Ray Neutron Method for Soil Moisture Estimation and Other Environmental Science Applications, Vadose Zone J., 16, vzj2017.04.0086, https://doi.org/10.2136/vzj2017.04.0086, 2017a. a
Andreasen, M., Jensen, K. H., Desilets, D., Zreda, M., Bogena, H. R., and Looms, M. C.: Cosmic-ray neutron transport at a forest field site: the sensitivity to various environmental conditions with focus on biomass and canopy interception, Hydrol. Earth Syst. Sci., 21, 1875–1894, https://doi.org/10.5194/hess-21-1875-2017, 2017b. a, b
Andreasen, M., Jensen, K. H., Bogena, H., Desilets, D., Zreda, M., and Looms, M. C.: Cosmic Ray Neutron Soil Moisture Estimation Using Physically Based Site-Specific Conversion Functions, Water Resour. Res., 56, e2019WR026588, https://doi.org/10.1029/2019wr026588, 2020. a
Babaeian, E., Sadeghi, M., Jones, S. B., Montzka, C., Vereecken, H., and Tuller, M.: Ground, Proximal, and Satellite Remote Sensing of Soil Moisture, Rev. Geophys., 57, 530–616, https://doi.org/10.1029/2018rg000618, 2019. a
Badiee, A., Wallbank, J. R., Fentanes, J. P., Trill, E., Scarlet, P., Zhu, Y., Cielniak, G., Cooper, H., Blake, J. R., Evans, J. G., Zreda, M., Köhli, M., and Pearson, S.: Using Additional Moderator to Control the Footprint of a COSMOS Rover for Soil Moisture Measurement, Water Resour. Res., 57, e2020WR028478, https://doi.org/10.1029/2020wr028478, 2021. a
Baroni, G., Scheiffele, L., Schrön, M., Ingwersen, J., and Oswald, S.: Uncertainty, sensitivity and improvements in soil moisture estimation with cosmic-ray neutron sensing, J. Hydrol., 564, 873–887, https://doi.org/10.1016/j.jhydrol.2018.07.053, 2018. a
BKG – German Federal Agency for Cartography and Geodesy: Digital landcover model: ATKIS-Basis-DLM (© GeoBasis-DE/BKG 2018), available at: https://www.bkg.bund.de/SharedDocs/Produktinformationen/BKG/DE/P-2019/191011_ATKISDLM.html (last access: 21 December 2021), 2018a. a
BKG – German Federal Agency for Cartography and Geodesy: German administrative units ATKIS-VG2500, scale 1:2 500 000 (© GeoBasis-DE/BKG 2018), available at: https://gdz.bkg.bund.de/index.php/default/digitale-geodaten/verwaltungsgebiete/verwaltungsgebiete-1-2-500-000-stand-01-01-vg2500.html (last access: 21 December 2021), 2018b. a
Bogena, H. R., Huisman, J. A., Baatz, R., Franssen, H.-J. H., and Vereecken, H.: Accuracy of the cosmic-ray soil water content probe in humid forest ecosystems: The worst case scenario, Water Resour. Res., 49, 5778–5791, https://doi.org/10.1002/wrcr.20463, 2013. a
Bogena, H. R., Herrmann, F., Jakobi, J., Brogi, C., Ilias, A., Huisman, J. A., Panagopoulos, A., and Pisinaras, V.: Monitoring of Snowpack Dynamics With Cosmic-Ray Neutron Probes: A Comparison of Four Conversion Methods, Front. Water, 2, 19, https://doi.org/10.3389/frwa.2020.00019, 2020. a, b, c, d, e, f
Börner, A.: Neue Beiträge zum Naturraum und zur Landschaftsgeschichte im Teilgebiet Serrahn des Müritz-Nationalparks – Forschung und Monitoring, vol. 4, chap. Geologische Entwicklung des Gebietes um den Großen Fürstenseer See, Geozon Science Media, Berlin, 21–29, https://doi.org/10.3285/g.00012, 2015. a, b
Daly, E. and Porporato, A.: A Review of Soil Moisture Dynamics: From Rainfall Infiltration to Ecosystem Response, Environ. Eng. Sci., 22, 9–24, https://doi.org/10.1089/ees.2005.22.9, 2005. a
Desilets, D., Zreda, M., and Ferré, T. P. A.: Nature's neutron probe: Land surface hydrology at an elusive scale with cosmic rays, Water Resour. Res., 46, W11505, https://doi.org/10.1029/2009wr008726, 2010. a, b, c, d, e
Dettmann, U., Bechtold, M., Frahm, E., and Tiemeyer, B.: On the applicability of unimodal and bimodal van Genuchten–Mualem based models to peat and other organic soils under evaporation conditions, J. Hydrol., 515, 103–115, https://doi.org/10.1016/j.jhydrol.2014.04.047, 2014. a
Dimitrova-Petrova, K., Geris, J., Wilkinson, E. M., Rosolem, R., Verrot, L., Lilly, A., and Soulsby, C.: Opportunities and challenges in using catchment-scale storage estimates from cosmic ray neutron sensors for rainfall-runoff modelling, J. Hydrol., 586, 124878, https://doi.org/10.1016/j.jhydrol.2020.124878, 2020. a
Duygu, M. B. and Akyürek, Z.: Using Cosmic-Ray Neutron Probes in Validating Satellite Soil Moisture Products and Land Surface Models, Water, 11, 1362, https://doi.org/10.3390/w11071362, 2019. a
DWD – German Weather Service: Multi-annual temperature observations 1981–2010, available at: ftp://opendata.dwd.de/climate_environment/CDC/observations_germany/climate/multi_annual/mean_81-10/Temperatur_1981-2010_aktStandort.txt (last access: 1 December 2020), 2020a. a
DWD – German Weather Service: Multi-annual precipitation observations 1981–2010, available at: ftp://opendata.dwd.de/climate_environment/CDC/observations_germany/climate/multi_annual/mean_81-10/Niederschlag_1981-2010_aktStandort.txt (last access: 1 December 2020), 2020b. a
Famiglietti, J. S., Ryu, D., Berg, A. A., Rodell, M., and Jackson, T. J.: Field observations of soil moisture variability across scales, Water Resour. Res., 44, W01423, https://doi.org/10.1029/2006wr005804, 2008. a
Fersch, B., Jagdhuber, T., Schrön, M., Völksch, I., and Jäger, M.: Synergies for Soil Moisture Retrieval Across Scales From Airborne Polarimetric SAR, Cosmic Ray Neutron Roving, and an In Situ Sensor Network, Water Resour. Res., 54, 9364–9383, https://doi.org/10.1029/2018wr023337, 2018. a
Fersch, B., Francke, T., Heistermann, M., Schrön, M., Döpper, V., Jakobi, J., Baroni, G., Blume, T., Bogena, H., Budach, C., Gränzig, T., Förster, M., Güntner, A., Hendricks Franssen, H.-J., Kasner, M., Köhli, M., Kleinschmit, B., Kunstmann, H., Patil, A., Rasche, D., Scheiffele, L., Schmidt, U., Szulc-Seyfried, S., Weimar, J., Zacharias, S., Zreda, M., Heber, B., Kiese, R., Mares, V., Mollenhauer, H., Völksch, I., and Oswald, S.: A dense network of cosmic-ray neutron sensors for soil moisture observation in a highly instrumented pre-Alpine headwater catchment in Germany, Earth Syst. Sci. Data, 12, 2289–2309, https://doi.org/10.5194/essd-12-2289-2020, 2020. a
Francke, T., Heistermann, M., Köhli, M., Budach, C., Schrön, M., and Oswald, S. E.: Assessing the feasibility of a directional CRNS-sensor for estimating soil moisture, Geosci. Instrum. Method. Data Syst. Discuss. [preprint], https://doi.org/10.5194/gi-2021-18, in review, 2021. a
Franz, T. E., Zreda, M., Ferre, T. P. A., Rosolem, R., Zweck, C., Stillman, S., Zeng, X., and Shuttleworth, W. J.: Measurement depth of the cosmic ray soil moisture probe affected by hydrogen from various sources, Water Resour. Res., 48, W08515, https://doi.org/10.1029/2012wr011871, 2012. a
Franz, T. E., Zreda, M., Ferre, T. P. A., and Rosolem, R.: An assessment of the effect of horizontal soil moisture heterogeneity on the area-average measurement of cosmic-ray neutrons, Water Resour. Res., 49, 6450–6458, https://doi.org/10.1002/wrcr.20530, 2013a. a
Franz, T. E., Zreda, M., Rosolem, R., and Ferre, T. P. A.: A universal calibration function for determination of soil moisture with cosmic-ray neutrons, Hydrol. Earth Syst. Sci., 17, 453–460, https://doi.org/10.5194/hess-17-453-2013, 2013b. a, b
Franz, T. E., Wang, T., Avery, W., Finkenbiner, C., and Brocca, L.: Combined analysis of soil moisture measurements from roving and fixed cosmic ray neutron probes for multiscale real-time monitoring, Geophys. Res. Lett., 42, 3389–3396, https://doi.org/10.1002/2015gl063963, 2015. a
Franz, T. E., Wahbi, A., Vreugdenhil, M., Weltin, G., Heng, L., Oismueller, M., Strauss, P., Dercon, G., and Desilets, D.: Using Cosmic-Ray Neutron Probes to Monitor Landscape Scale Soil Water Content in Mixed Land Use Agricultural Systems, Appl. Environ. Soil Sci., 2016, 1–11, https://doi.org/10.1155/2016/4323742, 2016. a
Gugerli, R., Salzmann, N., Huss, M., and Desilets, D.: Continuous and autonomous snow water equivalent measurements by a cosmic ray sensor on an alpine glacier, The Cryosphere, 13, 3413–3434, https://doi.org/10.5194/tc-13-3413-2019, 2019. a
Gupta, H. V., Kling, H., Yilmaz, K. K., and Martinez, G. F.: Decomposition of the mean squared error and NSE performance criteria: Implications for improving hydrological modelling, J. Hydrol., 377, 80–91, https://doi.org/10.1016/j.jhydrol.2009.08.003, 2009. a
Heidbüchel, I., Güntner, A., and Blume, T.: Use of cosmic-ray neutron sensors for soil moisture monitoring in forests, Hydrol. Earth Syst. Sci., 20, 1269–1288, https://doi.org/10.5194/hess-20-1269-2016, 2016. a, b, c, d, e, f
Heinrich, I., Balanzategui, D., Bens, O., Blasch, G., Blume, T., Böttcher, F., Borg, E., Brademann, B., Brauer, A., Conrad, C., Dietze, E., Dräger, N., Fiener, P., Gerke, H. H., Güntner, A., Heine, I., Helle, G., Herbrich, M., Harfenmeister, K., Heußner, K.-U., Hohmann, C., Itzerott, S., Jurasinski, G., Kaiser, K., Kappler, C., Koebsch, F., Liebner, S., Lischeid, G., Merz, B., Missling, K. D., Morgner, M., Pinkerneil, S., Plessen, B., Raab, T., Ruhtz, T., Sachs, T., Sommer, M., Spengler, D., Stender, V., Stüve, P., and Wilken, F.: Interdisciplinary Geo-ecological Research across Time Scales in the Northeast German Lowland Observatory (TERENO-NE), Vadose Zone J., 17, 180116, https://doi.org/10.2136/vzj2018.06.0116, 2018. a
Heistermann, M., Francke, T., Schrön, M., and Oswald, S. E.: Spatio-temporal soil moisture retrieval at the catchment scale using a dense network of cosmic-ray neutron sensors, Hydrol. Earth Syst. Sci., 25, 4807–4824, https://doi.org/10.5194/hess-25-4807-2021, 2021. a
Holgate, C., Jeu, R. D., van Dijk, A., Liu, Y., Renzullo, L., Vinodkumar, Dharssi, I., Parinussa, R., Schalie, R. V. D., Gevaert, A., Walker, J., McJannet, D., Cleverly, J., Haverd, V., Trudinger, C., and Briggs, P.: Comparison of remotely sensed and modelled soil moisture data sets across Australia, Remote Sens. Environ., 186, 479–500, https://doi.org/10.1016/j.rse.2016.09.015, 2016. a
Hubert, G., Pazianotto, M. T., and Federico, C. A.: Modeling of ground albedo neutrons to investigate seasonal cosmic ray-induced neutron variations measured at high-altitude stations, J. Geophys. Res.-Space Phys., 121, 12186–12201, https://doi.org/10.1002/2016ja023055, 2016. a, b, c, d
Iwema, J., Rosolem, R., Rahman, M., Blyth, E., and Wagener, T.: Land surface model performance using cosmic-ray and point-scale soil moisture measurements for calibration, Hydrol. Earth Syst. Sci., 21, 2843–2861, https://doi.org/10.5194/hess-21-2843-2017, 2017. a
Jakobi, J., Huisman, J. A., Vereecken, H., Diekkrüger, B., and Bogena, H. R.: Cosmic Ray Neutron Sensing for Simultaneous Soil Water Content and Biomass Quantification in Drought Conditions, Water Resour. Res., 54, 7383–7402, https://doi.org/10.1029/2018wr022692, 2018. a, b, c
Jakobi, J., Huisman, J. A., Schrön, M., Fiedler, J., Brogi, C., Vereecken, H., and Bogena, H. R.: Error Estimation for Soil Moisture Measurements With Cosmic Ray Neutron Sensing and Implications for Rover Surveys, Front. Water, 2, 10, https://doi.org/10.3389/frwa.2020.00010, 2020. a
Jakobi, J., Huisman, J. A., Köhli, M., Rasche, D., Vereecken, H., and Bogena, H. R.: The Footprint Characteristics of Cosmic Ray Thermal Neutrons, Geophys. Res. Lett., 48, e2021GL094281, https://doi.org/10.1029/2021GL094281, 2021. a, b, c, d
Köhli, M., Schrön, M., Zreda, M., Schmidt, U., Dietrich, P., and Zacharias, S.: Footprint characteristics revised for field-scale soil moisture monitoring with cosmic-ray neutrons, Water Resour. Res., 51, 5772–5790, https://doi.org/10.1002/2015wr017169, 2015. a, b, c, d, e, f, g, h, i, j, k, l, m, n, o
Köhli, M., Schrön, M., and Schmidt, U.: Response functions for detectors in cosmic ray neutron sensing, Nuclear Instruments and Methods in Physics Research Section A: Accelerators, Spectrometers, Detectors and Associated Equipment, 902, 184–189, https://doi.org/10.1016/j.nima.2018.06.052, 2018. a
Köhli, M., Weimar, J., Schrön, M., Baatz, R., and Schmidt, U.: Soil Moisture and Air Humidity Dependence of the Above-Ground Cosmic-Ray Neutron Intensity, Front. Water, 2, 66, https://doi.org/10.3389/frwa.2020.544847, 2021. a, b, c, d, e, f
LAIV-MV – State Agency for Interior Administration Mecklenburg-Western Pomerania: Digital elevation model: ATKIS-DEM1 (© GeoBasis-DE/M-V 2011), available at: https://www.laiv-mv.de/Geoinformation/Geobasisdaten/Gelaendemodelle/ (last access: 21 December 2021), 2011. a
Li, D., Schrön, M., Köhli, M., Bogena, H., Weimar, J., Bello, M. A. J., Han, X., Gimeno, M. A. M., Zacharias, S., Vereecken, H., and Franssen, H.-J. H.: Can Drip Irrigation be Scheduled with Cosmic-Ray Neutron Sensing?, Vadose Zone J., 18, 190053, https://doi.org/10.2136/vzj2019.05.0053, 2019. a
Lv, L., Franz, T. E., Robinson, D. A., and Jones, S. B.: Measured and Modeled Soil Moisture Compared with Cosmic-Ray Neutron Probe Estimates in a Mixed Forest, Vadose Zone J., 13, vzj2014.06.0077, https://doi.org/10.2136/vzj2014.06.0077, 2014. a, b
Mares, V., Brall, T., Bütikofer, R., and Rühm, W.: Influence of environmental parameters on secondary cosmic ray neutrons at high-altitude research stations at Jungfraujoch, Switzerland, and Zugspitze, Germany, Radiat. Phys. Chem., 168, 108557, https://doi.org/10.1016/j.radphyschem.2019.108557, 2020. a, b
McJannet, D., Hawdon, A., Baker, B., Renzullo, L., and Searle, R.: Multiscale soil moisture estimates using static and roving cosmic-ray soil moisture sensors, Hydrol. Earth Syst. Sci., 21, 6049–6067, https://doi.org/10.5194/hess-21-6049-2017, 2017. a
Montzka, C., Bogena, H., Zreda, M., Monerris, A., Morrison, R., Muddu, S., and Vereecken, H.: Validation of Spaceborne and Modelled Surface Soil Moisture Products with Cosmic-Ray Neutron Probes, Remote Sens., 9, 103, https://doi.org/10.3390/rs9020103, 2017. a
Pang, Z., Jia, Y., Peng, X., Ju, X., and Gao, L.: Applicability of cosmic-ray neutron sensing for measuring soil water content to heterogeneous landscapes under subtropical hydroclimatic conditions, J. Hydrol., 596, 126068, https://doi.org/10.1016/j.jhydrol.2021.126068, 2021. a
R Core Team: R: A Language and Environment for Statistical Computing, R Foundation for Statistical Computing, Vienna, Austria, r version 3.5.1 (2018-07-02) edn., available at: https://www.R-project.org/ (last access: 21 December 2021), 2018. a
Rezanezhad, F., Price, J. S., Quinton, W. L., Lennartz, B., Milojevic, T., and Cappellen, P. V.: Structure of peat soils and implications for water storage, flow and solute transport: A review update for geochemists, Chem. Geol., 429, 75–84, https://doi.org/10.1016/j.chemgeo.2016.03.010, 2016. a, b
Rivera Villarreyes, C. A., Baroni, G., and Oswald, S. E.: Integral quantification of seasonal soil moisture changes in farmland by cosmic-ray neutrons, Hydrol. Earth Syst. Sci., 15, 3843–3859, https://doi.org/10.5194/hess-15-3843-2011, 2011. a
Rosolem, R., Shuttleworth, W. J., Zreda, M., Franz, T. E., Zeng, X., and Kurc, S. A.: The Effect of Atmospheric Water Vapor on Neutron Count in the Cosmic-Ray Soil Moisture Observing System, J. Hydrometeorol., 14, 1659–1671, https://doi.org/10.1175/jhm-d-12-0120.1, 2013. a
Sato, T. and Niita, K.: Analytical Functions to Predict Cosmic-Ray Neutron Spectra in the Atmosphere, Radiat. Res., 166, 544–555, 2006. a
Schattan, P., Köhli, M., Schrön, M., Baroni, G., and Oswald, S. E.: Sensing Area-Average Snow Water Equivalent with Cosmic-Ray Neutrons: The Influence of Fractional Snow Cover, Water Resour. Res., 55, 10796–10812, https://doi.org/10.1029/2019wr025647, 2019. a, b, c, d
Scheiffele, L. M., Baroni, G., Franz, T. E., Jakobi, J., and Oswald, S. E.: A profile shape correction to reduce the vertical sensitivity of cosmic-ray neutron sensing of soil moisture, Vadose Zone J., 19, e20083, https://doi.org/10.1002/vzj2.20083, 2020. a
Schrön, M., Köhli, M., Scheiffele, L., Iwema, J., Bogena, H. R., Lv, L., Martini, E., Baroni, G., Rosolem, R., Weimar, J., Mai, J., Cuntz, M., Rebmann, C., Oswald, S. E., Dietrich, P., Schmidt, U., and Zacharias, S.: Improving calibration and validation of cosmic-ray neutron sensors in the light of spatial sensitivity, Hydrol. Earth Syst. Sci., 21, 5009–5030, https://doi.org/10.5194/hess-21-5009-2017, 2017. a, b, c, d, e, f, g, h, i, j
Schrön, M., Rosolem, R., Köhli, M., Piussi, L., Schröter, I., Iwema, J., Kögler, S., Oswald, S. E., Wollschläger, U., Samaniego, L., Dietrich, P., and Zacharias, S.: Cosmic-ray Neutron Rover Surveys of Field Soil Moisture and the Influence of Roads, Water Resour. Res., 54, 6441–6459, https://doi.org/10.1029/2017wr021719, 2018a. a, b
Schrön, M., Zacharias, S., Womack, G., Köhli, M., Desilets, D., Oswald, S. E., Bumberger, J., Mollenhauer, H., Kögler, S., Remmler, P., Kasner, M., Denk, A., and Dietrich, P.: Intercomparison of cosmic-ray neutron sensors and water balance monitoring in an urban environment, Geosci. Instrum. Method. Data Syst., 7, 83–99, https://doi.org/10.5194/gi-7-83-2018, 2018b. a, b, c
Seneviratne, S. I., Corti, T., Davin, E. L., Hirschi, M., Jaeger, E. B., Lehner, I., Orlowsky, B., and Teuling, A. J.: Investigating soil moisture–climate interactions in a changing climate: A review, Earth-Sci. Rev., 99, 125–161, https://doi.org/10.1016/j.earscirev.2010.02.004, 2010. a, b
Sigouin, M. J., Dyck, M., Si, B. C., and Hu, W.: Monitoring soil water content at a heterogeneous oil sand reclamation site using a cosmic-ray soil moisture probe, J. Hydrol., 543, 510–522, https://doi.org/10.1016/j.jhydrol.2016.10.026, 2016. a
Stevanato, L., Baroni, G., Cohen, Y., Lino, F. C., Gatto, S., Lunardon, M., Marinello, F., Moretto, S., and Morselli, L.: A Novel Cosmic-Ray Neutron Sensor for Soil Moisture Estimation over Large Areas, Agriculture, 9, 202, https://doi.org/10.3390/agriculture9090202, 2019. a
Tan, X., Zhang, L., He, C., Zhu, Y., Han, Z., and Li, X.: Applicability of cosmic-ray neutron sensor for measuring soil moisture at the agricultural-pastoral ecotone in northwest China, Science China Earth Sci., 63, 1730–1744, https://doi.org/10.1007/s11430-020-9650-2, 2020. a
Tian, Z., Li, Z., Liu, G., Li, B., and Ren, T.: Soil water content determination with cosmic-ray neutron sensor: Correcting aboveground hydrogen effects with thermal/fast neutron ratio, J. Hydrol., 540, 923–933, https://doi.org/10.1016/j.jhydrol.2016.07.004, 2016. a
Vather, T., Everson, C., and Franz, T. E.: Calibration and Validation of the Cosmic Ray Neutron Rover for Soil Water Mapping within Two South African Land Classes, Hydrology, 6, 65, https://doi.org/10.3390/hydrology6030065, 2019. a
Vather, T., Everson, C. S., and Franz, T. E.: The Applicability of the Cosmic Ray Neutron Sensor to Simultaneously Monitor Soil Water Content and Biomass in an Acacia mearnsii Forest, Hydrology, 7, 48, https://doi.org/10.3390/hydrology7030048, 2020. a, b, c
Vereecken, H., Huisman, J. A., Bogena, H., Vanderborght, J., Vrugt, J. A., and Hopmans, J. W.: On the value of soil moisture measurements in vadose zone hydrology: A review, Water Resour. Res., 44, W00D06, https://doi.org/10.1029/2008wr006829, 2008. a, b
Vereecken, H., Huisman, J., Pachepsky, Y., Montzka, C., van der Kruk, J., Bogena, H., Weihermüller, L., Herbst, M., Martinez, G., and Vanderborght, J.: On the spatio-temporal dynamics of soil moisture at the field scale, J. Hydrol., 516, 76–96, https://doi.org/10.1016/j.jhydrol.2013.11.061, 2014. a, b
Wang, C., Fu, B., Zhang, L., and Xu, Z.: Soil moisture–plant interactions: an ecohydrological review, J. Soil. Sediment., 19, 1–9, https://doi.org/10.1007/s11368-018-2167-0, 2018. a
Weimar, J., Köhli, M., Budach, C., and Schmidt, U.: Large-Scale Boron-Lined Neutron Detection Systems as a 3He Alternative for Cosmic Ray Neutron Sensing, Front. Water, 2, 16, https://doi.org/10.3389/frwa.2020.00016, 2020. a, b, c, d, e, f
Zacharias, S., Bogena, H., Samaniego, L., Mauder, M., Fuß, R., Pütz, T., Frenzel, M., Schwank, M., Baessler, C., Butterbach-Bahl, K., Bens, O., Borg, E., Brauer, A., Dietrich, P., Hajnsek, I., Helle, G., Kiese, R., Kunstmann, H., Klotz, S., Munch, J. C., Papen, H., Priesack, E., Schmid, H. P., Steinbrecher, R., Rosenbaum, U., Teutsch, G., and Vereecken, H.: A Network of Terrestrial Environmental Observatories in Germany, Vadose Zone J., 10, 955–973, https://doi.org/10.2136/vzj2010.0139, 2011. a
Zambrano-Bigiarini, M.: hydroGOF: Goodness-of-fit functions for comparison of simulated and observed hydrological time series, r package version 0.3-10, Zenodo, https://doi.org/10.5281/zenodo.840087, 2017. a
Zreda, M., Desilets, D., Ferré, T. P. A., and Scott, R. L.: Measuring soil moisture content non-invasively at intermediate spatial scale using cosmic-ray neutrons, Geophys. Res. Lett., 35, https://doi.org/10.1029/2008gl035655, 2008. a, b, c
Zreda, M., Shuttleworth, W. J., Zeng, X., Zweck, C., Desilets, D., Franz, T., and Rosolem, R.: COSMOS: the COsmic-ray Soil Moisture Observing System, Hydrol. Earth Syst. Sci., 16, 4079–4099, https://doi.org/10.5194/hess-16-4079-2012, 2012. a, b