the Creative Commons Attribution 4.0 License.
the Creative Commons Attribution 4.0 License.
 | 03 Dec 2021
Can we use precipitation isotope outputs of isotopic general circulation models to improve hydrological modeling in large mountainous catchments on the Tibetan Plateau?
Zhihua He
Zhongwang Wei
Lide Tian
Issues related to large uncertainty and parameter equifinality have posed big challenges for hydrological modeling in cold regions where runoff generation processes are particularly complicated. Tracer-aided hydrological models that integrate the transportation and fractionation processes of water stable isotope are increasingly used to constrain parameter uncertainty and refine the parameterizations of specific hydrological processes in cold regions. However, the common unavailability of site sampling of spatially distributed precipitation isotopes hampers the practical applications of tracer-aided models in large-scale catchments. This study, taking the precipitation isotope data (isotopes-incorporated global spectral model – isoGSM) derived from the isotopic general circulation models (iGCMs) as an example, explored its utility in driving a tracer-aided hydrological model in the Yarlung Tsangpo River basin (YTR; around 2×10⁵ km2, with a mean elevation of 4875 m) on the Tibetan Plateau (TP). The isoGSM product was firstly corrected based on the biases between gridded precipitation isotope estimates and the limited site sampling measurements. Model simulations driven by the corrected isoGSM data were then compared with those forced by spatially interpolated precipitation isotopes from site sampling measurements. Our results indicated that (1) spatial precipitation isotopes derived from the isoGSM data helped to reduce modeling uncertainty and improve parameter identifiability in a large mountainous catchment on the TP, compared to a calibration method using discharge and snow cover area fraction without any information on water isotopes; (2) model parameters estimated by the corrected isoGSM data presented higher transferability to nested subbasins and produced higher model performance in the validation period than that estimated by the interpolated precipitation isotope data from site sampling measurements; (3) model calibration forced by the corrected isoGSM data successfully rejected parameter sets that overestimated glacier melt contribution and gave more reliable contributions of runoff components, indicating the corrected isoGSM data served as a better choice to provide informative spatial precipitation isotope than the interpolated data from site sampling measurements at the macro scale. This work suggested plausible utility of combining isoGSM data with measurements, even from a sparse sampling network, in improving hydrological modeling in large high mountain basins.
- Article
(9536 KB) - Full-text XML
- BibTeX
- EndNote


Large uncertainty and strong equifinality of parameter calibration are the widely recognized issues in hydrological modeling (Gupta et al., 2008), especially in cold regions where hydrological complexity is highly enhanced by the competition of multiple water inputs and the strong spatiotemporal variabilities in runoff generation processes (Li et al., 2019). Tracer-aided hydrological models integrating a water or environmental tracer (e.g., stable oxygen isotope, δ18O) module into the runoff generation architecture have proved to be highly valuable in improving parameter calibration and diagnosing model uncertainty (Son and Sivapalan, 2007; Birkel et al., 2011; Capell et al., 2012; He et al., 2019). Multiple-objective calibration of tracer-aided model towards both runoff and isotope simulation allows for the rejection of parameters based on runoff observation alone and, consequently, makes the model satisfy multiple objectives and reduces the model uncertainty (McGuire et al., 2007). However, practical applications of tracer-aided hydrological modeling are mainly limited in only small to mesoscales. The largest basin area where previous tracer-aided modeling has been implemented is around 103 km2 (i.e., Delavau et al., 2017; Campell et al., 2012; Stadnyk et al., 2013). Reasons fall into either the lumped conceptual model structures, due to the complicated tracer processes difficult to be coupled with distributed model (Birkel and Soulsby, 2015), or the low availability of tracer data in large basins, due to difficulties in the long-term, continuous and high-frequency field sampling works (e.g., Ala-aho et al., 2017; He et al., 2019). The structure and data issues make the model unsuitable for capturing the strong spatial variability in hydrological behaviors in-large scale basins.
The Tibetan Plateau (TP) is the source region of many large rivers (e.g., Brahmaputra, Ganges, Indus and Mekong, among others) which sustain the ecosystems and provide a great proportion of water resources for downstream livelihoods and agricultural irrigation (Zhang et al., 2013; Schaner et al., 2012). Decision-making of water resource management over the TP and its downstream area relies heavily on river runoff in the large basins. Meanwhile, melting water from snow and ice contributes a significant proportion to river runoff in the large basins on the TP due to the cold climate and glacier coverage in head watersheds (Li et al., 2019). Runoff in this region is, thus, highly vulnerable to climate warming. Robust quantification of the contribution of meltwater to river runoff is critical in understanding water resource dynamics on the TP (Immerzeel et al., 2013). Although great efforts have been made to quantify the contributions of runoff components and their future trends under climate changes on the TP (e.g., Immerzeel et al., 2010; Lutz et al., 2014; Su et al., 2016; Masood et al., 2015), the results reported in a wide range of studies show substantial differences (R. Xu et al., 2019; Tian et al., 2020). The disagreement among studies indicates big challenges for quantifying the contributions of runoff components and predicting their future trend in the large basins on the TP. The difficulty of this task is mainly related to the large uncertainty in hydrological modeling and parameter calibration in the TP because of the complex hydrological processes (He et al., 2018) and the commonly inaccurate estimation of precipitation (Xu et al., 2017; He et al., 2017). The strong inter-competitions of runoff processes induced by meltwater versus rainwater and surface water versus subsurface water are inadequately constrained in hydrological models by the commonly used hydrological observation of streamflow (Duethmann et al., 2015) and even additional data of snow and ice coverage (He et al., 2019). Reducing the modeling uncertainty originating from parameter calibration is essential for a proper understanding of runoff regimes and the robust prediction of future hydrological change.
Tracer-aided hydrological models that additionally involve water stable isotope data for parameter calibration have proved to be highly capable for constraining the inter-competitions of runoff processes induced by meltwater and rainwater in high mountains (He et al., 2019; Nan et al., 2021), which, however, have not been tested in large basins yet due to the unavailability of precipitation isotope data. The global gridded isotope product potentially serves as an alternative forcing of precipitation isotope data for tracer-aided hydrological models in large basins where high-frequency sampling work in a large region is not feasible. One of these options comes from outputs of the isotopic general or regional circulation models (iGCM and iRCM; Noone and Sturm, 2010; Xi, 2014; Sturm et al., 2005, 2007), which have been proven to have high performances when simulating the seasonal and spatial variations in the isotopic signature of precipitation on regional and global scales (Wang et al., 2017; Yao et al., 2013). However, very few works have been conducted to test the behavior of such products on forcing hydrological models. To the best of our knowledge, the only one was conducted by Delavau et al. (2017), who examined the performance of an iRCM product, REMOiso, on forcing a tracer-aided model in a regional catchment of around 103 km2 in Canada. Their results indicated that hydrological simulations driven by the iRCM product reproduced the variations of isotopic signature (δ18O) of river water comparably to the simulations driven by δ18O measurements from sampling sites and improved the representations of internal hydrological processes in the model. Those attempts provide sound confidences for exploring the utility of global and regional gridded isotope data products in aiding hydrological modeling in large basins on TP.
Motivated by the mentioned backgrounds, we adopted a tracer-aided hydrological model developed by Nan et al. (2021) to simulate runoff processes and the contributions of runoff components to streamflow in a large basin extending to around 2×10⁵ km2 on the TP. The isotope module was driven by two kinds of precipitation isotope data, including site measurements from water samples and outputs of the isotopic general circulation models (iGCM). The following scientific questions addressed in this study are two-fold: (1) what are the benefits of using water isotope data for hydrological modeling in larger catchments? (2) How do the gridded precipitation isotope data of iGCM products perform on forcing tracer-aided hydrological models in large basins?
2.1 Study area
The Yarlung Tsangpo river (YTR), located in the southern TP to the north of the Himalaya mountain (Fig. 1), is one of the longest rivers (longer than 2000 km) originating from TP. The YTR basin is located in the range of 27–32∘ N and 82–97∘ E, with an elevation range of 2900–6900 m a.s.l. (above sea level). The mean annual precipitation in the YTR basin is around 470 mm, which is dominated by the South Asian monsoon in the Indian Ocean hydrosphere–atmosphere system, resulting in an obviously wet season from June to September (Dong et al., 2016). The area contributing to the Nuxia hydrological station extends approximately 2×10⁵ km2, around 2 % of which is covered by glacier. Plenty of previous works have shown the great contribution of snow and glacier melting to the runoff in YTR (e.g., Chen et al., 2017; Tian et al., 2020).
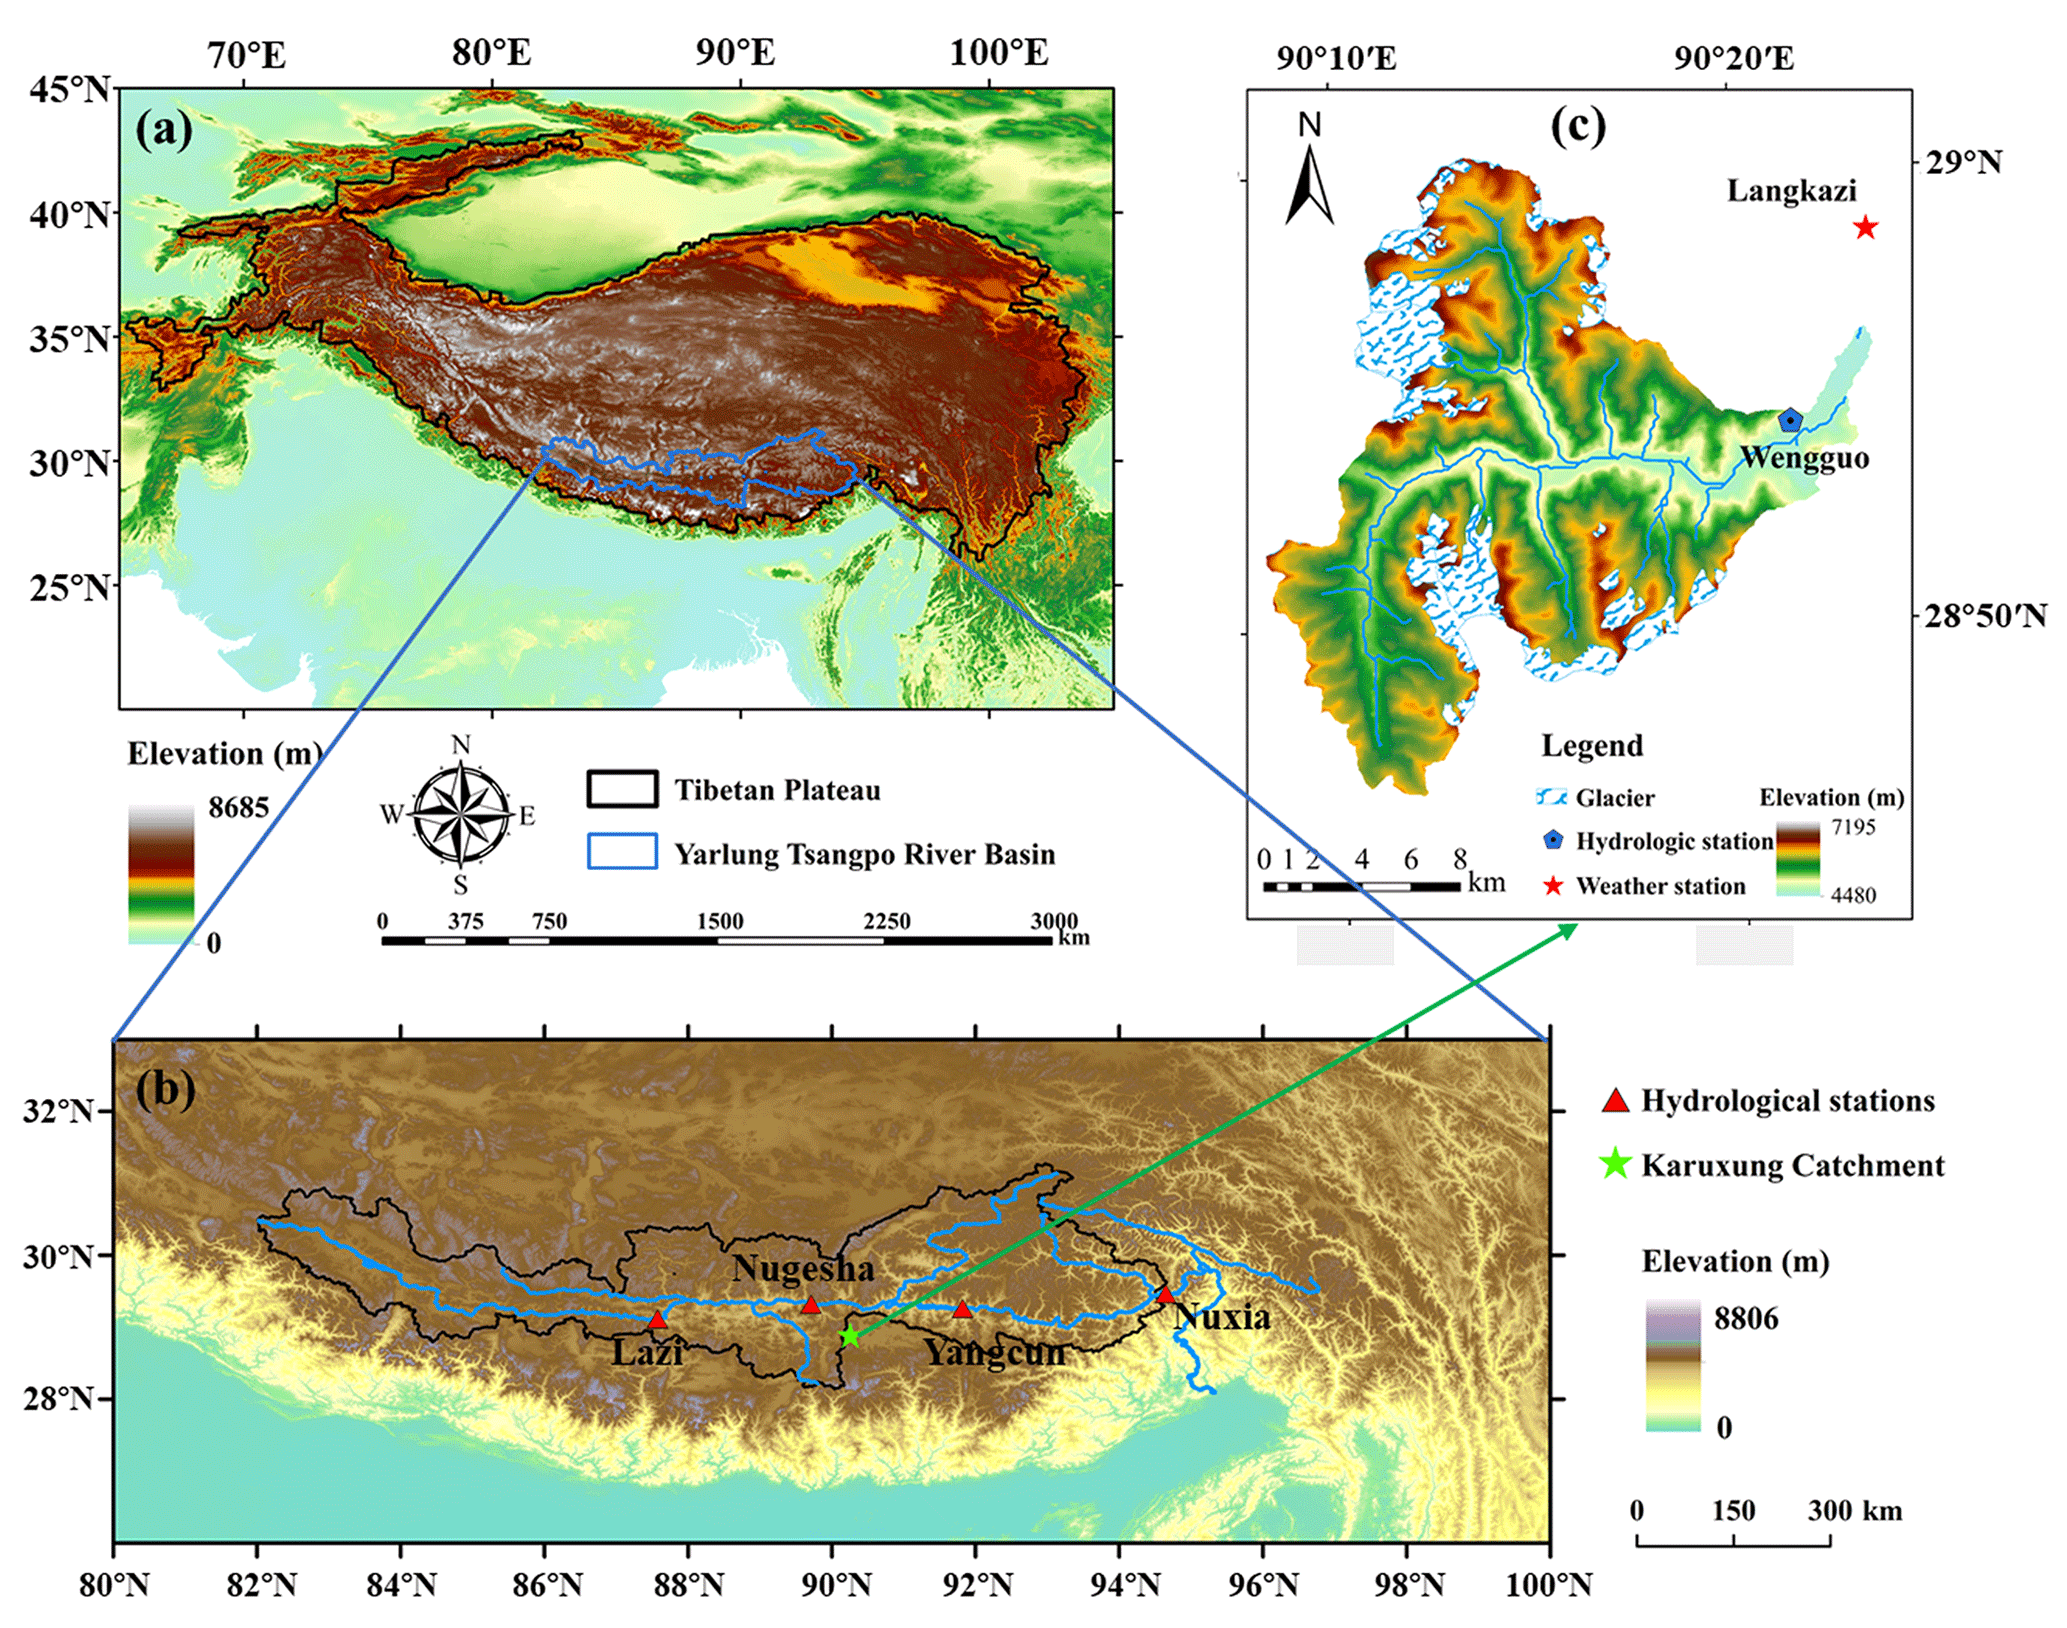
Figure 1Location and topography of (a) Tibetan Plateau, (b) Yarlung Tsangpo river basin and (c) Karuxung catchment.
The Karuxung River (KR) catchment is located in the upper region of the YTR basin, on the northern slope of the Himalaya mountains, which is used for model evaluation in the subbasin because of its high proportion of glacierized area (around 20 %). The KR originates from the Lejin Jangsan peak of the Karola mountain, at 7206 m a.s.l., and flows into the Yamdrok Lake, at 4550 m a.s.l. (F. Zhang et al., 2006). The KR catchment covers an area of 286 km2. Runoff in the KR catchment is strongly influenced by the headwater glaciers which cover an area of around 58 km2.
2.2 Hydro-meteorological data and site water sampling for isotope analysis
Digital elevation model (DEM) data in the YTR catchment with a spatial resolution of 30 m was extracted from the Geospatial Data Cloud (http://www.gscloud.cn, last access: 1 January 2019). The 3 h 0.1∘ × 0.1∘ China Meteorological Forcing Dataset (CMFD), which combined multiple data sets (e.g., Global Land Data Assimilation System (GLDAS) and Tropical Rainfall Measuring Mission (TRMM)) with the national meteorological station data (Yang et al., 2010), provided meteorological inputs including precipitation, temperature and potential evapotranspiration. Glacier coverages were extracted from the second glacier inventory data set of China (Liu, 2012). The Tibetan Plateau Snow Cover Extent product (TPSCE; 5 km × 5 km; Chen et al., 2018) was used to denote the fluctuations of the daily snow cover area (SCA) in the basins, which also included the glacier cover area. The 8 d leaf area index (LAI) and the monthly normalized difference vegetation index (NDVI) data were downloaded from MODIS products of MOD15A2H (500 × 500 m; Myneni et al., 2015) and MOD13A3 (1 ×1 km; Didan, 2015), respectively. Soil parameters were estimated based on the soil properties extracted from the 1 ×1 km Harmonized World Soil Database (HWSD; http://www.fao.org/geonetwork, last access: 1 January 2019).
Daily streamflow during 2000–2010 for hydrological calibration was observed at the Nuxia, Yangcun and Nugesha hydrological stations. Grab samples of precipitation and stream water were collected in 2005 at four stations along the main stream of YTR, i.e., Lazi (4889 m a.s.l.), Nugesha (4715 m a.s.l.), Yangcun (4541 m a.s.l.) and Nuxia (3691 m a.s.l.), from the upstream to the downstream (Fig. 1). Precipitation water was sampled as soon as possible after the precipitation events, and stream water samples were collected weekly, on every Monday, from the river. Considering the continental effect and elevation effect on precipitation isotopes, the measured isotopic composition of precipitation from site sampling was interpolated by longitude and altitude (similar with Zhao et al., 2012; Liu et al., 2014), using Eq. (1) to provide spatial precipitation isotopes for the model input, where the coefficients x, y and z were estimated by fitting the average precipitation δ18O and the corresponding altitude/longitude at the four measuring stations with the least squares method. The coefficient x reflected the altitudinal lapse of the precipitation isotopes; thus, it was expected to be lower than zero. Longitude reflected the distance from the station to the mainland border; thus, the coefficient y was expected to be larger than zero. The term latitude was not chosen as a regression variable because of the similar latitude of the measurement stations and the relatively narrow north–south range of the basin (Fig. 1). The isotopic composition of glacier meltwater was assumed to be constant during the entire study period and lower than the amount weighted as the average isotopic composition of precipitation (Boral and Sen, 2020).
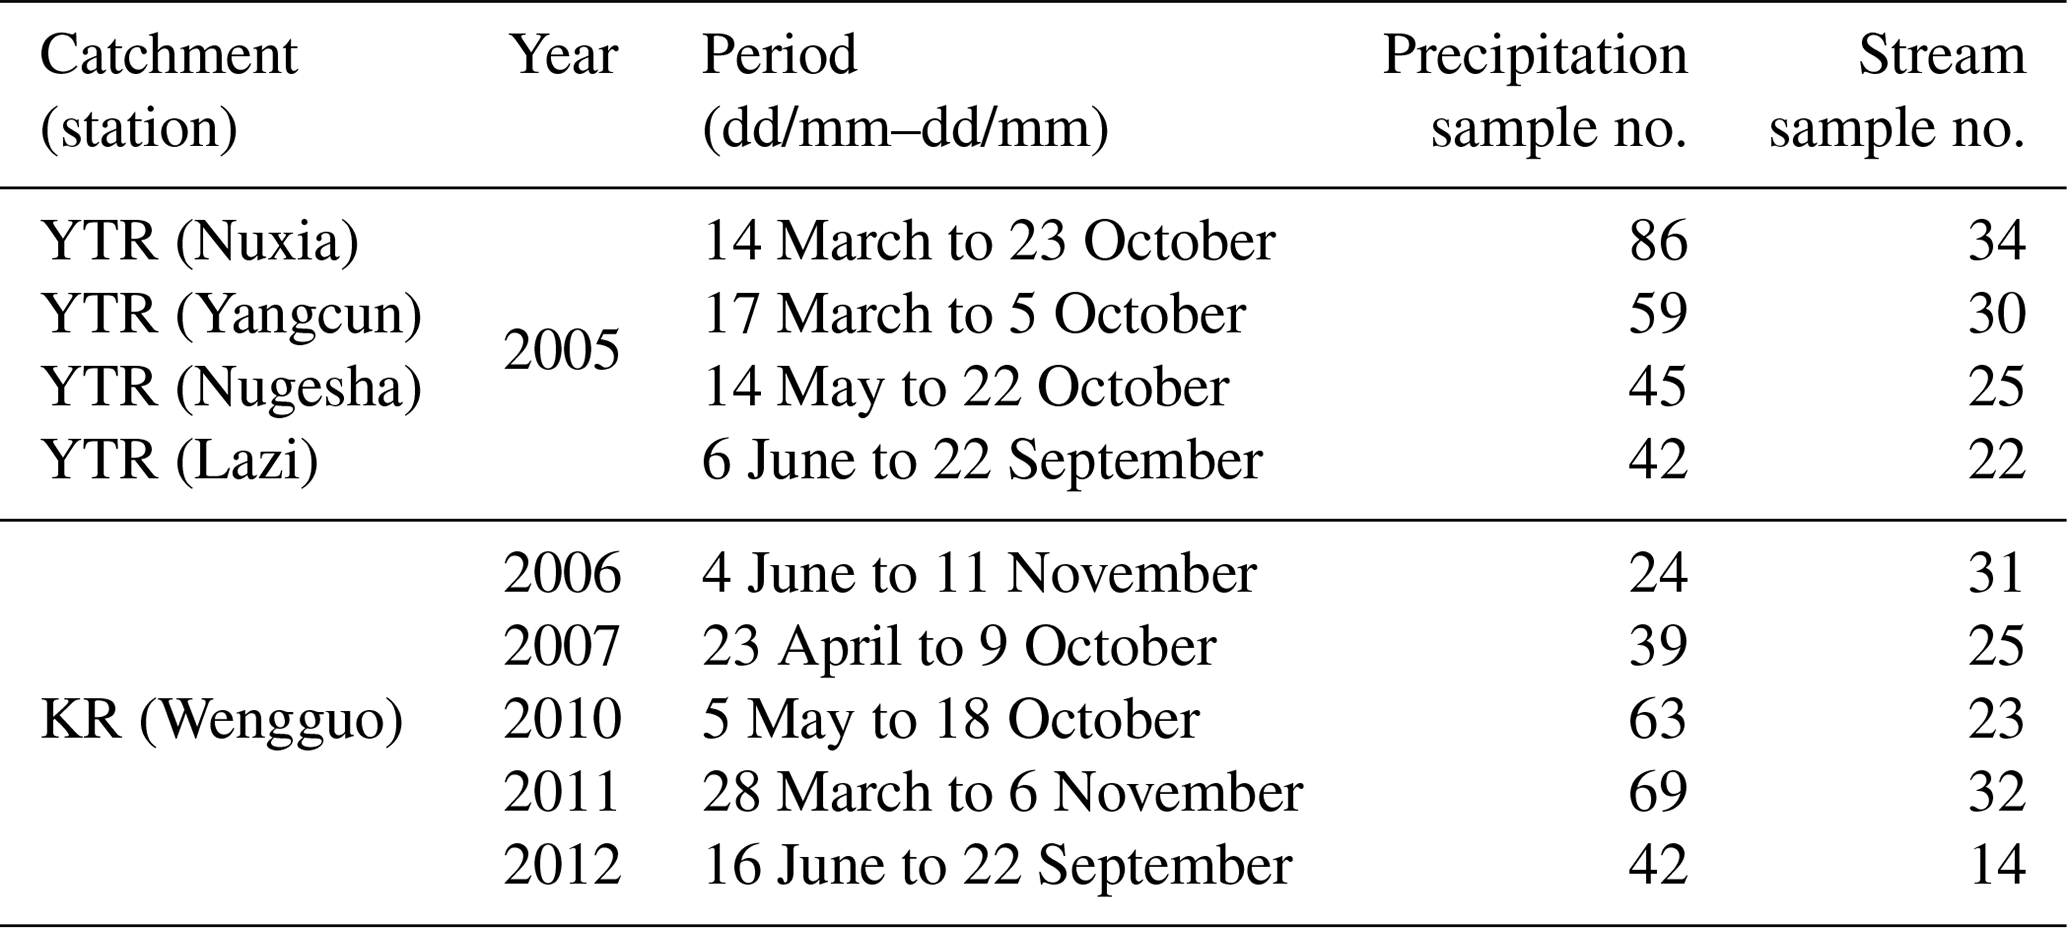
Daily temperature and precipitation data in the KR catchment during 2006–2012 were collected at the Langkazi meteorological station. Altitudinal distributions of temperature and precipitation across the catchment were estimated by the lapse rates reported in Zhang et al. (2015). Daily streamflow during 2006–2012, for hydrological calibration and evaluation, was measured at the Wengguo hydrological station. Grab samples of precipitation and stream water at the Wengguo station in 2006–2007 and 2010–2012 were collected for isotope analysis. The isotopic composition of precipitation over elevation bands was calculated from the sampling site of Wengguo station using an altitudinal lapse of −0.34 ‰ 100 m, as reported in Liu et al. (2007). The isotopic composition of glacier meltwater in this catchment was assumed to be −18.9 ‰, remaining constant throughout the entire study period (we adopted the value reported in Gao et al., 2009). Details of the water samples in the YTR and KR catchments are summarized in Table 1.
Table 1Characteristics of precipitation and stream water samples in the YTR and KR catchments.
2.3 Isotopic general circulation model (isoGSM) and bias correction
Precipitation δ18O of the Scripps global spectral model with water isotopes incorporated (isoGSM), developed by Yoshimura et al. (2008), was extracted to drive the tracer-aided model. The isoGSM was developed from the Scripps Experimental Climate Prediction Center's global spectral model (GSM), which was based on the medium-range forecast model for making operational analyses and predictions (Kanamitsu et al., 2002). Wang et al. (2017) evaluated the performance of 10 iGCM data sets with regard to the five aspects of average isotope simulation, seasonal difference, temperature effect, precipitation effect and the global meteoric water line, ranking isoGSM as 1, 2, 1, 2 and 2, respectively, indicating the best performance of isoGSM among the iGCMs, relatively speaking. The spatial and temporal resolutions of the isoGSM data set are 1.875∘ × 1.875∘ and 6 h, respectively.
The precipitation δ18O estimated by isoGSM was corrected by site sampling measurements in Eqs. (2)–(4) before being used for the hydrological model input. Biases between the weighted averages of isoGSM isotope and sampling measurements at the four sampling sites in YTR basin were calculated in Eq. (2) first. The spatial distribution of the bias between isoGSM isotope and sampling measurements was then assumed to be linearly related to altitude in Eq. (3), where the coefficients of a and b were estimated by fitting the site biases calculated in Eq. (2) and corresponding site altitudes with the least squares method. Daily isoGSM isotope data in hydrological model units over the study catchment were finally corrected in Eq. (4), using the unit altitudes.
where is the weighted average of the measured precipitation isotopes over the sampling period in sampling site , and is the weighted average of the isoGSM precipitation isotopes over the study period in pixel that contains the sampling site i. ALT is altitude of the sampling site or hydrological model unit. Parameters a and b are the linear regression coefficients. and are the corrected and original isoGSM precipitation isotopes at all the hydrological model units of on the jth day, respectively. The performance of the correction method of isoGSM data was evaluated by sampling measurements of the precipitation isotope at the Wengguo station in the KR subbasin, which was not involved in the estimation of coefficients a and b in Eq. (3). The spatial precipitation isotope of the isoGSM data in the KR subbasin for hydrological modeling was estimated using the same altitudinal lapse that was used to interpolate the sampling data in Sect. 2.2 because the KR catchment only encompasses one pixel of the isoGSM data.
2.4 Tracer-aided hydrological model
A distributed tracer-aided hydrological model, THREW-t (Tian et al., 2006; Nan et al., 2021), was adopted in this study for streamflow and isotope simulations. This model uses the representative elementary watershed (REW) method for the spatial discretization of the catchment, where the study catchment is first divided into REWs based on the catchment DEM. Each REW is further divided into two vertical distributed layers (surface and subsurface layers), including eight hydrological subzones according to the land cover and soil properties within the REW. Hydrological processes, including canopy interception, infiltration, infiltration–excess runoff, saturation–excess runoff and groundwater outflow were simulated in each REW. REW is based on the similar characteristics of a watershed and its subwatersheds (Reggiani et al., 1999) and is regarded as the fundamental component of hydrological processes and modeling in which series of balance equations are established. The principle of REW division is based on the scale of interest, modeling purpose and the data availability (Tian et al., 2006, 2008). In total, 63 and 41 REWs were extracted in YTR and KR, respectively, which were adopted in two previous studies (Tian et al., 2020; Nan et al., 2021). Areal averages of the gridded estimates of CMFD meteorological variables and precipitation δ18O were used in each of the REWs to drive the hydrological model. For application in cold and high regions, a module representing the glacier melting and snowpack evolution was incorporated into the original model in Tian et al. (2006), which has been proved to be successful in previous modeling works (e.g., He et al., 2015; R. Xu et al., 2019; Tian et al., 2020). The semi-distributed REW-based structure made the model concise enough to couple the tracer module easily. The tracer module was developed by Nan et al. (2021) and performed quite well when reproducing the isotopic signature of stream water in the KR catchment. The isotope mixing and fractionation processes were simulated based on the complete mixing assumption and the Rayleigh fractionation method (Hindshaw et al., 2011; Wolfe et al., 2007). Forced by the input data of the precipitation isotope composition, the model can simulate the isotopic evolution of all the water bodies in the watershed, including soil water, snowpack, stream water, etc. The THREW-t model considered the runoff components in stream water based on two aspects (Nan et al., 2021). First, the consideration is based on the individual water sources in the total water input forcing runoff processes including rainfall, snowmelt and glacier melt. Second, the consideration is based on the runoff-generation processes, including surface runoff and subsurface runoff (baseflow). The THREW-t model mainly described the rainfall–runoff processes; thus, only the role of shallow groundwater which can be recharged by the rainfall was considered, but the contribution from deep groundwater storage was not simulated. More details of model description and setup are given in Tian et al. (2006) and Nan et al. (2021).
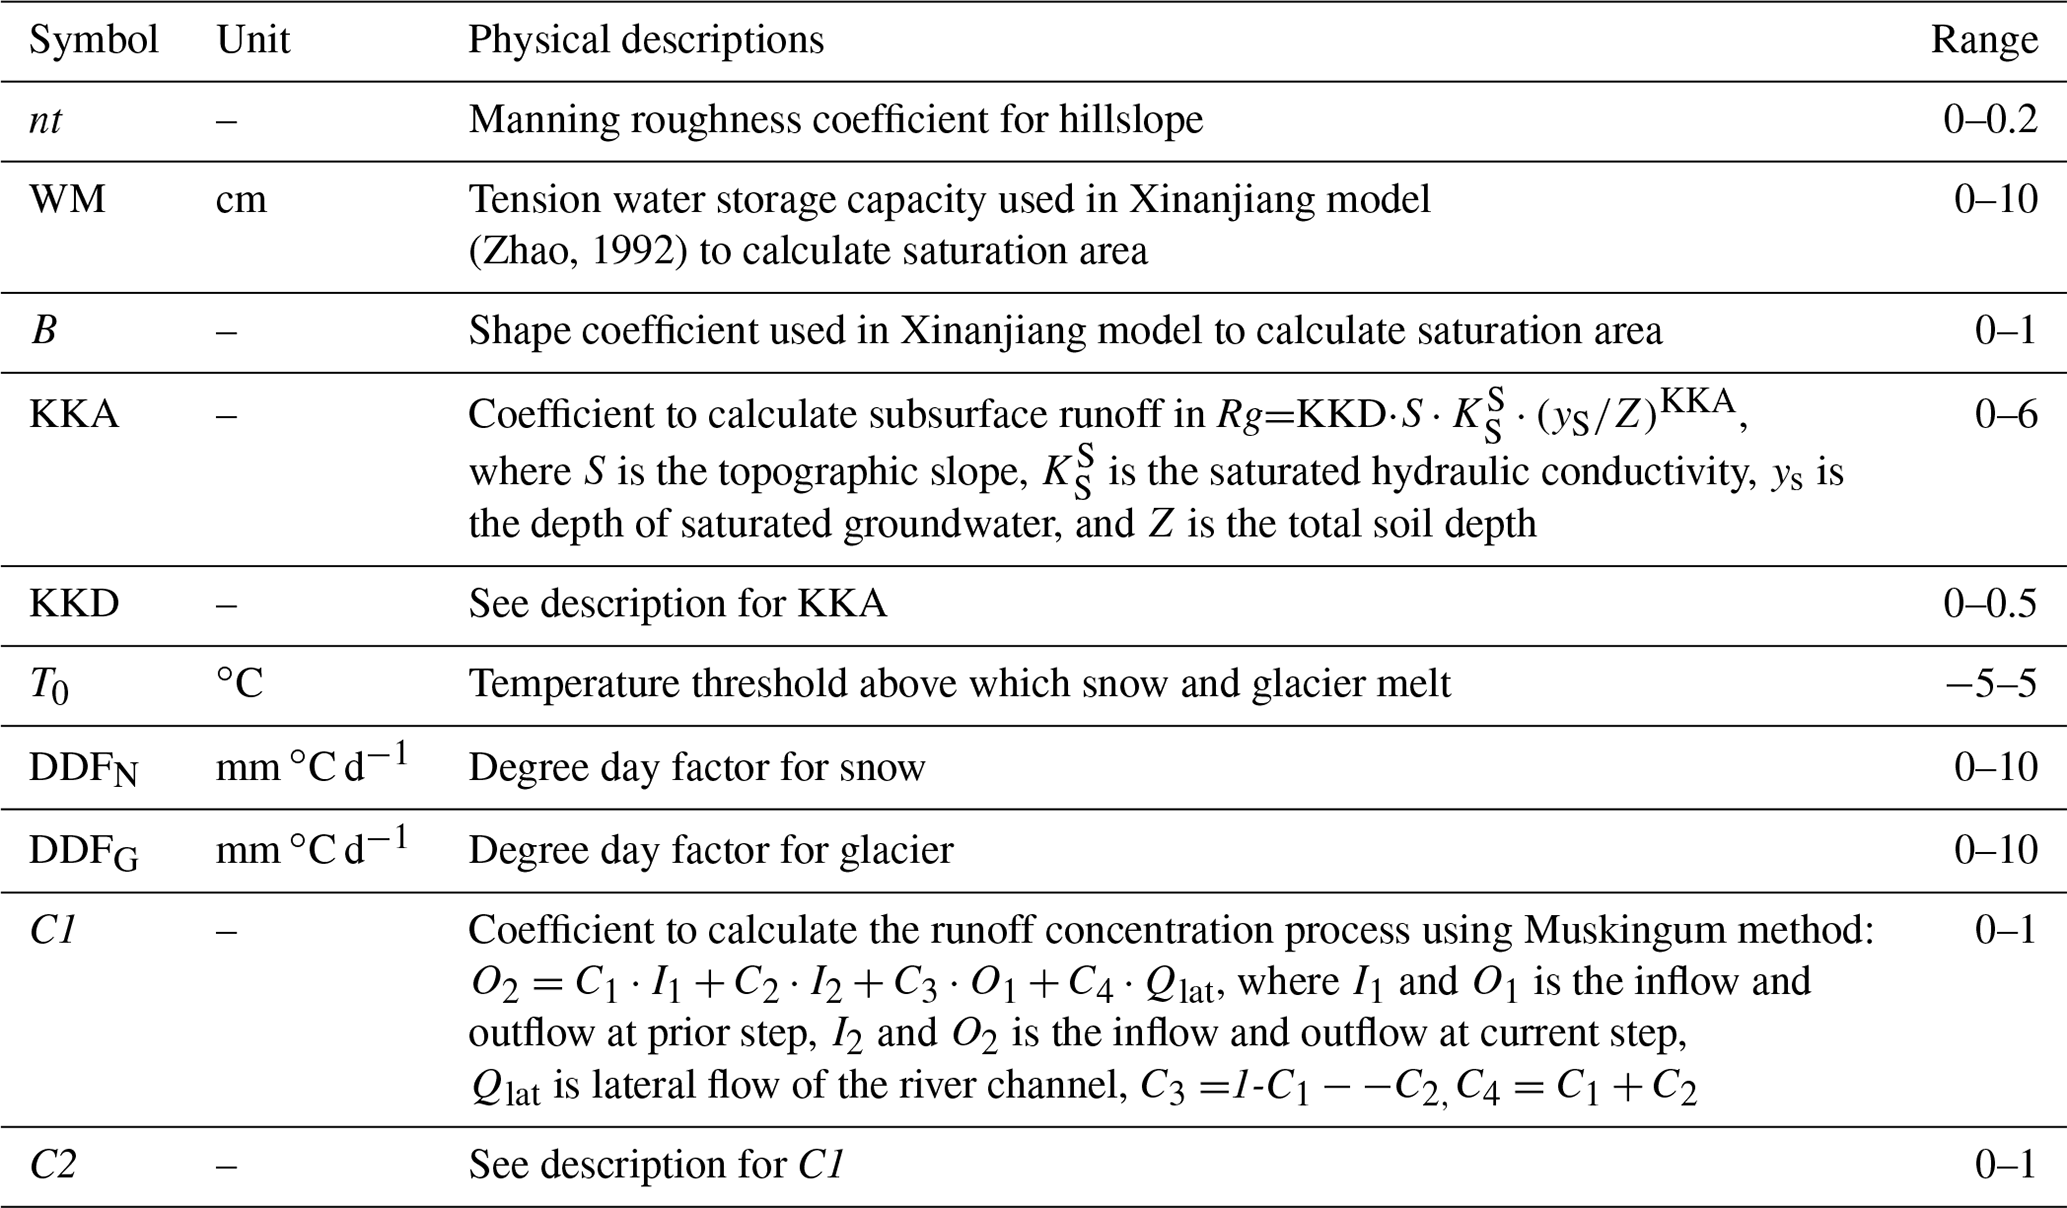
The physical basis and value ranges of the calibrated parameters in the THREW-t model are described in Table 2. In both modeling catchments of YTR and KR, the parameter values were optimized using the following three calibration variants: (1) a dual-objective calibration, using observed discharge and the MODIS snow covered area fraction (SCA), (2) a triple-objective calibration, using observed discharge, MODIS SCA and δ18O measurements of stream water forced by linearly interpolated measurements of site sampling precipitation isotope, and (3) a triple-objective calibration, using observed discharge, MODIS SCA and δ18O measurements of stream water but forced by the isoGSM precipitation isotope data. Metrics used to evaluate the simulations of discharge, SCA and isotope are listed in Eqs. (5)–(7).
where n is the total number of observations. Subscripts “o” and “s” refer to observed and simulated variables, respectively. is the average value of observed streamflow during the assessment period.
An automatic procedure based on the Python Surrogate Optimization Toolbox (pySOT) algorithm developed by Eriksson et al. (2017) was implemented for all three calibration variants to identify the behavioral parameters. The pySOT algorithm used a surrogate model to guide the search for improved solutions, with the advantage of needing few function evaluations to find a good solution. An event-driven framework, Plumbing for Optimization with Asynchronous Parallelism (POAP), was used for building and combining the asynchronous optimization strategies. The optimization was stopped if a maximum number of allowed function evaluations was reached, which was set as 3000 in this study. For both modeling catchments, the pySOT algorithm was repeated 150 times for each calibration variant. Although the measurement unit of NSEdis is different from RMSESCA and MAEiso, their values are of the same order of magnitude (0–1) when the model performances were acceptable (Ala-aho et al., 2017; Nan et al., 2021). Consequently, they were combined with equal weights for simplification to represent the simultaneous performance on multiple objectives. For the dual- and triple-objective calibration variants, NSEdis–RMSESCA and NSEdis–RMSESCA–MAEiso were chosen as the combined optimization objectives, respectively. Among the 150 final parameter sets produced by the pySOT runs, the behavioral parameter sets were selected by NSEdis thresholds, i.e., only the parameter sets producing NSEdis higher than an assumed threshold were regarded as behavioral parameter sets. Considering the model behaviors in the two catchments, the NSEdis threshold was chosen as 0.85 for the YTR basin and as 0.75 and 0.70 for dual- and triple-objective calibration variants in KR catchment, respectively. Focusing on the utility of isoGSM on the forcing tracer-aided model, the influence of the calibration objective function and the weight of each objective were not assessed in this study.
Considering the data availability, the calibration and validation periods for KR catchment were set as 2006–2010 and 2011–2012, respectively. For the YTR basin, discharge measured at the outlet station Nuxia, the MODIS SCA fraction over the basin area upper the Nuxia station and the stream water δ18O measured at the Nuxia station were used for calibration. Calibration and validation periods of 2001–2005 and 2006–2010 were selected to test the model performance for simulations of discharge and SCA at the Nuxia station. In addition, discharge measured at the internal hydrological stations of Yangcun and Nugesha during 2001–2010 were used to validate the spatial consistency of the calibrated model parameters. Model performance on simulating stream water isotope at the Nuxia station in a validation period was not assessed, as stream water isotope measurements were available only during 2005. However, stream water δ18O measured during 2005 at the internal hydrological stations of Yangcun, Nugesha and Lazi were adopted to validate the model performance on simulating spatial stream water δ18O within YTR basin.
3.1 Comparison between isoGSM and measured precipitation δ18O
Figures 2a and 3a show the comparison between isoGSM and measured precipitation δ18O at four sampling sites in the YTR basin. The isoGSM data presented similar fluctuations in the seasonal precipitation δ18O compared to the sampling measurements (Fig. 3a). In particular, both isoGSM and sampling measurements showed high precipitation δ18O in May and reached relatively low values in the wet season during August and September. However, the original isoGSM data tended to overestimate the measured precipitation δ18O in the sampling periods (Fig. 2a). From downstream to upstream, the weighted average precipitation δ18O of the samples collected at the four stations (Nuxia, Yangcun, Nugesha and Lazi) were −9.58 ‰, −14.01 ‰, −14.80 ‰ and −17.86 ‰, respectively, while the corresponding weighted average values of isoGSM pixels containing the sampling stations during the same period were −7.53 ‰, −8.38 ‰, −9.22 ‰ and −9.61 %, respectively. Bias between isoGSM data and sampling measurement tended to be larger at upstream stations with higher elevations, partly due to the coarse spatial resolution of general circulation models (GCMs) which cannot reproduce the effect of regional topography well. In contrast, the corrected isoGSM data (black lines in Fig. 3a) captured the relatively low values in the late wet season better than the original data (gray lines in Fig. 3a), and the scatter points fall closer to the 1 : 1 line (Fig. 2b). The mean absolute error (MAE) of the isoGSM precipitation δ18O in the YTR reduced from 6.65 ‰ to 4.91 ‰ after correction. Similarly, the original isoGSM data presented comparable seasonal fluctuations in the precipitation isotopes to the sampling measurement at the Wengguo station in the KR catchment (Fig. 3b), but the weighted average of the precipitation δ18O in the original isoGSM data (−10.95 ‰) is much higher than that in the sampling measurement (−15.97 ‰; Figs. 2c and 3b). After bias correction, the overestimation was much reduced (Fig. 2d), as indicated by a reduced MAE value from 6.24 ‰ to 4.47 ‰. Underestimation of the precipitation δ18O by the original isoGSM data in spring of 2011 and 2012, respectively however, was not improved by the bias correction.
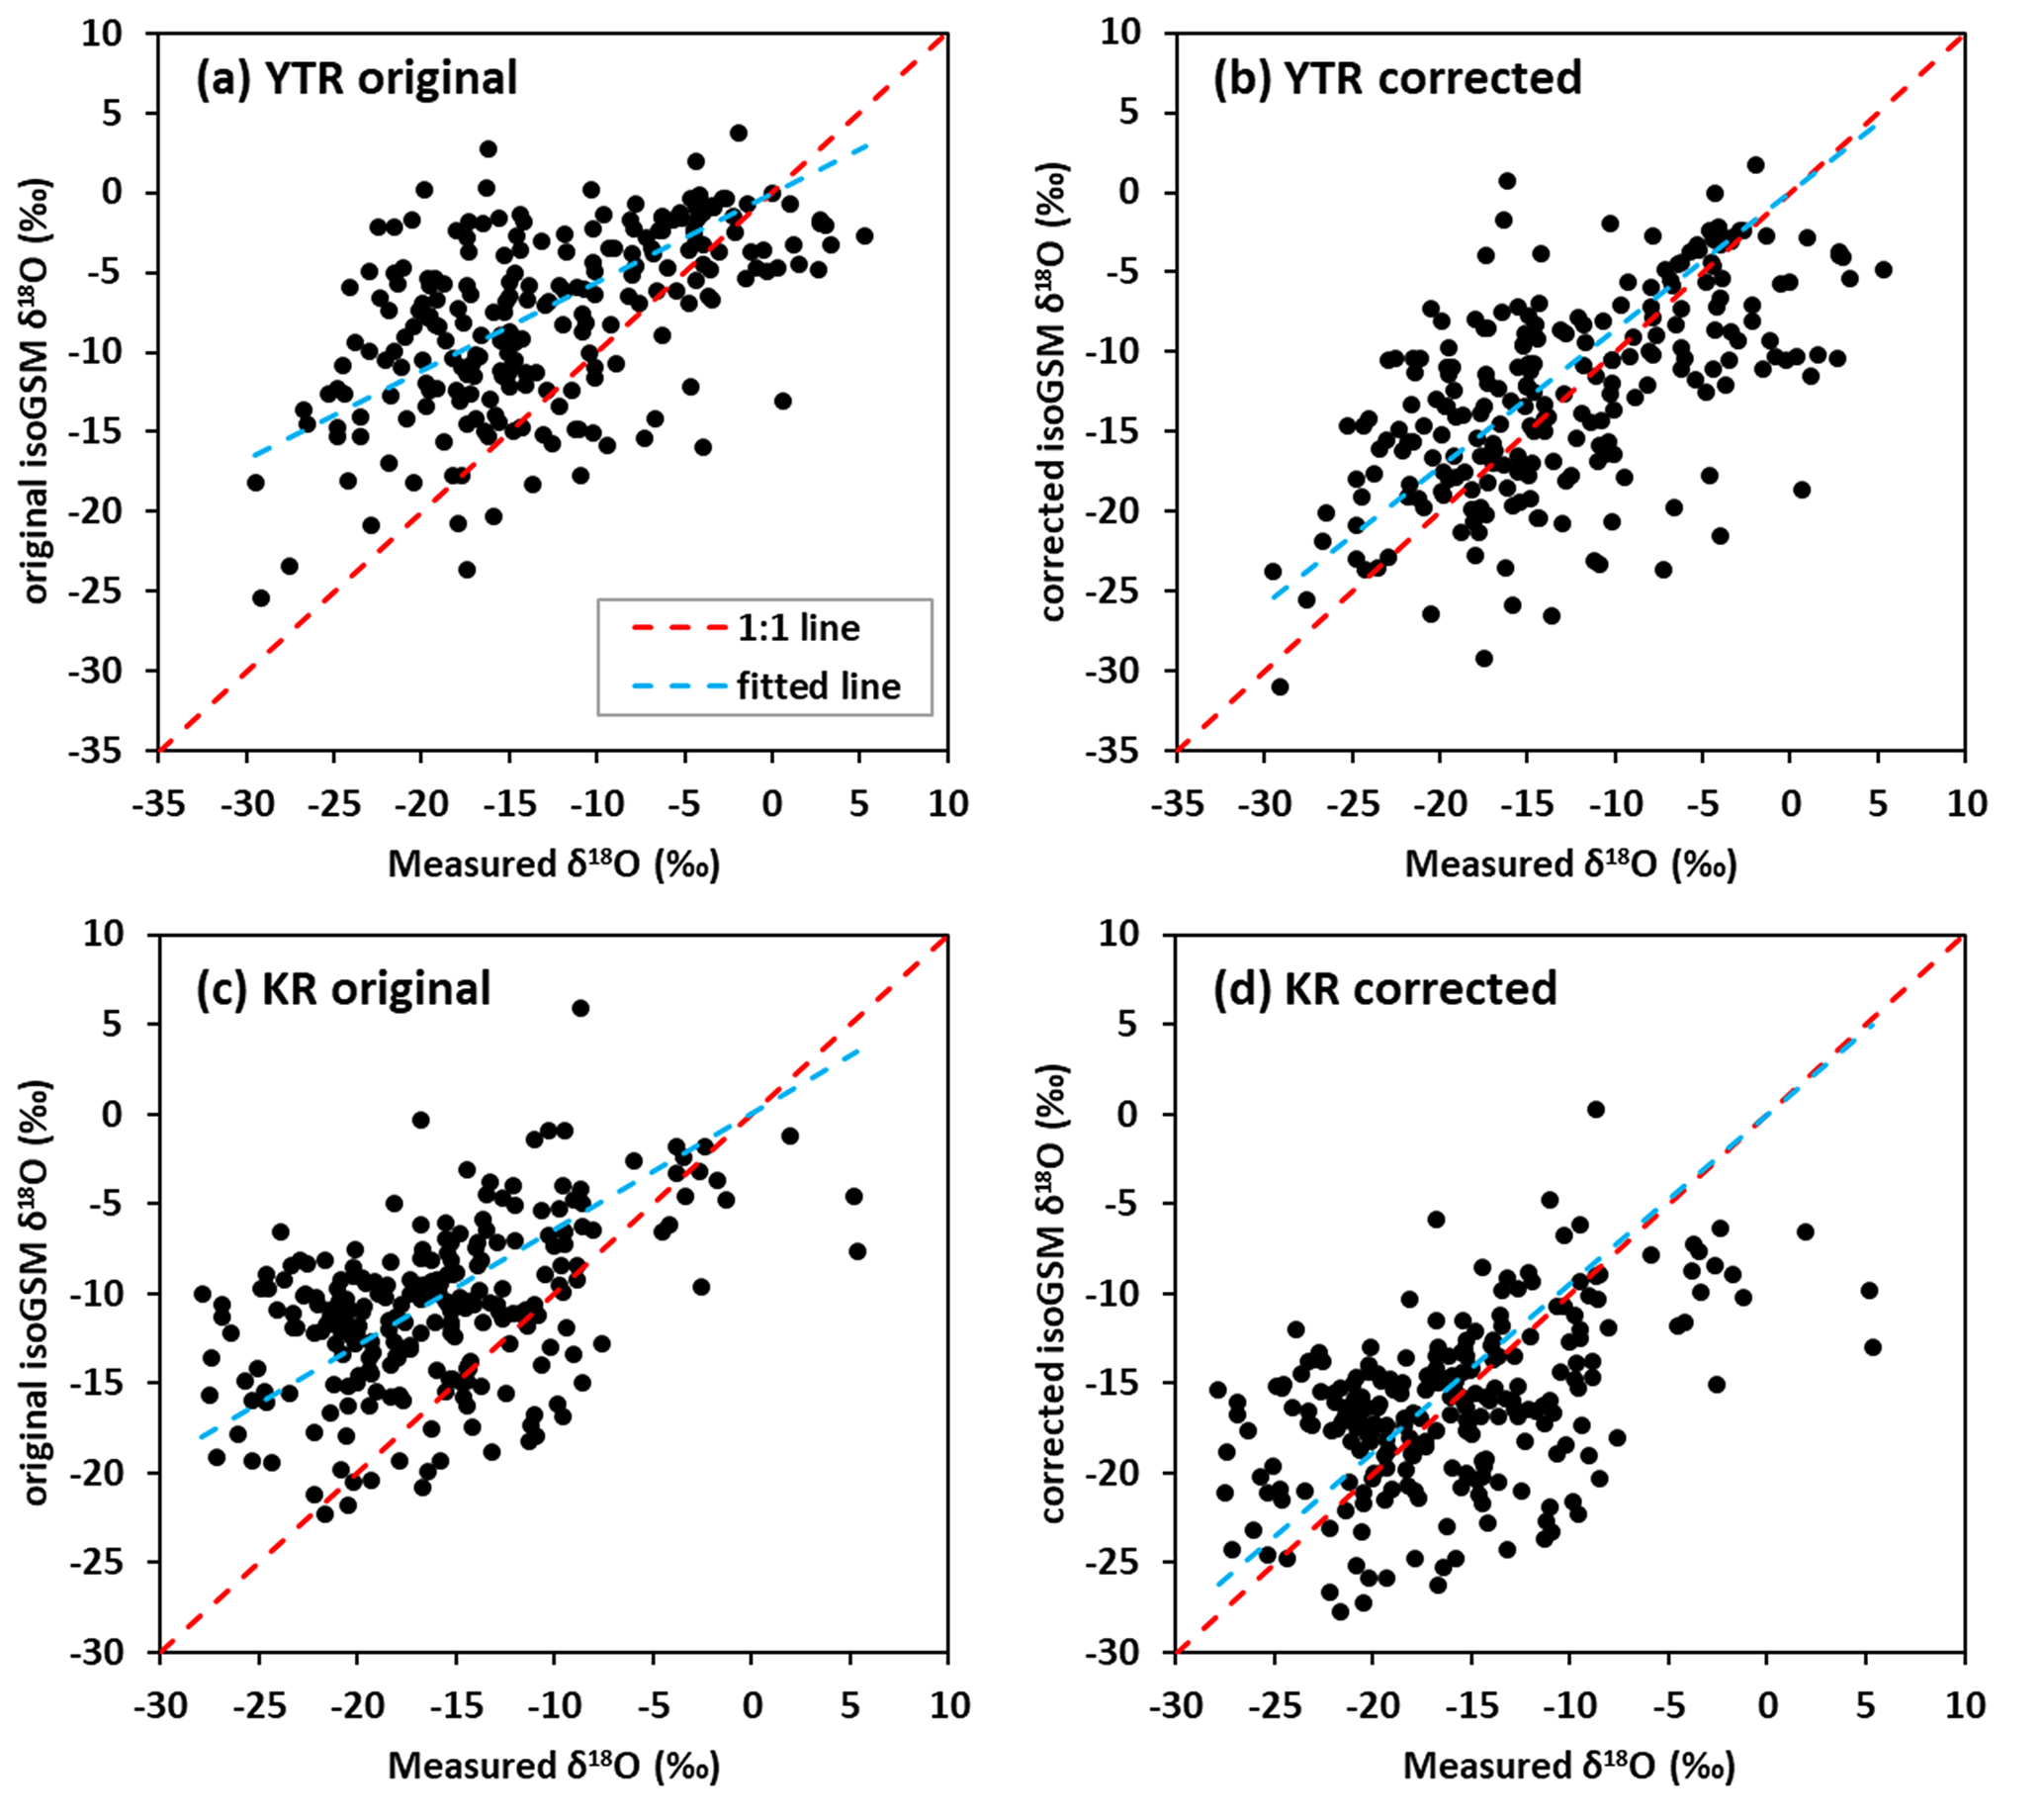
Figure 2The scatter diagrams between the original/corrected isoGSM and measured isotope data in the YTR basin (a, b) and KR catchment (c, d).

Figure 3Temporal variations in the precipitation δ18O derived from measured and isoGSM data in the YTR basin (a1–a4) and KR catchment (b).
Based on the multiple linear regression, the coefficients x, y and z in Eq. (1) were estimated as −0.003, 0.574 and −52.6, respectively, with a R2 value of 0.98, to interpolate the measured isotope data to estimate the spatial precipitation isotope over the YTR basin. The negative x and positive y values were consistent with their physical meanings. Parameters a and b in Eq. (3) were estimated as being −0.0046 and 14.96, based on the biases between isoGSM data and the sampling measurements at the four sampling sites in the YTR. Figures 4 and 5 show the comparison of the weighted averages of precipitation δ18O on 63 REWs derived from the corrected isoGSM data and the interpolated sampling measurement. It is shown that the distributions of precipitation isotopes with altitude were rather similar in the two data sets (Fig. 4b). However, distributions across the longitudes show visible differences. The largest differences between the two data sets were located in the western upstream region (long. < 86∘) and the source region of the Lhasa River tributary (93∘ > long. > 86∘, lat. > 30∘; Figs. 4a and 5). In comparison to the corrected isoGSM data, the interpolated sampling measurement estimated a much lower isotope signature in the upstream region, while presenting a higher isotope signature in the upper Lhasa River. As the site-sampled data of the precipitation was insufficient to test which of the two data sets captured the west–east distribution of precipitation isotope better, the model performance on simulating isotope signatures of stream water measured at hydrological stations from west to east forced by the two data sets provides a perspective to assess the precipitation isotope estimations.
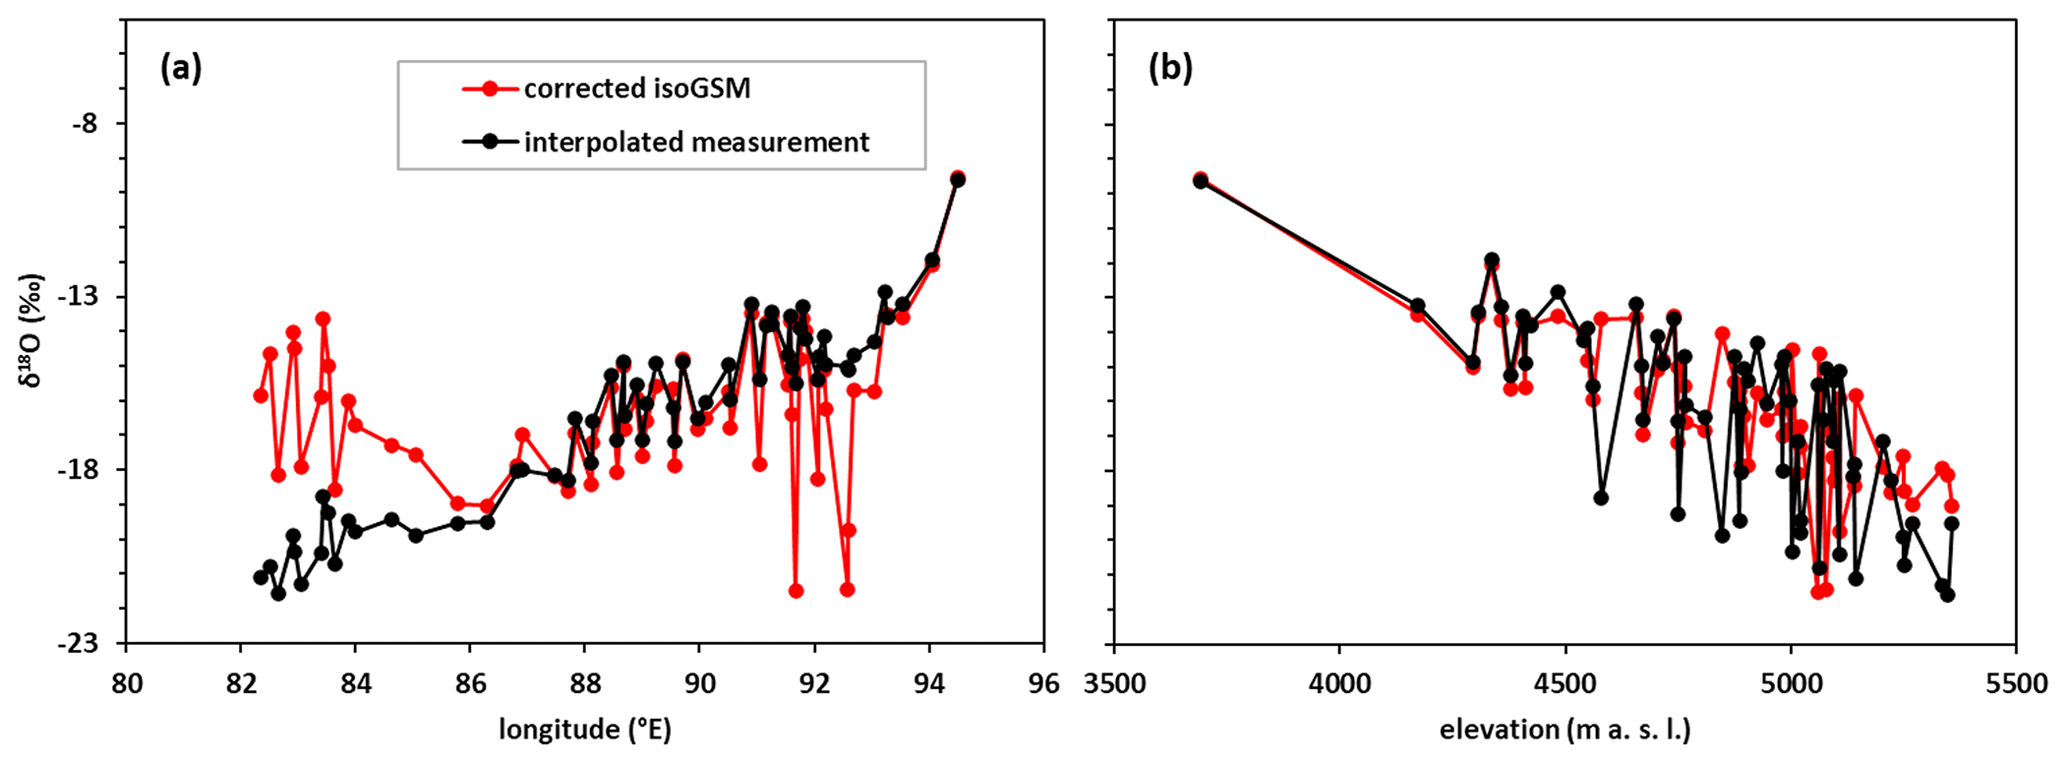
Figure 4Comparisons of the weighted averages of precipitation δ18O on 63 REWs in the YTR basin by longitude (a) and elevation (b).
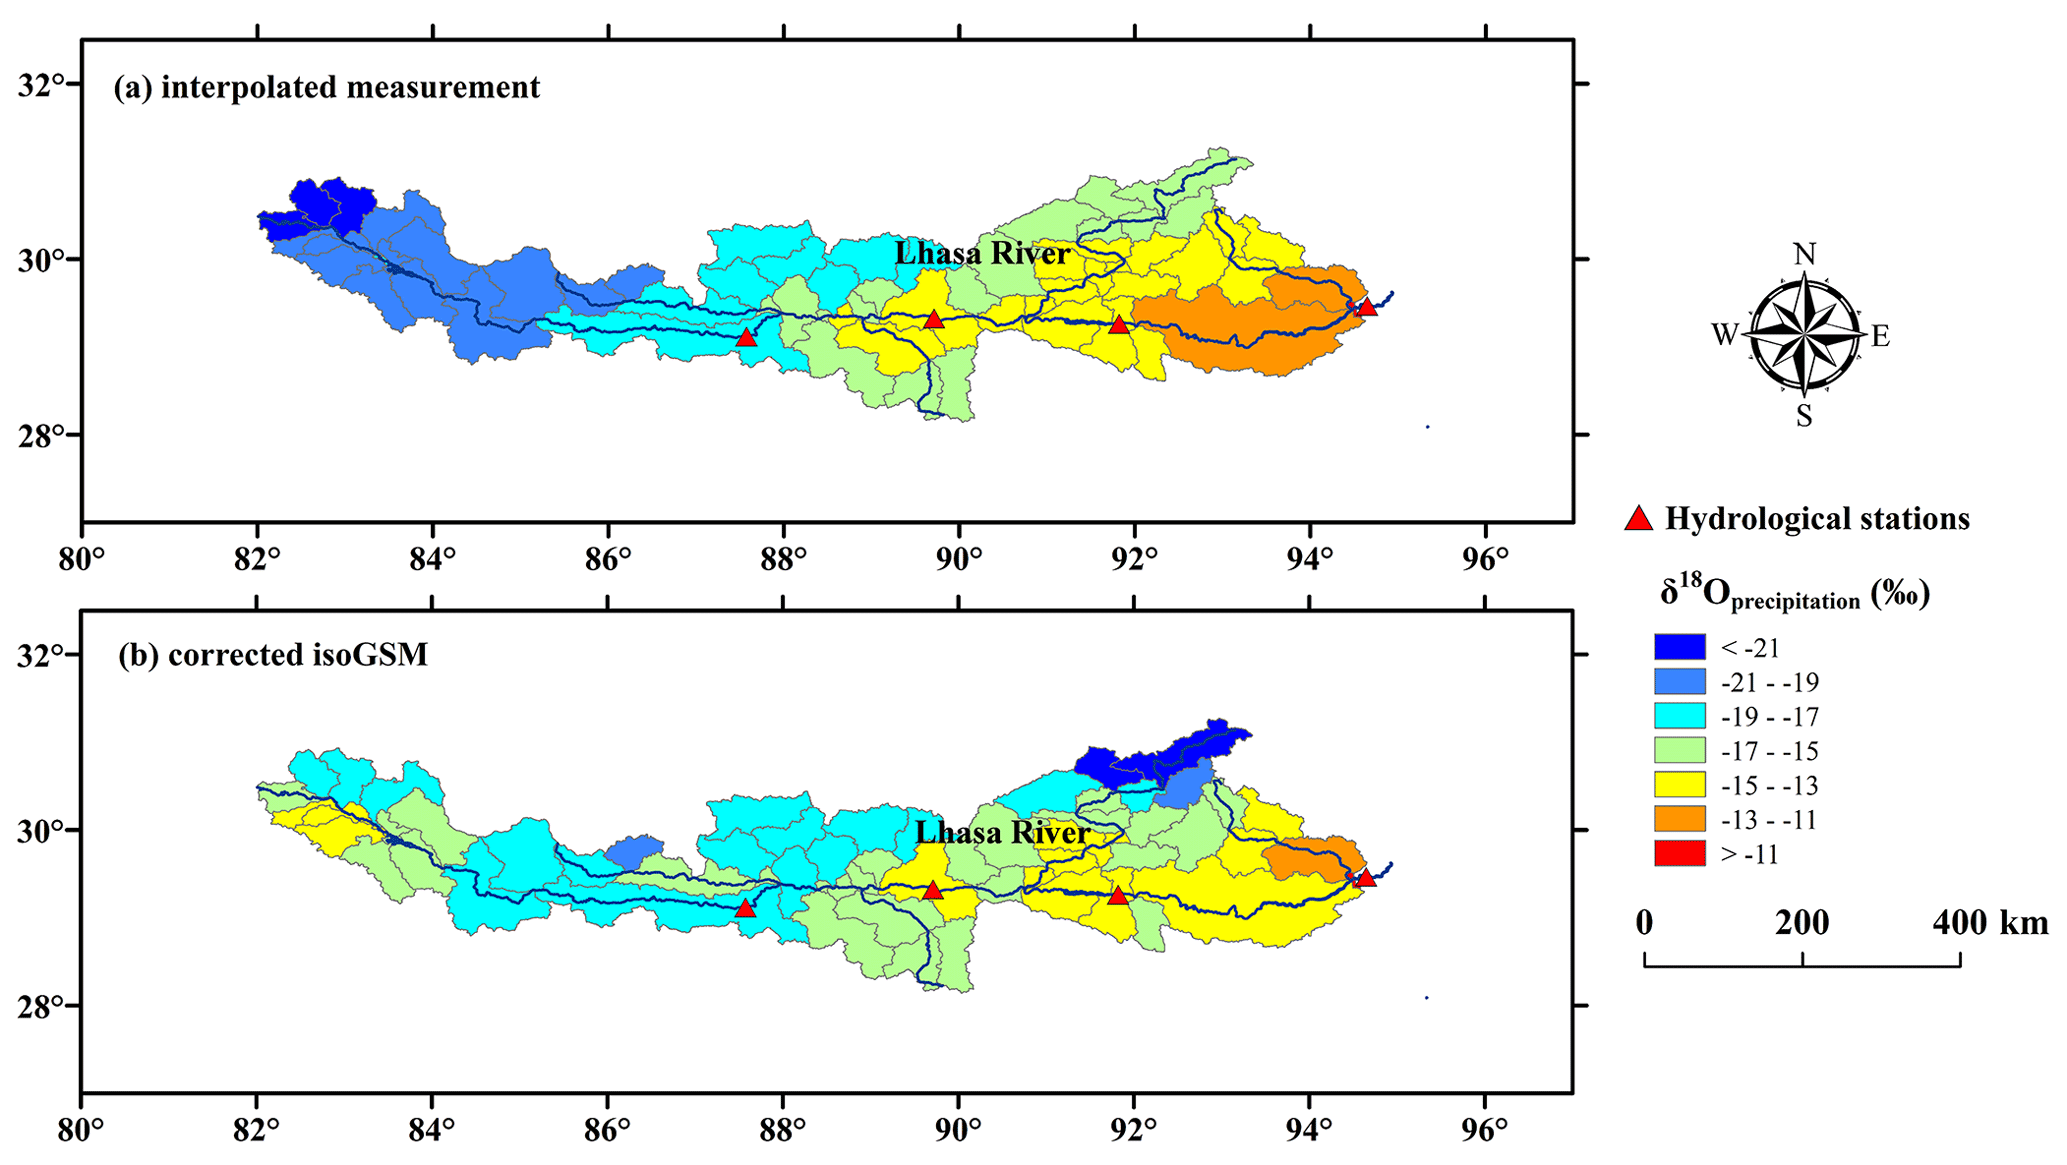
Figure 5Spatial distribution of average precipitation isotope composition obtained by (a) interpolated measurement data and (b) corrected isoGSM.
3.2 Model performance for the simulations of discharge and stream water isotope
Figures 6–7 and Table 3 show the model performance of different calibration variants in the YTR basin produced by the behavioral parameter sets. The three calibration variants produced similar simulations of discharge and SCA (Fig. 6), in spite of the slightly higher NSEdis and lower RMSESCA estimated by the dual-objective calibration (Table 3). For the simulation of stream water δ18O, the dual-objective calibration produced the worst MAEiso values in three out of the four testing stations with the largest uncertainty ranges (Fig. 7a), which can be expected as isotope data were not involved in this calibration. The two triple-objective calibration variants produced a good simulation for the stream water isotope at the Nuxia station in the calibration year of 2005 (Fig. 7b and c). However, the triple-objective calibration variant forced by isoGSM data estimated a worse performance (i.e., higher MAEiso values) for stream water δ18O at the stations of Yangcun and Nugesha than the calibration forced by the interpolated sampling measurement showing significant underestimations for peak isotope values in June at Yangcun station and higher overestimations for isotope values after August at Nugesha. This was due to the poor performance of isoGSM when capturing the isotope signature of individual precipitation events during a specific period (see Fig. 3a), despite being corrected already. For example, the weighted average of measured precipitation δ18O in June at the Yangcun station was −5.87 ‰, while the average of corrected isoGSM data showed a value of −10.09 ‰, leading to an underestimated peak value. Similarly, the weighted average of measured precipitation δ18O at Nugesha during August was −16.34 ‰, while the corrected isoGSM data estimated an average of −11.47 ‰, leading to an overestimated stream δ18O in the late wet season. In spite of that, the performance of the simulated stream water δ18O at Nuxia, Yangcun and Nugesha stations forced by the corrected isoGSM data can still be considered as acceptable, given that the MAEiso values were generally around 1 (Fig. 7c). For the most upstream station of Lazi, however, the triple-objective variant forced by measured precipitation δ18O produced a significantly underestimated δ18O of stream water, likely due to the underestimated precipitation δ18O in the upstream high altitudes produced by the interpolated measurement data (Figs. 4a and 5). The good performance of simulated stream water δ18O at the Lazi station, driven by the corrected isoGSM data, demonstrated that the corrected isoGSM estimated a better precipitation isoscape in high altitudes of the study catchment than the linearly interpolated measurement data, as it partly benefitted from the information of spatial precipitation isotope implied in the gridded values. It is worth noting that the model simulations forced by corrected isoGSM estimated narrower uncertainty bands for stream water δ18O at Nuxia, Yangcun and Nugesha, and smaller value ranges of the MAEiso metric at all the four stations, in comparison to the simulations driven by the interpolated precipitation δ18O. Compared to the simulations yielded by the dual-objective calibration, the triple-objective calibration variants simulated smaller uncertainty ranges for stream water δ18O and slightly narrowed value ranges of objective metrics for the simulations of discharge and SCA with the lower behavioral ratios of calibrated parameter sets in Table 3, indicating good potential of isotope data to reduce modeling uncertainty and improve parameter identifiability.
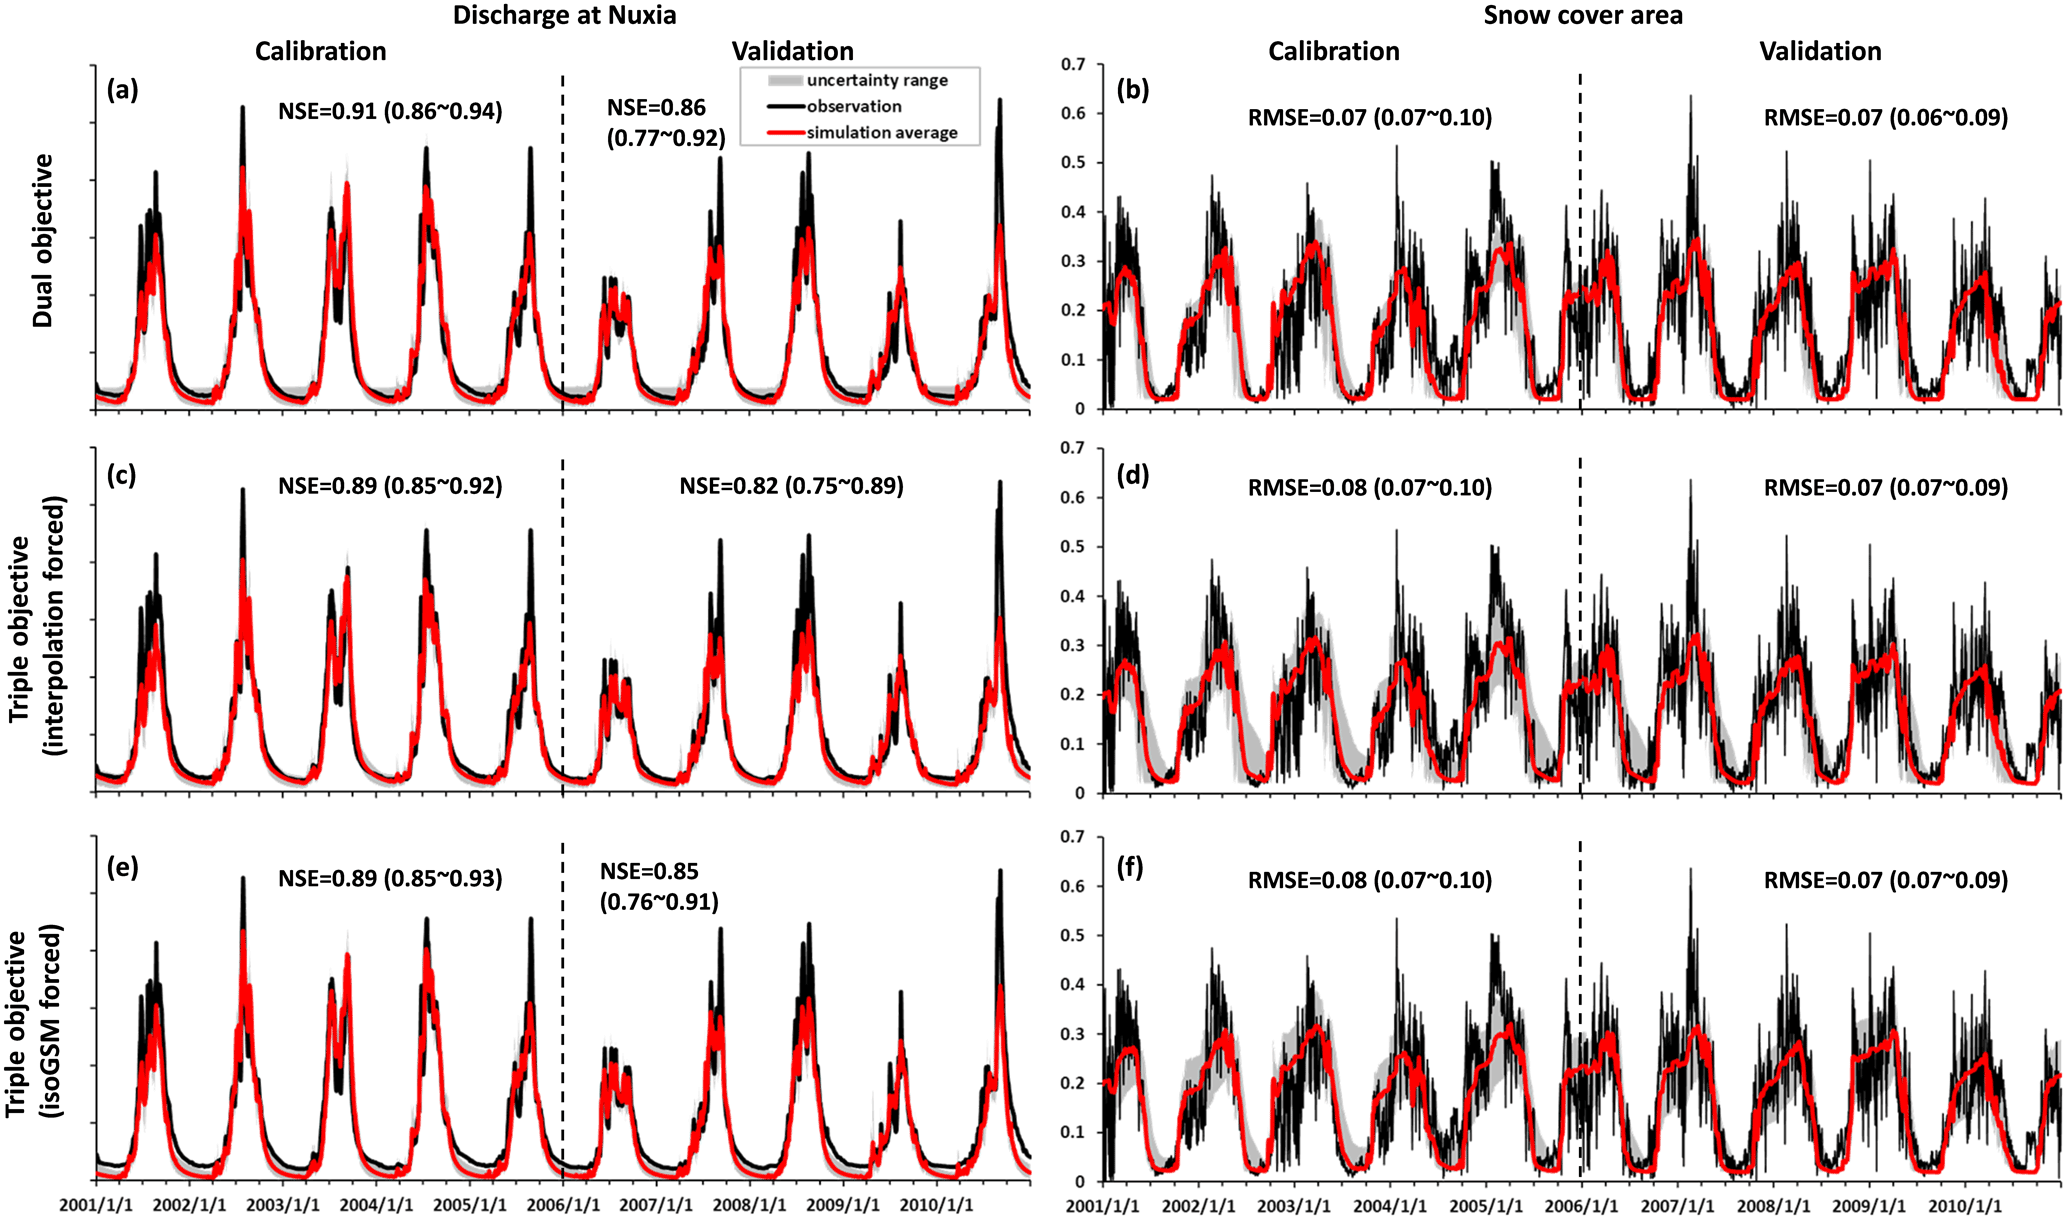
Figure 6Uncertainty ranges of discharge (Nuxia station) and SCA simulations in the YTR basin during calibration and validation periods produced by the behavioral parameter sets of the dual-objective (a, b), interpolation-forced triple-objective (c, d) and isoGSM-forced triple-objective (e, f) calibration variants. The discharge data are hidden due to the data security policy.

Figure 7Uncertainty ranges of stream water δ18O simulations at four stations in 2005 produced by the behavioral parameter sets of the dual-objective (a), interpolation-forced triple-objective (b) and isoGSM-forced triple-objective (c) calibration variants.
Table 3Comparisons of the model performance in the YTR basin produced by different calibration variants.
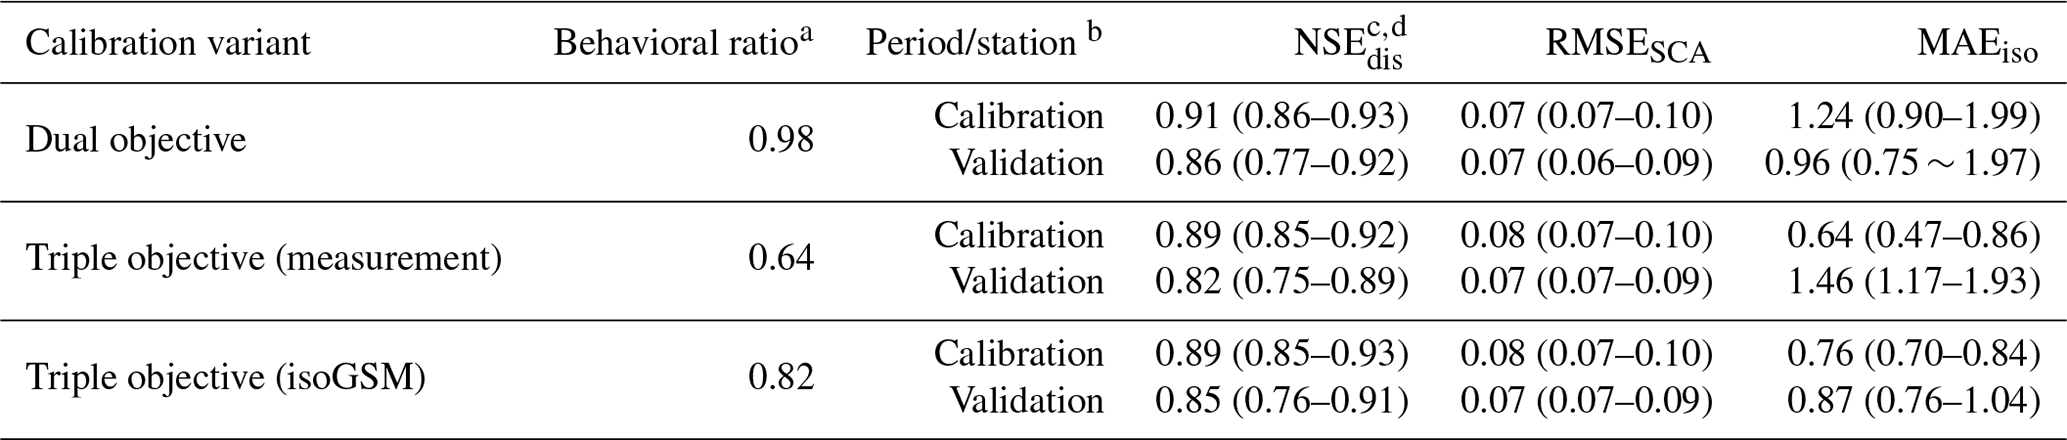
a The behavioral ratio represents the ratio of behavioral parameter set number to the runtime of the pySOT program. b The period refers to the discharge and SCA simulation, and the station refers to the isotope simulation. c Values in parentheses represent the minimal and maximal values produced by the behavioral parameter sets. d NSEdis is calculated based on the simulated and observed streamflow at Nuxia station.
The simulated hydrographs at two internal hydrological stations of Yangcun and Nugesha were compared in Fig. 8 to assess the spatial consistency of model parameters calibrated by the different variants. The isoGSM-forced triple-objective calibration produced the highest performance for discharge simulation at the two internal stations (Fig. 8e and f) indicated by the highest averages (0.82 and 0.74 for Yangcun and Nugesha) and minimal values (0.72 and 0.53 for Yangcun and Nugesha) of the NSE (Nash–Sutcliffe efficiency) and the smallest values ranges of the NSE. The dual-objective calibration produced a lower performance for the discharge simulation than the isoGSM-forced triple-objective calibration (with average NSE of 0.8 and 0.67 at Yangcun and Nugesha) with a much larger uncertainty of the baseflow simulation (Fig. 8a and b). The interpolation-forced triple-objective calibration produced a higher mean NSE (0.81 and 0.74 for Yangcun and Nugesha) but smaller minimal NSE (0.62 and 0.31 for Yangcun and Nugesha) than the dual-objective calibration with the largest values ranges of NSE at the two stations. Moreover, the isoGSM-forced triple-objective calibration performed best at capturing the peak flows in summer at both stations.
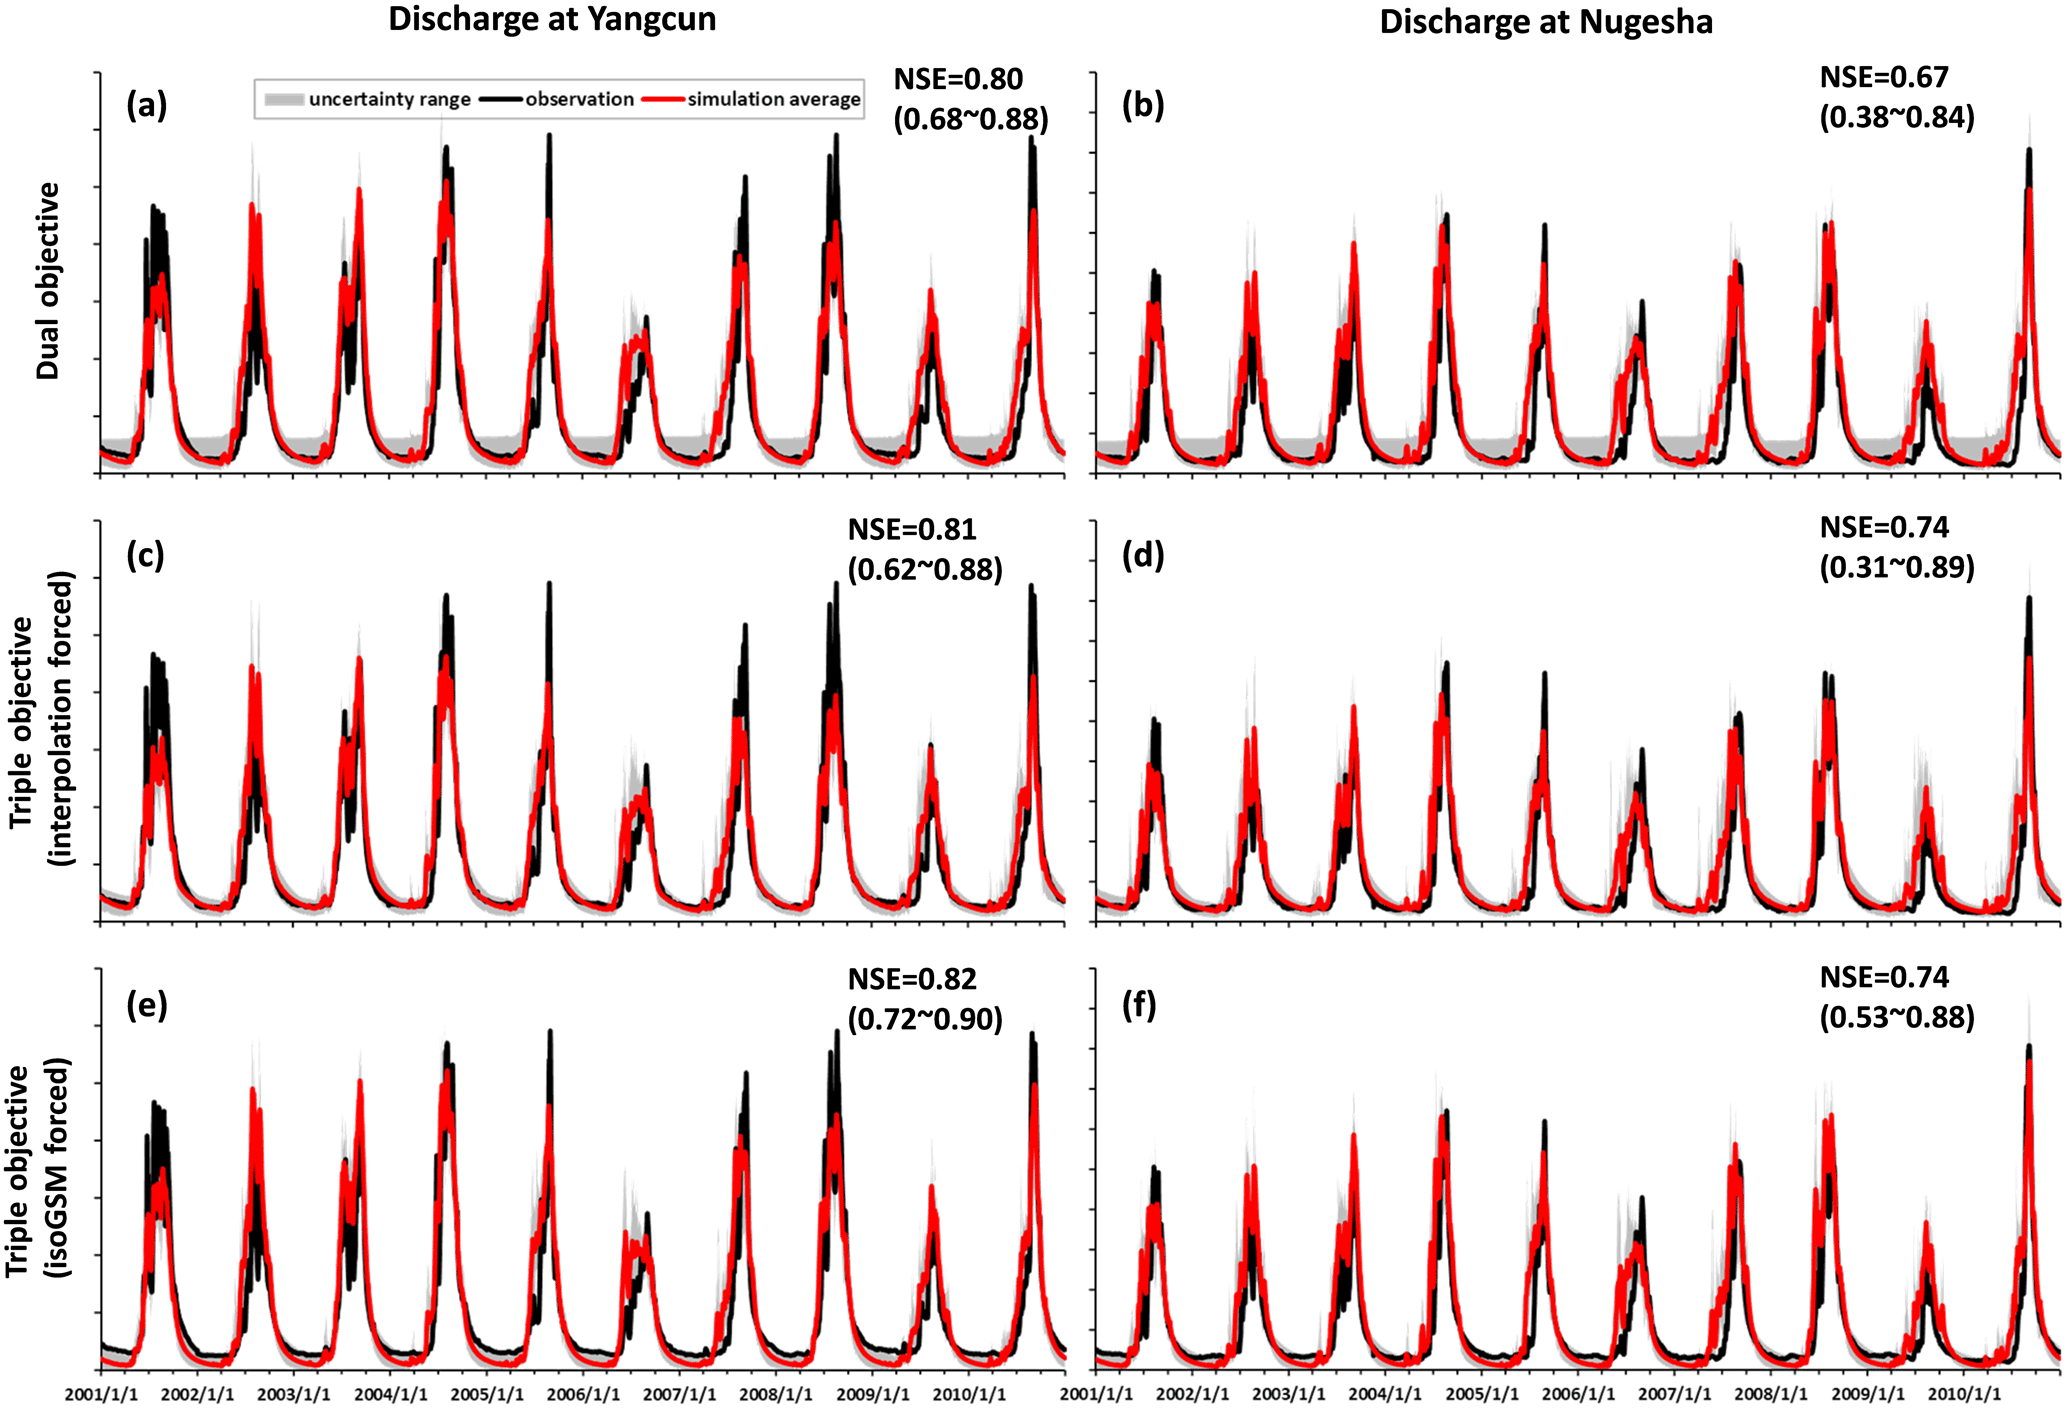
Figure 8Uncertainty ranges of discharge simulations at Yangcun and Nugesha stations produced by the behavioral parameter sets of the dual-objective (a, b), interpolation-forced triple-objective (c, d) and isoGSM-forced triple-objective (e, f) calibration variants.
The model performances produced by the behavioral parameter sets of different calibration variants in the KR catchment are shown in Figs. 9–10 and Table 4. All the three calibration variants presented similar performances on simulating streamflow, while the two triple-objective calibrations resulted in narrower uncertainty ranges, especially for the baseflow (Fig. 9c and e). The declining SCA in spring–summer was captured well in all the calibration variants (Fig. 9b, d and f). Triple-objective calibrations driven by the two isotope data sets performed comparably well when simulating the isotopic composition of stream water in the calibration period (Fig. 10b and c) indicated by the low average values of MAEiso (0.68 and 0.69) and the well-captured seasonal fluctuations of stream water δ18O. The peak isotopic values in the period around June 2007 were not captured well by the isoGSM-driven model (Fig. 10c), resulting in a relatively larger minimal MAEiso (0.57) than the interpolated measurement-driven result (0.48). This was due to the underestimation of isoGSM when estimating the isotope signatures of individual extreme precipitation events in June (see Fig. 3b). Specifically, there was a precipitation event larger than 20 mm d−1 in June 2007, for which the corrected isoGSM produced significantly lower δ18O (−21.55 ‰) than the sampling measurement (−9.83 ‰) at the Wengguo station. Despite that, the isoGSM-forced triple-objective calibration estimated a much better performance than the interpolated measurement-driven calibration for stream water δ18O in the validation period (Fig. 10b and c). Similar to the YTR, the triple-objective calibrations had much smaller behavioral parameter sets (19 and 18 for measurement- and isoGSM-forced calibration variants) than the dual-objective calibration (117) through 150 runs of the automatic calibration program, indicating strongly a increased identifiability of the model parameters and reduced uncertainty by using the isotope data.
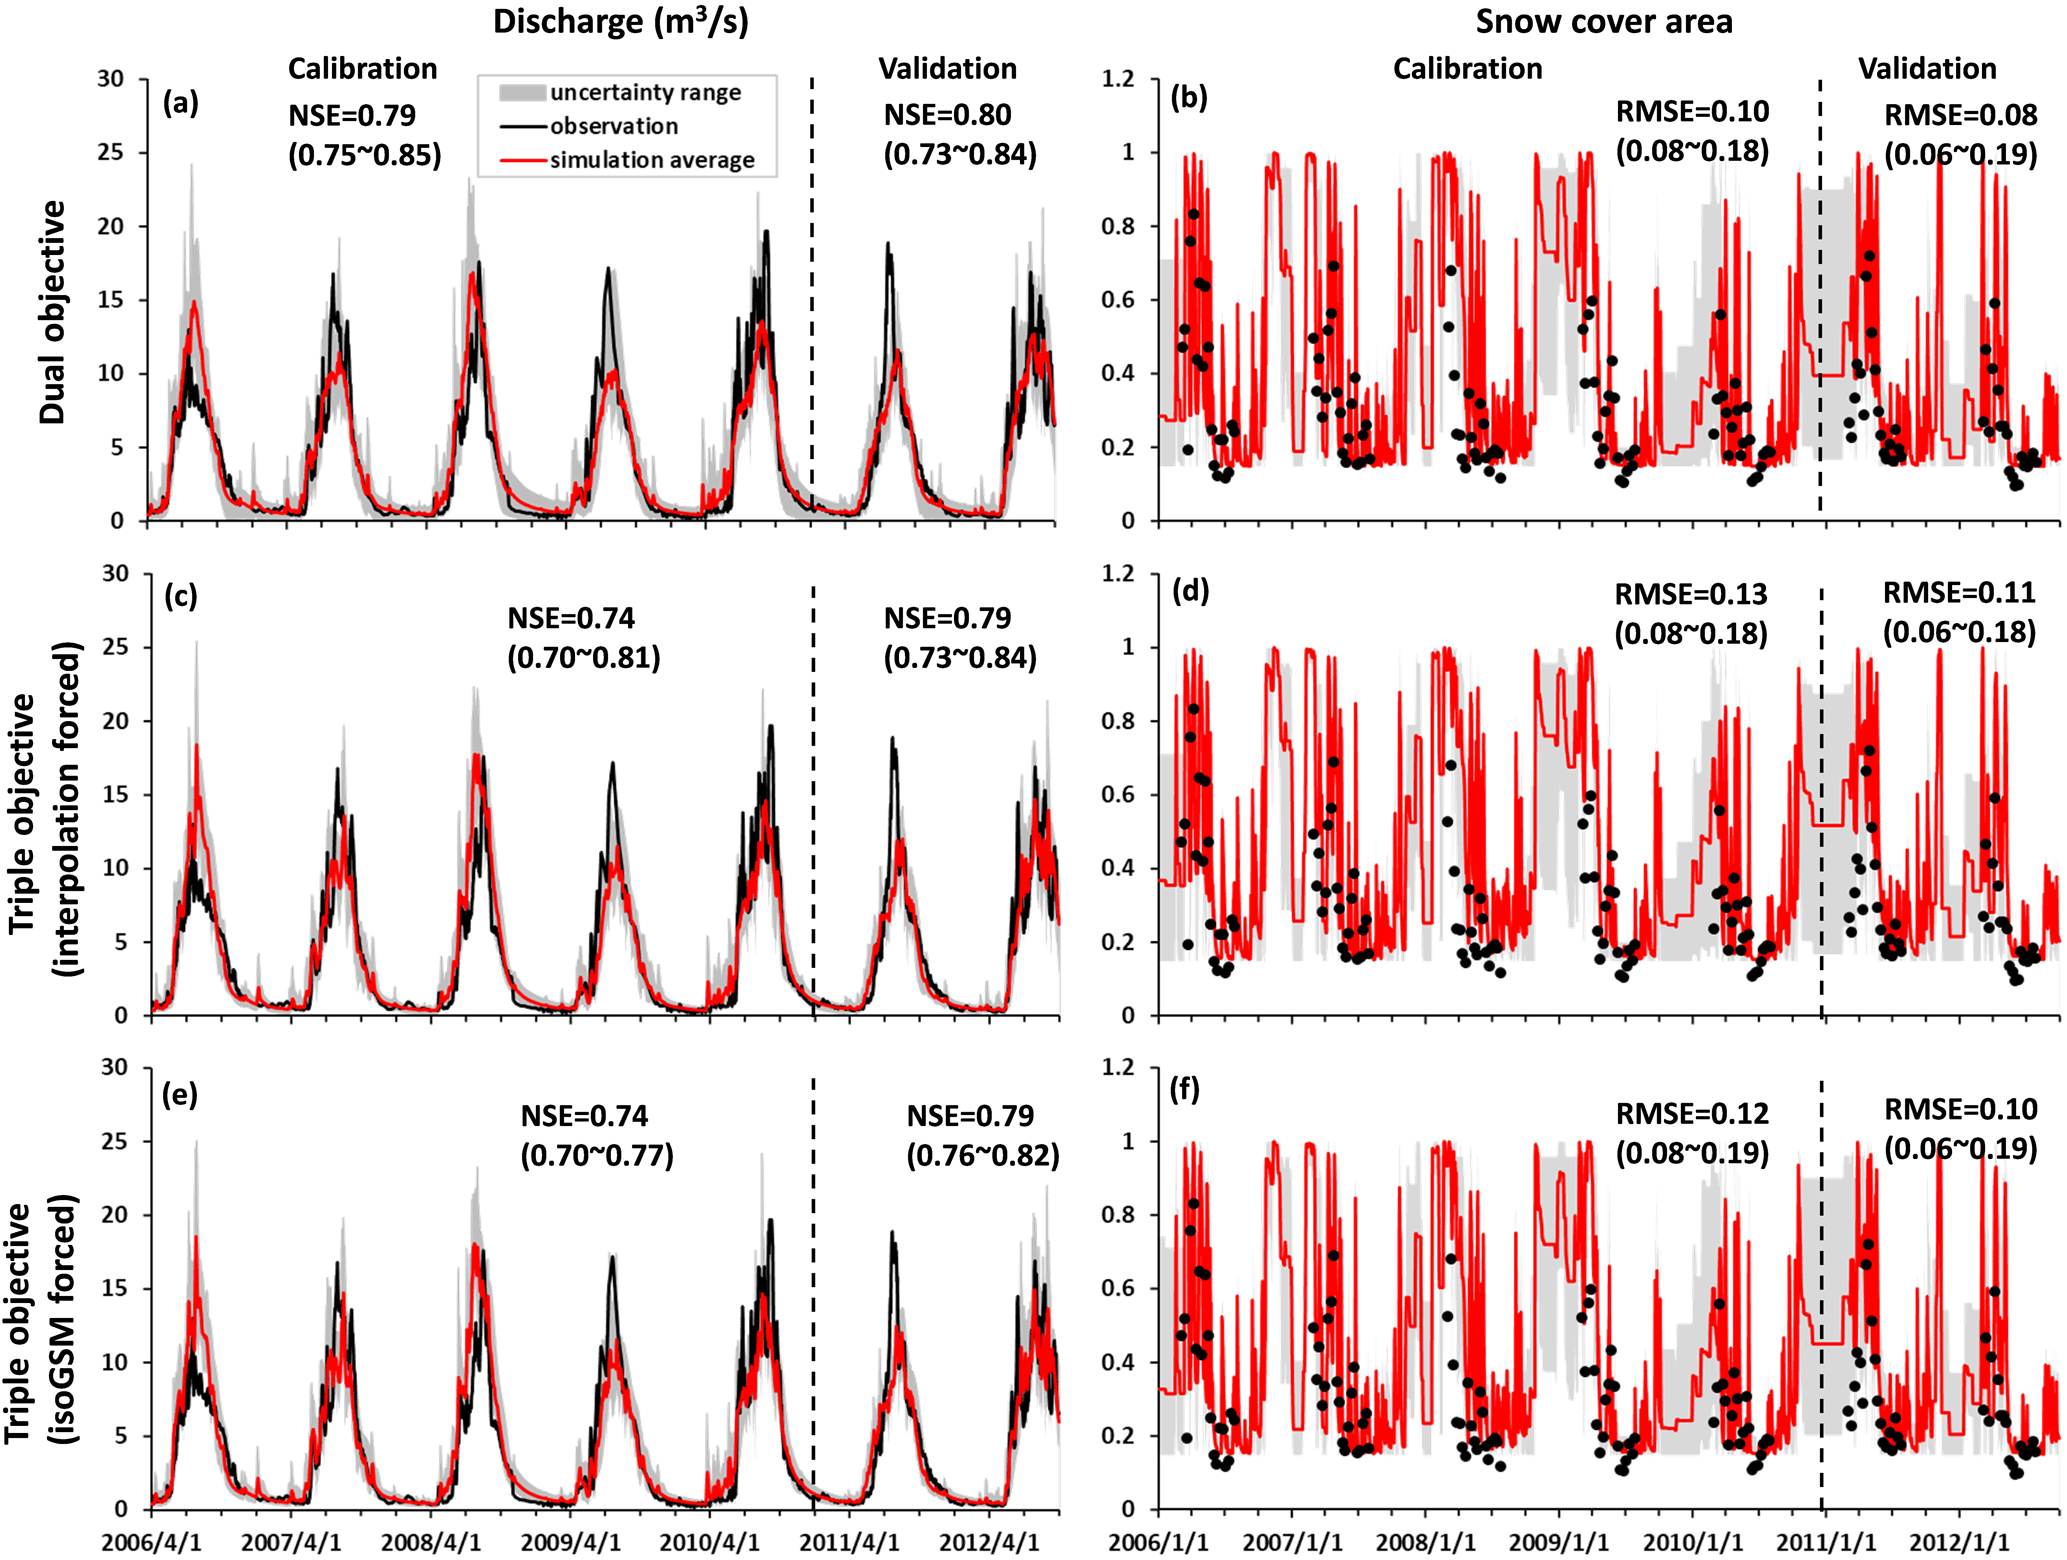
Figure 9Uncertainty ranges of discharge and SCA simulations in the KR catchment during the calibration and validation periods produced by the behavioral parameter sets of the dual-objective (a, b), interpolation-forced triple-objective (c, d) and isoGSM-forced triple-objective (e, f) calibration variants.
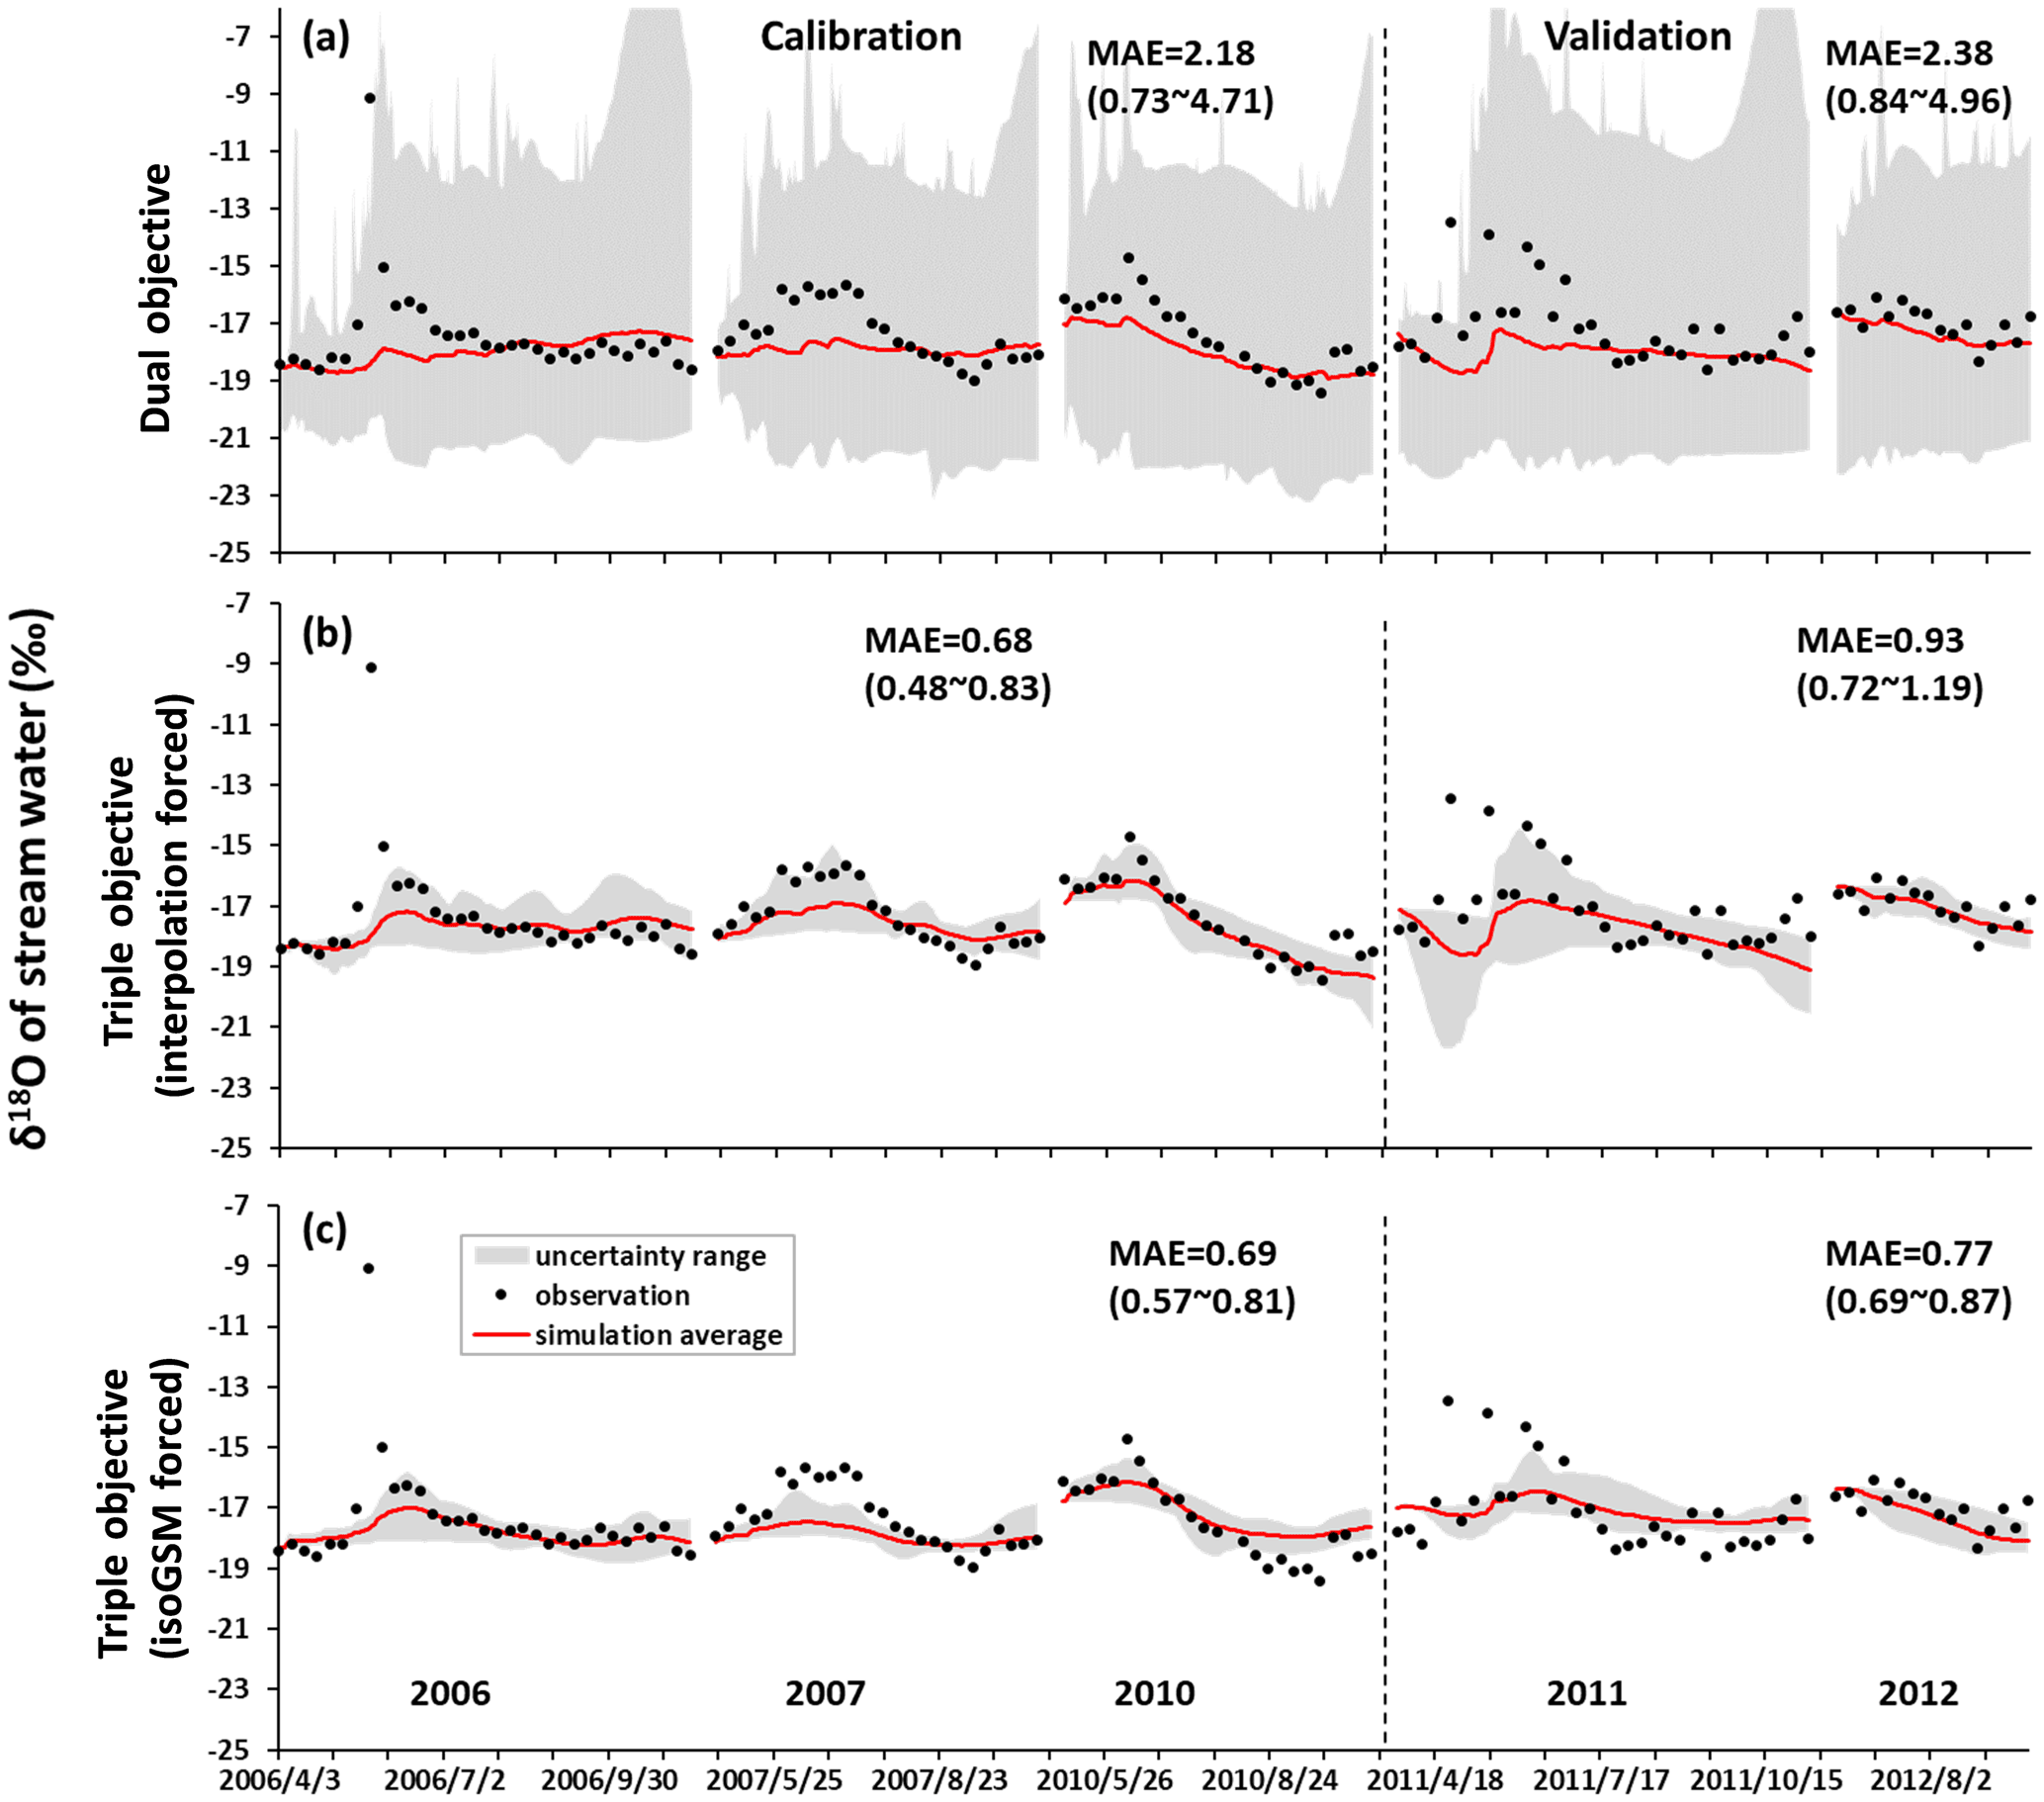
Figure 10Uncertainty ranges of stream water δ18O simulations in the KR catchment during the calibration and validation periods produced by the behavioral parameter sets of the dual-objective (a), interpolation-forced triple-objective (b) and isoGSM-forced triple-objective (c) calibration variants.
Table 4Comparisons of the model performance in the KR catchment produced by different calibration variants.

3.3 Contributions of runoff components
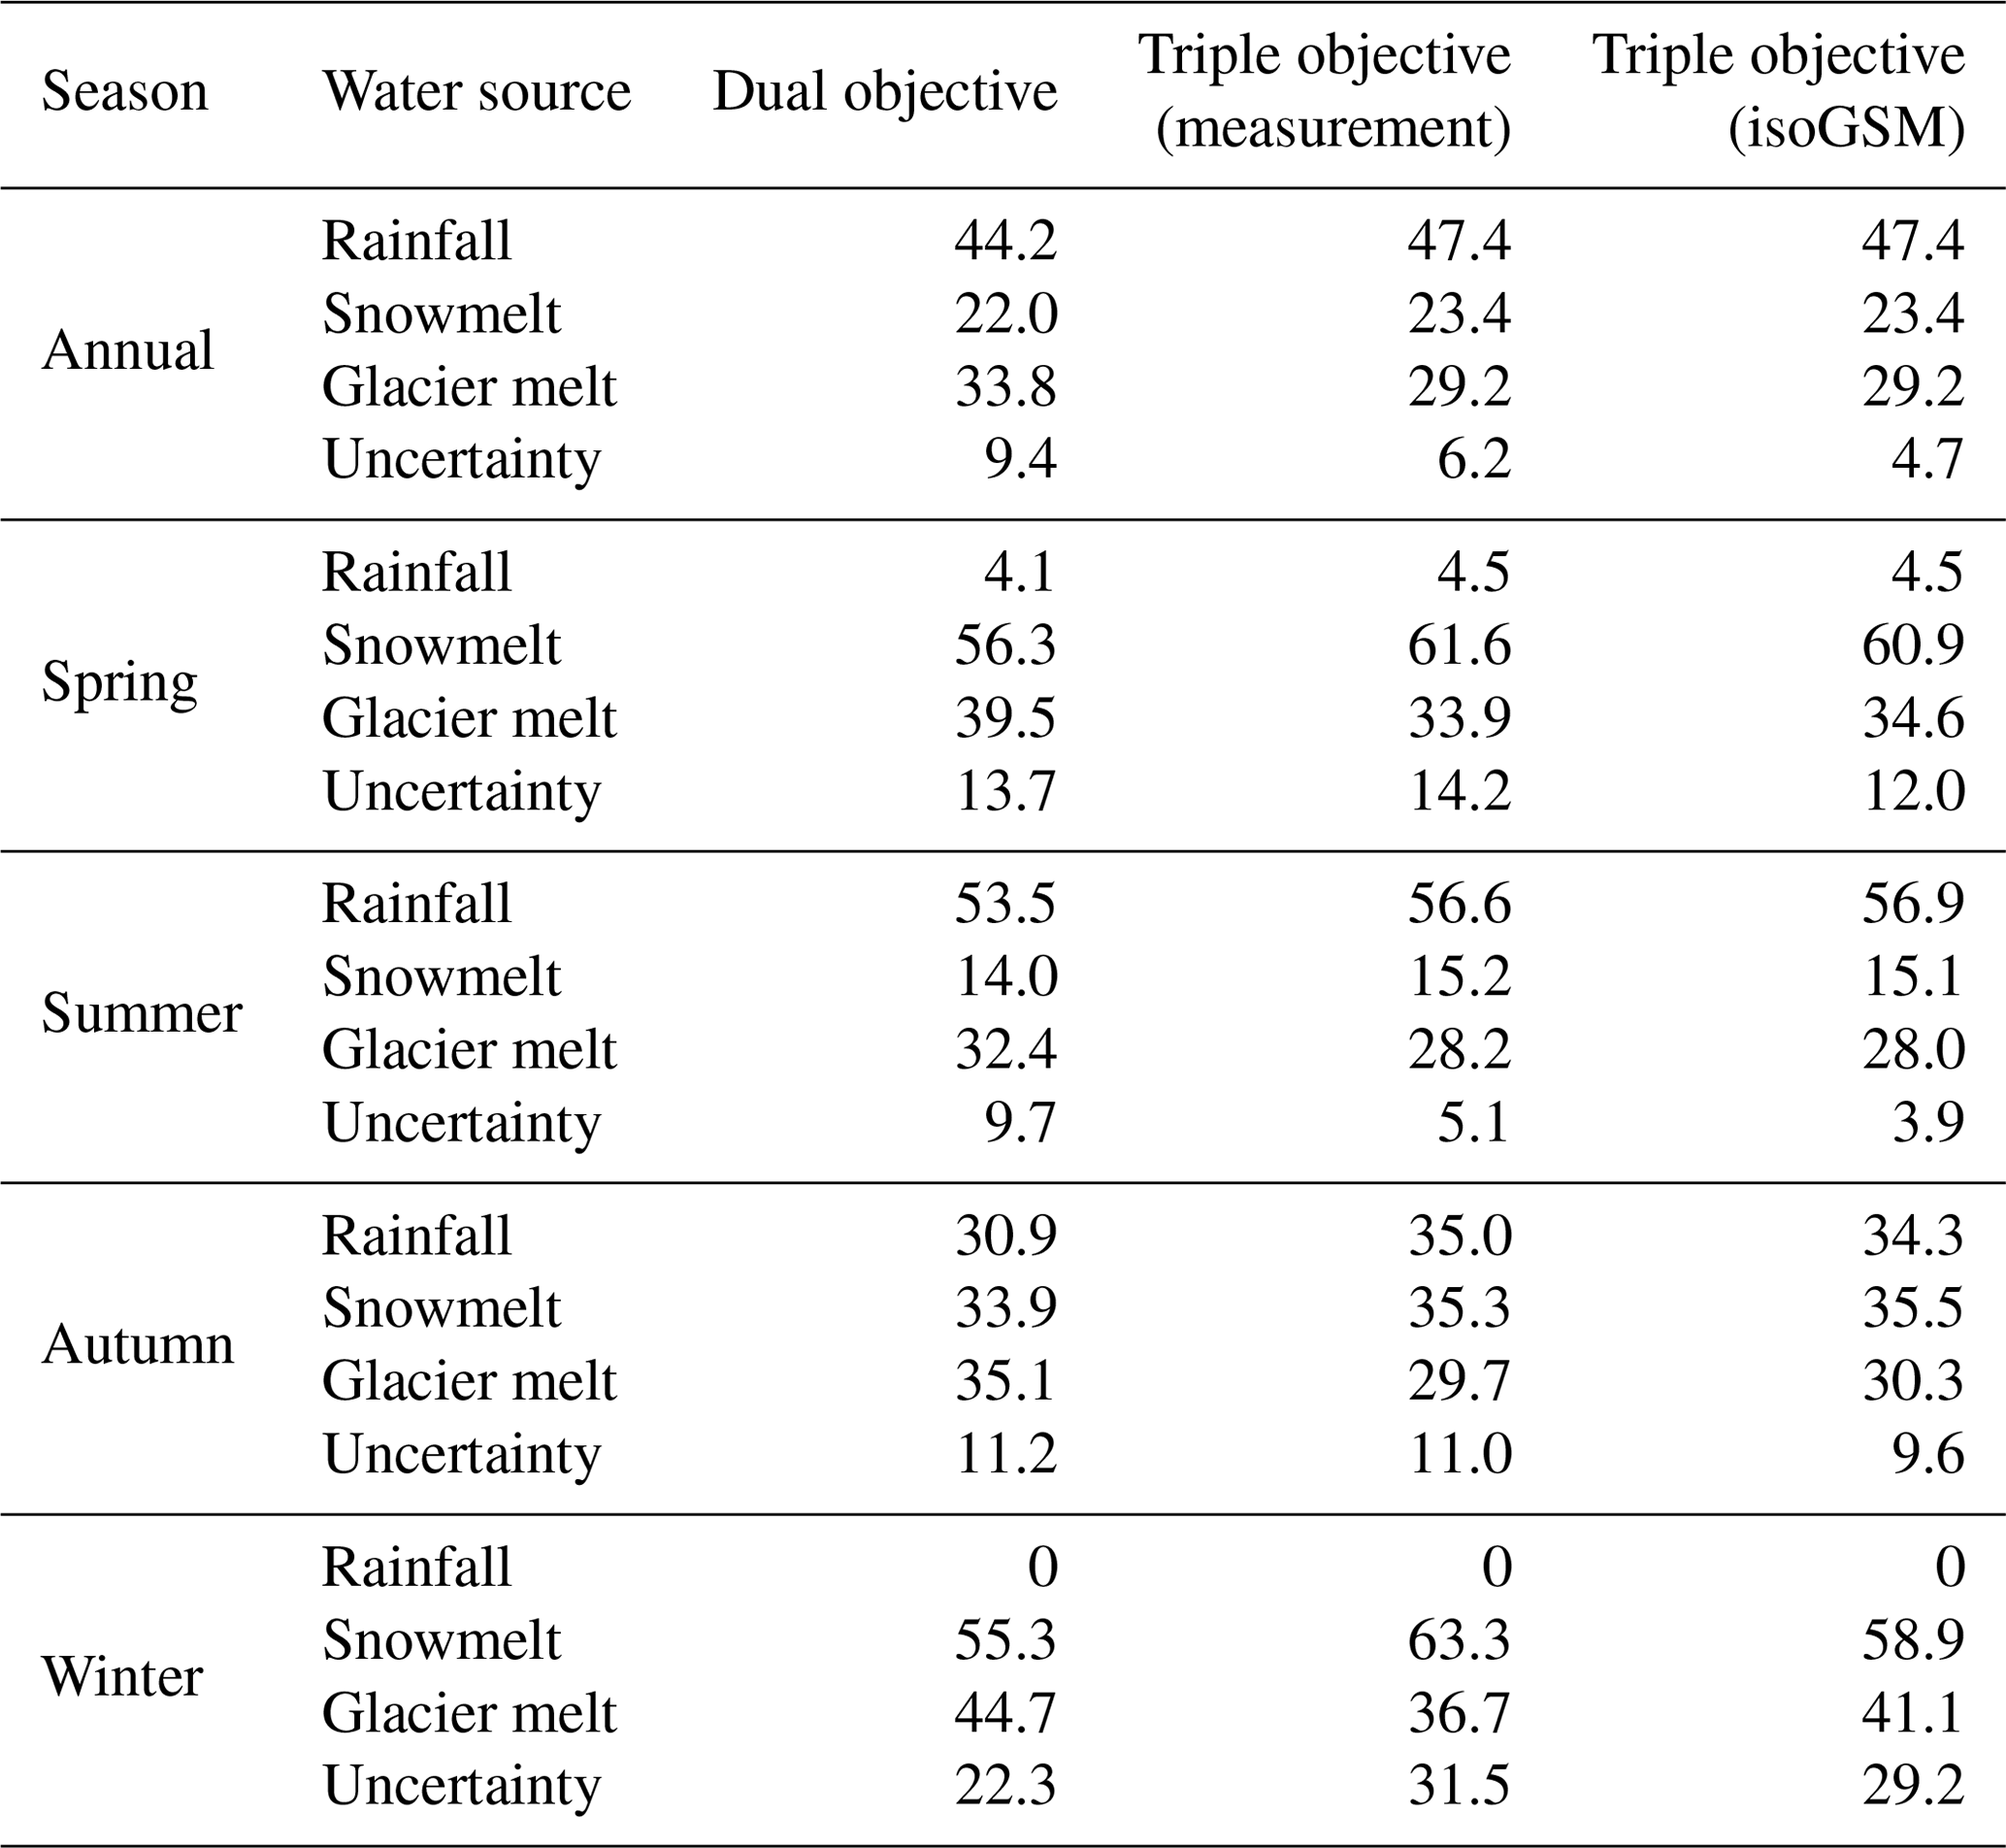
Figure 11 and Tables 5–6 compare the proportions of water sources in the annual water input for runoff generation simulated by the behavioral parameter sets identified by the three calibration variants. In the KR subbasin (Fig. 11b and Table 6), rainfall provided the largest volume of the water source for runoff generation simulated by the three calibration variants (44.2 %–47.4 %), followed by glacier meltwater (29.2 %–33.8 %). Snowmelt contributed the lowest proportion (22.0 %–23.4 %) to the total water input. The two triple-objective calibrations estimated very similar contributions to the runoff component and consistently estimated lower proportions of glacier melt than the dual-objective calibration, which can be attributed to the role of isotope data in regulating the contribution of the strong evaporated surface runoff component fed by glacier melt to streamflow (Nan et al., 2021) by rejecting parameter sets that estimated small proportions of rainfall but large proportions of glacier melt (as shown by the error bar in Fig. 11b). Meanwhile, uncertainties of the estimated contributions were significantly reduced (from 9.4 % to 6.2 % and 4.7 %; Table 6) by integrating isotope data into the model. Regarding the contributions of water sources to seasonal water input, snowmelt and rainfall were the dominant water sources in spring and summer. In total, three water sources had similar contributions during autumn. Glacier melt produced a relatively steady contribution of around 30 %–35 % throughout the year. Similar to the annual contributions, the seasonal contributions of snowmelt and rainfall estimated by the two triple-objective calibrations were larger than those estimated by the dual-objective calibration, while the opposite holds true for the seasonal contributions of glacier melt. The largest differences in the contributions estimated by the different calibration variants go to the winter season (Table 6), which, however, had a negligible effect on the annual runoff regime because of the extremely low contribution of water input in this season (< 1 %). Uncertainties in the runoff component contributions were reduced by involving isotope calibration most significantly during summer because the isotope data brought more constraint to the rainfall–runoff processes which played dominant role in summer. The uncertainties of the annual contributions were close to those of the summer contributions because of the large proportion of water input to annual runoff in summer (> 60 %). In contrast, the uncertainties of winter contributions estimated by the triple-objective calibration variants tended to be larger than those estimated by the dual-objective calibration, due to the smaller amount of total water input in winter as a result of lower contribution of meltwater estimated by triple-objective variants.
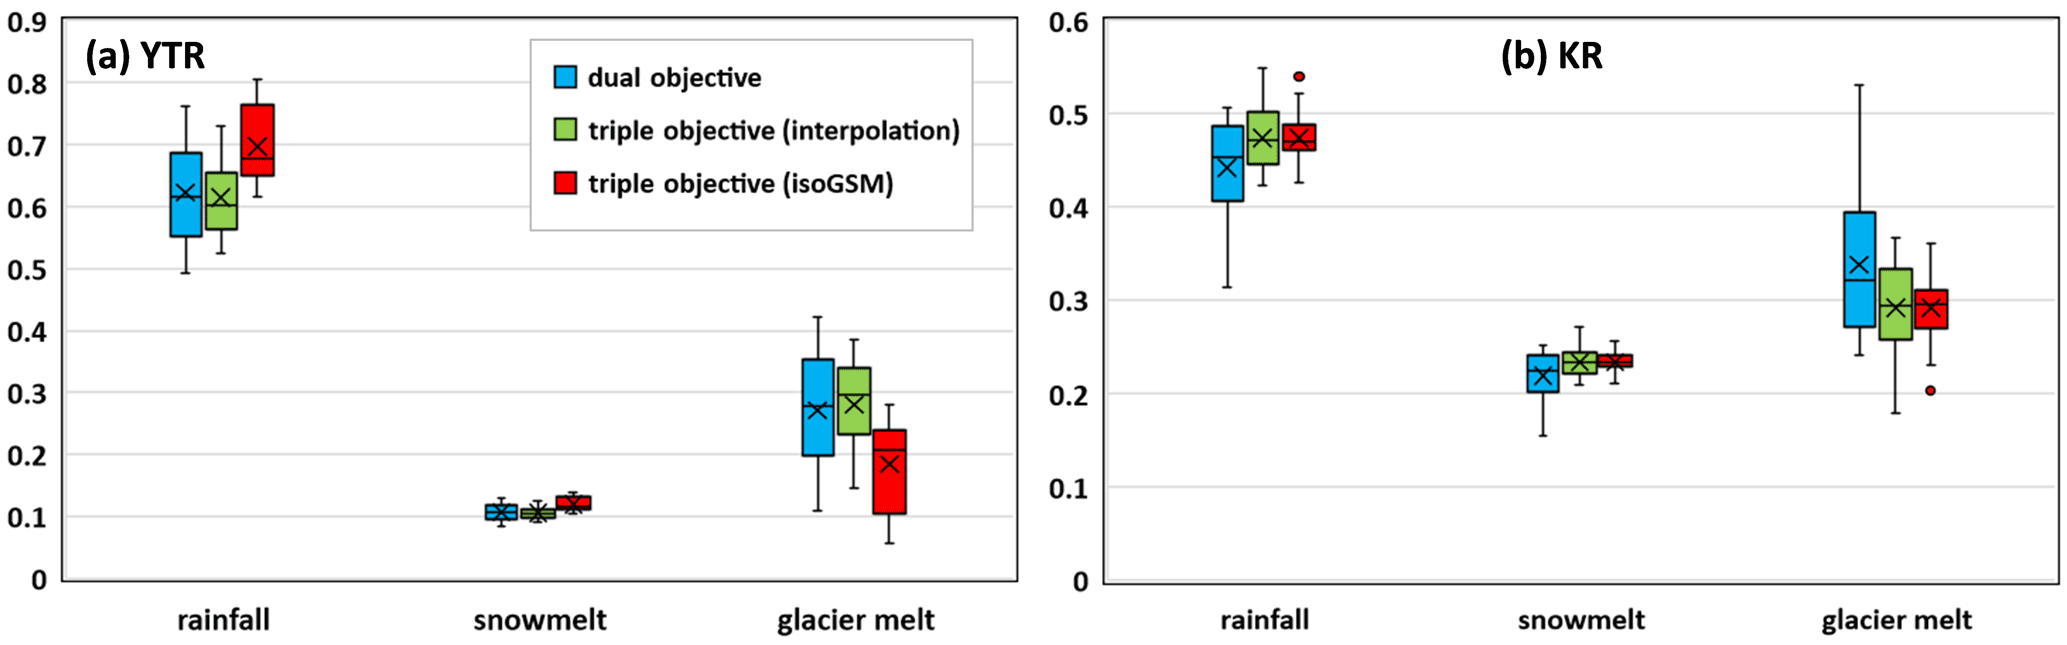
Figure 11Average proportion and corresponding uncertainty ranges of different water sources in the annual water input for runoff generation estimated by different calibration variants in the (a) YTR and (b) KR catchments.
Table 5Average proportions of water sources in the annual and seasonal water inputs for runoff generation in the YTR basin.
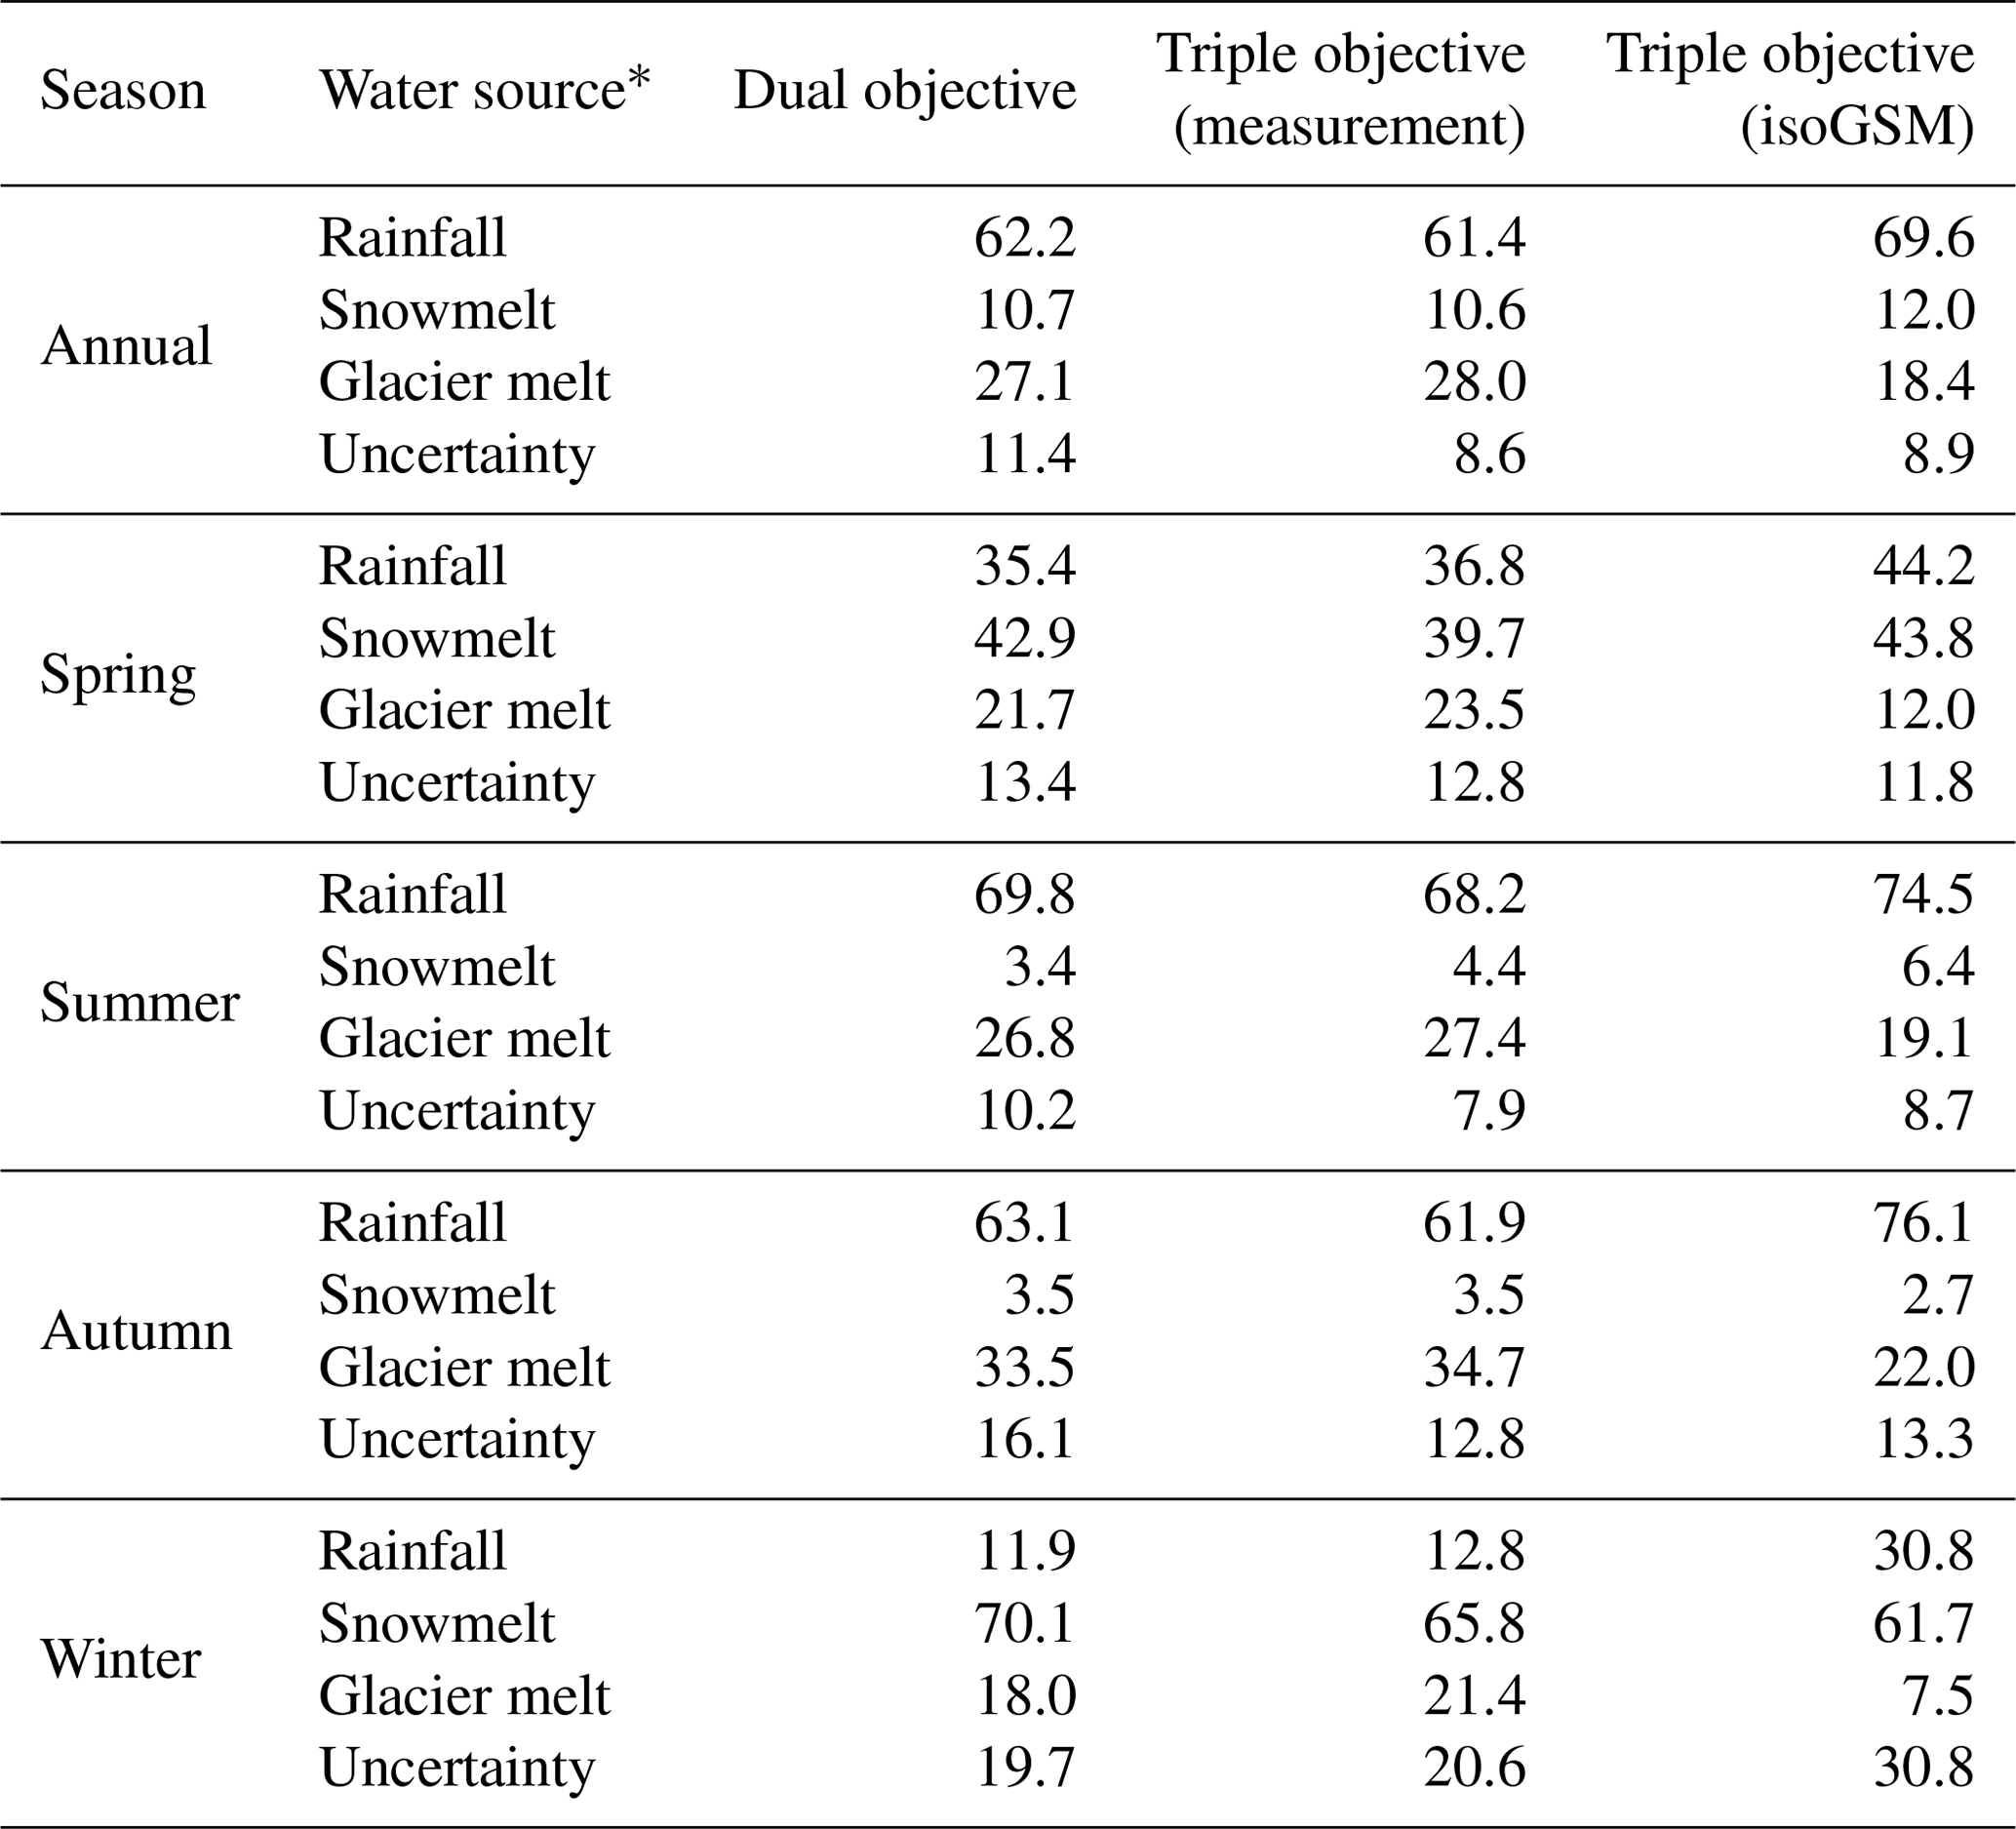
* The uncertainty of the contribution is defined as , where ER, EN and EG represent the standard deviations of the contributions of the water sources produced by the corresponding behavioral parameter sets. The subscripts of R, N and G represent rainfall, snow meltwater and glacier meltwater, respectively.
Table 6Average proportions of water sources in the annual and seasonal water inputs for runoff generation in the KR catchment.
In the YTR catchment, rainfall showed a larger dominance on the annual runoff than glacier and snow meltwater, with mean contributions of 61.4 %–69.6 % (Fig. 11a and Table 5). The dual-objective calibration and triple-objective calibration forced by the measured isotope data estimated similar annual contributions of rainfall (∼ 62 %), snowmelt (∼ 11 %) and glacier melt (∼ 27 %). Nonetheless, the isoGSM-forced triple-objective calibration estimated a significantly higher mean proportion of rainfall (70 %) but a lower mean proportion of glacier melt (18 %) by rejecting the parameter sets that estimated rainfall contributions to be less than 60 % and glacier melt contributions to be more than 30 %, which, however, were identified to be acceptable in the other two calibration variants (as shown by the error bar in Fig. 11a). The difference in the glacier melt contributions estimated by the two triple-objective calibration variants mainly resulted from the difference in precipitation δ18O inputs from the two data sets. The interpolated measurement data tended to produce higher precipitation δ18O in the middle and downstream regions of YTR basin but lower values in the upstream region, compared to the corrected isoGSM data (Fig. 4b). Meanwhile, the precipitation input in the downstream region was higher than that which occurred in the upstream (Xu et al., 2017), thus resulting in higher average precipitation δ18O over the entire YTR of the interpolated measurement data. Consequently, a larger contribution of glacier melt with low isotope composition was estimated in the interpolated interpolation-forced triple-objective calibration to counteract the effect of the precipitation input with a high isotopic composition for matching the measured stream water δ18O. By involving the isotope simulation, both triple-objective variants significantly reduced the uncertainties of the estimated contributions (from 11.9 % to 8.6 % and 8.9 %; Table 5). Similar to the estimated annual contributions, the isoGSM-forced triple-objective calibration estimated a higher mean proportion of rainfall, a lower mean proportion of glacier melt and a comparable mean proportion of snowmelt in the four seasons, compared to the dual-objective calibration and triple-objective calibration forced by the measured isotope data. In general, rainfall was the dominant water input source in summer and autumn, and snowmelt dominated the runoff in winter. The contributions of rainfall and snowmelt to total water input were close in spring. Similar to the KR catchment, the uncertainty of the runoff component contribution was reduced by the isotope-involved calibrations more significantly in seasons when rainfall played a dominant role.
4.1 Uncertainties and limitations of the tracer-aided hydrological model
Integrating the simulations of water isotope signatures into the hydrological model structure could help to make use of hydrological information additionally implied in the water isotope data without introducing new model parameters for the runoff processes. However, the uncertainty of the simulation of water isotopes in the tracer-aided hydrological model can be caused by the following sources. First, the isotopic compositions of meltwater sources were determined based on simplified assumptions, which, however, were hard to verify in a large basin due to the limited field sampling work. The isotopic compositions of glacier melt were assumed to be constant throughout the modeling period due to the unavailability of glacier melting water samples. A large number of studies reported that the isotope composition of glacier melt had very small variability, and the values were much lower than that of precipitation (e.g., Boral and Sen, 2020; Cable et al., 2011; He et al., 2019; Rai et al., 2019; Wang et al., 2016). Considering that the changes in glacier elevation during the 10-year modeling period were small, indicating that ice melt on the glacier surface in each of the summer seasons very likely occurred from the same elevation bands with similar isotopic compositions, the assumption on glacier melt isotope adopted in this study was reasonable. However, the assumed isotope composition of glacier melt will no doubt influence the modeling result, especially with respect to the estimated contribution of water sources. Specifically, a lower assumed value of glacier melt isotope composition led to a lower contribution of the isotopic depleted glacier melt runoff component. As for the snow meltwater, the isotopic evolution was simulated according to the mass balance of snowpack, similar to other water storage. The isotope fractionation effect caused by the melt processes was inadequately characterized in our model, which could lead to uncertainty in the simulation of snowmelt isotope (Pu et al., 2020).
Second, the uncertainty of the precipitation isotope input data served as another uncertainty source of the isotope simulation in the model. Although the isotope data itself had no influence on the hydrological processes, the calibration procedure to fit the simulated stream isotope signature with observation indeed affected the model simulations of the runoff processes (Delavau et al., 2017). For the sampling measurement-based forcing data, the uncertainty came from the interpolation procedure. We used a linear interpolation method based on longitude and altitude to estimate the precipitation isoscape. This could be reasonable in our study catchment because these two factors characterize the major spatial pattern and altitude effect of precipitation isotope in similar large-scale regions on the TP (Liu et al., 2014). However, the low availability of site measurement data derived from the sparse water sampling network lead to large uncertainties in the interpolated result. All the four sampling stations were located at around the same latitude and cannot reflect the latitude effect on the precipitation isotope (Dansgaard, 1964). Measurements from more water sampling sites are required in the future for the improvement of the interpolation method. For the isoGSM data, the uncertainty came from its coarse spatial resolution. Although the isoGSM data bear the potential to capture spatial patterns of precipitation isotope in large basins, the effect of regional topography on the isotope was not reflected well in the current product due to its rather coarse pixel size (∼ 200 × 200 km). Consequently, developing downscale methods that are applicable to mountainous catchments to extract regional isotope estimates from iGCM products (such as iRCM in Sturm et al., 2007) might be helpful for the tracer-aided hydrological modeling on the TP. Moreover, the bias correction procedure based on measurements from a sparse water sampling network inevitably brought uncertainty to the corrected isoGSM data. The current sampling sites of precipitation are located along the river channel with elevations lower than the contributing mountains, thus failing to involve isoGSM estimates at high mountainous terrains in the correction procedure. The terms used in Eq. (3) (only elevation) to correct isoGSM were different from those used in Eq. (1) (elevation and longitude) to interpolate the measurement data. The error of isoGSM tended to be larger in higher elevation regions because of the complex regional topography, which cannot be captured well by the coarse spatial resolution of isoGSM, but there was no mechanism making the error of isoGSM change with longitude. Consequently, the term longitude, rather than the interpolation equation, was deprecated in Eq. (3). However, the choice of regression terms in the interpolation and bias correction undoubtedly had a significant influence on the modeling result, which could be another important source of uncertainty.
The modeling uncertainty is highly related to the model structure and parameters, and our results indicated that the additional information from the isotope data reduced the uncertainty of the parameters. However, global climate changes are changing streamflow regimes on the TP (e.g., M. Xu et al., 2019; Lin et al., 2020; Yong et al., 2021), which may request a changing model structure as well. In this study, the model structure was not modified; thus, the changing conditions were far less than adequately represented in the current model, due to lack of adequate understanding of the influence of changing conditions on the runoff generation mechanism. However, some of the changing underlying conditions can also be reflected by the parameters. For example, frozen ground degradation can lead to a larger water storage capacity and higher hydraulic conductivity, which can be reflected by the parameters WM, KKA and KKD in our model. Meanwhile, the tracer-aided hydrological modeling method can also help diagnose the model structure (e.g., Birkel et al., 2011), but such work has only been conducted in small catchments due to the limited precipitation isotope input data on a large scale. This study mainly explored the utility of iGCM data on forcing tracer-aided model in large basins, thus providing the potential to conduct the work that improves the model structure in large-scale basins. For the simulation in the YTR basin in this study, the model was applied at a relatively short timescale (less than 1 decade), during which the change condition was not an important issue. To expand the result to a longer timescale and to predict the future streamflow trend, more work is needed to consider the variation in model structures and parameters.
4.2 The value of spatial precipitation isotope data derived from iGCM to aid hydrological modeling in large basins
Comparisons with the dual-objective calibration without isotope data indicated a high value of spatial precipitation isotope data for reducing modeling uncertainty. To better understand the role of isotope data, we analyzed the relationship between the behaviors of discharge and isotope simulations obtained by the calibration without isotope (dual-objective calibration). There was a trade-off between the two objectives (Fig. 12a). The highest NSEdis can reach around 0.93, but the MAEiso was not good at the same time. When MAEiso reached its, relatively speaking, best values, the NSEdis was around 0.9, which exhibited a high-level performance as well. The relationship between the model performance and the estimated glacier melt contribution was further explored, and it was found that when the highest NSEdis was obtained, the contribution of glacier melt was estimated as being around 0.35–0.4, which was, however, estimated as being around 0.2 when the best MAEiso value was obtained (Fig. 12b and c). The isotope composition of glacier melt was assumed to be lower than the precipitation; thus, an overestimated contribution of glacier melt can lead to a lower simulated river isotope than the measurement. Consequently, calibration focusing only on discharge may result in overestimated glacier melt, which can be rejected by the behavior of isotope simulation. It is notable that the performance of the isotope simulation is more sensitive than discharge simulation to the runoff component and internal processes. When the contribution of the glacier melt is in a large range of 10 %–40 %, the NSEdis values can all be calibrated to a higher value (> 0.9) by adjusting other parameters, whereas the MAEiso value becomes significantly worse when the proper contribution of the water source is deviated.
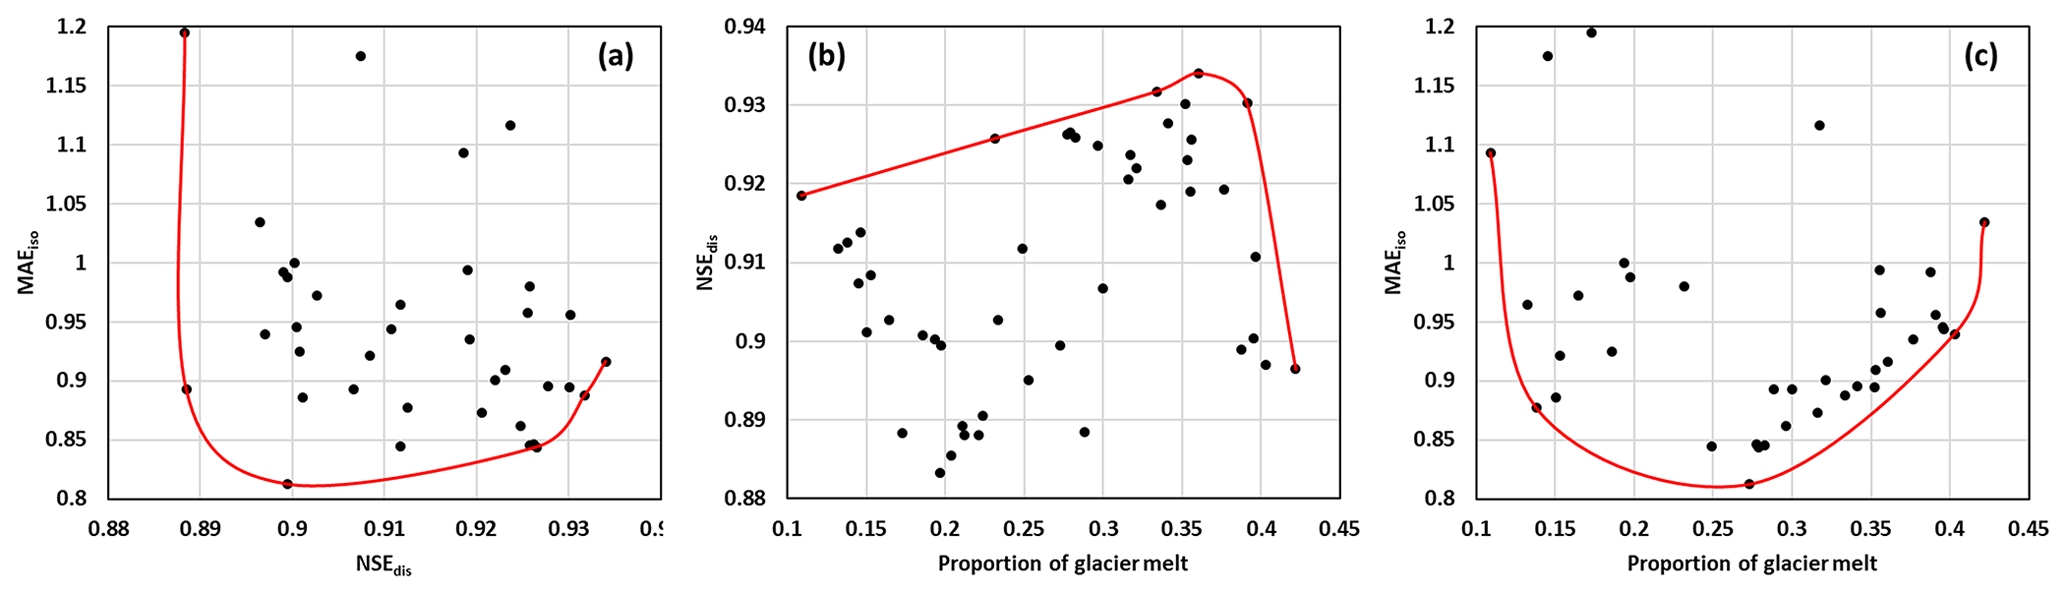
Figure 12The relationships between the (a) MAEiso and NSEdis, (b) NSEdis and glacier melt contribution and (c) MAEiso and glacier melt contribution.
Model simulations forced by the two precipitation isotope data sets produced a similar total streamflow simulation in the YTR basin but resulted in certain difference in the simulated stream water isotopic composition and water source apportionments, which was consistent with the findings in Delavau et al. (2017). The choice of precipitation isotope input data was demonstrated to have a large influence on the model performance. In this study, model simulations forced by the corrected isoGSM data performed better than those driven by the interpolated data of the sampling measurement with respect to discharge and stream water isotope simulations at internal hydrological stations. The fact that the model can simultaneously satisfy multiple calibration objectives gave us confidence in the model realization and robustness (McDonnell and Beven, 2014), consequently resulting in the consistent model behavioral performances in both the outlet and internal stations.
Beyond the model performance on discharge and isotope simulation, three types of evidence indicated the results of the model forced by isoGSM data to more likely be reasonable. First, the runoff component contributions estimated by the isoGSM-forced triple-objective calibration were likely more reliable than those estimated by the dual-objective and the interpolation-forced triple-objective calibrations. The contribution of glacier melt to the annual water input in the YTR basin was estimated as being around 27 % in the dual-objective and the interpolation-forced triple-objective calibrations, which was more unlike to be true considering the small glacier-covered area ratio (2 %). The glacier melt contribution estimated by the isoGSM-forced triple-objective calibration was lower than 20 %, which is within the ranges reported by some previous studies (Immerzeel et al., 2010; Bookhagen and Burbank, 2010; Zhang et al., 2013). Second, the average calibrated melting threshold temperature (T0) and glacier degree day factor (DDFG) of the YTR basin obtained by the isoGSM-forced triple-objective calibration were 0.75 ∘C and 7.43 mm d−1∘C−1. This was consistent with the reported results of estimated glacier mass balance measurements in that the YTR basin was in the region with the DDFG ranging from 6–9 mm d ∘C−1 estimated by the T0 of 0 ∘C (Y. Zhang et al., 2006). On the contrary, although the calibrated DDFG obtained by dual-objective and interpolation-forced triple-objective calibrations were still within the range of 6–9 (7.98 and 8.37 mm d ∘C−1, respectively), the T0 values were calibrated to be −1.41 and −1.49 ∘C, respectively, which is much lower than the value adopted in Y. Zhang et al. (2006), resulting in overestimated glacier melt runoff. Third, the THREW-t model also quantified the runoff component in terms of the runoff generation pathway and divided the runoff into surface runoff and baseflow. The contribution of baseflow was estimated as being 29.26 km3 yr−1 by the isoGSM-forced triple-objective calibration, which was very close to the result (30 km3 yr−1) estimated by the groundwater model, MODFLOW-NWT, independent from hydrological modeling approach reported in Yao et al. (2021), whereas the baseflow estimated by dual-objective and interpolation-forced triple-objective calibrations were much lower (24.04 and 22.47 km3 yr−1, respectively). A more reliable baseflow estimation likely helped improve the reasonability of the modeling result and reduced the equifinality by constraining the parameters related to groundwater.
The above results indicated that the corrected isoGSM product served as a better choice to force the tracer-aided hydrological model than the interpolated data of the sampling measurement. It is commonly difficult to estimate the precipitation isoscapes in large mountainous catchments according to limited available site sampling data. Relatively speaking, the iGCM data have the advantage of presenting more spatial information of precipitation isotopes via physically simulating the processes of vapor transfer, condensation and supersaturation in the atmosphere and their effects on precipitation isotope (Xi, 2014). Our results indicated that even precipitation isotope measurements at only four sampling sites provided good ground databases to correct the isoGSM isotope product in the study basin with a size of 2 × 10⁵ km2. The condition was different in the KR subcatchment, where the triple-objective variants forced by two isotope data sets performed similarly with respect to discharge and isotope simulation and runoff component contribution estimation. This is due to the much smaller catchment area than the pixel size; thus, the advantage of the spatial information provided by isoGSM was not taken adequately. To develop a general strategy to establish tracer-aided in large basin, especially in regions where limited measured precipitation isotope data are available, as little information as possible from measurement data was used to correct the isoGSM data. Consequently, only the average value of the measured isotope data were used to correct the isoGSM (Eq. 2), and the seasonal characteristic of the bias was not considered (such as in Delavau et al., 2017). Our results indicated that, even when being corrected by only four average values, isoGSM can perform well in terms of capturing seasonal fluctuation of precipitation isotope and forcing tracer-aided model in the YTR basin. This offers the potential to serve as input isotope data in data-sparse regions. The influence of the iGCM/iRCM product and bias correction method was not discussed in detail in this study, which is, however, an important issue and need further exploration.
The utility of the precipitation isotope input derived from the isotopic general circulation models (iGCM) product, isoGSM, in forcing the distributed tracer-aided hydrological model THREW-t in a large basin of 2 ×10⁵ km2 on the Tibetan Plateau (TP) was investigated in this study. The model performance driven by the isoGSM data was evaluated by comparing it with simulations driven by precipitation isotope measurements from a sparse sampling network. Our main findings are as follows:
-
Spatial precipitation isotope data derived from the isotopic general circulation models helped to reduce the modeling uncertainty and improve parameter identifiability, in comparison to a calibration method using discharge and snow cover area fraction without any information on water isotopes. The developed tracer-aided hydrological model forced by the isoGSM data showed high values to robustly represent the runoff processes in large mountainous catchments.
-
Model parameters estimated by the isoGSM data corrected using site sampling measurements of precipitation isotopes presented a higher transferability to the nested subbasins and produced a higher model performance in the validation period than that estimated by the interpolated isotope data from site sampling measurement. The smaller the uncertainty ranges of the model simulations in the nested subbasins forced by the corrected isoGSM data further indicated that the corrected isoGSM data served as a better choice to provide informative spatial precipitation isotopes in large basins than the interpolated data from site sampling measurements.
-
Using the corrected isoGSM data improved the quantification of the contributions of runoff components to streamflow on both annual and seasonal scales. The model calibration procedure forced by the corrected isoGSM data successfully rejected parameter sets that estimated the overestimation of the glacier melt contribution, indicating that precipitation isotope measurements at only four sampling sites along the river channel provided a good ground database to correct the isoGSM product in the study catchment.
The isotope data and the code of THREW-t model used in this study are available from the corresponding author (tianfq@tsinghua.edu.cn). Other data sets and the calibration program pySOT are publicly available as follows: DEM (http://www.gscloud.cn/sources/details/310?pid=302, last access: 1 January 2019, Geospatial Data Cloud Site, 2019), CMFD (https://doi.org/10.11888/AtmosphericPhysics.tpe.249369.file, Yang and He, 2019), glacier data (https://doi.org/10.3972/glacier.001.2013.db, Liu et al., 2012), NDVI (https://doi.org/10.5067/MODIS/MOD13A3.006, Didan et al., 2015), LAI (https://doi.org/10.5067/MODIS/MOD15A2H.006, Myneni et al., 2015), HWSD (https://data.apps.fao.org/map/catalog/srv/eng/catalog.search#/metadata/c31a38f0-88fd-11da-a88f-000d939bc5d8, last access: 1 January 2019, Nachtergaele, 2019) and the pySOT program (https://doi.org/10.5281/zenodo.569554, Eriksson et al., 2017). These data sets and programs are also referred to in the main text (Yang et al., 2010; Chen et al., 2018).
YN, ZH and FT conceived the idea. ZW provided the isoGSM data. LT provided the measurement isotope data. YN, ZH and FT conducted the analysis. ZW and LT provided comments on the analysis. All the authors contributed to writing and revisions.
At least one of the (co-)authors is a member of the editorial board of Hydrology and Earth System Sciences. The peer-review process was guided by an independent editor, and the authors also have no other competing interests to declare.
Publisher's note: Copernicus Publications remains neutral with regard to jurisdictional claims in published maps and institutional affiliations.
This study has been supported by the National Key Research and Development Program of China (grant no. 2018YFC1508103) and by the National Natural Science Foundation of China (grant no. 92047301).
This paper was edited by Genevieve Ali and reviewed by two anonymous referees.
Ala-aho, P., Tetzlaff, D., McNamara, J. P., Laudon, H., and Soulsby, C.: Using isotopes to constrain water flux and age estimates in snow-influenced catchments using the STARR (Spatially distributed Tracer-Aided Rainfall–Runoff) model, Hydrol. Earth Syst. Sci., 21, 5089–5110, https://doi.org/10.5194/hess-21-5089-2017, 2017.
Birkel, C. and Soulsby, C.: Advancing tracer-aided rainfall-runoff modelling: a review of progress, problems and unrealised potential, Hydrol. Process., 29, 5227–5240, https://doi.org/10.1002/hyp.10594, 2015.
Birkel, C., Tetzlaff, D., Dunn, S. M., and Soulsby, C.: Using time domain and geographic source tracers to conceptualize streamflow generation processes in lumped rainfall-runoff models, Water Resour. Res., 47, W02515, https://doi.org/10.1029/2010wr009547, 2011.
Bookhagen, B. and Burbank, D. W.: Toward a complete Himalayan hydrological budget: Spatiotemporal distribution of snowmelt and rainfall and their impact on river discharge, J. Geophys. Res., 115, F03019, https://doi.org/10.1029/2009jf001426, 2010.
Boral, S. and Sen, I. S.: Tracing “Third Pole” ice meltwater contribution to the Himalayan rivers using oxygen and hydrogen isotopes, Geochem. Perspect. Lett, 13, 48–53, https://doi.org/10.7185/geochemlet.2013, 2020.
Cable, J., Ogle, K., and Williams, D.: Contribution of glacier meltwater to streamflow in the Wind River Range, Wyoming, inferred via a Bayesian mixing model applied to isotopic measurements, Hydrol. Process., 25, 2228–2236, https://doi.org/10.1002/hyp.7982, 2011.
Capell, R., Tetzlaff, D., and Soulsby, C.: Can time domain and source area tracers reduce uncertainty in rainfall-runoff models in larger heterogeneous catchments? Water Resour. Res., 48, W09544, https://doi.org/10.1029/2011wr011543, 2012.
Chen, X., Long, D., Hong, Y., Zeng, C., and Yan, D.: Improved modeling of snow and glacier melting by a progressive two-stage calibration strategy with grace and multisource data: how snow and glacier meltwater contributes to the runoff of the upper brahmaputra river basin?, Water Resour. Res., 53, 2431–2466, https://doi.org/10.1002/2016WR019656, 2017.
Chen, X., Long, D., Liang, S., He, L., Zeng, C., Hao, X., and Hong, Y.: Developing a composite daily snow cover extent record over the Tibetan Plateau from 1981 to 2016 using multisource data, Remote Sen. Environ., 215, 284–299, https://doi.org/10.1016/j.rse.2018.06.021, 2018.
Dansgaard, W.: Stable isotopes in precipitation, Tellus, 16, 436–468, 1964.
Delavau, C. J., Stadnyk, T., and Holmes, T.: Examining the impacts of precipitation isotope input (δ18O ppt) on distributed, tracer-aided hydrological modelling, Hydrol. Earth Syst. Sci., 21, 2595–2614, https://doi.org/10.5194/hess-21-2595-2017, 2017.
Didan, K.: MOD13A3 MODIS/Terra vegetation Indices Monthly L3 Global 1km SIN Grid V006, NASA EOSDIS Land Processes DAAC [data set], https://doi.org/10.5067/MODIS/MOD13A3.006, 2015.
Dong, W., Lin, Y., Wright, J. S., Ming, Y., Xie, Y., Wang, B., Luo, Y., Huang, J., Wang, L., Tian, L., Peng, Y., and Xu, F.: Summer rainfall over the southwestern Tibetan Plateau controlled by deep convection over the Indian subcontinent, Nat. Commun., 7, 10925, https://doi.org/10.1038/ncomms10925, 2016.
Duethmann, D., Bolch, T., Farinotti, D., Kriegel, D., Vorogushyn, S., Merz, B., Pieczonka, T., Jiang, T., Su, B., and Güntner, A.: Attribution of streamflow trends in snow and glacier melt-dominated catchments of the Tarim River, Central Asia, Water Resour. Res., 51, 4727–4750, https://doi.org/10.1002/2014WR016716, 2015.
Eriksson, D., Bindel, D., and Shoemaker, C.: Dme65/Pysot: V0.1.35, Zenodo [code], https://doi.org/10.5281/zenodo.569554, 2017.
Gao J., Tian L., and Liu, Y.: Oxygen isotope variation in the water cycle of the Yamzho Lake Basin in southern Tibetan Plateau, Chinese Sci. Bull., 54, 2758–2765, 2009.
Geospatial Data Cloud Site: ASTER GDEM 30M [data set], available at:http://www.gscloud.cn/sources/details/310?pid=302 (last access: 1 January 2019), 2019.
Gupta, H. V., Wagener, T., and Liu, Y.: Reconciling theory with observations: elements of a diagnostic approach to model evaluation, Hydrol. Process., 22, 3802–3813, https://doi.org/10.1002/hyp.6989, 2008.
He, Z. H., Tian, F. Q., Gupta, H. V., Hu, H. C., and Hu, H. P.: Diagnostic calibration of a hydrological model in a mountain area by hydrograph partitioning, Hydrol. Earth Syst. Sci., 19, 1807–1826, https://doi.org/10.5194/hess-19-1807-2015, 2015.
He, Z., Yang, L., Tian, F., Ni, G., Hou, A., and Lu, H.: Intercomparisons of Rainfall Estimates from TRMM and GPM Multisatellite Products over the Upper Mekong River Basin, J. Hydrometeorol., 18, 413–430, https://doi.org/10.1175/jhm-d-16-0198.1, 2017.
He, Z., Vorogushyn, S., Unger-Shayesteh, K., Gafurov, A., Kalashnikova, O., Omorova, E., and Merz, B.: The value of hydrograph partitioning curves for calibrating hydrological models in glacierized basins, Water Resour. Res., 54, 2336–2361, https://doi.org/10.1002/2017WR021966, 2018.
He, Z., Unger-Shayesteh, K., Vorogushyn, S., Weise, S. M., Kalashnikova, O., Gafurov, A., Duethmann, D., Barandun, M., and Merz, B.: Constraining hydrological model parameters using water isotopic compositions in a glacierized basin, central asia, J. Hydrol., 571, 332–348, https://doi.org/10.1016/j.jhydrol.2019.01.048, 2019.
Hindshaw, R. S., Tipper, E. T., Reynolds, B. C., Lemarchand, E., Wiederhold, J. G., Magnusson, J., Bernasconi, S. M., Kretzschmar, R., and Bourdon, B.: Hydrological control of stream water chemistry in a glacial catchment (Damma Glacier, Switzerland), Chem. Geol., 285, 215–230, https://doi.org/10.1016/j.chemgeo.2011.04.012, 2011.
Immerzeel, W. W., Van Beek, L. P., and Bierkens, M. F.: Climate change will affect the Asian water towers, Science, 328, 1382–1385, https://doi.org/10.1126/science.1183188, 2010.
Immerzeel, W. W., Pellicciotti, F., and Bierkens, M. F. P.: Rising river flows throughout the twenty-first century in two Himalayan glacierized watersheds, Nat. Geosci. 6, 742–745, https://doi.org/10.1038/ngeo1896, 2013.
Kanamitsu, M., Kumar, A., Juang, H. M. H., Schemm, J. K., Wang, W. Q., Yang, F. L., Hong, S. Y., Peng, P. T., Chen, W., Moorthi, S., and Ji, M.: NCEP dynamical seasonal forecast system 2000, B. Am. Meteorol. Soc., 83, 1019–1038, https://doi.org/10.1175/1520-0477(2002)083<1019:Ndsfs>2.3.Co;2, 2002.
Li, Z., Feng, Q., Li, Z., Yuan, R., Gui, J., and Lv, Y.: Climate background, fact and hydrological effect of multiphase water transformation in cold regions of the western china: a review, Earth-Sci. Rev., 190, 33–57, https://doi.org/10.1016/j.earscirev.2018.12.004, 2019.
Lin, L., Gao, M., Liu, J., Wang, J., Wang, S., Chen, X., and Liu, H.: Understanding the effects of climate warming on streamflow and active groundwater storage in an alpine catchment: the upper Lhasa River, Hydrol. Earth Syst. Sci., 24, 1145–1157, https://doi.org/10.5194/hess-24-1145-2020, 2020.
Liu, S.: The second glacier inventory dataset of China (version 1.0) (2006–2011), National Tibetan Plateau Data Center [data set], https://doi.org/10.3972/glacier.001.2013.db, 2012.
Liu, Z., Tian, L., Yao, T., Gong, T., Yin, C., and Yu, W.: Temporal and spatial variations of delta O-18 in precipitation of the Yarlung Zangbo River Basin, J. Geogr. Sci., 17, 317–326, https://doi.org/10.1007/s11442-007-0317-1, 2007.
Liu, J., Song, X., Yuan, G., Sun, X., and Yang, L.: Stable isotopic compositions of precipitation in China, Tellus B, 66, 22567, https://doi.org/10.3402/tellusb.v66.22567, 2014.
Lutz, A. F., Immerzeel, W. W., Shrestha, A. B., and Bierkens, M. F. P.: Consistent increase in high asia's runoff due to increasing glacier melt and precipitation, Nat. Clim. Change, 4, 587–592, https://doi.org/10.1038/NCLIMATE2237, 2014.
Masood, M., Yeh, P. J.-F., Hanasaki, N., and Takeuchi, K.: Model study of the impacts of future climate change on the hydrology of Ganges–Brahmaputra–Meghna basin, Hydrol. Earth Syst. Sci., 19, 747–770, https://doi.org/10.5194/hess-19-747-2015, 2015.
McDonnell, J. J. and Beven, K.: Debates – The future of hydrological sciences: A (common) path forward? A call to action aimed at understanding velocities, celerities and residence time distributions of the headwater hydrograph, Water Resour. Res., 50, 5342–5350, https://doi.org/10.1002/2013WR015141, 2014.
McGuire, K. J., Weiler, M., and McDonnell, J. J.: Integrating tracer experiments with modeling to assess runoff processes and water transit times, Adv. Water Resour., 30, 824–837, https://doi.org/10.1016/j.advwatres.2006.07.004, 2007.
Myneni, R., Knyazikhin, Y., and Park, T.: MOD15A2H MODIS/Terra Leaf Area Index/FPAR 8-Day L4 Global 500 m SIN Grid V006, NASA EOSDIS Land Processes DAAC [data set], https://doi.org/10.5067/MODIS/MOD15A2H.006, 2015.
Nachtergaele, F.: Soil Map of North and Central Eurasia [data set], available at: https://data.apps.fao.org/map/catalog/srv/eng/catalog.search#/metadata/c31a38f0-88fd-11da-a88f-000d939bc5d8, (last access: 1 January 2019), 2019.
Nan, Y., Tian, L., He, Z., Tian, F., and Shao, L.: The value of water isotope data on improving process understanding in a glacierized catchment on the Tibetan Plateau, Hydrol. Earth Syst. Sci., 25, 3653–3673, https://doi.org/10.5194/hess-25-3653-2021, 2021.
Noone, D. and Sturm, C.: Comprehensive dynamical models of global and regional water isotope distributions, in: Isoscapes: Understanding movement, pattern, and process on Earth through isotope mapping, edited by: West, J. B., Bowen, G. J., Dawson, T. E., and Tu, K. P., Springer, London, 195–219, https://doi.org/10.1007/978-90-481-3354-3_10, 2010.
Pu, T., Wang, K., Kong, Y., Shi, X., Kang, S., Huang, Y., He, Y., Wang, S., Lee, J., and Cuntz, M.: Observing and Modeling the Isotopic Evolution of Snow Meltwater on the Southeastern Tibetan Plateau, Water Resour. Res., 56, e2019WR026423, https://doi.org/10.1029/2019wr026423, 2020.
Rai, S. P., Singh, D., Jacob, N., Rawat, Y. S., and Arora, M.: Identifying contribution of snowmelt and glacier melt to the Bhagirathi River (Upper Ganga) near snout of the Gangotri Glacier using environmental isotopes, Catena, 173, 339–351, https://doi.org/10.1016/j.catena.2018.10.031, 2019.
Reggiani, P., Hassanizadeh, S. M., Sivapalan, M., and Gray, W. G.: A unifying framework for watershed thermodynamics: constitutive relationships, Adv. Water Resour., 23, 15–39, https://doi.org/10.1016/S0309-1708(99)00005-6, 1999.
Schaner, N., Voisin, N., Nijssen, B., and Lettenmaier, D. P.: The contribution of glacier melt to streamflow, Environ. Res. Lett., 7, 034029, https://doi.org/10.1088/1748-9326/7/3/034029, 2012.
Son, K. and Sivapalan, M.: Improving model structure and reducing parameter uncertainty in conceptual water balance models through the use of auxiliary data, Water Resour. Res., 43, W01415, https://doi.org/10.1029/2006wr005032, 2007.
Stadnyk, T. A., Delavau, C., Kouwen, N., and Edwards, T. W. D.: Towards hydrological model calibration and validation: simulation of stable water isotopes using the isoWATFLOOD model, Hydrol. Process., 27, 3791–3810, https://doi.org/10.1002/hyp.9695, 2013.
Sturm, K., Hoffmann, G., Langmann, B., and Stichler, W.: Simulation of delta O-18 in precipitation by the regional circulation model REMOiso, Hydrol. Process., 19, 3425–3444, https://doi.org/10.1002/hyp.5979, 2005.
Sturm, C., Hoffmann, G., and Langmann, B.: Simulation of the stable water isotopes in precipitation over South America: Comparing regional to global circulation models, J. Climate, 20, 3730–3750, https://doi.org/10.1175/jcli4194.1, 2007.
Su, F., Zhang, L., Ou, T., Chen, D., Yao, T., Tong, K., and Qi, Y.: Hydrological response to future climate changes for the major upstream river basins in the Tibetan Plateau, Global Planet. Change, 136, 82–95, https://doi.org/10.1016/j.gloplacha.2015.10.012, 2016.
Tian, F., Hu, H., Lei, Z., and Sivapalan, M.: Extension of the Representative Elementary Watershed approach for cold regions via explicit treatment of energy related processes, Hydrol. Earth Syst. Sci., 10, 619–644, https://doi.org/10.5194/hess-10-619-2006, 2006.
Tian, F., Hu, H., and Lei, Z.: Thermodynamic watershed hydrological model: Constitutive relationship, Sci. China Ser. E., 51, 1353–1369, https://doi.org/10.1007/s11431-008-0147-0, 2008.
Tian, F., Xu, R., Nan, Y., Li, K., and He, Z.: Quantification of runoff components in the Yarlung Tsangpo River using a distributed hydrological model, Adv. Water Sci., 31, 324–336, https://doi.org/10.14042/j.cnki.32.1309.2020.03.002, 2020.
Wang, C., Dong, Z., Qin, X., Zhang, J., Du, W., and Wu, J.: Glacier meltwater runoff process analysis using δD and δ18O isotope and chemistry at the remote Laohugou glacier basin in western Qilian Mountains, China, J. Geogr. Sci., 26, 722–734, 2016.
Wang, X., Zhang, X., Zhang, W., Zhang, X., and Luo, Z.: Comparison on Spatial Distribution of Hydrogen and Oxygen Stable Isotope GCM Simulation in Global Precipitation, Adv. Earth Sci., 32, 983–995, 2017.
Wolfe, B. B., Karst-Riddoch, T. L., Hall, R. I., Edwards, T. W. D., English, M. C., Palmini, R., McGowan, S., Leavitt, P. R., and Vardy, S. R.: Classification of hydrological regimes of northern floodplain basins (Peace -Athabasca Delta, Canada) from analysis of stable isotopes (delta O-18, delta H-2) and water chemistry, Hydrol. Process., 21, 151–168, https://doi.org/10.1002/hyp.6229, 2007.
Xi, X.: A Review of Water Isotopes in Atmospheric General Circulation Models: Recent Advances and Future Prospects, Int. J. Atmos. Sci., 2014, 1–16, https://doi.org/10.1155/2014/250920, 2014.
Xu, R., Tian, F., Yang, L., Hu, H., Lu, H., and Hou, A.: Ground validation of GPM IMERG and TRMM 3B42V7 rainfall products over southern Tibetan Plateau based on a high-density rain gauge network, J. Geophys. Res.-Atmos., 122, 910–924, https://doi.org/10.1002/2016jd025418, 2017.
Xu, M., Kang, S., Wang, X., Pepin, N., and Wu, H.: Understanding changes in the water budget driven by climate change in cryospheric-dominated watershed of the northeast Tibetan Plateau, China, Hydrol. Process., 33, 1040–1058, https://doi.org/10.1002/hyp.13383, 2019.
Xu, R., Hu, H., Tian, F., Li, C., and Khan, M. Y. A.: Projected climate change impacts on future streamflow of the Yarlung Tsangpo-Brahmaputra River, Global Planet. Change, 175, 144–159, https://doi.org/10.1016/j.gloplacha.2019.01.012, 2019.
Yang, K. and He, J.: China meteorological forcing dataset (1979–2018), National Tibetan Plateau Data Center [data set], https://doi.org/10.11888/AtmosphericPhysics.tpe.249369.file, 2019.
Yang, K., He, J., Tang, W., Qin, J., and Cheng, C. C. K.: On downward shortwave and longwave radiations over high altitude regions: Observation and modeling in the Tibetan Plateau, Agr. Forest Meteorol., 150, 38–46, https://doi.org/10.1016/j.agrformet.2009.08.004, 2010.
Yao, T., Masson-Delmotte, V., Gao, J., Yu, W., Yang, X., Risi, C., Sturm, C., Werner, M., Zhao, H., He, Y., Ren, W., Tian, L., Shi, C., and Hou, S.: A review of climatic controls on δ18O in precipitation over the Tibetan Plateau: Observations and simulations, Rev. Geophys., 51, 525–548, https://doi.org/10.1002/rog.20023, 2013
Yao, Y., Zheng, C., Andrews, C. B., Scanlon, B. R., Kuang, X., Zeng, Z., Jeong, S., Lancia, M., Wu, Y., and Li, G.: Role of Groundwater in Sustaining Northern Himalayan Rivers, Geophys. Res. Lett., 48, e2020GL092354, https://doi.org/10.1029/2020GL092354, 2021.
Yong, B., Wang, C. Y., Chen, J., Chen, J., Barry, D. A., Wang, T., and Li, L.: Missing water from the Qiangtang Basin on the Tibetan Plateau, Geology, 49, 867–872, https://doi.org/10.1130/G48561.1, 2021.
Yoshimura, K., Kanamitsu, M., Noone, D., and Oki, T.: Historical isotope simulation using Reanalysis atmospheric data, J. Geophys. Res., 113, D19108, https://doi.org/10.1029/2008jd010074, 2008.
Zhang, F., Liu, J., Gong, T., and Wang, H.: Hydrological Regime of the Karuxung Watershed in North Himalayas, Acta Geogr., 61, 1141–1148, 2006.
Zhang, Y., Liu, S., and Ding, Y.: Spatial variation of degree-day factors on the observed glaciers in western China, Acta Geogr., 61, 89–98, 2006.
Zhang, L., Su, F., Yang, D., Hao, Z., and Tong, K.: Discharge regime and simulation for the upstream of major rivers over Tibetan Plateau, J. Geophys. Res.-Atmos., 118, 8500–8518, https://doi.org/10.1002/jgrd.50665, 2013.
Zhang, F., Zhang, H. B., Hagen, S. C., Ye, M., Wang, D. B., Gui, D. W., Zeng, C., Tian, L. D., and Liu, J. S.: Snow cover and runoff modelling in a high mountain catchment with scarce data: effects of temperature and precipitation parameters, Hydrol. Process., 29, 52–65, https://doi.org/10.1002/hyp.10125, 2015.
Zhao, L., Xiao, H., Zhou, M., Cheng, G., Wang, L., Yin, L., and Ren, J.: Factors controlling spatial and seasonal distributions of precipitation d18O in China, Hydrol. Process., 26, 143–152, https://doi.org/10.1002/hyp.8118, 2012.
Zhao, R., Wang, P., and Hu, F.: Relations between parameter values and corresponding natural conditions of Xinanjiang Model, Journal of Hohai University, 20, 52–59, 1992.