the Creative Commons Attribution 4.0 License.
the Creative Commons Attribution 4.0 License.
 | 09 Sep 2021
Development of a Wilks feature importance method with improved variable rankings for supporting hydrological inference and modelling
Kailong Li
Guohe Huang
Brian Baetz
Feature importance has been a popular approach for machine learning models to investigate the relative significance of model predictors. In this study, we developed a Wilks feature importance (WFI) method for hydrological inference. Compared with conventional feature importance methods such as permutation feature importance (PFI) and mean decrease impurity (MDI), the proposed WFI aims to provide more reliable variable rankings for hydrological inference. To achieve this, WFI measures the importance scores based on Wilks Λ (a test statistic that can be used to distinguish the differences between two or more groups of variables) throughout an inference tree. Compared with PFI and MDI methods, WFI does not rely on any performance measures to evaluate variable rankings, which can thus result in less biased criteria selection during the tree deduction process. The proposed WFI was tested by simulating monthly streamflows for 673 basins in the United States and applied to three interconnected irrigated watersheds located in the Yellow River basin, China, through concrete simulations for their daily streamflows. Our results indicated that the WFI could generate stable variable rankings in response to the reduction of irrelevant predictors. In addition, the WFI-selected predictors helped random forest (RF) achieve its optimum predictive accuracy, which indicates that the proposed WFI could identify more informative predictors than other feature importance measures.
- Article
(15459 KB) - Full-text XML
-
Supplement
(1859 KB) - BibTeX
- EndNote


Machine learning (ML) has been used for hydrological forecasting and examining modelling processes underpinned by statistical and physical relationships. Due to the rapid progress in data science, increased computational power, and recent advances in ML, the predictive accuracy of hydrological processes has been greatly improved (Reichstein et al., 2019; Shortridge et al., 2016). Yet, the explanatory power of ML models for hydrological inference has not increased apace with their predictive power for forecasting (Konapala and Mishra, 2020). Previous studies have indicated that purely pursuing predictive accuracy may not be a sufficient reason for applying a certain hydrological model to a given problem (Beven, 2011). The ever increasing data sources allow ML models to incorporate potential driving forces that cannot be easily considered in physically based hydrological models (Kisi et al., 2019). The increasing volume of input information has left one challenge as “how to extract interpretable information and knowledge from the model”. Even though obtaining exact mappings from data input to prediction is technically infeasible for ML models, previous research has shown opportunities to understand the model decisions through either post hoc explanations or statistical summaries of model parameters (Murdoch et al., 2019). Nevertheless, the reliability of the interpretable information is not well understood. Therefore, quality interpretable information from ML models is much desired for evolving our understanding of nature's laws (Reichstein et al., 2019).
The main idea of model interpretation is to understand the model decisions, including the main aspects of (i) identifying the most relevant predictor variables (i.e. predictors) leading to model predictions and (ii) reasoning why certain predictors are responsible for a particular model response. Interpretability can be defined as the degree to which a human can understand the cause of a decision (Miller, 2019). The model interpretation for ML is mainly achieved through feature importance, which relies on techniques that quantify and rank the variable importance (i.e. a measure of the influence of each predictor to predict the output) (Scornet, 2020). The obtained importance scores can be used to explain certain predictions through relevant knowledge. Moreover, Gregorutti et al. (2017) pointed out that some irrelevant predictors may have a negative effect on the model accuracy. Therefore, eliminating irrelevant predictors might improve the predictive accuracy. Feature importance methods can be categorized as model-agnostic and model-specific (Molnar, 2020). The model-agnostic methods refer to extracting post hoc explanations by treating the trained model as a black box (Ribeiro et al., 2016a). Such methods usually follow a process of interpretable model learning based on the outputs of the black-box model (Craven and Shavlik, 1996) and perturbing inputs and seeing the response of the black-box model (Ribeiro et al., 2016b). Such methods mainly include permutation feature importance (PFI) (Breiman, 2001a), partial dependence (PD) plots (Friedman, 2001), individual conditional expectation (ICE) plots (Goldstein et al., 2015), accumulated local effects (ALE) plots (Apley and Zhu, 2020), local interpretable model-agnostic explanations (LIME) (Ribeiro et al., 2016b), the Morries method (Morris, 1991), and Shapley values (Lundberg and Lee, 2017; Shapley, 1953). In hydrology, Yang and Chui (2020) used Shapley values to explain individual predictions of hydrological response in sustainable drainage systems at fine temporal scales. Kratzert et al. (2019a) used the Morries method to estimate the rankings of predictors for a long short-term memory (LSTM) model. Worland et al. (2019) used LIME to infer the relation between basin characteristics and the predicted flow duration curves. Konapala and Mishra (2020) used partial dependence plots to understand the role of climate and terrestrial components in the development of hydrological drought. Compared with the above model-agnostic methods, PFI is more widely used in hydrological inference due to its high efficiency and ability to take global insights into model behaviours (Molnar, 2020). Recent applications of PFI include inferring the relationship between basin characteristics and predicted low flow quantiles (Ahn, 2020) and comparing the interpretability among multiple machine learning models in the context of flood events (Schmidt et al., 2020). The above model-agnostic methods are useful for comparative studies of ML models with exceedingly complex (such as deep neuron networks) algorithmic structures to extract the interpretable information.
On the other hand, the model-specific methods (also known as interpretable models), such as decision trees and sparse regression models, can inspect model components directly (Ribeiro et al., 2016a; Yang, 2020). For instance, the weights (or coefficients) of a linear regression model can directly reflect how the predictions are produced, thus providing critical information for ranking the model predictors. Due to the oversimplified input–output relationships, linear regression models may be inadequate to approximate the complex reality. As a consequence, these models may hardly achieve satisfactory predictive accuracy and obtain quality interpretable information. As one of the essential branches of interpretable models, tree-structured models such as classification and regression trees (CART) (Breiman et al., 1984) have been an excellent alternative to linear regression models for solving complex non-linear problems. The principle of CART is to successively split the training data space (i.e. predictors and response) into many irrelevant subspaces. These subspaces and the splitting rules will form a decision/regression tree, which asks each of the new observations a series of “yes” and “no” questions and guides it to the corresponding subspaces. The model prediction for a new observation shares the same value as the average value for the training responses in that particular subspace. Mean decrease impurity (MDI) is the feature importance method for CART, and it summarizes how much a predictor can improve the model performance through the paths of a tree. Compared with linear regression models, trees are more understandable for inferring a particular model behaviour because the transparent decision-making process functions similarly to how the human brain makes decisions for a series of questions (Murdoch et al., 2019). Based on CART, Breiman (2001a) proposed an ensemble of trees named random forest (RF), which significantly improved the predictive accuracy compared with CART. Previous studies reported that RF could outperform many other ML models in predictive accuracy (Fernández-Delgado et al., 2014; Galelli and Castelletti, 2013; Schmidt et al., 2020). The high predictive accuracy allowed RF to become very useful in interpretation, especially in hydrology (Lawson et al., 2017; Worland, 2018). As Murdoch et al. (2019) argued, higher predictive accuracy can lead to a more reliable inference.
Owing to its widespread success in prediction and interpretation, Breiman's RF has been under active development during the last two decades. For instance, Athey et al. (2019) presented generalized random forests for solving heterogeneous estimating equations. Friedberg et al. (2020) proposed a local linear forest model to improve the conventional RF in terms of smooth signals. Ishwaran et al. (2008) introduced random survival forests, which can be used for the analysis of right-censored survival data. Wager and Athey (2018) developed a non-parametric causal forest for estimating heterogeneous treatment effects (HTE). Du et al. (2021) proposed another variant of random forests to help HTE inference through estimating some key conditional distributions. Katuwal et al. (2020) proposed several variants of heterogeneous oblique random forest employing several linear classifiers to optimize the splitting point at the internal nodes of the tree. These new variants of RF are primarily focused on handling various regression and classification tasks or improving the predictive accuracy; yet their usefulness for interpretation has been minimally studied.
In fact, many studies have reported that the feature importance methods used in Breiman's RF (including PFI and MDI) are unstable (i.e. a small perturbation of training data may significantly change the relative importance of predictors) (Bénard et al., 2021; Breiman, 2001b; Gregorutti et al., 2017; Strobl et al., 2007). Such instability has become one of the critical challenges for the practical use of current feature importance measures. Yu (2013) defined that statistical stability holds if statistical conclusions are robust or stable to appropriate perturbations. In hydrology, stability is critical in terms of interpretation and prediction. For interpretation, if a distinctive set of variable rankings was observed after a small perturbation of training data, one is unable to conclude realistic reasonings of hydrological processes. For prediction, there is no guarantee that the predictors with low rankings do not bear more valuable information than the higher ones. This problem challenges the selection of a subset of predictors for the optimum predictive accuracy (Gregorutti et al., 2017). Strobl et al. (2008) and Scornet (2020) disclosed the finding that positively correlated predictors would lead to biased criteria selection during the tree deduction process, which further amplifies such instability. To address the issues mentioned above, Hothorn et al. (2006) proposed an unbiased node splitting rule for criteria selection. The proposed method showed that the predictive performance of the resulting trees is as good as the performance of established exhaustive search procedures used in CART. Strobl et al. (2007) examined Hothorn's method under the RF framework, which was called Cforest. They found that the bias of criteria selection can be further reduced if their method is applied using subsampling without replacement. Nevertheless, Xia (2009) found that Cforest only outperformed Breiman's RF in some extreme cases and concluded that RF was able to provide more accurate predictions and more reliable PFI compared to Cforest. A similar finding was also achieved by Fernández-Delgado et al. (2014), who reported RF was likely to be the best among 179 ML algorithms (including Cforest) in terms of predictive accuracy based on 121 data sets. More recently, Epifanio (2017) proposed a feature importance method called intervention in prediction measure (IPM), which was reported as a competitive alternative to other PFI and MDI. Since the proposed IPM was specifically designed for high-dimensional problems (i.e. the number of predictors is much larger than the number of observed samples), it is not suitable for most hydrological problems. Bénard et al. (2021) proposed a stable rule learning algorithm (SIRUS) based on RF. The algorithm (which aimed to remove the redundant paths of a decision tree) has indicated stable behaviour when data are perturbed, while the predictive accuracy was not as good as Breiman's RF. To sum up, the existing approaches do not guarantee stable and reliable variable ranking for robust interpretability and optimum predictive accuracy.
Therefore, as an extension of the previous efforts, the objective of this study is to develop a Wilks feature importance (WFI) method with improved variable rankings for supporting hydrological inference and modelling. WFI is based on an advanced splitting procedure, stepwise cluster analysis (SCA) (Huang, 1992), which employed statistical significance of the F test, instead of least square fitting (used in CART), to determine the optimum splitting points. These points, in combination with the subsequent sub-cluster mergence, can eventually lead to the desired inference tree for variable rankings. The importance scores of predictors can then be obtained according to the values of Wilks Λ for reflecting the significance of differences between two or more groups of response variables. Compared with MDI and PFI, WFI does not rely on any performance measures (e.g. least-square errors in MDI or mean square errors in PFI) and can thus result in less biased criteria selection during the tree deduction process. Comparative assessment of WFI, PFI and MDI performances under the RF framework will then be undertaken through efforts in simulating monthly streamflows for 673 basins in the United States. With a finer temporal resolution, the proposed approach has also been applied to three irrigated watersheds in the Yellow River basin, China, through concrete simulations of their daily streamflows.
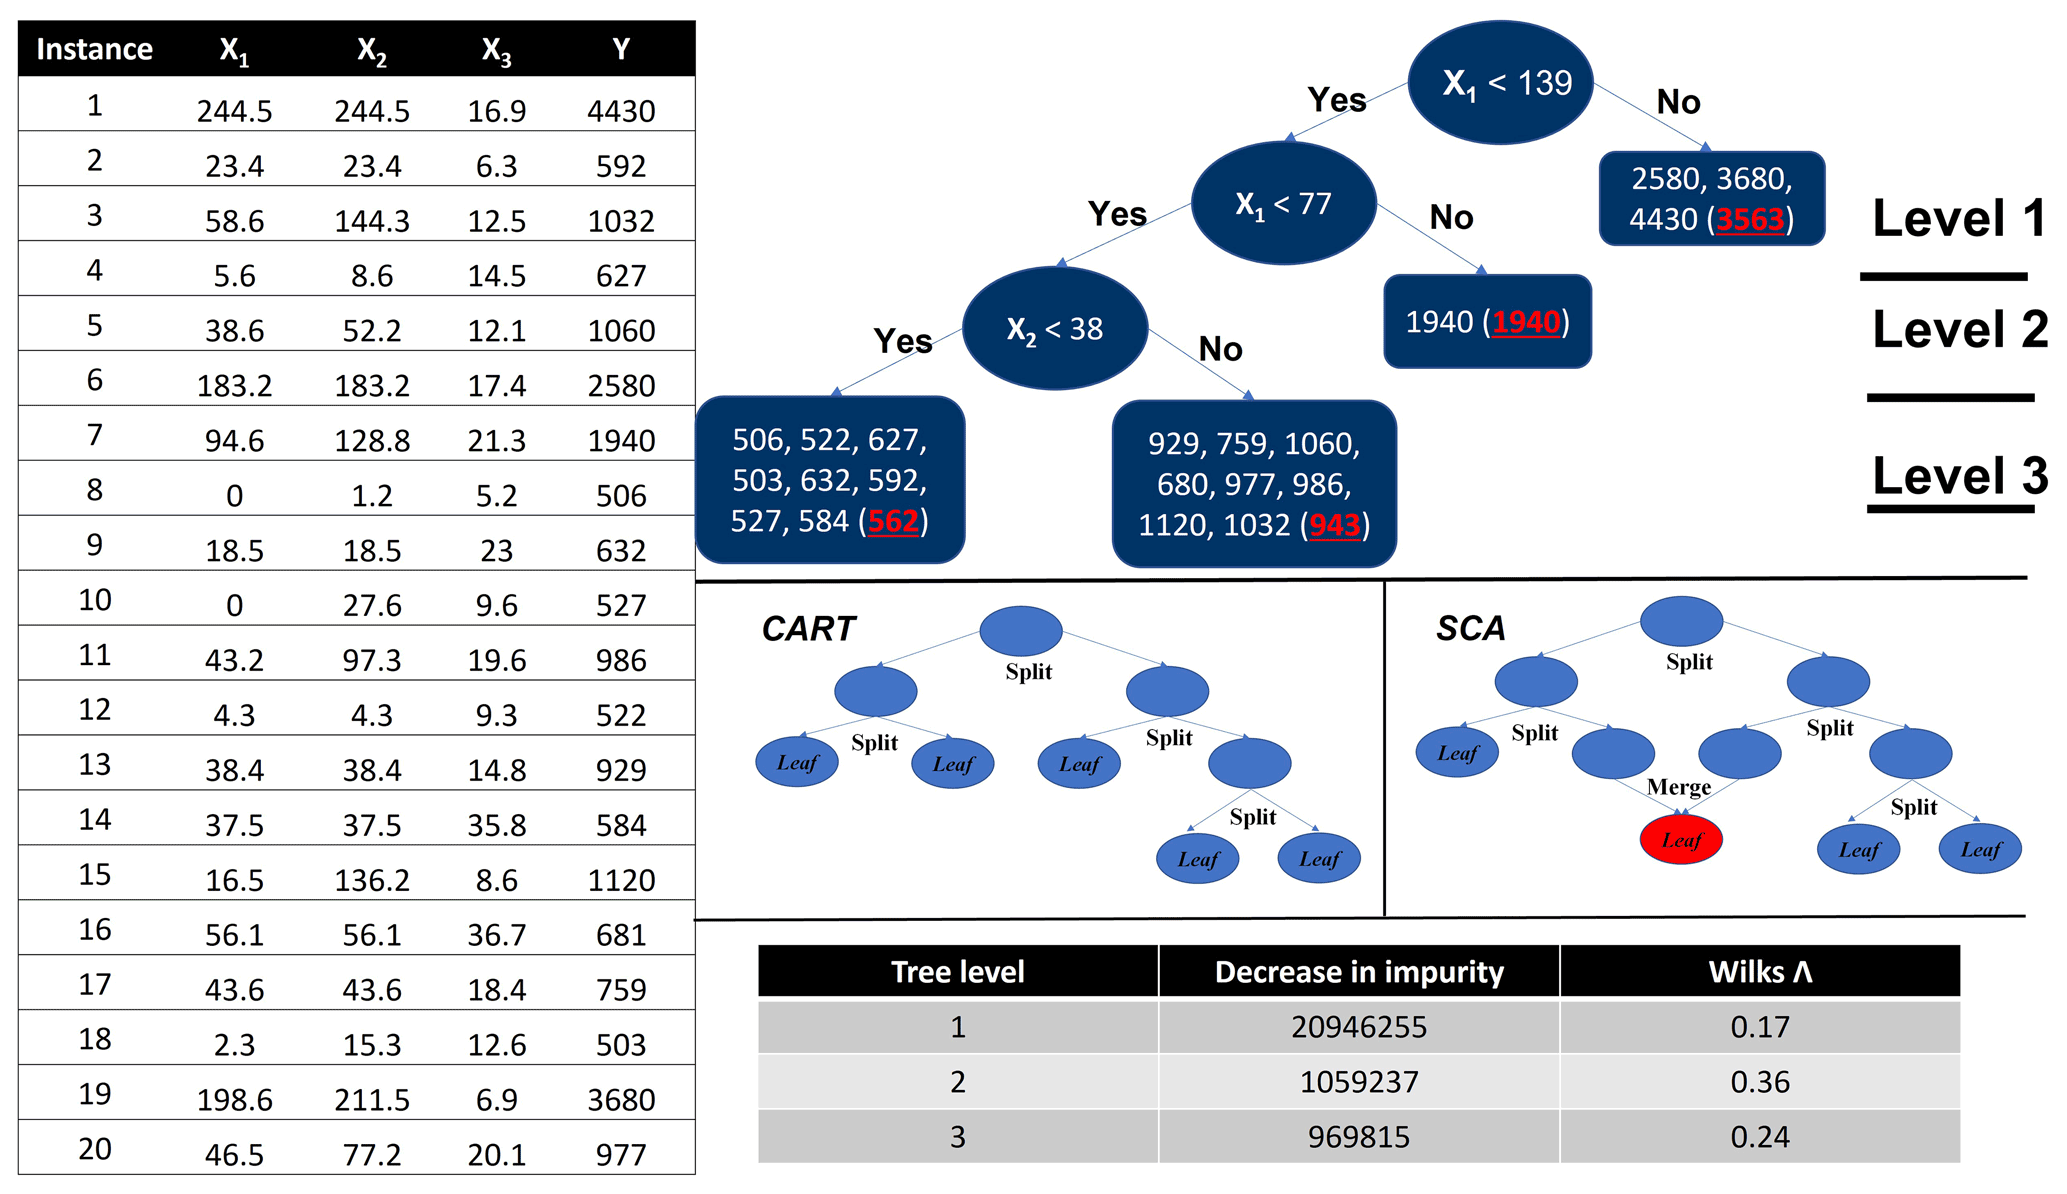
Figure 1The table on the left is a numeric hydrological dataset; the figure on the top right is the tree deduction process for both CART and SCA with the dataset. (Note that the highlighted numbers in brackets of the leaf nodes are the mean response values of those nodes. In this particular case, the two algorithms share the same node splitting rules; however, for most real-world cases, they lead to different decision trees.). The panels on the middle right illustrate the distinct difference of deduction process between CART and SCA (not related to the case); the table on the bottom right shows the statistic summaries for CART and SCA of this synthetic case.
2.1 Random forest
RF is an ensemble of decision trees, each of which is grown in accordance with a random subset of predictors and a bootstrapped version of the training set. As the ensemble members (trees) increase, the non-linear relationships between predictors and responses become increasingly stable. The prediction can thus be more robust and accurate (Breiman, 2001a; Zhang et al., 2018). The training set for building each tree is drawn randomly from the original training dataset with replacement. Such bootstrap sampling process will leave about of the training dataset as out-of-bag (OOB) data, which thus can be used as a validation dataset for the corresponding tree.
There are many variants of RF according to the types of trees (e.g. CART). Based on splitting rules equipped in different types of trees, the resulting RF may use various feature importance measures. In this study, Breiman's RF is selected as the benchmark algorithm to investigate the feature importance measures. The algorithm is implemented using the R package “randomForest” (Liaw and Wiener, 2002). There are three hyperparameters in RF as the number of trees (Ntree), the minimum number of samples in a node (Nmin) for a splitting action, and the number/ratio of predictors in a subspace (Mtry). In addition, Breiman's RF has two feature importance measures: permutation feature importance (PFI) and mean decrease impurity (MDI).
2.2 Permutation feature importance
PFI was initially proposed by Breiman (2001a) and can be described as follows: assume a trained decision tree t (where ; Ntree is the total number of decision trees in the forest) with a subset of predictor u (where u∈p; and p is complete set of predictors), predictor matrix X (with full predictors), response vector Y, predicted vector Y′, and an error measure . (1) Calculate the original model error based on the OOB dataset of the tth decision tree: (where Xu is a subset of predictor matrix X). (2) For each predictor j (where ), (i) generate permuted predictor matrix Xperm, j by duplicating X and shuffling the values of predictor Xj; (ii) estimate error for the permuted dataset ; and (iii) calculate variable importance of predictor j for the tth decision tree as ); (note that PFI(t)j=0 if predictor j is not in u). (3) Calculate the variable importance for the forest by averaging the variable importance over all trees: . The error measure used in this study is mean squared error (MSE), given by
where yn and are the nth observed and predicted quantities, respectively, and N is the total number of quantities.
2.3 MDI feature importance
The MDI importance measure is based on the CART decision tree, which is illustrated using a hydrological dataset (Fig. 1) including 20 instances and 3 predictors as X1 (i.e. precipitation), X2 (i.e. 3 d cumulative precipitation), and X3 (i.e. temperature) and a response Y (i.e. streamflow). It starts by sorting the value of Xj in ascending order (j indicates the column index of the predictors so that ), and the Y will be reordered accordingly. Then we go through each instance of Xj from the top to examine each candidate split point. For a sample set with k instances, the total number of split points for Xj will be k−1. Any instance z (where z∈ {1, … , k}) in Xj can split the predictor space into two subspaces as , x2,j, … , xz,j} (where ) and (where ). The response space Y will be correspondingly divided into two subspaces as (where ) and (where ). To maximize the predictive accuracy, the objective of the splitting process is to find the split point (based on the row and column coordinate z and j, respectively) with the minimum squared errors (SEs) of Y1 and Y2:
where and indicate the mean value of Y1 and Y2, respectively.
After each split, each of the newly generated subspaces can be further split using the same process as long as the number of instances in a subspace is greater than a threshold. This process will be repeated until a stopping criterion is reached, such as a threshold value by which the square errors must be reduced after each split.
The importance score of a particular predictor is measured based on how effective this predictor can reduce the square error in Eq. (1) for the entire tree deduction process (i.e. MDI). In the case of regression, “impurity” reflects the square error of the sample in a subspace (e.g. the larger the square error, the more “impure” the subspace is). The decrease in node impurity (DI) for splitting a particular space s is calculated as
where z and j are the coordinates for the optimum splitting point of space s, k is the number of instances in space s, and is the mean value of Y(i) in space s. Therefore, the mean decrease impurity (MDI) for the variable Xj computed via a decision tree is defined as
where S is the total spaces in a tree, and Ps is the fraction of instances falling into s. In other words, the MDI of Xj computes the weighted DI related to the splits using the jth predictor. MDI computed via RF is simply the average of the MDI computed via each tree of the forest. The ensemble (i.e. average) of important scores from the forest is assumed to be more robust than the individual tree.
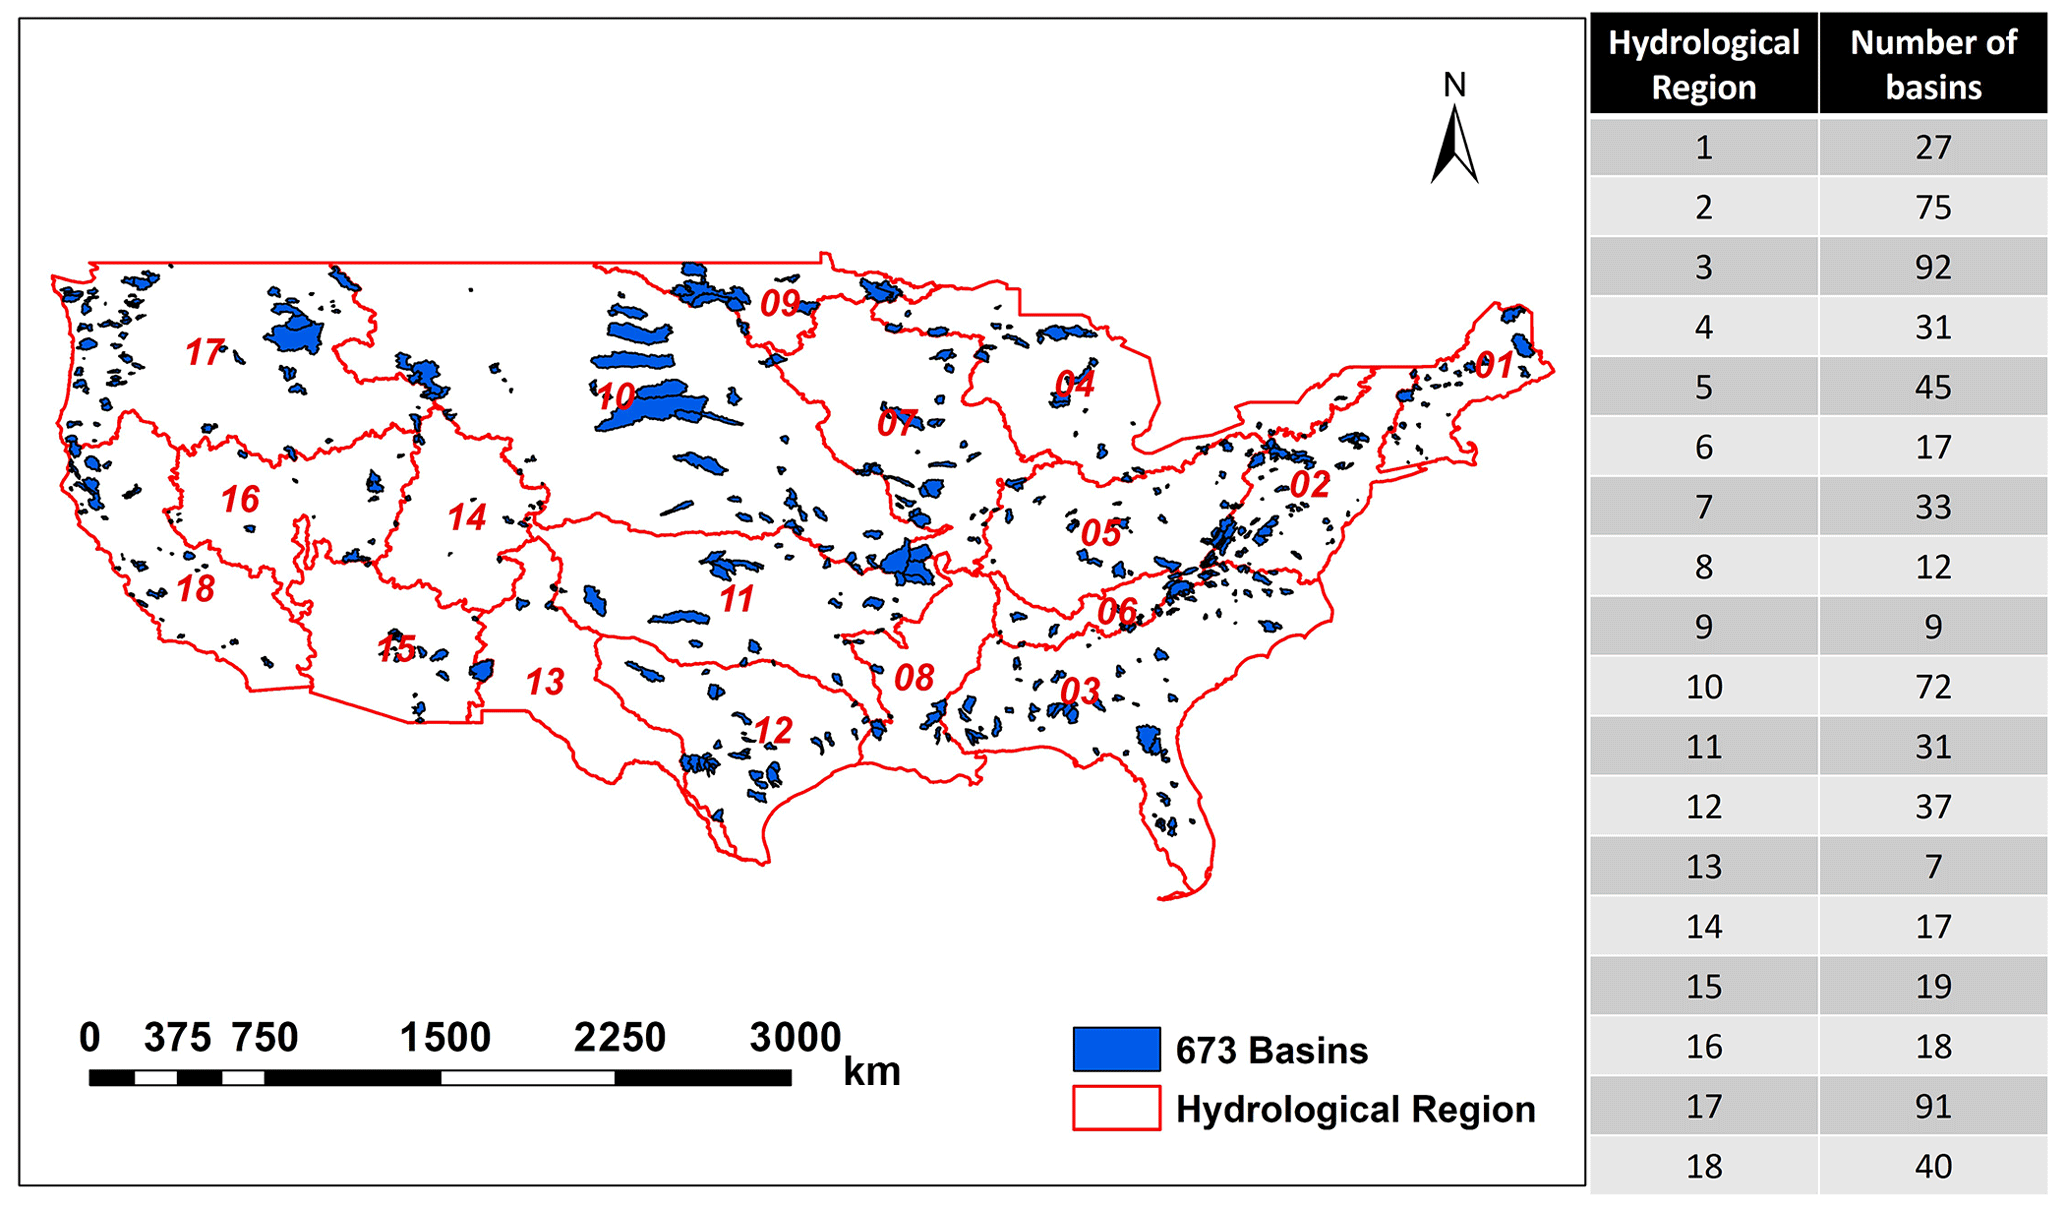
Figure 2Overview of the basin locations and corresponding hydrological regions. This map was created using ArcGIS software (Esri Inc. 2020).
WFI is based on the stepwise cluster analysis (SCA) algorithm (Huang, 1992). The fundamental difference between WFI and MDI comes from the split criterion and the tree deduction process. Let us recall the split criterion of CART, in which the optimum split point for Xj is located based on the minimum squared errors of Y1 and Y2 as shown in Eq. (1). In WFI, this function is achieved by comparing the two subspaces' (i.e. Y1 and Y2) likelihood, which is measured through the Wilks Λ statistics (Nath and Pavur, 1985; Wilks, 1967). It is defined as , where Det(W) is the determinant of a matrix, and W and B are the within- and between-group sums of squares and cross-product matrices in a standard one-way analysis of variance, respectively. The W and B can be given by
The value of Λ is a measure of how effective Xj can differentiate between Y1 and Y2. The smaller Λ value represents a larger difference between Y1 and Y2. The distribution of Λ is approximated by Rao's F approximation (R statistic), which is defined as
where the R statistic is distributed approximately as an F variate with and degrees of freedom, and m is the number of groups. Since the number of groups is two in this study, an exact F test is possibly performed based on the following Wilks Λ criterion as
Therefore, the two subspaces can be compared for examining significant differences through the F test. The null hypothesis would be versus the alternative hypothesis , where μ(Y1) and μ(Y2) are population means of Y1 and Y2, respectively. If we let the significance level be α, the split criterion would be Fcal<Fα (i.e. H0 is false), which implies that the difference between two subspaces is significant, and thus they should be split.
The second difference between the CART and SCA algorithms lies in the tree deduction procedure. In CART, the splitting process will be repeated until any newly generated subspace can no longer be split. In SCA, once all the nodes in the current stage have been examined for splitting, merging will be followed in the next stage, as illustrated in Fig. 1. The merging process will compare any pairs of nodes based on the value of Wilks Λ to test whether they can be merged for Fcal≥Fα (H0 is true), which indicates that these two subspaces have no significant difference and thus should be merged. Such splitting and merging processes are iteratively performed until no node can be further split or merged. Once an SCA tree is built, the WFI for the variable Xj computed via an SCA tree is defined as
where S is the total spaces in a tree, Ps is the fraction of instances falling into s, and Λ () denotes the value of Λ obtained at the optimum splitting point of space s with row and column coordinates z and j, respectively. Similar to the calculation of MDI in Eq. (3), the WFI for Xj computes the weighted (1−Λ) value related to the splits using the jth predictor.
According to the law of large numbers, WFI is expected to perform better under the RF framework since the randomized predictors ensure enough tree diversity, leading to more balanced importance scores. Therefore, we name the ensemble of SCA as the stepwise clustered ensemble (SCE). In addition to the three hyperparameters (i.e. Ntree, Nmin, and Mtry) for Breiman's RF, SCE also requires the significance level (α), which is used for the F test during the node splitting process.
There could be two potential advantages of WFI over MDI. First, the decrease in node impurity (DI) will become smaller and smaller as long as the tree level goes down (as shown in the bottom-right table in Fig. 1). Such a mechanism naturally assumes that the predictors considered (for node splitting) in lower levels of the tree are less significant than those in upper levels. This effect is even aggravated by the existence of predictor dependence, which will depress the importance scores of independent predictors and increase the positively dependent ones (Scornet, 2020). As a consequence, some critical predictors may only receive small importance scores. In comparison, Wilks Λ is a measure of the separateness of two subspaces, which could avoid the above-mentioned issue for MDI because values of (1−Λ) do not necessarily decline as long as the tree level goes down (as shown in the bottom-right table in Fig. 1). Therefore, the predictors that are primarily considered in later splits may have higher importance scores than those in earlier splits. As a consequence, some critical predictors might be identified by WFI but overlooked by MDI. Second, the node splitting mechanism of WFI is based on the F test, which, therefore, may significantly reduce the probabilities that the two child nodes are split due to chance. Such a mechanism could be helpful to build more robust input–output relationships for prediction and inference by reducing overfitting. The above-mentioned potential advantages of WFI will be tested with a large number of hydrological simulations in the following two sections.
4.1 Dataset description
The Catchment Attributes and Meteorological (CAMELS) dataset (version 1.2) (Addor et al., 2017; Newman et al., 2015) was used to evaluate the WFI performance. The dataset contains daily forcing and hydrologic response data for 673 basins across the contiguous United States that spans a very wide range of hydroclimatic conditions (Fig. 2) (Newman et al., 2015). These basins range in size between 4 and 25 000 km2 (with a median basin size of 336 km2) and have relatively low anthropogenic impacts (Kratzert et al., 2019b).
In attempting to demonstrate the relative importance of meteorological data and large-scale climatic indices on streamflow, we used monthly mean values of meteorological data in CAMELS dataset and four commonly used large-scale climatic indices (including Nino3.4, Trenberth, 1997; Pacific decadal oscillation (PDO), Mantua et al., 1997; interdecadal Pacific oscillation (IPO), Mantua et al., 1997; and Pacific North American index (PNA), Leathers et al., 1991) to simulate the monthly streamflows. To reflect the initial catchment conditions and lagged impact of climatic indices, the 2-month moving average meteorological data and climatic indices of the preceding 2 months were incorporated as model predictors. Therefore, the input–output structure (with 22 predictors) for each of these basins can be written as follows:
where Qt represents streamflow of month t. Pr, Rad, Tmax, Tmin, and Vp represent monthly values of precipitation, short-wave radiation, maximum temperature, minimum temperature, and vapour pressure, respectively.
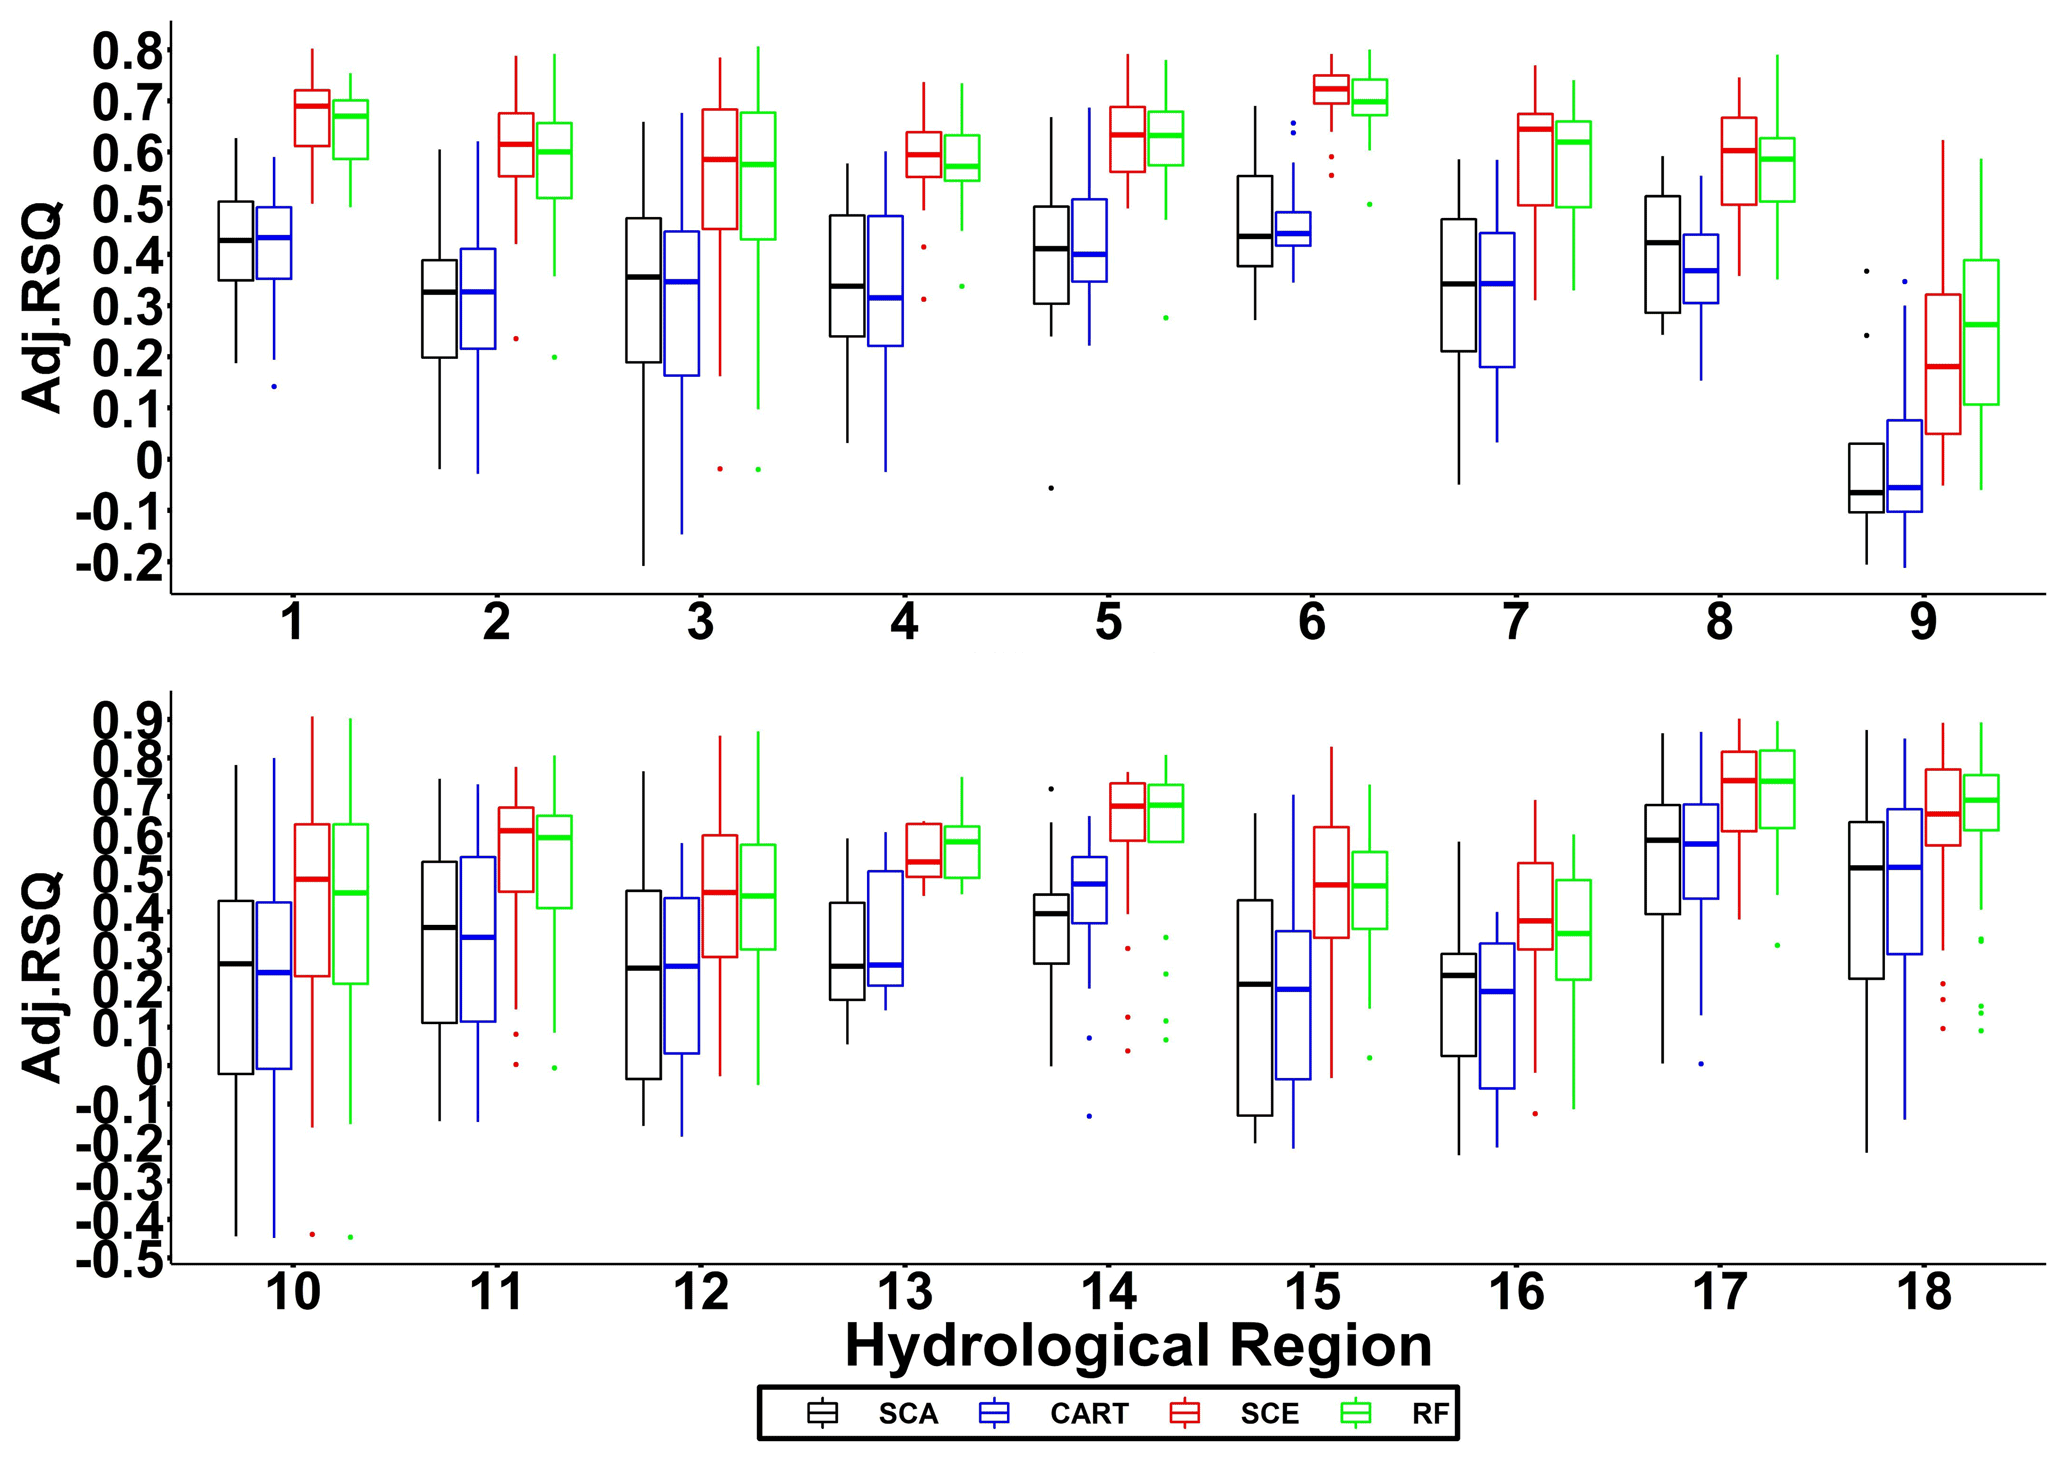
Figure 3Adjusted R2 for 18 hydrological regions. Each box indicates statistical summaries (i.e. the bars represent median value; the lower and upper boundaries of a box represent first and third quantiles, respectively; dots represent outliers) of adjusted R2 for all the basins in a particular hydrological region.
4.2 Evaluation procedures and metrics
The model training was performed based on January 1980 to December 2005, while the testing was done based on the period of January 2006 to December 2014. The hyperparameters for both RF and SCE were set as follows: Ntree was set as 100, Nmin was set as 5, and Mtry was set as 0.5 as suggested by Barandiaran (1998), indicating half of the predictors were selected in each tree. In addition, the significance level (α) was set as 0.05 for the F test in SCE.
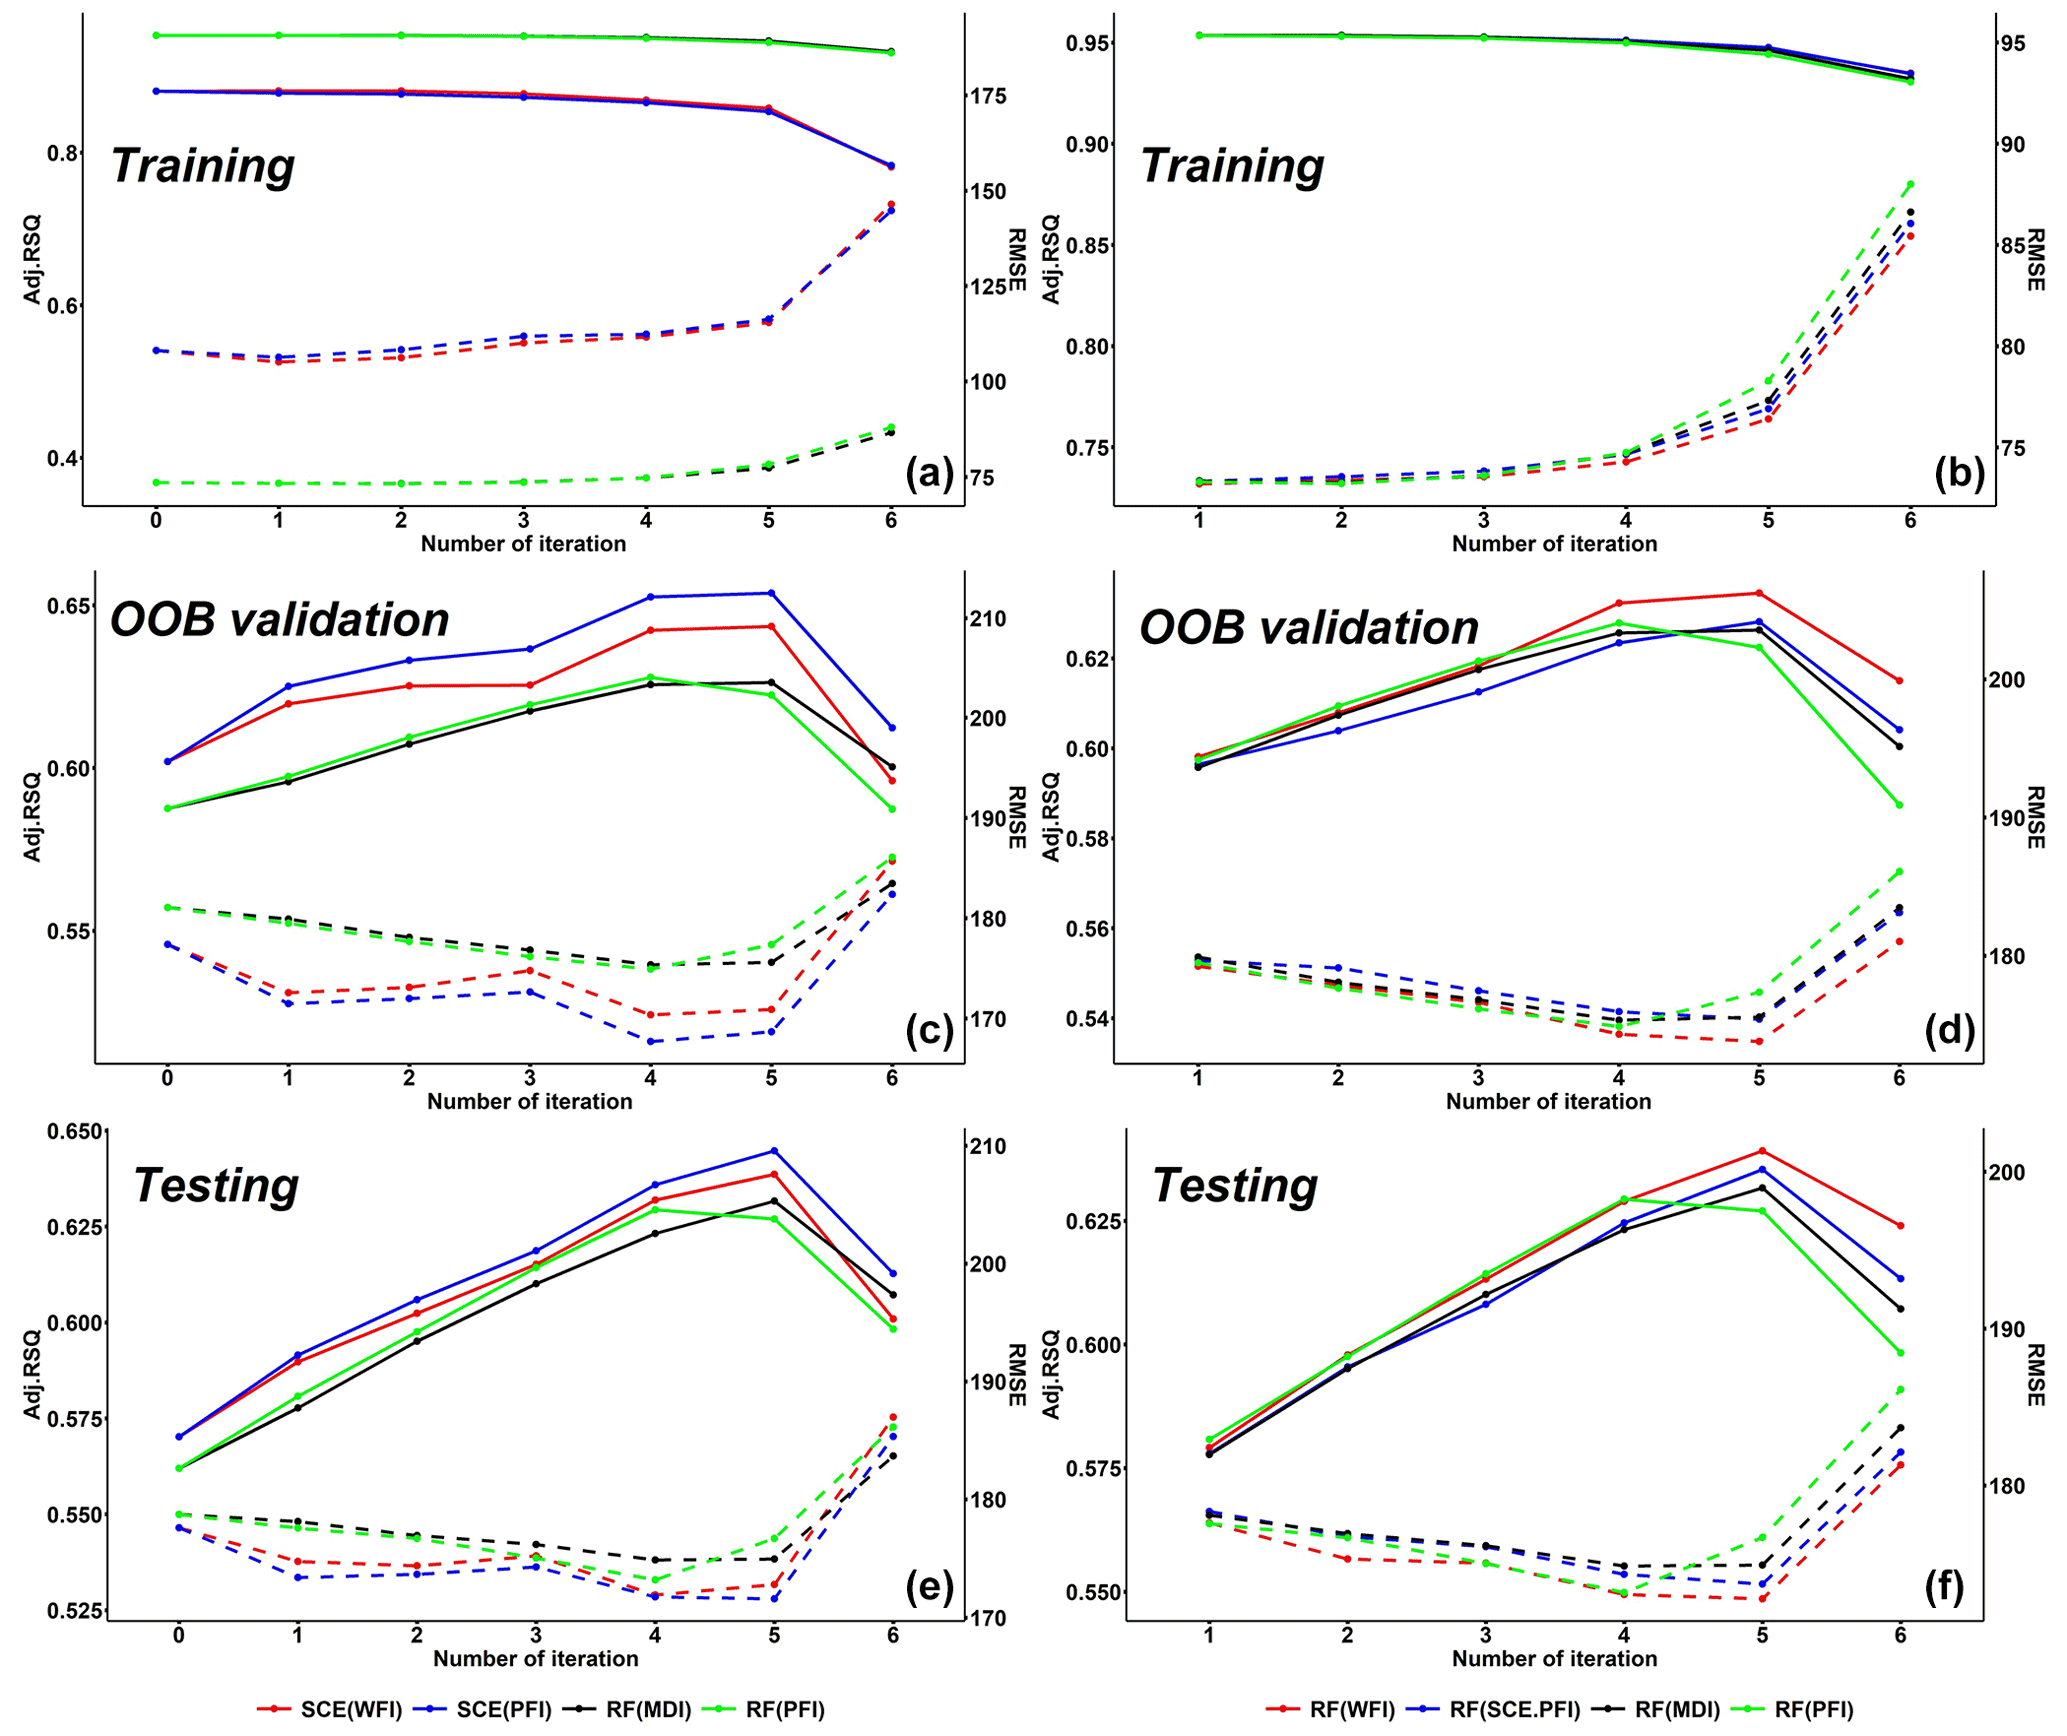
Figure 5Iterative change in accuracy in mean values of 673 US basins. The solid lines indicate adjusted R2, while the dashed lines represent RMSE. The panels in the left column show SCE and RF performances based on variables selected by themselves, while the panels on the right show RF model performances based on variables selected by SCE and RF. The models with an iteration number of 0 represent the model with all 22 predictors.
The performance of WFI will be evaluated and compared against PFI (applied to RF and SCE) and MDI (applied to RF). To improve the stability of the PFI results, previous studies have suggested repeating and averaging the PFI over repetitions (Molnar, 2020). In this study, the PFI process was repeated 10 times and then averaged for stabilizing the results. To facilitate the comparisons among different variable rankings, importance scores from the three feature importance methods were scaled into the [0, 1] range. All the feature importance methods will be evaluated through recursive feature elimination (RFE) (Guyon et al., 2002) as follows: (1) train SCE and RF models with all predictors; (2) calculate the importance scores using the three interpretation methods embedded in their corresponding models; (3) exclude the three least relevant predictors for each set of the importance scores obtained in step 2; (4) retrain the models using the remaining predictors in step 3; and (5) repeat step 2 to 4 until the number of predictors is less than or equal to a threshold (set to 4 in this case study). To directly compare the quality of variable rankings from different feature importance measures, the selected predictors from WFI (after every RFE iteration) were also used to train RF. This procedure allows the effects of different variable rankings to be solely from feature importance methods (i.e. removed the effects from different node splitting algorithms). The same procedure was also performed for SCE-based PFI (i.e. SCE-PFI) to examine whether the differences in variable rankings are from the WFI method or the tree deduction process in SCE.
Two error metrics (i.e. adjusted R2 and RMSE) were used to evaluate the model performance. Adjusted R2 has been used instead of R2 because adjusted R2 can consider the number of predictors. Adjusted R2 is defined as
where P is the number of predictors, and N is the number of instances.
RMSE is defined as
where yn and are the nth observed and predicted streamflow values, respectively.
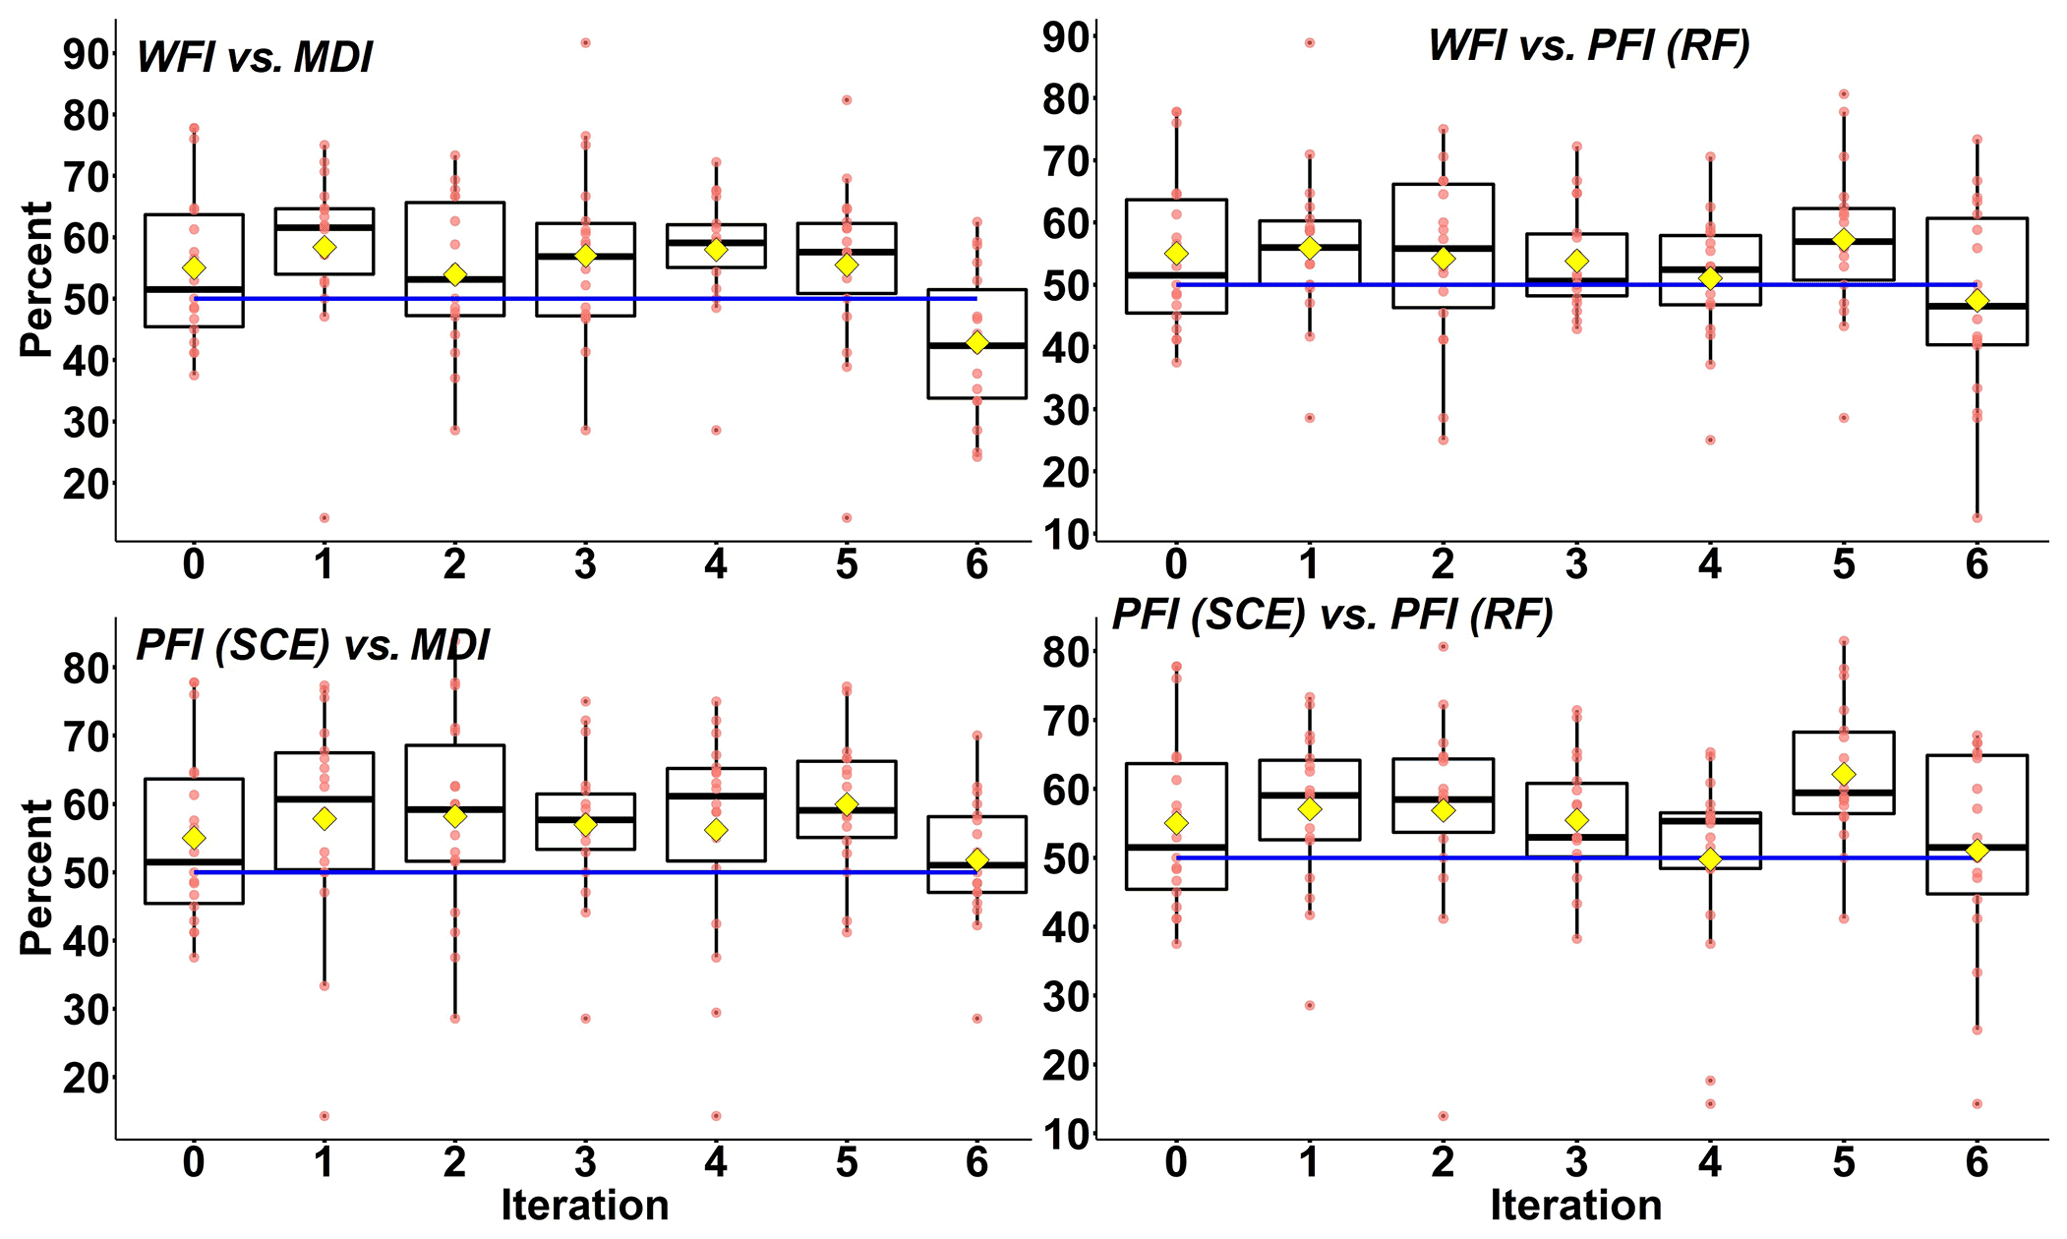
Figure 6Pairwise comparisons of model performance with different feature importance measures. Each of these red points represents the percentage of basins simulated by model A outperforming model B (based on adjusted R2), in one particular hydrological region. The blue line represents 50 % percent, and the yellow square represents the mean percentage of 18 hydrological regions.

Figure 7Pairwise comparisons of RF model performance with different feature importance measures. Z scores and p values are calculated based on the two-sided Mann–Kendall trend test. If the Z score is greater than 1.96, an increasing trend can be assumed with a significance level of 0.05. If the Z score is greater than 1.645, an increasing trend can be assumed with a significance level of 0.1. Other notation is the same as in Fig. 6.
To evaluate the stability of a feature importance method, we consider reducing predictors during the RFE iterations as a form of perturbation to the dataset. Suppose the obtained importance scores for a dominant predictor show an irregular changing pattern during the RFE iterations. In that case, the method is not stable because it leads to many versions of inferences for such a predictor. On the other hand, if such a changing pattern is predictable (e.g. monotonically increasing trend), a stable inference can be achieved among interactions because the predictable pattern can help analyse how a predictor reacts to the change in the dataset. In this study, the monotonicity is examined using Spearman's rank correlation coefficient (i.e. Spearman's ρ), which is commonly used to test the statistical dependence between the rankings of two variables and is defined as
where RXi denotes the ranks of variables X for the ith RFE iteration, RYi is the number of selected predictors for the ith RFE iteration, and and are the means of RXi and RYi, respectively. Larger Spearman's ρ values indicate the importance score for a predictor will increase along with the reduction of irrelevant predictors, leading to stable importance scores.

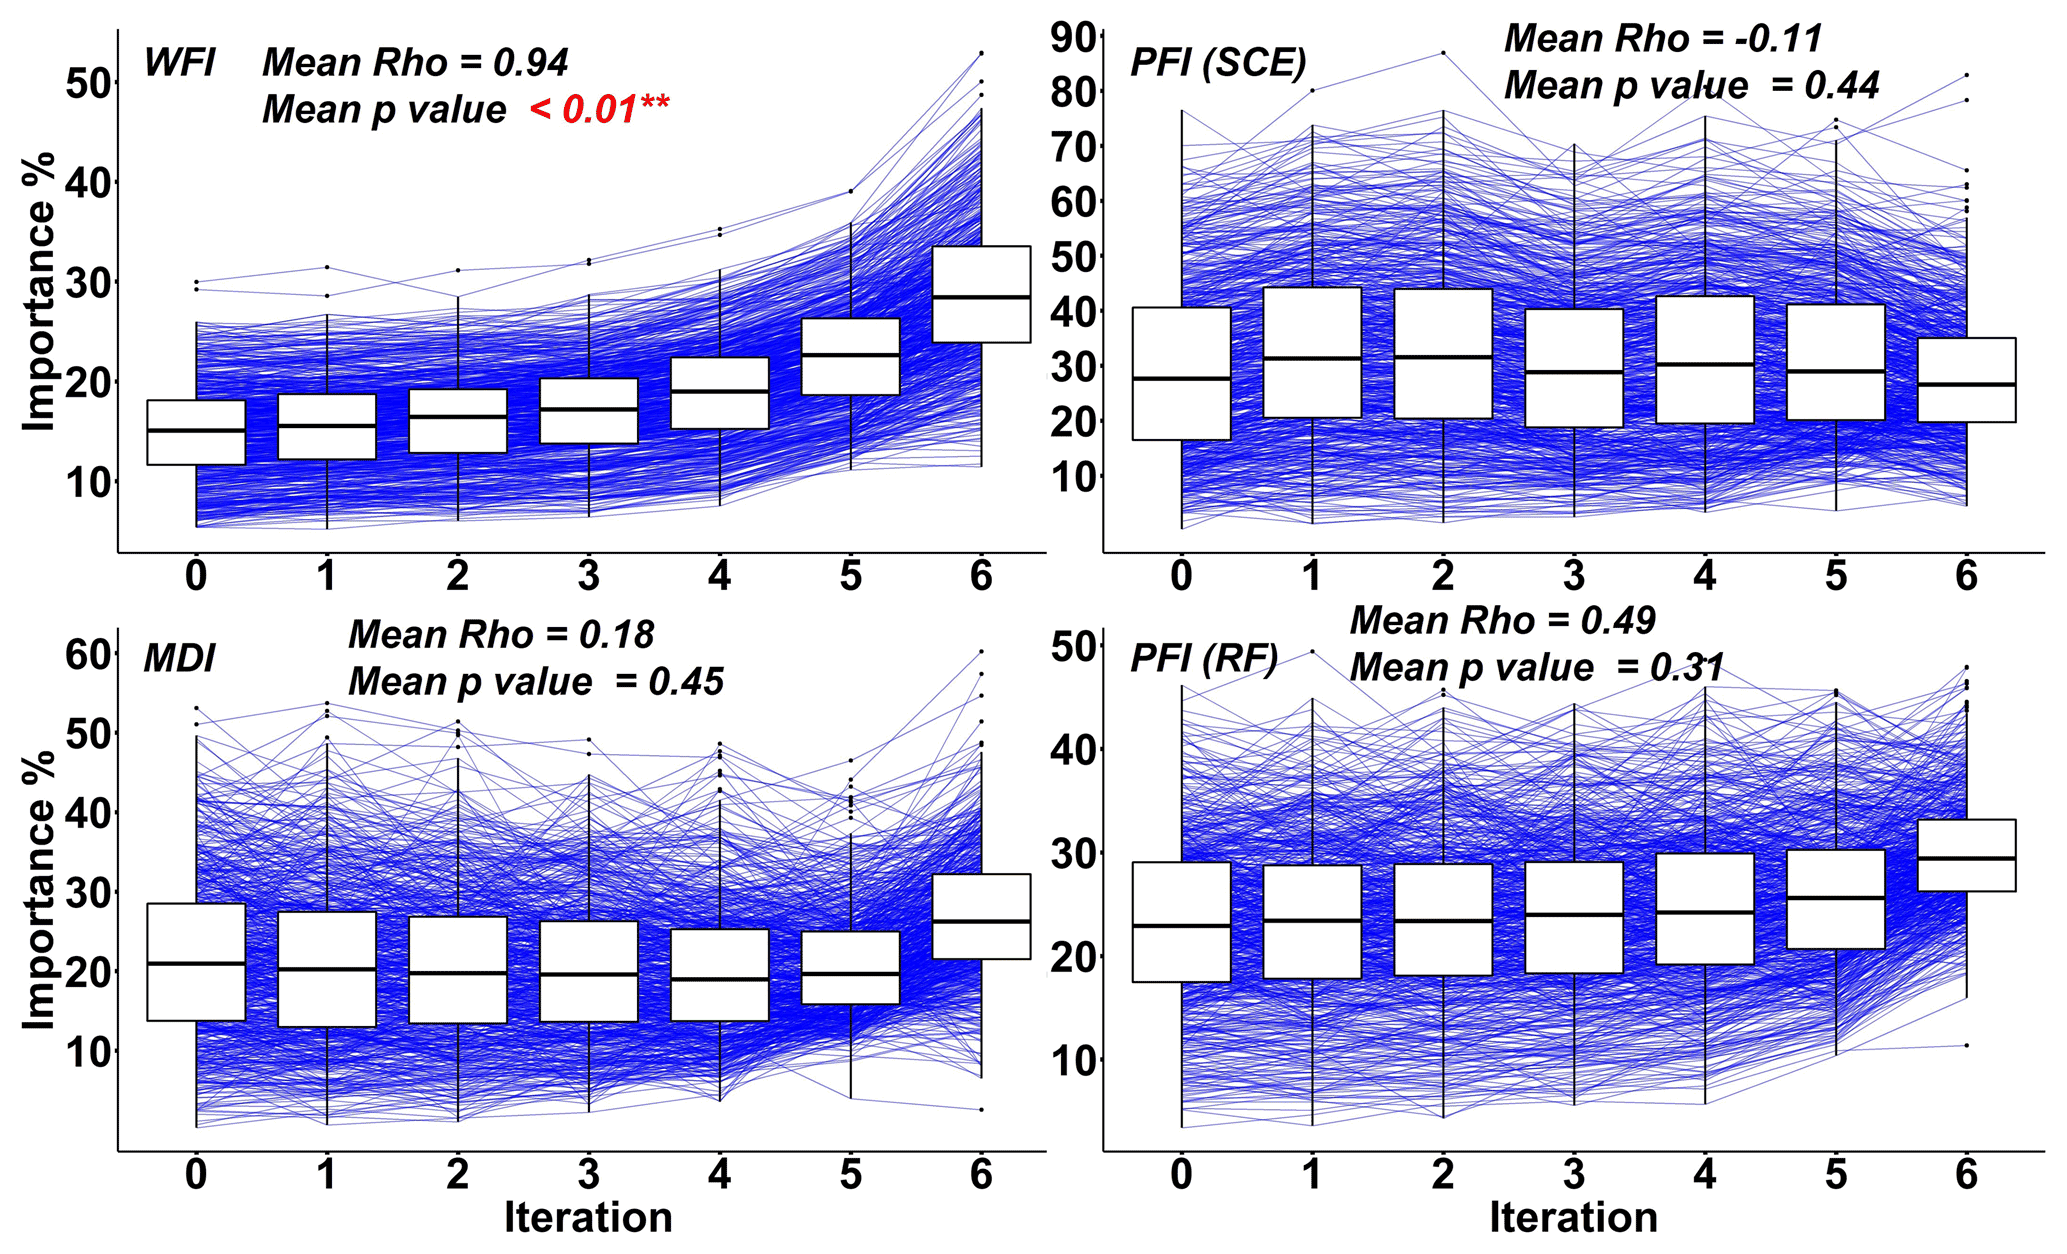
Figure 9Mean Spearman's ρ values for the most important features. The mean p value means how likely it is that the observed correlation is due to chance. Small p values indicate strong evidence for the observed correlations.
4.3 Predictive accuracy and interpretation stability
Figure 3 shows the model testing performances (adjusted R2) for 18 hydrological regions with all 22 predictors. The results show that SCE and RF significantly outperform SCA and CART, respectively. When taking a close look at these two pairs of model performance, SCA and CART are close to each other, while SCE outperforms RF in most hydrological regions (except the 9th region).
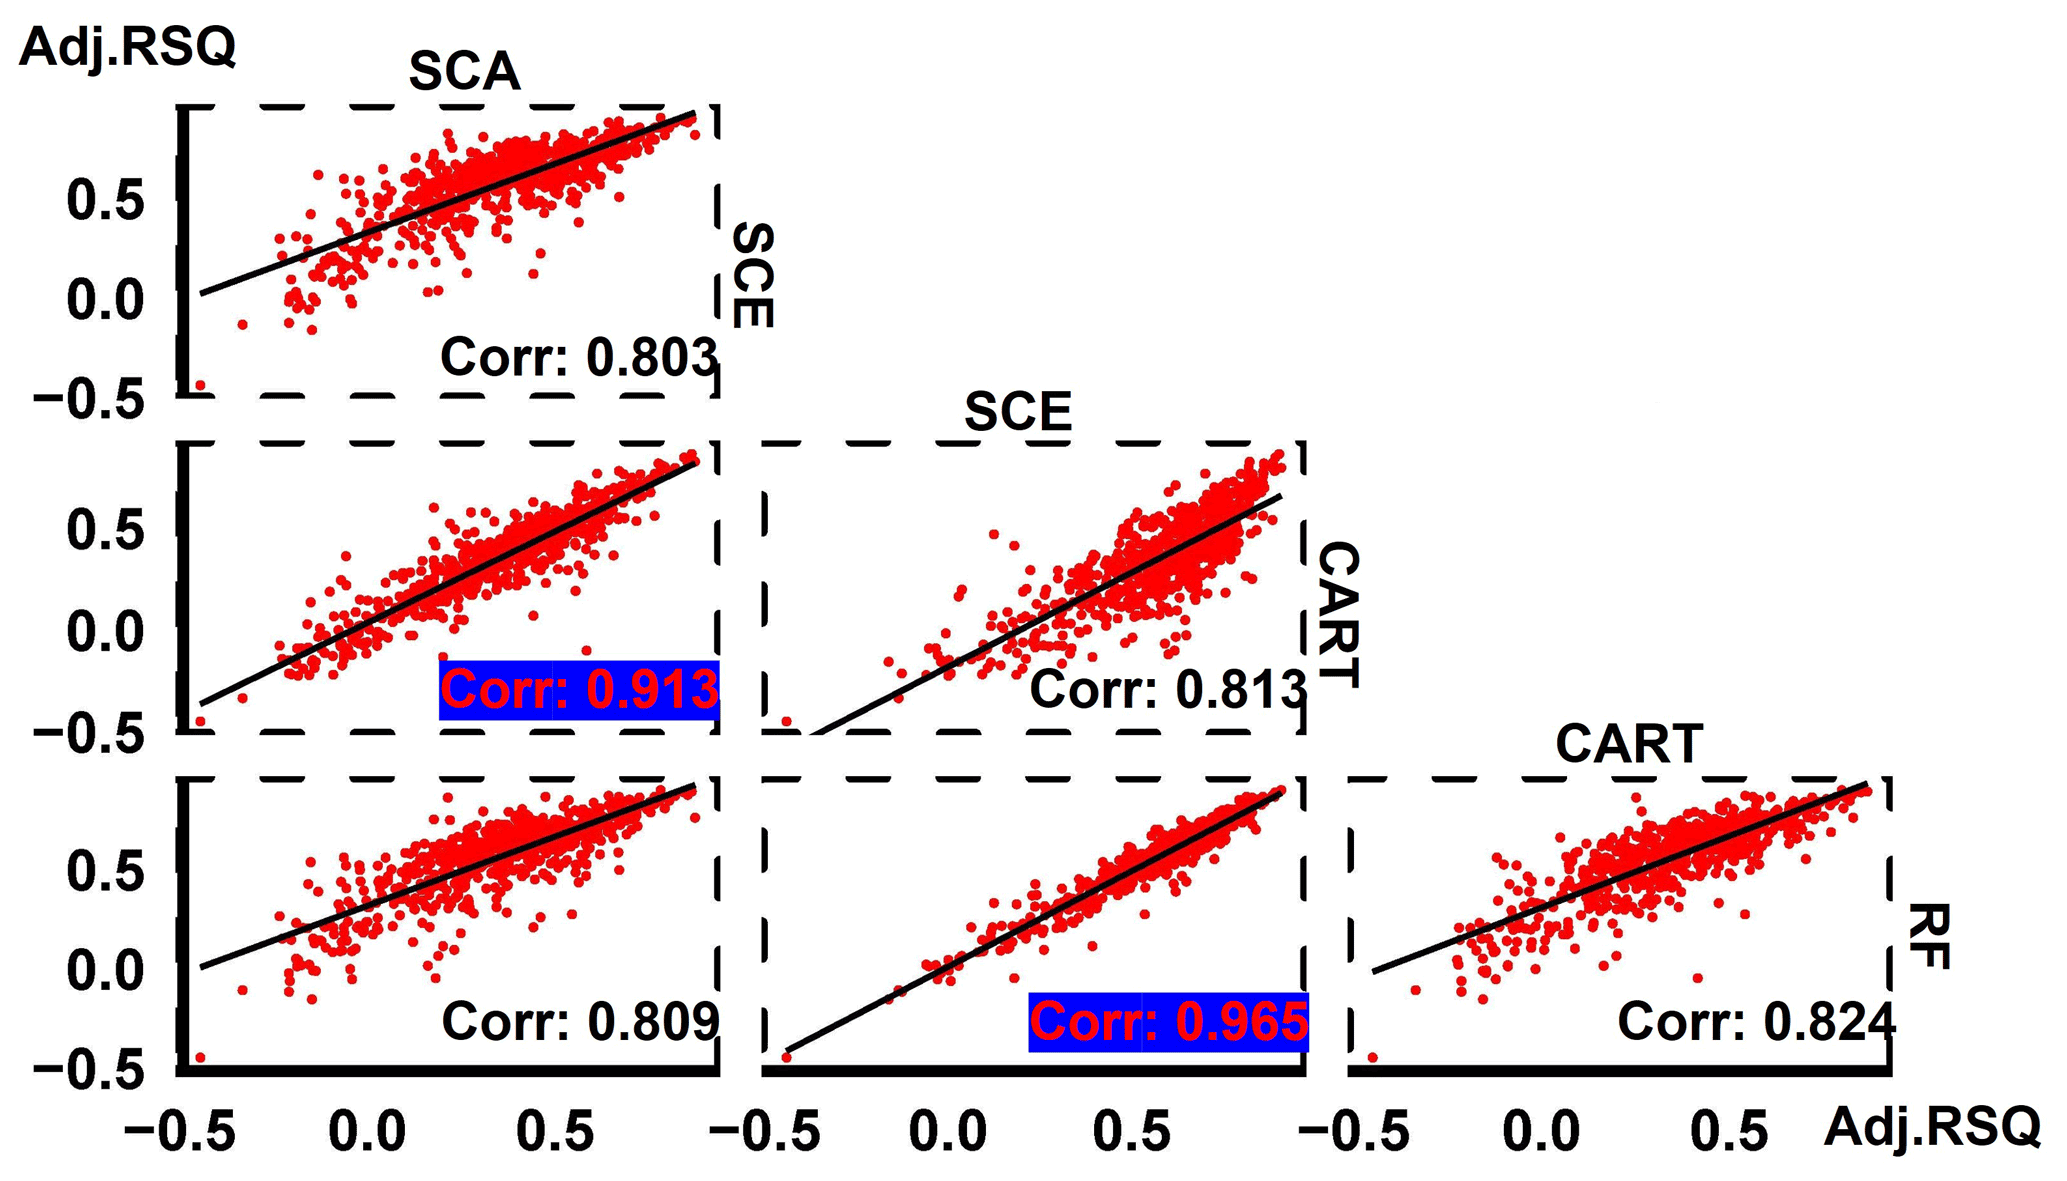
The pairwise comparisons of these four algorithms over 673 basins show a high coefficient of determination (0.913) of adjusted R2 between SCE and RF and an even higher coefficient of determination (0.965) between SCE and RF (Fig. 4). This result indicates that, in general, it is not likely that there is a distinct performance gap for a particular simulation task, either between SCA and CART or between SCE and RF. Therefore, SCA/SCE can be a good substitute for CART/RF.
The left column in Fig. 5 shows simulation performances based on RFE iterations for three feature importance measures embedded in SCE and RF. In general, both models can improve their simulation performance by eliminating irrelevant predictors. When the number of predictors reduces to 7 (i.e. at the 5th iteration), both models reach their highest predictive accuracy over the OOB and testing dataset. This result indicates that it is plausible to use the OOB dataset to identify the optimum subset of predictors. Comparing the simulation performance for the training period, the simulation performance for SCE is much lower than it for RF, while an opposite result is observed for the testing period. This result highlights the issue of overfitting for RF. One exception where RF outperforms SCE (for the testing period) happens in the last (i.e. 6th) iteration, where RF with MDI-selected predictors outperforms SCE with WFI-selected ones. We can assume that RF may have a better chance to outperform SCE with insufficient predictors. Nevertheless, SCE achieves the overall best performance with PFI-selected predictors.
The upper left panel in Fig. 6 shows that from 0th to 5th iterations, over 55 % to 60 % of basins (as indicated by yellow diamonds) simulated by SCE with WFI-selected predictors outperform those simulated by RF with MDI-selected predictors. In comparison, the number drops to about 40 % at the 6th iteration. This result agrees with the results shown in Fig. 5. The lower left panel in Fig. 6 shows that from the 1st to 5th iterations, there is a higher chance that SCE with PFI-selected predictors outperforms RF with MDI-selected ones for over 75 % of the hydrological regions (as indicated in Fig. 6 that the black boxes are above the blue line).
The reliability of variable rankings of WFI is further investigated using the WFI and SCE-PFI-selected predictors from each of the RFE iterations to run RF models. The results are shown in the right column in Fig. 5. The RF simulations with WFI-selected predictors achieved the highest predictive accuracy in most RFE iterations over the training, OOB validation, and testing datasets. In particular, the WFI-selected predictors have shown significant strength in the last two iterations and facilitated RF to improve its predictive accuracy. It is worth mentioning that even though SCE-PFI-selected predictors allowed SCE to achieve its optimum performance, they did not deliver optimum performance for RF. This result shows WFI-selected predictors provide a better universal solution than the PFI-selected ones.
The upper left panel in Fig. 7 shows that the majority of basins simulated by RF with WFI-selected predictors outperform those simulated by RF with MDI-selected predictors. In particular, at the 6th iteration, basins in 16 (out of 18) hydrological regions may own better performance with WFI-selected predictors than with the MDI-selected predictors. In addition, as the number of predictors decreases, there are increasing chances that WFI-selected predictors could generate better performance than the MDI-selected ones. Based on a two-sided Mann–Kendall (M-K) trend test (Kendall, 1948; Mann, 1945), such an increasing trend is significant (i.e. the Z score equals 2.63, and the p value is smaller than 0.01). Another significant increasing trend (i.e. the Z score equals 1.88, and the p value equals 0.06) can also be observed for the paired studies of WFI and RF-PFI. In contrast, no significant increasing trend can be observed for the pairs of SCE-PFI and MDI, as well as SCE-PFI and RF-PFI. This finding indicates WFI could generate robust variable rankings, based on which informative predictors are more likely to be kept for optimum simulation performance. In contrast, other feature importance measures may lose critical predictors during the RFE process.
Figure 8 shows the summaries of selected predictors (in the last iteration) with different feature importance measures. Pr (monthly precipitation at time step t) and Pr2 (mean values for monthly precipitation at time step t and t−1) are considered the two most important predictors for the SCE algorithm with WFI-selected predictors. In contrast, MDI considers Tmax2 (mean values for the monthly maximum temperature at time step t and t−1) as the most important predictor for monthly streamflow simulation. It is acknowledged that streamflow is more responsive to precipitation than air temperature. Therefore, we can assume that RF may capture more acute responses of streamflow with WFI-selected predictors than MDI- or PFI-selected ones. This assumption could be one of the reasons that RF with WFI-selected predictors outperforms the others. It should be noted that IPO is considered an important predictor for 56 out of 673 basins with WFI, while this predictor has only been employed in 21, 5, and 10 basins with SCE-PFI, MDI, and RF-PFI methods, respectively.
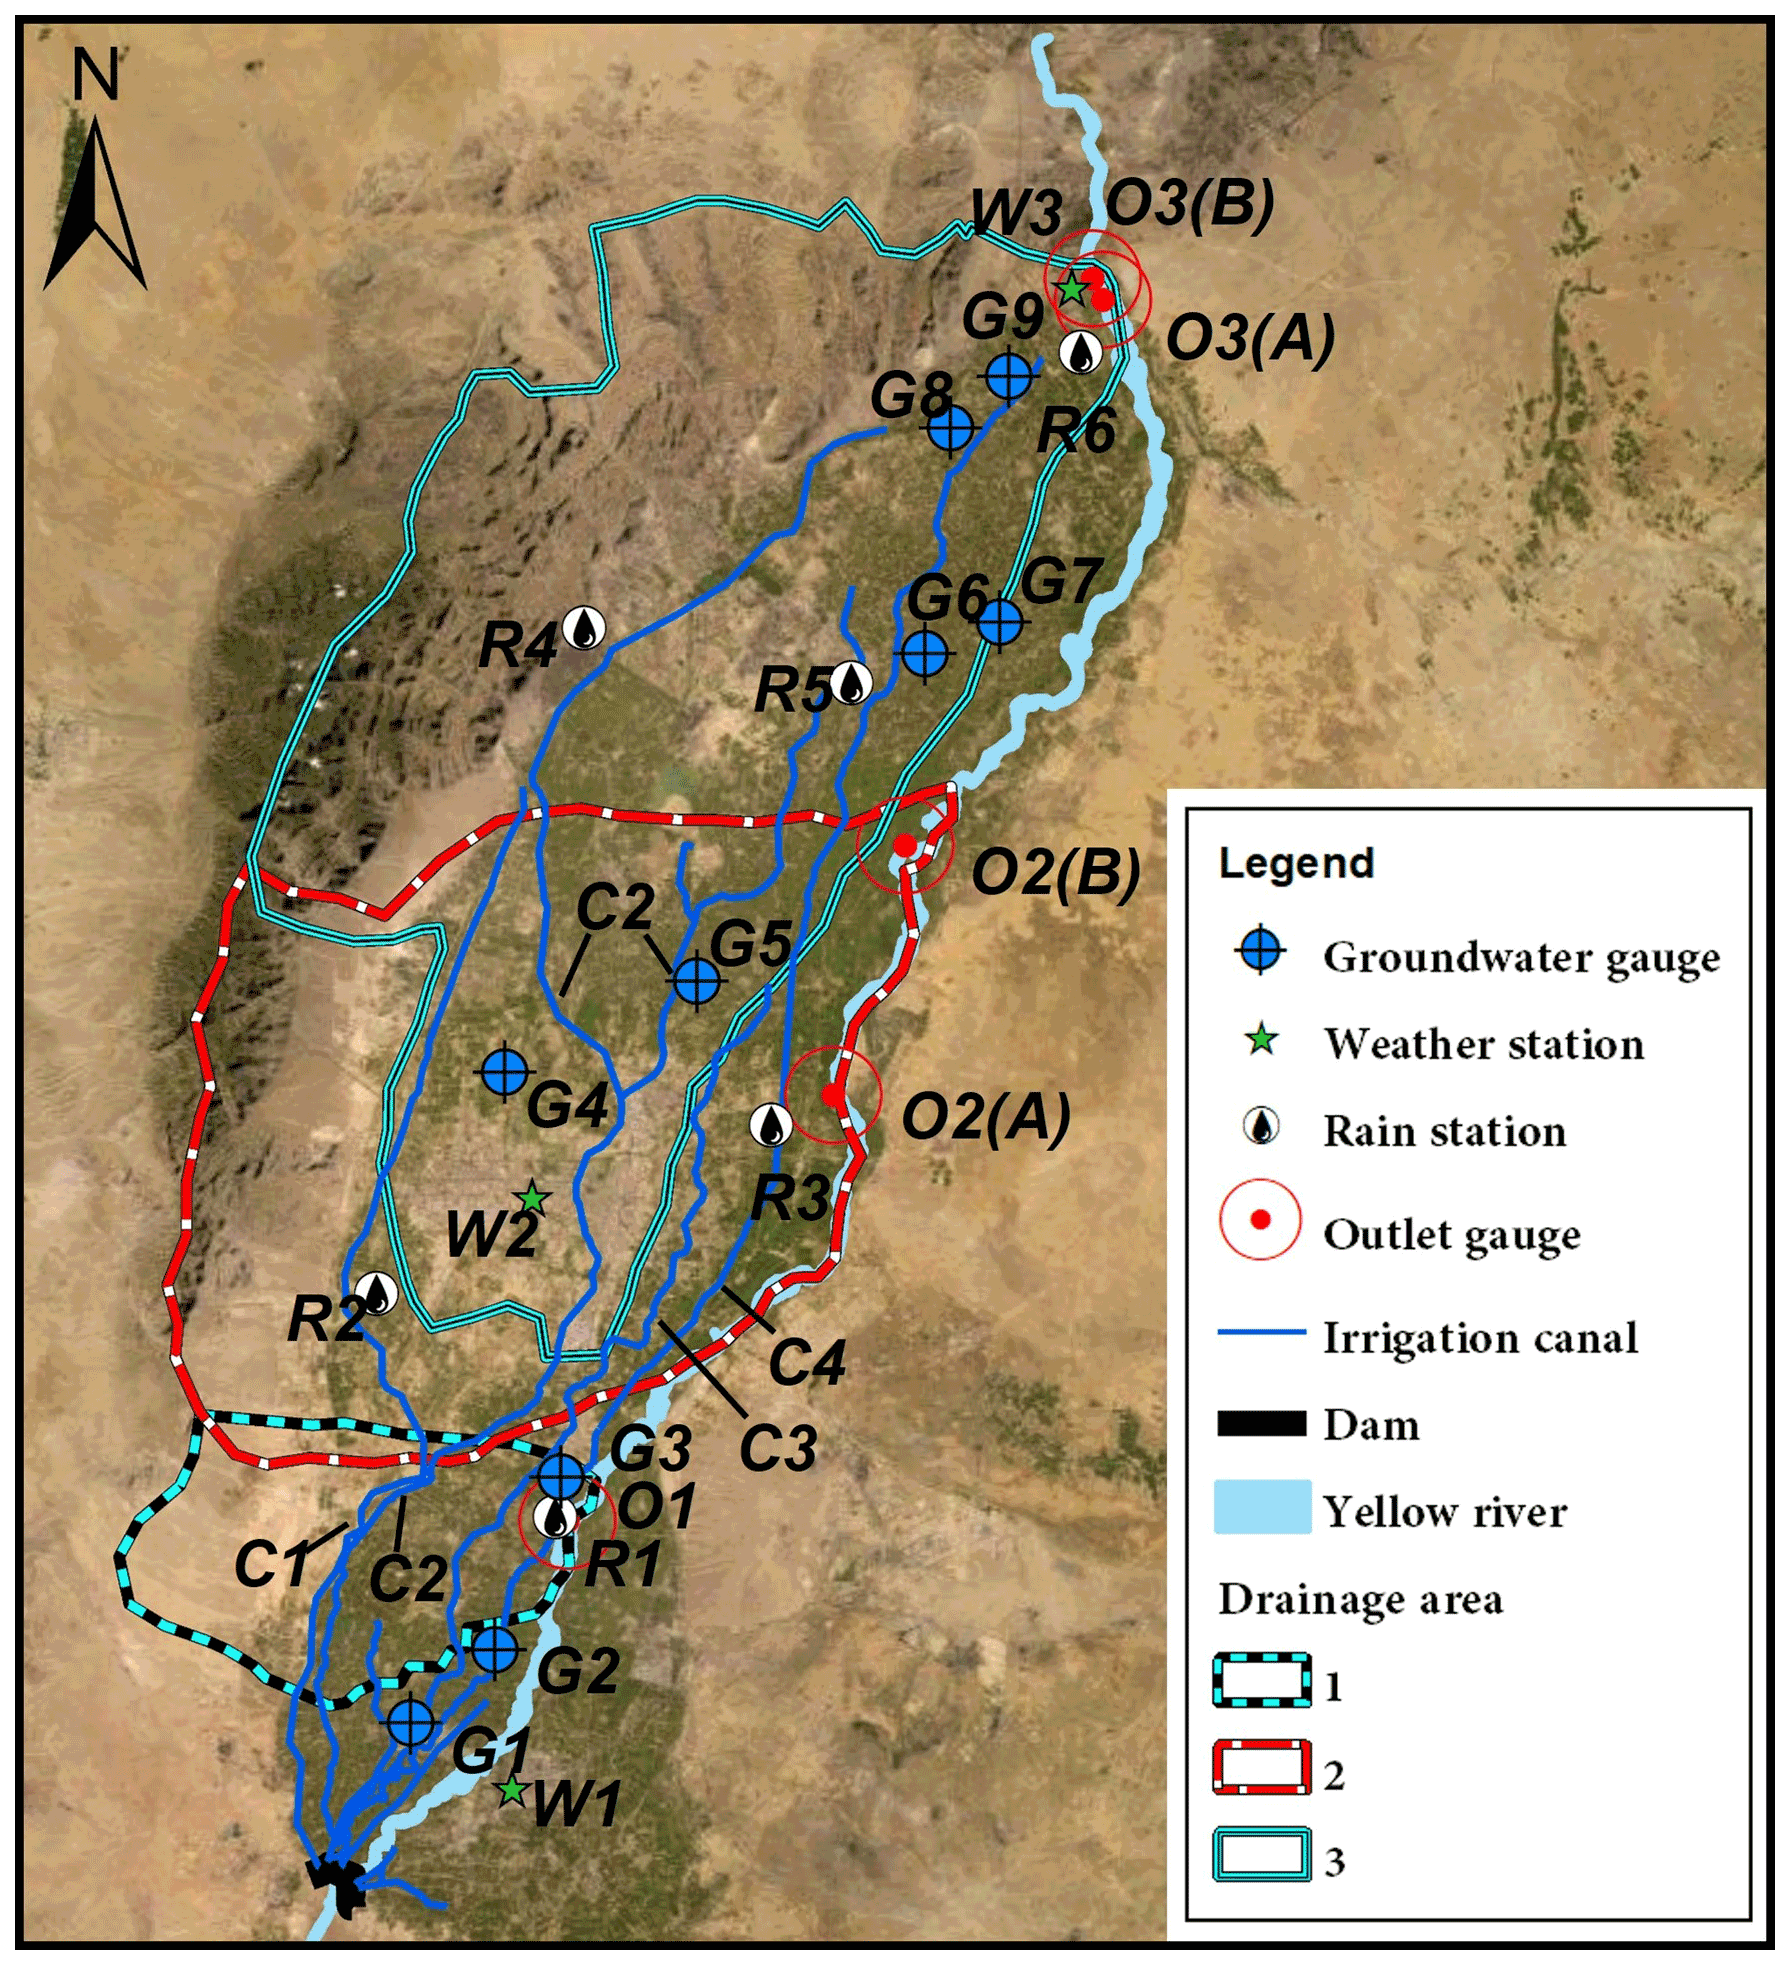
Figure 10Map of the study area. Note that due to the extremely flat surface, three interconnected irrigated watersheds are approximately delineated. In this map, G indicates groundwater gauges, W indicates weather stations, R indicates rain stations, C indicates irrigation canals, and O indicates drainage outlets. Both second and third irrigated watersheds contain two cris-crossed drainages with strong hydrological connections. The map was created using ArcGIS software (Esri Inc. 2020).

Spearman's Rho (ρ) values for the predictor with the highest importance score (at the last RFE iteration) illustrate the stability of all three interpretation methods embedded in SCE and RF (Fig. 9). The results indicate that the importance score for the predominant predictor increases in response to the reduction of irrelevant predictors. Compared with other feature importance measures, WFI achieves the highest ρ values in general, with the p value less than 0.01, indicating a significant correlation between the importance score and the reduction of irrelevant features. In comparison, eliminating irrelevant predictors will significantly influence the importance score of predominant predictors obtained by PFI and MDI. This fact challenges the application of the PFI and MDI since the removal of irrelevant predictors cannot guarantee the same or similar level of hydrological inference because the importance score may distinctly vary according to the reduction of irrelevant predictors. In contrast, the WFI method provides more stable importance scores and will lead to more consistent hydrological inferences.
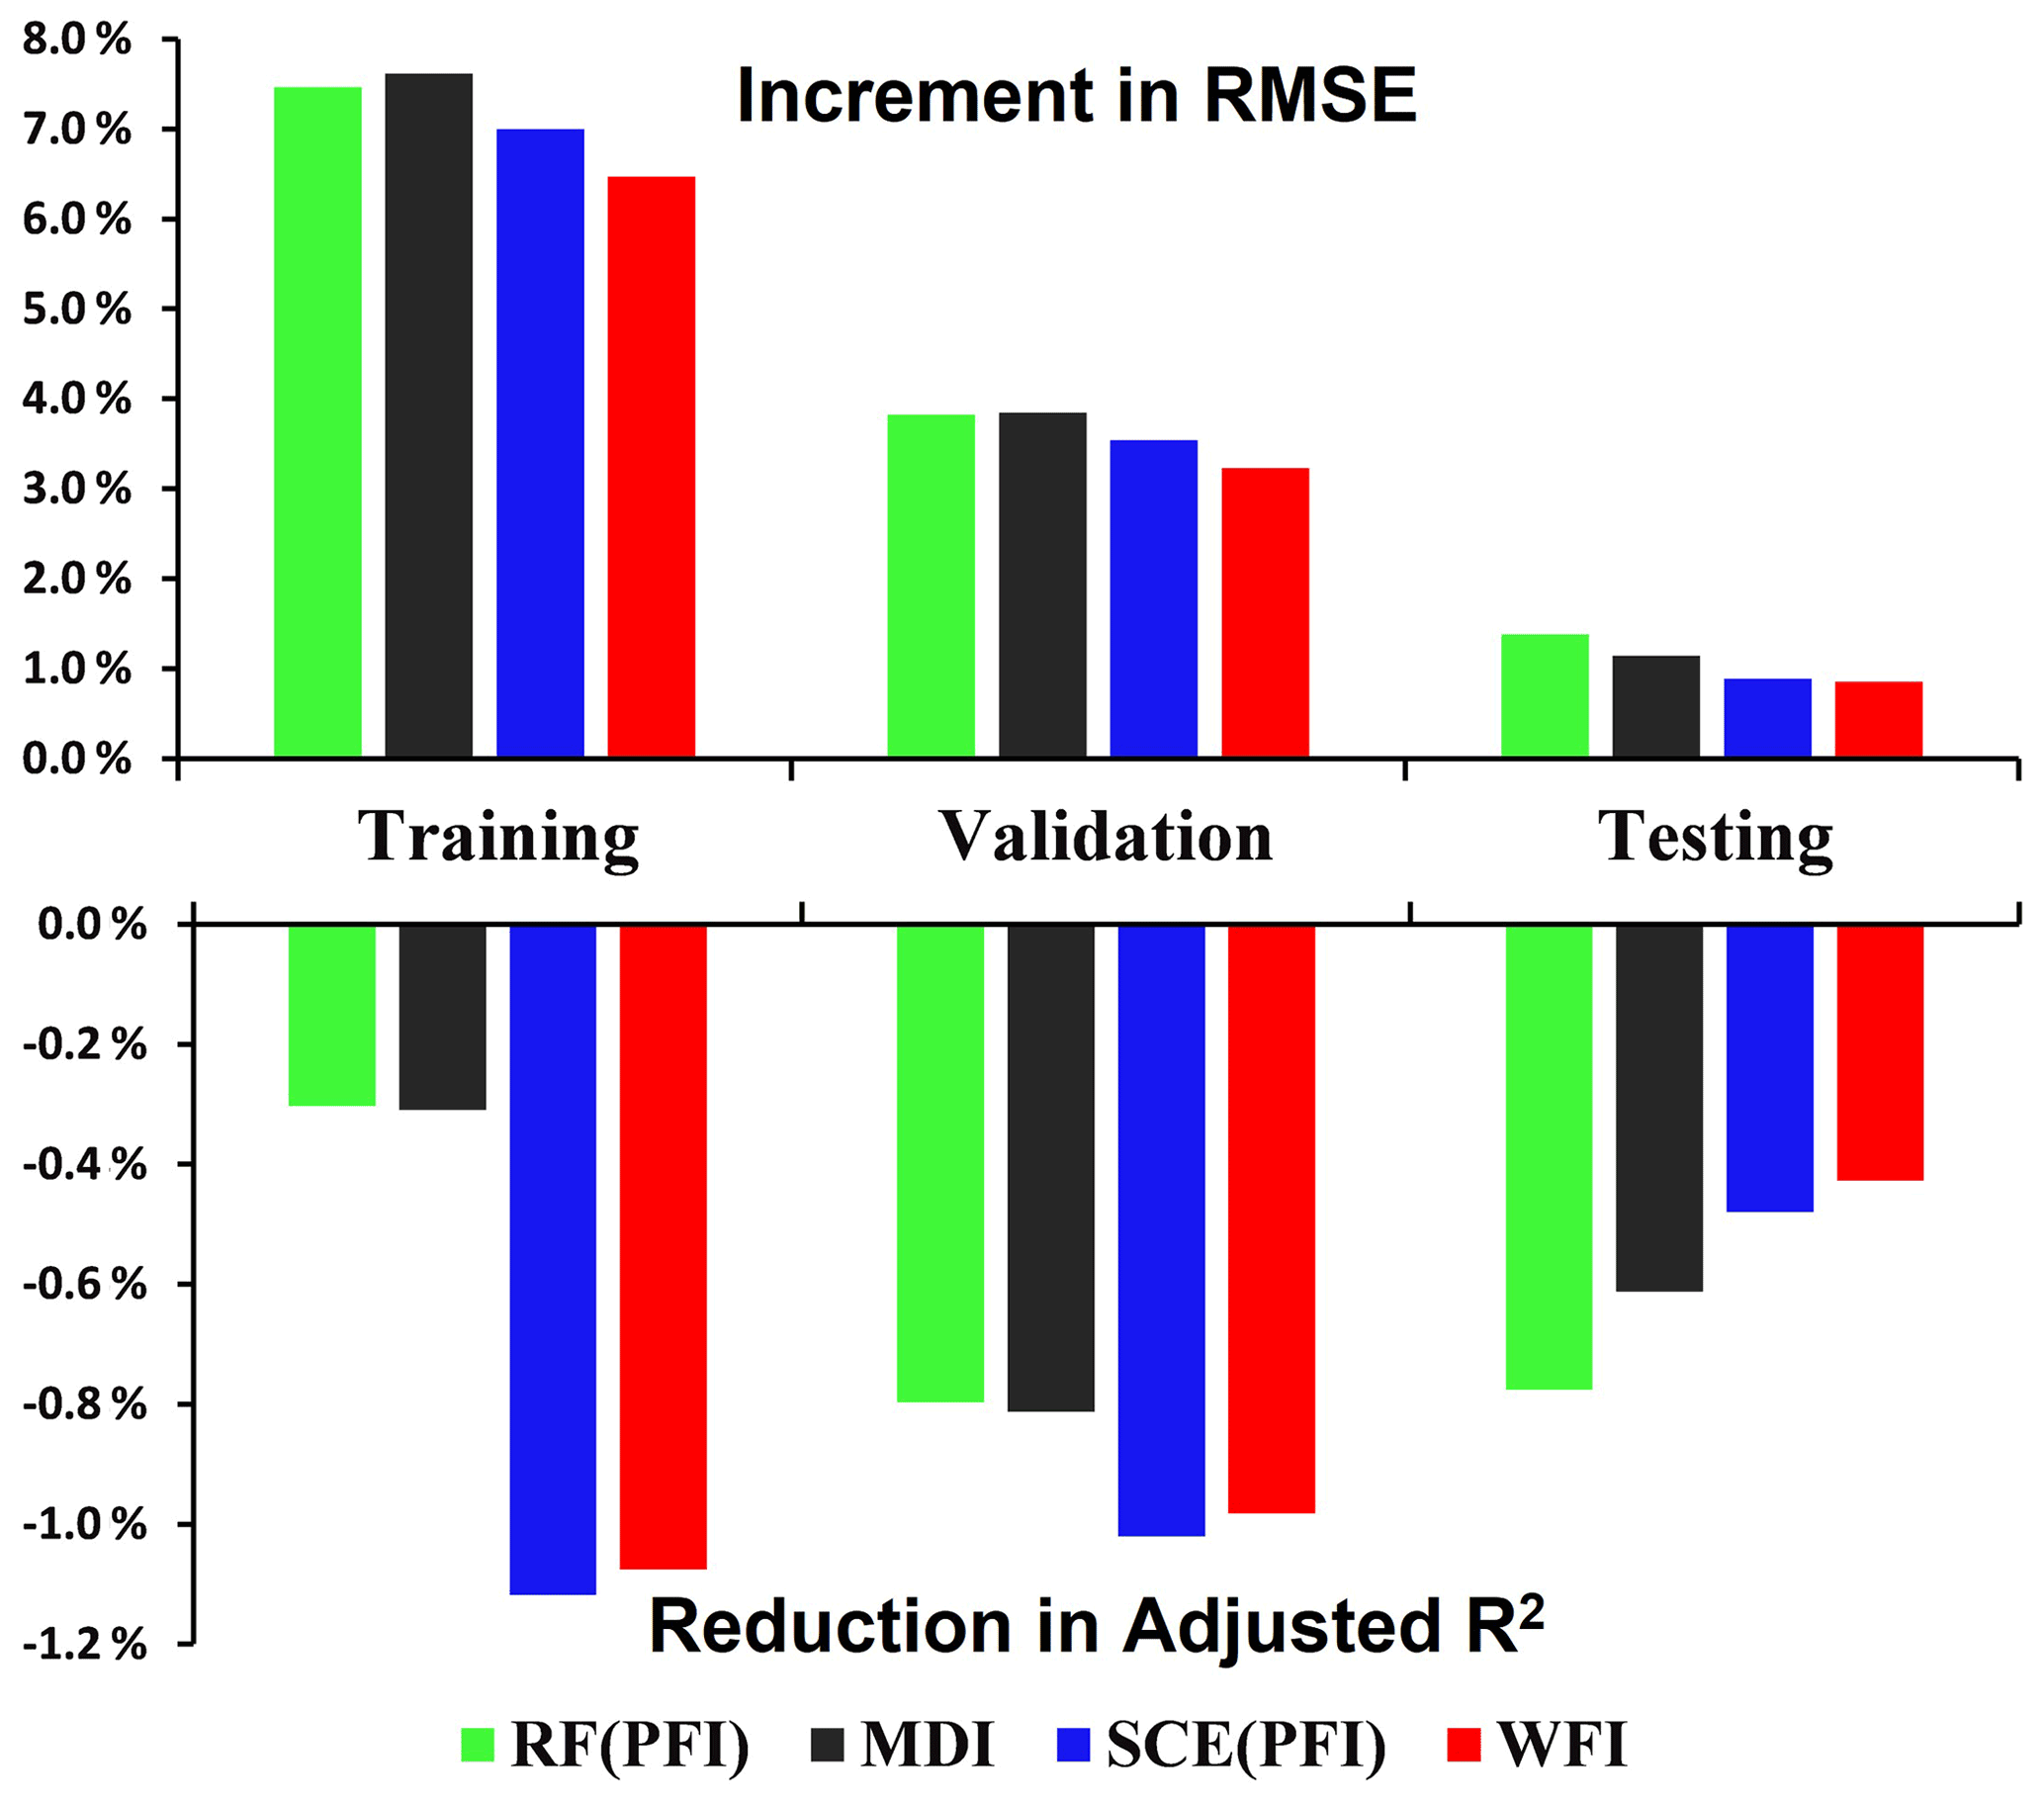
Figure 12Change in predictive accuracy averaged across three watersheds and two seasons. Note the change in predictive accuracy (e.g. RMSE) for a particular case is calculated using (RMSE (last iteration) − RMSE (full model)) RMSE (full model).

Figure 13Spearman's ρ values for the most important predictor. Note that the most important predictor is the predictor with the highest importance score in the last RFE iteration. The p value means how likely it is that the observed correlation is due to chance. Small p values indicate strong evidence for the observed correlations.
5.1 Study area and data
Daily streamflow simulations for three irrigated watersheds located in the alluvial plain of the Yellow River in China were conducted to test the capability of the proposed WFI method at a finer temporal resolution. These watersheds share a total area of 4905 km2, consisting of 52 % irrigated land, 17 % residential area, 15 % desert, 12 % forested land, and 4 % water surface (Fig. 10). The landscape of the study area is characterized by an extremely flat surface, with an average slope ranging from 1:4000 to 1:8000, with mostly highly permeable soil (sandy loam). The climatic condition of the study area is characterized by extreme arid environments, with annual precipitation ranging from 180 to 200 mm and annual potential evaporation ranging from 1100 to 1600 mm (Yang et al., 2015).
Initial catchment conditions were also considered in this case study to improve the model performance. Specifically, moving sums of daily precipitation, temperature, and evaporation time series over multiple time periods prior to the date of predictions were set as predictors to reflect the antecedent watershed conditions. Similarly, the moving window for daily irrigation time series was set as . In addition, daily groundwater level data are used as additional predictors to reflect the baseflow conditions of the catchments. The daily time-series data were divided into two subsets: one from 1 January 2001 to 31 December 2011 for model training and OOB validation and the other from 1 January 2012 to 31 December 2015 for model testing. Table 1 lists the weather, rain, and groundwater stations used for each basin. The streamflow processes show distinct behaviours in terms of flow magnitude and duration due to the different irrigation schedules in spring and winter. To analyse such temporal variations, daily streamflow for spring–summer (April to September) and autumn–winter (October to March) were examined separately. In this case study, the hyperparameters for RF and SCE are used the same as in Sect. 4.
Table 1Weather, rain, and groundwater gauges and irrigation canals used in each irrigation basin.
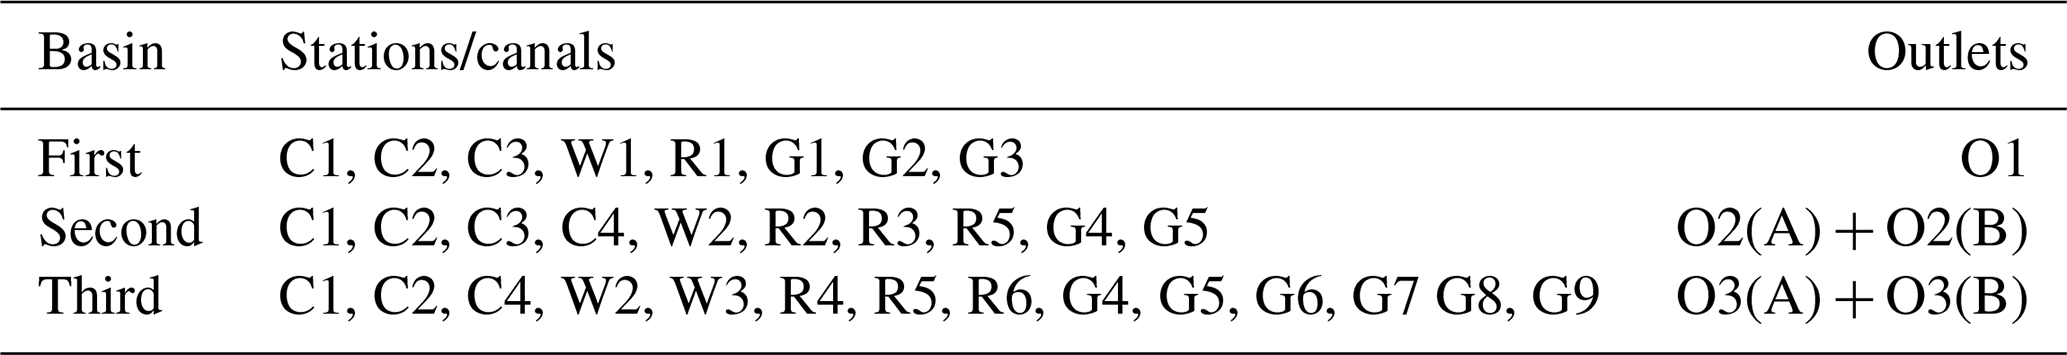
Note that streamflow for each watershed is integrated as the sum of the gauged streamflows within this area.
5.2 Result analysis
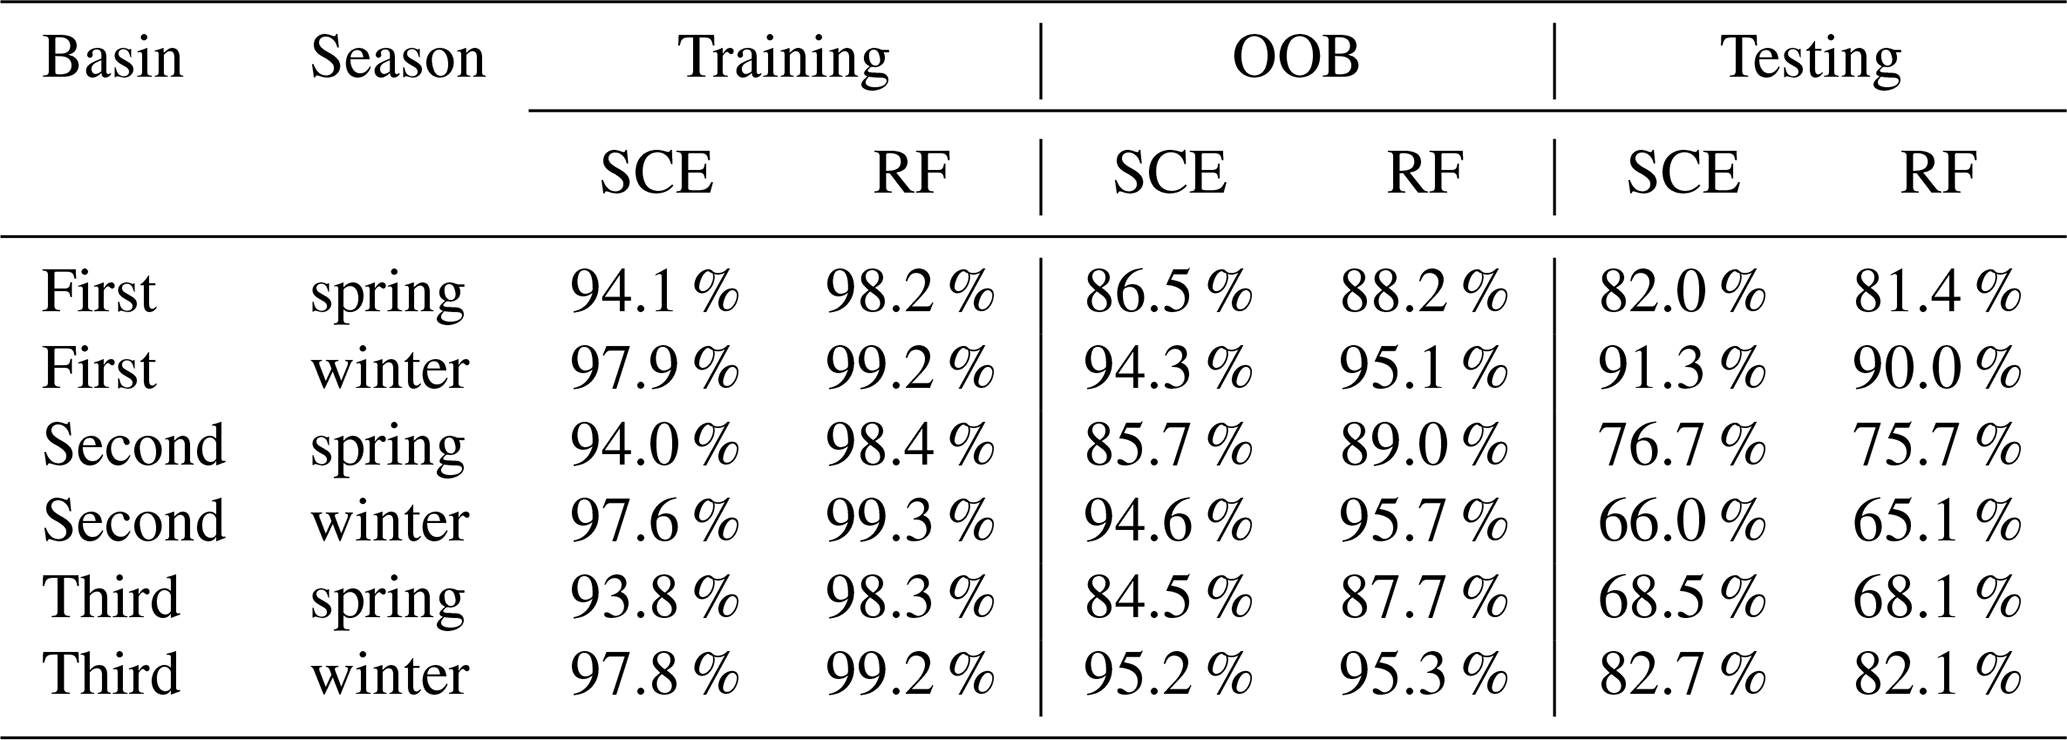
Generally, SCE and RF delivered reasonable predictive accuracy (using all considered predictors) across all watersheds and seasons (Table 2). The SCE approaches the best overall predictive accuracy for the testing dataset. Compared with RF, the SCE has a smaller drop in predictive accuracy from the training to testing period, indicating the SCE algorithm captured a more robust input–output relationship during the training period. This result agrees with those for the large-scale dataset in Sect. 4. The convergence tests for training, OOB validation, and testing datasets were shown in Figs. S1, S2, and 11, respectively. The results from the testing period (Fig. 11) show that SCE always outperforms RF as the number of trees increases.
Table 2The adjusted R2 for SCE and RF with all considered predictors.
The iterative reductions in accuracy for training, OOB validation, and test datasets are listed in Figs. S3, S4, and S5, respectively. The summary (Fig. 12) shows that WFI achieves the smallest reduction in accuracy (for both adjusted R2 and RMSE) over the testing period, followed by SCE-PFI, MDI, and RF-PFI. A smaller reduction in accuracy means the selected predictors are more informative in describing the complex relationships of hydrological processes. As a consequence, WFI can identify the most informative predictors compared with other methods. Figure 12 also shows that over the training period, RF receives a much smaller impact from RFE in terms of adjusted R2 compared with SCE because the least-square fittings employed in the CART training process pursue the highest R2 over the training period.
Figure 13 shows Spearman's ρ values for the most relevant predictor (i.e. with the highest importance score in the last RFE iteration). The result indicates that WFI has the highest absolute ρ values for the majority of the cases. This result agrees with the results demonstrated in Sect. 4. In fact, the highest absolute Spearman ρ values for the rest of the relevant predictors (selected for the last RFE iteration) mainly belong to the WFI method (as shown in Fig. 14), which further illustrates that WFI could provide stable relative importance values for essential predictors for hydrological inference.
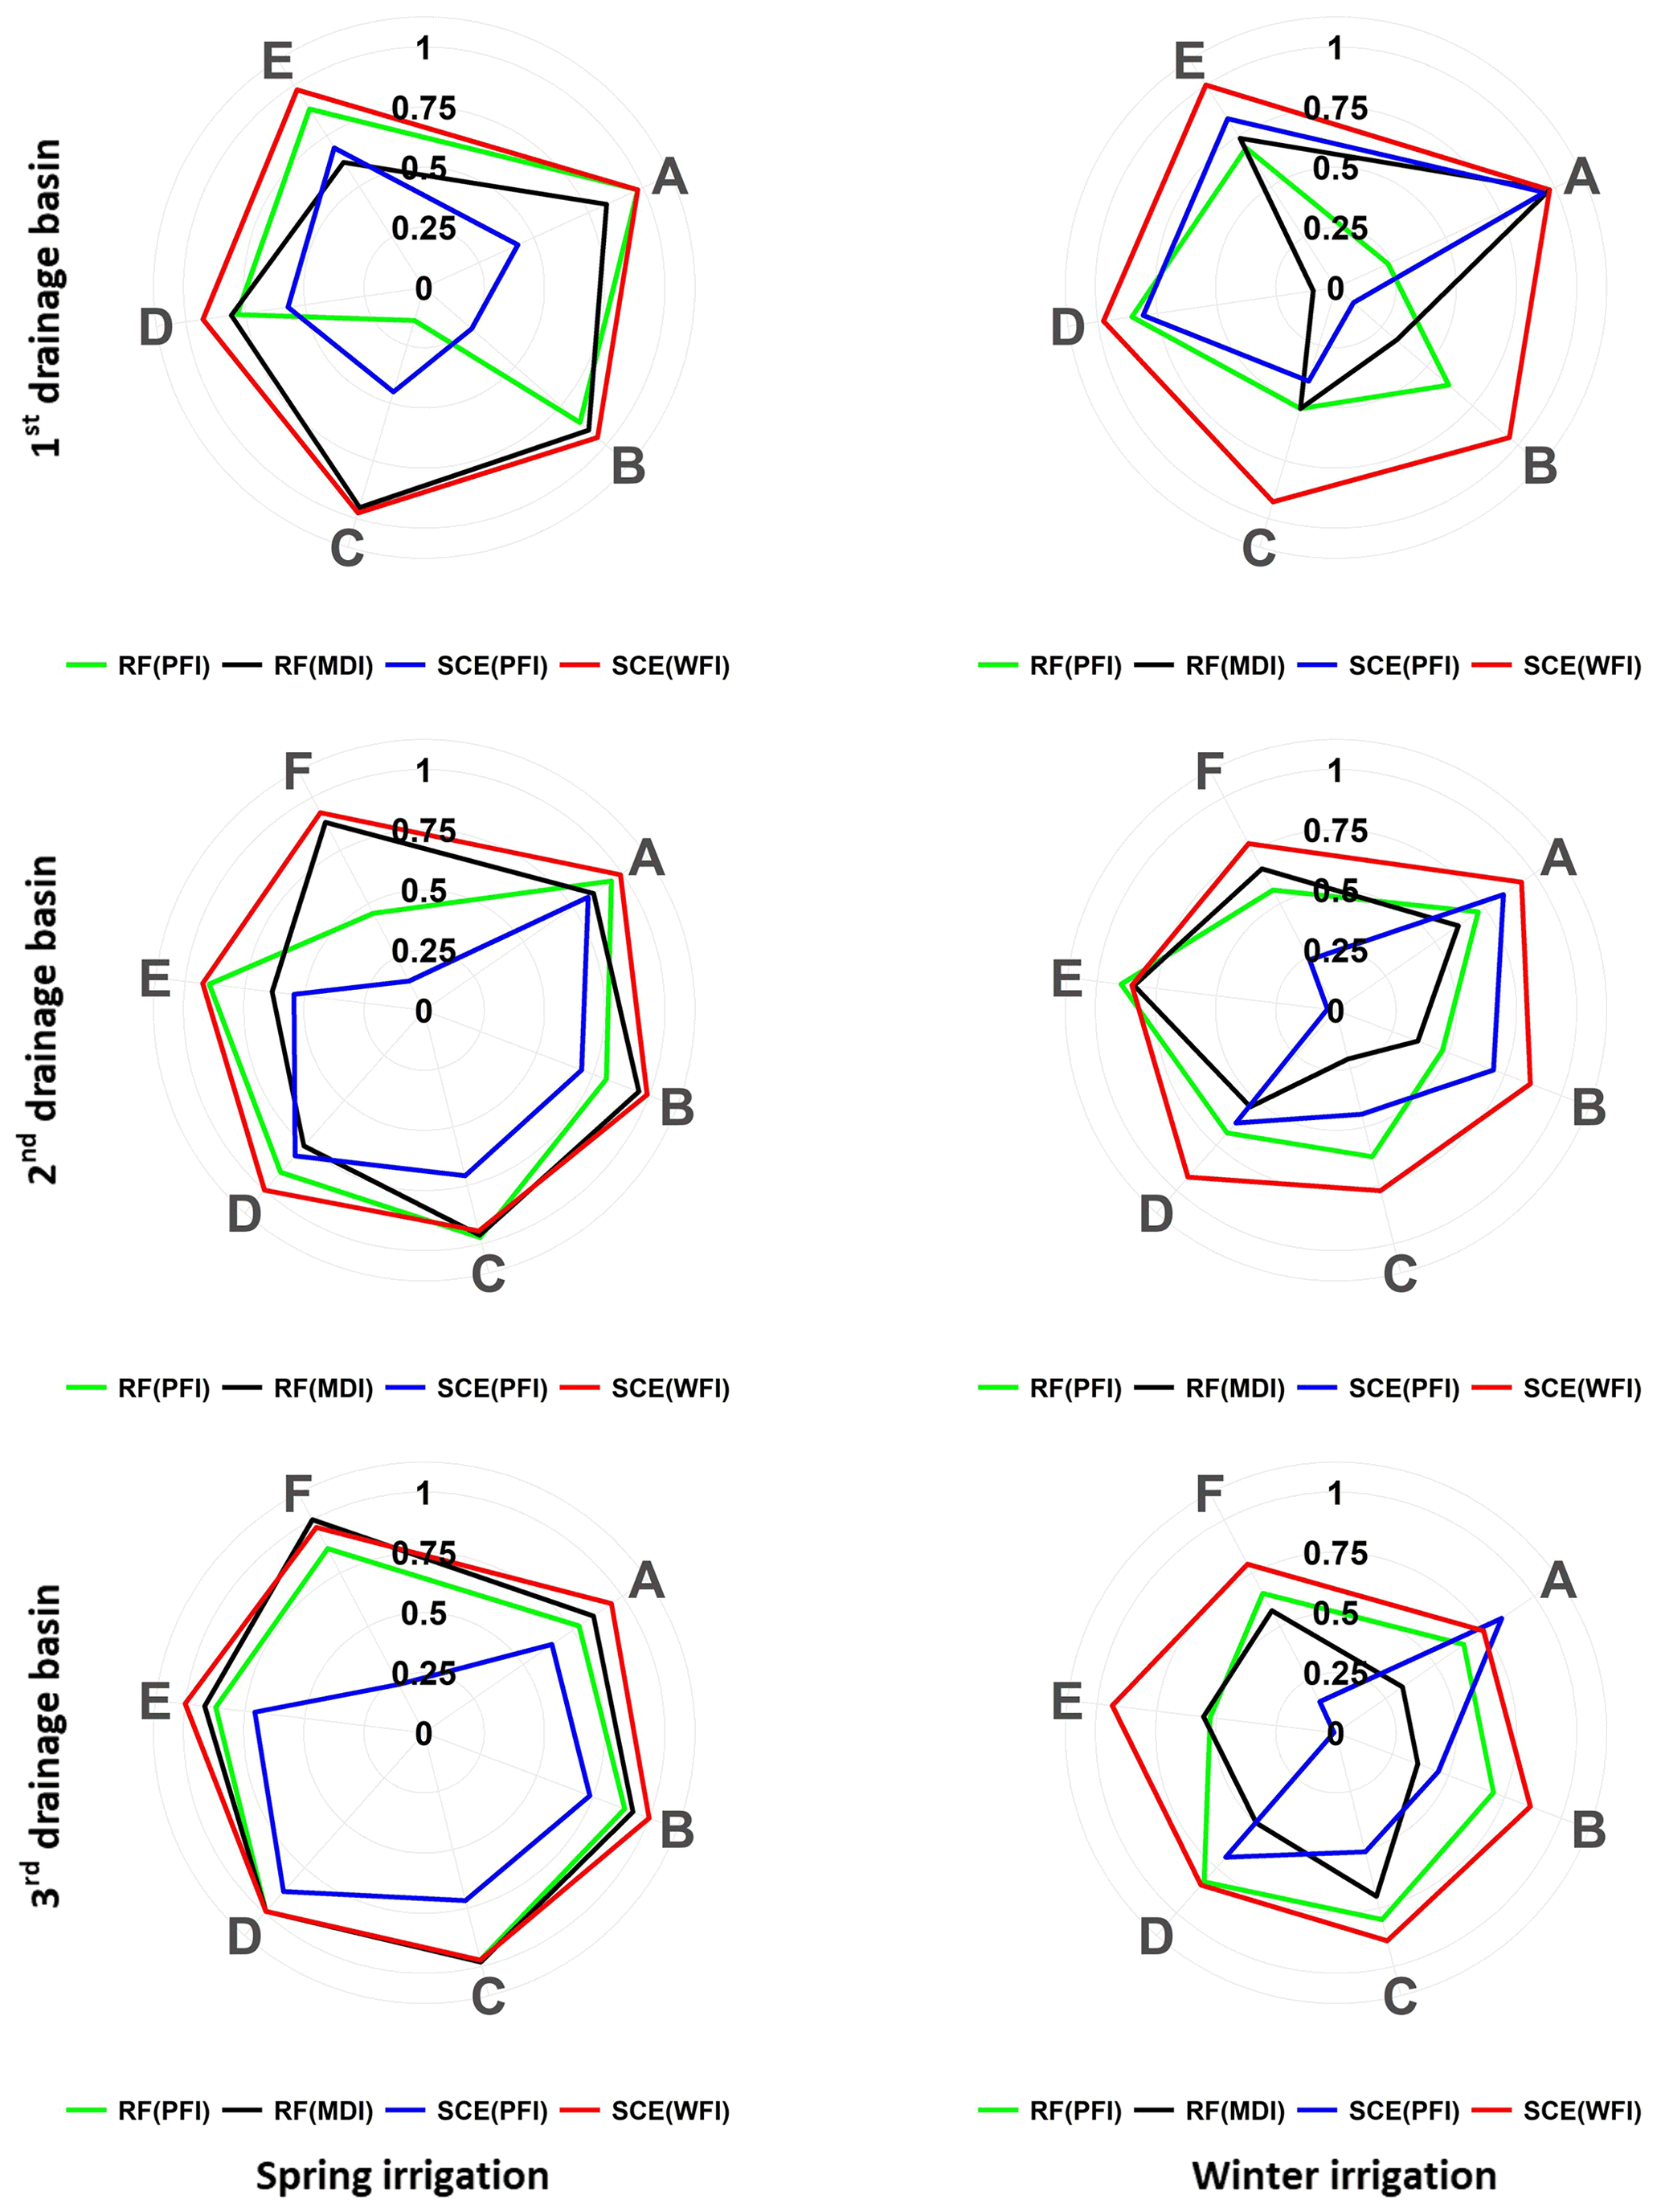
Figure 14Spearman's ρ values for three watersheds and seasons. Note that the RFE process of this case study keeps at least five and up to seven of the most relevant predictors in the last iteration, according to the remainder of the total considered predictors divided by 3. Capital letters from A to F represent the most relevant predictors identified by different feature importance methods.
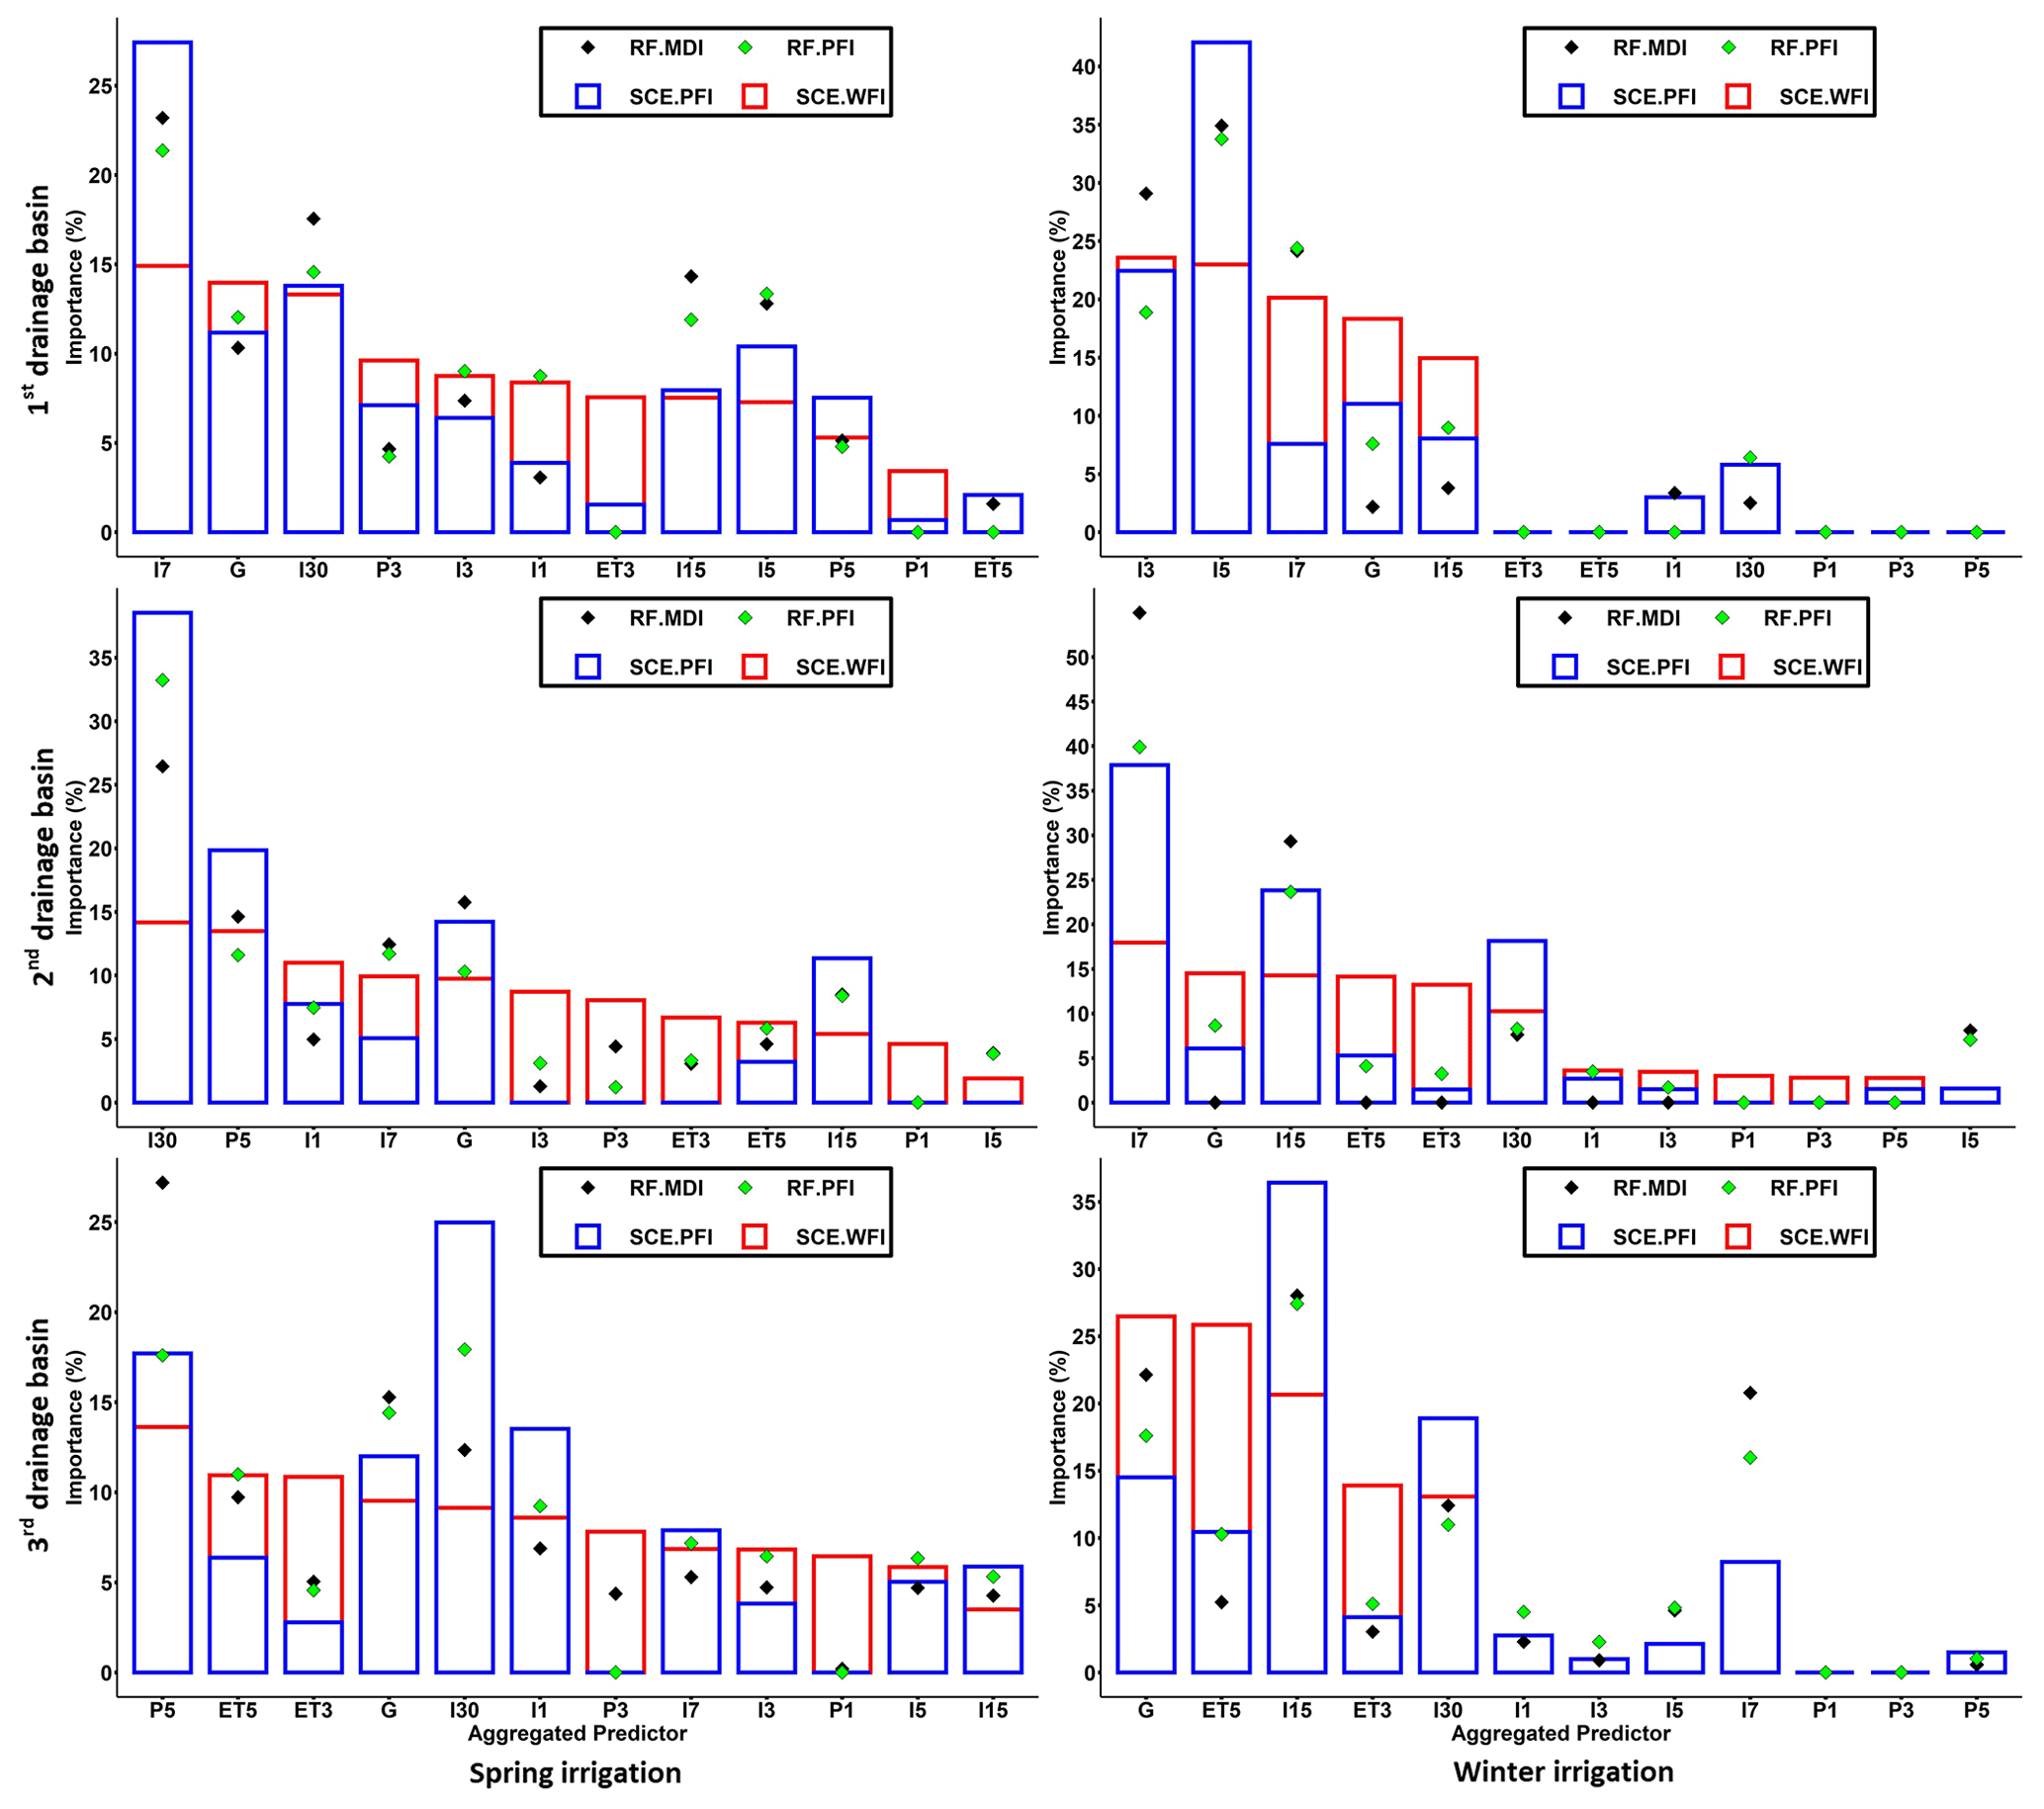
Figure 15Importance scores aggregated by predictor type. Note that each type of predictor includes predictors from all considered spatial locations. For example, P1 includes predictors for all the considered climatic stations with 1 d precipitation. Therefore, the importance score of P1 is the average of the importance score from the predictors of P1.
The importance scores were aggregated and analysed according to different types (i.e. precipitation, irrigation, evaporation, etc.) to explore the relationships between the hydrological responses and their driving forces. We chose the models with the smallest RMSE (among all the RFE iterations) on the testing dataset for the hydrological inference. The results indicate the importance scores differed significantly according to the algorithms and interpretation methods used (Fig. 15). In particular, the aggregated predictor P1 (i.e. daily precipitation for time step t from all spatial locations) achieves positive contributions (in reducing the RMSE) for WFI in the Spring irrigation. At the same time, it has merely no contribution for other feature importance methods. To investigate whether the predictors identified by WFI are also meaningful to other algorithms, we reinserted the predictors in P1 into the best RF model (in which the set of predictors reaches the smallest RMSE over the testing dataset). Indeed, we found the RF with reinserted predictors showing slightly improved predictive accuracy (i.e. RMSE and adjusted R2) for Spring irrigation across all watersheds on the testing dataset (Table 3). This result illustrates that even though the predictors in P1 have no contribution in improving the predictive accuracy on the training dataset, they can potentially distinguish different hydrological behaviour (i.e. with a small Wilks Λ value) and lead to improved model performance on the testing dataset. In fact, the time of concentration for these basins is usually less than 1 d if the storm falls near the outlets of the irrigation basins. This fact proves the above hydrological inference is reasonable.
Table 3Predictive accuracy for reinserting the predictors in P1 into the RF model (Spring irrigation).
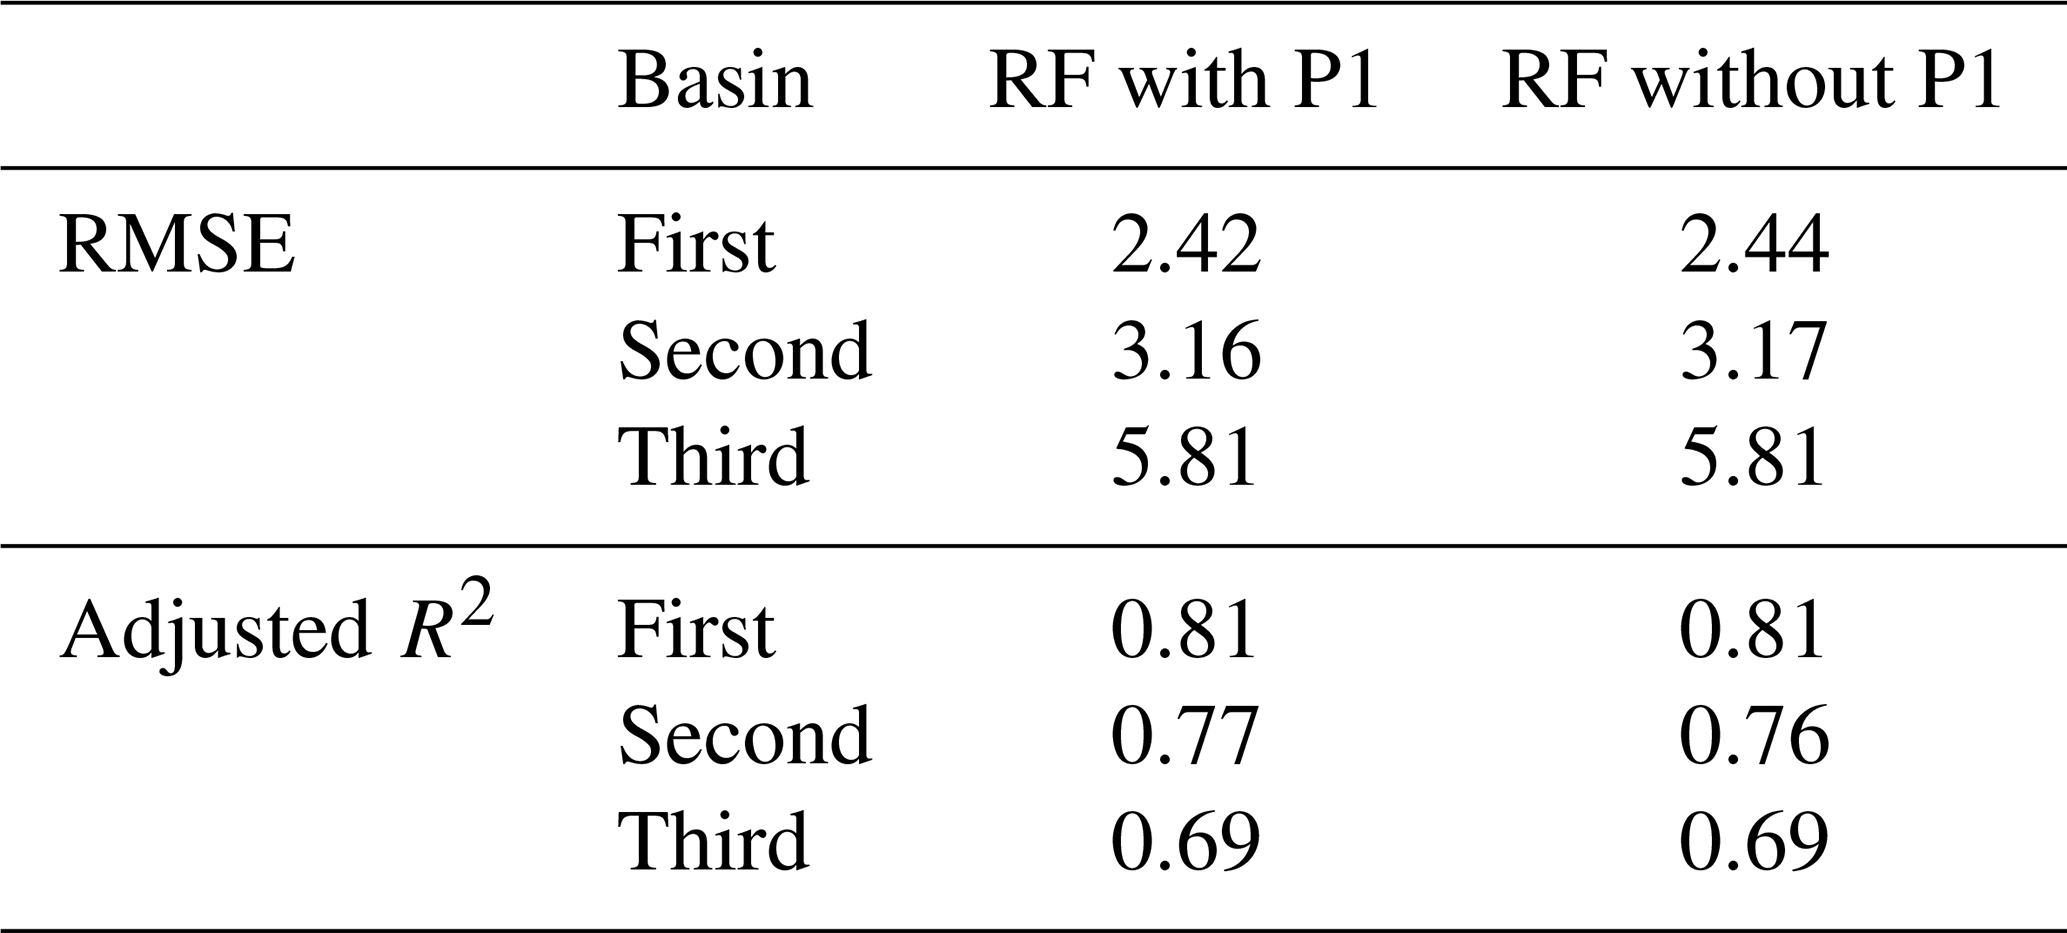
Note that the RF model was based on the optimum set of predictors in RFE iterations.
There could be several reasons why WFI can have more robust variable rankings than other feature importance measures. First, WFI does not rely on performance measures to evaluate the variable importance. Instead, it depends on Wilks Λ, which prevents any node splitting due to chance. In the node splitting process, a predictor that significantly increases the predictive accuracy may not necessarily have the ability to differentiate two potential subspaces. Therefore, the WFI method (which evaluates every splitting and merging action based on Wilks test statistics with the predefined significance level α) is expected to generate more robust variable rankings. Secondly, WFI considers all the interactions among predictors in the tree deduction process, while PFI can only consider the effect of one predictor at a time. Thus the interactions between the target predictor and the rest of the predictors are overlooked. For example, in Sect. 4, the SCE-PFI-selected predictors achieved higher performance (over the testing dataset) than the WFI-selected ones. However, these SCE-PFI-selected predictors are model-specific, which means when transferring these predictors to the other model (i.e. RF), they may not deliver the optimum performance. In contrast, the WFI-selected predictors have good transferability: they helped the RF model achieve optimum predictive accuracy. Similar evidence was also found by Schmidt et al. (2020), who reported that the variable rankings from PFI might vary significantly according to different algorithms. This fact has been considered a major challenge for hydrological inference because one cannot reach the same reasoning with different algorithms. Based on the results above, we can conclude that the WFI could produce more robust variable rankings, which enables a universal solution rather than a specific one for hydrological inference.
RFE was used to identify the most relevant predictors for optimum predictive accuracy. This approach could be quite useful in real-world practice, especially in hydrology, where the simulation problem may involve hundreds of inputs (from climate models, observations, or remote sensing, etc.), describing the spatial and temporal variabilities of the system. Each of these inputs may contain useful information and may also contain noise that will mislead the model (e.g. increase the simulation errors). Therefore, it is critical to eliminate those variables that cannot improve the predictive accuracy. WFI, in combination with the RFE process, can thus be used for facilitating hydrological inference and modelling.
WFI was developed to improve the robustness of variable rankings for tree-structured statistical models. Our results indicate that the proposed WFI can provide more robust variable rankings than well-known PFI and MDI methods. In addition, we found that the predictors selected by WFI can replace those selected by RF with its default methods to improve modelling predictive accuracy.
The achievements of the proposed WFI approach are twofold: firstly, robust variable rankings are provided for a sound hydrological inference. Specifically, some critical predictors that may be overlooked by conventional feature importance methods (PFI and MDI) can be captured through WFI. Secondly, the enhanced variable rankings combined with the RFE process can help identify the most important predictors for optimum model predictive accuracy.
The proposed WFI could be a step closer for earth system scientists to get a preliminary understanding of the hydrological process through ML. Future studies may focus on the development of tree-structured hydrological models that may not only be viewed as black-box heuristics, but also can be used for rigorous hydrological inference. Even though the focus of this paper is hydrological inference, WFI can also be applied to a variety of other important applications. Moreover, current applications of importance scores are still limited. As interpretable ML continues to mature, its potential benefits for hydrological inference could be promising.
The climatic data are available on the data repository of the China Meteorological Data Service Centre (http://data.cma.cn/en/?r=data/detail&dataCode=A.0012.0001, China Meteorological Data Service Center, 2021). The hydrological data and code for the numeric case can be accessed from the Zenodo repository (https://doi.org/10.5281/zenodo.4387068, Li, 2020). The entire model code for this study can be obtained upon request to the corresponding author via email.
The supplement related to this article is available online at: https://doi.org/10.5194/hess-25-4947-2021-supplement.
KL designed the research under the supervision of GH. KL carried out the research, developed the model code, and performed the simulations. KL prepared the manuscript with contributions from GH and BB.
The authors declare that they have no conflict of interest.
Publisher’s note: Copernicus Publications remains neutral with regard to jurisdictional claims in published maps and institutional affiliations.
We appreciate Ningxia Water Conservancy for providing the streamflow, groundwater, and irrigation data, as well as related help. We are also very grateful for the helpful inputs from the editor and anonymous reviewers.
This research was supported by the National Key Research and Development Plan (grant no. 2016YFA0601502), Canada Research Chair Program, Natural Science and Engineering Research Council of Canada, Western Economic Diversification (grant no. 15269), and MITACS.
This paper was edited by Stacey Archfield and reviewed by two anonymous referees.
Addor, N., Newman, A. J., Mizukami, N., and Clark, M. P.: The CAMELS data set: catchment attributes and meteorology for large-sample studies, Hydrol. Earth Syst. Sci., 21, 5293–5313, https://doi.org/10.5194/hess-21-5293-2017, 2017.
Ahn, K.-H.: A neural network ensemble approach with jittered basin characteristics for regionalized low flow frequency analysis, J. Hydrol., 590, 125501, https://doi.org/10.1016/j.jhydrol.2020.125501, 2020.
Apley, D. W. and Zhu, J.: Visualizing the effects of predictor variables in black box supervised learning models, J. Roy. Stat. Soc. B Met., 82, 1059–1086, https://doi.org/10.1111/rssb.12377, 2020.
Athey, S., Tibshirani, J., and Wager, S.: Generalized random forests, Ann. Stat., 47, 1148–1178, https://doi.org/10.1214/18-AOS1709, 2019.
Barandiaran, I.: The random subspace method for constructing decision forests, IEEE Trans. Pattern Anal. Mach. Intell, 20, 1–22, https://doi.org/10.1109/34.709601, 1998.
Bénard, C., Biau, G., Veiga, S., and Scornet, E.: Interpretable random forests via rule extraction, International Conference on Artificial Intelligence and Statistics, 937–945, available at: http://proceedings.mlr.press/v130/benard21a.html, last access: 1 July 2021.
Beven, K. J.: Rainfall-runoff modelling: the primer, John Wiley & Sons, Hoboken, New Jersey, United States, 2011.
Breiman, L.: Statistical modeling: The two cultures (with comments and a rejoinder by the author), Stat. Sci., 16, 199–231, https://doi.org/10.1214/ss/1009213726, 2001a.
Breiman, L.: Random forests, Machine learning, 45, 5–32, https://doi.org/10.1023/A:1010933404324, 2001b.
Breiman, L., Friedman, J., Stone, C. J., and Olshen, R. A.: Classification and regression trees, CRC press, Boca Raton, Florida, United States, 1984.
China Meteorological Data Service Center: Hourly data from surface meteorological stations in China, [data set], available at: http://data.cma.cn/en/?r=data/detail&dataCode=A.0012.0001 (last access: 1 December 2020), 2021.
Craven, M. and Shavlik, J. W.: Extracting tree-structured representations of trained networks, Adv. Neur. In., 24–30, available at: https://dl.acm.org/doi/10.5555/2998828.2998832 (last access: 1 July 2021), 1996.
Du, Q., Biau, G., Petit, F., and Porcher, R.: Wasserstein Random Forests and Applications in Heterogeneous Treatment Effects, International Conference on Artificial Intelligence and Statistics, 1729–1737, available at: http://proceedings.mlr.press/v130/du21a.html, last access: 1 July 2021.
Epifanio, I.: Intervention in prediction measure: a new approach to assessing variable importance for random forests, BMC bioinformatics, 18, 1–16, https://doi.org/10.1186/s12859-017-1650-8, 2017.
Fernández-Delgado, M., Cernadas, E., Barro, S., and Amorim, D.: Do we need hundreds of classifiers to solve real world classification problems?, J. Mach. Learn. Res., 15, 3133–3181, 2014.
Friedberg, R., Tibshirani, J., Athey, S., and Wager, S.: Local linear forests, J. Comput. Graph. Stat., 30, 1–15, https://doi.org/10.1080/10618600.2020.1831930, 2020.
Friedman, J. H.: Greedy function approximation: a gradient boosting machine, Ann. Stat., 29, 1189–1232, https://doi.org/10.1214/aos/1013203451, 2001.
Galelli, S. and Castelletti, A.: Assessing the predictive capability of randomized tree-based ensembles in streamflow modelling, Hydrol. Earth Syst. Sci., 17, 2669–2684, https://doi.org/10.5194/hess-17-2669-2013, 2013.
Goldstein, A., Kapelner, A., Bleich, J., and Pitkin, E.: Peeking inside the black box: Visualizing statistical learning with plots of individual conditional expectation, J. Comput. Graph. Stat., 24, 44–65, https://doi.org/10.1080/10618600.2014.907095, 2015.
Gregorutti, B., Michel, B., and Saint-Pierre, P.: Correlation and variable importance in random forests, Stat. Comput., 27, 659–678, https://doi.org/10.1007/s11222-016-9646-1, 2017.
Guyon, I., Weston, J., Barnhill, S., and Vapnik, V.: Gene selection for cancer classification using support vector machines, Machine learning, 46, 389–422, https://doi.org/10.1023/A:1012487302797, 2002.
Hothorn, T., Hornik, K., and Zeileis, A.: Unbiased recursive partitioning: A conditional inference framework, J. Comput. Graph. Stat., 15, 651–674, https://doi.org/10.1198/106186006X133933, 2006.
Huang, G.: A stepwise cluster analysis method for predicting air quality in an urban environment, Atmos. Environ. B-Urb., 26, 349–357, https://doi.org/10.1016/0957-1272(92)90010-P, 1992.
Ishwaran, H., Kogalur, U. B., Blackstone, E. H., and Lauer, M. S.: Random survival forests, Ann. Appl. Stat., 2, 841–860, https://doi.org/10.1214/08-AOAS169, 2008.
Katuwal, R., Suganthan, P. N., and Zhang, L.: Heterogeneous oblique random forest, Comm. Com. Inf. Sc., 99, 107078, https://doi.org/10.1016/j.patcog.2019.107078, 2020.
Kendall, M. G.: Rank Correlation Methods, 4th edn., Charles Griffin and Company, London, 1948.
Kisi, O., Choubin, B., Deo, R. C., and Yaseen, Z. M.: Incorporating synoptic-scale climate signals for streamflow modelling over the Mediterranean region using machine learning models, Hydrolog. Sci. J., 64, 1240–1252, https://doi.org/10.1080/02626667.2019.1632460, 2019.
Konapala, G. and Mishra, A.: Quantifying climate and catchment control on hydrological drought in the continental United States, Water Resour. Res., 56, e2018WR024620, https://doi.org/10.1029/2018WR024620, 2020.
Kratzert, F., Klotz, D., Herrnegger, M., Sampson, A. K., Hochreiter, S., and Nearing, G. S.: Toward improved predictions in ungauged basins: Exploiting the power of machine learning, Water Res. Res., 55, 11344–11354, https://doi.org/10.1029/2019WR026065, 2019a.
Kratzert, F., Klotz, D., Shalev, G., Klambauer, G., Hochreiter, S., and Nearing, G.: Towards learning universal, regional, and local hydrological behaviors via machine learning applied to large-sample datasets, Hydrol. Earth Syst. Sci., 23, 5089–5110, https://doi.org/10.5194/hess-23-5089-2019, 2019b.
Lawson, E., Smith, D., Sofge, D., Elmore, P., and Petry, F.: Decision forests for machine learning classification of large, noisy seafloor feature sets, Comput. Geosci., 99, 116–124, https://doi.org/10.1016/j.cageo.2016.10.013, 2017.
Leathers, D. J., Yarnal, B., and Palecki, M. A.: The Pacific/North American teleconnection pattern and United States climate. Part I: Regional temperature and precipitation associations, J. Climate, 4, 517–528, https://doi.org/10.1175/1520-0442(1991)004<0517:TPATPA>2.0.CO;2, 1991.
Li, K.: Data for “Gaining Hydrological Insights Through Wilk's Feature Importance: A Test-Statistic Interpretation method for Reliable and Robust Inference”, Zenodo [data set], https://doi.org/10.5281/zenodo.4387068, 2020.
Liaw, A. and Wiener, M.: Classification and regression by randomForest, R news, 2, 18–22, available at: https://cran.r-project.org/doc/Rnews/Rnews_2002-3.pdf (last access: 1 July 2021), 2002.
Lundberg, S. M. and Lee, S.-I.: A unified approach to interpreting model predictions, Adv. Neur. In., 4765–4774, available at: https://dl.acm.org/doi/10.5555/3295222.3295230 (last access: 1 July 2021), 2017.
Mann, H. B.: Nonparametric tests against trend, Econometrica, 13, 245–259, https://doi.org/10.2307/1907187, 1945.
Mantua, N. J., Hare, S. R., Zhang, Y., Wallace, J. M., and Francis, R. C.: A Pacific interdecadal climate oscillation with impacts on salmon production, B. Am. Meteorol. Soc., 78, 1069–1080, https://doi.org/10.1175/1520-0477(1997)078<1069:APICOW>2.0.CO;2, 1997.
Miller, T.: Explanation in artificial intelligence: Insights from the social sciences, Artificial intelligence, 267, 1–38, https://doi.org/10.1016/j.artint.2018.07.007, 2019.
Molnar, C.: Interpretable Machine Learning, Lulu Press, Morrisville, North Carolina, United States, 2020.
Morris, M. D.: Factorial sampling plans for preliminary computational experiments, Technometrics, 33, 161–174, https://doi.org/10.2307/1269043, 1991.
Murdoch, W. J., Singh, C., Kumbier, K., Abbasi-Asl, R., and Yu, B.: Definitions, methods, and applications in interpretable machine learning, P. Natl. Acad. Sci. USA, 116, 22071–22080, https://doi.org/10.1073/pnas.1900654116, 2019.
Nath, R. and Pavur, R.: A new statistic in the one-way multivariate analysis of variance, Comput. Stat. Data An., 2, 297–315, https://doi.org/10.1016/0167-9473(85)90003-9, 1985.
Newman, A. J., Clark, M. P., Sampson, K., Wood, A., Hay, L. E., Bock, A., Viger, R. J., Blodgett, D., Brekke, L., Arnold, J. R., Hopson, T., and Duan, Q.: Development of a large-sample watershed-scale hydrometeorological data set for the contiguous USA: data set characteristics and assessment of regional variability in hydrologic model performance, Hydrol. Earth Syst. Sci., 19, 209–223, https://doi.org/10.5194/hess-19-209-2015, 2015.
Reichstein, M., Camps-Valls, G., Stevens, B., Jung, M., Denzler, J., and Carvalhais, N.: Deep learning and process understanding for data-driven Earth system science, Nature, 566, 195–204, https://doi.org/10.1038/s41586-019-0912-1, 2019.
Ribeiro, M. T., Singh, S., and Guestrin, C.: “Why should I trust you?” Explaining the predictions of any classifier, Proceedings of the 22nd ACM SIGKDD international conference on knowledge discovery and data mining, 1135–1144, https://doi.org/10.1145/2939672.2939778, 2016a.
Ribeiro, M. T., Singh, S., and Guestrin, C.: Model-agnostic interpretability of machine learning, arXiv [preprint], arXiv:1606.05386, 2016b.
Schmidt, L., Heße, F., Attinger, S., and Kumar, R.: Challenges in applying machine learning models for hydrological inference: A case study for flooding events across Germany, Water Resour. Res., 56, e2019WR025924, https://doi.org/10.1029/2019WR025924, 2020.
Scornet, E.: Trees, forests, and impurity-based variable importance, arXiv [preprint], arXiv:2001.04295, 2020.
Shapley, L. S.: A value for n-person games, Contributions to the Theory of Games, 2, 307–317, https://doi.org/10.7249/P0295, 1953.
Shortridge, J. E., Guikema, S. D., and Zaitchik, B. F.: Machine learning methods for empirical streamflow simulation: a comparison of model accuracy, interpretability, and uncertainty in seasonal watersheds, Hydrol. Earth Syst. Sci., 20, 2611–2628, https://doi.org/10.5194/hess-20-2611-2016, 2016.
Strobl, C., Boulesteix, A.-L., Zeileis, A., and Hothorn, T.: Bias in random forest variable importance measures: Illustrations, sources and a solution, BMC bioinformatics, 8, 25, https://doi.org/10.1186/1471-2105-8-25, 2007.
Strobl, C., Boulesteix, A.-L., Kneib, T., Augustin, T., and Zeileis, A.: Conditional variable importance for random forests, BMC bioinformatics, 9, 1–11, https://doi.org/10.1186/1471-2105-9-307, 2008.
Trenberth, K. E.: The definition of el nino, B. Am. Meteorol. Sco., 78, 2771–2778, https://doi.org/10.1175/1520-0477(1997)078<2771:TDOENO>2.0.CO;2, 1997.
Wager, S. and Athey, S.: Estimation and inference of heterogeneous treatment effects using random forests, J. Am. Stat. Assoc., 113, 1228–1242, https://doi.org/10.1080/01621459.2017.1319839, 2018.
Wilks, S. S.: Collected papers; contributions to mathematical statistics, Wiley, Hoboken, New Jersey, United States, https://doi.org/10.1017/S0008439500029787, 1967.
Worland, S. C.: Data-driven methods for hydrologic inference and discovery, Vanderbilt University, available at: http://hdl.handle.net/1803/11791 (last access: 1 July 2021), 2018.
Worland, S. C., Steinschneider, S., Asquith, W., Knight, R., and Wieczorek, M.: Prediction and Inference of Flow Duration Curves Using Multioutput Neural Networks, Water Resour. Res., 55, 6850–6868, https://doi.org/10.1029/2018WR024463, 2019.
Xia, R.: Comparison of Random Forests and Cforest: Variable Importance Measures and Prediction Accuracies, All Graduate Plan B and other Reports, 1255, available at: https://digitalcommons.usu.edu/gradreports/1255 (last access: 1 July 2021), 2009.
Yang, J., Tan, C., Wang, S., Wang, S., Yang, Y., and Chen, H.: Drought adaptation in the Ningxia Hui Autonomous Region, China: Actions, planning, pathways and barriers, Sustainability, 7, 15029–15056, https://doi.org/10.3390/su71115029, 2015.
Yang, Y. and Chui, T. F. M.: Modeling and interpreting hydrological responses of sustainable urban drainage systems with explainable machine learning methods, Hydrol. Earth Syst. Sci. Discuss. [preprint], https://doi.org/10.5194/hess-2020-460, in review, 2020.
Yang, Z.: DCT-Based Least-Squares Predictive Model for Hourly AQI Fluctuation Forecasting, J. Environ. Inform., 36, 58–69, https://doi.org/10.3808/jei.201800402, 2020.
Yu, B.: Stability, Bernoulli, 19, 1484–1500, https://doi.org/10.3150/13-BEJSP14, 2013.
Zhang, Y., Chiew, F. H., Li, M., and Post, D.: Predicting Runoff Signatures Using Regression and Hydrological Modeling Approaches, Water Resour. Res., 54, 7859–7878, https://doi.org/10.1029/2018WR023325, 2018.
- Abstract
- Introduction
- Related works
- Wilks feature importance
- Comparative studies over the NCAR CAMELS dataset
- Application of WFI over irrigated watersheds in the Yellow River basin, China
- Discussion
- Conclusions
- Code and data availability
- Author contributions
- Competing interests
- Disclaimer
- Acknowledgements
- Financial support
- Review statement
- References
- Supplement