the Creative Commons Attribution 4.0 License.
the Creative Commons Attribution 4.0 License.
 | 29 Jan 2021
Validation of SMAP L2 passive-only soil moisture products using upscaled in situ measurements collected in Twente, the Netherlands
Rogier van der Velde
Andreas Colliander
Michiel Pezij
Harm-Jan F. Benninga
Rajat Bindlish
Steven K. Chan
Thomas J. Jackson
Dimmie M. D. Hendriks
Denie C. M. Augustijn
Zhongbo Su
The Twente region in the east of the Netherlands has a network with 20 soil monitoring stations that has been utilized for validation of the Soil Moisture Active/Passive (SMAP) passive-only soil moisture products. Over the period from April 2015 until December 2018, seven stations covered by the SMAP reference pixels have fairly complete data records. Spatially distributed soil moisture simulations with the Dutch National Hydrological Model have been utilized for the development of upscaling functions to translate the spatial mean of point measurements to the domain of the SMAP reference pixels. The native and upscaled spatial soil moisture means computed using the in situ measurements have been adopted as references to assess the performance of the SMAP (i) Single Channel Algorithm at Horizontal Polarization (SCA-H), (ii) Single Channel Algorithm at Vertical Polarization (SCA-V), and (iii) Dual Channel Algorithm (DCA) soil moisture estimates. In the case of the Twente network it was found that the SCA-V SMAP soil moisture observations collected in the afternoon had the best agreement with the native spatial mean, leading to an unbiased root mean squared error (uRMSE) of 0.059 m3 m−3, whereas for the upscaled in situ references primarily larger biases were found. These error levels are larger than the mission's target accuracy of 0.04 m3 m−3, which can be attributed to large over- and under-estimation errors (>0.08 m3 m−3), in particular at the end of dry spells and during freezing, respectively. The strong vertical dielectric gradients associated with rapid soil freezing and wetting cause the disparity in soil depth characterized by SMAP and in situ that leads to the large mismatches. Once filtered for frozen conditions and antecedent rainfall, the uRMSE improves to 0.043 m3 m−3.
- Article
(14671 KB) - Full-text XML
-
Supplement
(10439 KB) - BibTeX
- EndNote


Science and professional communities rate the success of satellite missions, at least in part, by error metrics calculated between their data products and a reference. ESA's Soil Moisture and Ocean Salinity (SMOS, Kerr et al., 2001) and NASA's Soil Moisture Active/Passive (SMAP, Entekhabi et al., 2010) missions apply a target accuracy of 0.04 m3 m−3 to the retrieval of soil moisture from L-band brightness temperature in the top 5 cm of soil. Comprehensive calibration and validation programmes (e.g. Jackson et al., 2013; Delwart et al., 2010) are, therefore, imperative to establishing a reference to which the retrieved soil moisture can be compared in an objective manner. This is complicated by the disparity in spatial support provided by satellite observations and the techniques available to measure soil moisture in situ (Western and Blöschl, 1999; Cosh et al., 2015). Indeed, the area covered by measurements taken with most ground sampling techniques is a mere fraction of the area covered by satellite footprints (Jackson et al., 2012). Also, differences between soil depths that can be sampled reliably in situ and observed with microwave radiometry contribute to this spatial-scale mismatch (e.g. Escorihuela et al., 2010; Zheng et al., 2019).
A strategy that can be adopted for validation of satellite-based soil moisture estimates is accepting the spatial-scale mismatch and focusing efforts on quantifying spatial sampling errors by introducing a third independent data set of the same quantity (e.g. Stoffelen, 1998; Miralles et al., 2010), referred to as triple collocation (TC). Recently, Chen et al. (2017) applied its classic and extended TC versions to validate SMAP L2 data products using data from sparse in situ monitoring networks and acknowledged its merits in correlation-based assessments, but they found that TC is likely not to be able to correct RMSEs (root mean squared errors) for spatial sampling errors due to large biases between point and satellite-based estimates. This supports the choice for using sites with multiple measurement locations inside satellite footprints as the primary basis for assessing the performance of the SMAP L2 data products (Chan et al., 2016; Colliander et al., 2017).
However, even with a network with a multitude of soil moisture monitoring stations, the question remains how to translate the collection of spatially distributed point measurements to the satellite footprint and how many stations are needed to establish a reliable spatial mean. Crow et al. (2012) provide a review of the upscaling of point measurements to satellite footprints. For instance, Famiglietti et al. (2008) applied stochastic analyses to surface soil moisture data sets collected during intensive field campaigns and concluded that 30 samples are needed to estimate the spatial mean of 50×50 km2 domains (approximate size of satellite footprints) with an accuracy of 0.03 m3 m−3 with 95 % confidence. Brocca et al. (2010) used statistical and temporal stability analyses applied to year-round intensive field measurements to conclude that nearly 40 samples are needed to determine the catchment (60×60 km2) mean soil moisture with an accuracy of 0.02 m3 m−3. Other investigators (Mohanty and Skaggs, 2001; Cosh et al., 2005; Martínez-Fernández and Ceballos, 2005) have adopted the temporal stability concept to diagnose how well measurements taken at specific locations represent the spatial mean recorded by the network. However, De Lannoy et al. (2007) indicated that temporal stability may be less suited as an upscaling strategy under complex hydrologic terrain with a strong soil layer stratification and/or spatially heterogeneous water management practices. Moreover, reliance on a limited number of measurement sites makes the spatial mean vulnerable to spatially varying rainfall and the continuity of the data streams.
In summary, preferably more than 30 spatially independent measurements are suggested to establish a reliable reference for validation of satellite-based soil moisture estimates, and no generally accepted upscaling protocol exists with which metrics can be derived without spatial sampling errors. This poses a challenge to validation activities as only a few monitoring networks with such a high density of stations are available at a particular time, mainly because of the difficulty in keeping all stations operational. This led to accepting an accuracy of 0.03 m3 m−3 for the spatial mean with 70 % confidence, implying a requirement of at least eight monitoring stations within satellite footprints and the application of an upscaling strategy based on weights assigned to individual measurements using Thiessen polygons (Colliander et al., 2017).
The Twente soil moisture monitoring network, located in the central–eastern part of the Netherlands, is one of the regions that has been used for validation of the SMAP L2 passive-only soil moisture products (Colliander et al., 2017; Chan et al., 2018). The Twente network consisted of 20 locations where both soil moisture and temperature were measured at various depths. However, not all stations could be utilized because some did not fall within the satellite validation footprint and others did not consistently deliver data as a result of instrument failures, vandalism, or changes in landownership. As a result, the requirement of eight operational stations was not always met. This was in particular the case for April to October 2015. Hence, a model-based upscaling strategy, similar to the one described in Crow et al. (2005), was explored to be able to utilize the in situ measurements for validation of the SMAP L2 soil moisture estimates, also for periods when the number of operational stations would fall short of the requirement.
In this paper, we report on the development of a model-based upscaling method with scaling parameters derived directly from the mean and standard deviation of the in situ measured and model-simulated soil moisture. We adopted the Dutch integrated water resources model (De Lange et al., 2014), called the “Landelijke Hydrologisch Model” (LHM, National Hydrological Model in Dutch), which simulates the transfer of water masses across the groundwater, unsaturated zone, and surface water reservoirs. LHM-simulated soil moisture matching in situ measurements from January 2015 till October 2018 were utilized to develop the upscaling functions. These were applied to upscale the in situ measurements used to assess the performance of the SMAP L2 passive-only soil moisture product for the period from April 2015 to December 2018. Validation of the SMAP L2 passive-only soil moisture product is an extension of the earlier worldwide assessments presented in, for instance, Colliander et al. (2017) and Chan et al. (2018) in the sense that comparisons are presented for multiple years covering a wider spectrum of hydro-meteorological conditions ranging from cold wet winters to the dry hot European summer of 2018.
2.1 Twente region
The monitoring stations are distributed across the central–eastern part of the Netherlands in the region known as “Twente”. Characteristics of this region include very little relief and the use of land for farming practices amongst various mid-sized urban conglomerates. Pastures make up more than 70 % of the agricultural fields, and the remainder is mostly corn, wheat, and potatoes. The growing season generally starts in April and ends around October/November depending on the weather and crop type. In this period, the pastures are either grazed by cattle or mowed four to six times. Forested areas are typically found on the gently rolling hills (<50 m in height).
Sandy, loamy, and peat soils are the main soil types (Dente et al., 2011). Sand and loamy sand are dominant near the surface and some peat remnants are spread across the domain. The subsurface consists mostly of glacial windblown sand deposits in the south and poorly drained soils in the north. The groundwater tables are rather shallow across the entire region, close to the surface during winters and 1 to 2 m deep during summers. Water standing on the fields can be persistent in low-lying areas in the cold wet season and may also occur in the warm season after intensive rain.
Climate in Twente is determined by a mixture of influences from the sea towards the west and land towards the east. Moist and warm (or cold in the summer) air is received from the sea direction, whereas dry and cold (or warm in the summer) air is blown from land. As a result, both winters and summers are generally mild and wet. However, fairly extreme cold and warm episodes may occur depending on the wind direction, with temperatures well below −10 ∘C in winter or well above 30 ∘C in summer, respectively. Figure 1 provides an impression of the prevailing weather conditions for the study period, from January 2015 till February 2019, by showing monthly averages of daily mean, minimum, and maximum 1.5 m air temperatures (Tmean, Tmin, and Tmax, respectively) along with monthly rainfall and reference crop evapotranspiration (ETref) sums. Data presented in the plot are derived from meteorological measurements collected at the three weather stations in the region (see Fig. 2) operated by the Royal Netherlands Meteorological Institute (KNMI). It should be noted that 2018 was an exceptional year with record high temperatures and evaporative demand and low rainfall.
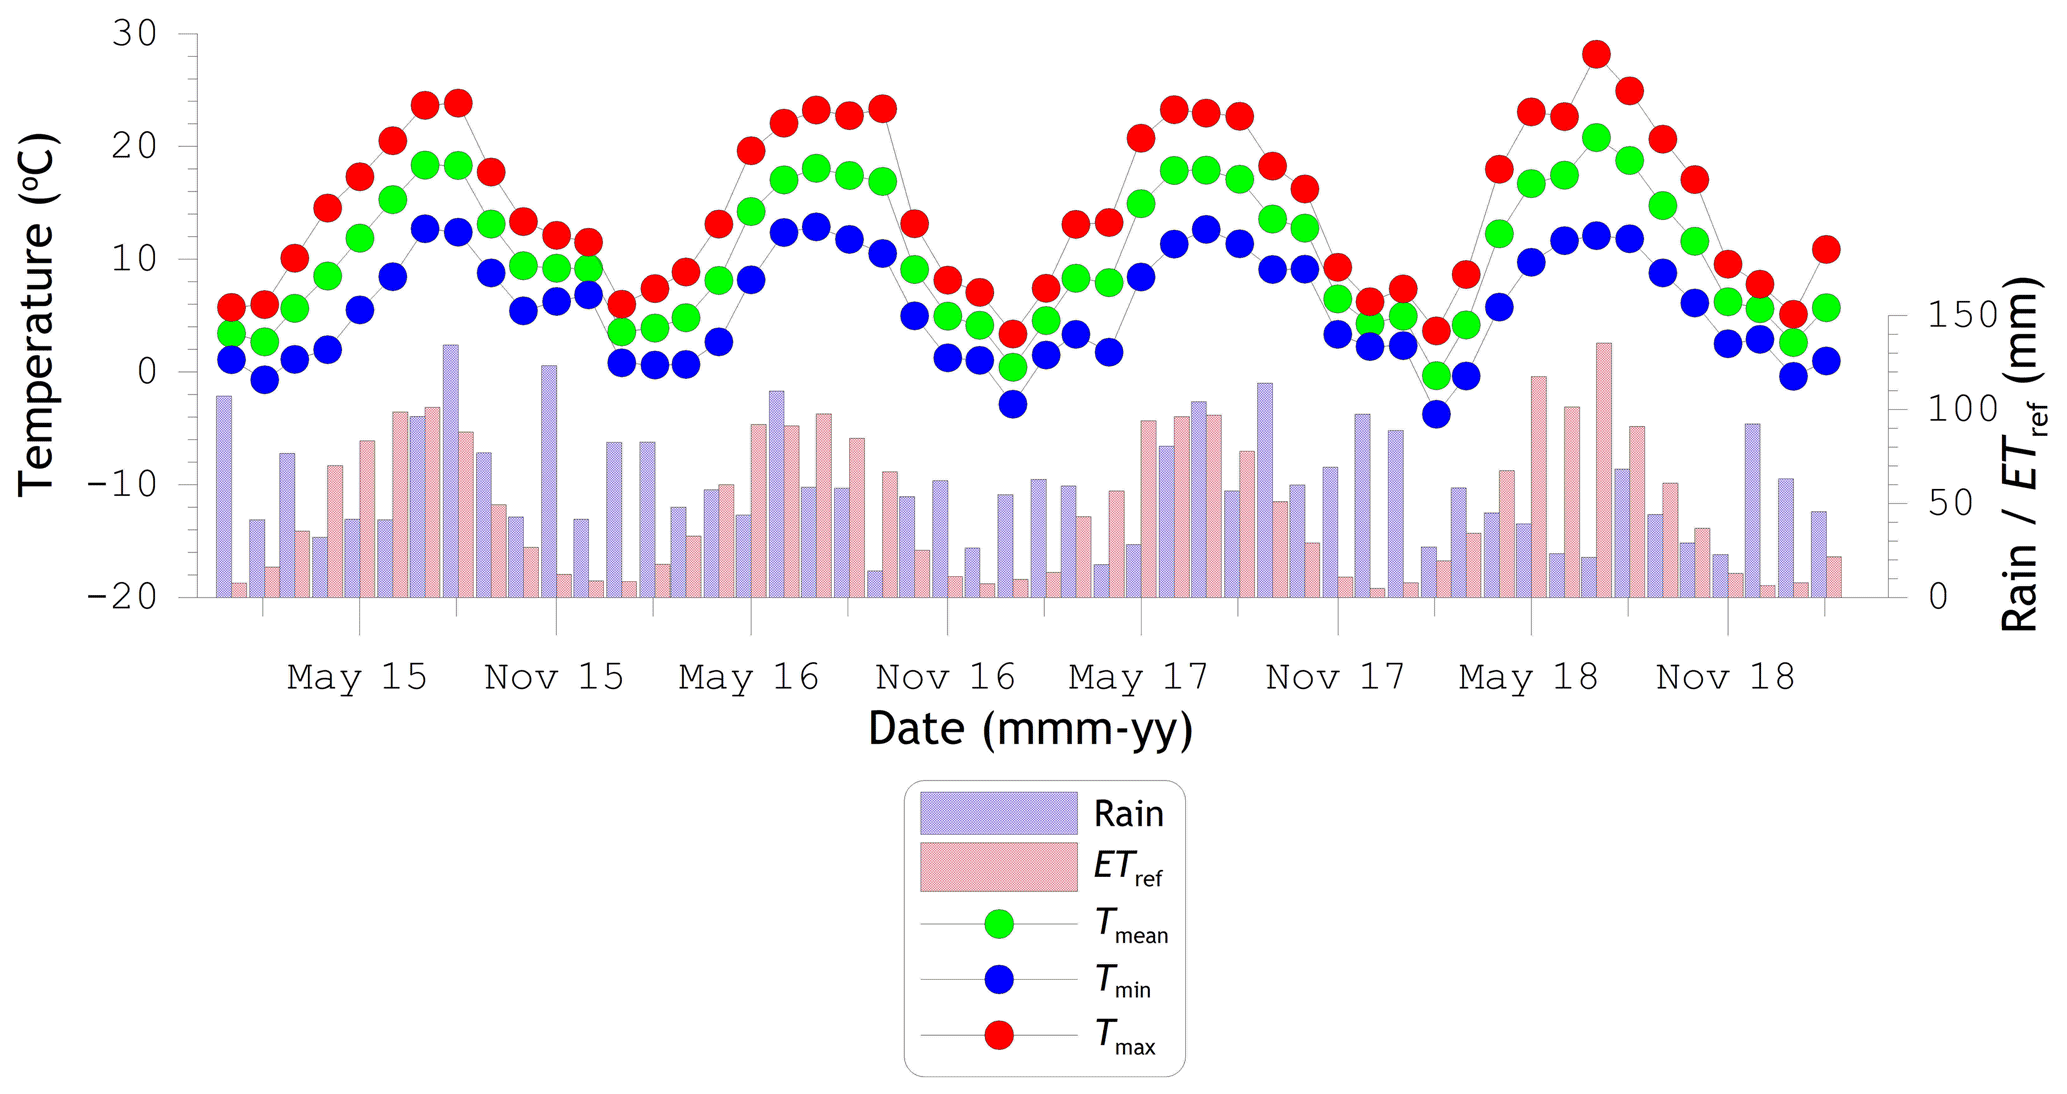
Figure 1Monthly averages of daily mean (Tmean), minimum (Tmin), and maximum (Tmax) air temperature and monthly sums of rainfall and reference evapotranspiration (ETref), all derived from measurements collected at the three KNMI weather stations Heino, Hupsel, and Twenthe.
2.2 Measurement networks
Figure 2 displays the distribution of soil monitoring stations and KNMI weather stations and the extent of the SMAP reference pixels lain over a Landsat 8 true colour composite of 20 July 2013. Wind, temperature, radiation, precipitation, visibility, humidity, and ETref observations for the Heino and Hupsel automated weather stations are available from 1989 onwards, and the Twenthe record even dates back to 1951. More information and data access can be obtained from http://www.knmi.nl/nederland-nu/klimatologie (last access: 10 July 2019).
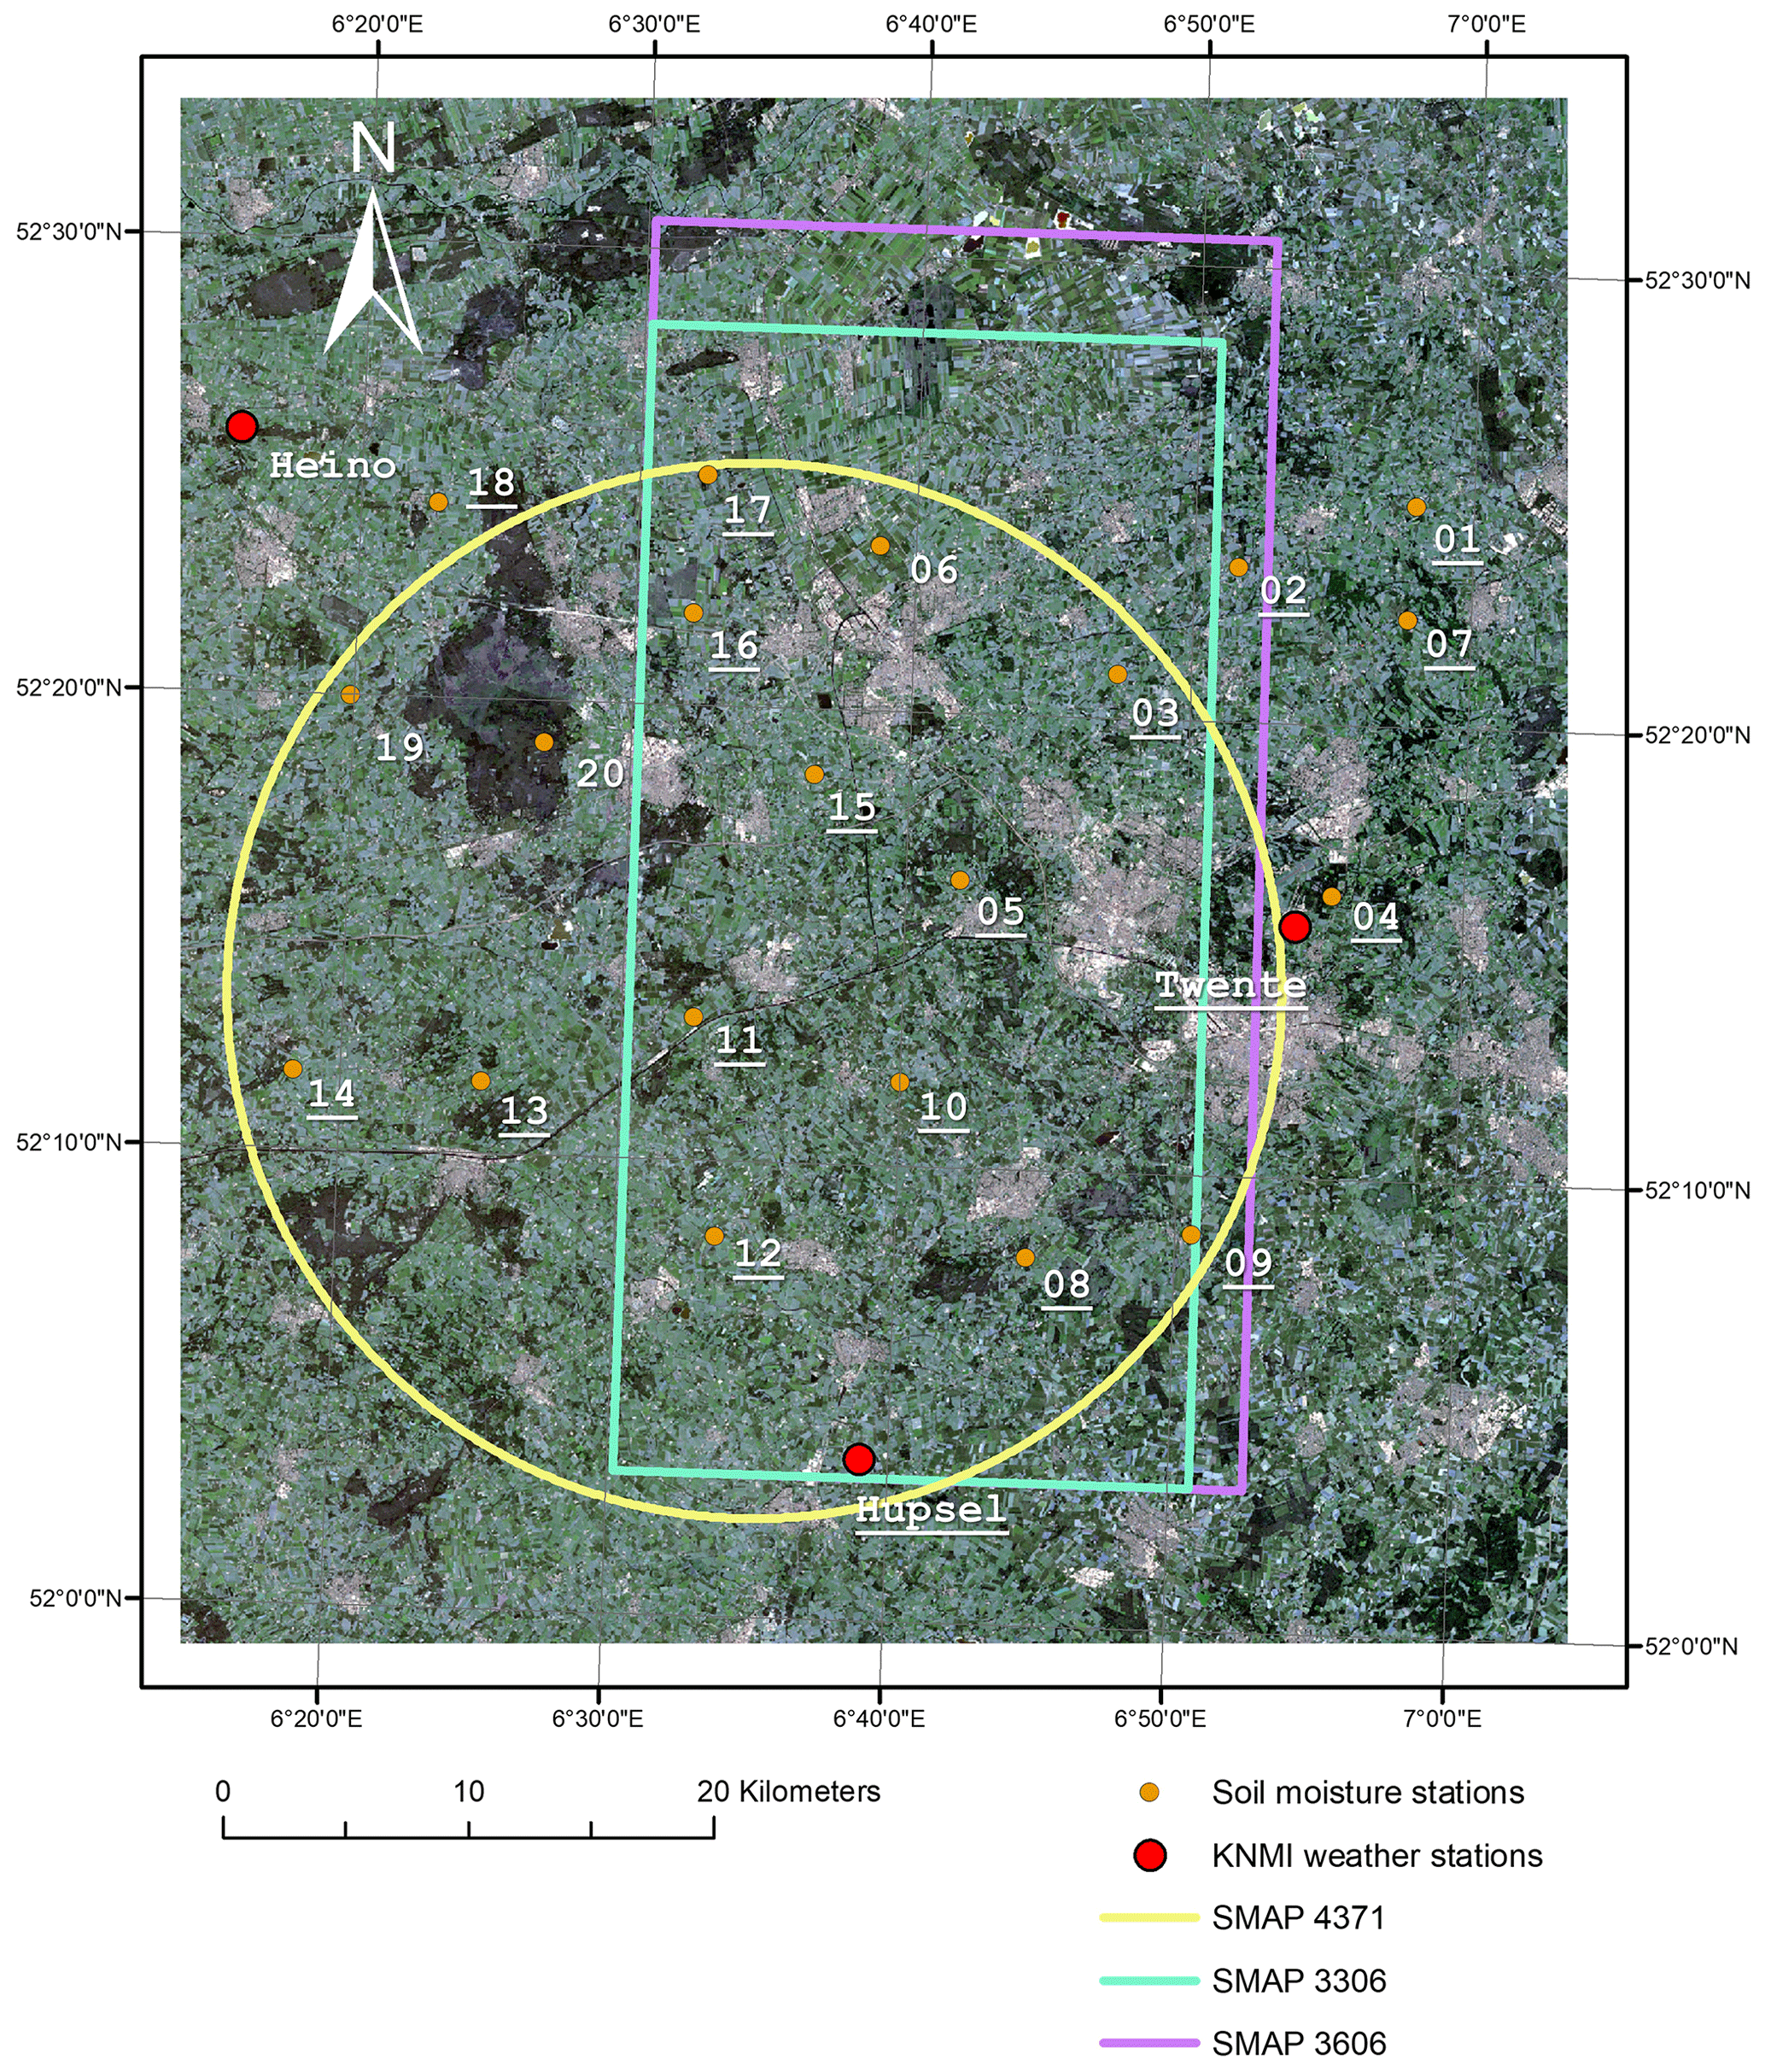
Figure 2Delineation of the SMAP reference pixels 4371, 3306, and 3606 and the locations of the UT-ITC soil monitoring and the KNMI weather stations lain over a Landsat 8 true colour composite of 20 July 2013 (image courtesy of the U.S. Geological Survey). Double digits indicate the soil moisture station ID and names (Heino, Hupsel, Twenthe) refer to the weather stations. Stations with underlined ID numbers are still operational. Coordinates are given in latitude/longitude (datum: WGS84).
The University of Twente (UT-ITC) soil monitoring network was developed in 2009. Twenty stations were set up to measure soil moisture and soil temperature every 15 min with Decagon EC-TM ECH2O probes installed at nominal depths of 5, 10, 20, and 40 cm below the surface. Budget constraints restricted the number of fully equipped stations, but every station included a sensor at 5 and 10 cm. A soil-specific calibration function was developed for the EC-TM probe under laboratory conditions with an estimated accuracy of 0.023 m3 m−3. Readers are referred to Dente et al. (2012) and Dente et al. (2011) for additional information on the network development.
Over time, the original locations of a number of stations had to be changed for various reasons (e.g. vandalism, land use/ownership change). This and equipment failures caused gaps in the data records. In the autumn of 2015, a concerted maintenance operation was undertaken to update the network. Activities included reinstallation of stations within the same field, in an adjacent field of the same landowner, or in a neighbouring parcel of a different landowner. The newly installed stations are equipped with five new Decagon 5TM probes at nominal depths of 5, 10, 20, 40, and 80 cm with the exception of station 4 (three probes) due to a shallow groundwater table and station 7 (four probes). Also, a new soil-specific calibration function was developed for the 5TM probe following the same procedure as described in Dente et al. (2011) with an accuracy of 0.027 m3 m−3 expected. Since the autumn of 2017, stations 6, 19, and 20 have no been longer operational and have been replaced by equipment installed at the premises of KNMI weather stations Hupsel and Twenthe. Table S1 in the Supplement lists the stations, the vegetation cover, the sensor types and depth, and dates on which the locations of the stations were changed, when applicable.
3.1 SMAP and its passive-only soil moisture products
The SMAP mission includes a radiometer that measures at a centre frequency of 1.4135 GHz (L-band) the four Stokes parameters, of which two provide the horizontally (H) and vertically (V) polarized brightness temperatures (Tb), and the other two (T3 and T4) channels serve to correct for the Faraday rotation. Additional signal processing techniques have been embedded within the design of SMAP to assist with the detection and mitigation of RFI (see Piepmeier et al., 2014, and Mohammed et al., 2016, for details). The SMAP radiometer observes at an angle of 40∘ with a 3 dB instantaneous field of view (IFOV) of 38 km × 49 km on the Earth's surface from a Sun-synchronous orbit every 2 to 3 d at nominal overpass times of 06:00 (descending) and 18:00 (ascending) near the Equator (Piepmeier et al., 2017). All native gridded radiometer-based data products are placed on Equal-Area Scalable Earth (EASE) grid projection version 2 (Brodzik et al., 2012) with a nominal 36 km × 36 km pixel size (Chan et al., 2016). Enhanced radiometer-based data products are available with a pixel size of 9 km × 9 km, which are created through application of the Backus–Gilbert optimal interpolation technique to the antenna temperatures of overlapping SMAP footprints (Chan et al., 2018).
Soil moisture retrieval is performed using five algorithms applied to the calibrated and gridded L1C brightness temperature products and run through sets of processing steps and data streams responsible for the necessary inputs and flags for unfavourable land surface conditions (see O'Neill et al., 2018, for details). All five algorithms are based on the zeroth-order radiative transfer approach described in Mo et al. (1982), whereby the most fundamental difference among them is the manner in which the vegetation effects are treated. Two single-channel algorithms (SCAs) adopt the ancillary data approach (Jackson, 1993) to calculate the vegetation opacity and estimate the soil moisture content from either the H- or V-polarized Tb, hereafter referred to as SCA-H and SCA-V. The other three algorithms make use of the combination of H- and V-polarized Tbs to derive simultaneously the vegetation opacity and soil moisture content. The Dual Channel Algorithm (DCA) and Extended DCA (E-DCA) accomplish this by iteratively minimizing cost functions composed of the observed and modelled Tb, whereas the Microwave Polarization Ratio Algorithm (MPRA, Owe et al., 2008) uses closed-form relationships. Previous analyses (Chan et al., 2016) have shown that the E-DCA and MPRA provide essentially the same results as the DCA; therefore, only the retrievals obtained using the SCA-H, SCA-V, and DCA are evaluated here.
To optimize the number of covered soil moisture monitoring stations, the SMAP team developed a validation grid processing procedure that allows centering of the footprint on any location along the defined 3 km grid lines (Colliander et al., 2017). Figure 2 shows the three SMAP reference pixels selected for the Twente network, coded SMAP 3606, SMAP 3306, and SMAP 4371. SMAP 3606 is the reference pixel based on the native 36 km resolution. SMAP 3306 with a 33 km resolution originates from the development of the enhanced data products (Colliander et al., 2018). SMAP 4371 evolved from a reconsideration of the shape of the footprint and has a 36 km resolution. As indicated in Table 1 and shown in Fig. 2, SMAP 3606 and 3306 are quite similar and are both represented by 13 monitoring stations, while SMAP pixel 4371 is represented by a total of 17 stations. Note that stations less than 5 km from the periphery are also assigned to that reference pixel and that not all stations were continuously operational during the study period. For this research, the SMAP soil moisture retrievals (version 5) for the three reference pixels have been analysed from April 2015 till December 2018.
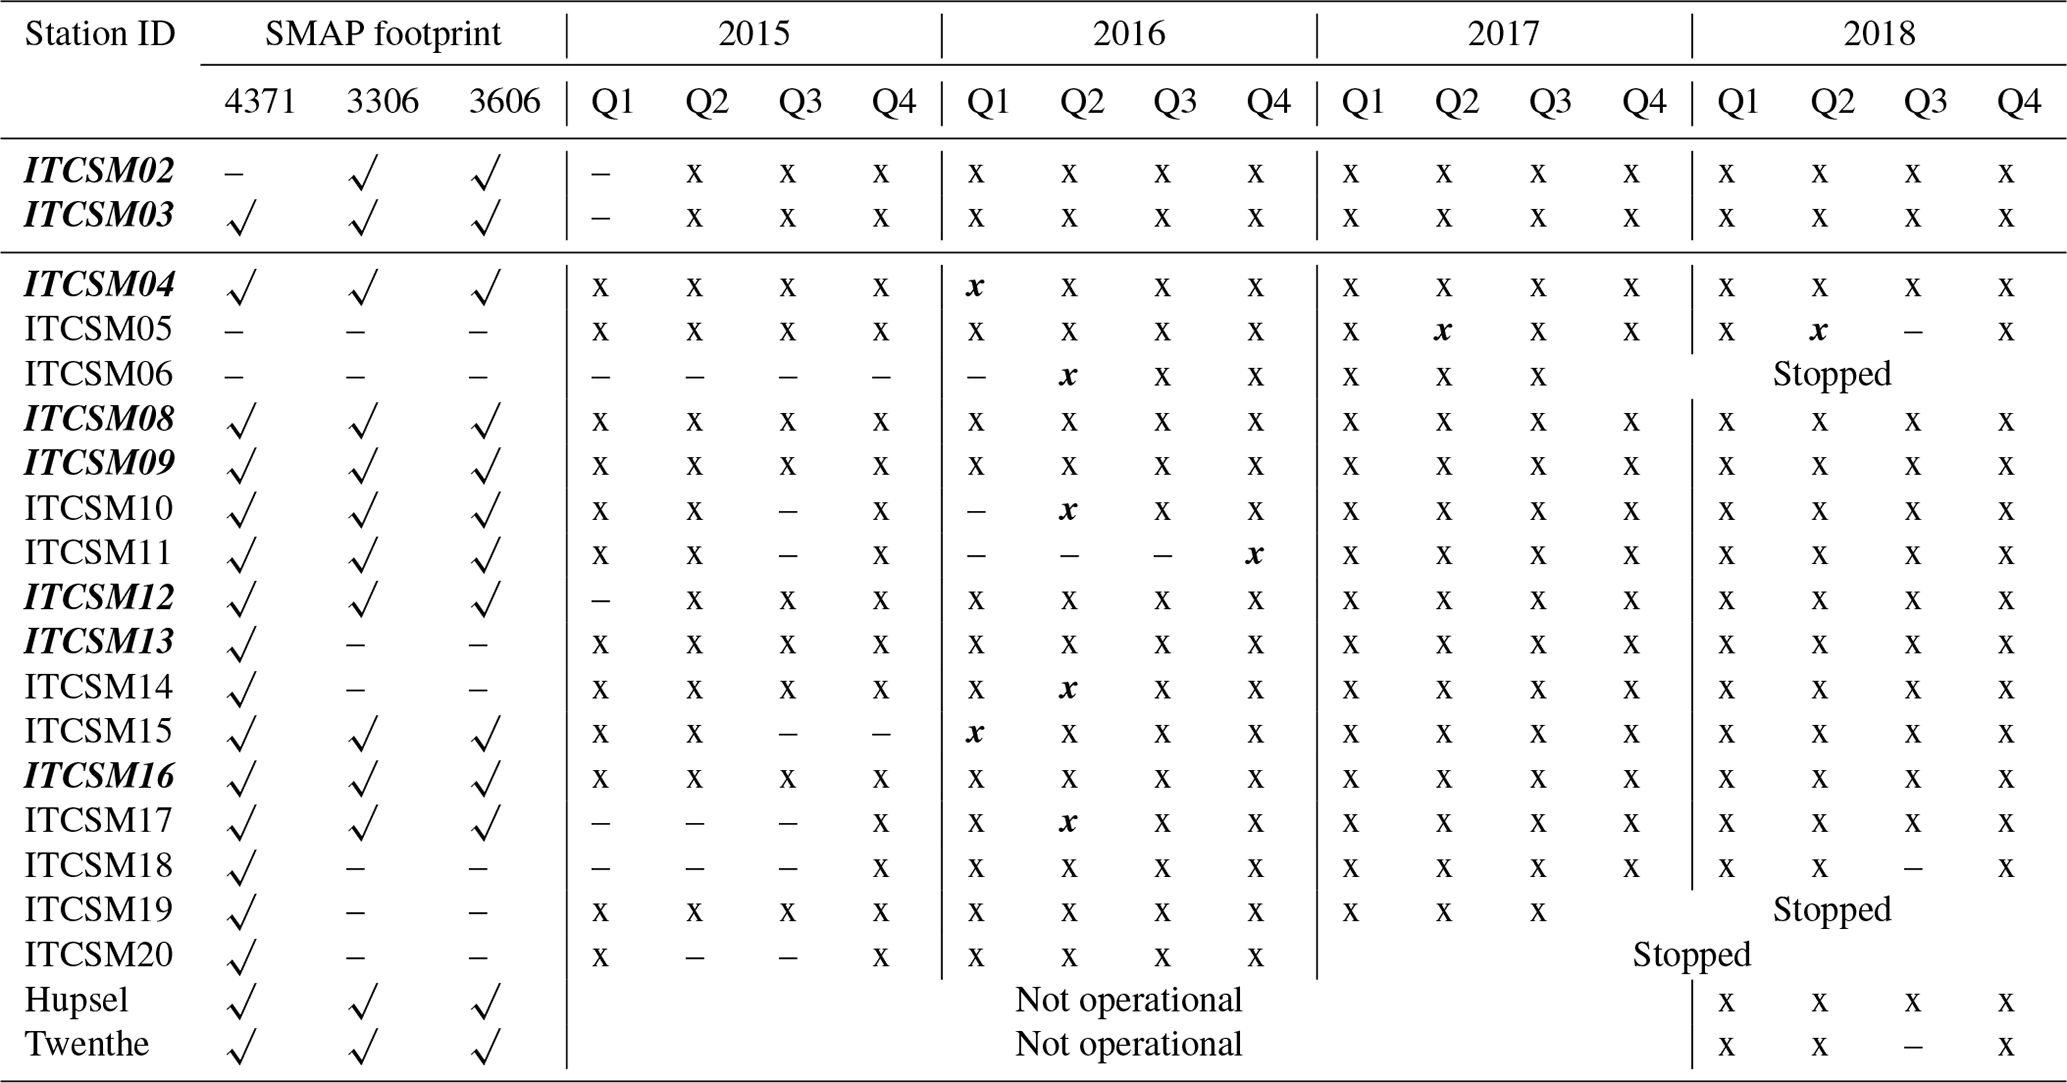
Table 1Data availability of the Twente monitoring stations within SMAP footprints. Q1, Q2, Q3, and Q4 refer to quartiles 1 (January–March), 2 (April–June), 3 (July–September), and 4 (October–December). “√” indicates that the station is used for determining the reference for the SMAP footprint, “x” indicates that the data are available for that specific period and station, and “–`' means that the two previous qualifications are not applicable. Bold and italic “x” suggests that the location of the station was changed; exact dates are given in Table S1. Bold and italic station IDs highlight that records over the period 2015–2018 are fairly complete.
3.2 LHM soil moisture simulations
The LHM is the national implementation of the Netherlands Hydrological Instrument (NHI, De Lange et al., 2014), which is an integrated framework that couples physically based modelling approaches for the groundwater, unsaturated, and surface water flow. MODFLOW (Harbaugh et al., 2017) is used to simulate groundwater flow, and a meta version of the Soil Water Atmosphere Plant (SWAP, Van Dam et al., 2008) model, called MetaSWAP (Van Walsum and Groenendijk, 2008), is adopted to compute the unsaturated soil water flow with a quasi-steady-state solution of Richards' equation. Readers are referred to De Lange et al. (2014) and http://www.nhi.nu/ (last access: 10 July 2019) for more information on NHI.
The national NHI implementation, viz. LHM, consists of boundary conditions and atmospheric forcings derived from a comprehensive set of data layers for which various research institutes in the Netherlands are responsible. For instance, subsurface information follows from the national hydrogeological database with a pixel spacing of 100 m (https://www.dinoloket.nl/regis-ii-het-hydrogeologische-model, last access: 10 July 2019). The Dutch class pedotransfer function applied to the 500 m resolution soil map provides the soil physical characteristics (Wösten et al., 2013). A 5 m resolution lidar-based digital terrain model is included as elevation data (http://www.ahn.nl/index.html, last access: 10 July 2019) and the land use information is adopted from the national 25 m resolution land use map (Hazeu et al., 2014). Daily rainfall and ETref are the two primary atmospheric forcings obtained from KNMI as 1 km gridded data products. The precipitation data are based on gauge-adjusted rain radar observations (Overeem et al., 2009) and the spatial ETref data are obtained via thin-plate spline interpolation of the ETref available for the 35 automated weather stations operated by KNMI in the Netherlands (https://data.knmi.nl/datasets/EV24/2, last access: 10 July 2019), of which three are shown in Fig. 2.
The LHM simulations used for this investigation cover the period from January 2015 till October 2018. The initial conditions are obtained by spinning the model for up for 1 year starting from long-term climatological states. The LHM model structure provides daily soil moisture simulations of the root with a nominal depth of 0.4 m for the Twente region on a 250 m resolution grid. The model's ability to provide the root zone soil moisture content as the shallowest soil layer clearly poses an additional challenge to its use for comparison with satellite-observed soil moisture products. Nevertheless, we have chosen to use LHM simulations for the development of the upscaling functions for two main reasons. Firstly, the LHM is an integrated hydrological model that couples unsaturated and groundwater flow processes, which is important for our study area, where the groundwater tables are shallow. Secondly, the LHM makes use of the best possible boundary conditions, which is essential for a proper characterization of the spatial heterogeneity. In Sect. 5, we elaborate further on how the LHM root zone simulations are adopted for upscaling 5 cm soil moisture measurements.
4.1 Method
Soil moisture measured in situ is only representative of a small domain, whereas model simulations provide spatial distributions across scales. The assumption is that the spatial soil moisture variability simulated by the LHM projected onto the in situ measurements can be used to obtain a reference representative for the satellite footprint. Figure 3 illustrates this spatial scale mismatch between the in situ monitoring stations, the LHM grid, and the reference pixels of SMAP.
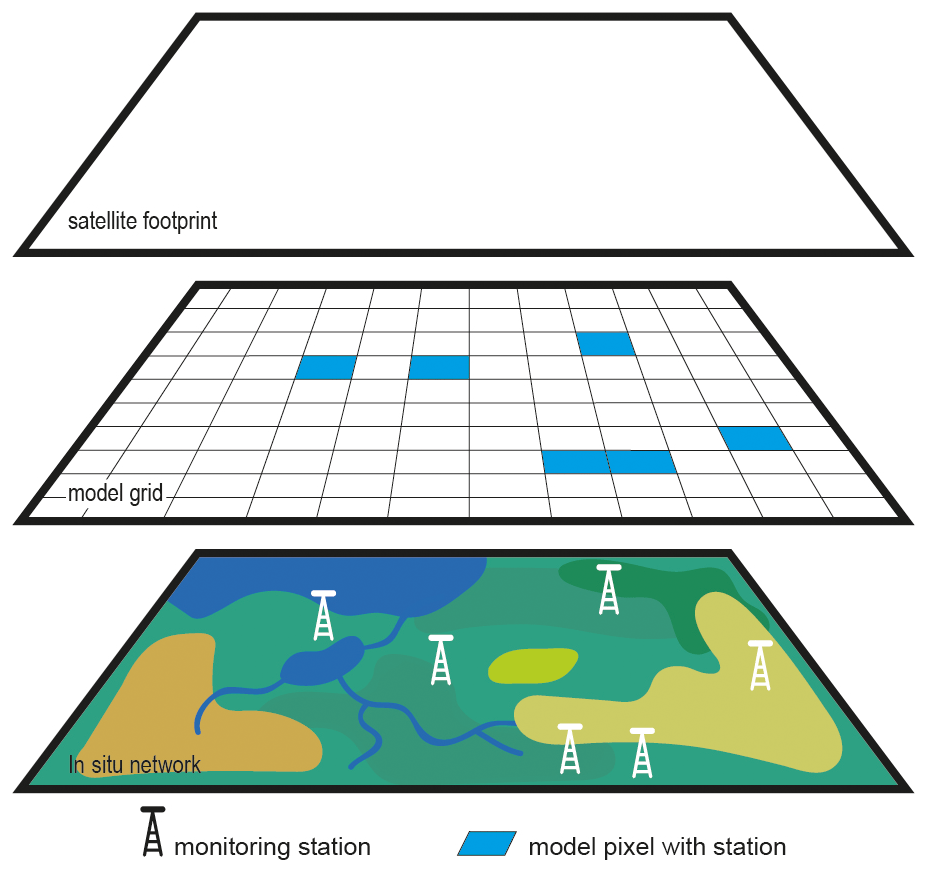
Figure 3Schematic illustration of the spatial scale mismatch between in situ monitoring stations, hydrological model grid, and SMAP reference pixel (satellite footprint).
However, spatial-scale mismatch is not the only cause of biases between the climatologies of in situ measurements and model simulations. Also, the model physics employed and the specific application (e.g. atmospheric forcings, boundary conditions, soil and vegetation parameters) contribute. The method selected for the transformation from point to footprint scale is based on matching the mean and standard deviation (1st and 2nd statistical moments) of the in situ measured and LHM-simulated soil moisture records as was done previously by, for instance, Draper et al. (2009) for the assessment of satellite-derived soil moisture over Australia.
The first step is to convert the statistical moments of the LHM simulations into those of in situ measurements within the satellite footprint, according to
where θ (m3 m−3) stands for the spatial mean soil moisture content within the SMAP footprint of the indicated data source at time t, μ (m3 m−3) and σ (m3 m−3) stand for the temporal mean and standard deviation of θ(t), subscripts i, m,p, and m,f indicate that the variable is derived from the in situ measurements, model grid cells where the monitoring stations are located, and all model grid cells covering the SMAP footprint, respectively, and superscript i indicates that the variable is transformed into the in situ measured climatology.
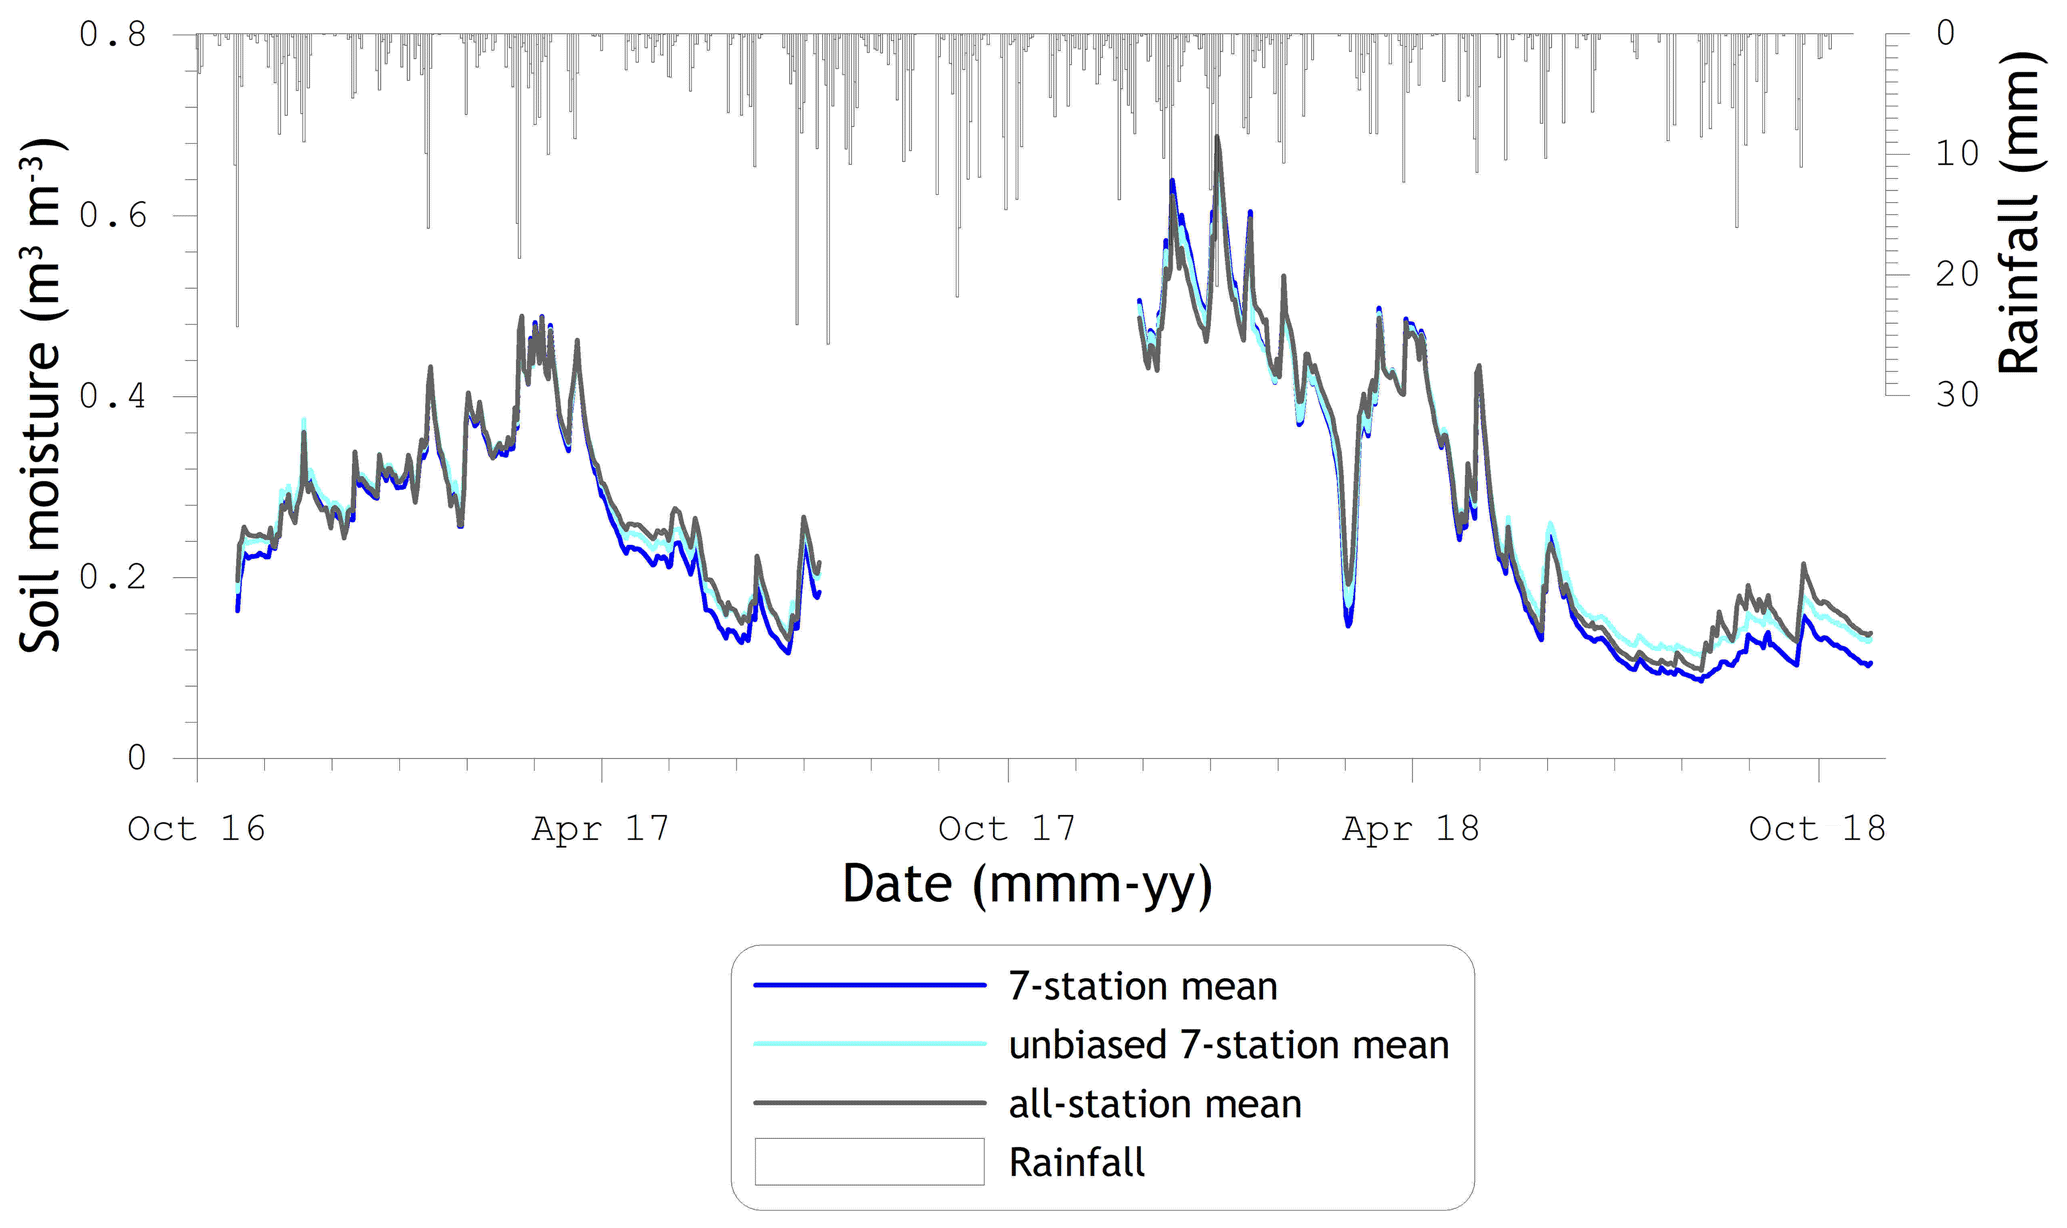
Figure 4Spatial soil moisture means for SMAP reference pixels 3306 and 3606 from October 2016 up to October 2018.
After transformation of the LHM soil moisture data to the in situ measured statistics, the step from point-scale to footprint-representative measurements is taken as follows:
where subscript i,f indicates that the in situ soil moisture is considered representative for the satellite footprint.
From Eq. (2) a linear relationship between θi, f and θi can be identified with the following form:
with
The parameterization of a and b can be simplified by recognizing that and can be obtained from Eq. (1) as follows:
Substitution of Eq. (4b) into Eq. (3b) gives
Using Eq. (5) together with Eq. (4a) to eliminate and from Eq. (3a) yields, after some rearrangements,
Equation (3) forms the upscaling function with a and b given by Eqs. (6) and (5), respectively. The advantage of the mathematical rearrangements leading to Eqs. (5) and (6) is that upscaling functions can be determined directly from the statistical moments (1st and 2nd) of in situ measured and model-simulated soil moisture. It is interesting to note that the slope of the upscaling function, b, is independent of the in situ measurements. This implies that the choice of the in situ measurements affects primarily the offset, a, of the upscaling function, as will be shown in the following sections.
4.2 Comparison of spatial soil moisture means
The application of the method described by Eqs. (1)–(3) depends on the availability of data from the individual measurement stations. As indicated in Sect. 2.2, the data record of the Twente soil moisture monitoring network has several gaps, and the three SMAP footprints also cover different numbers of stations. Table 1 indicates for the stations present within the three SMAP footprints the availability and continuity (e.g. changes in the location of stations) of the 5 cm soil moisture data. The table shows that for each of the three footprints there are seven stations available with a fairly complete record and that after the spring of 2016 the data availability improved considerably.
Ideally, satellite-based soil moisture estimates are validated against a reference established based on as many spatially distributed samples as possible over a time period as long as possible. To investigate whether both criteria can be met, we assessed the agreement between pairs of spatial means composed of measurements from (i) the seven stations (hereafter seven-station mean) with the most complete records since SMAP operations began and (ii) all stations (hereafter all-station mean) within the respective footprints, available as a complete set for a shorter duration. Figure 4 shows for footprints 3306 and 3606 (hereafter 3306 and 3606) the available spatial means for the period October 2016 to October 2018. The plot illustrates an obvious similarity between the soil moisture time series even though they are determined from different sets of soil moisture stations. However, biases exist as a result of spatially variable hydro-meteorological conditions, e.g. soil types, groundwater tables, rainfall, and evapotranspiration. Hence, an “unbiased seven-station mean” obtained by matching the mean and standard deviation is also given in Fig. 4.
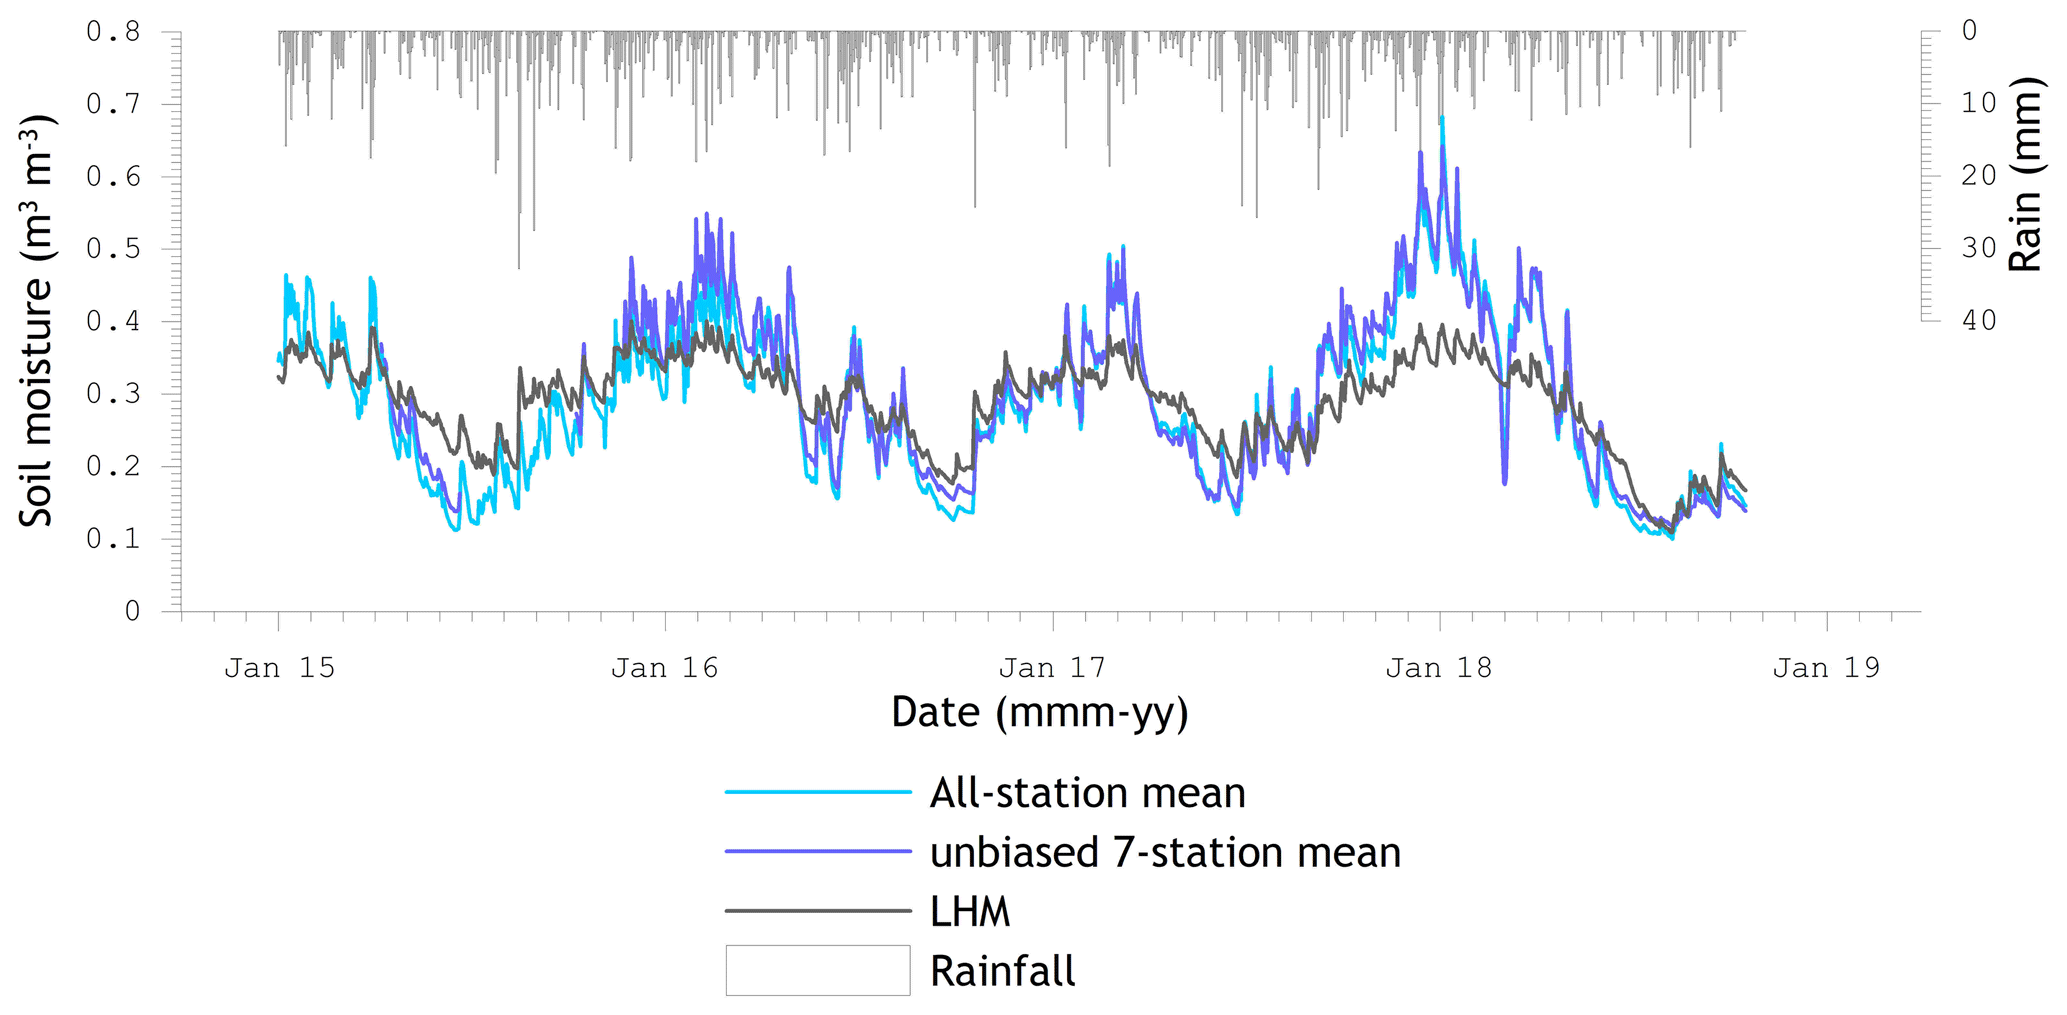
Figure 5Spatial soil moisture mean for SMAP reference pixels 3306 and 3606 from January 2015 up to October 2018 derived from (i) measurements collected at all available stations, (ii) unbiased measurements from the seven stations operating fairly continuously, and (iii) LHM simulations for the locations where stations are situated.
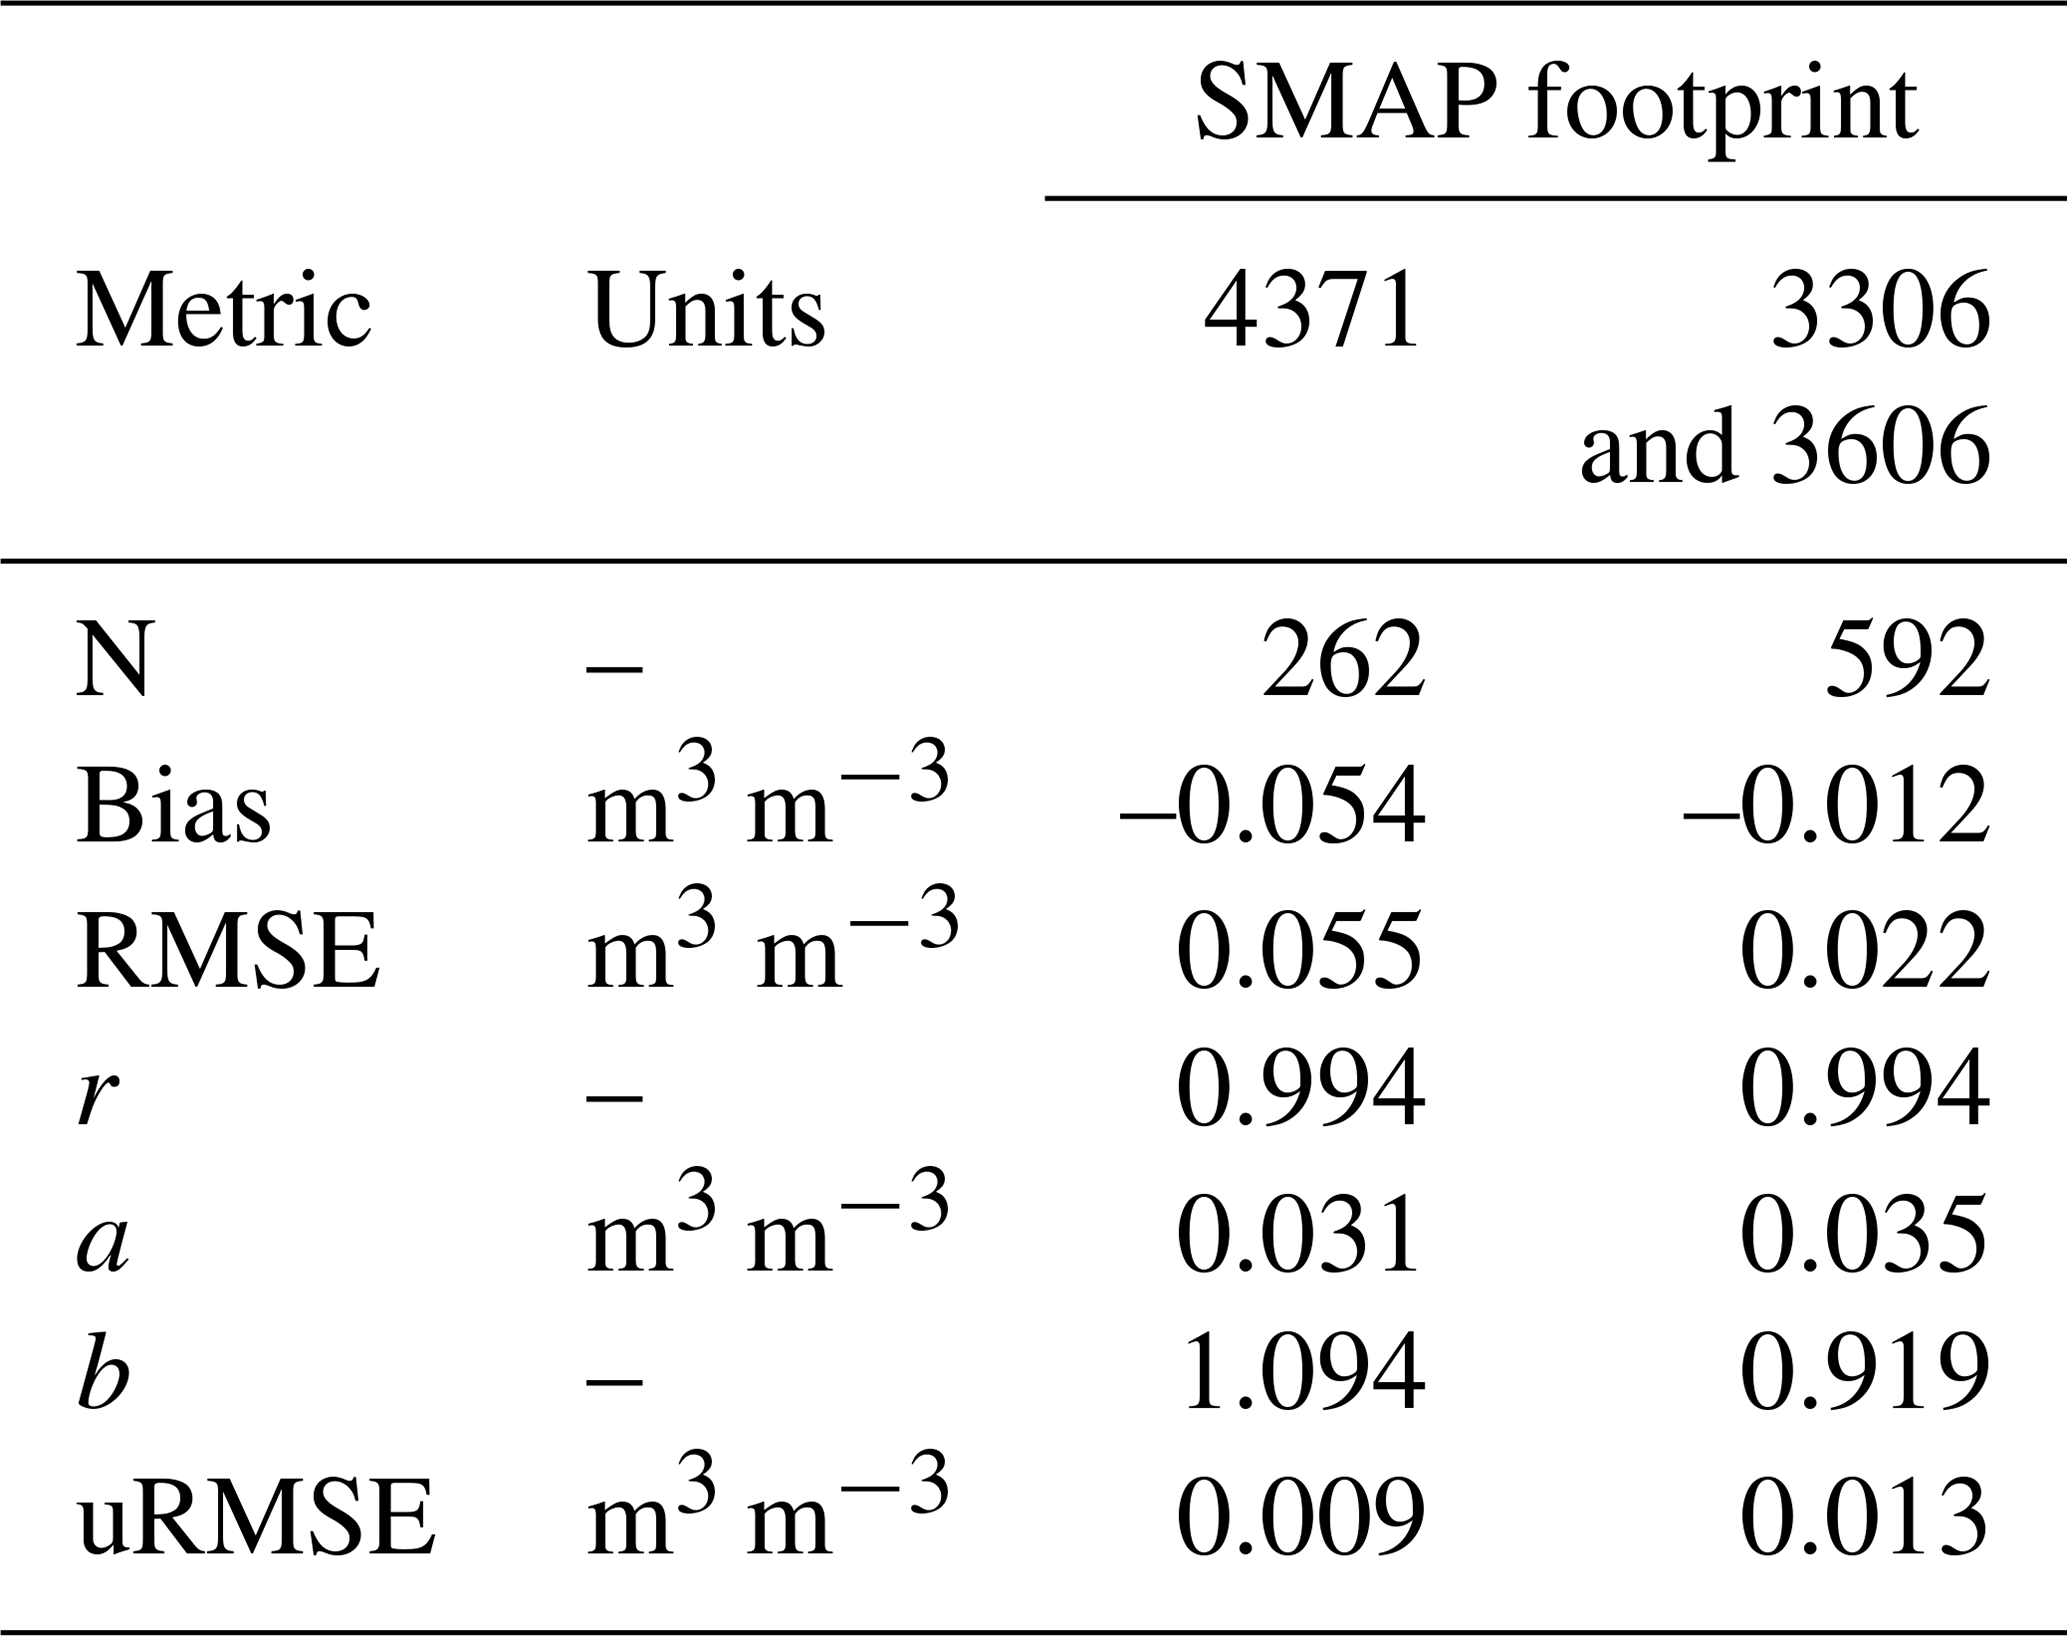
Table 2 provides the error metrics computed between pairs of the seven-station (biased and unbiased) and all-station means for footprints 3606, 3306, and 4371. In general, the metrics confirm the visual interpretation of Fig. 4. A very high correlation, r>0.99, was found between the spatial means, and the mismatch is largely determined by a systematic bias. For instance, for footprint 4371, a RMSE of 0.055 m3 m−3 is obtained and the bias is 0.054 m3 m−3. After removal of the biases, as was done for the unbiased seven-station mean, the RMSE (RMSE-b) reduces to 0.009 m3 m−3 for footprint 4371 and to 0.013 m3 m−3 for footprints 3306 and 3606. From these low RMSE-b values it can be concluded that with the linear equation, the seven-station mean can be used to mimic the all-station mean with a relatively small uncertainty. In the remainder of the paper, we utilize the unbiased seven-station mean as one of the validation references.
Further, it should be noted that more than twice as many matchups are available for footprints 3306 and 3606 (592) as compared to 4371 (262). This is explained by changes in the locations of the stations (e.g. 19 and 6) within footprint 4371, which compromises the integrity of spatial mean soil moisture and makes it unsuitable for the analysis presented in this section.
Table 2Error metrics computed from matchups of the spatial soil moisture means derived from measurements collected at seven stations and all stations within the respective footprint. N stands for the number of matchups, r is the Pearson product moment correlation coefficient, a and b are coefficients of a linear function, , between the two footprint averages derived as given by Eqs. (3a) and (b), and uRMSE is computed between the unbiased seven-station and all-station means.
5.1 Measurements versus simulations
In this section we evaluate the agreement between the spatial soil moisture means derived from the in situ measurements and the LHM simulations for the SMAP footprints. Figure 5 presents results for January 2015 till October 2018 of the LHM-simulated and in situ measured spatial means for footprints 3306 and 3606, whereby the LHM soil moisture is the mean of the simulations for the grid cells where the monitoring stations are located. The two references based on the in situ measurements are (i) the all-station mean and (ii) the unbiased seven-station mean introduced in Sect. 4.2.
In general, Fig. 5 illustrates that the measured seasonal cycle of wet winters (November to mid-March) and dry summers (mid-May to mid-October) is well reproduced by the LHM simulations. Also, the shorter timescale wetting and drying events measured at the monitoring stations coincide with the simulated events. As such, it may be concluded that the LHM root zone simulations capture the dynamics of soil moisture measured at a 5 cm soil depth.
However, systematic discrepancies can be noted as well. For instance, the measured winter soil moisture is typically higher than the LHM simulations, while this is the opposite for summers. This may be attributed to the difference in soil layer thickness for which information is provided. In the case of the in situ measurements, the probes have a 4 cm influence zone (e.g. Benninga et al., 2018) and, thus, provide information for the 1–9 cm soil layer, while the LHM root zone layer has for the Twente region a nominal depth of 40 cm with the moisture state defined at 20 cm, the mid-point of the soil layer. This explains the overestimation by the LHM in the summer and partly the underestimation in the winter as the larger soil reservoir takes longer to fill up/to deplete and also has more direct interactions with the groundwater. The winter underestimation is also caused by the fact that in reality the saturated soil moisture content near the surface is higher than prescribed in the LHM due to an elevated organic matter content and standing water that may occur.
Exceptions to the LHM winter underestimation occur when the soil is frozen. Under those circumstances, the water in the soil becomes ice and the dielectric constant of the soil mixture measured by the probes drops considerably, while the simulated soil moisture remains unaffected; a good example is February 2018. An exception to the summer overestimation by the LHM is found for 2018, which was such a dry period that forced depletion of the LHM root zone to moisture levels similar to those measured at a 5 cm soil depth.
Comparable observations can be made for the LHM-simulated and in situ measured spatial means of footprint 4371, but a time series plot is omitted here for brevity. Instead Fig. 6 presents scatter plots with the LHM-simulated spatial mean of footprint 4371 against the in situ measured (a) unbiased seven-station and (b) all-station means, in which the matchups for individual years are separated. Two additional scatter plots (c and d) are provided for which the mean and standard deviation of the LHM simulations are matched to those of the in situ measured spatial means. The error metrics, r, RMSE, and bias, computed between the matchups are given in the lower right corner of the individual plots.
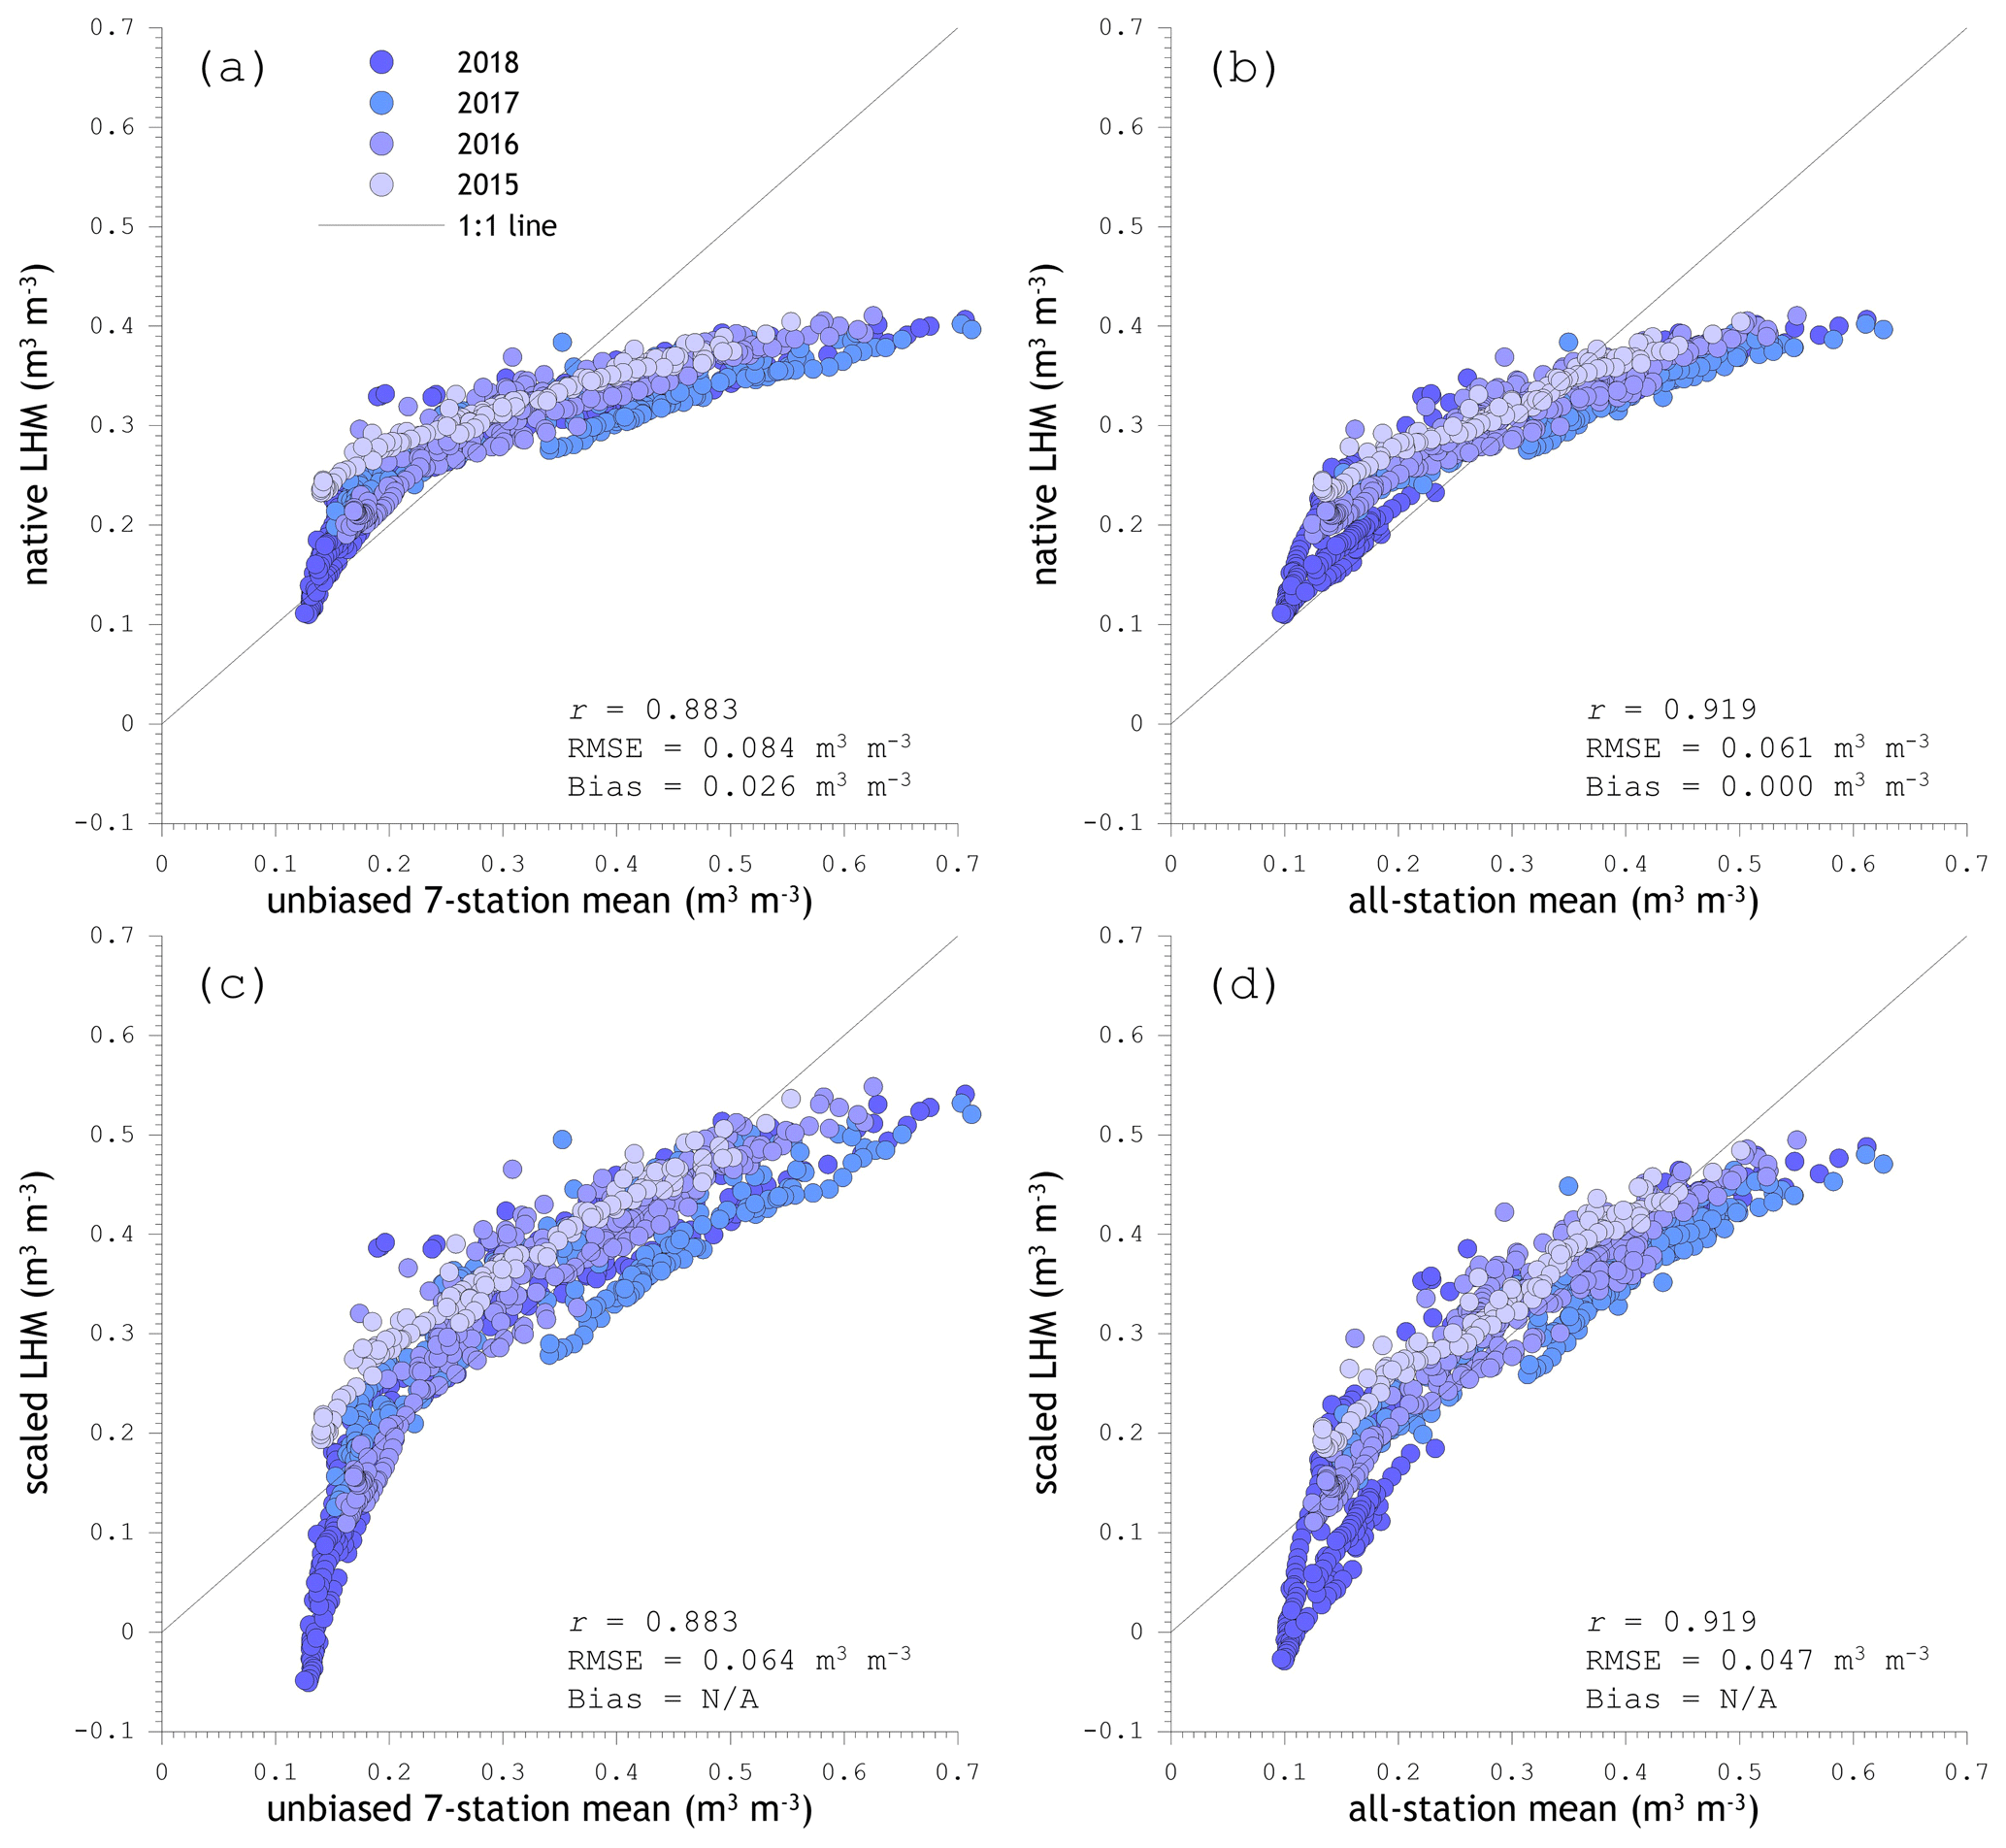
Figure 6LHM-simulated spatial mean soil moisture against references deduced from in situ measurements for SMAP reference pixel 4371; panels (a) and (b) show the native LHM simulations versus the unbiased seven-station mean and all-station mean, respectively; panels (c) and (d) presented the same as panels (a) and (b); only LHM soil moisture is scaled to the statistical moments (1st and 2nd) of the in situ references.
The scatter plots show a linear relationship between the LHM-simulated root zone soil moisture and the measured references for the 5 cm soil depth over the range from 0.2 up to 0.7 m3 m−3. The discontinuity at 0.2 m3 m−3 can be attributed to the summer matchups, in particular those from 2018. Under normal circumstances, the 5 cm soil moisture decreases quite quickly early in the summer, after which further drying is constrained by the available water itself. The root zone soil moisture simulated by the LHM remains at a higher level longer partly due to a water supply from the deeper layers fed by the groundwater reservoir. However, during prolonged dry episodes the groundwater table drops to levels where the supply from the deep layers is cut off, leading to an accelerated decrease in the LHM-simulated root zone soil moisture.
Carranza et al. (2018) made similar observations based on an analysis of the Twente measurements taken at 5 and 40 cm and referred to this as the (de)coupling of surface and subsurface soil moisture. An interesting implication of the coupled situation under wet conditions is that satellite-observed surface soil moisture, such as the SMAP products, can be used as a proxy for the root zone soil moisture. Indeed, Pezij et al. (accepted for publication) adopt this assumption by assimilating the SMAP L3 9 km product into the LHM. Note that this is only justifiable for coupled surface–subsurface conditions, which occurs mostly in regions with sufficiently shallow groundwater tables.
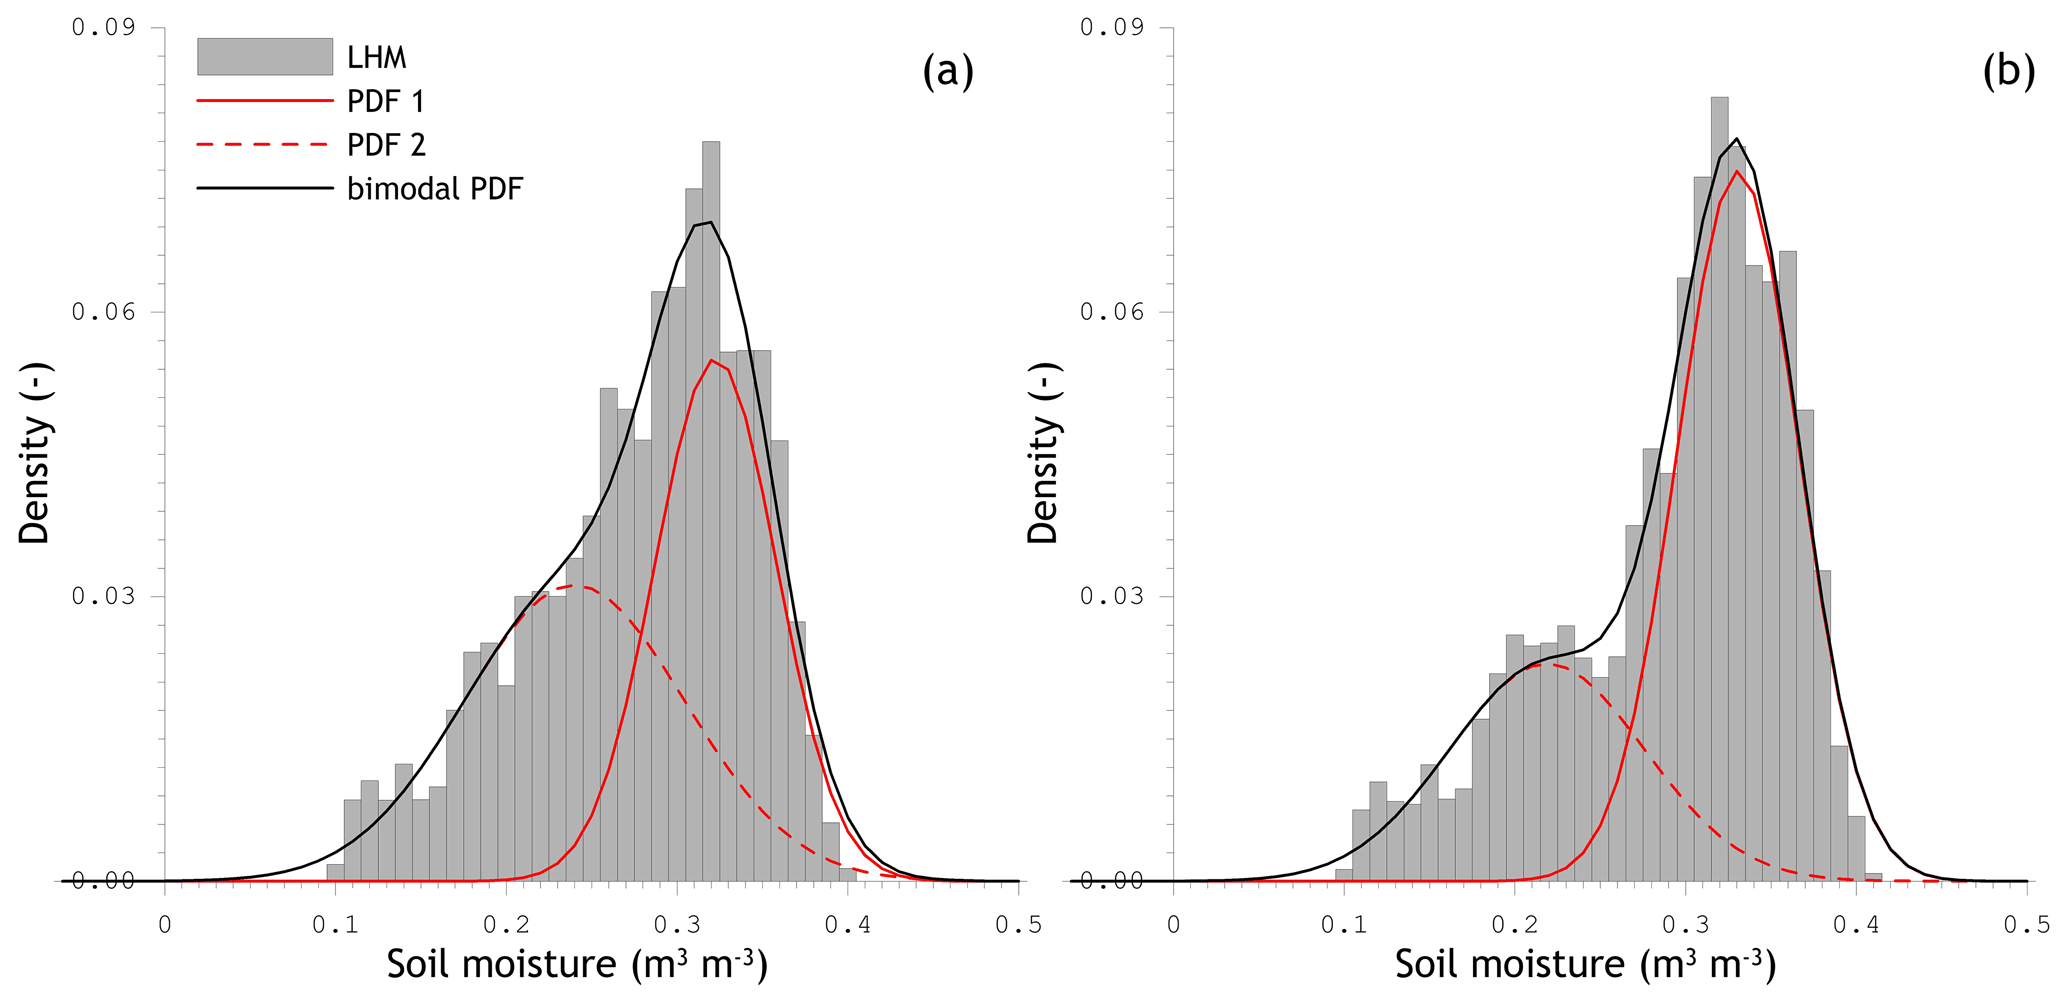
Figure 7Density of soil moisture estimated from LHM simulations (bin size 0.01 m3 m−3) and calculated using a weighed sum of two normally distributed pdfs. Panel (a) shows the density for reference pixels 3306 and 3606 and panel (b) that of reference pixel 4371.
Regardless of the imperfections in the matchups described above, the agreement found between the simulations and measurements can be considered good, with r>0.88. Yet the RMSEs computed from matchups with the unbiased seven-station and all-station spatial means are, at 0.084 and 0.061 m3 m−3, respectively, somewhat unsatisfactory, as they are larger than the accuracy requirement defined for the SMAP mission. Even after matching of the statistical moments of the LHM time series to those of the in situ measured references, the RMSE remains above the SMAP requirement at 0.061 and 0.047 m3 m−3, respectively.
5.2 Accounting for bimodality when deriving upscaling parameters
The utility of the LHM simulations for development of the upscaling functions depends on the linearity between simulated and in situ measured soil moisture. Section 5.1 showed that a linear relationship that worked well for wet conditions does not capture the data collected under dry circumstances. This suggests that the density distribution of the soil moisture simulated by the LHM has bimodal characteristics. To assess this bimodality, the estimated density distribution of LHM soil moisture was reproduced using the weighed sum of two normal probability density functions (pdfs) formulated as follows:
with
where x is taken here as θm, p, α is a weighing parameter, and subscripts 1 and 2 represent the statistical moments of pdf 1 and pdf 2. Equation (7) is matched to the density distribution (bin size 0.01 m3 m−3) estimated from the LHM soil moisture simulations by fitting the parameters α, μ1, μ2, σ1, and σ2. The r is selected as the objective function, which is optimized using the generalized reduced gradient (GRG, Lasdon et al., 1978) method implemented in the Solver add-in of MS Excel. Figure 7 shows the density estimated from the LHM soil moisture simulations and calculated using the weighed sum of two normal distributed pdfs (hereafter bimodal pdf) with the individual contributions of the two pdfs presented as well. Table 3 lists the fitting parameters for footprints 3606, 3306, and 4371; both are obtained with a r larger than 0.989.
Table 3Parameters of the bimodal probability density functions fitted to the density distribution of LHM soil moisture simulations of the grid cells where monitoring stations are located. Note that the results for the two footprints are separated because they contain different sets of monitoring stations.
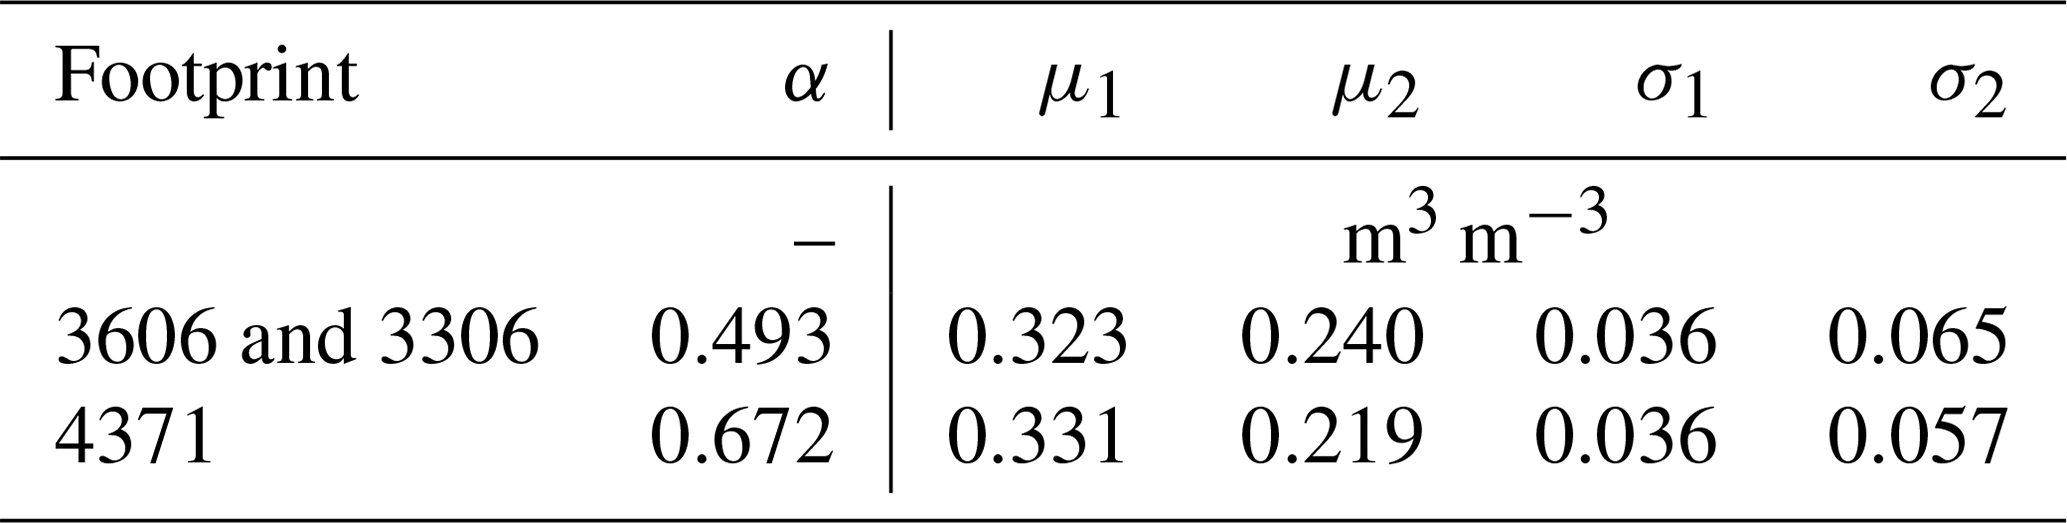
Figure 7 illustrates that the bimodal pdf matches the density of the LHM soil moisture simulations reasonably well, which is also supported by the large r. The underlying fitted pdfs include a pdf (pdf 1) with a μ of 0.32 m3 m−3 and a σ of 0.036 m3 m−3 and a pdf (pdf 2) with a μ of 0.24 m3 m−3 and a σ of 0.057 m3 m−3. Even though attribution is difficult, pdf 1 may be interpreted as the winter situation during which the dynamic soil moisture range is constrained by shallow groundwater tables on the down (dry) side and porosity on the up (wet) side. Hence, pdf 2 may be considered the summer situation.
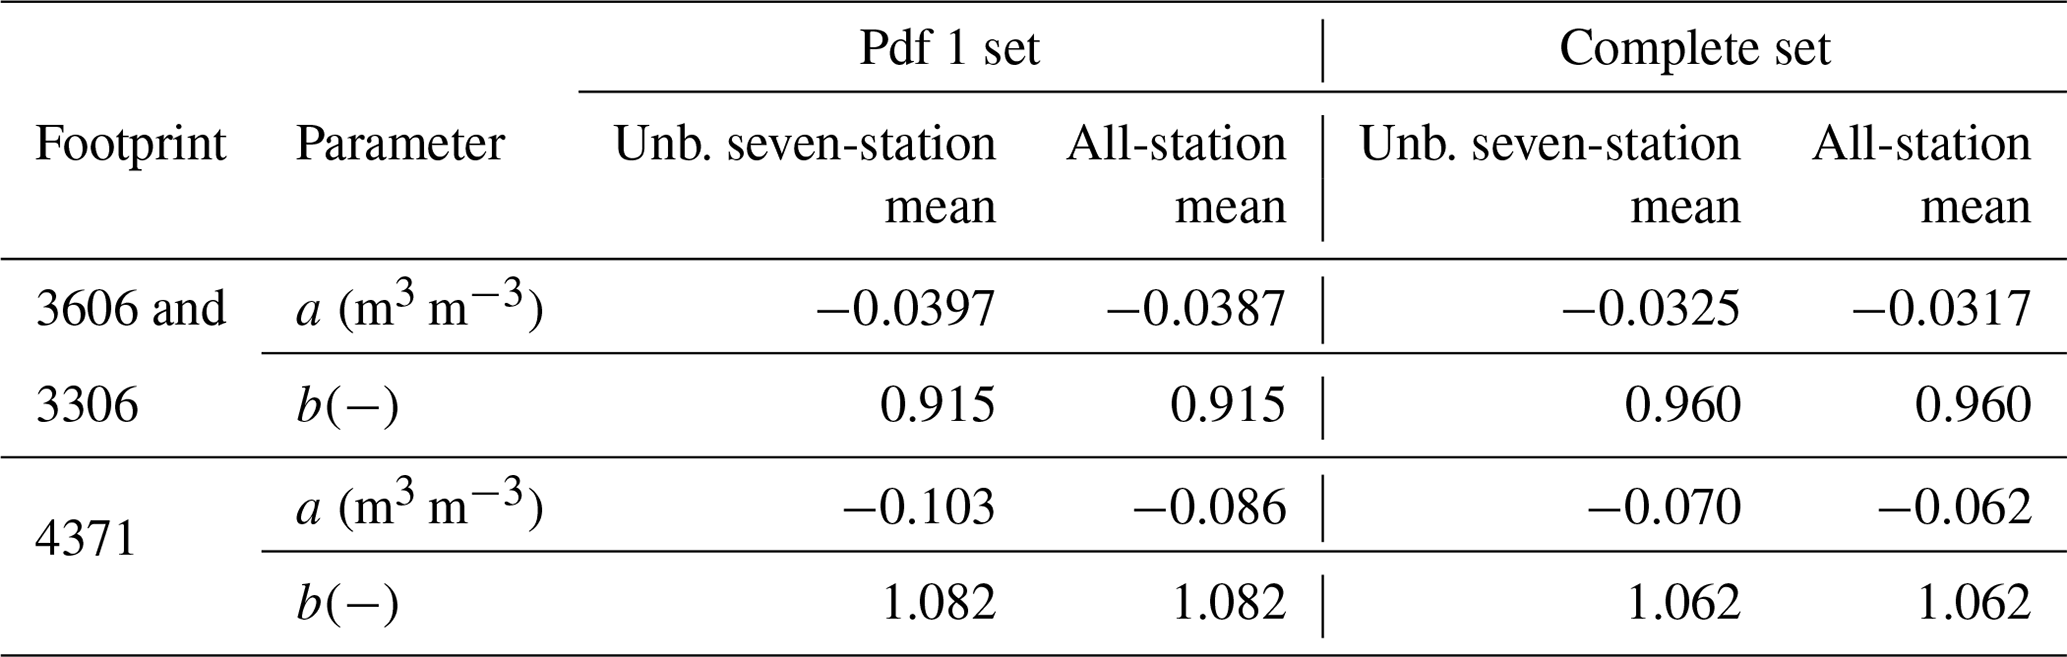
With the established modes of the density of LHM soil moisture simulations, the available data can be split into sets that have a normal distribution. Subsequently, Eqs. (5) and (6) can be applied to arrive at parameters, a and b, for the upscaling function, Eq. (3). Here, the threshold >μ1−2σ1 is taken to extract the set representing pdf 1, which implies a value of 0.251 m3 m−3 for footprints 3606 and 3306 and 0.259 m3 m−3 for footprint 4371. Table 4 lists the scaling parameters calculated using the pdf 1 set, with the unbiased seven-station mean and the all-station mean as references. In addition, the parameters calculated with the complete data set are provided. It is important to note here that the slope, b, of the upscaling function is independent of the selected in situ reference as demonstrated in Sect. 4.1.
Table 4Upscaling parameters, a and b, calculated by applying Eqs. (5) and (6), respectively, to the complete data and a set representing pdf 1 with the unbiased seven-station mean and the all-station mean as references. The pdf 1 set holds 828 and 747 samples for footprints 3606, 3306, and 4731, respectively, and the complete set includes 1146 and 1003 samples, respectively.
6.1 Time series
Figure 8 shows time series of the SMAP estimates of (a) SCA-H, (b) SCA-V, and (c) DCA for reference pixel 3606 and the native all-station mean in situ soil moisture for the complete study period regardless of gaps in the time series of in situ measurements, along with the mean daily minimum air temperature and daily rainfall measured at the three KNMI weather stations. The results for SMAP footprints 3306 and 4371 are included in the Supplement in Figs. S1 and S2, respectively.
In general, the time series of the SMAP and in situ soil moisture display great similarity on a seasonal scale, particularly for the SCA estimates. Both the SMAP and in situ soil moisture are high during winters, mainly due to a weak evaporative demand; see Fig. 1. This evaporative demand is much stronger during summers, resulting in lower SMAP and in situ soil moisture levels. In the SCA series the dry-down events can be recognized, which is less the case for the DCA record. Overall, the DCA estimates have a larger apparent volatility than the SCA soil moisture, and the SCA-H soil moisture reaches its upper limit under wet conditions more frequently than the SCA-V estimates.
For all three algorithms, large mismatches between the SMAP estimates and in situ measurements manifest themselves as (i) overestimations after rain events demarcating the end of dry spells and (ii) underestimations during winters. Examples of the former are obvious in the autumn of 2016 and in August 2018. The winter underestimations coincide with sub-zero temperatures that are not masked via the SMAP freeze/thaw flag that is derived from global land model simulations, and the frost depth is too shallow to also affect the in situ sensors. On the other hand, there is reasonable agreement between the SMAP estimates and in situ measurements when frost in the soil does reach the sensors; see for instance February/March 2018.
6.2 Matchups
A quantitative assessment of the three SMAP products is made for matchups for which the data from all stations contributing to the unbiased seven-station mean are available. These matchups were used to compute the r, bias, and uRMSE defined in the Appendix and presented in Figs. 9, 10, and 11, respectively. The r is provided for the three SMAP reference pixels, for the morning and afternoon overpasses, and for the unbiased seven-station and all-station mean soil moisture as a reference. Here, no differentiation is made between the different implementations of the upscaling method as it does not affect the agreement between matchups due to its linear nature. The upscaling method does influence the biases and uRMSEs, and is, therefore, given for the native in situ references and the references whereby the upscaling parameters are derived using (i) the full set of LHM simulations (hereafter LHM-all) and (ii) the LHM simulations belonging only to the wet regime (hereafter LHM-pdf1). A selection of scatter plots showing SMAP soil moisture retrievals versus references based on measurements is given in Fig. 12 for reference pixel 4371. The full set of plots is presented in the Supplement in Figs. S3–S8. In total 601 matchups are available for SMAP's morning overpasses for reference pixel 3606, 621 matchups for 3306, and 666 matchups for 4371. The numbers for the afternoon passes were 719, 731, and 722 matchups for reference pixels 3606, 3306, and 4371, respectively.
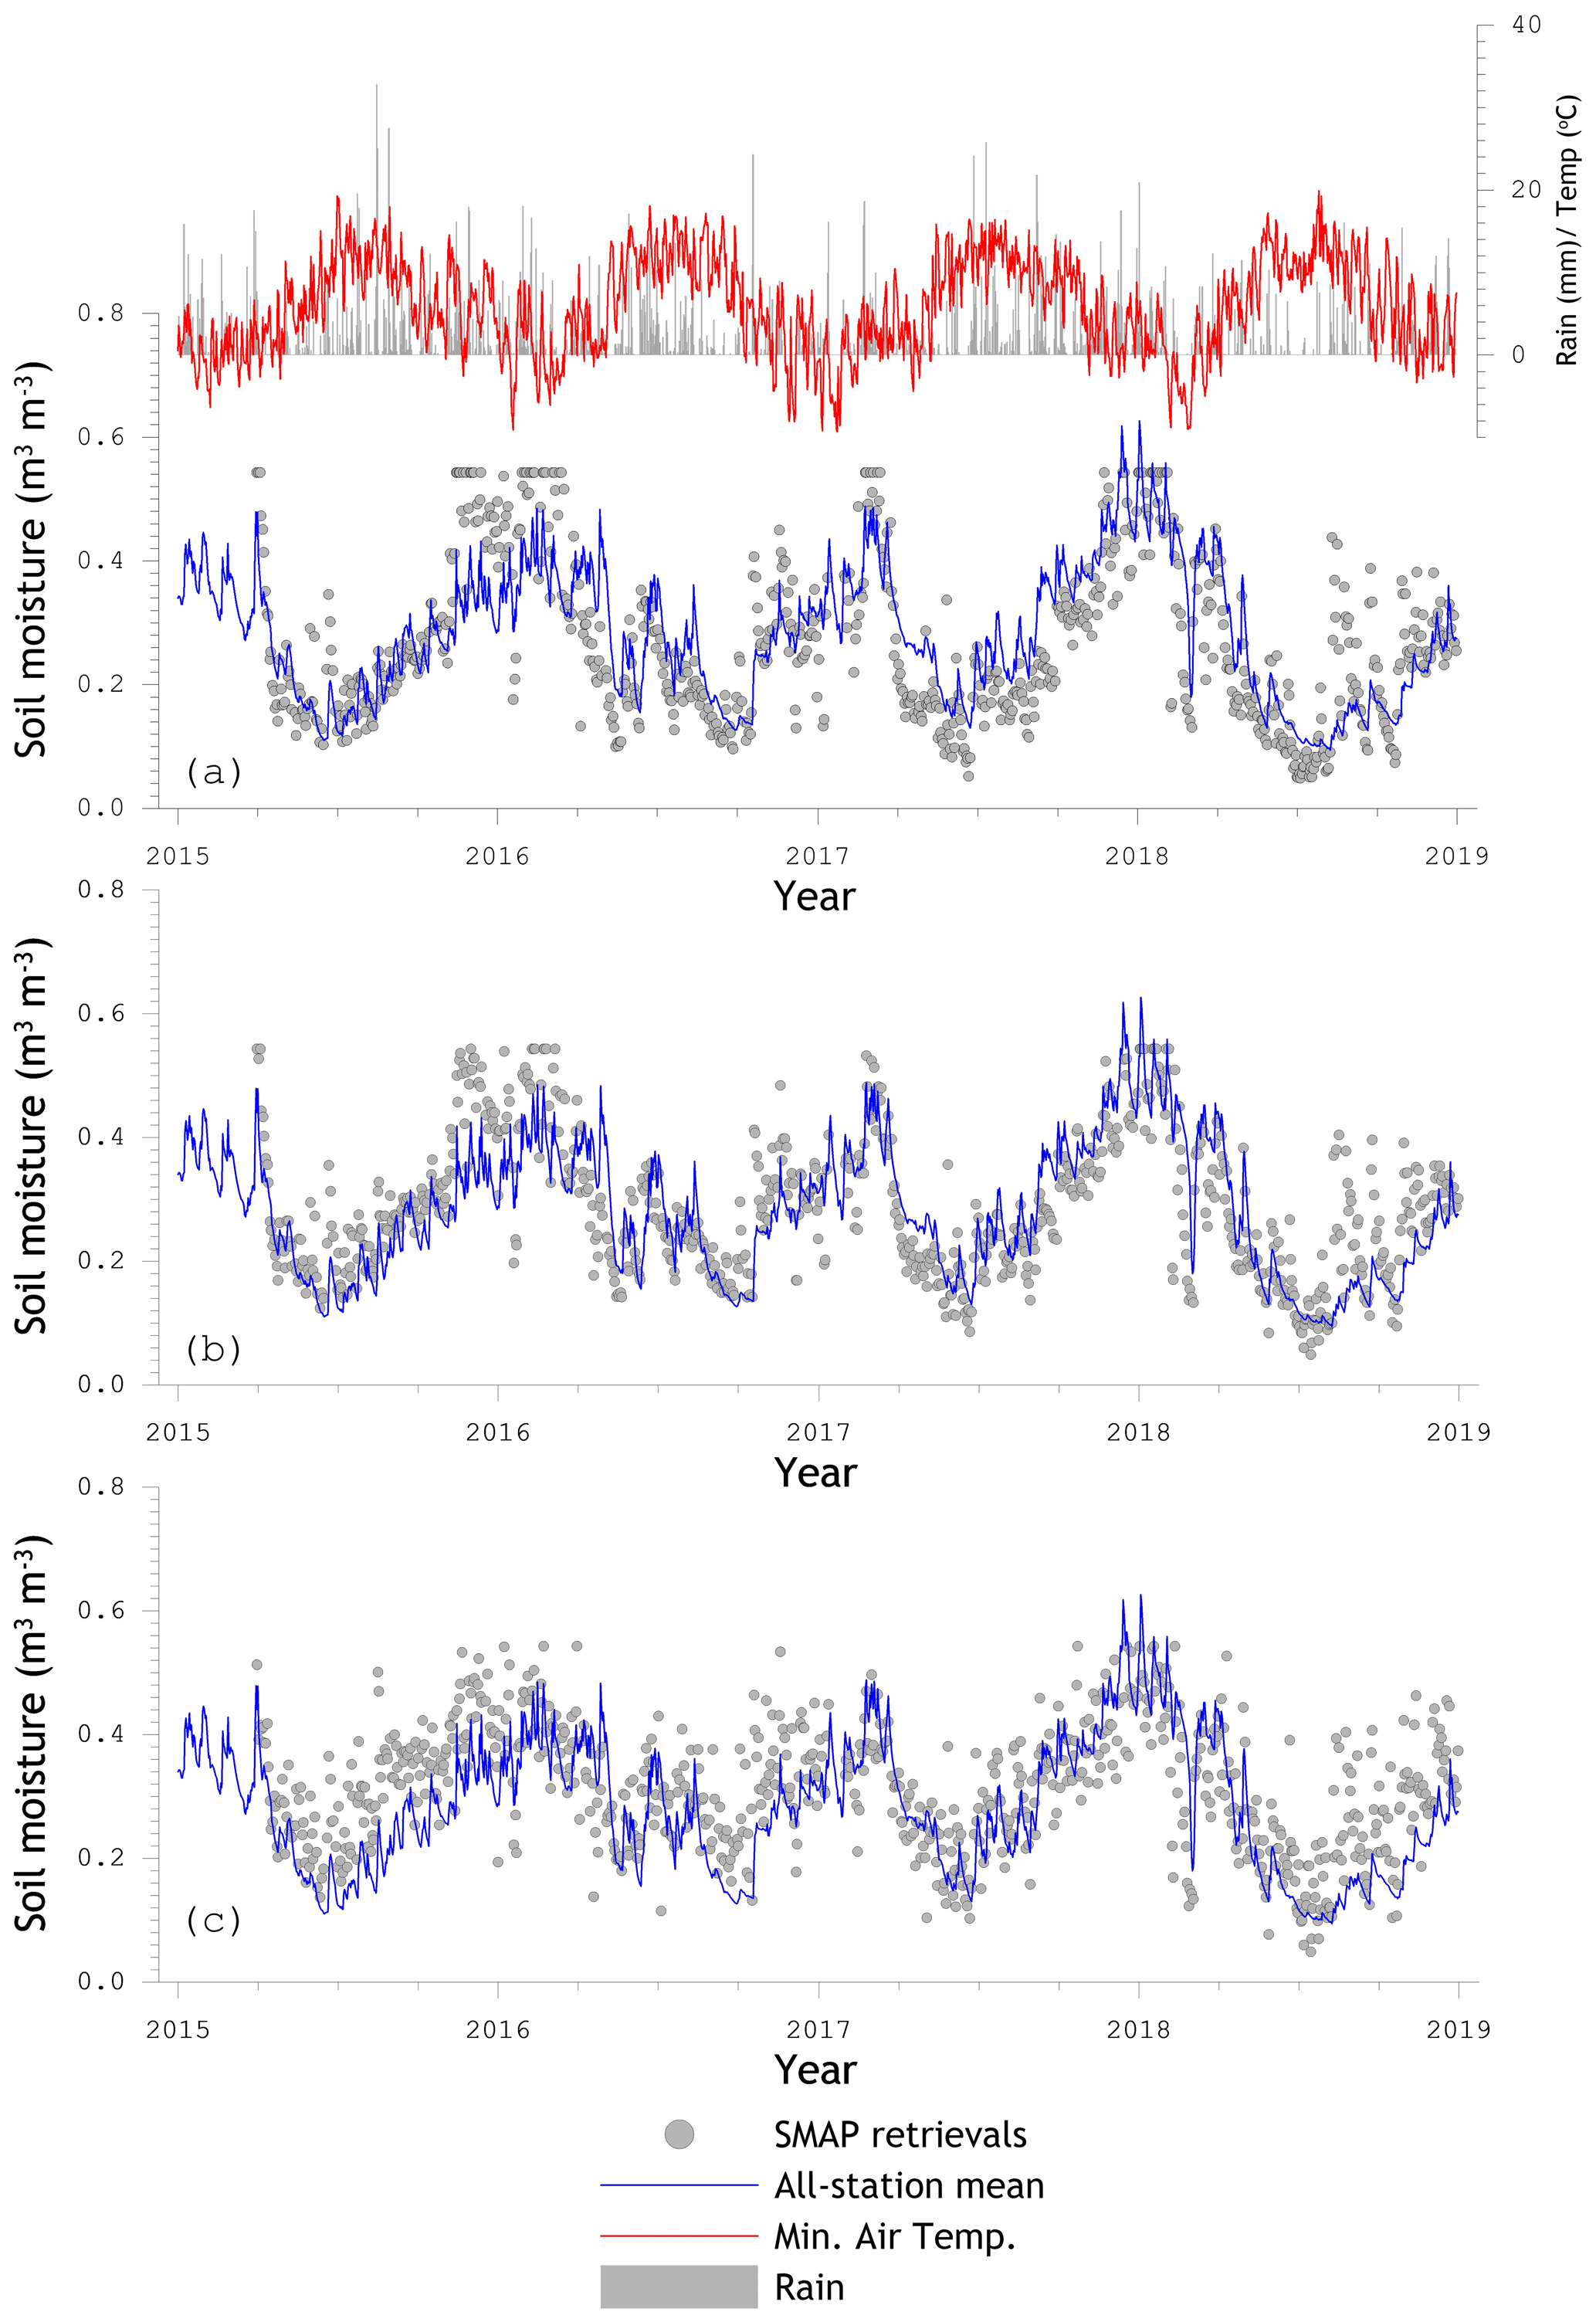
Figure 8Time series of daily minimum air temperature, daily rainfall sums, all-station mean soil moisture, and SMAP retrievals for reference pixel 3606 and the (a) Single Channel Algorithm at H polarization (SCA-H), the (b) Single Channel Algorithm at V polarization (SCA-V), and the (c) Dual Channel Algorithm (DCA).
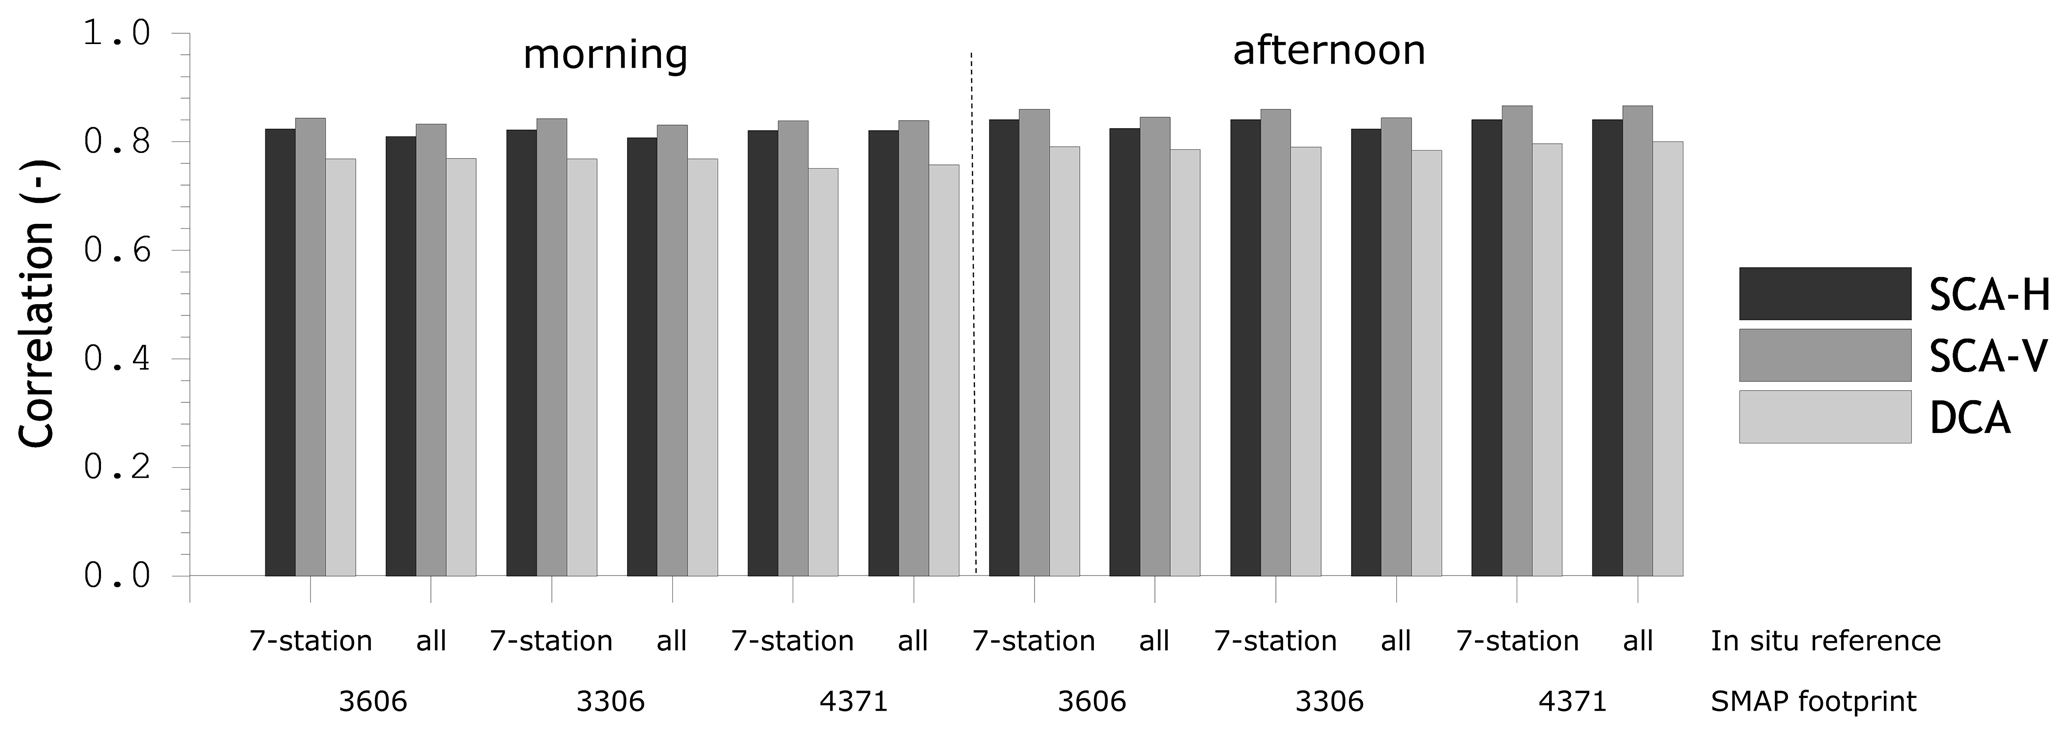
Figure 9Pearson product moment correlation coefficient computed between SMAP soil moisture and in situ references.
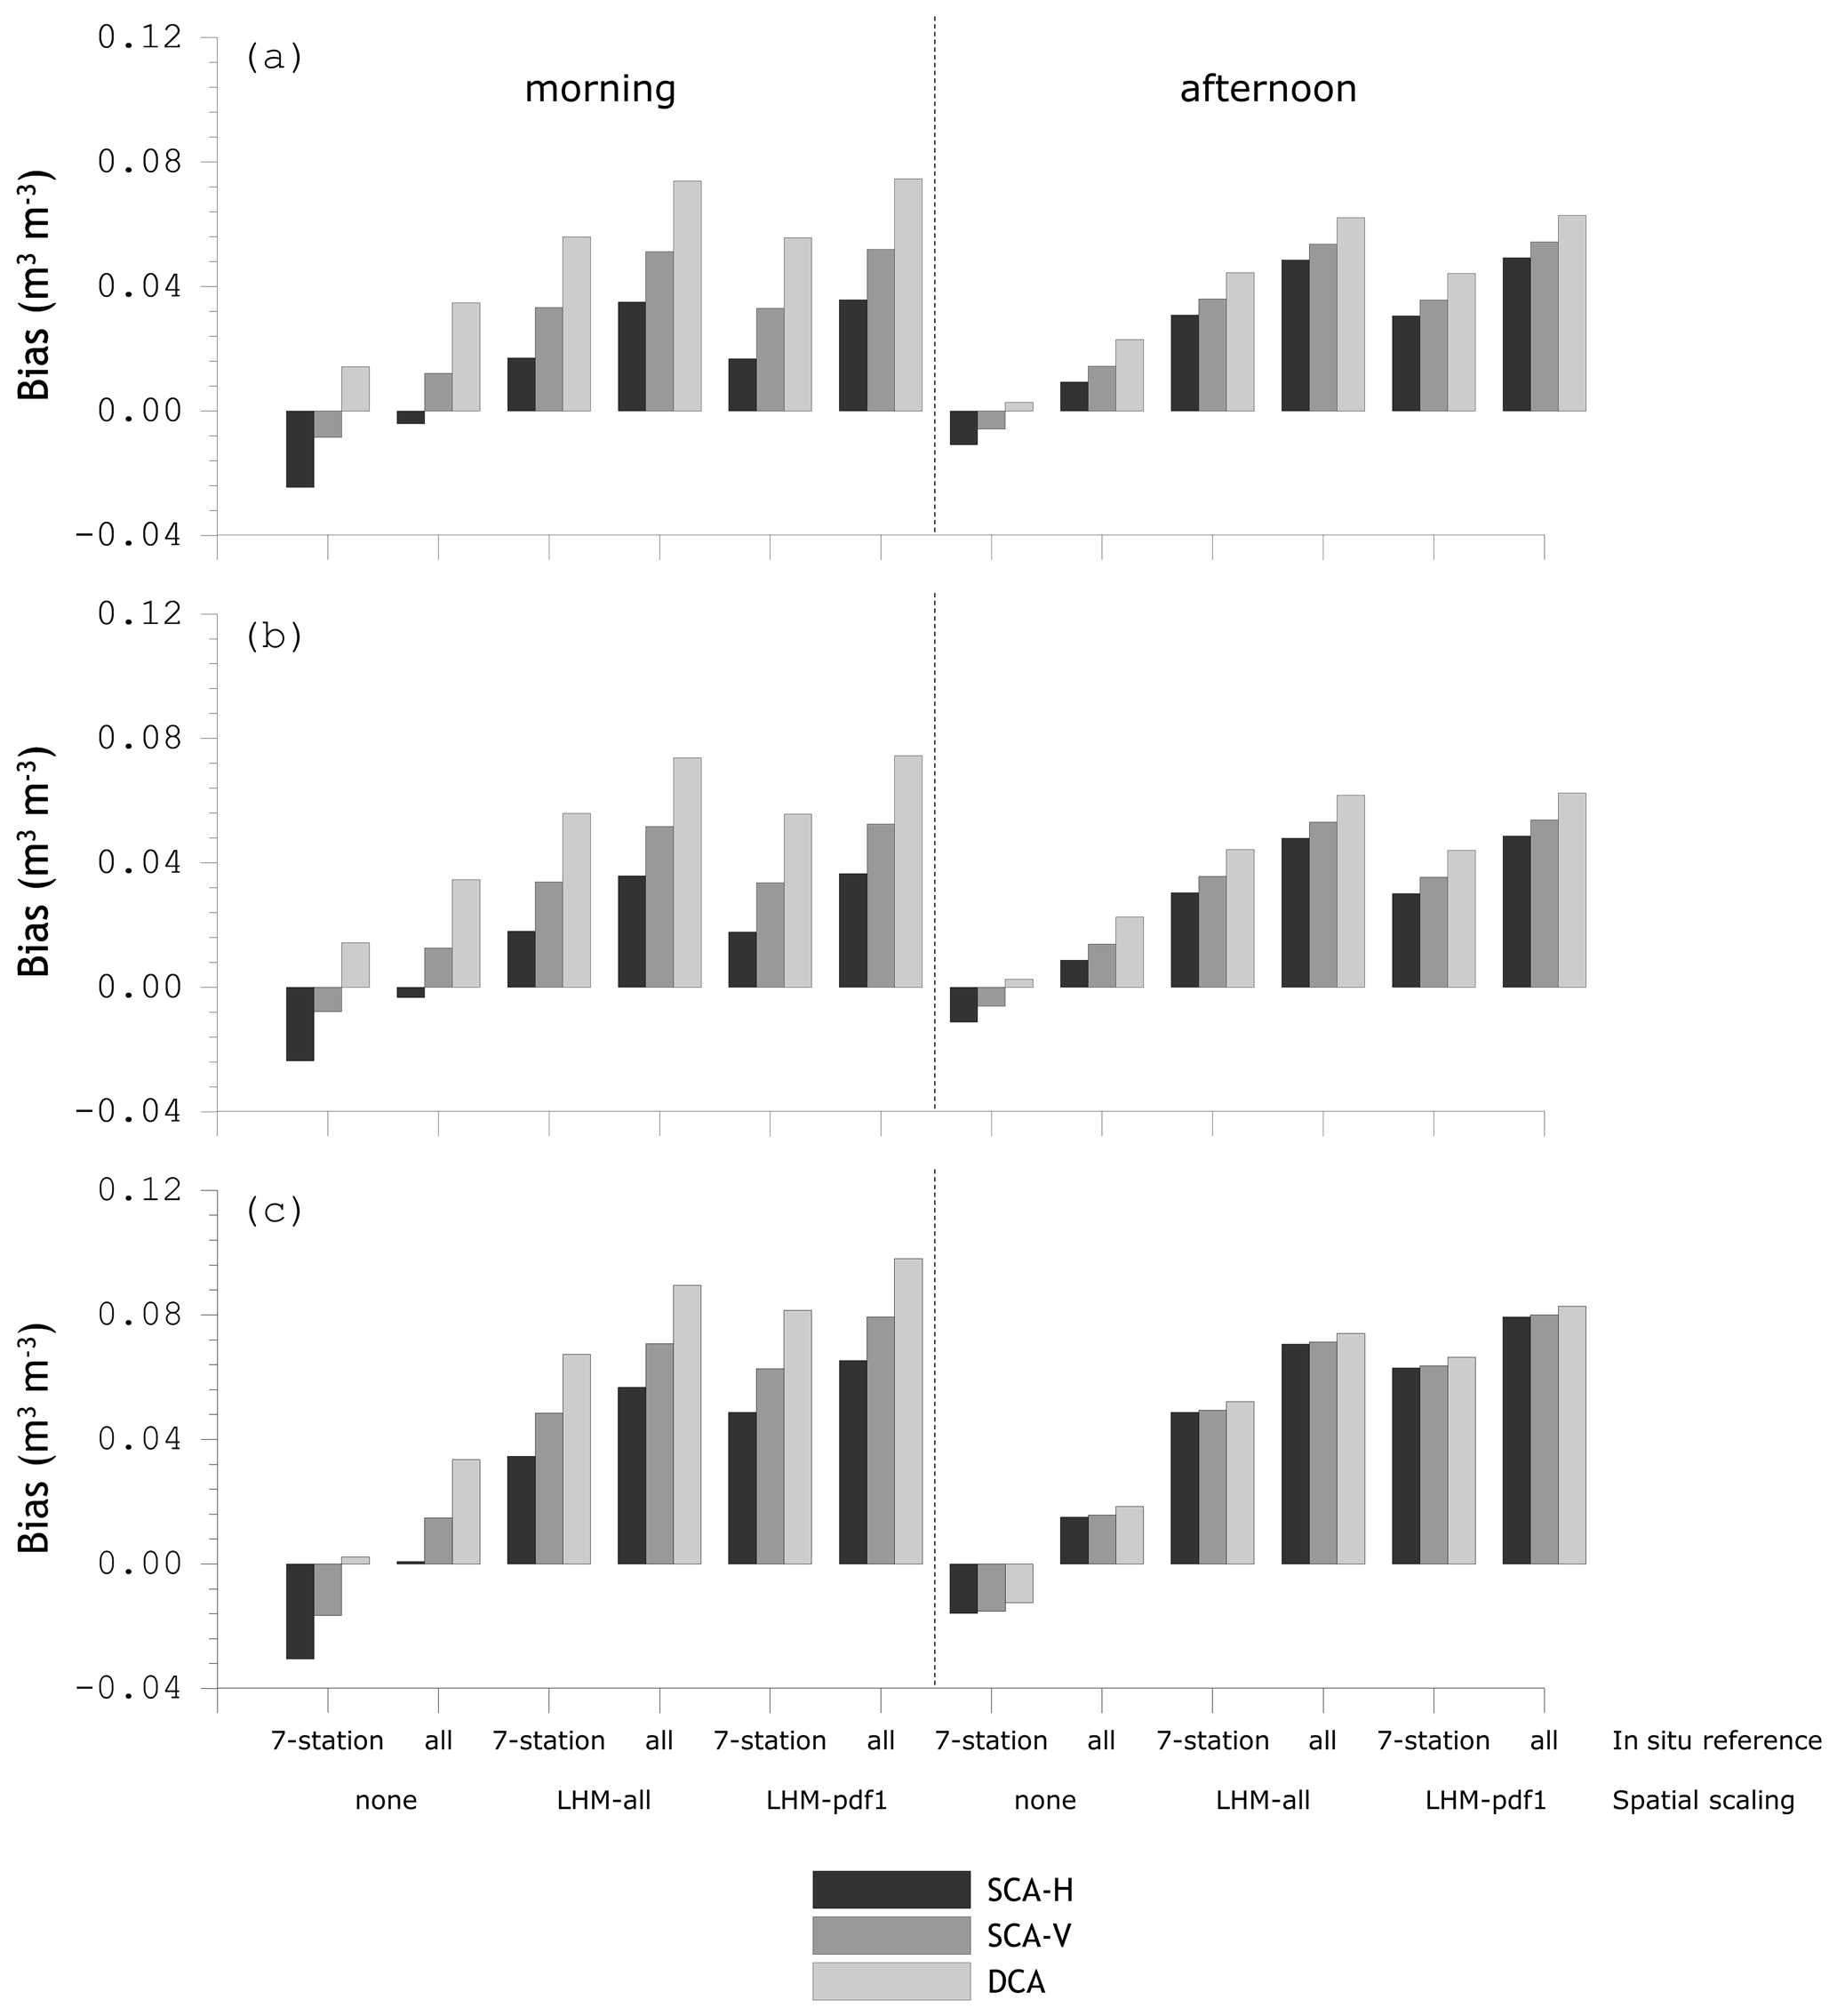
Figure 10Bias computed between SMAP soil moisture retrieved and in situ references; (a) the metrics for reference pixel 3306, (b) for reference pixel 3606, and (c) for reference pixel 4371.
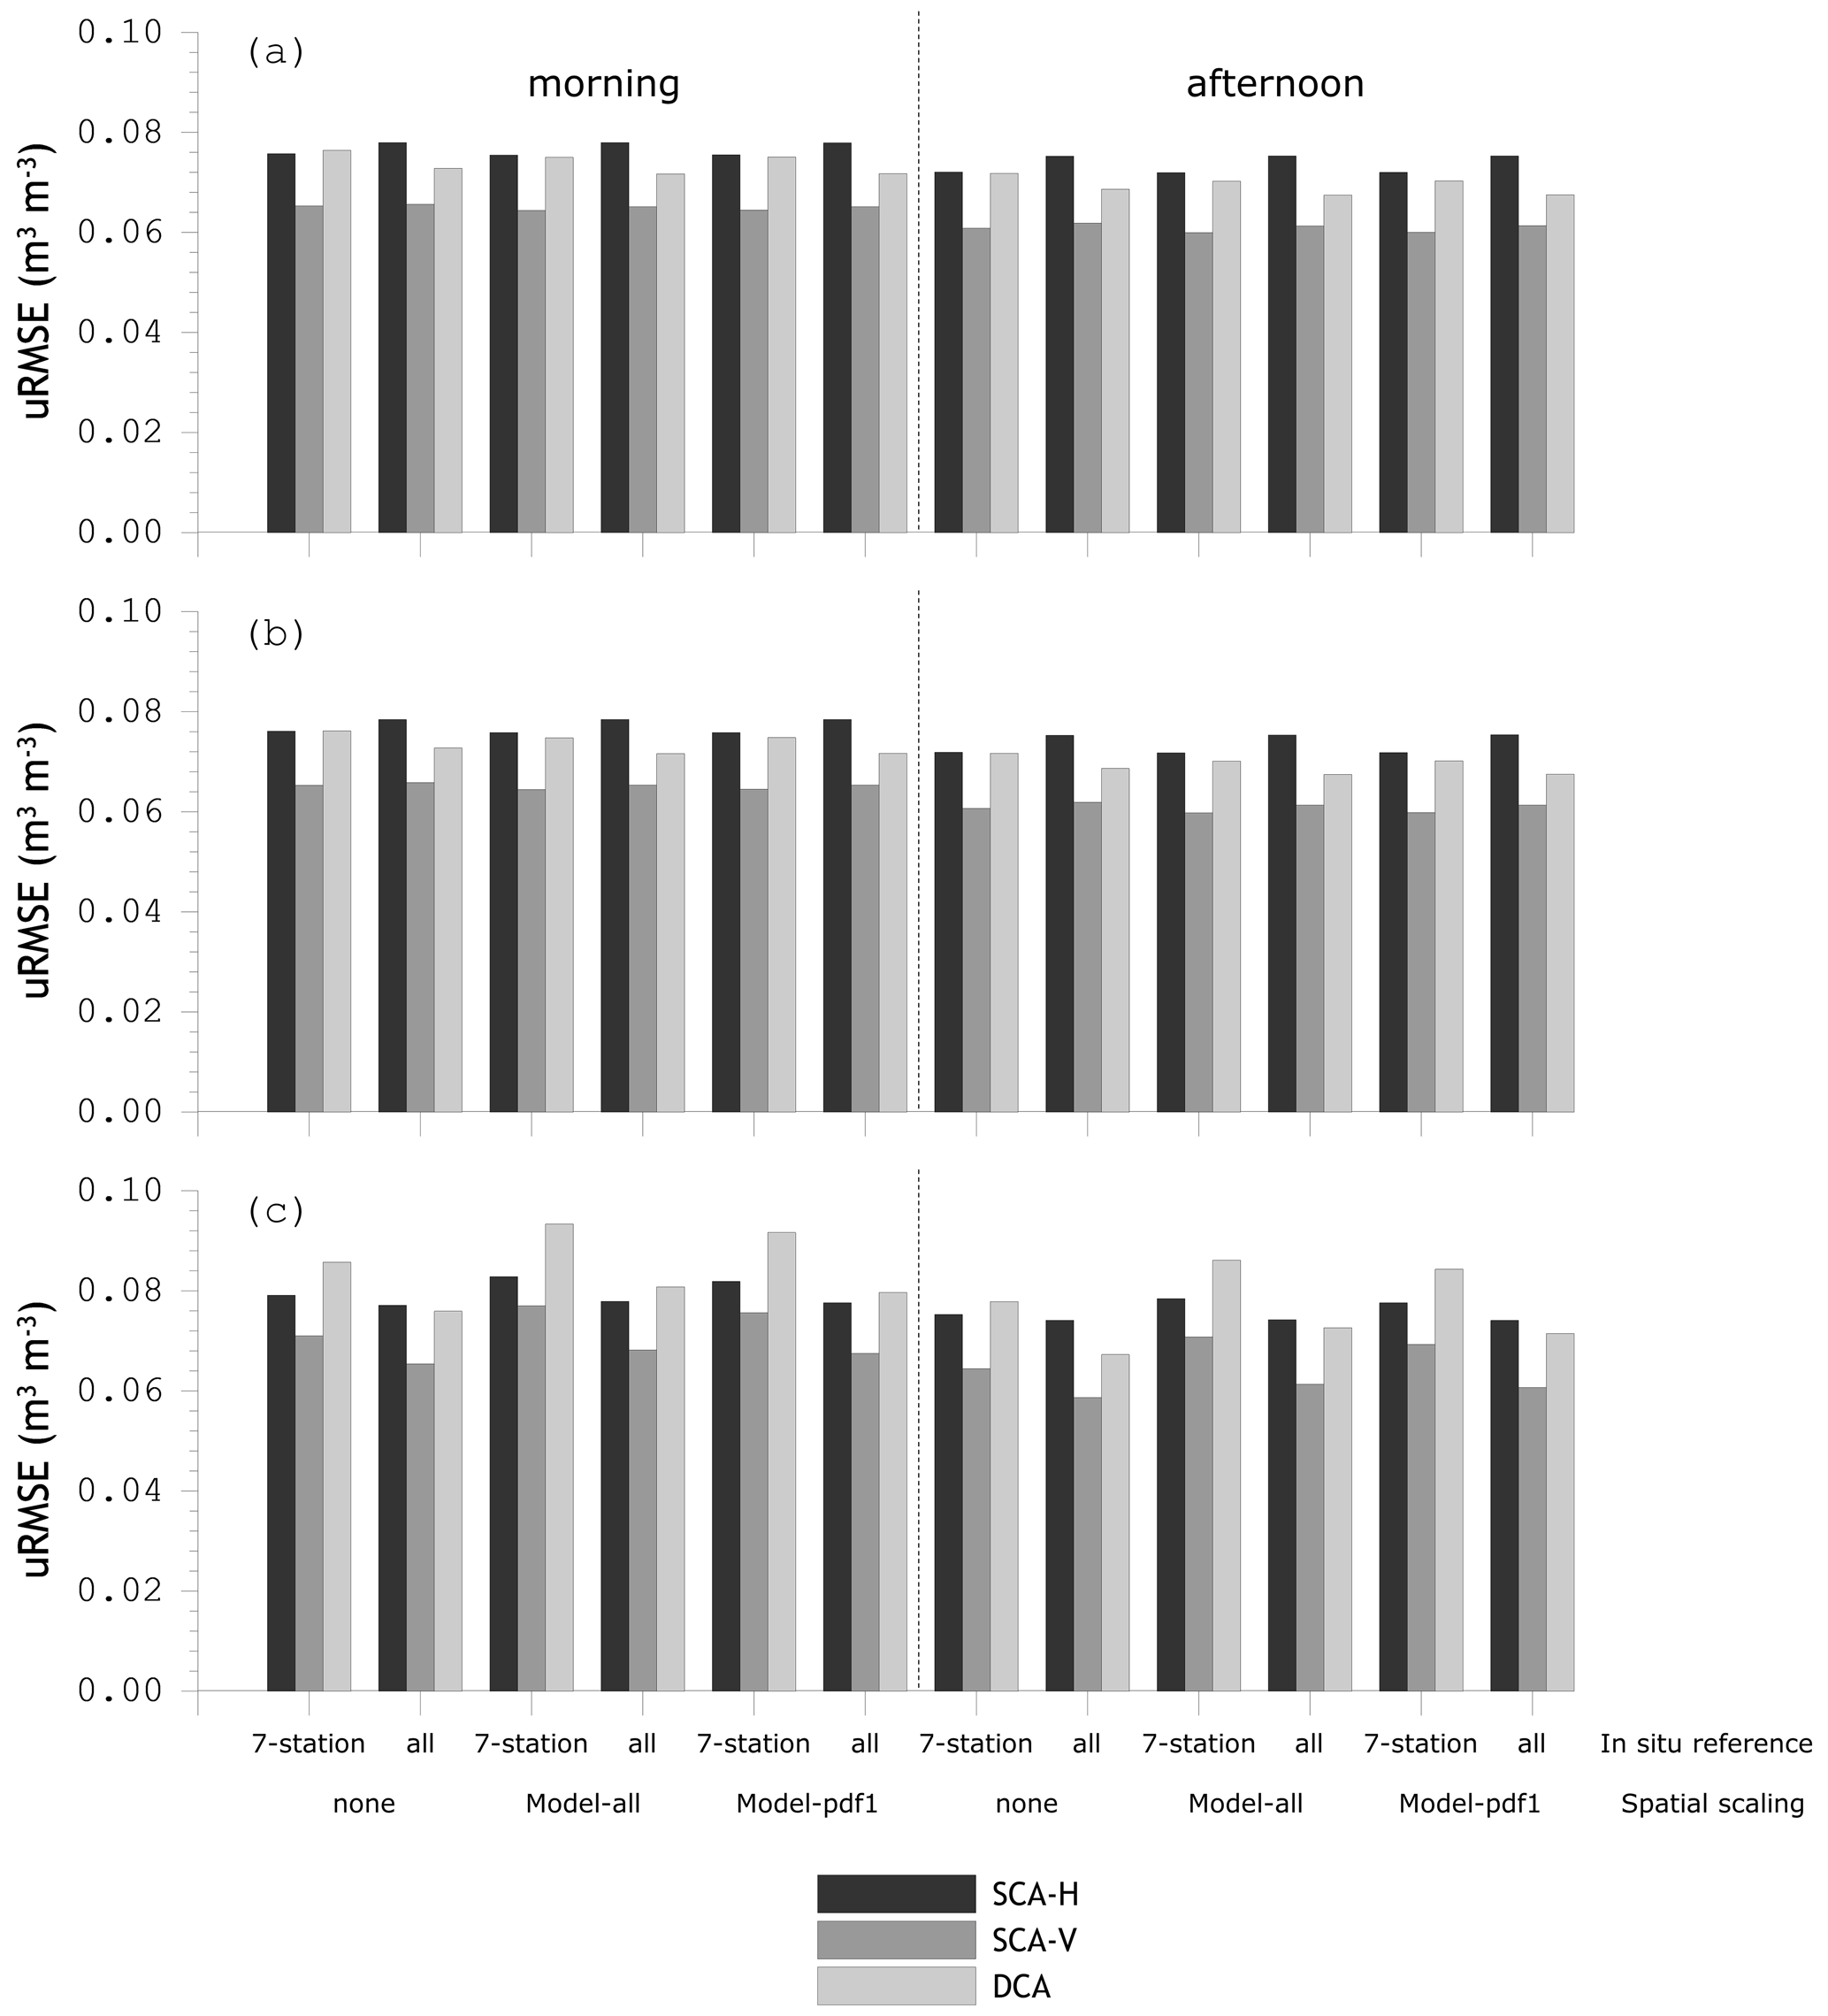
Figure 11Unbiased root mean squared error (uRMSE) computed between SMAP soil moisture retrieved and in situ references; (a) the metrics for reference pixel 3306, (b) for reference pixel 3606, and (c) for reference pixel 4371.
The overall results of the assessment represented by the error metrics and scatter plots are in line with the previous validation reports by the SMAP validation team (e.g. Chan et al., 2016, 2018; Colliander et al., 2018). The soil moisture retrieved with the SCA-V yields consistently better r and uRMSE than the estimates with the SCA-H and DCA. The DCA matchups have a larger spread, with an average r of 0.764, than found for the SCA-V and SCA-H, with an average r of 0.838 and 0.818, respectively. The SCA-H performs slightly less than SCA-V in terms of r, and this lower performance is comparable to the one found for the DCA in terms of uRMSE. This is attributable to a more frequent saturation of the SCA-H estimates, which is particularly clear from the scatter plots for the afternoon overpasses; see Fig. 12a.iii and a.iv. As the assumption of vertically uniform temperature and dielectric profiles is generally considered to have a higher validity near dawn (O'Neill et al., 2018), it was unexpected that the error metrics are consistently in favour of the afternoon over the morning matchups. On the other hand, Jackson et al. (2012) also found better agreement between afternoon SMOS retrievals and in situ measurements. This is further discussed in Sect. 7.2.
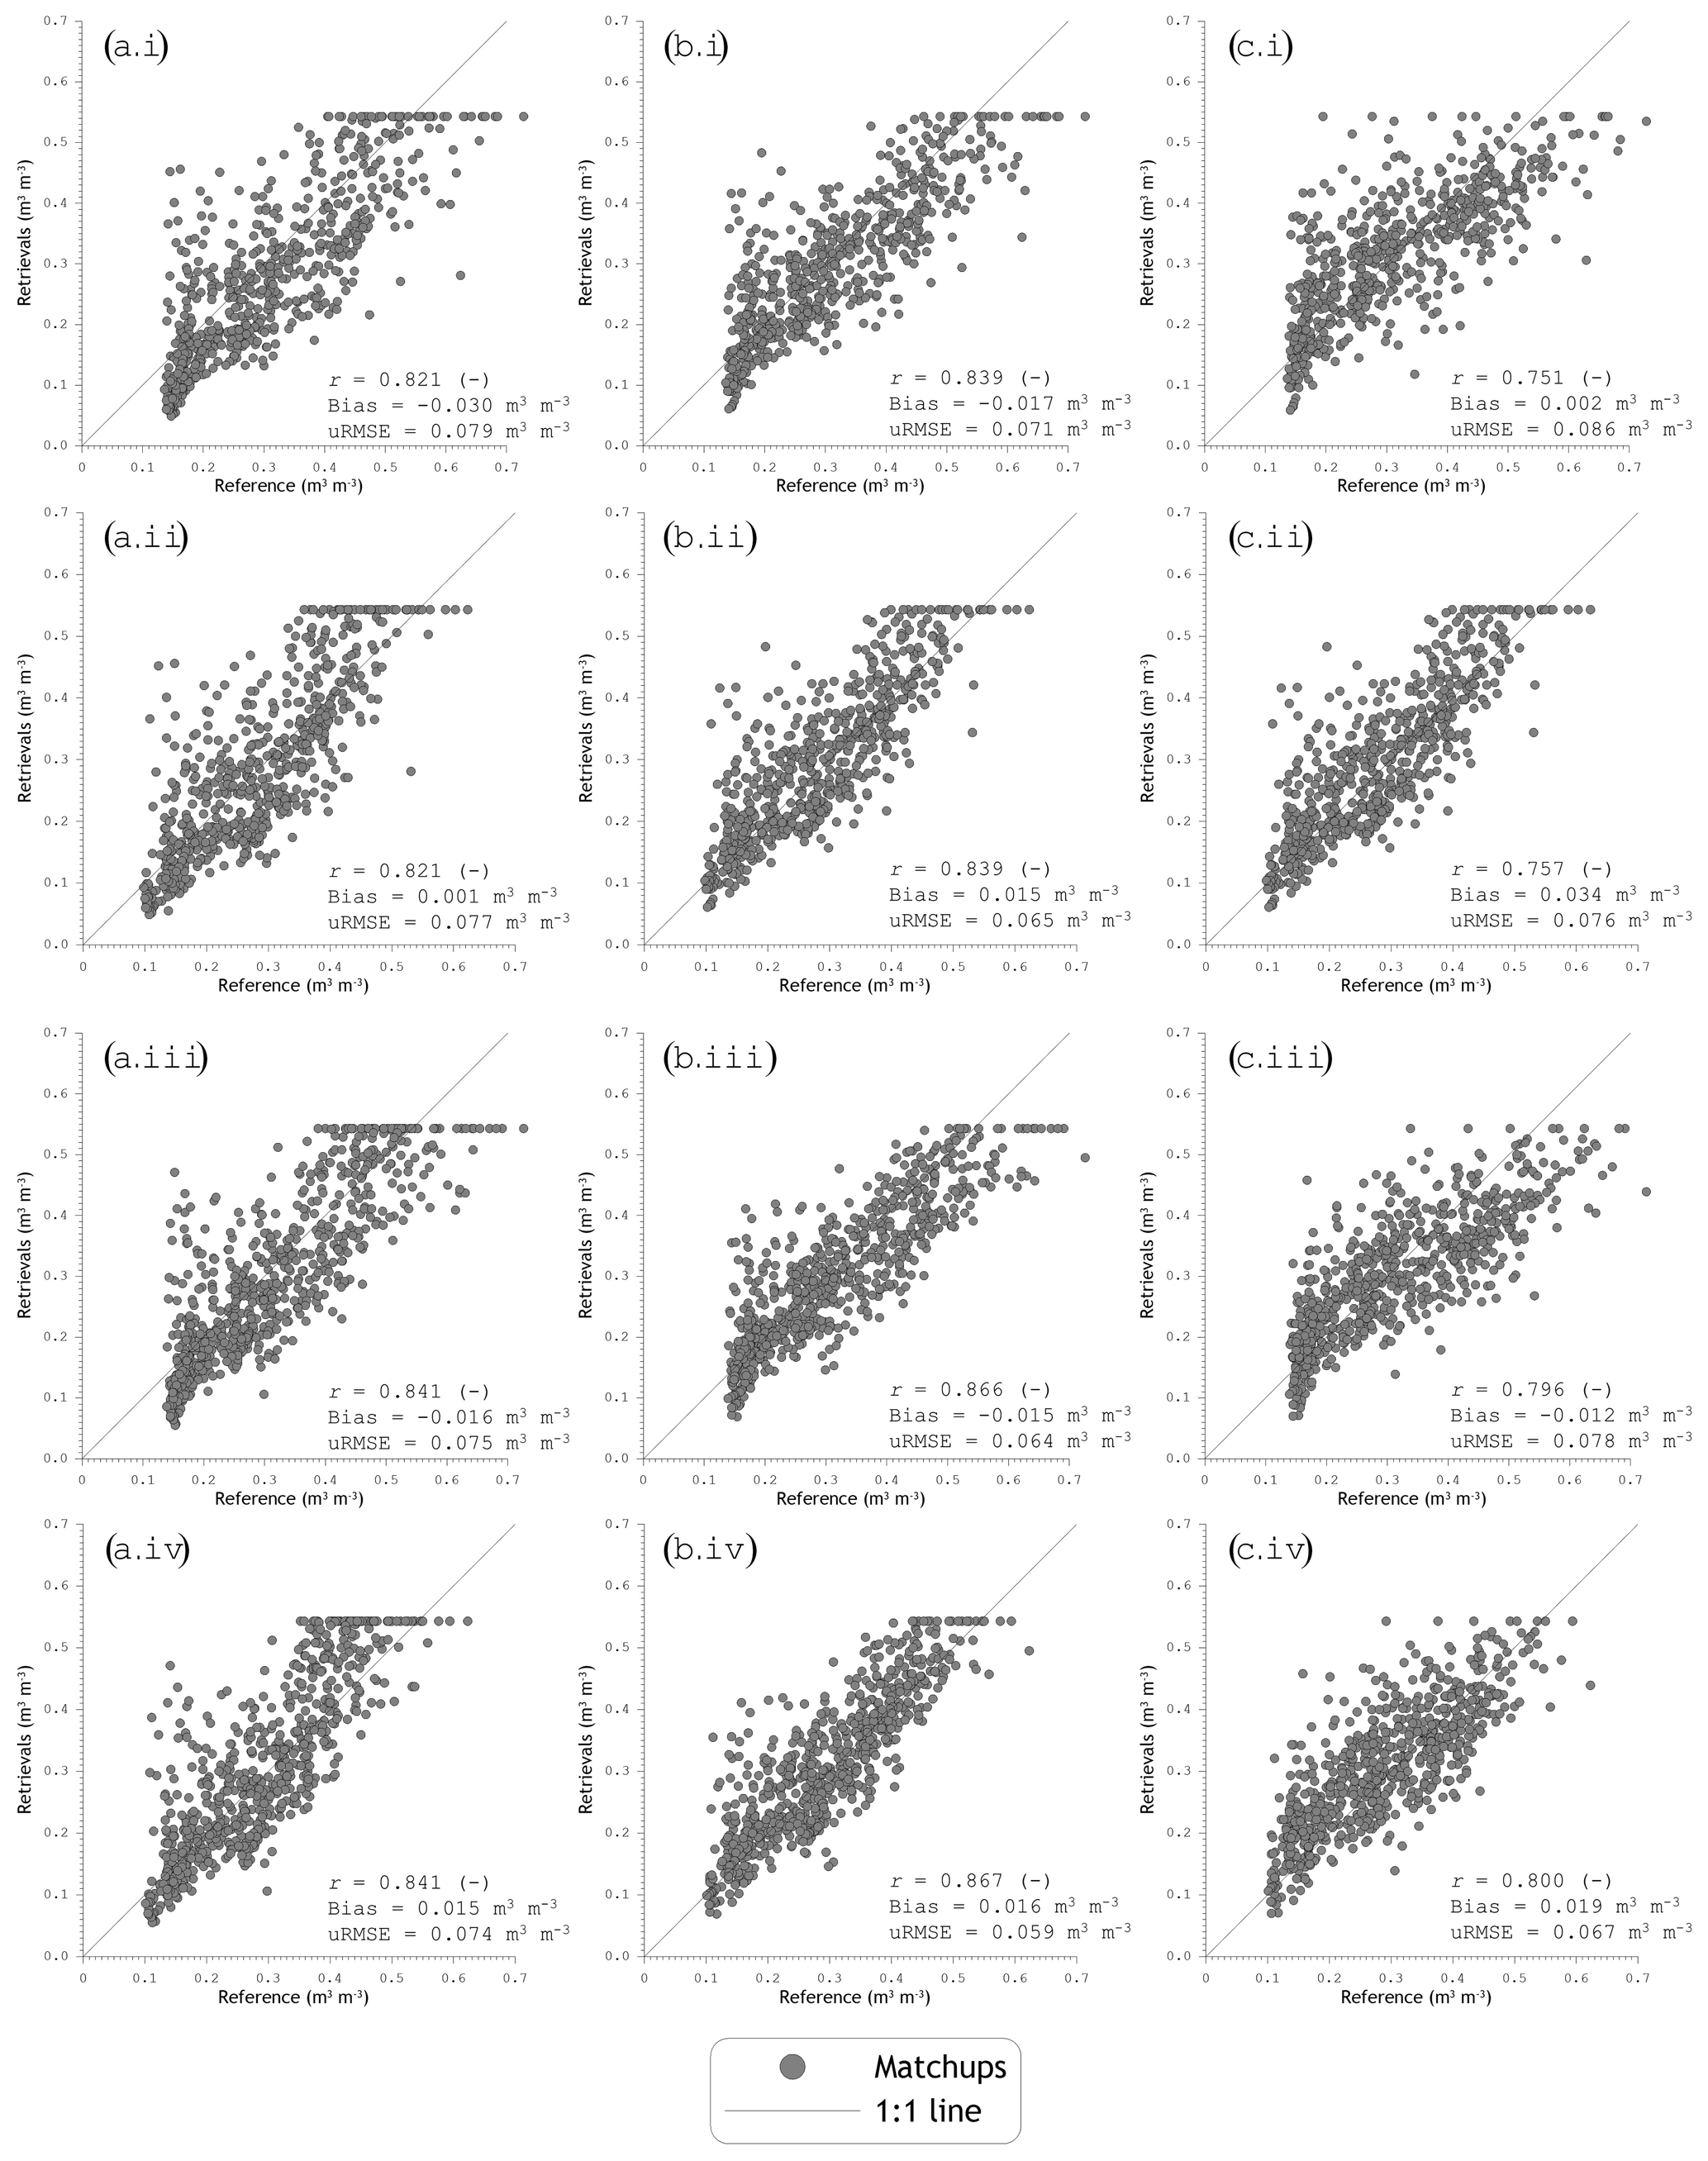
Figure 12Scatter plots of SMAP soil moisture retrievals for reference pixel 4371 versus in situ references available from April 2015 till December 2018. Panels (a), (b), and (c) indicate SMAP estimates derived using SCA-H, SCA-V, and DCA, respectively; (i) and (ii) are for SMAP's morning overpass, and (iii) and (iv) are for the afternoon overpasses; (i) and (iii) include references based on the unbiased seven-station mean soil moisture, and (ii) and (iv) use the all-station mean as a reference.
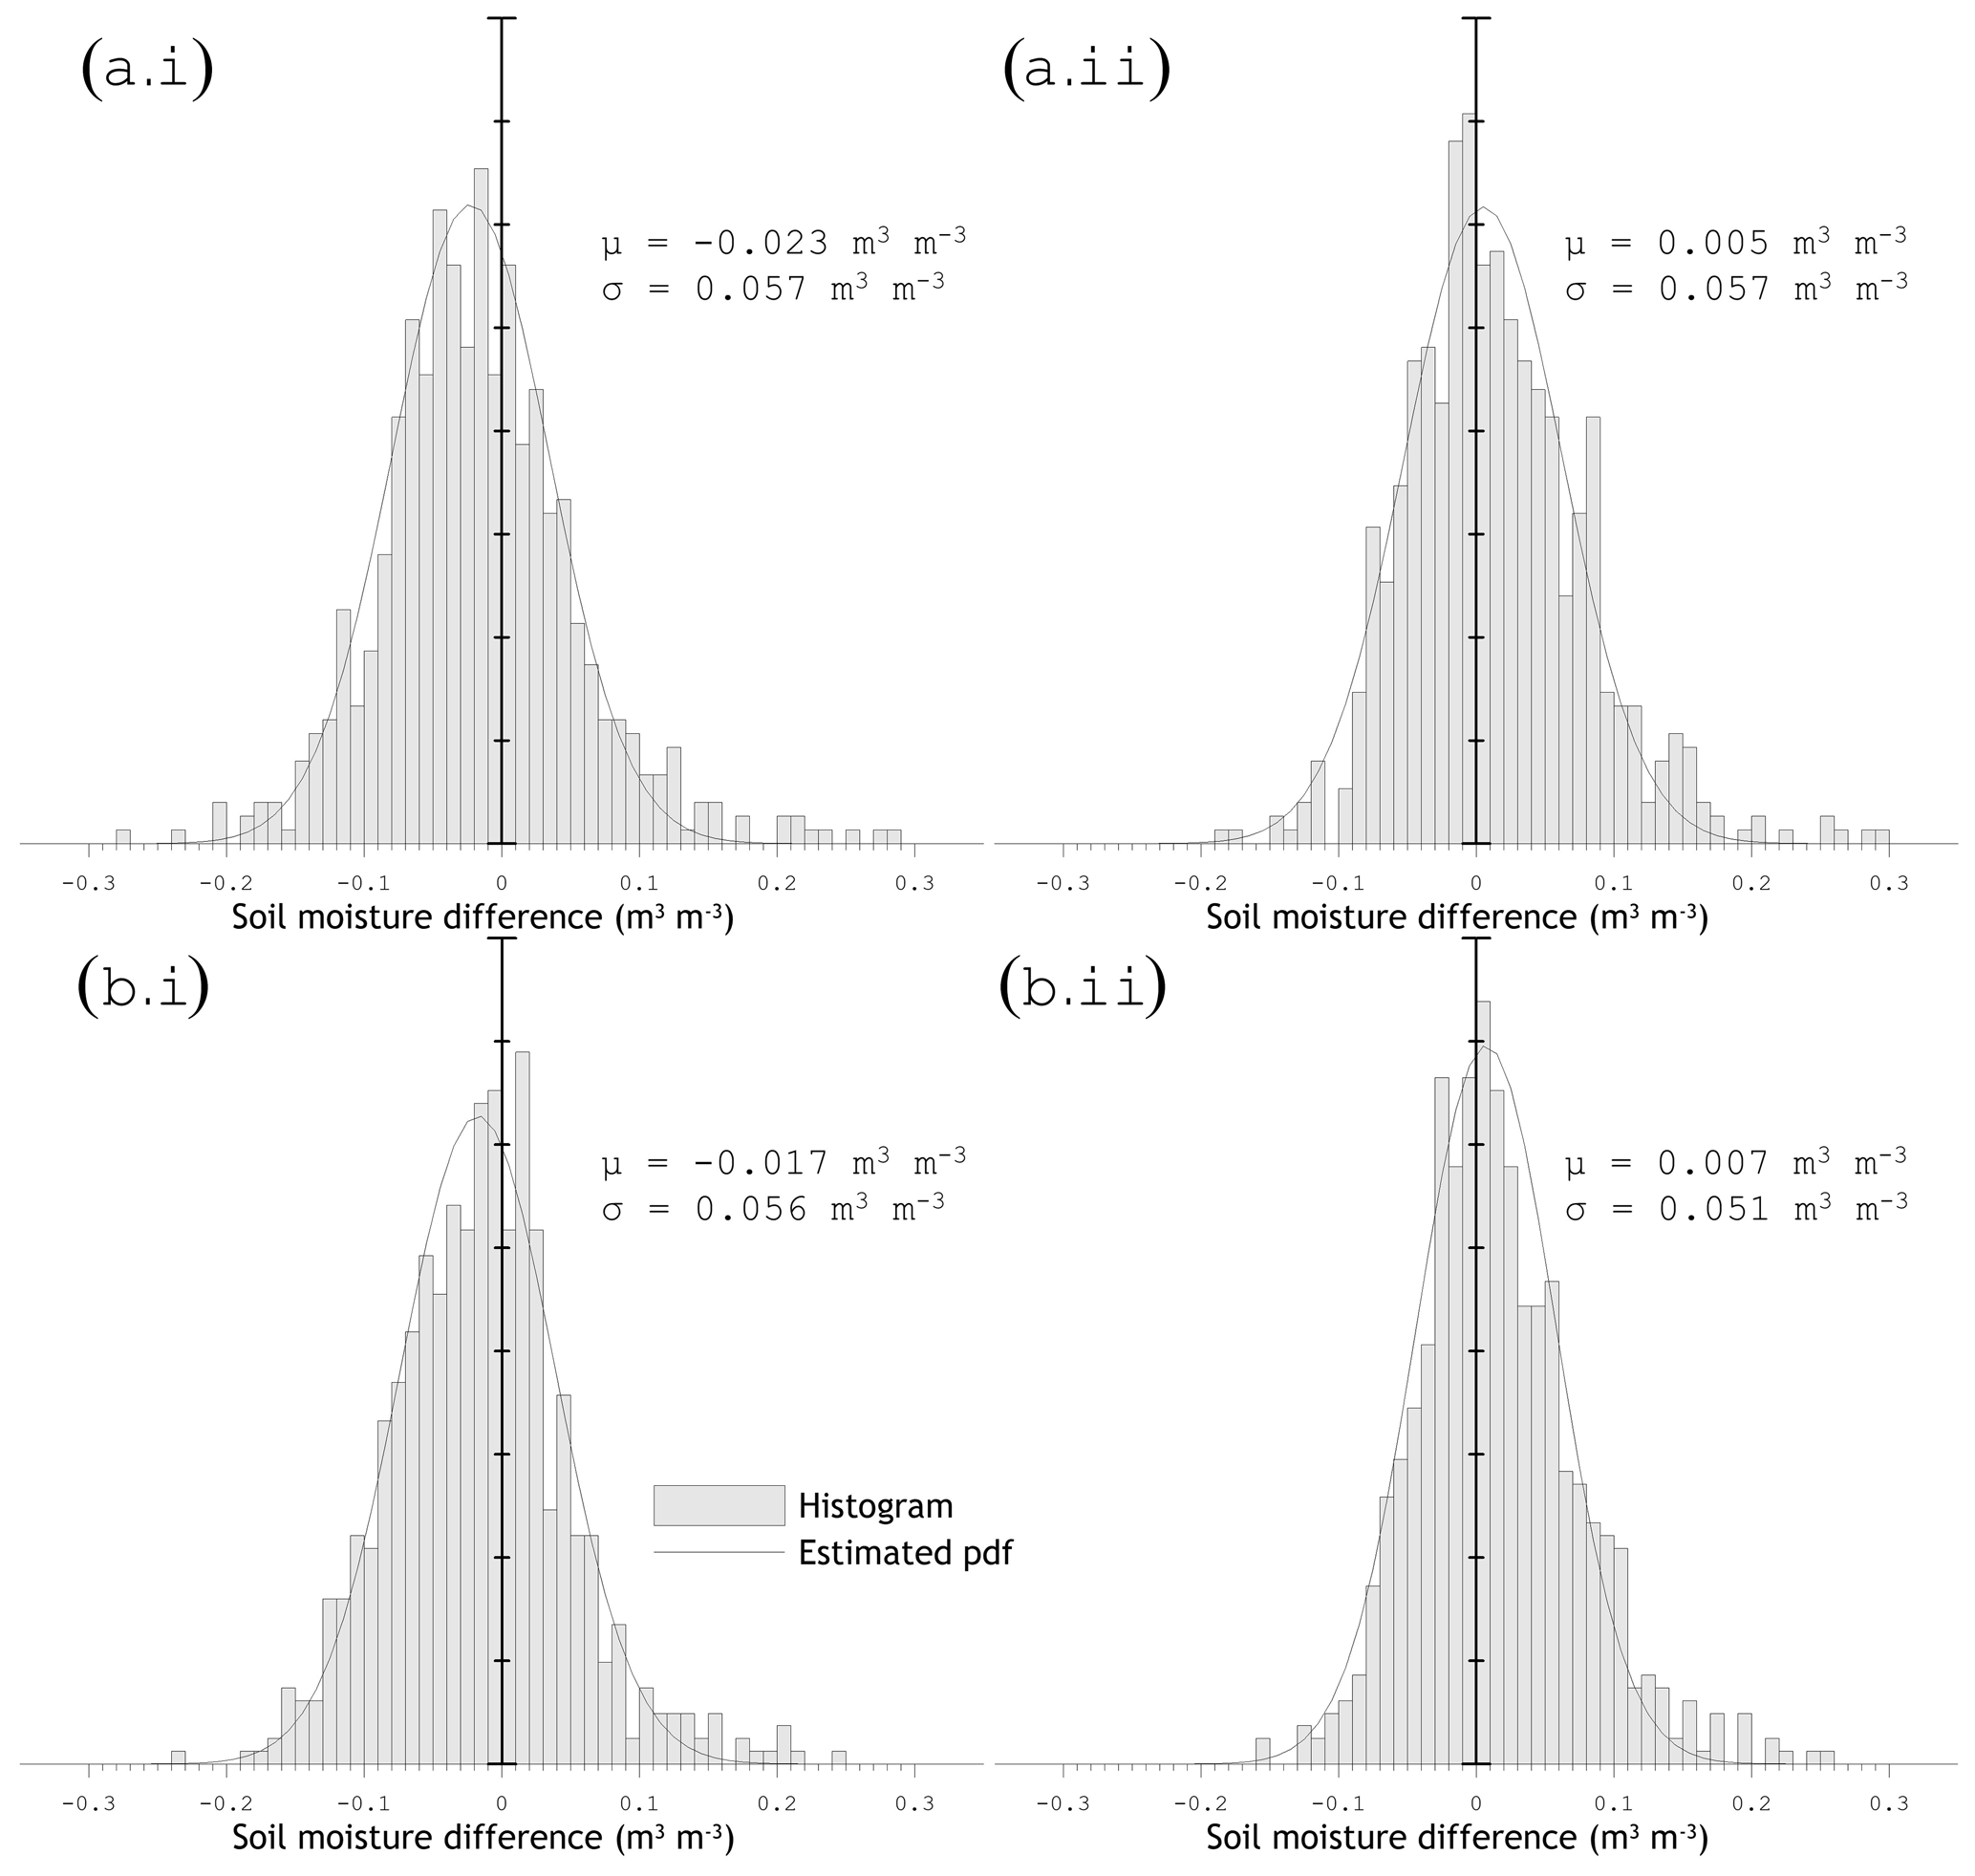
Figure 13Histograms constructed from the differences between the SMAP SCA-V retrievals for reference pixel 4371 versus in situ references, and probability distribution functions (pdfs) obtained by fitting the mean (μ) and standard deviation (σ); panel (a) uses the data from SMAP morning overpasses and panel (b) the SMAP afternoon overpasses; (i) includes the unbiased seven-station mean as a reference, and (ii) includes the all-station mean as a reference.
With regard to the different implementations of the upscaling strategy, it is clear that the largest impact is found for the bias (Fig. 10), and only a minor effect can be noted across the uRMSEs (Fig. 11). Moreover, the upscaling strategy affects the bias negatively; the biases are larger when the SMAP estimates are assessed against the upscaled in situ references. This is partly because the bias of the SMAP soil moisture towards native in situ references is already fairly small and the application of the upscaling method apparently only adds uncertainty. An alternative way to interpret this is that the collection of stations within the Twente network represents the spatial mean soil moisture observed by SMAP fairly well. This is supported by the small differences in the error metrics computed with the unbiased seven-station and all-station soil moisture means for reference pixels 3306 and 3606. This also applies to a lesser extent to reference pixel 4371, for which the uRMSE computed with the all-station mean as a reference is on average more than 0.005 m3 m−3 lower than when the unbiased seven-station mean is used. A possible explanation for this difference in performance is the number of stations present within the reference pixels. For pixels 3306 and 3606, soil moisture data from on average 11.0 stations contribute to the all-station mean; for pixel 4371 this is 13.7. The latter has almost twice as many spatially distributed measurements in comparison to those used for the unbiased seven-station mean. A large number of independent measurements implies that the inherent measurement uncertainty (see Sect. 2.2) contribution to the total uncertainty of the spatial mean reduces.
Despite all efforts to construct a reliable spatial mean and upscale the collection of point measurements towards the domain of the SMAP reference pixel, it is unfortunate to have to conclude that the accuracy requirement of 0.04 m3 m−3 (uRMSE) is not met using the in situ references derived from the Twente measurements. An important factor contributing to the large uRMSEs is that in Twente soil moisture measurements cover the full dynamic range from saturated to dry soil. This makes it more challenging to meet the uRMSE requirement in comparison to regions with a naturally small soil moisture range, as is the case in arid regions for instance. The best performance with the Twente in situ reference is achieved when the SCA-V estimates of pixel 4371 are assessed against the native all-station, resulting in an uRMSE of 0.059 m3 m−3. This is larger than the 0.054 and 0.056 m3 m−3 uRMSEs reported in Colliander et al. (2017) and Chan et al. (2018) using matchups constructed from the 2015 and 2016 measurements. It should, however, be noted that in this paper we have analysed the period from April 2015 up to December 2018, during which in 2018 record dry conditions were encountered. Under those circumstances the vertical soil moisture gradients are strong, which may add to the disparity between soil moisture measured in situ and estimated via SMAP observations. In the discussion section the error structure and the conditions leading to larger uRMSE will be analysed in more detail.
7.1 Error distribution
The error metrics reported in Sect. 6.2 indicate that none of the SMAP products fulfills the uRMSE target accuracy using the Twente measurements. Yet the time series of the SMAP estimates and the in situ references in Fig. 8 demonstrate an agreement that is up to the level that the effect of rain events on the soil moisture content can be identified. On the other hand, large mismatches between the SMAP estimates and in situ references are encountered on various occasions. Here, we investigate the overall error structure by constructing histograms from the differences between the SMAP estimates and in situ references shown in Fig. 13. Further, theoretical normal pdfs, Eq. (7b), are derived by fitting the μ and σ for each histogram. The histograms and pdfs are only provided for the SCA-V retrievals from pixel 4371, (a) morning and (b) afternoon, and with the native (i) unbiased seven-station and (ii) all-station means as references.
From a comparison of the histograms and pdfs it follows that the tails hold larger densities, whereby the number of overestimations is larger than the number of underestimations. This implies that the relatively large number of outliers inflates the “squared root”-based error metric, uRMSE, which is also supported by the lower magnitude of the σ fitted to the histograms. For instance, the lowest uRMSE of 0.059 m3 m−3 is found for the SCA-V 4371 afternoon estimates against the all-station mean, while the σ fitted through the histogram is 0.051 m3 m−3 for this case.
7.2 Mismatch occurrence
Outliers, e.g. large differences between the SMAP estimates and in situ references, are a more important cause of the larger uRMSEs than SMAP's target accuracy. Patterns in the occurrence of mismatches are highlighted in Fig. 14 via time series of unbiased differences between SMAP SCA-V 4371 estimates and the all-station mean exceeding twice the target accuracy, >0.08 m3 m−3. The results from SMAP's morning and afternoon overpasses are separated in the plot and the daily minimum air temperature (Tmin) and the all-station mean soil moisture are provided as a reference for the environmental conditions.
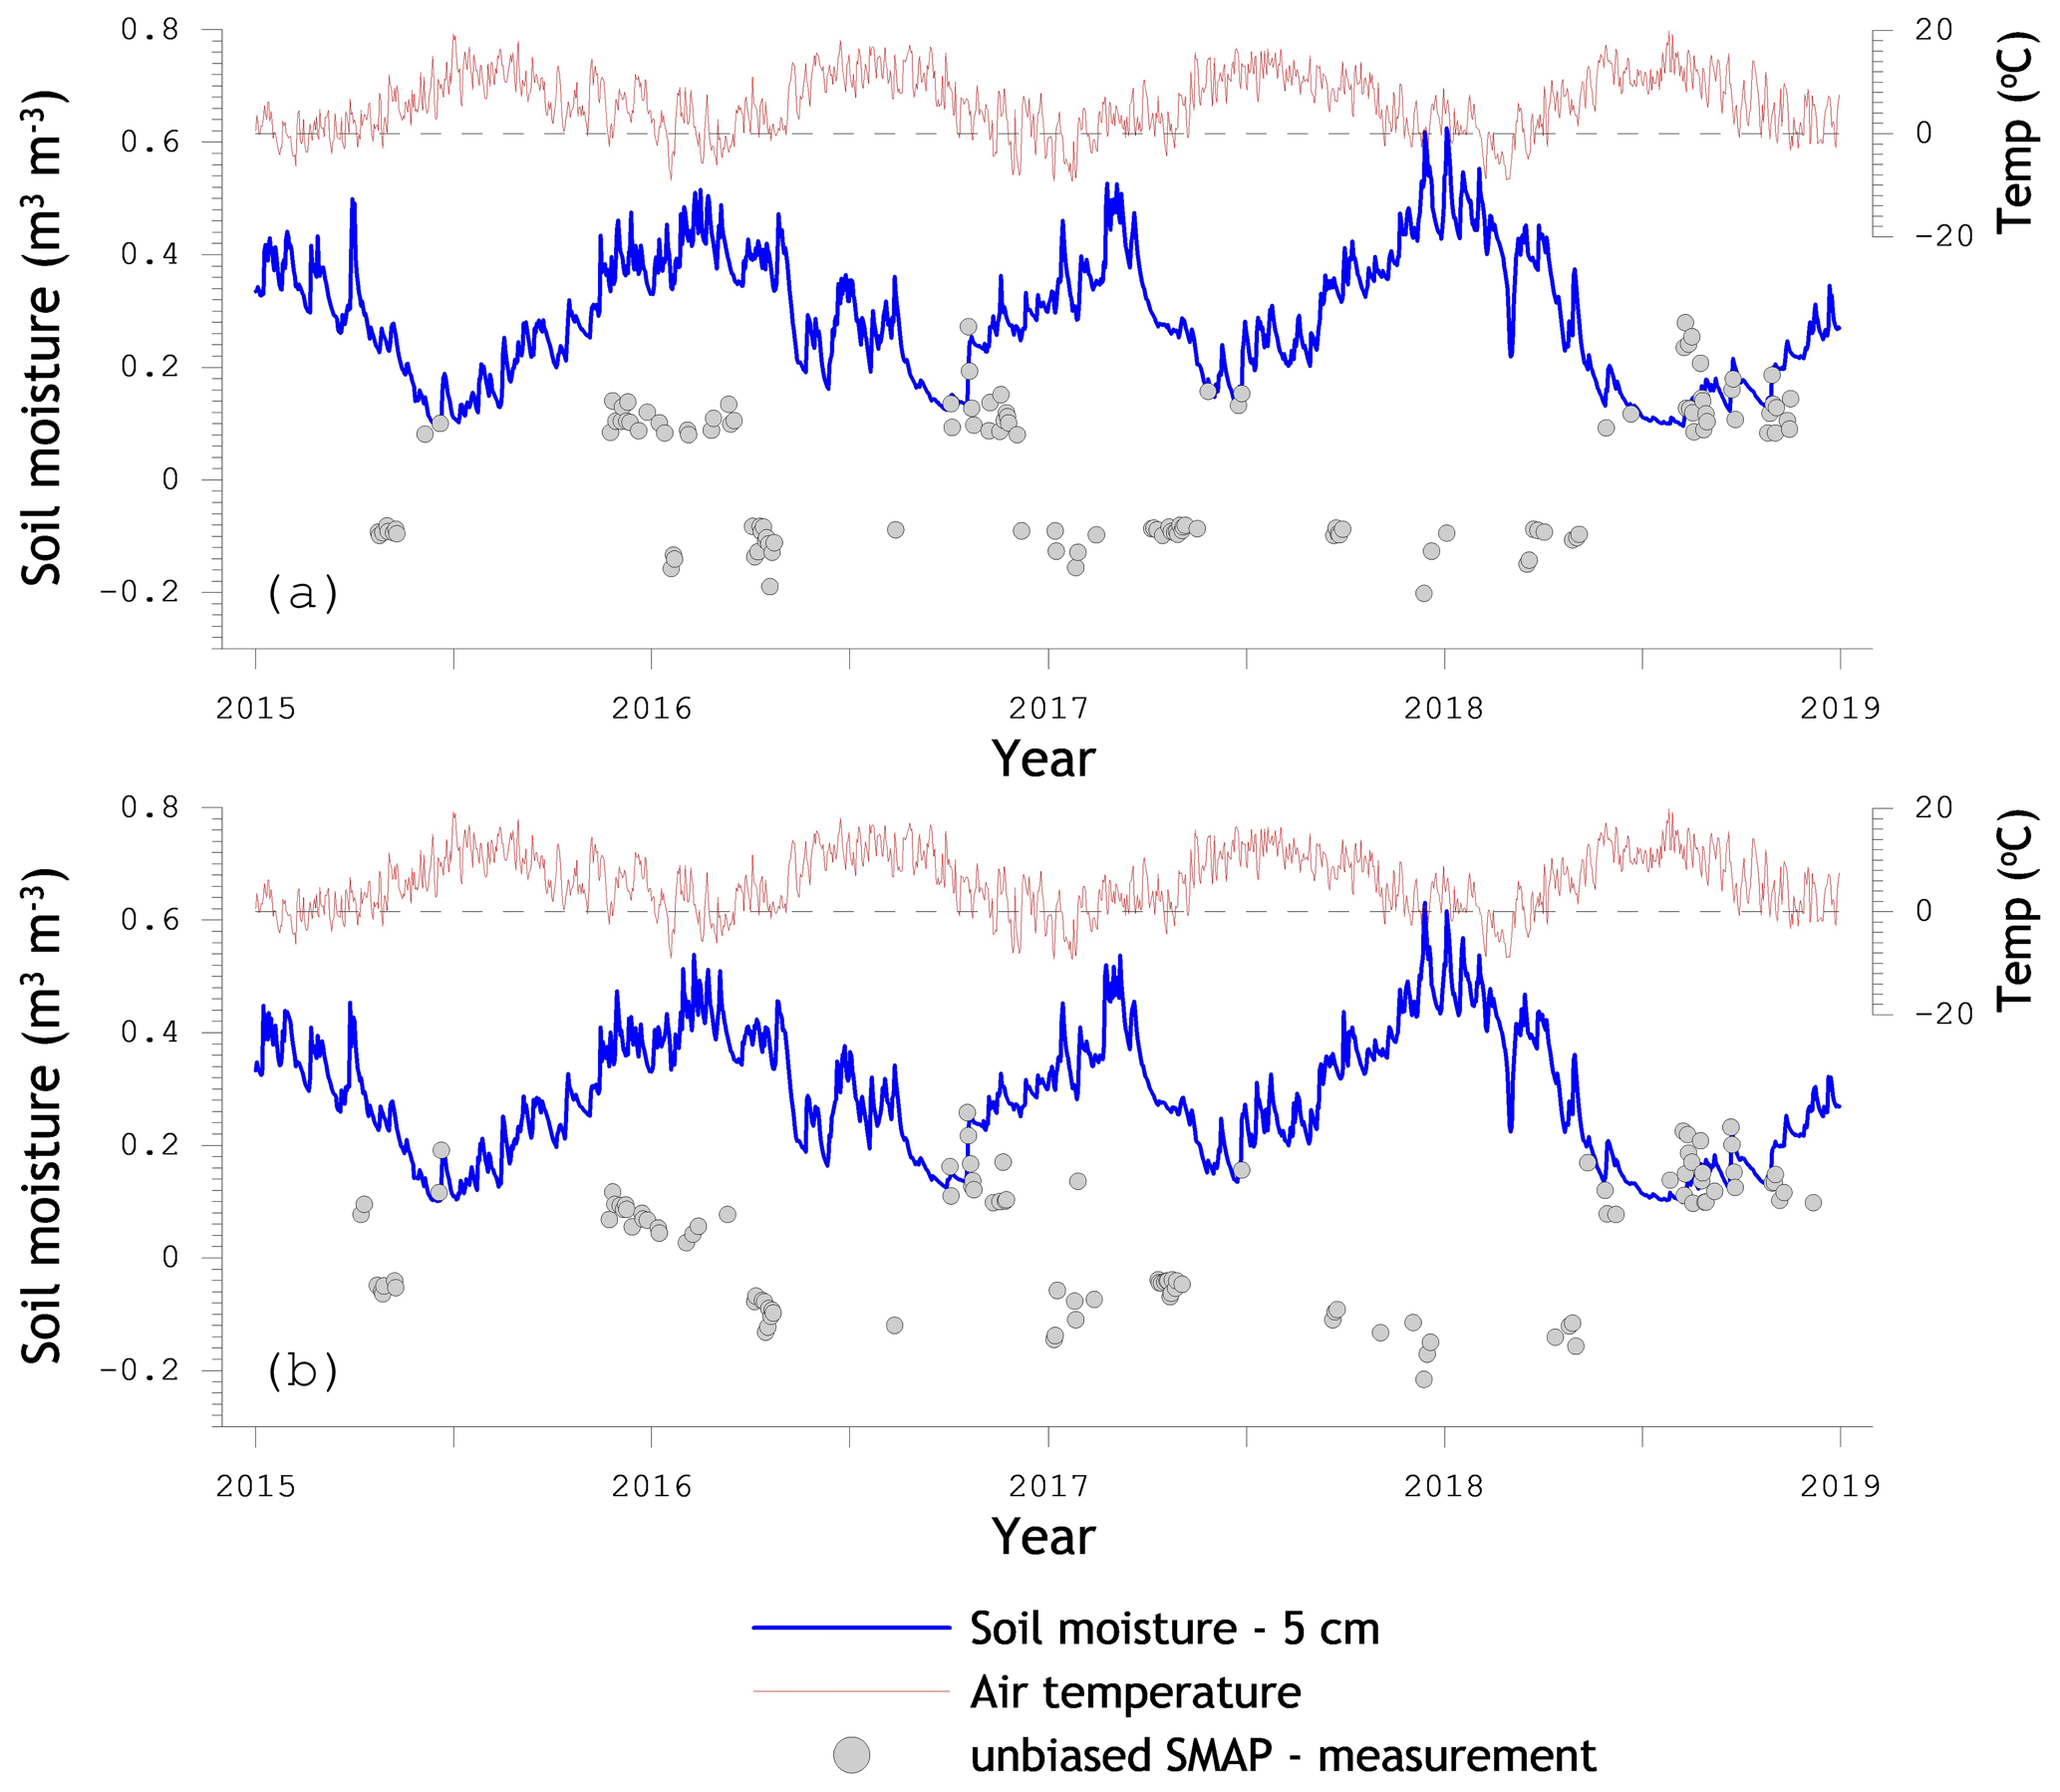
Figure 14Time series of measured soil moisture (all-station mean), daily minimum air temperature, and unbiased differences between SMAP SCA-V retrievals for reference pixel 4371 and the all-station mean exceeding 2σ (>0.08 m3 m−3).
Figure 14 shows three large groups of matchups where SMAP overestimates the in situ reference, namely winter 2015/2016, autumn 2016, and summer/autumn 2018. In the latter two, dry spells were ended by a sequence of substantial rain events that exposed the disparity in sampling depth between SMAP and the in situ sensors. The in situ sensors of the Twente network installed at a 5 cm soil depth effectively monitor the 1–9 cm soil layer below the surface (Benninga et al., 2018), while SMAP's sampling depth is generally considered to be shallower and depends on the soil moisture content (e.g. Escorihuela et al., 2010; Colliander et al., 2017; Zheng et al., 2019). After a dry episode has ended, the soil moisture content in the subsurface will be low and increases towards the surface, causing the overestimation by SMAP. Similar findings are reported in Shellito et al. (2016) through quantification of SMAP and in situ soil drying.
However, the winter 2015/2016 overestimation was not preceded by a drought. In fact, it was quite wet (see Fig. 1), with small-scale flooding on agricultural parcels across the Twente region. Since it is well known that standing water lowers the L-band emissivity, we expect that this contributed to SMAP's overestimation during the winter of 2015/2016. Gouweleeuw et al. (2012) and Ye et al. (2015) have indeed investigated the soil moisture overestimation by microwave radiometry as a result of standing water. Researchers (e.g. Du et al., 2018; Schroeder et al., 2015) have even been using microwave radiometry for worldwide assessments of the faction of land covered by water.

Figure 15uRMSEs against the daily minimum 1.5 m air temperature (Tmin) and rainfall threshold used to filter out matchups for suspected frozen conditions and conditions with an disparity between SMAP's sensing depth and the depth at which soil moisture is measured. Panel (a) shows the results for the morning estimates and panel (b) the afternoon estimates. The straight line is the uRMSE obtained when matchups are not filtered, and the dashed line is the uRMSE achieved when matchups are filtered on both Tmin (<2 ∘C) and rainfall (0 mm).
As suggested in Sect. 6.1, the large underestimations by SMAP can often be associated with frozen conditions. Notably, when the water molecules are bound, as in ice, the dielectric constant of the medium reduces to levels comparable to that of dry soil (Rautiainen et al., 2014; Mironov et al., 2017) and, therefore, the SMAP estimates decrease as the ice content in the soil increases. In situ sensors also quantify the soil moisture content by measuring the dielectric constant and are likewise influenced by the ice content; see February/March 2018. However, the in situ sensors provide measurements over a larger soil depth and are only weakly affected when the frost depth is shallow. Hence, the underestimation by SMAP also follows from a difference in sampling depth. The SMAP soil moisture processor includes a freeze/thaw flag that is derived from global surface temperature simulations of the Goddard Earth Observing System model, version 5 (GEOS-5), which is like any method subject to uncertainties and does not capture all frost events.
Figure 14 provides an opportunity to discuss the unexpected superior error metrics found for the afternoon over the morning matchups. It is self-evident that the soil moisture estimated from morning SMAP observations is more susceptible to frost and, thus, to underestimation of the in situ reference because air and surface temperatures are lower than in the afternoon. However, the SMAP overestimations in the autumn of 2016 and summer/autumn of 2018 are also more severe for SMAP's morning observations; e.g. compare the tails of the histograms in Fig. 13a and b. A possible explanation could be that when the soil surface is wetter than the subsurface, the SMAP soil moisture in the afternoon will be drier due to evaporation and, therefore, closer to the in situ reference. In any case, the temperature and dielectric constant stratification across the soil–vegetation system is not the decisive factor that makes morning satellite observations more favourable for microwave radiometry-based soil moisture monitoring over Twente.
In an attempt to quantify the negative impact of frozen conditions and antecedent rainfall on SMAP's performance, uRMSEs have been calculated using validation sets excluding matchups for which the Tmin did not or the daily amount of rainfall did exceed a certain threshold. Figure 15 presents the uRMSE against the Tmin or the rainfall threshold for morning (Fig. 15a) and afternoon (Fig. 15b) SMAP SCA-V soil moisture estimates of reference pixel 4371. The figure illustrates that the agreement between SMAP and in situ is considerably less on days with rainfall for both morning and afternoon SMAP estimates. The impact of frozen conditions is comparable in the morning SMAP estimates but is of much less significance for the afternoon retrievals for the reasons discussed above. When validation sets are filtered for both frost (Tmin<2 ∘C) and rainfall, the uRMSE drops even further to 0.053 m3 m−3 for the morning and 0.043 m3 m−3 for the afternoon SMAP estimates (dashed lines in Fig. 15). The latter becomes quite close to the mission's target accuracy.
In this paper, we report on the validation of Soil Moisture Active/Passive (SMAP) passive-only soil moisture products using in situ measurements collected from April 2015 until December 2018 by the Twente monitoring network situated in the east of the Netherlands and model simulations by the Dutch National Hydrological Model (LHM). The monitoring network consisted of 20 measurement locations during the study period. However, not all stations provided data continuously due to inevitable equipment failures and changes in landownership forcing reinstallation of instrumentation. Seven stations that were within the SMAP reference pixels and had fairly complete data records can be identified. This number is insufficient to construct a reliable spatial mean according to criteria defined by the SMAP validation team. Spatially distributed soil moisture simulations performed by the LHM are employed to translate the sample mean of a collection of point measurements to the domain of the SMAP reference pixels. With this aim, we have derived a set of equations to compute the parameters of a linear scaling function that uses the mean and standard deviation of time series of the in situ measured and model-simulated spatial soil moisture means. With this approach biases in these statistical moments between the two data sets are accounted for. The upscaling strategy has been applied to an unbiased spatial mean soil moisture computed from the in situ measurements collected by the seven stations with fairly complete records and the spatial mean soil moisture calculated from all available measurements.
We have adopted the native and upscaled spatial means calculated using the in situ soil moisture measurements as references to assess the SMAP soil moisture estimates obtained with the (i) Single Channel Algorithm at Horizontal polarization (SCA-H), (ii) Single Channel Algorithm at Vertical polarization (SCA-V), and (iii) Dual Channel Algorithm (DCA). In line with previous validation reports, we find that the SCA-V is the best-performing algorithm. SMAP's afternoon soil moisture estimates are systematically in closer agreement with the in situ references than the morning estimates. This can in part be attributed to the fact that the most severe over- and under-estimations are found for the estimates retrieved from SMAP's morning observations. The large overestimation errors (>0.08 m3 m−3) typically occur at the end of dry spells when the soil moisture is higher near surface than in the subsurface. Large underestimation errors (<0.08 m3 m−3) are noticed in periods with sub-zero air temperatures causing local freezing, which are not all identified by the SMAP freeze/thaw flag that is derived from global land model simulations. Both under- and over-estimations essentially follow from the disparity in the soil depth characterized by SMAP and in situ as frost and soil wetting coincide with strong vertical dielectric/soil moisture gradients, and the satellite probes the soil from the surface, while the sensors are installed 5 cm below the surface.
The large over- and under-estimations contribute to the fact that SMAP's target accuracy of 0.04 m3 m−3 is not achieved using any of the in situ references derived from the Twente measurements. The best unbiased root mean squared error (uRMSE) of 0.059 m3 m−3 is obtained for the SMAP's SCA-V afternoon estimates assessed against the native all-station mean. This can reduce to 0.043 m3 m−3 when matchups are filtered for frozen conditions and antecedent rainfall. The upscaled in situ references do not result in better metrics. Notably, the application of the upscaling strategy has a negative impact on the bias, which is somewhat inevitable due to the already good agreement between the in situ measurements and SMAP retrievals.
Pearson's product moment correlation coefficient (r), bias or mean error (ME), root mean squared error (RMSE), and unbiased root mean squared error (uRMSE) are the metrics used for the assessments presented in this paper. These metrics can be expressed as follows:
where x stands for the reference and y for the estimated quantity, n is the total number of samples, i indicates an individual realization, and the bar stands for the mean of the respective quantity.
The SMAP soil moisture retrieved for the reference pixels, the in situ soil moisture measurements of the Twente network, and the LHM soil moisture simulations used for the research presented in the article are available at https://doi.org/10.17026/dans-x3c-5cvq (van der Velde et al., 2018).
The supplement related to this article is available online at: https://doi.org/10.5194/hess-25-473-2021-supplement.
RvdV designed the research and wrote the paper with contributions from all the other authors. RvdV and HJFB collected the observational data, MP performed the LHM simulations, and AC, RB, SKC, and TJJ provided the matching SMAP data.
The authors declare that they have no conflict of interest.
The first author would like to thank Suhyb Salama and Alfred Stein for scientific discussions related to research presented in this article. The Royal Netherlands Meteorological Institute (KNMI) is acknowledged for making available meteorological measurements collected by their network of automated weather stations. A partial contribution to this work was made at the Jet Propulsion Laboratory, California Institute of Technology, under contract with the National Aeronautics and Space Administration.
This research has been supported by the Dutch Research Council – Applied and Engineering Science (grant no. 13871).
This paper was edited by Patricia Saco and reviewed by two anonymous referees.
Benninga, H.-J. F., Carranza, C. D. U., Pezij, M., van Santen, P., van der Ploeg, M. J., Augustijn, D. C. M., and van der Velde, R.: The Raam regional soil moisture monitoring network in the Netherlands, Earth Syst. Sci. Data, 10, 61–79, https://doi.org/10.5194/essd-10-61-2018, 2018.
Brocca, L., Melone, F., Moramarco, T., and Morbidelli, R.: Spatial-temporal variability of soil moisture and its estimation across scales, Water Resour. Res., 46, W02516, https://doi.org/10.1029/2009WR008016, 2010.
Brodzik, M. J., Billingsley, B., Haran, T., Raup, B., and Savoie, M. H.: EASE-Grid 2.0: Incremental but Significant Improvements for Earth-Gridded Data Sets, ISPRS Int. J. Geo-Inf., 1, 32–45, https://doi.org/10.3390/ijgi1010032, 2012.
Carranza, C. D. U., van der Ploeg, M. J., and Torfs, P. J. J. F.: Using lagged dependence to identify (de)coupled surface and subsurface soil moisture values, Hydrol. Earth Syst. Sci., 22, 2255–2267, https://doi.org/10.5194/hess-22-2255-2018, 2018.
Chan, S. K., Bindlish, R., O'Neill, P., Njoku, E., Jackson, T., Colliander, A., Chen, F., Burgin, M., Dunbar, S., Piepmeier, J., Yueh, S., Entekhabi, D., Cosh, M. H., Caldwell, T., Walker, J., Wu, X., Berg, A., Rowlandson, T., Pacheco, A., McNairn, H., Thibeault, M., Martinez-Fernandez, J., Gonzalez-Zamora, A., Seyfried, M., Bosch, D., Starks, P., Goodrich, D., Prueger, J., Palecki, M., Small, E. E., Zreda, M., Calvet, J., Crow, W. T., and Kerr, Y.: Assessment of the SMAP passive soil moisture product, IEEE Trans. Geosci. Remote Sens., 54, 4994–5007, https://doi.org/10.1109/TGRS.2016.2561938, 2016.
Chan, S. K., Bindlish, R., O'Neill, P., Jackson, T., Njoku, E., Dunbar, R. S., Chaubell, J., Piepmeier, J., Yueh, S., Entekhabi, D., Colliander, A., Chen, F., Cosh, M. H., Caldwell, T. G., Walker, J., Berg, A. A., McNairn, H., Thibeault, M., Martínez-Fernández, J., Uldall, F., Seyfried, M., Bosch, D. D., Starks, P. J., Holifield-Collins, C. D., Prueger, J. H., van der Velde, R., Asanuma, J., Palecki, M., Small, E. E., Zreda, M., Calvet, J. C., Crow, W. T., and Kerr, Y. H.: Development and assessment of the SMAP enhanced passive soil moisture product, Remote Sens. Environ., 204, 931–941, https://doi.org/10.1016/j.rse.2017.08.025, 2018.
Chen, F., Crow, W. T., Colliander, A., Cosh, M. H., Jackson, T. J., Bindlish, R., Reichle, R. H., Chan, S. K., Bosch, D. D., Starks, P. J., Goodrich, D. C., and Seyfried, M. S.: Application of Triple Collocation in Ground-Based Validation of Soil Moisture Active/Passive (SMAP) Level 2 Data Products, IEEE J. Sel. Top. Appl., 10, 489–502, https://doi.org/10.1109/JSTARS.2016.2569998, 2017.
Colliander, A., Jackson, T. J., Bindlish, R., Chan, S., Das, N., Kim, S. B., Cosh, M. H., Dunbar, R. S,. Dang, L., Pashaian, L., Asanuma, J., Aida, K., Berg, A., Rowlandson, T., Bosch, D. D., Caldwell, T., Caylor, K., Goodrich, D. C., Al Jassar, H., Lopez-Baeza, E., Martinez-Fernandez, J., Gonzalez-Zamora, A., Livingston, S., McNairn, H., Pacheco-Vega, A., Moghaddam, M., Montzka, C., Notarnicola, C., Niedrist, G., Pellarin, T., Prueger, J., Pulliainen, J., Rautiainen, K., Garcia-Ramos, J. V., Seyfried, M., Starks, P. J., Su, Z., Zeng, Y., van der Velde, R., Thibeault, M., Dorigo, W. A., Vreugdenhil, J. M., Walker, J. P., Wu, X., Monerris, A., O'Neill, P. E., Entekhabi, D., Njoku, E. G., and Yueh, S.: Validation of SMAP surface soil moisture products with core validation sites, Remote Sens. Environ., 191, 215–231, https://doi.org/10.1016/j.rse.2017.01.021, 2017.
Colliander, A., Jackson, T. J., Chan, S. K., O'Neill, P., Bindlish, R., Cosh, M. H., Caldwell, T., Walker, J. P., Berg, A., McNairn, H., Thibeault, M., Martínez-Fernández, J., Jensen, K. H., Asanuma, J., Seyfried, M. S., Bosch, D. D., Starks, P. J., Holifield-Collins, C. D., Prueger, J. H., Su, Z., Lopez-Baeza, E., and Yueh, S. H.: An assessment of the differences between spatial resolution and grid size for the SMAP enhanced soil moisture product over homogeneous sites, Remote Sens. Environ., 207, 65–70, https://doi.org/10.1016/j.rse.2018.02.006, 2018.
Cosh, M. H., Jackson, T. J., Bindlish, R., Famiglietti, J. S., and Ryu, D.: Calibration of an impedance probe for estimation of surface water content over large regions, J. Hydrol., 311, 49–58, https://doi.org/10.1016/j.jhydrol.2005.01.003, 2005.
Cosh, M. H., Ochsner, T. E., McKee, L., Dong, J., Basara, J. B., Evett, S. R., Hatch, C. E., Small, E. E., Steele-Dunne, S. C., Zreda, M., and Sayde, C.: The soil moisture active passive Marena, Oklahoma, in-situ sensor testbed (SMAP-MOISST): Testbed design and evaluation of in situ sensors, Vadose Zone J., 15, vzj2015.09.0122, https://doi.org/10.2136/vzj2015.09.0122, 2015.
Crow, W. T., Ryu, D., and Famiglietti, J. S.: Upscaling of field-scale soil moisture measurements using distributed land surface modelling, Adv. Water Resour., 28, 1–14, https://doi.org/10.1016/j.advwatres.2004.10.004, 2005.
Crow, W. T., Berg, A. A., Cosh, M. H., Loew, A., Mohanty, B. P., Panciera, R., de Rosnay, P., Ryu, D., and Walker, J. P.: Upscaling sparse ground-based soil moisture observations for the validation of coarse-resolution satellite soil moisture products, Rev. Geophys., 50, RG2002, https://doi.org/10.1029/2011RG000372, 2012.
De Lange, W. J., Prinsen, G. F., Hoogewoud, J. C., Veldhuizen, A. A., Verkaik, J., Oude Essink, G. H. P., van Walsum, P. E. V., Delsman, J. R., Hunnink, J. C., Massop, H. T. L., and Kroon, T.: An operational, multi-scale, multi-model system for consensus-based integrated water management and policy analysis: The Netherlands Hydrological Instrument, Environ. Modell. Softw., 59, 98–108, https://doi.org/10.1016/j.envsoft.2014.05.009, 2014.
De Lannoy, G. J. M., Houser, P. R., Verhoest, N. E. C., Pauwels, V. R. N., and Gish, T. J.: Upscaling of point soil moisture measurements to field averages at the OPE3 test site, J. Hydrol., 343, 1–11, https://doi.org/10.1016/j.jhydrol.2007.06.004, 2007.
Delwart, S., Bouzinac, C., Kerr, Y., Font, J., and Hahne, A.: SMOS calibration validation & retrieval plan, European Space Agency/ESTEC, Noordwijk, the Netherlands, SO-PL-ESA-SY-3898, 137 pp., 2010.
Dente, L., Vekerdy, Z., Su, Z., and Ucer, M.: Twente soil moisture and soil temperature monitoring network, University of Twente, Enschede, the Netherlands, ISBN 978-90-6164-324-1, 19 pp., 2011.
Dente, L., Su, Z., and Wen, J.: Validation of SMOS Soil Moisture Products over the Maqu and Twente Regions, Sensors, 12, 9965–9986, https://doi.org/10.3390/s120809965, 2012.
Draper, C. S., Walker, J. P., Steinle, P. J., de Jeu, R. A. M., and Holmes, T. R. H.: An evaluation of AMSR-E derived soil moisture over Australia, Remote Sens. Environ., 113, 703–710, https://doi.org/10.1016/j.rse.2008.11.011, 2009.
Du, J., Kimball, J. S., Galantowicz, J., Kim, S.-B., Chan, S. K., Reichle, R., Jones, L. A., and Watts, J. D.: Assessing global surface water inundation dynamics from SMAP, AMSR2 and Landsat, Remote Sens. Environ., 213, 1–17, https://doi.org/10.1016/j.rse.2018.04.054, 2018.
Entekhabi, D., Njoku, E. G., O'Neill, P. E., Kellog, K. H., Crow, W. T., Edelstein, W. N., Entin, J. K., Goodman, S. D., Jackson, T. J., Johnson, J., Kimball, J., Piepmeier, J. R., Koster, R. D., Martin, N., McDonald, K. C., Moghaddam, M., Moran, S., Reichle, R., Shi, J. C., Spencer, M. W., Thurman, S. W., Leung, T., and van Zyl, J.: The Soil Moisture Active Passive (SMAP) mission, P. IEEE, 98, 704–716, https://doi.org/10.1109/JPROC.2010.2043918, 2010.
Escorihuela, M. J., Chanzy, A., Wigneron, J. P., and Kerr, Y. H.: Effective soil moisture sampling depth of L-band radiometric: A case study, Remote Sens. Environ., 114, 995–1001, https://doi.org/10.1016/j.rse.2009.12.011, 2010.
Famiglietti, J. S., Ryu, D., Berg, A. A., Rodell, M., and Jackson, T. J.: Field observations of soil moisture variability across scales, Water Resour. Res., 44, W01423, https://doi.org/10.1029/2006WR005804, 2008.
Gouweleeuw, B. T., van Dijk, A. I. J. M., Guerschman, J. P., Dyce, P., and Owe, M.: Space-based passive microwave soil moisture retrievals and the correction for a dynamic open water fraction, Hydrol. Earth Syst. Sci., 16, 1635–1645, https://doi.org/10.5194/hess-16-1635-2012, 2012.
Harbaugh, A. W., Langevin, C. D., Hughes, J. D., Niswonger, R. N., and Konikow, L. F.: MODFLOW-2005 version 1.12.00, the U.S. Geological Survey modular groundwater model: U.S. Geological Survey Software Release, https://doi.org/10.5066/F7RF5S7G, 2017.
Hazeu, G. W.: Operational land cover and land use mapping in the Netherlands, in: Land Use and Land Cover Mapping in Europe: Practices & Trends, edited by: Manakos, I. and Braun, M., Springer, Dordrecht, the Netherlands, 283–296, https://doi.org/10.1007/978-94-007-7969-3, 2014.
Jackson, T. J.: III. Measuring surface soil moisture using passive microwave remote sensing, Hydrol. Process., 7, 139–152, https://doi.org/10.1002/hyp.3360070205, 1993.
Jackson, T. J., Bindlish, R., Cosh, M. H., Zhao, T., Starks, P. J., Bosch, D. D., Seyfried, M., Moran, M. S., Goodrich, D. C., Kerr, Y. H., and Leroux, D.: Validation of Soil Moisture and Ocean Salainty (SMOS) soil moisture over watershed networks in the U.S., IEEE Trans. Geosci. Remote Sens., 50, 1530–1543, https://doi.org/10.1109/TGRS.2011.2168533, 2012.
Jackson, T. J., Colliander, A., Kimball, J., Reichle, R., Crow, W., Entekhabi, D., O'Neill, P., and Njoku, E.: SMAP Science Data Calibration and Validation Plan, SMAP Mission, Jet Propulsion Laboratory, Pasadena, USA, 105 pp., 2013.
Kerr, Y. H., Waldteufel, P., Wigneron, J.-P., Martinuzzi, J.-M., Font, J., and Berger, M.: Soil moisture retrieval from space: The Soil Moisture and Ocean Salinity (SMOS) mission, IEEE Trans. Geosci. Remote Sens., 39, 1729–1735, https://doi.org/10.1109/36.942551, 2001.
Lasdon, L. S., Waren, A. D., Jain, A., and Ratner, M.: Design and testing of a generalized reduced gradient code for nonlinear programming, ACM T. Math. Software, 4, 34–50, 1978.
Martínez-Fernández, J. and Ceballos, A.: Mean soil moisture estimation using temporal stability analysis, J. Hydrol., 312, 28–38, https://doi.org/10.1016/j.jhydrol.2005.02.007, 2005.
Miralles, D. G., Crow, W. T., and Cosh, M. H.: Estimating spatial sampling errors in coarse-scale soil moisture estimates derived from point-scale observations, J. Hydrometeor., 11, 1423–1429, https://doi.org/10.1175/2010JHM1285.1, 2010.
Mironov, V. L., Kosolapoca, L. G., Lukin, Y. I., Karavaysky, A. Y., and Molostov, I. P.: Temperature- and texture-dependent dielectric model for frozen and thawed minerals soils at a frequency of 1.4 GHz, Remote Sens. Environ., 200, 240–249, https://doi.org/10.1016/j.rse.2017.08.007, 2017.
Mo, T., Choudhury, B. J., Schmugge, T. J., Wang, J. R., and Jackson, T. J.: A model for microwave emission from vegetation-covered fields, J. Geophys. Res., 8, 11229–11237, https://doi.org/10.1029/JC087iC13p11229, 1982.
Mohammad, P. N., Aksoy, M., Piepmeier, J. R., Johnson, J. T., and Bringer, A.: SMAP L-band microwave radiometer: RFI mitigation prelaunch analysis and first year on-orbit observation, IEEE Trans. Geosci. Remote Sens., 54, 6035–6047, https://doi.org/10.1109/TGRS.2016.2580459, 2016.
Mohanty, B. P. and Skaggs, T. H.: Spatio-temporal evolution and time-stable characteristics of soil moisture within remote sensing footprints with varying soil, slope and vegetation, Adv. Water Resour., 24, 1051–1067, https://doi.org/10.1016/S0309-1708(01)00034-3, 2001.
O'Neill, P., Bindlish, R., Chan, S., Njoku, E., and Jackson, T.: Algorithm theoretical basis document: Level 2 & 3 soil moisture (passive) data products, Jet Propulsion Laboratory/California Institute of Technology, Pasadena, USA, JPL D-66480 (revision D), 82 pp., 2018.
Overeem, A., Holleman, I., and Buishand, A.: Derivation of a 10-year radar-based climatology of rainfall, J. Appl. Meteorol. Clim., 48, 1448–1463, https://doi.org/10.1175/2009JAMC1954.1, 2009.
Owe, M., De Jeu, R. A. M., and Holmes, T. R. H.: Multi-sensor historical climatology of satellite-derived global land surface moisture, J. Geophys. Res., 113, F01002, https://doi.org/10.1029/2007JF000769, 2008.
Pezij, M., Augustijn, D. C. M., Hendriks, D. M. D., Weerst, A. H., Hummel, S., van der Velde, R., and Hulscher, S. J. M. H.: State updating of root zone soil moisture estimates of an unsaturated zone metamodel for operational water resources management, J. Hydrol X, 4, 100040, https://doi.org/10.1016/j.hydroa.2019.100040, 2021.
Piepmeier, J., Mohammed, P., de Amici, G., Kim, E., Peng, J., and Ruf, C.: Algorithm theoretical basis document (ATBD): SMAP calibrated, time-ordered brightness temperatures L1B TB data product (revision A), NASA Goddard Space Flight Center, Greenbelt, USA, 83 pp., 2014.
Piepmeier, J., Focardi, P., Horgan, K. A., Knuble, J., Ehsan, N., Lucey, J., Brambora, C., Brown, P. R., Hoffman, P. J., French, R. T., Mikhaylov, R. L., Kwack, E.-Y., Slimko, E. M., Dawson, D. E., Hudson, D., Peng, J., Mohammed, P. N., De Amici, G., Freedman, A. P., Medeiros, J., Sacks, F., Estep, R., Spencer, M. W., Chen, C. W., Wheeler, K. B., Edelstein, W. N., O'Neill, P. E., and Njoku, E. G.: SMAP L-band microwave radiometer: Instrument design and first year on orbit, IEEE Trans. Geosci. Remote Sens., 55, 1954–1966, https://doi.org/10.1109/TGRS.2016.2631978, 2017.
Rautiainen, K., Lemmetyinnen, J., Schwank, M., Kontu, A., Ménard, C. B., Mätzler, C., Drusch, M., Wiesmann, A., Ikonen, J., and Pulliainen, J.: Detection of soil freezing from L-band passive microwave observations, Remote Sens. Environ., 147, 206–218, https://doi.org/10.1016/j.rse.2014.03.007, 2014.
Schroeder, R., McDonald, K. C., Chapman, B. D., Jensen, K., Podest, E., Tessler, Z. D., Bohn, T. J., and Zimmermann, R.: Development and evaluation of a multi-year factional surface water data set derived from active and passive microwave remote sensing data, Remote Sens., 7, 16688–16731, https://doi.org/10.3390/rs71215843, 2015.
Shellito, P. J., Small, E. E., Colliander, A., Bindlish, R., Cosh, M. H., Berg, A. A., Bosch, D. D., Caldwell, T. G., Goodrich, D. C., McNairn, H., Prueger, J. H., Starks, P. J., van der Velde, R., and Walker, J. P.: SMAP soil moisture drying more rapid than observed in situ following rainfall events, Geophys. Res. Lett., 43, 9068–8075, https://doi.org/10.1002/2016GL069946, 2016.
Stoffelen, A.: Toward the true near-surface wind speed: Error modeling and calibration using triple collocation, J. Geophys. Res., 103, 7755–7766, https://doi.org/10.1029/97JC03180, 1998.
Van Dam, J. C., Groenendijk, P., Hendriks, R. F. A., and Kroes, J. G.: Advances of modeling water flow in variably saturated soils with SWAP, Vadoze Zone J., 7, 640–653, https://doi.org/10.2136/vzj2007.0060, 2008.
van der Velde, R., Colliander, A., Pezij, M., Benninga, H.-J. F., Bindlish R., Chan, S. K., and Hendriks, D. M. D.: Validation of SMAP L2 passive-only soil moisture products using in situ measurements collected in Twente, the Netherlands, https://doi.org/10.17026/dans-x3c-5cvq, 2018.
Van Walsum, P. E. V. and Groenendijk, P.: Quasi steady-state simulation of the unsaturated zone in groundwater modeling of lowland regions, Vadoze Zone J., 7, 769–781, https://doi.org/10.2136/vzj2007.0146, 2008.
Western, A. W. and Blöschl, G.: On the spatial scaling of soil moisture, J. Hydrol., 217, 203–224, https://doi.org/10.1016/S0022-1694(98)00232-7, 1999.
Wösten, H., de Vries, F., Hoogland, T., Massop, H., Veldhuizen, A., Vroon, H., Wesseling, J., Heijkers, J., and Bolman, A.: BOFEK2012, de nieuwe, bodemfysische schematisatie van Nederland, Alterra Wageningen UR, Alterra-rapport 2387, Wageningen, the Netherlands, 92 pp., 2013 (in Dutch).
Ye, N., Walker, J. P., Guerschman, J., Ryu, D., and Gurney, R. J.: Standing water effect on soil moisture retrieval from L-band passive microwave observations, Remote Sens. Environ., 169, 232–242, https://doi.org/10.1016/j.rse.2015.08.013, 2015.
Zheng, D., Li, X., Wang, X., Wang, Z., Wen, J., van der Velde, R., Schwank, M., and Su, Z.: Sampling depth of L-band radiometer measurements of soil moisture and freeze-thaw dynamics on the Tibetan Plateau, Remote Sens. Environ., 226, 16–25, https://doi.org/10.1016/j.rse.2019.03.029, 2019.
- Abstract
- Introduction
- Study area and in situ measurements
- Spatial data
- From point to footprint scale
- Development of upscaling functions
- Validation
- Discussion
- Conclusions
- Appendix A
- Data availability
- Author contributions
- Competing interests
- Acknowledgements
- Financial support
- Review statement
- References
- Supplement