the Creative Commons Attribution 4.0 License.
the Creative Commons Attribution 4.0 License.
 | 09 Jul 2021
Microphysical features of typhoon and non-typhoon rainfall observed in Taiwan, an island in the northwestern Pacific
Jayalakshmi Janapati
Balaji Kumar Seela
Meng-Tze Lee
Everette Joseph
Information about the raindrop size distribution (RSD) is vital for comprehending the precipitation microphysics, improving the rainfall estimation algorithms, and appraising the rainfall erosivity. Previous research has revealed that the RSD exhibits diversity with geographical location and weather type, which leads to the assessment of the region and weather-specific RSDs. Based on long-term (2004 to 2016) disdrometer measurements in northern Taiwan, this study attempts to demonstrate the RSD aspects of summer seasons that were bifurcated into two weather conditions, namely typhoon (TY) and non-typhoon (NTY) rainfall. The results show a higher concentration of small drops and a lower concentration of large-sized drops in TY compared to NTY rainfall, and this behavior persisted even after characterizing the RSDs into different rainfall rate classes. RSDs expressed in gamma parameters show higher mass-weighted mean diameter (Dm) and lower normalized intercept parameter (Nw) values in NTY than TY rainfall. Moreover, sorting these two weather conditions (TY and NTY rainfall) into stratiform and convective regimes revealed a larger Dm in NTY than in TY rainfall. The RSD empirical relations used in the valuation of rainfall rate (Z–R, Dm–R, and Nw–R) and rainfall kinetic energy (KE–R and KE–Dm) were enumerated for TY and NTY rainfall, and they exhibited profound diversity between these two weather conditions. Attributions of RSD variability between the TY and NTY rainfall to the thermodynamical and microphysical processes are elucidated with the aid of reanalysis, remote sensing, and ground-based data sets.
- Article
(2708 KB) - Full-text XML
- BibTeX
- EndNote


Taiwan, an island in the northwestern Pacific, has complex topography that extends from south to north, with an average elevation of about 2 km and peaks of ∼4 km. The East China Sea bounds Taiwan to the north, the Philippine Sea to the east, Luzon Strait to the south, and the South China Sea to the southwest. This island is affected by two monsoon regimes, i.e., southwesterly monsoon (May to August) and northeasterly monsoon (September to April), and these two monsoon regimes are further categorized into winter (December to February), spring (March to April), mei-yu (mid-May to mid-June), summer (mid-June to August), typhoon (May to October), and autumn (September to November) seasons (Chen and Chen, 2003). Among the abovementioned seasons, the summer seasons, exclusively associated with thunderstorms and typhoons, have more intense precipitation than other seasons. Despite reports on the rainfall individualities of different seasons and weather systems in Taiwan (Chen et al., 1999, 2007, 2010; Chen and Chen, 2011; Liang et al., 2017; Tu and Chou, 2013), few attempts were made to explicate rain microphysical aspects, particularly the raindrop size distribution (RSD) characteristics.
The RSDs aid in diverse fields like meteorology, hydrology, and remote sensing and offer insight into the precipitation microphysics (Rosenfeld and Ulbrich, 2003). Characterization of RSDs offers the opportunity to design radar rainfall estimation algorithms (Ryzhkov and Zrnić, 1995), improve the cloud modeling parameterization (McFarquhar et al., 2015), assess the rainfall erosivity relations (Janapati et al., 2019), validate the remote sensing instruments (Liao et al., 2014; Nakamura and Iguchi, 2007), and appraise the rain attenuations (Chen et al., 2011). Owing to the aforementioned implications of RSDs, ample literature exists on RSDs for spatial and seasonal variations (Thompson et al., 2015; Jayalakshmi and Reddy, 2014; Seela et al., 2016, 2017, 2018; Krishna et al., 2016) and storm-to-storm, within-storm (Kumari et al., 2014; Maki et al., 2001; Jung et al., 2012; Bao et al., 2020; Janapati et al., 2017), and different precipitation (Tokay and Short, 1996; Krishna et al., 2016).
Investigations on RSDs have been increasing in order to illuminate the hydrological (Lin and Chen, 2012; Lu et al., 2008; Janapati et al., 2019; Chang et al., 2017) and microphysical characteristics (Chu and Su, 2008; Jung et al., 2012; Seela et al., 2017, 2018; Lee et al., 2019; Janapati et al., 2020) of diverse precipitating clouds in Taiwan. For instance, Chu and Su (2008) reconnoitered the slope–shape relations for seven precipitation events related to four different weather systems in northern Taiwan, and they showed that the derived μ–Λ relation was independent of the gamma RSD moment order. Measurements of a squall line in southern Taiwan, with ground-based radar and a disdrometer, revealed that the Dm values in the squall line's convective precipitation were higher than the maritime clusters (Jung et al., 2012). Chang et al. (2009) analyzed the RSDs of landfall typhoons in northern Taiwan, and they argued that the interaction of typhoons with Taiwan's complex terrain resulted in the intermediate RSDs leading to maritime and continental clusters. The comparison study of summer season RSDs between Taiwan and the Palau islands by Seela et al. (2017) revealed more large drops in Taiwan than Palau, and they contended that deeply extended convective clouds with more aerosols in Taiwan resulted in the differences between these two islands. With the aid of long-term disdrometer measurements for the summer and winter seasons in northern Taiwan, Seela et al. (2018) noticed profound disparities in the RSDs between these two seasons, and they attributed the RSD differences to the microphysical processes concomitant with deep convective clouds in summer and warm clouds in winter. Furthermore, investigations on the microphysical features of the six seasons (winter, spring, mei-yu, summer, typhoon, and autumn) in northern Taiwan divulged the highest mean Dm values in summer and the highest concentration (log 10Nw) in winter (Lee et al., 2019). A recent study on Indian and Pacific Ocean tropical cyclones manifested higher Dm values in the Pacific Ocean tropical cyclones than in the Indian Ocean tropical cyclones (Janapati et al., 2020).
Efforts have been made to reveal the RSDs characteristics of tropical cyclones and non-tropical cyclones in India, Australia, China, and Japan (Radhakrishna and Narayana Rao, 2010; Kumar and Reddy, 2013; Deo and Walsh, 2016; Chen et al., 2017, 2019). Analysis of tropical cyclones and non-tropical cyclones RSDs in Gadanki (Radhakrishna and Narayana Rao, 2010) and Kadapa (Kumar and Reddy, 2013) unveiled a higher concentration of small drops in tropical cyclones than the non-tropical cyclones. In Australia, Deo and Walsh (2016) illustrated the tropical and non-tropical cyclone RSDs and demonstrated higher Dm values in non-tropical cyclones than in tropical cyclone rainfall. From the 2-dimensional video disdrometer (2DVD) measurements in eastern China, Chen et al. (2017) determined the polarimetric radar variables for typhoons, mei-yu, and squall line precipitations, and they revealed discrete alterations among these weather systems. Over southern China, distinct differences in the rain integral parameters of typhoons and squall lines were perceived by Zhang et al. (2019), and they concluded that it is essential to adopt precipitation-specific rainfall estimators. An examination of typhoons and mei-yu season RSDs in Japan affirmed maritime behavior in typhoons and continental behavior in mei-yu rainfall (Chen et al., 2019).
Despite investigations on the rainfall characteristics of typhoon and non-typhoon weather conditions (Chen and Chen, 2011; Tu and Chou, 2013), the microphysical features, especially the summer seasons' RSDs (explicitly segregated to typhoon and non-typhoon weather conditions) are yet to be documented for the Taiwan region. Thus, this study sought to address the following objectives: (1) to investigate alike or unalike individualities of RSDs between the typhoon and non-typhoon rainfall, (2) to identify the comparable or unrelated features of typhoon and non-typhoon rainfall to the previous studies, (3) to quantify the rainfall rate and rainfall kinetic energy relations, and (4) to discern a conceivable rationale for peculiarities in the RSDs between typhoon and non-typhoon rainfall events. In this context, to address the aforementioned objectives for the typhoon and non-typhoon rainfall, long-term disdrometer, radar, remote sensing, and reanalysis data sets were used.
The geographic map of Taiwan, with the National Central University (NCU; 24∘58′ N, 121∘10′ E) site (indicated with a filled green circle), where the Joss–Waldvogel disdrometer (JWD; Joss and Waldvogel, 1969) measurements were conducted (summer season rainy days (16 June to 31 August) for the years 2004 to 2016), is shown in Fig. 1. The disdrometer measurements in the summer seasons were further classified into typhoon (TY) and non-typhoon (NTY) weather conditions. In identifying the rainfall amounts of typhoons over Taiwan, previous studies adopted different criteria (Tu and Chou, 2013; Chu et al., 2007; Chen et al., 2010). For instance, if a typhoon center was invaded, with the rectangular grid box of 21–26∘ N and 119–125∘ E (Chu et al., 2007), 19.5–27.5 and 117.5–124.5∘ E (Chen et al., 2010), or 18–29.5∘ N and 116–126∘ E (Tu and Chou, 2013), then the corresponding rain in Taiwan was selected as being typhoon-induced rain. On the other hand, in the current study, precipitation at the NCU disdrometer site was considered as being typhoon-induced rain when the typhoon center was ≤500 km from the disdrometer (Janapati et al., 2019), and the rest of the rainy days in summer seasons were categorized as NTY rainy days. With this condition, a total number of 59 TY rainy days (hereafter TY days) and 131 NTY rainy days (hereafter NTY days) were recorded by the NCU JWD from 2004 to 2016 (excluding the years 2008 and 2009).
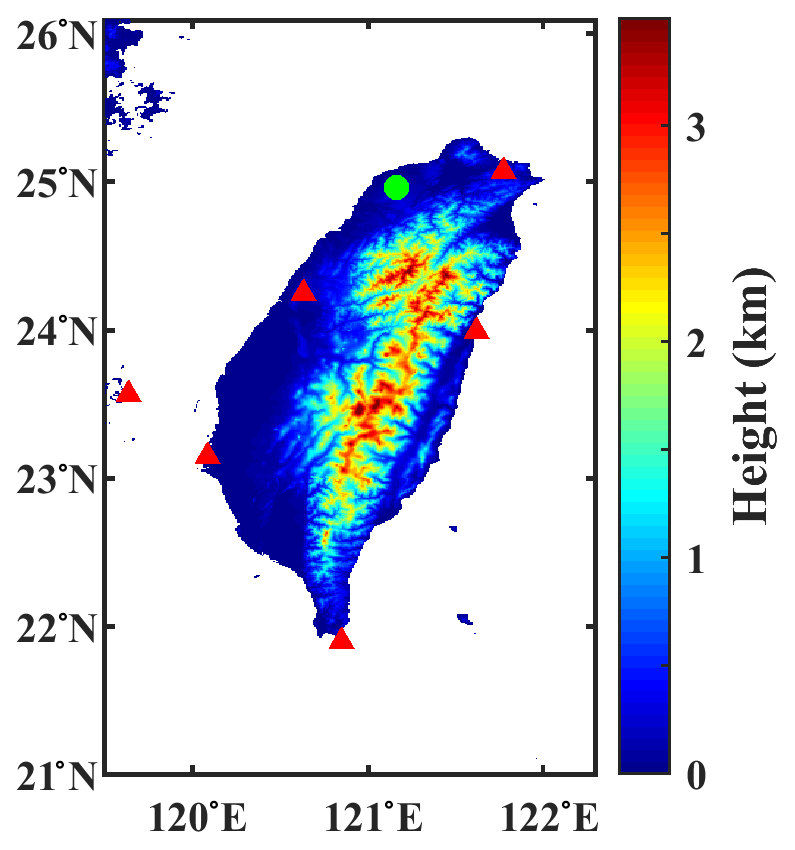
Figure 1Map of Taiwan with disdrometer (green circle) and radar (red triangles) sites.
The JWD has advantages and disadvantages over the other disdrometers (Lee and Zawadzki, 2005; McFarquhar and List, 1993; Sauvageot and Lacaux, 1995; Sheppard, 1990; Sheppard and Joe, 1994; Tokay et al., 2001, 2013). For instance, JWD cannot measure fall velocity; hence, to evaluate the RSD parameters from the JWD, we assumed that raindrops reach the ground with terminal velocity. Furthermore, in heavy rainfall events, the JWD measures the spurious values for the raindrops of diameter < 1 mm, and it was named the dead-time correction of the instrument. To deal with the dead-time correction of the JWD, the manufacturer provided an error correction multiplication matrix based on a correction scheme from Sheppard and Joe (1994). However, as the JWD cannot record any drops for the first three to four channels in heavy rainfall events, the multiplicative matrix algorithm does not increase the counts when the channel has no drops (Tokay and Short, 1996; Tokay et al., 2001); hence, in this study, we did not apply the dead-time correction to the JWD data. On top of that, 1 min RSD samples with a raindrop count of <10 and a rainfall rate of < 0.1 mm h−1 were discarded (Tokay and Short, 1996). The daily rainfall accumulations from the JWD are related to the collocated rain gauge for both TY and NTY rain regimes and are illustrated with scatter plots in Fig. 2. The rainy days (TY = 4 d; NTY = 0 d) with a larger discrepancy between JWD and rain gauge measurements were discarded in this study. Furthermore, we compared the JWD measurements (for both TY and NTY rainy days) with the rain gauge for different wind speed conditions (daily maximum wind speed is 0–8, 8–14, 14–18, and >18 m s−1), and the results are provided in Table 1. For the considered NTY rainy days, the daily maximum wind speeds were less than 14 m s−1; however, there were TY rainy days with wind speeds of > 18 m s−1. A good agreement between JWD and rain gauge measurements for both TY and NTY days (Fig. 2 and Table 1) provided the trustworthiness of the JWD data for further analysis.
Table 1The JWD and rain gauge comparison results (n – number of rainy days; CC – correlation coefficient; RMSE – root mean square error) for different wind speed conditions (daily maximum wind speed is 0–8, 8–14, 14–18, and >18 m s−1). Note that there were no NTY rainy days with a daily maximum wind speed of > 14 m s−1.

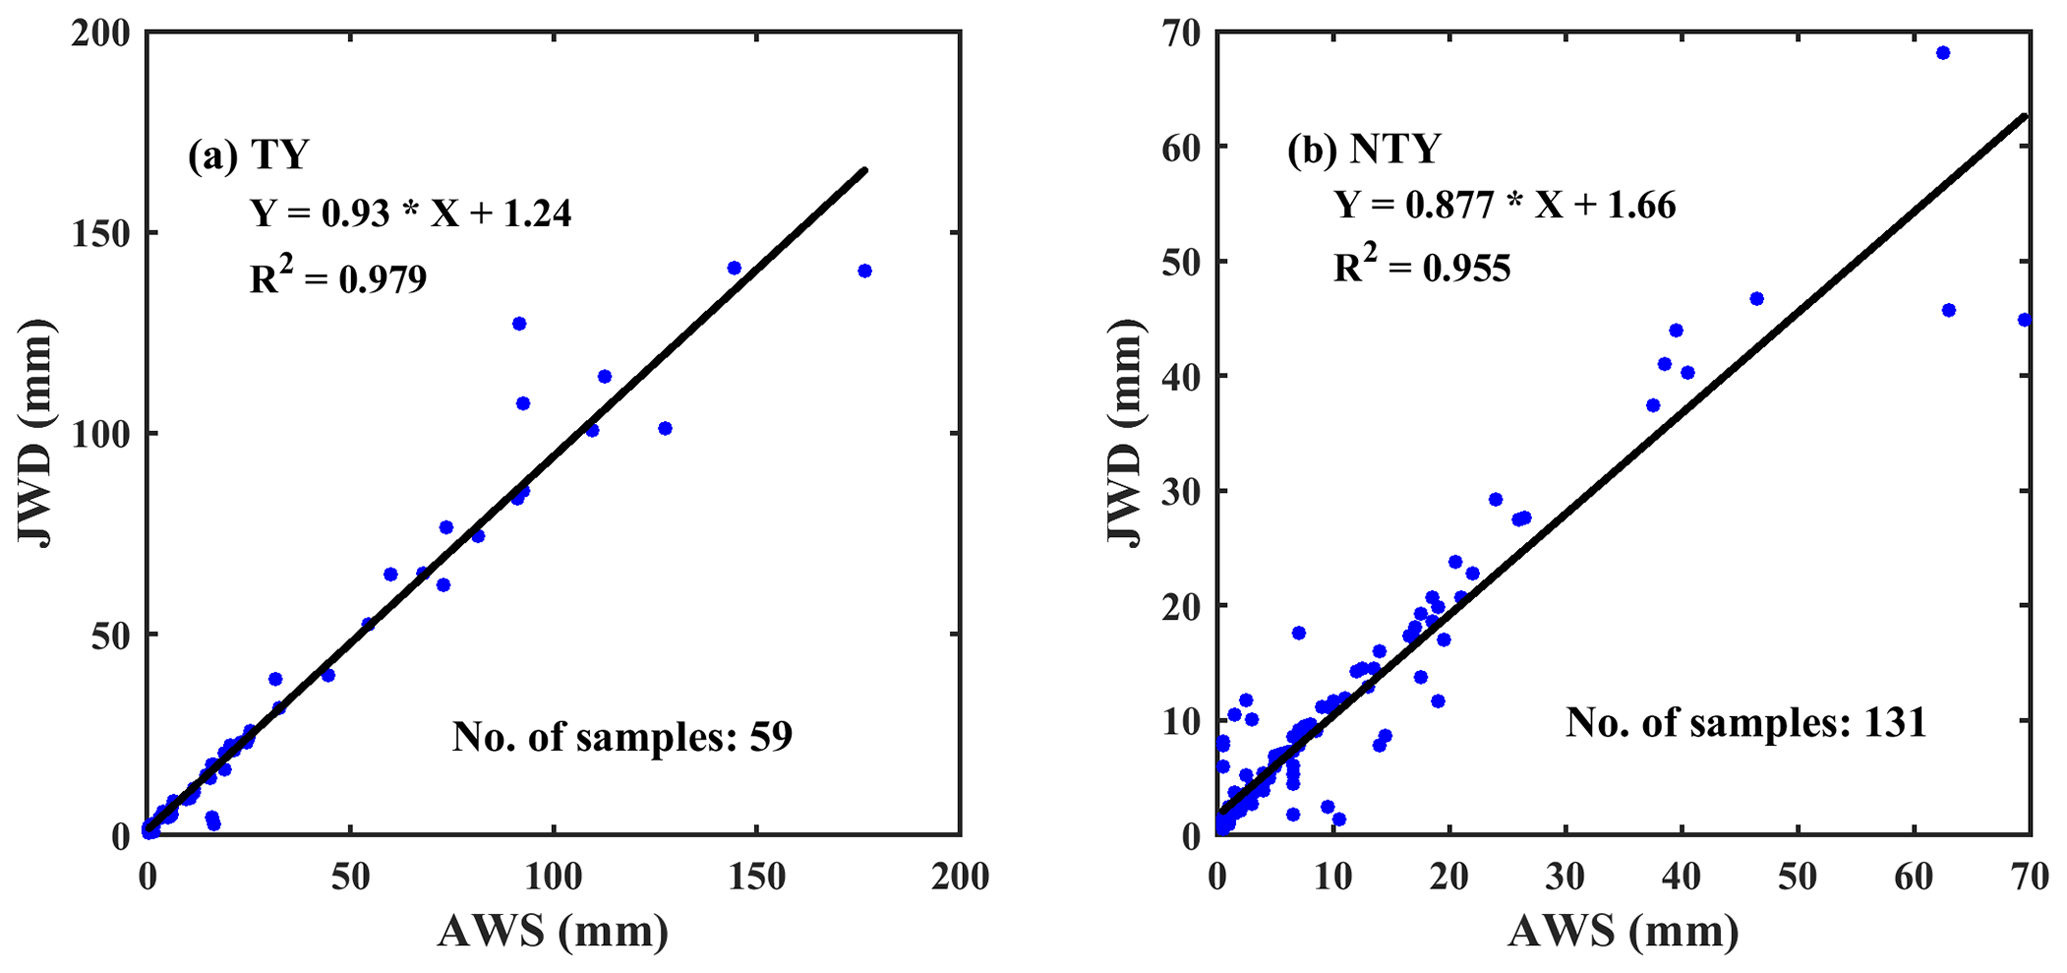
Figure 2The JWD and rain gauge daily accumulations scatterplot for (a) typhoon (TY) and (b) non-typhoon (NTY) rainfall.
The rain or RSD parameters like raindrop concentration N(D) (per millimeter per cubic meter, hereafter mm−1 m−3), radar reflectivity factor Z (sixth power of millimeter per cubic meter, hereafter mm6 m−3), liquid water content W (grams per cubic meter, hereafter g m−3), rainfall rate R (millimeters per hour, hereafter mm h−1), total number concentration Nt (per cubic meter, hereafter m−3), normalized intercept parameter, Nw (per cubic meter per millimeter, hereafter m−3 mm−1), shape parameter μ (no unit), slope parameter Λ (per millimeter, hereafter mm−1), and mass-weighted mean diameter Dm (millimeter, hereafter mm) are estimated from the JWD measurements. The formulations for these rain or RSD parameters are detailed in Seela et al. (2017, 2018), Tokay et al. (2001), Bringi et al. (2003), and Tokay and Short (1996). Along with rain parameters, the rainfall kinetic energy (KE), which can be expressed in KE flux (KEtime in joules per square meter per hour, hereafter J m−2 h−1) and KE content (KEmm in joules per square meter per millimeter, hereafter J m−2 mm−1) were computed for TY and NTY rainfall using the procedures of Fornis et al. (2005), Salles et al. (2002), and van Dijk et al. (2002).
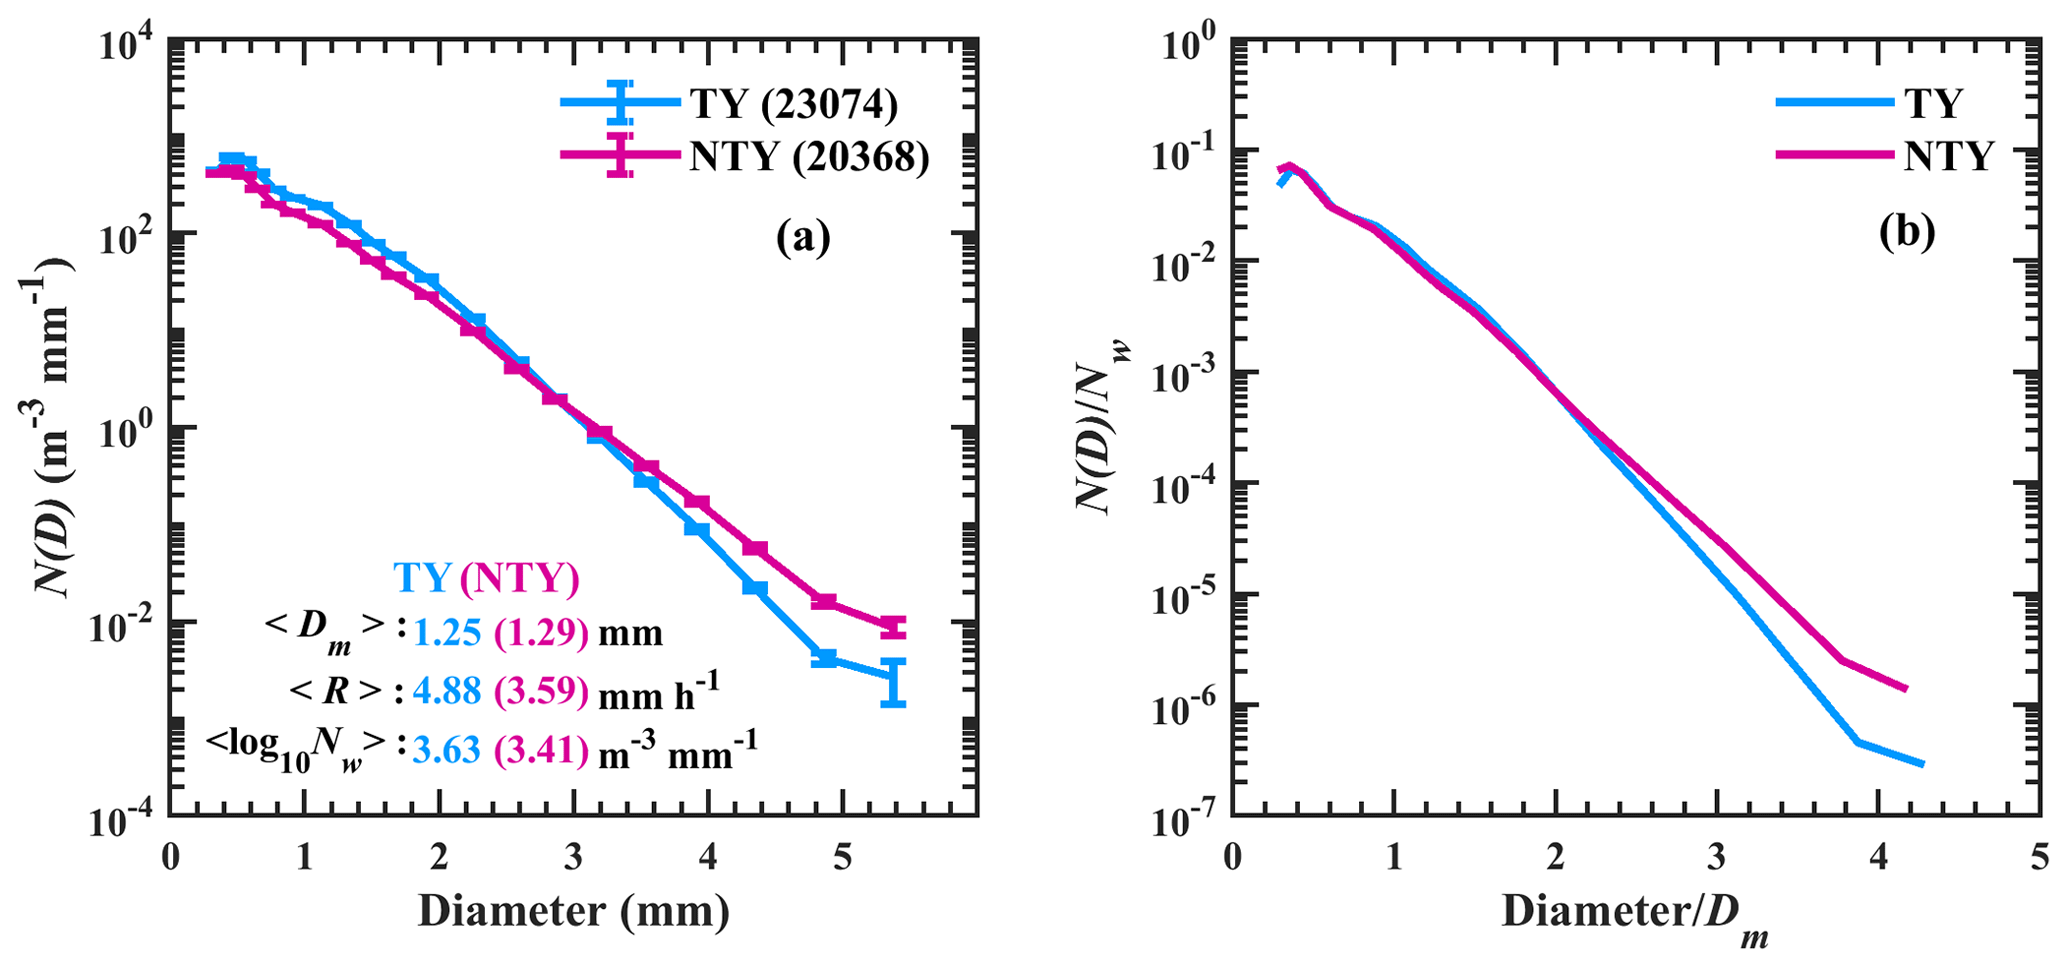
Figure 3(a) Distributions of mean concentration (N(D) in mm−1 m−3) with raindrop diameter for typhoon (TY) and non-typhoon (NTY) rainfall and their (b) normalized spectra.
In addition to disdrometer data, remote sensing (Tropical Rainfall Measuring Mission – TRMM; Moderate-Resolution Imaging Spectroradiometer – MODIS) and reanalysis (ERA-interim) data sets are also used to elucidate the thermodynamical and microphysical characteristics that are accountable for the possible disparities in RSDs between TY and NTY rainfall. Bright band and storm heights from the TRMM satellite (2A23 data product; Iguchi et al., 2000; Kummerow et al., 2001), the cloud effective radii (CER) of liquid and ice particles from the MODIS satellite (MOD08_D3 data product; Platnick et al., 2015; Remer et al., 2005; Nakajima and King, 1989), water vapor, convective available potential energy (CAPE), relative humidity, and temperature profiles from ERA-Interim (Dee et al., 2011) are considered for TY and NTY rainfall. A brief description of these data sets can be found in Seela et al. (2017) and Janapati et al. (2020).
Besides remote sensing and reanalysis data sets, the radar reflectivity profiles from radar mosaics are used to reveal TY and NTY rainfall characteristics. The Z profiles were obtained from the six ground-based radars, and the locations of these radars are depicted with red triangles in Fig. 1. Over the JWD site, the reflectivity profiles available for the period of 2005–2014 are used, and further details on Taiwan radar reflectivity mosaics can be found in Chang et al. (2020).
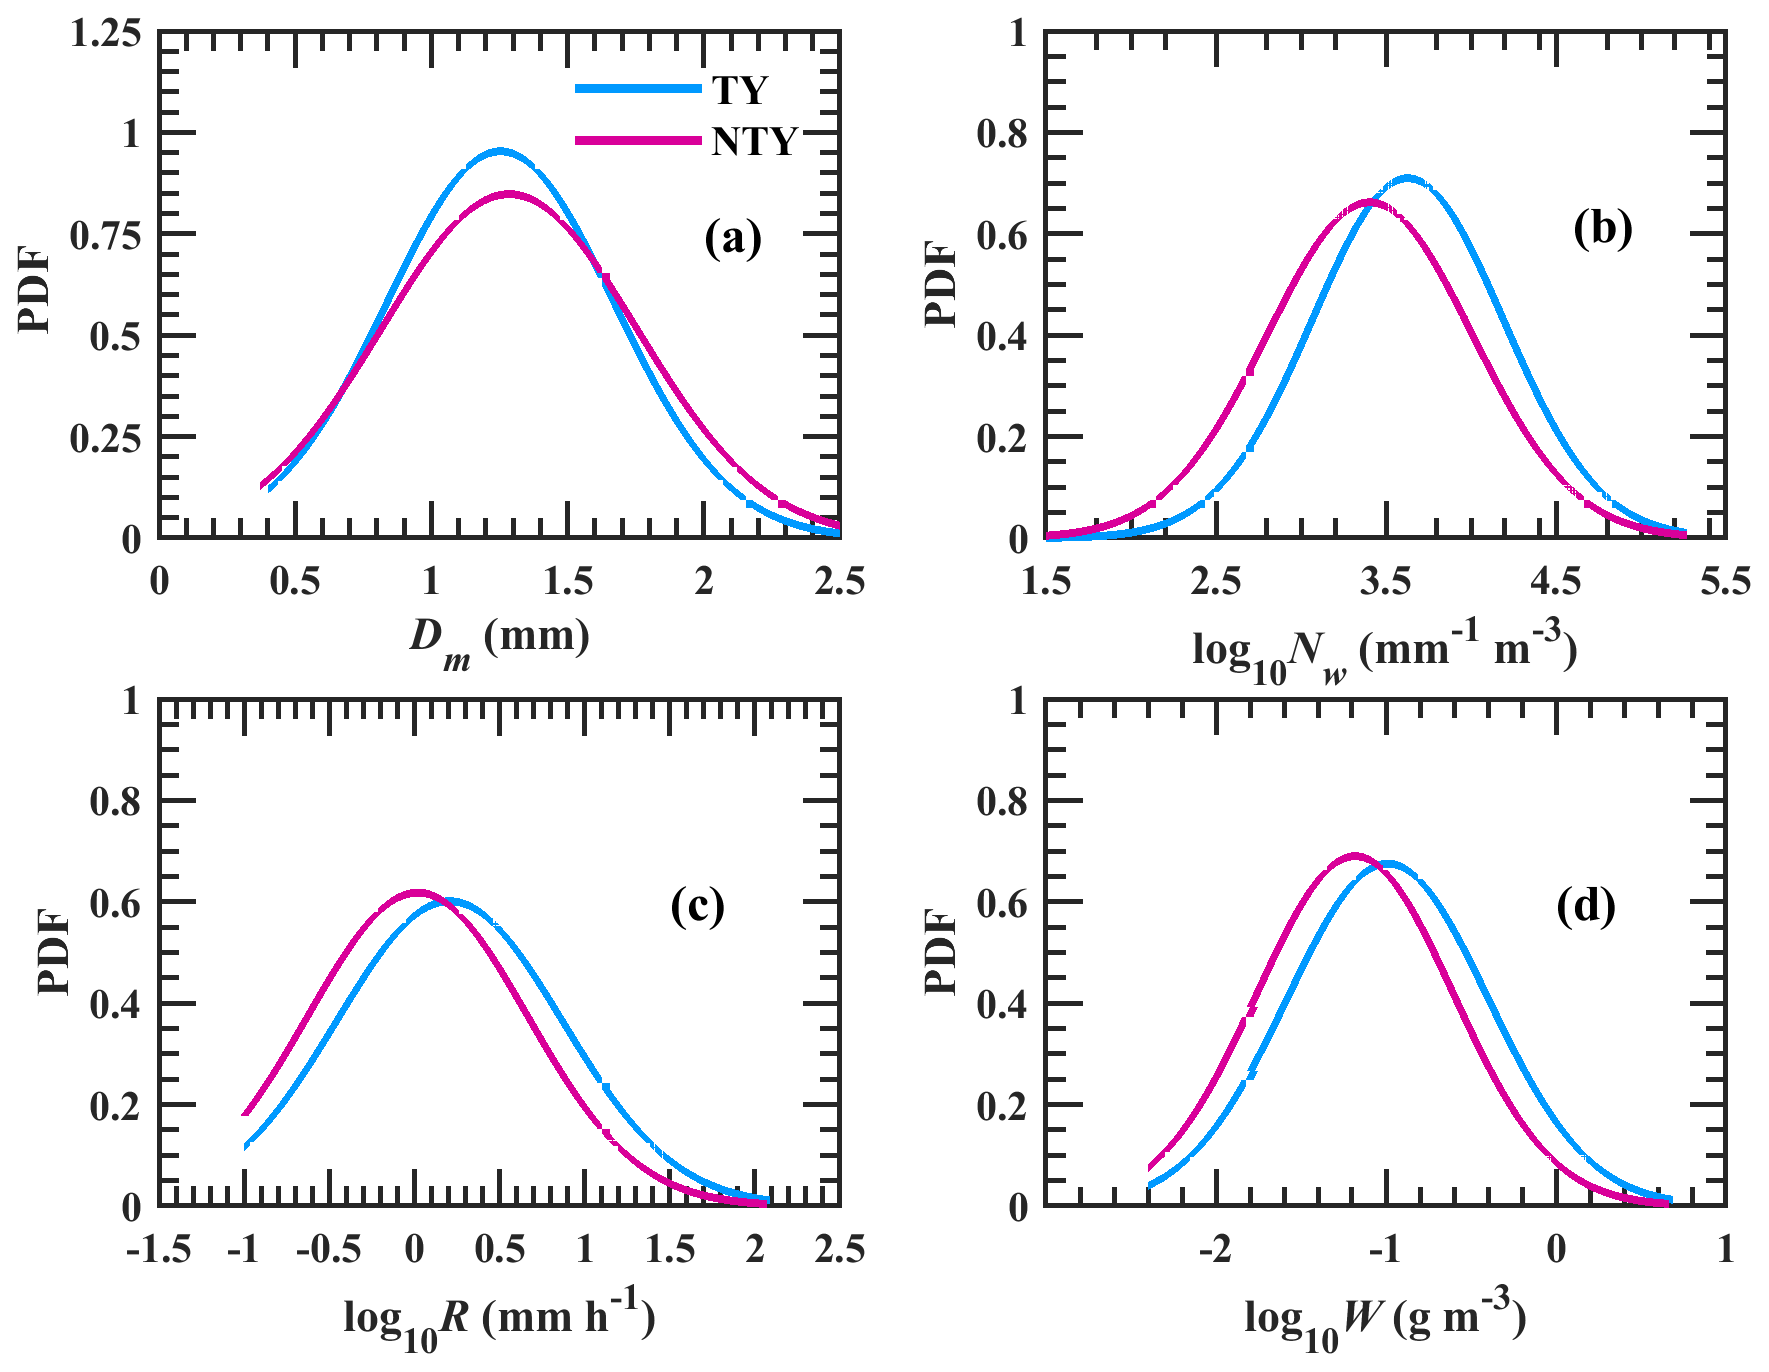
Figure 4The probability distribution functions (PDFs) of (a) mass-weighted mean diameter, Dm (mm), (b) log 10Nw (Nw is the normalized intercept parameter in mm−1 m−3), (c) log 10R (R is the rainfall rate in mm h−1), and (d) log 10W (W is the liquid water content in g m−3) for typhoon (TY) and non-typhoon (NTY) rainfall.
The quality-controlled JWD data showed 23 074 and 20 368 min of RSD samples, respectively, for TY and NTY rainfall, and the mean raindrop concentrations of these two weather conditions are depicted in Fig. 3. In this work, raindrops with a diameter greater than 3 mm, a diameter between 1 and 3 mm, and a diameter of less than 1 mm are named, respectively, as being large, mid-sized, or small drops (Tokay et al., 2008; Seela et al., 2018). As illustrated in Fig. 3a, perceivable segregation between TY and NTY rainfall RSDs can be seen with more large drops in NTY than in TY rainfall. Despite weak distinctions between TY and NTY mean rain spectra for raindrops with diameters of < 2 mm, it can be seen that the spectra variability within TY and NTY classes is smaller than the differences between averaged TY and NTY spectra. Given the dependency of the raindrop concentration on the rainfall rate, it is difficult to interpret alterations between TY and NTY rainfall RSDs from Fig. 3a. Consequently, we implemented the normalization procedure (Testud et al., 2001), which is independent of the shape of the observed raindrop spectra, to the TY and NTY RSDs. For TY and NTY rainfall, the drop diameter (D; millimeter, hereafter mm) and raindrop concentrations (N(D); mm−1 m−3) are normalized, respectively, by the mass-weighted mean diameter (Dm; mm) and the normalized intercept parameter (Nw; mm−1 m−3), and these normalized RSDs are illustrated in Fig. 3b. A remarkable departure in the normalized RSDs spectra between NTY and TY rainfall (for ) insinuates that divergent microphysical processes were involved in these two weather conditions.
For TY and NTY rainfall, the probability density functions (PDFs) are evaluated for Dm (mass-weighted mean diameter in mm), log 10Nw (Nw is normalized intercept parameter in mm−1 m−3), log 10R (R is rainfall rate in mm h−1), and log 10W (W is the liquid water content in g m−3) and are depicted in Fig. 4. Figure 4a demonstrates that the PDF of Dm in NTY rainfall has higher distribution than TY rainfall for Dm>1.7 mm. The log 10Nw (log 10R) PDF distribution shows peak values around 3.7 (0.3) and 3.4 (0), respectively, for TY and NTY rainfall (Fig. 4b and c). The PDF of log 10W shows a higher percentage at lower log 10W values () in NTY rainfall, and a higher percentage at higher log 10W values () in TY rainfall (Fig. 4d). Furthermore, a statistical Student's t test (used to determine whether two data sets are significantly different from each other or not) is executed between TY and NTY rainfall Dm values. The test results rejected the null hypothesis at 0.05 and 0.01 significance levels, confirming that the Dm values in TY rainfall are different from that of the NTY rainfall. Similarly, Student's t test performed for the other three parameters (log 10Nw, log 10R, and log 10W) also showed that these parameters in TY rainfall are different from those of the NTY rainfall.
3.1 Contribution of raindrop diameters to Nt and R
The contributions of raindrop diameter classes (diameter of < 1, 1–2, 2–3, 3–4, and 4–5 mm) to Nt (m−3) and R (mm h−1) for TY and NTY rainfall are shown in Fig. 5. As can be seen in Fig. 5a and b, for both TY and NTY rainfall, with the increase of drop diameter classes, the contribution to total number concentration decreases, while that of the rainfall rate increases and then lessens. Such peculiarities were noticed by previous researchers investigating tropical cyclones (Chen et al., 2019) and summer season rainfall (Wu et al., 2019). For both TY and NTY rainfall, small-sized drops (<1 mm) lead to large number concentrations (>70 %) and lead to about 10 % rainfall rate. For both TY and NTY rainfall, raindrops with a 1–2 mm diameter contribute around 20 % to number concentration; nonetheless, these raindrops (1–2 mm) yield around 60 % (55 %) of the rainfall rate for TY (NTY) rainfall. The contribution of raindrops with diameters 2–3 mm to the number concentration is negligible, and the rainfall rate is above 20 % for both TY and NTY rainfall. Figure 5a and b emphasize the predominant contribution of small (<1 mm) and mid-sized drops (1–3 mm) to total number concentration and rainfall rate compared to large drops. The occurrence percentages of Nt (m−3) ([(Nt)TY or and R (mm h−1) ([(R)TY or at different diameter classes are illustrated, respectively, in Fig. 5c and d. For the first three drop diameter classes (<1, 1–2, and 2–3 mm), the Nt (m−3) percentages are more predominant in TY than in NTY rainfall, and in contrast, for large drops (>3 mm), the Nt (m−3) percentages are higher in NTY than TY rainfall. Similar to the Nt (m−3), the rainfall rate percentages are higher in TY than NTY rainfall for small and mid-sized drops, and an opposite feature can be seen for large drops (>3 mm).
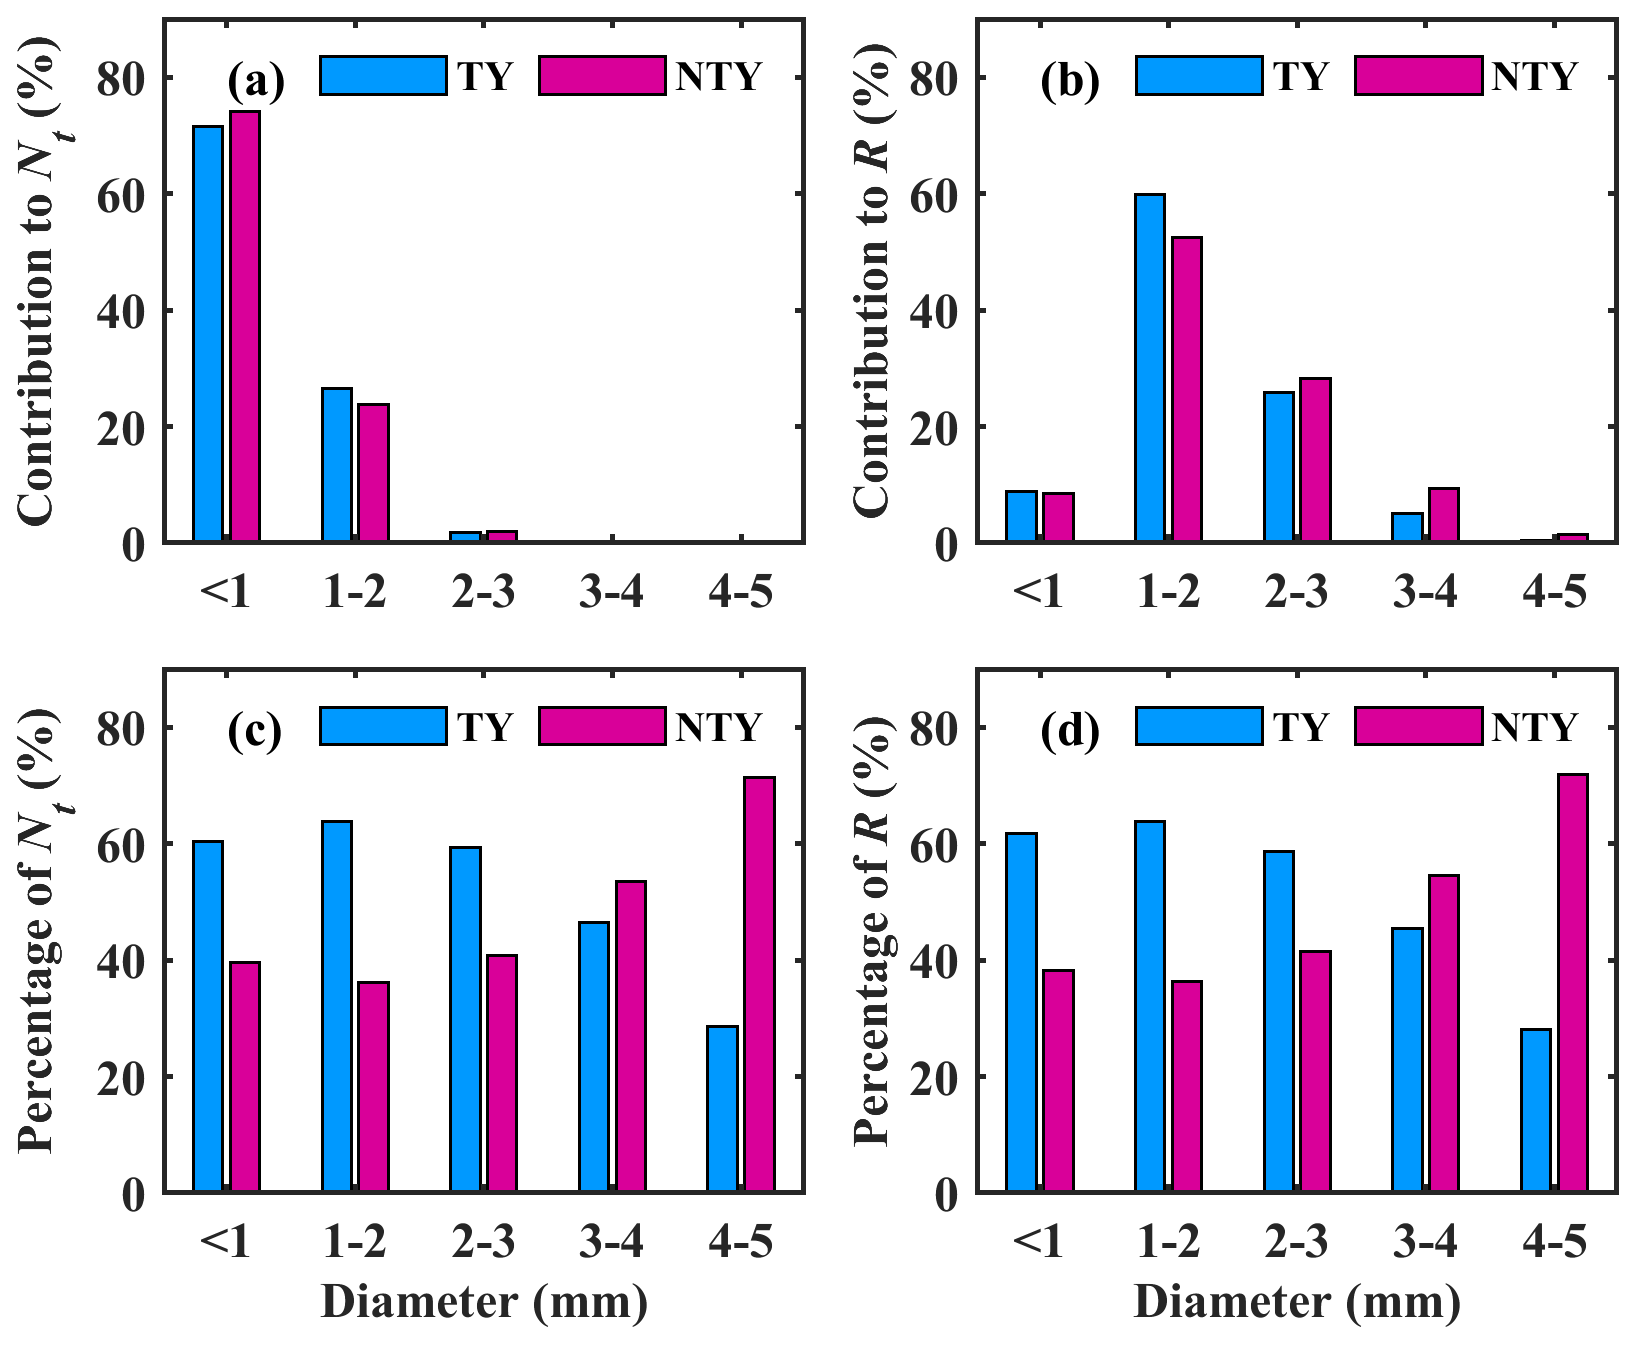
Figure 5Contribution of drop diameter classes (diameter is < 1, 1–2, 2–3, 3–4, and 4–5 mm) to (a) total number concentration Nt (m−3) and (b) rainfall rate R (mm h−1) in typhoon (TY) and non-typhoon (NTY) rainfall. The occurrence percentage of (c) total number concentration Nt (m−3) and (d) rainfall rate R (mm h−1) in each diameter class for typhoon (TY) and non-typhoon (NTY) rainfall.
3.2 Segregation of RSDs based on rainfall rates
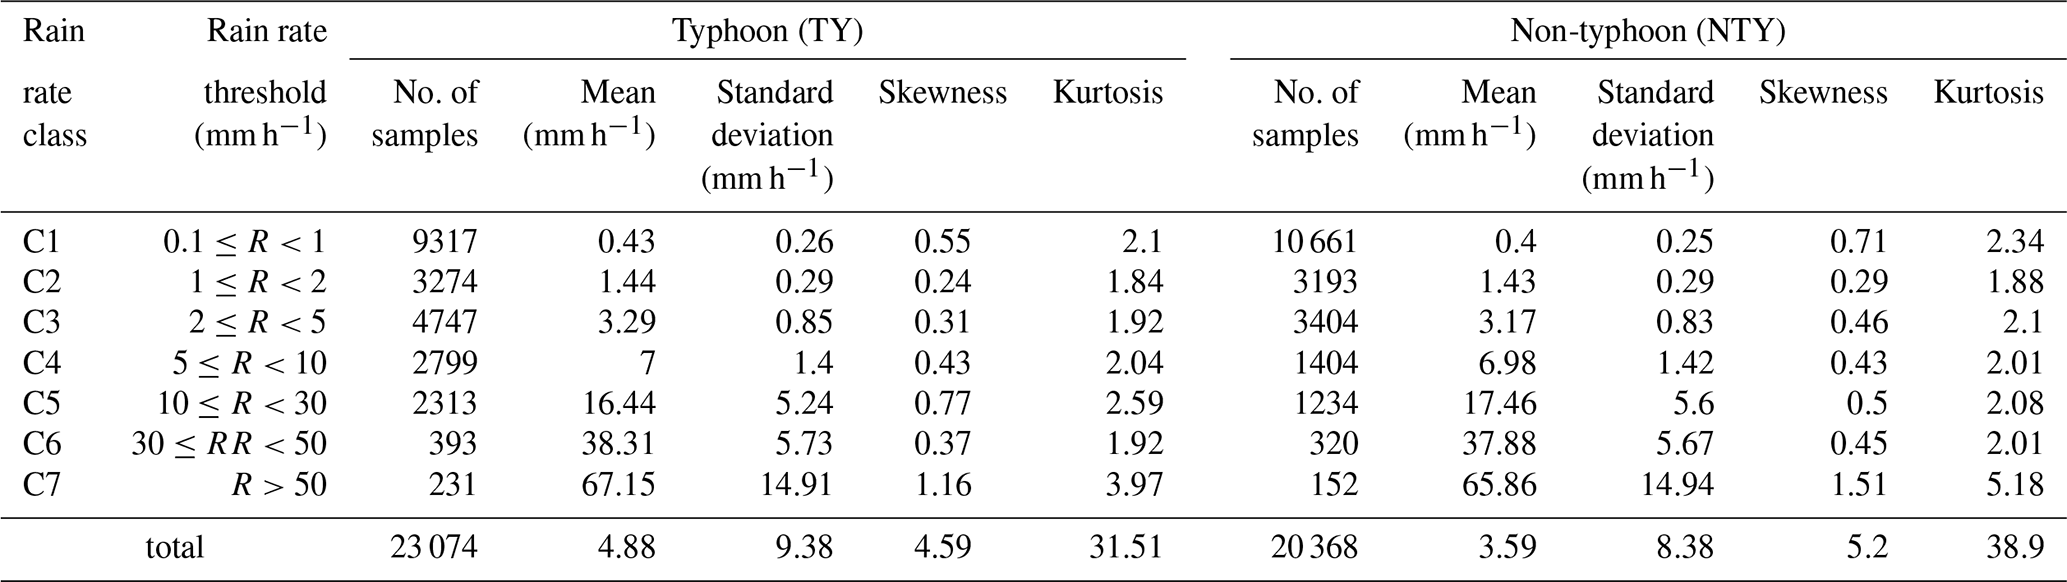
To further explore the discrepancies between TY and NTY rainfall RSDs, we segregate the TY and NTY RSDs into seven rainfall rate classes (as given in Table 2) using the below-mentioned grouping criteria. The data points in each rainfall rate category should be sufficiently large in TY and NTY rainfall, and for each category, the mean values of rainfall rates should be nearly equal between these two weather conditions (TY and NTY rainfall; Jayalakshmi and Reddy, 2014; Deo and Walsh, 2016; Seela et al., 2017). Statistical values of these seven rainfall rate categories are specified in Table 2 for TY and NTY rainfall. As depicted in the table, the mean values of the rainfall rates are nearly equal between these two weather conditions (TY and NTY). Excluding the fourth and fifth rainfall rate class (C4 and C5), the skewness values are more excessive in NTY than TY rainfall. Correspondingly, these two weather conditions (TY and NTY) show positive skewness, designating that the rainfall rates are focused to the left of the mean. The RSD peculiarities between TY and NTY rainfall are evaluated in a percentage parameter (i.e., the ratio of N(D) in TY or NTY rainfall for the raindrop diameter D and rainfall rate class R to the raindrop concentration accumulations in TY and NTY rainfall) context, as explicated in Seela et al. (2018). The percentage parameter of N(D) for different rain rate class, is given as follows:
where [N(D)TY]Ck or [N(D)NTY]Ck represent the mean N(D) of TY or NTY rainfall for the rain rate class Ck, with k=1, 2, 3, 4, 5, 6, and 7 (C1 is , C2 is , C3 is , C4 is , C5 is , C6 is , and C7 is R>50, where R is in mm h−1; please refer to Table 2).
Table 2Rainy minutes (N), mean, standard deviation (SD), skewness, and kurtosis of seven rainfall rate classes for typhoon (TY) and non-typhoon (NTY) rainy days of summer seasons.
The raindrop concentration percentages are appraised for both TY and NTY rainfall and are illustrated in Fig. 6. The percentage contribution of N(D) for TY and NTY rainfall corroborated that small and mid-sized drops (<3 mm) display a superior percentage in TY than in NTY rainfall. Nevertheless, large drops (>3 mm) unveil a higher percentage of N(D) in NTY than in TY rainfall.
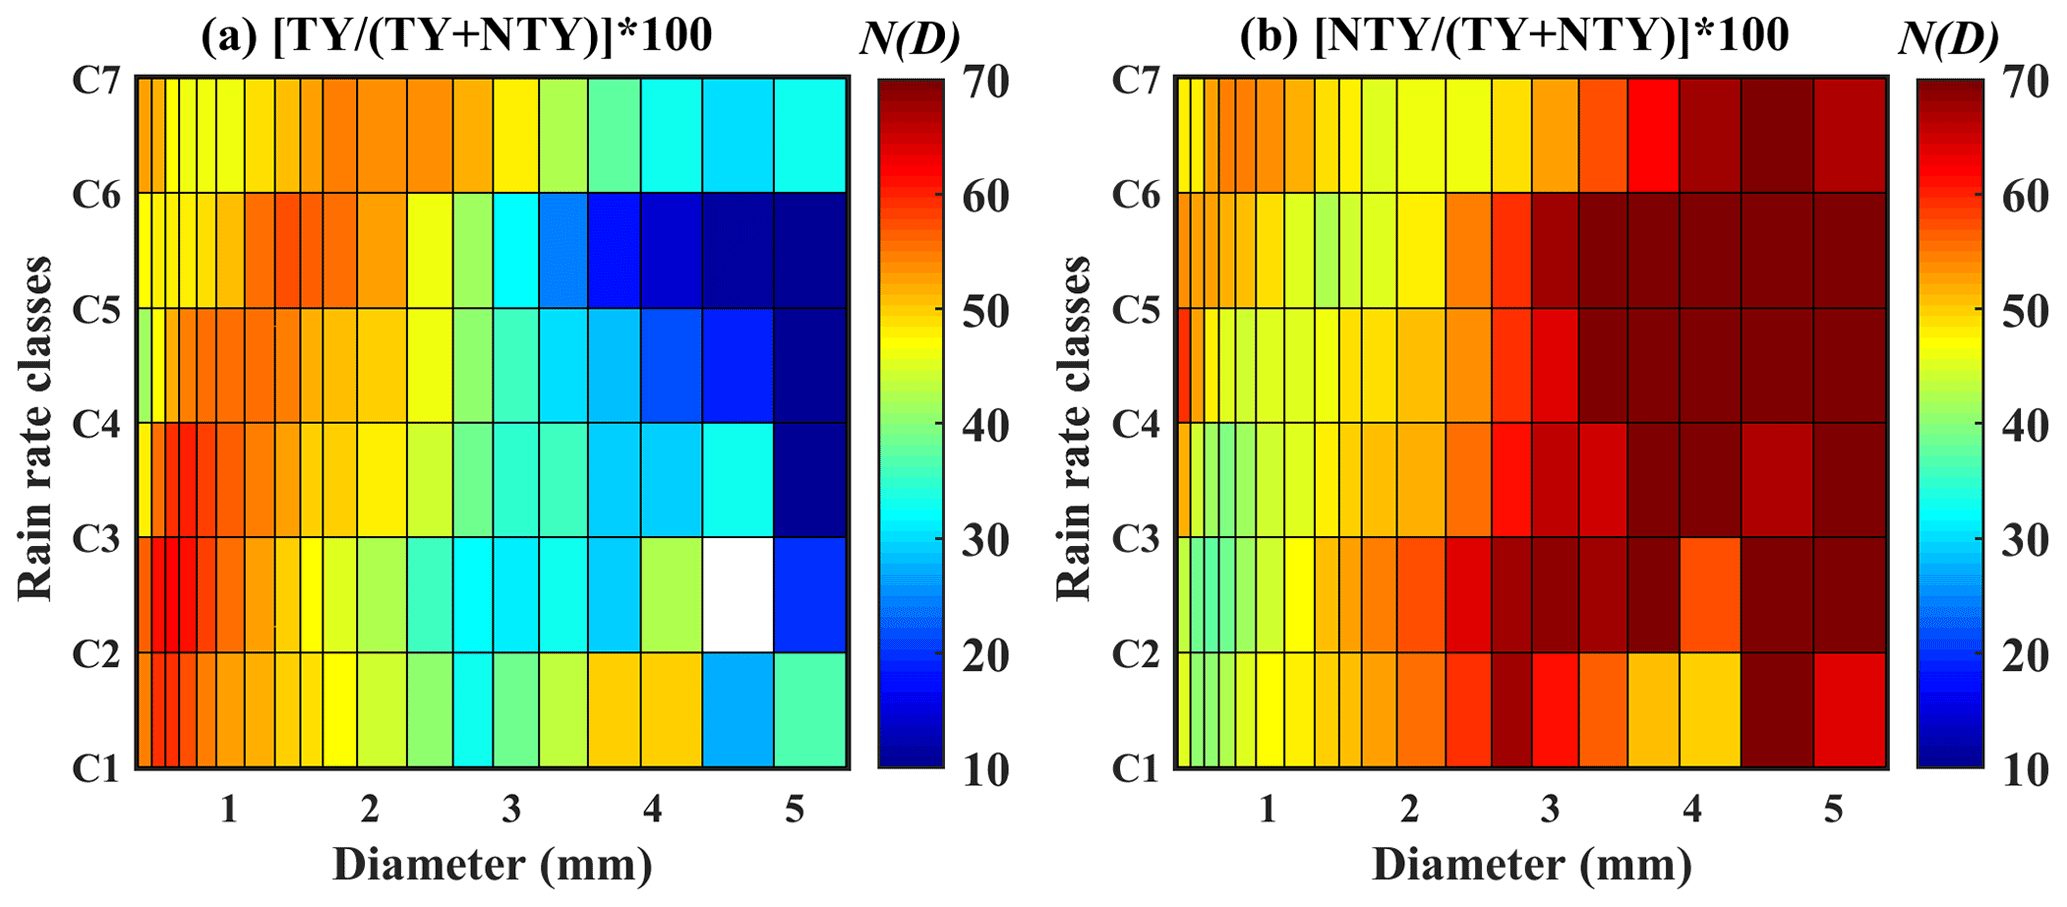
Figure 6Percentage contribution of N(D) (mm−1 m−3) in different rainfall rate classes for typhoon (TY) and non-typhoon (NTY) rainfall.
Distributions of Dm (mm) and log 10Nw (m−3 mm−1) for seven rainfall rate classes are depicted with box plots in Fig. 7. As can be seen in Fig. 7a, with the increase in rainfall rate class, Dm values increase for both TY and NTY rainfall, which is due to an increase in the concentration of large-sized drops and a reduction in the concentration of small drops (Rosenfeld and Ulbrich, 2003; Krishna et al., 2016). Similar findings were noticed by previous researchers for both tropical cyclone and non-tropical cyclone rainfall (Bao et al., 2020; Deo and Walsh, 2016; Jayalakshmi and Reddy, 2014; Radhakrishna and Narayana Rao, 2010). On the other hand, Dm values are greater in NTY than in TY rainfall in all rainfall rate classes due to the predominant concentration of mid-sized and small-sized raindrops on TY than on NTY days (Fig. 6). Compared to Dm, for all seven rainfall rate classes, the log 10Nw values are higher in TY than in NTY rainfall (Fig. 7b).
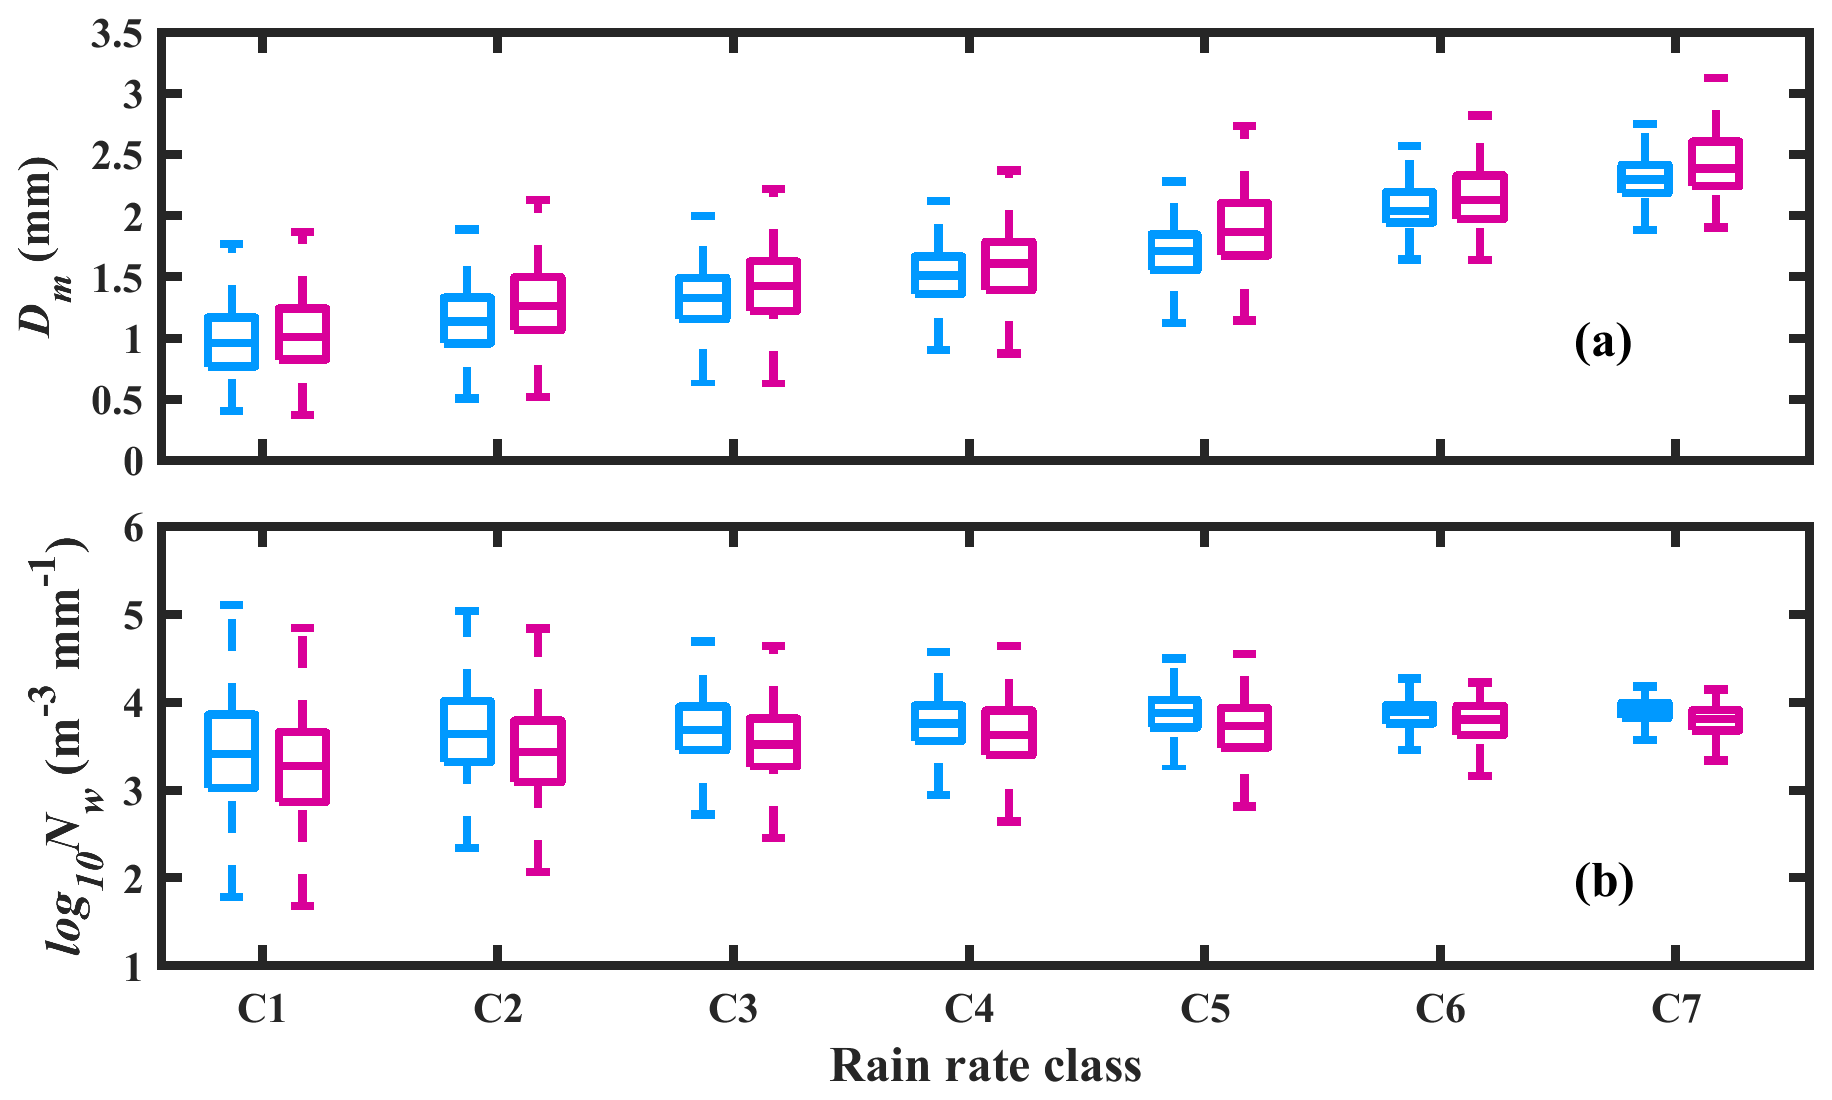
Figure 7Box plot of (a) Dm (mm) and (b) log 10Nw (mm−1 m−3) in seven rainfall rate classes for typhoon (TY; sky blue) and non-typhoon (NTY; dark magenta) rainfall. The center line of the box indicates the median, and the bottom and top lines of the box indicate the 25th and 75th percentiles, respectively. The bottom and top of the dashed vertical lines indicate the 5th and 95th percentiles, respectively.
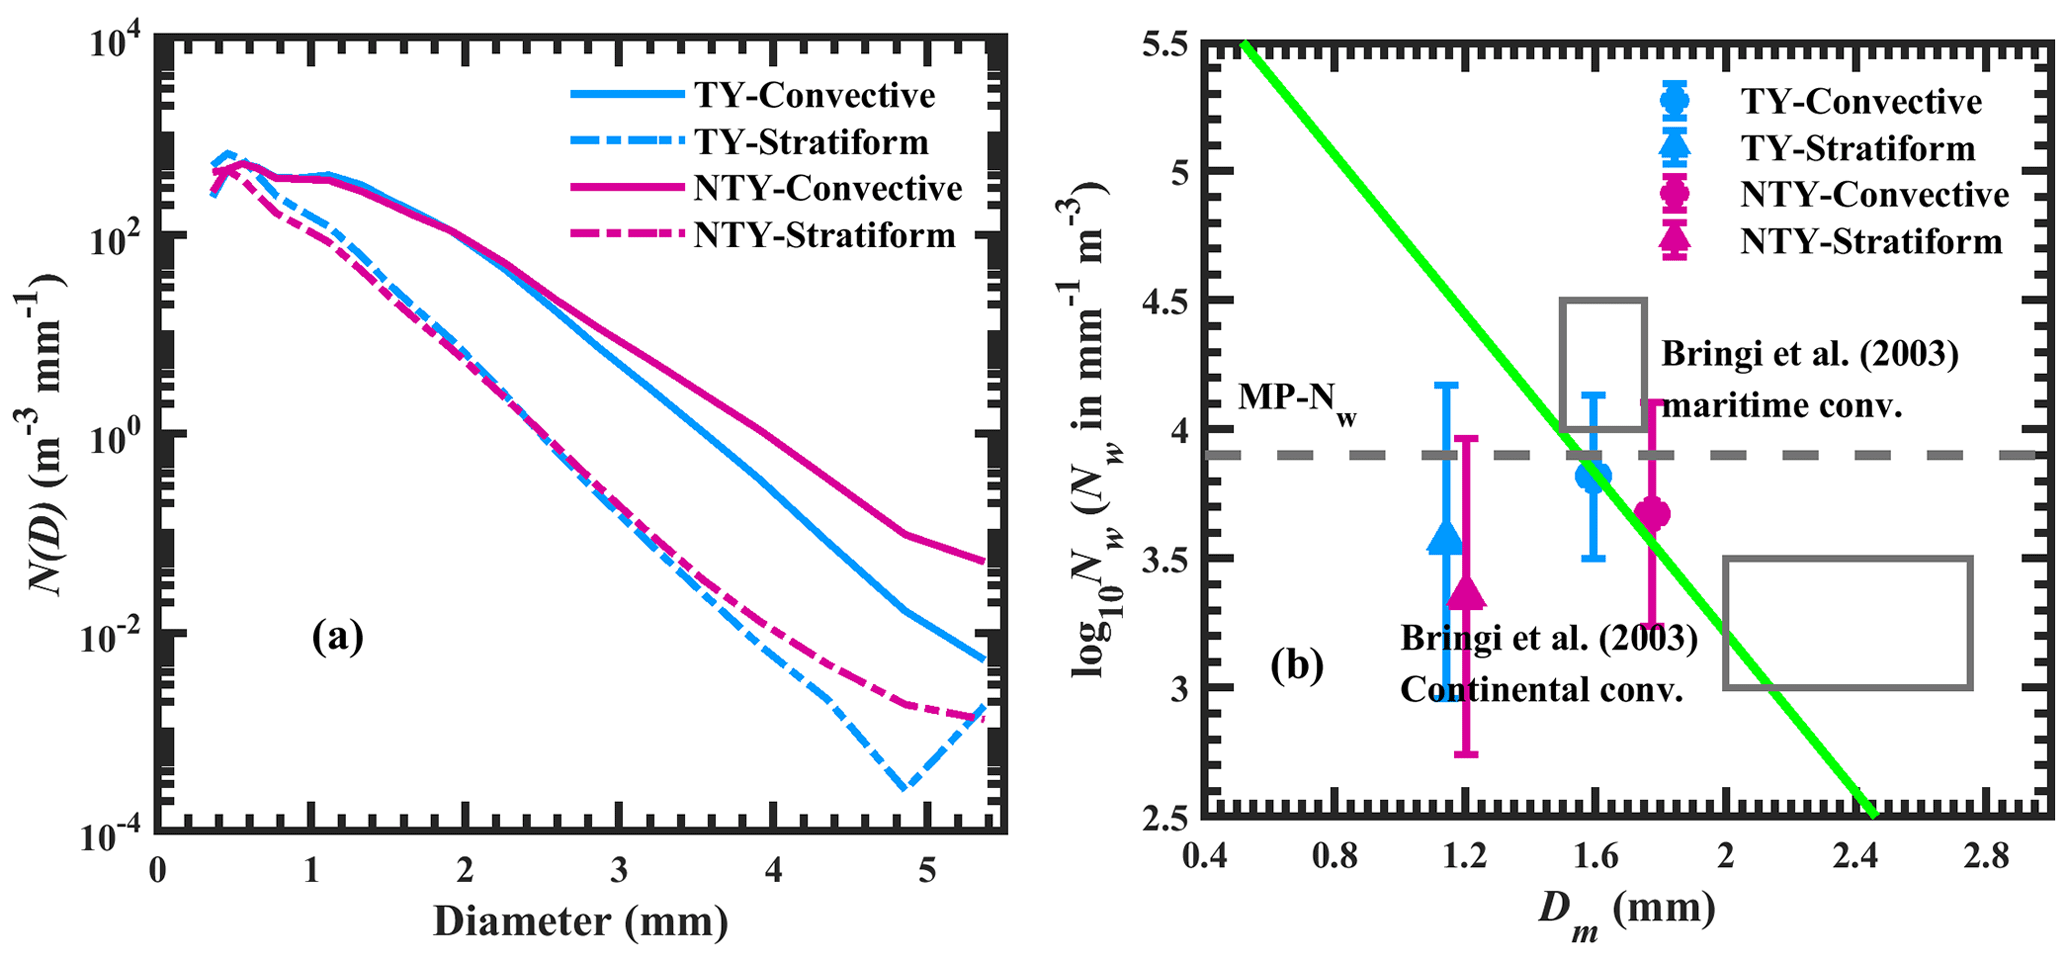
Figure 8(a) Distribution of N(D) (m−3 mm−1) with raindrop diameter in stratiform and convective precipitation for typhoon (TY) and non-typhoon (NTY) rainfall. (b) Variations in log 10Nw (where Nw is the normalized intercept parameter in mm−1 m−3) with Dm (mass-weighted mean diameter in mm) in stratiform and convective regimes for typhoon (TY) and non-typhoon (NTY) rainfall. The horizontal gray dashed line is the Marshall–Palmer value of log 10Nw (3.9) for the exponential shape. The green inclined line is the stratiform and convective separation line of Bringi et al. (2003).
3.3 RSDs in precipitation types
Ample literature showed a distinction between the RSDs with the precipitation type, and numerous methods were documented for the segregation of the precipitation into stratiform and convective types (Ma et al., 2019; Jayalakshmi and Reddy, 2014; Ulbrich and Atlas, 2007). For instance, Tokay and Short (1996) reported variations in convective precipitation to that of the stratiform regimes. Some studies emphasized the importance of adopting precipitation-specific rainfall estimation relations (Ulbrich and Atlas, 2007). In separating the TY and NTY rainfall into stratiform and convective types, we adopted the modified form of the Bringi et al. (2003) classification method, as mentioned in Ma et al. (2019). Distributions of mean N(D) (m−3 mm−1) with raindrop diameters for TY and NTY rainfall are depicted in Fig. 8a. Except for the first drop size bin, higher drop concentrations are noticed for convective rainfall than for the stratiform rainfall. Concave-shaped N(D), with a broader distribution in convective than in stratiform types, is due to the breakup of large drops by collisions (Hu and Srivastava, 1995). The RSD characteristics demonstrated by the stratiform and convective precipitation show similar features to that of the earlier studies for continental (Jayalakshmi and Reddy, 2014) and oceanic regions (Krishna et al., 2016). On the other hand, in stratiform and convective regimes, the mid-sized and large drop concentration is higher in NTY than TY rainfall. Variations in Dm and log 10Nw for both precipitation of TY and NTY are depicted in Fig. 8b. The maritime and continental convective clusters of Bringi et al. (2003) are depicted with gray rectangles. For both TY and NTY rainfall, larger mean Dm and log 10Nw values are noticed for convective precipitation. In contrast to that, in stratiform and convective regimes, the NTY rainfall exhibit smaller log 10Nw and larger Dm values than TY rainfall.
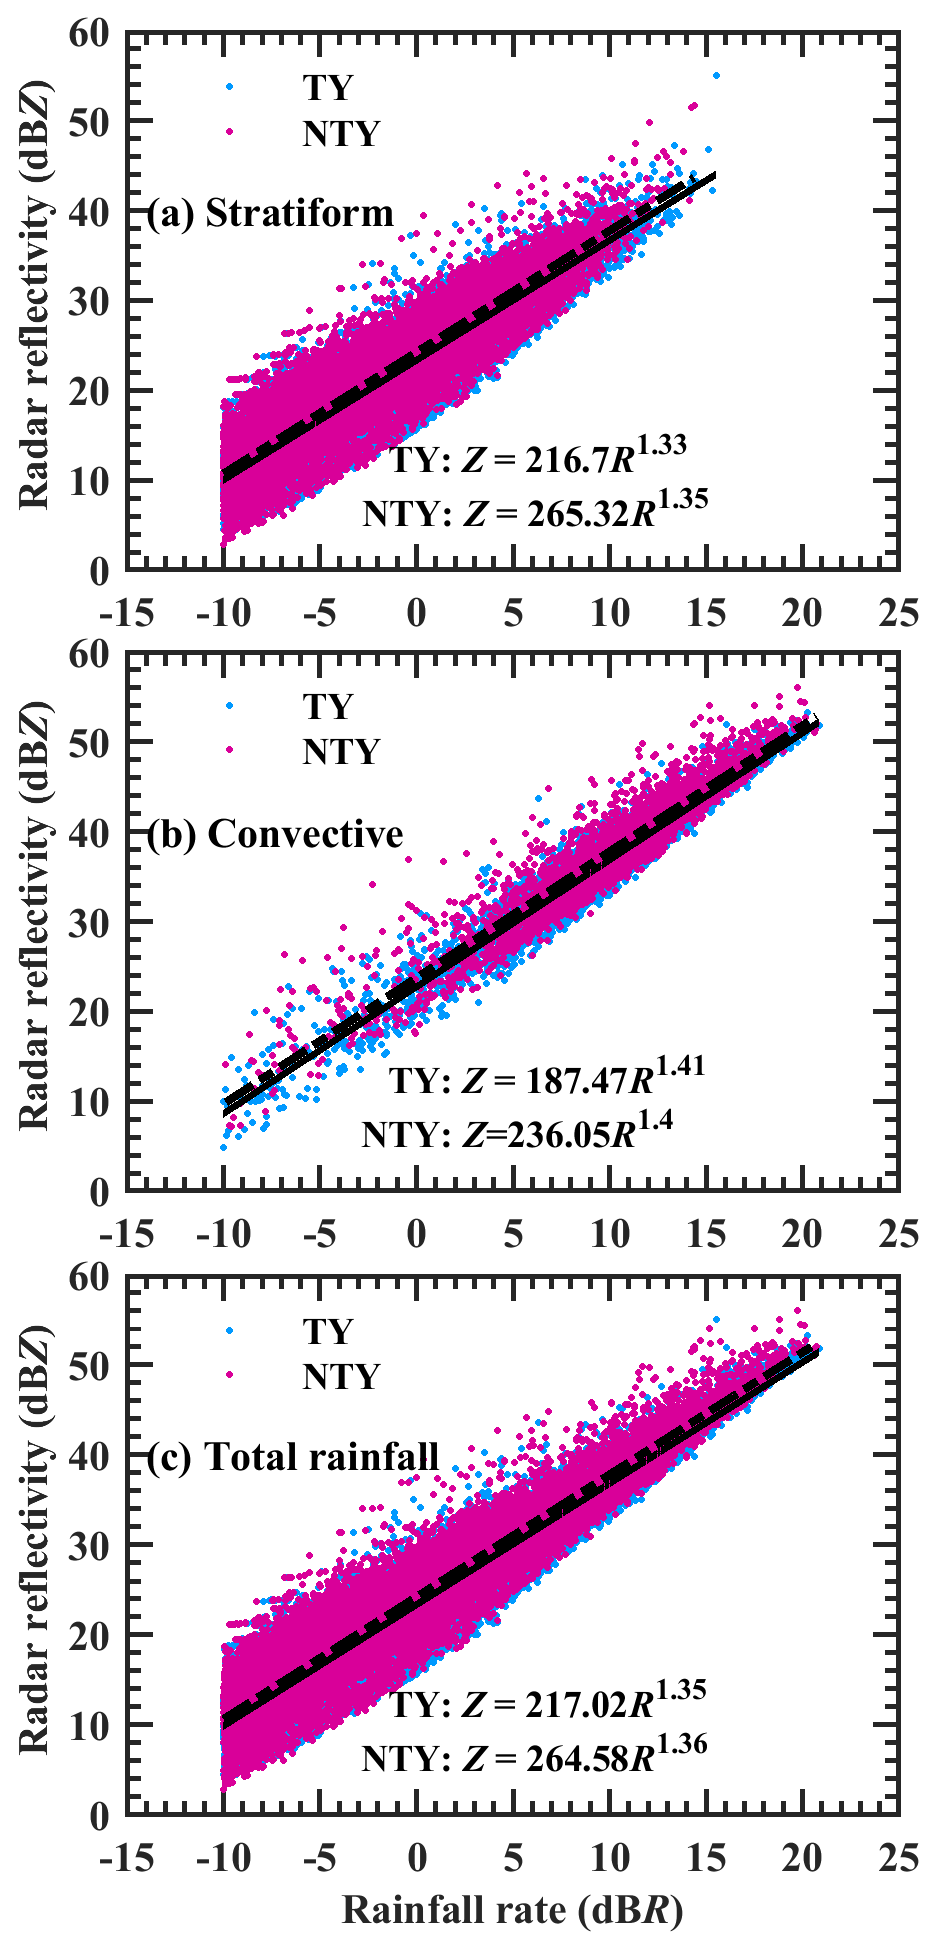
Figure 9Scatterplots of radar reflectivity (Z; dBZ) and rainfall rate in logarithmic scale (10×log 10R, dBR, and R in mm h−1) for typhoon (TY) and non-typhoon (NTY) rainfall.
Table 3Statistical parameters (correlation coefficient – R2; root mean square error – RMSE; normalized RMSE – NRMSE) for typhoon (TY) and non-typhoon (NTY) rainy days. Note that the units for RMSE are J m−2 h−1 for KEtime–R relations and J m−2 mm−1 for KEmm–R and KEmm–Dm relations.
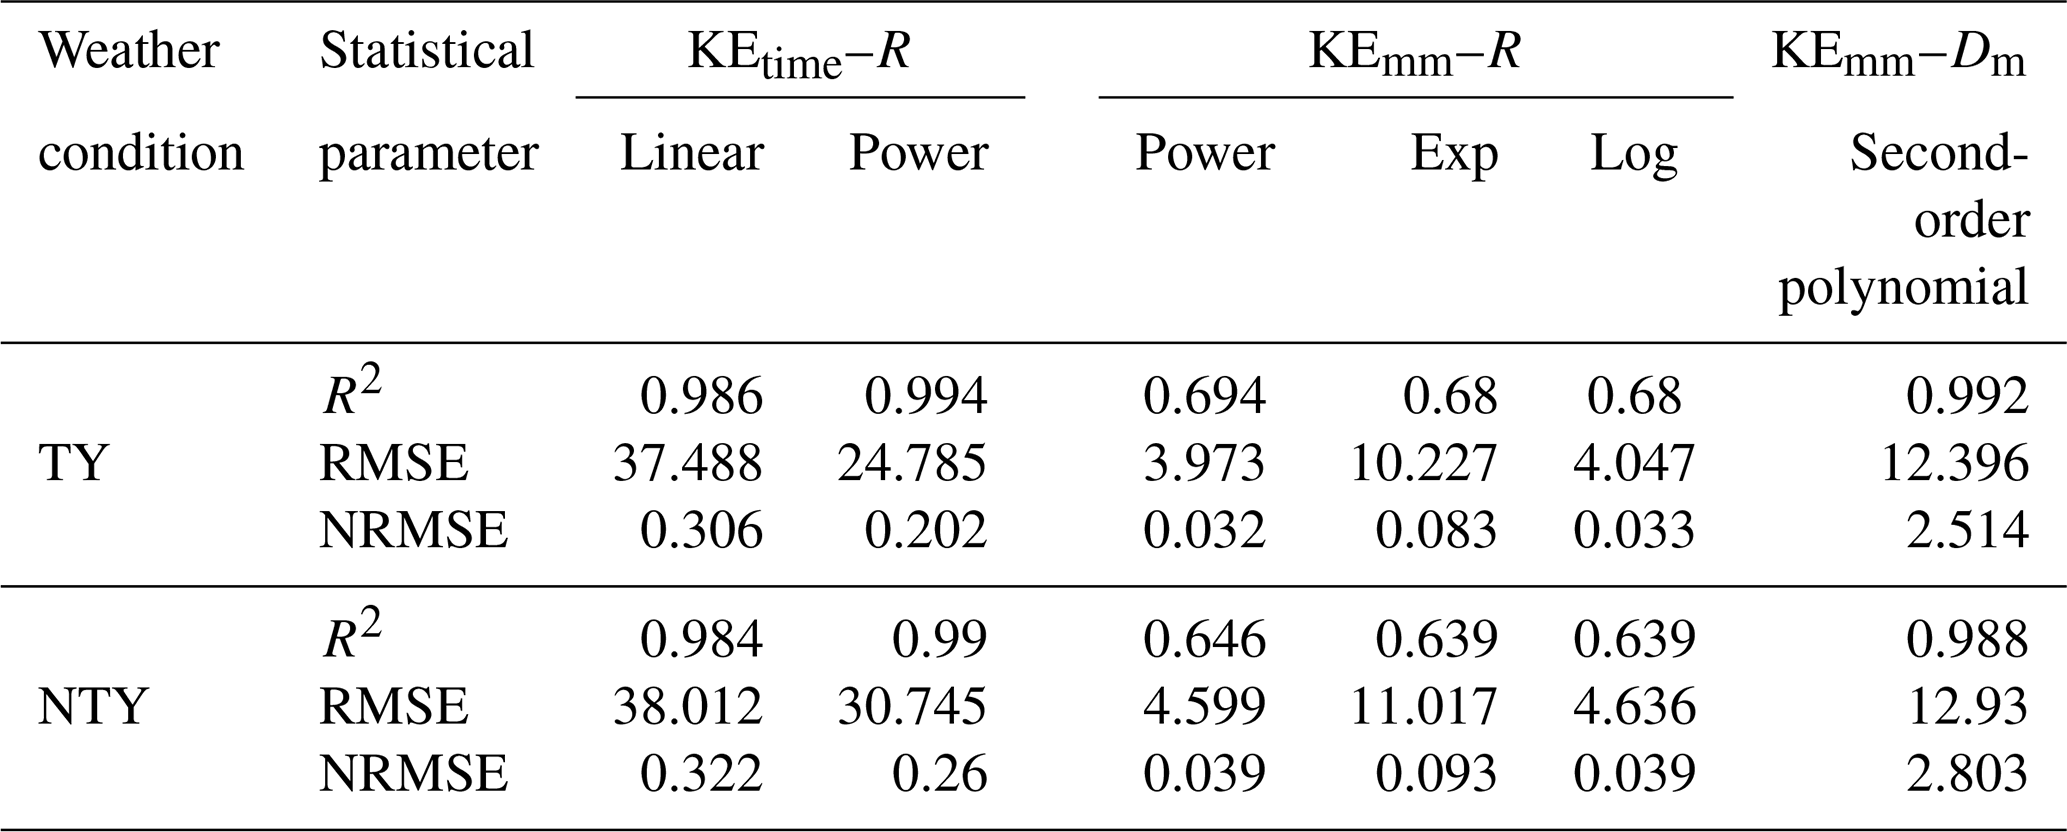
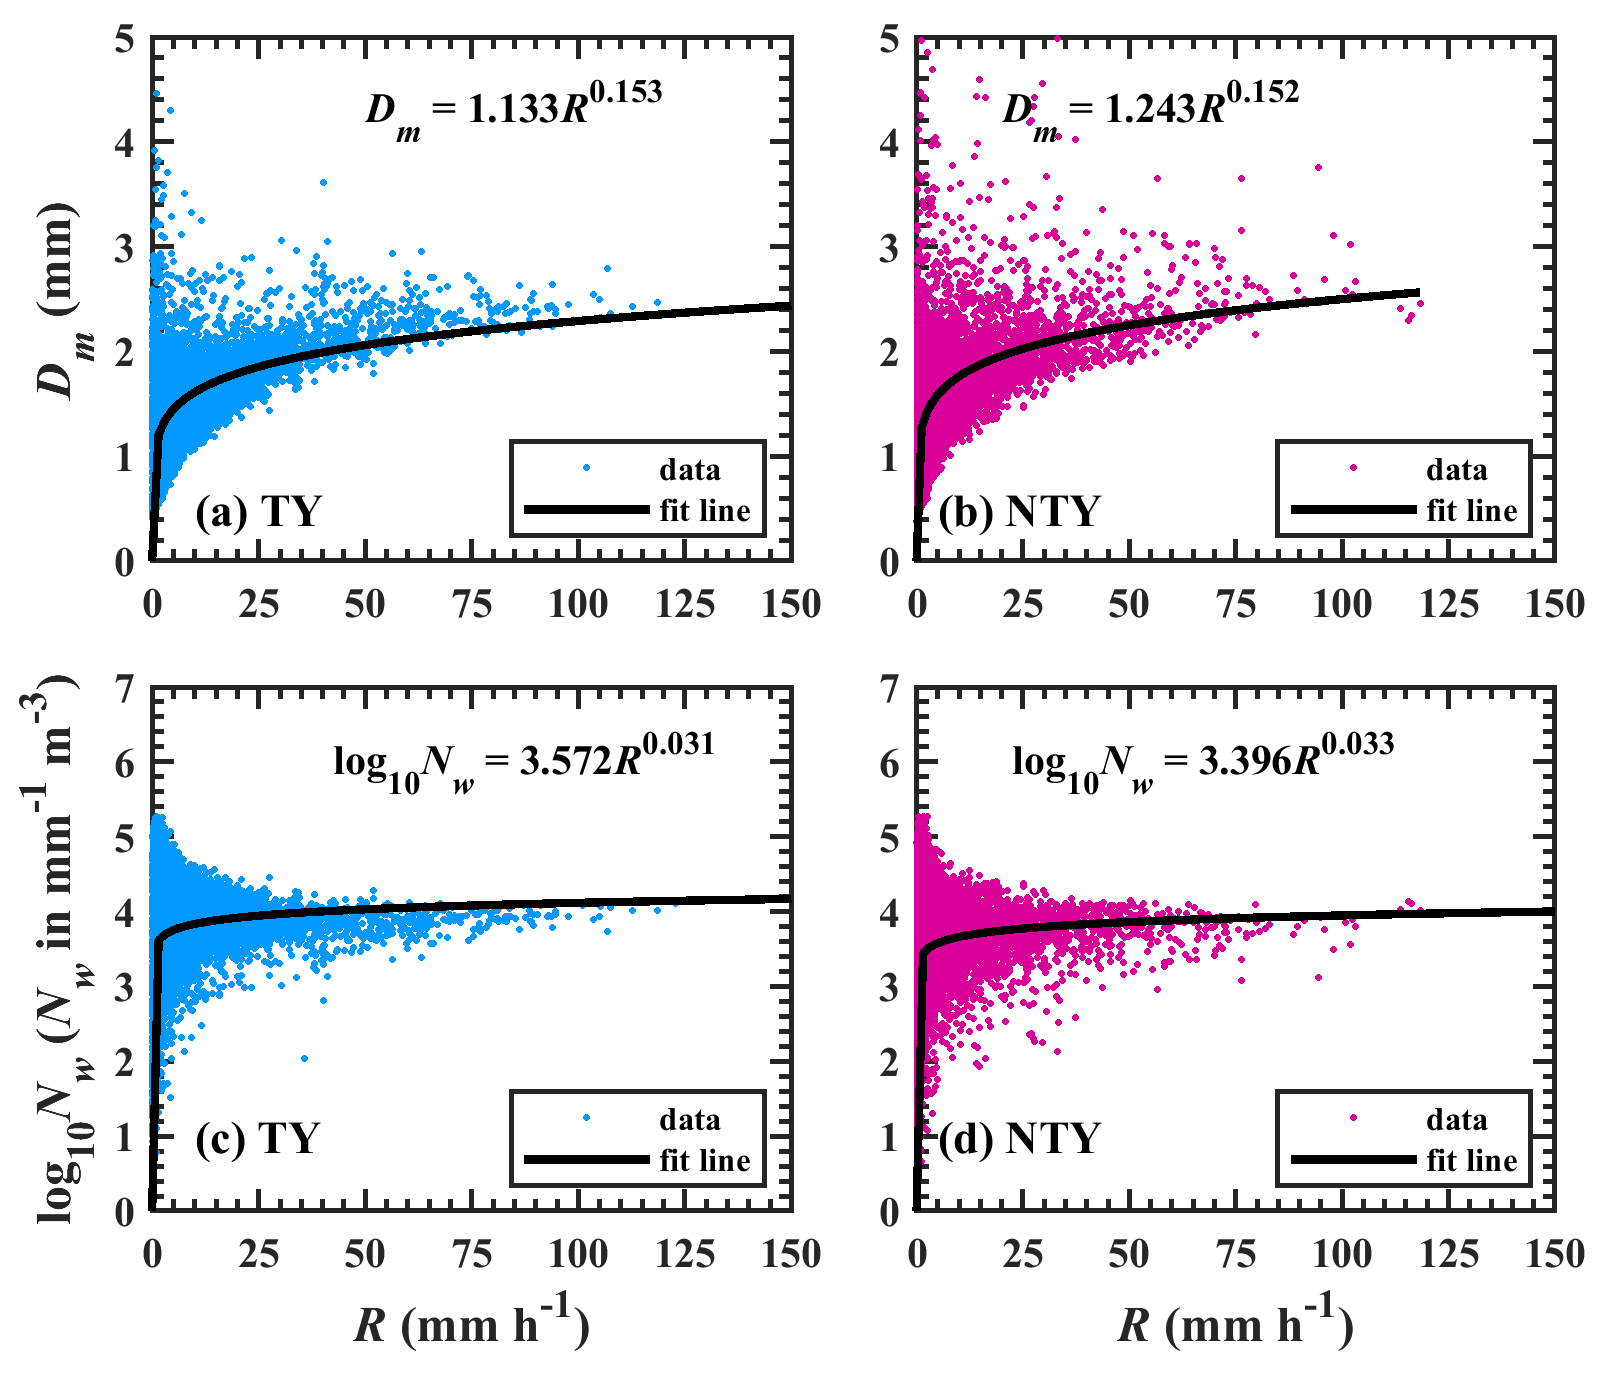
Figure 10Distributions of Dm (mm) and log 10Nw (Nw in mm−1 m−3) with the rainfall rate (R; mm h−1) for typhoon (TY) and non-typhoon (NTY) rainfall.
3.4 Rainfall estimation relations
Uncertainties in the estimation of rainfall from weather radars can be minimized through region, weather system, and precipitation-specific radar reflectivity and rainfall rate (Z–R) relations. In the Z=ARb relation, the size of the raindrops can be inferred from the coefficient A, and the exponent b represents the microphysical process (Atlas et al., 1999; Steiner et al., 2004; Atlas and Williams, 2003). The TY and NTY rainfall Z–R relations are derived from the linear regression applied to 10×log 10R and Z and are provided in Fig. 9. The coefficient values of Z–R relations are larger in NTY than in TY for stratiform and convective precipitations, as well as for total rainfall. This variation is due to the presence of a significant number of large-sized drops in NTY compared to that of the TY rainfall. The current TY rainfall Z–R relations show disparity with the other locations' tropical cyclones rainfall relations (Bao et al., 2020; Wen et al., 2018; Janapati et al., 2020). The possible reasons for the variations in other locations' tropical cyclones Z–R relations to that of the present TY rainfall could be due to geographical variations or the RSD measurements from different types of disdrometers (Adirosi et al., 2018). Moreover, the obtained TY and NTY days Z–R relations are found to differ from the default (Z=300R1.4) and tropical Z–R relationships (Z=250R1.2), which suggests that one should adopt weather- and region-specific Z–R relations.
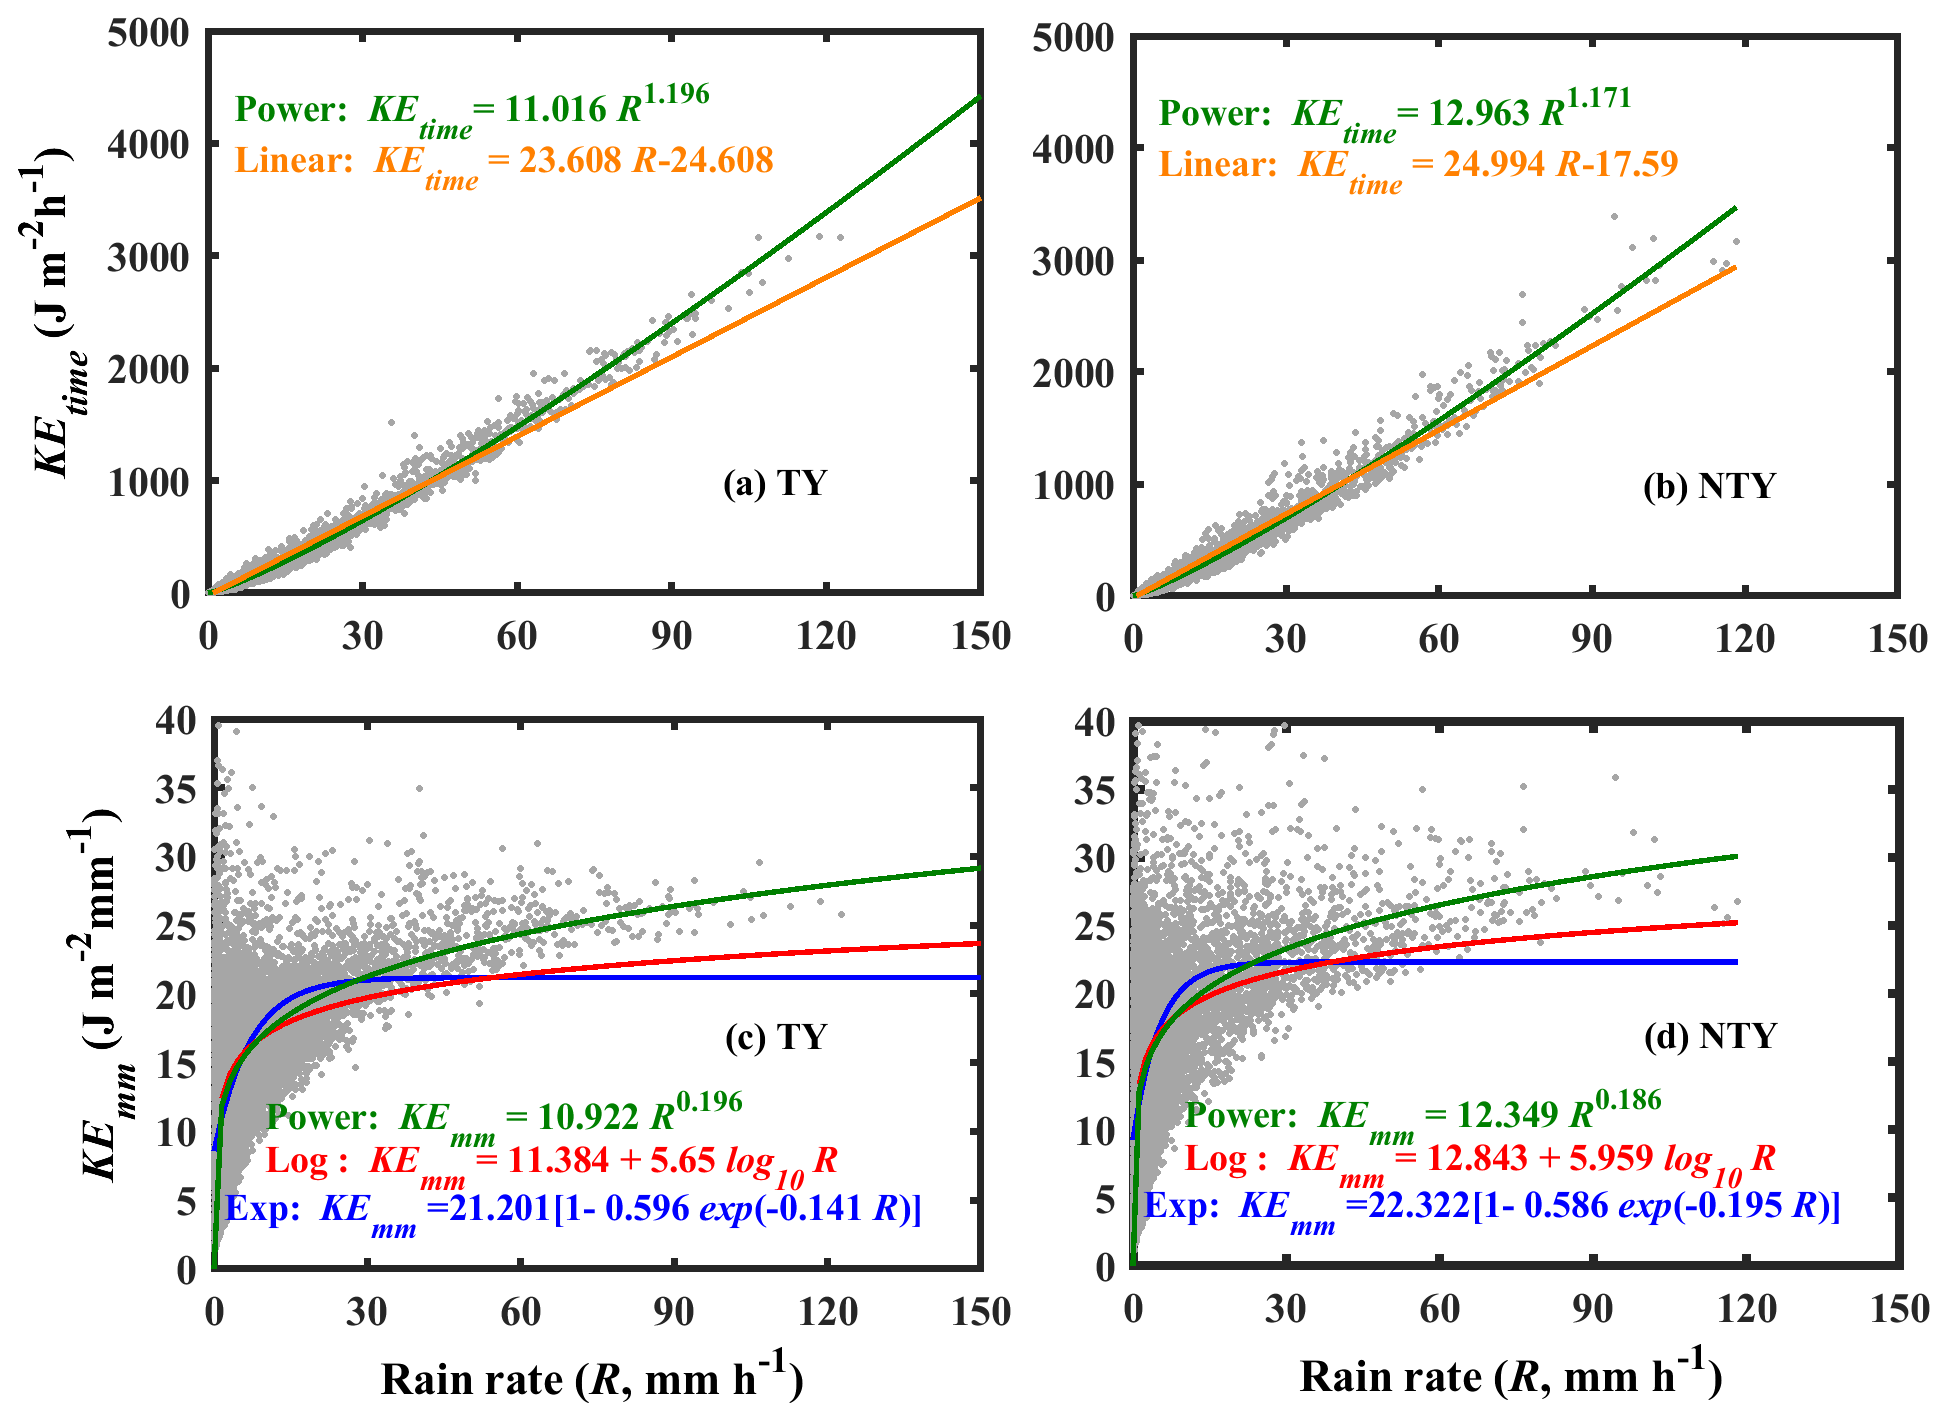
Figure 11Scatterplots of rainfall kinetic energy (KE; time-specific KE – KEtime; volume-specific KE – KEmm) with the rainfall rate (R; mm h−1) for typhoon (TY) and non-typhoon (NTY) rainfall.
3.5 The rainfall rate relationships with Dm and Nw
The normalized intercept parameter and mass-weighted mean diameter values can provide the RSD features, and these parameters were found to show uniqueness with the rainfall rate (Chen et al., 2016; Janapati et al., 2020). The distribution of Dm and log 10Nw with rainfall rates for both weather conditions is portrayed in Fig. 10. As can be seen from the figure, the distributions of Dm become narrowed with the increase in rainfall rates for both weather conditions, and such behaviors were reported for tropical cyclones and summer season rainfall (Kumar and Reddy, 2013; Wen et al., 2018; Chang et al., 2009; Janapati et al., 2020; Chen et al., 2019; Wu et al., 2019). No further fluctuations in the Dm values at higher rainfall rates (>25 mm h−1) are due to the equilibrium condition in the RSDs (attained through raindrop breakup and coalescence processes; Hu and Srivastava, 1995), and the further increase in rainfall rates is due to the increase in the number concentration under the RSD equilibrium condition (Bringi and Chandrasekar, 2001). The power law equations for Dm–R and log 10Nw–R are computed using a nonlinear least squares method and are exemplified in Fig. 10. The evaluated Dm–R (log 10Nw–R) relations exhibit a larger (smaller) coefficient in NTY rainfall than in TY rainfall, which confirms that, for given rainfall rates, the NTY rainfall had higher Dm and lower Nw values than the TY rainfall.
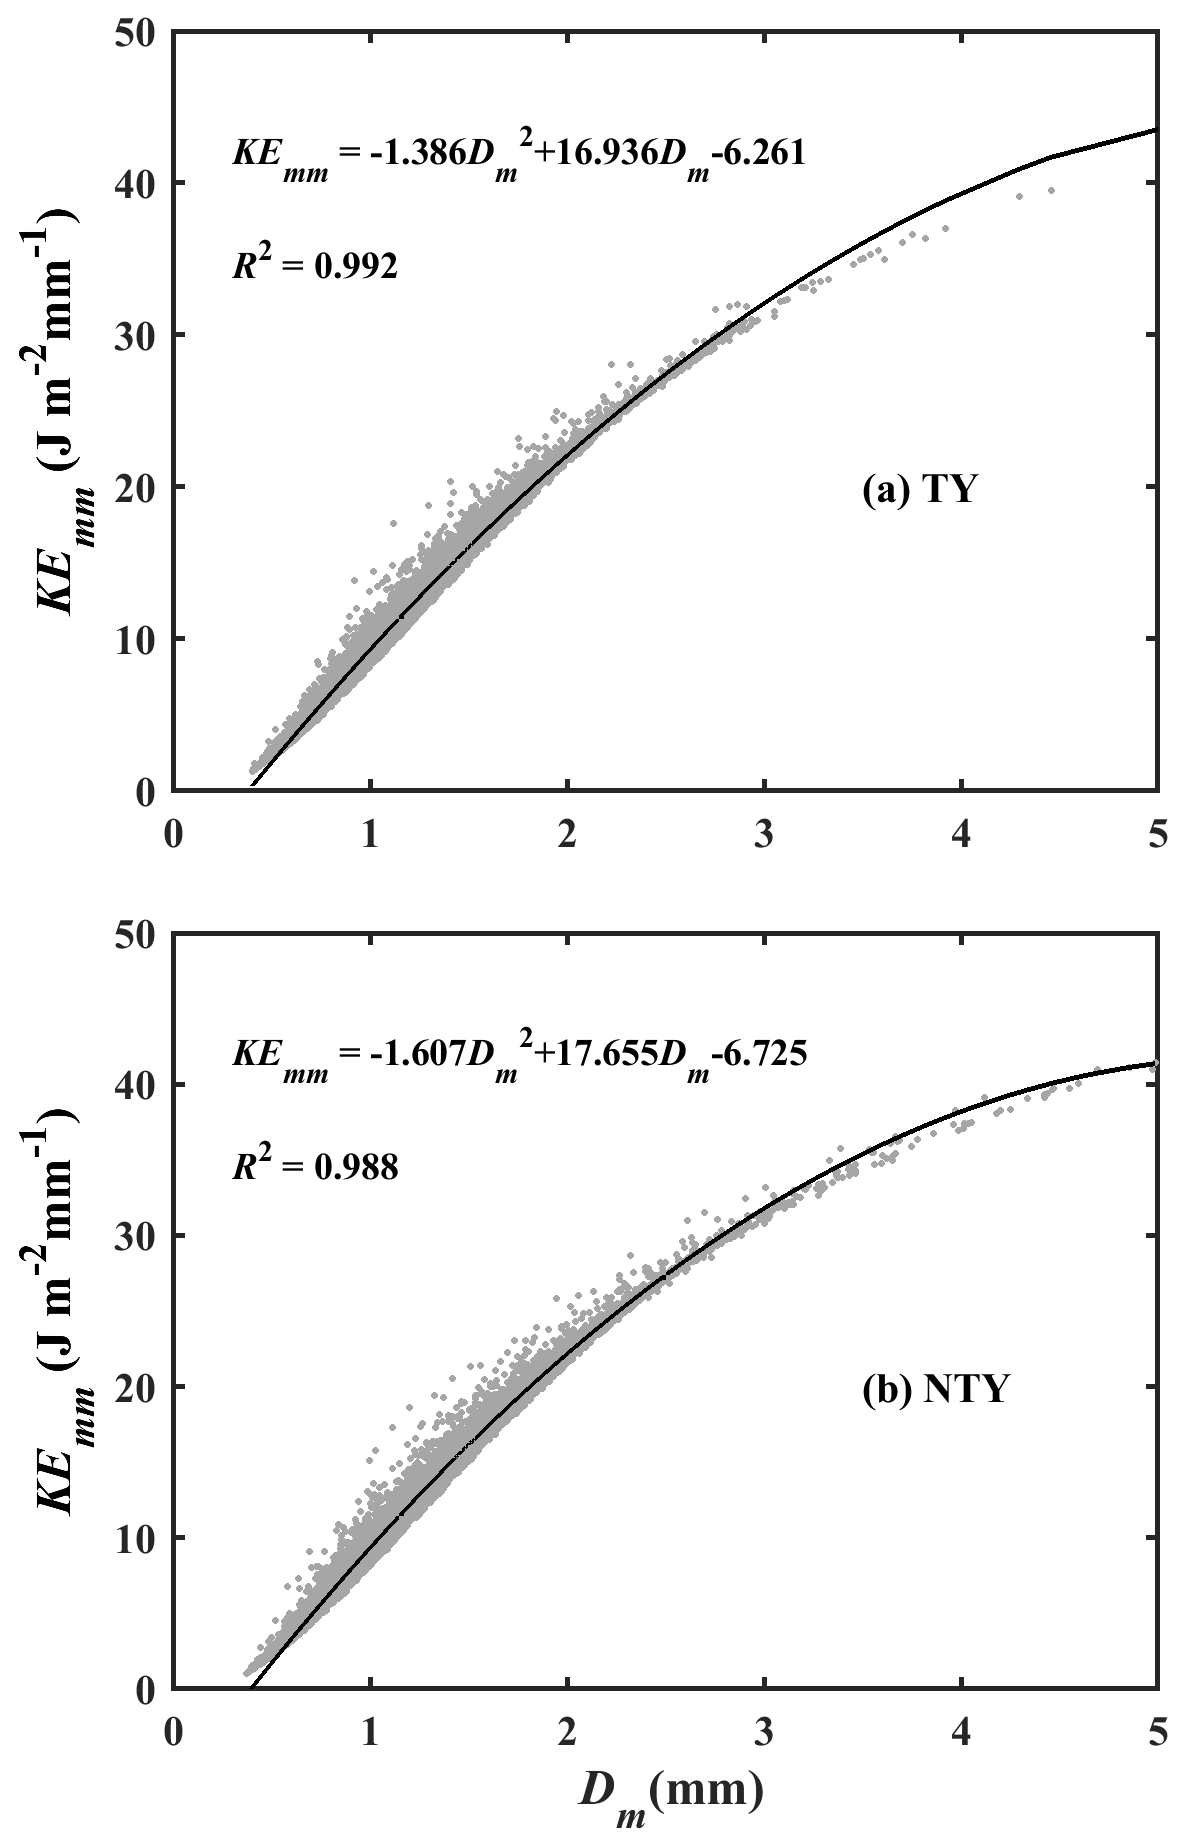
Figure 12Scatterplots of volume-specific KE (KEmm in J m−2 mm−1) with Dm (mm) for typhoon (TY) and non-typhoon (NTY) rainfall.

Figure 13Variations in the (a) convective available potential energy (CAPE; joules per kilogram, hereafter J kg−1) and the (b) vertical integral of water vapor (kilograms per square meter, hereafter kg m−2) for typhoon (TY) and non-typhoon (NTY) rainfall. The center line of the box indicates the median, and the bottom and top lines of the box indicate the 25th and 75th percentiles, respectively. The bottom and top of the dashed vertical lines indicate the 5th and 95th percentiles, respectively.
3.6 KE–R and KE–Dm relations
The raindrops reaching the ground with a certain amount of kinetic energy (KE) can erode the soil from the ground surface. Hence, the raindrop KE or rainfall KE is one of the critical physical quantities in soil erosion studies (Wischmeier, 1959; Kinnell, 1981). As the rainfall KE is related to the raindrop diameter and its fall velocity, it can be evaluated through RSD information (Kinnell, 1981). The empirical relations between the rainfall KE and rainfall intensity are incorporated by assessing the rainfall erosivity factor (R factor), which is one of the key parameters in soil erosion modeling studies (Renard et al., 1997; Janapati et al., 2019). To this end, we investigated the empirical relations between the rainfall KE (KEtime in J m−2 h−1; KEmm in J m−2 mm−1) and rainfall rate (mm h−1) using a nonlinear least-squares regression method for TY and NTY rainfall. The distribution plots of KEmm and KEtime with R for TY and NTY rainfall are portrayed in Fig. 11. The KEtime–R empirical relations are derived by fitting the data points with power and linear methods. For both TY and NTY days, the power law line fitted well, by passing through the middle of the data points at both lower and higher rainfall rates, compared to the linear fit line (Fig. 11a and b). The KEmm and R data points are fitted with power, logarithmic, and exponential law. Among these three forms of relations, the power law fitted well with the data points for both TY and NTY days (Fig. 11c and d). Moreover, empirical relations between Dm (mm), the KEmm are evaluated for both TY and NTY rainfall and are given in Fig. 12. A comparison of present KE–Dm relations with the East China seasonal rainfall KE–Dm (KE = ) relation shows that both TY and NTY relations in Taiwan are different from those of East China (Wen et al., 2019). The derived KE–Dm relations can be used to estimate the KE values from the remote sensing radar (Global Precipitation Measurement/Dual-frequency Precipitation Radar – GPM/DPR) measurements. The KEtime–R, KEmm–R, and KE–Dm relations and their statistical values are given in Table 3. For both KEtime–R and KEmm–R relations, the power law exhibits higher CC and lower RMSE and NRMSE values, which suggests the adoption of the power form equation to estimate the rainfall KE.
To apprehend propitious mechanisms responsible for the discrepancies in RSDs between TY and NTY rainfall, reanalysis, remote sensing, and ground-based radar data sets are used. The water vapor and CAPE values for TY and NTY days depicted with a box plot in Fig. 13 signify that NTY days had strong convective activity with vigorous updrafts and downdrafts compared to TY days. Nonetheless, if we look at the storm and bright band heights (BBHs; Fig. 14), TY days had relatively higher BBHs than NTY days, and there are no apparent alterations in storm heights between TY and NTY days. Relatively higher BBHs support the greater CER values for ice particles on TY compared to NTY days (Fig. 15b). Nevertheless, there is not much difference in the CER median values of liquid particles between TY and NTY days (Fig. 15a). The deep stratiform clouds on TY days offer sufficient time for the growth of ice crystals to large sizes (via aggregation and vapor deposition) and melt to very large-sized drops once they cross the melting layer. Relatively higher BBHs on TY days allowed the RSDs to reach equilibrium through various microphysical processes (collision, coalescence, and breakup) than NTY rainfall (Hu and Srivastava, 1995). In contrast, intense convection (with resilient updrafts and downdrafts) on NTY days enhances raindrop growth (through collision–coalescence and drop-sorting processes), shoots smaller drops at higher altitudes, and allows large drops to reach the surface. The vertical profiles of air temperature and relative humidity for TY and NTY days evidently illustrate that NTY days were drier compared to those of the TY rainy days (Fig. 16), and hence, the rate of evaporation of small drops (that were produced through the collision–breakup processes) on NTY days was higher than TY days, resulting in more large drops on NTY days.
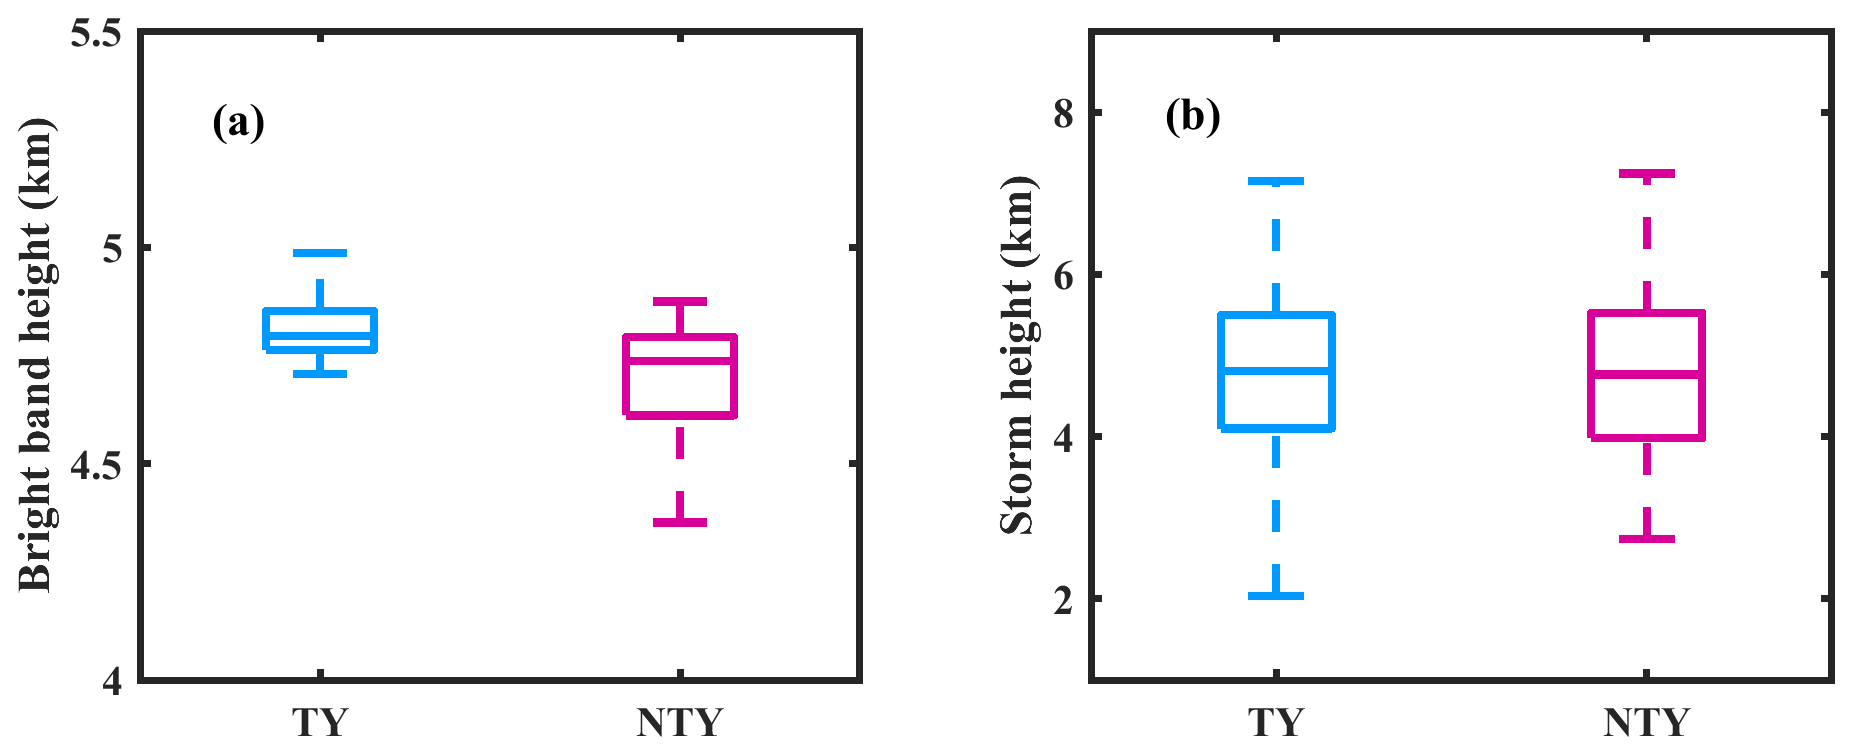
Figure 14(a) Bright band (BB) and (b) storm height box plots for typhoon (TY) and non-typhoon (NTY) rainfall.
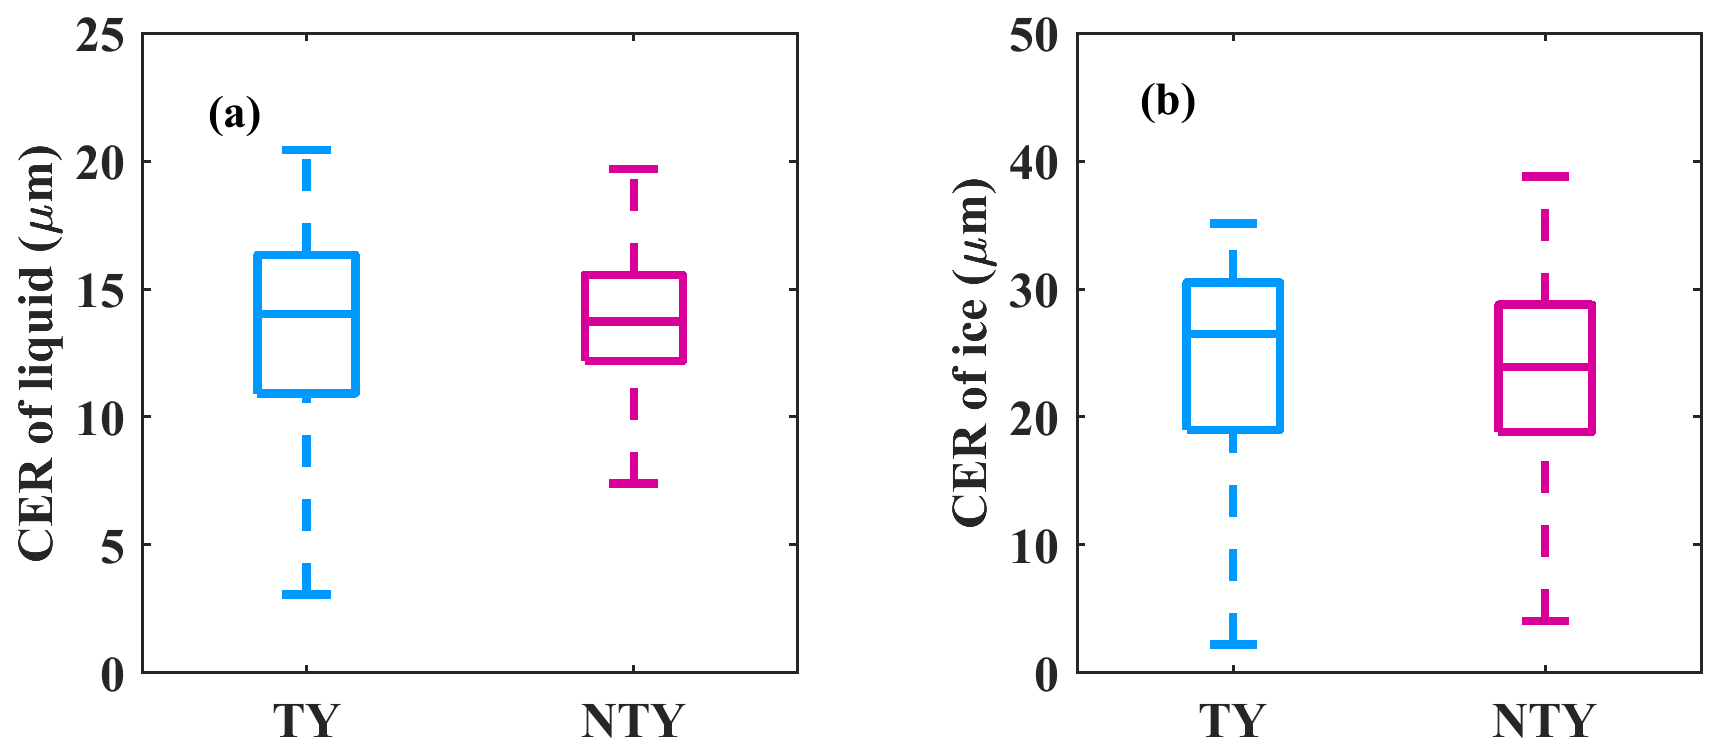
Figure 15(a) Liquid and (b) ice particles cloud effective radii (CER; in micrometers, µm) values for typhoon (TY) and non-typhoon (NTY) rainfall.
The radar reflectivity CFADs (contoured frequency-by-altitude diagrams) for (a) typhoon (TY) and (b) non-typhoon (NTY) days are portrayed in Fig. 17. The vertical sky blue (dark magenta) star line in Fig. 17a (Fig. 17b) is the mean radar reflectivity profile on TY (NTY) days. The white star dotted profile in Fig. 17a and b shows the mean reflectivity profiles for both TY and NTY days. The mean reflectivity profile on TY (NTY) days is less (more) than the mean reflectivity profile on TY and NTY days. A higher occurrence percentage of lower Z values (Z<10 dBZ) on TY compared to NTY days can be seen at higher altitudes. In contrast to that, below the melting layer, the occurrence percentage of higher reflectivity values (Z>40 dBZ) is higher on NTY than on TY days. The mean vertical profiles of radar reflectivity for TY and NTY days are plotted in Fig. 18. It can be seen from the figure that the mean reflectivity values are higher on NTY than TY days. As the radar reflectivity is directly related to the sixth power of the raindrop diameter, there are higher reflectivity profiles on NTY than on TY days, which infers the predominance of large drops on NTY compared to TY rainy days. The abovementioned microphysical and thermodynamical processes resulted in more very large-sized drops and few small drops on NTY than TY days, resulting in higher Dm and lower Nw values on NTY than TY days.
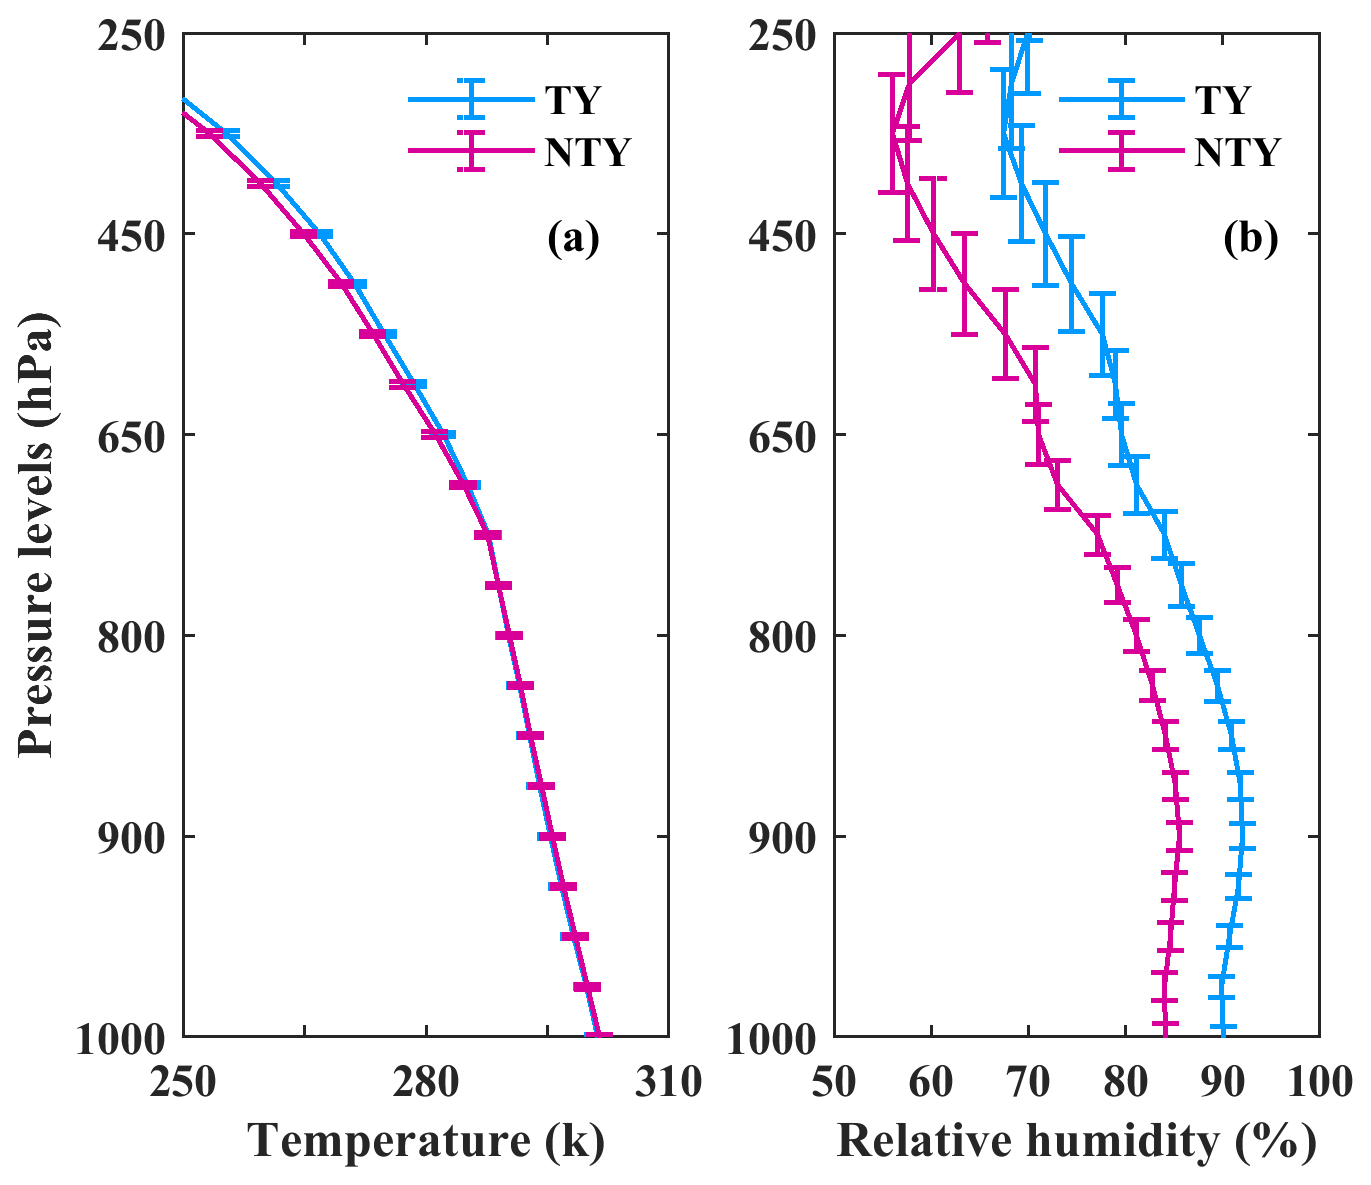
Figure 16(a) Mean air temperature (degrees Celsius) and (b) relative humidity (percent) profiles for typhoon (TY) and non-typhoon (NTY) rainfall.
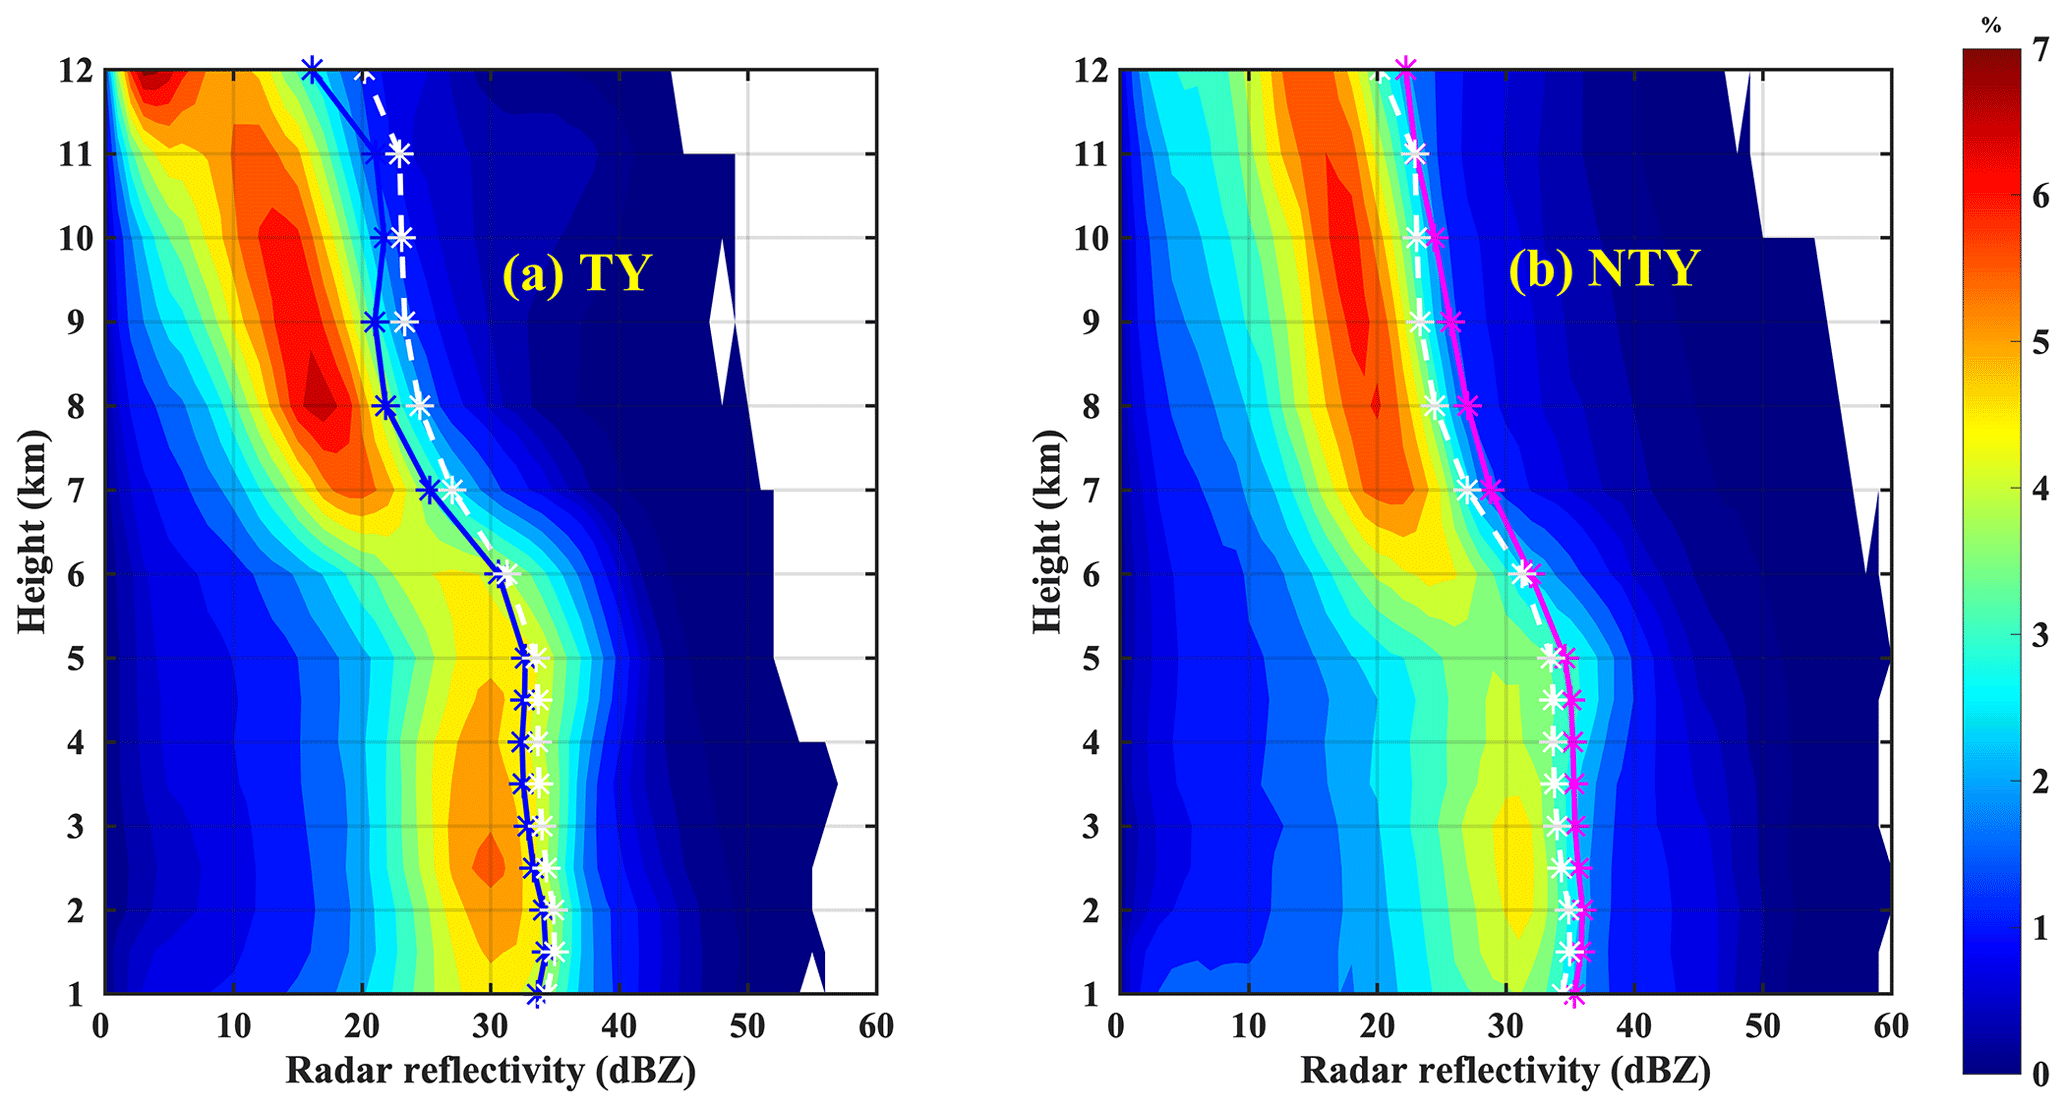
Figure 17Radar reflectivity contoured frequency-by-altitude diagrams (CFADs) from six ground-based radars for (a) typhoon (TY) and (b) non-typhoon (NTY) rainfall.

Raindrop size distributions (RSDs) of typhoon (TY) and non-typhoon (NTY) rainy days have been analyzed using long-term (2004–2016) disdrometer measurements from northern Taiwan. Besides disdrometer data, other auxiliary data sets (remote sensing, reanalysis, and ground-based radar) have been used to discuss the disparities in RSDs between TY and NTY rainfall. The NTY days have more very large-sized drops and fewer small-sized drops than TY days, resulting in larger Dm and smaller Nw values on NTY days. The mean normalized RSD of NTY precipitation has a higher occurrence of larger drops (at ) than TY precipitation, which indicates the possibility of diverse microphysical processes between these two weather conditions. The classification of RSDs into varying rainfall rates and precipitation (stratiform and convective) regimes clearly shows smaller Dm and larger Nw values on TY than on NTY days. The percentage contribution of large (small and mid-sized) drops to Nt and R is lower (higher) in TY than NTY rainfall. For both TY and NTY rainy days, stratiform precipitations Dm and Nw values are smaller than the maritime and continental clusters, while convective precipitation Dm values are approximately within the range of maritime clusters. The rainfall kinetic energy and intensity (KEtime–R and KEmm–R) relations evaluated for both TY and NTY rainy days reveal a greater performance of the power relation than other types and confirm the benefits of using the power form of KE–R relations in assessing the rainfall erosivity factor for TY and NTY rainfall events. The enumerated Z–R, Dm–R, Nw–R, KEtime–R, KEmm–R, and KEmm–Dm relations showed profound diversity between TY and NTY rainfall and substantiate the significance of adopting precipitation-specific empirical relations in evaluating the rainfall rate and kinetic energy values. Overall, the present study confirms that relatively higher convective activity with drier conditions on NTY than TY days significantly wedged the disparities in RSDs with dissimilar microphysical processes. The current observational outcomes could benefit from appraising the radar precipitation estimation algorithms, cloud modeling, and rainfall erosivity in northern Taiwan for TY and NTY rainfall events.
The ERA-Interim reanalysis data can be obtained from https://www.ecmwf.int/en/forecasts/datasets/reanalysis-datasets/era-interim (ECMF, 2020). The TRMM data can be retrieved from https://doi.org/10.5067/GPM/PR/TRMM/2A/06 (TRMM, 2018). The MODIS cloud data product can be accessed through https://modis.gsfc.nasa.gov/data/dataprod/mod06.php (Platnick et al., 2015). The ground-based radar and disdrometer data are available from the corresponding author upon reasonable request.
JJ, BKS, and PLL conceptualized the idea. PLL and EJ acquired the funding, administered the project, and provided the observation data. JJ, BKS, and MTL conducted the detailed analysis. PLL and EJ supervised the analysis. JJ and BKS wrote the draft. JJ, BKS, and PLL reviewed and revised the paper. All coauthors were involved in writing and revising the paper.
The authors declare that they have no conflict of interest.
Publisher's note: Copernicus Publications remains neutral with regard to jurisdictional claims in published maps and institutional affiliations.
We acknowledge the Central Weather Bureau (CWB) of Taiwan, for facilitating the radar reflectivity data, and the Tropical Rainfall Measuring Mission (TRMM), ERA-Interim, and MODIS research team for their efforts in providing the data. This research was supported by the US–Taiwan PIRE program, which itself is supported by the Ministry of Science and Technology (grant no. MOST 104-2923-M-008-003-MY5) and the US National Science Foundation (contract no. PIRE-1545917), managed by Pay-Liam Lin and Everette Joseph, and the Ministry of Science and Technology (grant nos. MOST 108-2111-M-008-028, MOST 108-2625-M-008-011, MOST 109-2111-M-008-017, MOST 109-2625-M-008-014 ), and it was partially supported by the Earthquake-Disaster & Risk Evaluation and Management Center, E-DREaM, from the Featured Areas Research Center Program within the framework of the Higher Education Sprout Project by the Ministry of Education (MOE) in Taiwan. Jayalakshmi Janapati (grant no. MOST 108-2811-M-008-558 and MOST 109-2811-M-008-555) and Balaji Kumar Seela (grant nos. MOST 108-2625-M-008-011, MOST 108-2811-M-008-595 and MOST 109-2811-M-008-563) acknowledge support from MOST.
This research has been supported by the Ministry of Science and Technology, Taiwan (grant nos. MOST 104-2923-M-008-003-MY5, MOST 108-2111-M-008-028, MOST 108-2625-M-008-011, MOST 109-2111-M-008-017, MOST 109-2625-M-008-014, MOST 108-2811-M-008-558, MOST 108-2811-M-008-595, MOST 109-2811-M-008-555, and MOST 109-2811-M-008-563).
This paper was edited by Carlo De Michele and reviewed by three anonymous referees.
Adirosi, E., Roberto, N., Montopoli, M., Gorgucci, E., and Baldini, L.: Influence of Disdrometer Type on Weather Radar Algorithms from Measured DSD: Application to Italian Climatology, Atmosphere-Basel, 9, 360, https://doi.org/10.3390/atmos9090360, 2018.
Atlas, D. and Williams, C. R.: The Anatomy of a Continental Tropical Convective Storm, J. Atmos. Sci., 60, 3–15, https://doi.org/10.1175/1520-0469(2003)060<0003:TAOACT>2.0.CO;2, 2003.
Atlas, D., Ulbrich, C. W., Marks Jr., F. D., Amitai, E., and Williams, C. R.: Systematic variation of drop size and radar-rainfall relations, J. Geophys. Res.-Atmos., 104, 6155–6169, https://doi.org/10.1029/1998JD200098, 1999.
Bao, X., Wu, L., Zhang, S., Li, Q., Lin, L., Zhao, B., Wu, D., Xia, W., and Xu, B.: Distinct Raindrop Size Distributions of Convective Inner- and Outer-Rainband Rain in Typhoon Maria (2018), J. Geophys. Res.-Atmos., 125, e2020JD032482, https://doi.org/10.1029/2020jd032482, 2020.
Bringi, V. N. and Chandrasekar, V.: Polarimetric Doppler Weather Radar: Principles and Applications, Cambridge University Press, Cambridge, 2001.
Bringi, V. N., Chandrasekar, V., Hubbert, J., Gorgucci, E., Randeu, W. L., and Schoenhuber, M.: Raindrop Size Distribution in Different Climatic Regimes from Disdrometer and Dual-Polarized Radar Analysis, J. Atmos. Sci., 60, 354–365, https://doi.org/10.1175/1520-0469(2003)060<0354:RSDIDC>2.0.CO;2, 2003.
Chang, J. M., Chen, H. E., Jou, B. J. D., Tsou, N. C., and Lin, G. W.: Characteristics of Rainfall Intensity, Duration, and Kinetic Energy for Landslide Triggering in Taiwan, Eng. Geol., 231, 81–87, https://doi.org/10.1016/j.enggeo.2017.10.006, 2017.
Chang, P.-L., Zhang, J., Tang, Y.-S., Tang, L., Lin, P.-F., Langston, C., Kaney, B., Chen, C.-R., and Howard, K.: An Operational Multi-Radar Multi-Sensor QPE System in Taiwan, B. Am. Meteorol. Soc., 102, E555–E577, https://doi.org/10.1175/bams-d-20-0043.1, 2020.
Chang, W.-Y., Wang, T.-C. C., and Lin, P.-L.: Characteristics of the Raindrop Size Distribution and Drop Shape Relation in Typhoon Systems in the Western Pacific from the 2D Video Disdrometer and NCU C-Band Polarimetric Radar, J. Atmos. Ocean. Tech., 26, 1973–1993, https://doi.org/10.1175/2009jtecha1236.1, 2009.
Chen, B., Wang, J., and Gong, D.: Raindrop size distribution in a midlatitude continental squall line measured by thies optical disdrometers over East China, J. Appl. Meteorol. Clim., 55, 621–634, https://doi.org/10.1175/JAMC-D-15-0127.1, 2016.
Chen, C.-S. and Chen, Y.-L.: The Rainfall Characteristics of Taiwan, Mon. Weather Rev., 131, 1323–1341, https://doi.org/10.1175/1520-0493(2003)131<1323:trcot>2.0.co;2, 2003.
Chen, C.-S., Chen, Y.-L., Liu, C.-L., Lin, P.-L., and Chen, W.-C.: Statistics of Heavy Rainfall Occurrences in Taiwan, Weather Forecast., 22, 981–1002, https://doi.org/10.1175/waf1033.1, 2007.
Chen, G., Zhao, K., Zhang, G., Huang, H., Liu, S., Wen, L., Yang, Z., Yang, Z., Xu, L., and Zhu, W.: Improving Polarimetric C-Band Radar Rainfall Estimation with Two-Dimensional Video Disdrometer Observations in Eastern China, J. Hydrometeorol., 18, 1375–1391, https://doi.org/10.1175/jhm-d-16-0215.1, 2017.
Chen, J.-M. and Chen, H.-S.: Interdecadal Variability of Summer Rainfall in Taiwan Associated with Tropical Cyclones and Monsoon, J. Climate, 24, 5786–5798, https://doi.org/10.1175/2011jcli4043.1, 2011.
Chen, J.-M., Li, T., and Shih, C.-F.: Tropical Cyclone- and Monsoon-Induced Rainfall Variability in Taiwan, J. Climate, 23, 4107–4120, https://doi.org/10.1175/2010jcli3355.1, 2010.
Chen, K., Chu, C.-Y., and Tzeng, Y.-C.: A semi-empirical model of rain attenuation at Ka-band in Northern Taiwan, Prog. Electromag. Res., 16, 213–223, 2011.
Chen, T.-C., Yen, M.-C., Hsieh, J.-C., and Arritt, R. W.: Diurnal and Seasonal Variations of the Rainfall Measured by the Automatic Rainfall and Meteorological Telemetry System in Taiwan, B. Am. Meteorol. Soc., 80, 2299–2312, https://doi.org/10.1175/1520-0477(1999)080<2299:Dasvot>2.0.Co;2, 1999.
Chen, Y., Duan, J., An, J., and Liu, H.: Raindrop Size Distribution Characteristics for Tropical Cyclones and Meiyu-Baiu Fronts Impacting Tokyo, Japan, Atmosphere-Basel, 10, 391, https://doi.org/10.3390/atmos10070391, 2019.
Chu, P.-S., Zhao, X., Lee, C.-T., and Lu, M.-M.: Climate prediction of tropical cyclone activity in the vicinity of Taiwan using the multivariate least absolute deviation regression method, Terr. Atmos. Ocean. Sci., 18, 805–825, https://doi.org/10.3319/TAO.2007.18.4.805(A), 2007.
Chu, Y.-H. and Su, C.-L.: An Investigation of the Slope–Shape Relation for Gamma Raindrop Size Distribution, J. Appl. Meteorol. Clim., 47, 2531–2544, https://doi.org/10.1175/2008jamc1755.1, 2008.
Dee, D. P., Uppala, S., Simmons, A., Berrisford, P., Poli, P., Kobayashi, S., Andrae, U., Balmaseda, M., Balsamo, G., and Bauer, D. P.: The ERA-Interim Reanalysis: Configuration and Performance of the Data Assimilation System, Q. J. Roy. Meteorol. Soc., 137, 553–597, 2011.
Deo, A. and Walsh, K. J.: Contrasting tropical cyclone and non-tropical cyclone related rainfall drop size distribution at Darwin, Australia, Atmos. Res., 181, 81–94, 2016.
ECMF: The ERA-Interim reanalysis dataset, available at: https://www.ecmwf.int/en/forecasts/datasets/reanalysis-datasets/era-interim, last access: 21 June 2020.
Fornis, R. L., Vermeulen, H. R., and Nieuwenhuis, J. D.: Kinetic Energy–Rainfall Intensity Relationship For Central Cebu, Philippines for Soil Erosion Studies, J. Hydrol., 300, 20–32, https://doi.org/10.1016/j.jhydrol.2004.04.027, 2005.
Hu, Z. and Srivastava, R. C.: Evolution of Raindrop Size Distribution by Coalescence, Breakup, and Evaporation: Theory and Observations, J. Atmos. Sci., 52, 1761–1783, https://doi.org/10.1175/1520-0469(1995)052<1761:Eorsdb>2.0.Co;2, 1995.
Iguchi, T., Kozu, T., Meneghini, R., Awaka, J., and Okamoto, K. I.: Rain-Profiling Algorithm for the TRMM Precipitation Radar, J. Appl. Meteorol., 39, 2038–2052, https://doi.org/10.1175/1520-0450(2001)040<2038:RPAFTT>2.0.CO;2, 2000.
Janapati, J., Reddy, V., Reddy, K., Lin, P.-L., and Liu, C.-Y.: A study on raindrop size distribution variability in before and after landfall precipitations of tropical cyclones observed over southern India, J. Atmos. Sol.-Terr. Phy., 159, 23–40, 2017.
Janapati, J., Seela, B. K., Lin, P.-L., Wang, P. K., and Kumar, U.: An assessment of tropical cyclones rainfall erosivity for taiwan, Sci. Rep.-UK, 9, 15862, https://doi.org/10.1038/s41598-019-52028-5, 2019.
Janapati, J., Seela, B. K., Lin, P.-L., Wang, P. K., Tseng, C.-H., Reddy, K. K., Hashiguchi, H., Feng, L., Das, S. K., and Unnikrishnan, C. K.: Raindrop Size Distribution Characteristics of Indian and Pacific Ocean Tropical Cyclones Observed at India and Taiwan Sites, J. Meteorol. Soc. Jpn. Ser. II, 98, 299–317, https://doi.org/10.2151/jmsj.2020-015, 2020.
Jayalakshmi, J. and Reddy, K. K.: Raindrop size distributions of southwest and northeast monsoon heavy precipitation observed over Kadapa (14∘4′ N, 78∘82′ E), a semi-arid region of India, Curr. Sci., 107, 1312–1320, 2014.
Joss, J. and Waldvogel, A.: Raindrop Size Distribution and Sampling Size Errors, J. Atmos. Sci., 26, 566–569, https://doi.org/10.1175/1520-0469(1969)026<0566:rsdass>2.0.co;2, 1969.
Jung, S.-A., Lee, D.-I., Jou, B. J.-D., and Uyeda, H.: Microphysical Properties of Maritime Squall Line Observed on June 2, 2008 in Taiwan, J. Meteorol. Soc. Jpn. Ser. II, 90, 833–850, https://doi.org/10.2151/jmsj.2012-516, 2012.
Kinnell, P. I. A.: Rainfall Intensity-Kinetic Energy Relationships for Soil Loss Prediction1, Soil Sci. Soc. Am. J., 45, 153–155, https://doi.org/10.2136/sssaj1981.03615995004500010033x, 1981.
Krishna, U. V. M., Reddy, K. K., Seela, B. K., Shirooka, R., Lin, P.-L., and Pan, C.-J.: Raindrop size distribution of easterly and westerly monsoon precipitation observed over Palau islands in the Western Pacific Ocean, Atmos. Res., 174–175, 41–51, https://doi.org/10.1016/j.atmosres.2016.01.013, 2016.
Kumar, S. B. and Reddy, K. K.: Rain drop size distribution characteristics of cyclonic and north east monsoon thunderstorm precipitating clouds observed over Kadapa (14.47∘ N, 78.82∘ E), tropical semi-arid region of India, Mausam, 64, 35–48, 2013.
Kumari, N., Kumar, S. B., Jayalakshmi, J., and Reddy, K. K.: Raindrop size distribution variations in JAL and NILAM cyclones induced precipitation observed over Kadapa (14.47∘ N, 78.82∘ E), a tropical semi-arid region of India, Indian J. Radio Space Phys., 43, 57–66, 2014.
Kummerow, C., Hong, Y., Olson, W. S., Yang, S., Adler, R. F., McCollum, J., Ferraro, R., Petty, G., Shin, D. B., and Wilheit, T. T.: The Evolution of the Goddard Profiling Algorithm (GPROF) for Rainfall Estimation from Passive Microwave Sensors, J. Appl. Meteorol., 40, 1801–1820, https://doi.org/10.1175/1520-0450(2001)040<1801:TEOTGP>2.0.CO;2, 2001.
Lee, G. W. and Zawadzki, I.: Variability of Drop Size Distributions: Noise and Noise Filtering in Disdrometric Data, J. Appl. Meteorol., 44, 634–652, https://doi.org/10.1175/JAM2222.1, 2005.
Lee, M.-T., Lin, P.-L., Chang, W.-Y., Seela, B. K., and Janapati, J.: Microphysical Characteristics and Types of Precipitation for Different Seasons over North Taiwan, J. Meteorol. Soc. Jpn. Ser. II, 97, 841–865, https://doi.org/10.2151/jmsj.2019-048, 2019.
Liang, A., Oey, L., Huang, S., and Chou, S.: Long-term trends of typhoon-induced rainfall over Taiwan: In situ evidence of poleward shift of typhoons in western North Pacific in recent decades, J. Geophys. Res.-Atmos., 122, 2750–2765, https://doi.org/10.1002/2017jd026446, 2017.
Liao, L., Meneghini, R., and Tokay, A.: Uncertainties of GPM DPR Rain Estimates Caused by DSD Parameterizations, J. Appl. Meteorol. Clim., 53, 2524–2537, https://doi.org/10.1175/JAMC-D-14-0003.1, 2014.
Lin, G.-W. and Chen, H.: The relationship of rainfall energy with landslides and sediment delivery, Eng. Geol., 125, 108–118, 2012.
Lu, J.-Y., Su, C.-C., Lu, T.-F., and Maa, M.-M.: Number and volume raindrop size distributions in Taiwan, Hydrol. Process., 22, 2148–2158, https://doi.org/10.1002/hyp.6814, 2008.
Ma, Y., Ni, G., Chandra, C. V., Tian, F., and Chen, H.: Statistical characteristics of raindrop size distribution during rainy seasons in the Beijing urban area and implications for radar rainfall estimation, Hydrol. Earth Syst. Sci., 23, 4153–4170, https://doi.org/10.5194/hess-23-4153-2019, 2019.
Maki, M., Keenan, T. D., Sasaki, Y., and Nakamura, K.: Characteristics of the Raindrop Size Distribution in Tropical Continental Squall Lines Observed in Darwin, Australia, J. Appl. Meteorol., 40, 1393–1412, https://doi.org/10.1175/1520-0450(2001)040<1393:COTRSD>2.0.CO;2, 2001.
McFarquhar, G. M. and List, R.: The Effect of Curve Fits for the Disdrometer Calibration on Raindrop Spectra, Rainfall Rate, and Radar Reflectivity, J. Appl. Meteorol., 32, 774–782, https://doi.org/10.1175/1520-0450(1993)032<0774:TEOCFF>2.0.CO;2, 1993.
McFarquhar, G. M., Hsieh, T.-L., Freer, M., Mascio, J., and Jewett, B. F.: The characterization of ice hydrometeor gamma size distributions as volumes in N0–λ–μ phase space: Implications for microphysical process modeling, J. Atmos. Sci., 72, 892–909, 2015.
Nakamura, K. and Iguchi, T.: Dual-wavelength Radar Algorithm, in: Measuring precipitation from space, Springer, Dordrecht, 225–234, 2007.
Nakajima, T. and King, M. D.: Determination of the Optical Thickness and Effective Particle Radius of Clouds from Reflected Solar Radiation Measurements. Part I: Theory, J. Atmos. Sci., 47, 1878–1893, https://doi.org/10.1175/1520-0469(1990)047<1878:DOTOTA>2.0.CO;2, 1989.
Platnick, S., King, M., and Hubanks, P.: MODIS Atmosphere L3Daily Product, NASA MODIS Adaptive Processing System, Goddard Space Flight Center, USA, available at: https://modis.gsfc.nasa.gov/data/dataprod/mod06.php (last access: 17 July 2018), 2015.
Radhakrishna, B. and Narayana Rao, T.: Differences in cyclonic raindrop size distribution from southwest to northeast monsoon season and from that of noncyclonic rain, J. Geophys. Res.-Atmos., 115, D16205, https://doi.org/10.1029/2009jd013355, 2010.
Remer, L. A., Kaufman, Y. J., Tanré, D., Mattoo, S., Chu, D. A., Martins, J. V., Li, R. R., Ichoku, C., Levy, R. C., Kleidman, R. G., Eck, T. F., Vermote, E., and Holben, B. N.: The MODIS Aerosol Algorithm, Products, and Validation, J. Atmos. Sci., 62, 947–973, https://doi.org/10.1175/JAS3385.1, 2005.
Renard, K. G., Foster, G. R., Weesies, G. A., McCool, D. K., and Yoder, D. C.: Predicting Soil Erosion byWater: A Guide to Conservation Planning with the Revised Universal Soil Loss Equation (RUSLE), in: Agricultural Handbook 703, US Department of Agriculture, Washington, DC, 1997.
Rosenfeld, D. and Ulbrich, C. W.: Cloud Microphysical Properties, Processes, and Rainfall Estimation Opportunities, Meteorol. Monogr., 52, 237–258, https://doi.org/10.1175/0065-9401(2003)030<0237:CMPPAR>2.0.CO;2, 2003.
Ryzhkov, A. V. and Zrnić, D. S.: Comparison of Dual-Polarization Radar Estimators of Rain, J. Atmos. Ocean. Tech., 12, 249–256, https://doi.org/10.1175/1520-0426(1995)012<0249:CODPRE>2.0.CO;2, 1995.
Salles, C., Poesen, J., and Sempere-Torres, D.: Kinetic Energy of Rain and Its Functional Relationship With Intensity, J. Hydrol., 257, 256–270, https://doi.org/10.1016/S0022-1694(01)00555-8, 2002.
Sauvageot, H. and Lacaux, J.-P.: The Shape of Averaged Drop Size Distributions, J. Atmos. Sci., 52, 1070–1083, https://doi.org/10.1175/1520-0469(1995)052<1070:TSOADS>2.0.CO;2, 1995.
Seela, B. K., Reddy, K. K., Jayalakshmi, J., Rao, T. N., Lin, P.-L., Liu, C.-Y., and Kumar, U.: Precipitation and cloud microstructure variations between two southern Indian stations, in: Remote Sensing of the Atmosphere, Clouds, and Precipitation VI, New Delhi, India, 4–7 April 2016, 98761O, 2016.
Seela, B. K., Janapati, J., Lin, P. L., Reddy, K. K., Shirooka, R., and Wang, P. K.: A Comparison Study of Summer Season Raindrop Size Distribution Between Palau and Taiwan, Two Islands in Western Pacific, J. Geophys. Res.-Atmos., 122, 11787–11805, https://doi.org/10.1002/2017jd026816, 2017.
Seela, B. K., Janapati, J., Lin, P.-L., Wang, P. K., and Lee, M.-T.: Raindrop Size Distribution Characteristics of Summer and Winter Season Rainfall Over North Taiwan, J. Geophys. Res.-Atmos., 123, 11602–11624, https://doi.org/10.1029/2018jd028307, 2018.
Sheppard, B. E.: Effect of Irregularities in the Diameter Classification of Raindrops by the Joss-Waldvogel Disdrometer, J. Atmos. Ocean. Tech., 7, 180–183, https://doi.org/10.1175/1520-0426(1990)007<0180:EOIITD>2.0.CO;2, 1990.
Sheppard, B. E. and Joe, P. I.: Comparison of Raindrop Size Distribution Measurements by a Joss-Waldvogel Disdrometer, a PMS 2DG Spectrometer, and a POSS Doppler Radar, J. Atmos. Ocean. Tech., 11, 874–887, https://doi.org/10.1175/1520-0426(1994)011<0874:CORSDM>2.0.CO;2, 1994.
Steiner, M., Smith, J. A., and Uijlenhoet, R.: A Microphysical Interpretation of Radar Reflectivity–Rain Rate Relationships, J. Atmos. Sci., 61, 1114–1131, https://doi.org/10.1175/1520-0469(2004)061<1114:AMIORR>2.0.CO;2, 2004.
Testud, J., Oury, S., Black, R. A., Amayenc, P., and Dou, X.: The Concept of “Normalized” Distribution to Describe Raindrop Spectra: A Tool for Cloud Physics and Cloud Remote Sensing, J. Appl. Meteorol., 40, 1118–1140, https://doi.org/10.1175/1520-0450(2001)040<1118:TCONDT>2.0.CO;2, 2001.
Thompson, E. J., Rutledge, S. A., Dolan, B., and Thurai, M.: Drop Size Distributions and Radar Observations of Convective and Stratiform Rain over the Equatorial Indian and West Pacific Oceans, J. Atmos. Sci., 72, 4091–4125, https://doi.org/10.1175/JAS-D-14-0206.1, 2015.
Tokay, A. and Short, D. A.: Evidence from Tropical Raindrop Spectra of the Origin of Rain from Stratiform versus Convective Clouds, J. Appl. Meteorol., 35, 355–371, https://doi.org/10.1175/1520-0450(1996)035<0355:Eftrso>2.0.Co;2, 1996.
Tokay, A., Kruger, A., and Krajewski, W. F.: Comparison of Drop Size Distribution Measurements by Impact and Optical Disdrometers, J. Appl. Meteorol., 40, 2083–2097, https://doi.org/10.1175/1520-0450(2001)040<2083:CODSDM>2.0.CO;2, 2001.
Tokay, A., Bashor, P. G., Habib, E., and Kasparis, T.: Raindrop Size Distribution Measurements in Tropical Cyclones, Mon. Weather Rev., 136, 1669–1685, https://doi.org/10.1175/2007mwr2122.1, 2008.
Tokay, A., Petersen, W. A., Gatlin, P., and Wingo, M.: Comparison of Raindrop Size Distribution Measurements by Collocated Disdrometers, J. Atmos. Ocean. Tech., 30, 1672–1690, https://doi.org/10.1175/JTECH-D-12-00163.1, 2013.
Tropical Rainfall Measuring Mission (TRMM): GPM PR on TRMM Reflectivity, Precipitation Characteristics and Rate, at Surface and Profile L2 1.5 hours V06, Greenbelt, MD, Goddard Earth Sciences Data and Information Services Center (GES DISC), https://doi.org/10.5067/GPM/PR/TRMM/2A/06, 2018.
Tu, J.-Y. and Chou, C.: Changes in precipitation frequency and intensity in the vicinity of Taiwan: typhoon versus non-typhoon events, Environ. Res. Lett., 8, 014023, https://doi.org/10.1088/1748-9326/8/1/014023, 2013.
Ulbrich, C. W. and Atlas, D.: Microphysics of Raindrop Size Spectra: Tropical Continental and Maritime Storms, J. Appl. Meteorol. Clim., 46, 1777–1791, https://doi.org/10.1175/2007JAMC1649.1, 2007.
van Dijk, A. I. J. M., Bruijnzeel, L. A., and Rosewell, C. J.: Rainfall Intensity–Kinetic Energy Relationships: A Critical Literature Appraisal, J. Hydrol., 261, 1–23, https://doi.org/10.1016/S0022-1694(02)00020-3, 2002.
Wen, L., Zhao, K., Chen, G., Wang, M., Zhou, B., Huang, H., Hu, D., Lee, W.-C., and Hu, H.: Drop size distribution characteristics of seven typhoons in China, J. Geophys. Res.-Atmos., 123, 6529–6548, https://doi.org/10.1029/2017JD027950, 2018.
Wen, L., Zhao, K., Wang, M., and Zhang, G.: Seasonal Variations of Observed Raindrop Size Distribution in East China, Adv. Atmos. Sci., 36, 346–362, 2019.
Wischmeier, W. H.: A Rainfall Erosion Index for a Universal Soil-Loss Equation, Soil Sci. Soc. Am. J., 23, 246–249, https://doi.org/10.2136/sssaj1959.03615995002300030027x, 1959.
Wu, Z., Zhang, Y., Zhang, L., Lei, H., Xie, Y., Wen, L., and Yang, J.: Characteristics of summer season raindrop size distribution in three typical regions of western Pacific, J. Geophys. Res.-Atmos., 124, 4054–4073, 2019.
Zhang, Y., Liu, L., Bi, S., Wu, Z., Shen, P., Ao, Z., Chen, C., and Zhang, Y.: Analysis of dual-polarimetric radar variables and quantitative precipitation estimators for landfall typhoons and squall lines based on disdrometer data in southern China, Atmosphere-Basel, 10, 30, https://doi.org/10.3390/atmos10010030, 2019.