the Creative Commons Attribution 4.0 License.
the Creative Commons Attribution 4.0 License.
 | 26 Jan 2021
Optimal water use strategies for mitigating high urban temperatures
Bin Liu
Shuang Liu
Yujing Zeng
Ruichao Li
Longhuan Wang
Binghao Jia
Peihua Qin
Si Chen
Jinbo Xie
ChunXiang Shi
Urban irrigation and road sprinkling are methods for mitigating high urban temperatures which are expected to enhance evapotranspiration and affect the urban weather, climate, and environment. Optimizing limited water supplies is necessary in regions with water shortages. In this study, we implemented urban water usage schemes, including urban irrigation and road sprinkling in the Weather Research and Forecasting (WRF) model, and assessed their effects with different amounts of water in city centers, suburbs, and rural areas by using the WRF model at a resolution of 1 km in Beijing, China. In addition, we developed an optimization scheme with a cooling effect as the optimal objective and the total water supply as the constraint condition. Nonlinear relationships were identified between the cooling effect and water consumption for both road sprinkling and urban irrigation, and the cooling effect due to urban irrigation was more effective than that attributed to road sprinkling. Based on the optimal water management scheme, and according to Beijing's 13th 5 Year Plan, about 90 % of the total water supply should be used for urban irrigation and 10 % for road sprinkling as the most effective approach for decreasing urban temperatures by about 1.9 ∘C.
- Article
(7455 KB) - Full-text XML
- BibTeX
- EndNote


Throughout the world, the level of urbanization has increased from 39 % to 55 % in the last four decades (Chen et al., 2014). Vast numbers of people have moved from rural to urban areas across the world, thereby increasing greenhouse gas emissions, anthropogenic heat flux release, and energy consumption in urban areas, as well as causing land use and land cover changes that increase the likelihood of urban high-temperature events (McCarthy et al., 2010). The frequency of high-temperature events in the first decade of the 21st century was much higher compared with that in the last 10 years of the 20th century (WMO, 2013). According to a previous report, the temperature reached a maximum of 42.1 ∘C in Beijing, China, on 3 August 2018. In addition, increased temperatures can substantially increase the rate of temperature-related illnesses (Zhang et al., 2014). Applying water can cool urban areas directly by increasing transpiration from vegetation and evaporation from the soil (Coutts et al., 2013). Beijing is a region that lacks adequate water resources, and optimal water use strategies can help to improve the water cooling efficiency. Thus, understanding and quantifying the relationships between the amounts of water applied and the cooling effect are critical for designing and planning better cities.
Urban irrigation includes ecological irrigation in city centers and farmland irrigation in suburban and rural areas. Many previous studies focused on the impacts of urban irrigation on hydro-meteorological variables at different scales (Kueppers et al., 2007; Vahmani and Hogue, 2014). Clearly, irrigation is a critical component of the regional water cycle because it enhances evapotranspiration due to the increased soil moisture content, and it contributes substantially to the latent heat flux in land–atmosphere interactions (Coutts et al., 2013; Pei et al., 2016). This so-called oasis effect is common in arid and semiarid cities. The impacts of irrigation on precipitation depend on the atmospheric circulation, where increasing the soil moisture can increase rainfall (Moore and Rojstaczer, 2001; DeAngelis et al., 2010; Alter et al., 2015; Pei et al., 2016; Yang et al., 2017), whereas it may inhibit rainfall in other cases due to the evaporative cooling effect strengthening the atmospheric stability and weakening deep convection (Ek and Holtslag, 2004; Zeng et al., 2017). In addition, outdoor water usage changes the partitioning of the available energy between the sensible and latent heat fluxes. A decrease in the sensible heat flux can reduce the urban air temperature by more than 3 ∘C, which helps to reduce thermal stress in cities during the summer (Kueppers et al., 2007; Lobell et al., 2008; Puma and Cook, 2010; Mueller et al., 2016). However, the cooling effects of different irrigation distributions differ slightly. The reductions in the daily maximum air temperature due to irrigation are evident in all urban land use types, but well-vegetated and low-intensity residential areas, such as suburbs and rural areas, exhibit the largest effects (Gao and Santamouris, 2019). As for urban areas, the optimal distribution of water supplies to mitigate urban high temperatures in the summer is a problem. Indeed, optimizing water usage is limited by the agricultural water demand, crop production, and water transactions (Feinerman et al., 1985; Amir and Fisher, 1999; Kuschel-Otarola et al., 2018). However, an effective method is not available for determining the distribution of the water supply to achieve the optimal cooling effect while also meeting the minimal requirements for plants.
Sprinkling water on the roads can keep roads clean and control air pollution, and it is also an effective method for mitigating urban high temperatures and the urban heat island effect (Yamagata et al., 2008; Hendel and Royon, 2015; Hendel et al., 2016). However, the relationship between the amount of water applied by road sprinkling and the cooling effect in different urban areas has not been investigated. Moreover, urban irrigation and road sprinkling have different roles in the water cycle process, where urban irrigation is related to plant and soil processes, whereas road sprinkling responds directly to the atmosphere. Thus, determining the different cooling effects of these two water usage approaches is essential for developing water management strategies to mitigate urban high temperatures.
In this study, we determined the optimal method for distributing water by urban irrigation and road sprinkling in different parts of a city in order to mitigate urban high temperatures. We elucidated the relationship between the amount of water applied and the cooling effects of urban irrigation and road sprinkling, based on simulations with the Weather Research and Forecasting (WRF) model. We then investigated whether the proposed method can be applied to other cities. We also collected water usage data for Beijing based on the water deficit coefficient, water supply, and land use cover in our case study, and we modified the urban irrigation and road sprinkling schemes in the urban canopy and hydrology modules of the WRF model before conducting simulations.
The remainder of this paper is organized as follows. In Sect. 2, we describe the materials and methods employed, including the model development, data, and experiments conducted. In Sect. 3, we present our results and discussion, including the model validation process, relationships between the amount of water applied and the cooling effect, and the optimal water use strategies. We give our concluding remarks in Sect. 4.
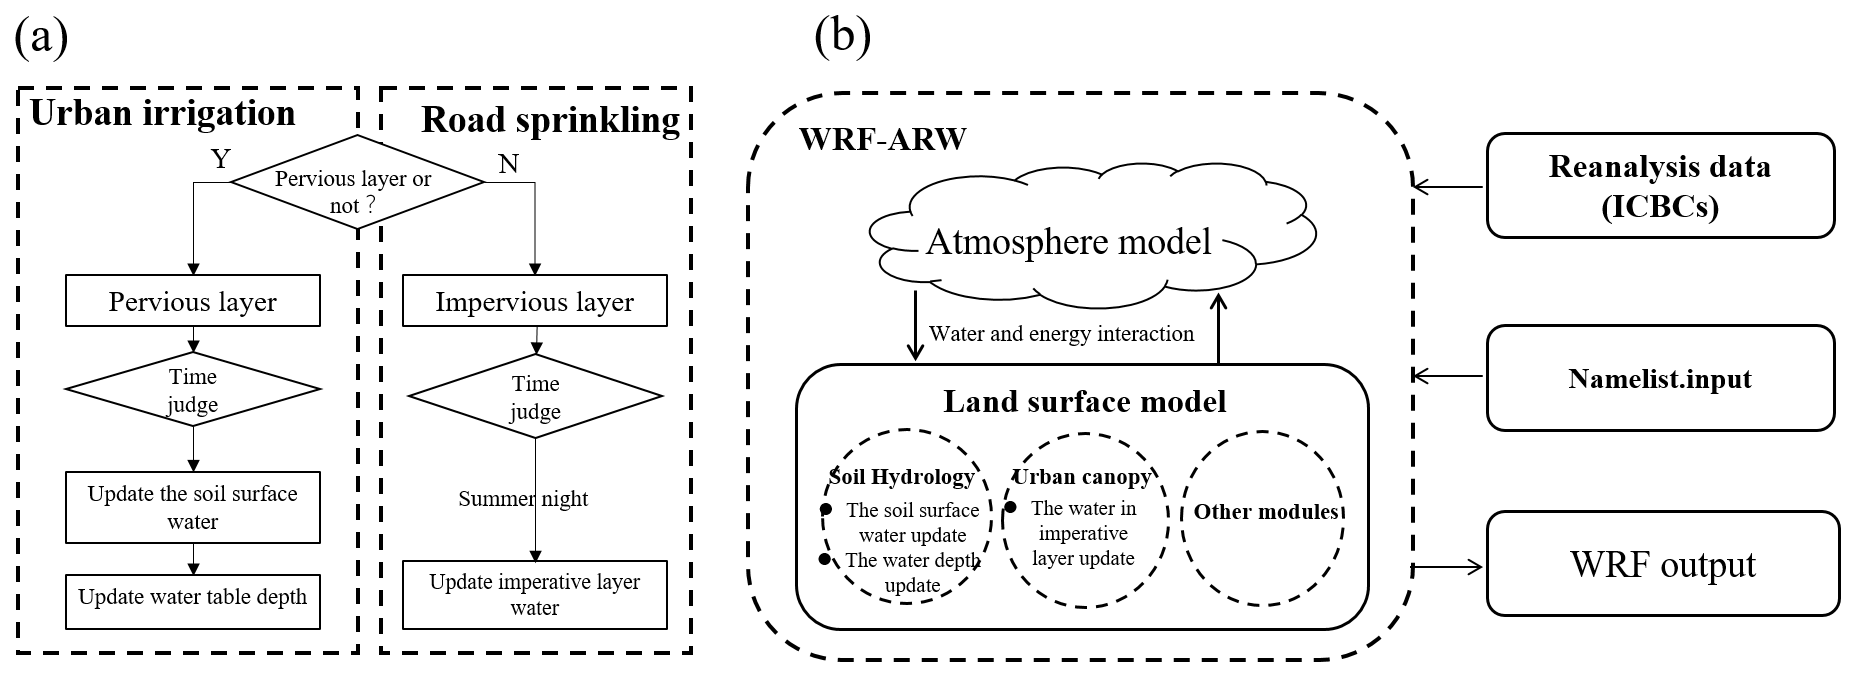
Figure 1Water usage scheme and its coupling with the Weather Research and Forecasting (WRF) model. (a) Flowchart illustrating the water usage scheme, including urban irrigation and road sprinkling. (b) Schematic showing the WRF model coupled with the water usage scheme.
2.1 Model development
The WRF model is a limited area, nonhydrostatic, mesoscale modeling system with a terrain-following estimated time of arrival (eta) coordinate, which is coupled with land surface models and the urban canopy model (UCM) to provide a better representation of the physical processes related to the exchange of heat, momentum, and water vapor in an urban environment. The land surface model describes the physical soil hydrological processes explicitly, including infiltration, storage, redistribution, drainage, and evaporation. The UCM is a single-layer model with a simplified urban geometry, where its features include shadowing from buildings, reflection of short- and long-wave radiation, the wind profile in the canopy layer, and multilayer heat transfer equations for roof, wall, and road surfaces (Tewari et al., 2007). The impervious roads lack soil hydrological processes, but the evaporation of liquid water still occurs above the road, which can change the urban weather, climate, and environment.
Table 1Data set descriptions.
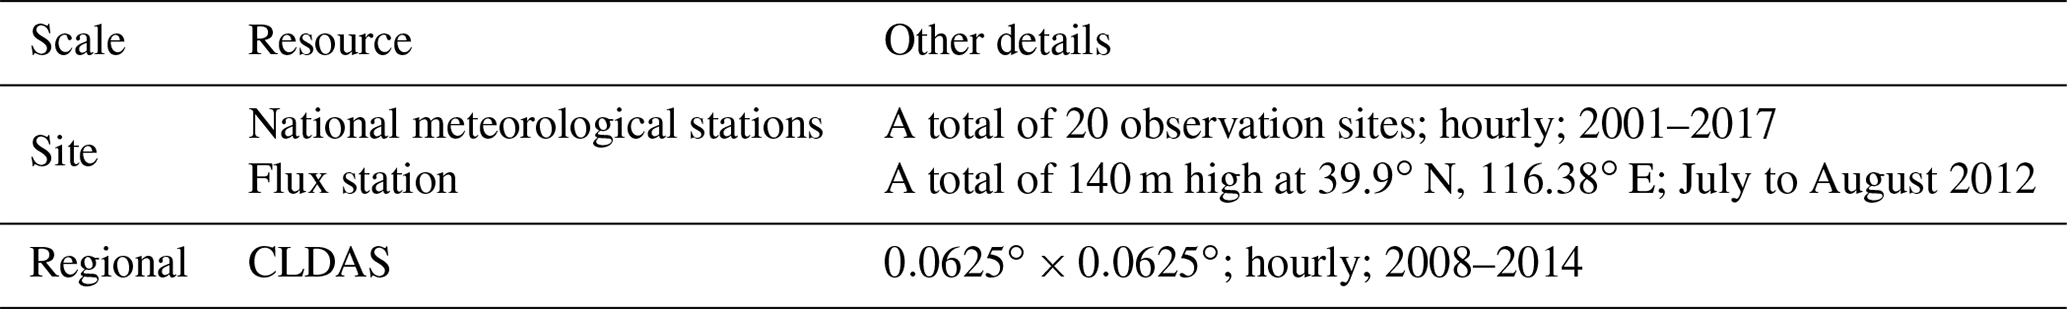
CLDAS: China Meteorological Administration Land Data Assimilation System (Shi et al., 2011).
A simple urban water usage scheme, including urban irrigation and road sprinkling, was incorporated into the WRF model, based on the scheme proposed by Zeng et al. (2017). Ecological and farmland irrigation were both treated as urban irrigation and implemented in the same manner in the model. The soil hydrological processes were changed, and the water balance between the land surface and atmosphere was disturbed, provided that the irrigation water was added to the first layer of the soil, and it was regarded as the available liquid water in the model. This process was conducted for farmland and urban land use types, and the water added from the surface soil was removed from the ground water table to maintain the water balance. According to the Requirements for Quality and Operation of City Road Sweeping and Cleaning (no. DB11/T 353-2014; Beijing M., 2014) the road sprinkling scheme was activated in the night, when water was applied to the impervious road layer to accelerate evaporation. A flowchart illustrating the urban water usage scheme, including irrigation and road sprinkling in the model, is shown in Fig. 1, and the specific scheme is represented by Eqs. (1)–(4). The advanced water usage scheme mentioned above was coupled into the WRF model. Water from urban irrigation with a specific spatial distribution was entered as an input for the model via a data interface with the WRF model. The program was initialized for the real-time case study, and the amount of water applied for road sprinkling was no more than the maximum water-holding capacity of the urban impervious layer, as follows:
where the subscripts i, j, and t represent the latitude, longitude, and time, respectively, represents the amount of water from urban irrigation, a is a coefficient from 0 to 1, pondmaxurban is the maximum water-holding capacity of the urban impervious layer, which mainly refers to the impervious road in the present study, is the surface liquid water entering the first soil layer or impervious layer, is the previous time step before , is the amount of water that needs to be removed from the ground water table, represents the water table at time t, and represents the previous time step at .
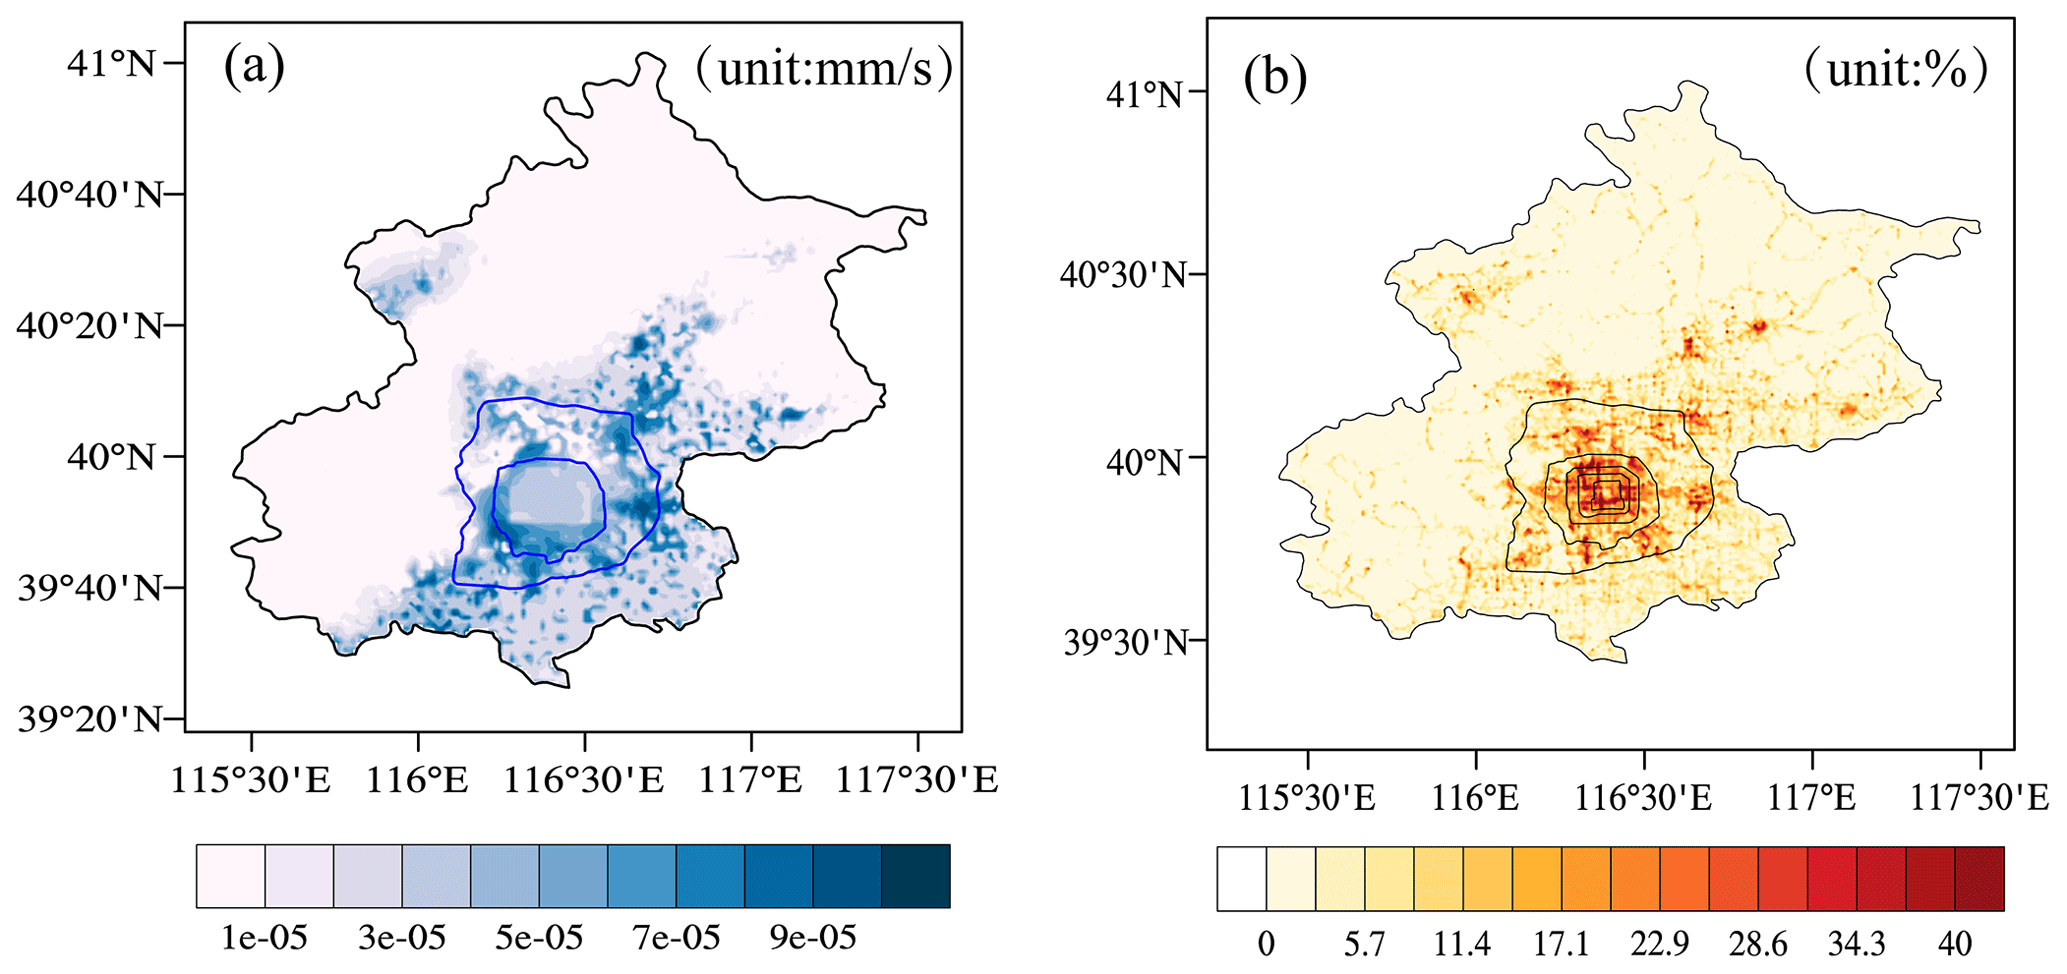
Figure 2(a) Estimated urban irrigation water use in Beijing (mm/s). (b) Spatial distribution of road area proportions (%).
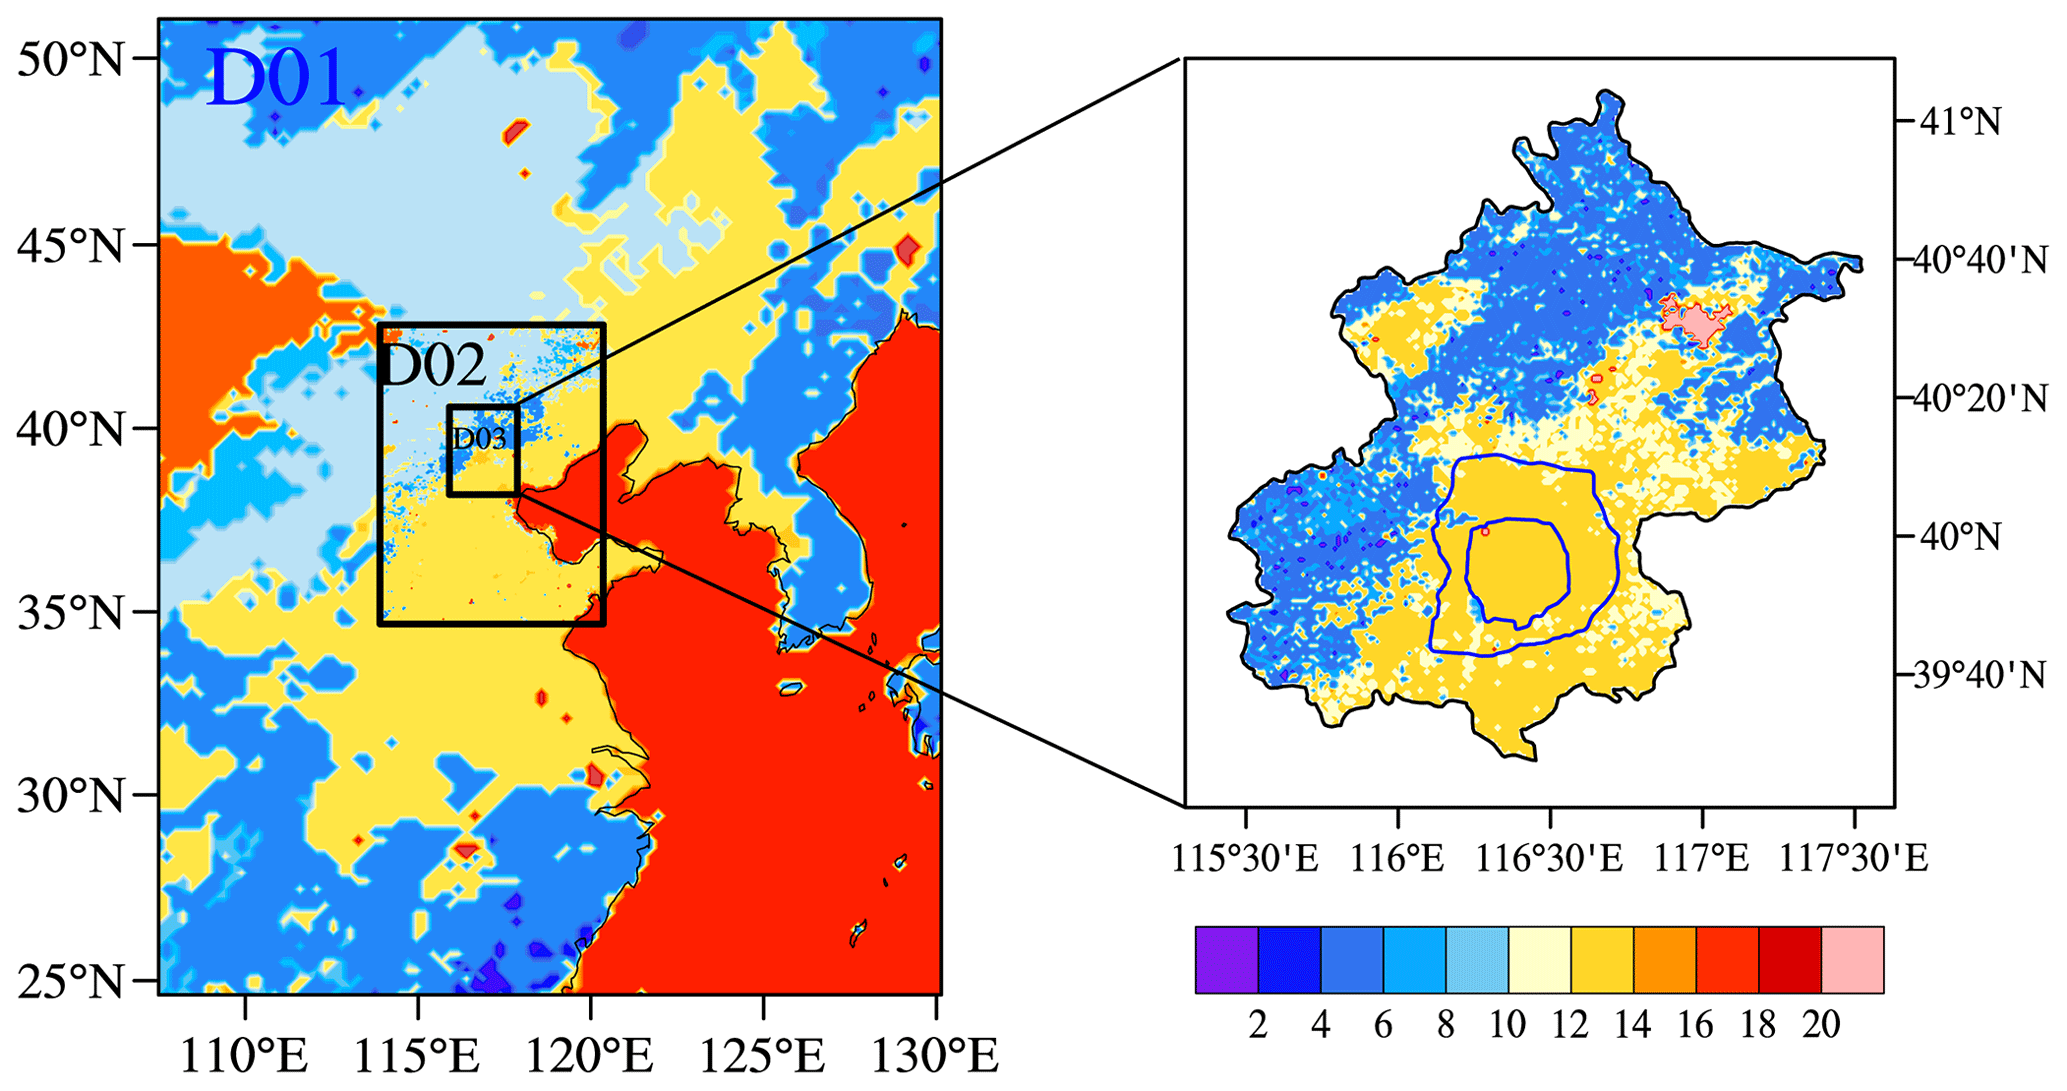
Figure 3Simulated area, land use, and land cover in Beijing.
2.2 Data and experiments
Air temperatures obtained from reanalysis data and in situ data were used to validate the WRF model output. In situ data were obtained from 20 national meteorological stations in Beijing, and the regional reanalysis data came from the China Meteorological Administration Land Data Assimilation System (CLDAS) with hourly outputs with a resolution of . More detailed descriptions of the data are given in Table 1. In addition, these data were also collected to verify the effectiveness of the WRF physical schemes.
The grid water usage data were derived from the total water consumption in Beijing and distributed according to the grid population density, GDP, and water deficit efficiency. The downscaling method employed was reported in a previous study (Zeng et al., 2017). The spatial distributions of the water usage amounts for the summed irrigation and ecological water are shown in Fig. 2a, and the spatial distributions of the road area proportions related to road sprinkling are shown in Fig. 2b. Farmland irrigation was mainly located in the south of Beijing and ecological water consumption occurred mainly in the center of the city. A primeval forest with little human influence is located to the north of Beijing, and the water consumption was low in this area. The urban planning for Beijing can be separated into urban, suburban, and rural areas divided by the fifth and sixth ring roads. The area within the fifth ring road was treated as the urban area inhabited by the majority of the population. The population declined from the fifth to the sixth ring road in the so-called suburban transition area. The rural areas were located outside the sixth ring road, where they mainly comprised farmland with few buildings and factories.
We used the WRF model (Skamarock, 2008) with the Advanced Research WRF Dynamic Core version 3.9.1, coupled with a single-layer UCM, in the experiments. Three types of experiments were conducted to consider no water usage, urban irrigation, and road sprinkling in the city center, suburbs, and rural areas. The urban irrigation experiments comprised 21 individual model simulations, where the grid water usage data ranged from 0.1 to 1.9 times the estimated urban irrigation in the city center, suburbs, and rural areas. In each case, the data were regarded as new input variables and added to the initial model input files with the same spatial resolution as the model when the WRF model was running. The road sprinkling experiments comprised 27 individual model simulations, where the amount of water sprinkled on roads ranged from 0.2 to 1 times the maximum water-holding capacity of the impervious layer in three parts of the city with different urban sprinkling frequencies and strengths. Detailed descriptions of the experimental designs are shown in Table 2.

Three-layer nested domains with horizontal resolutions of 15 km (d01; mesh size 95×121; most of northern China), 5 km (d02; mesh size 135×185; almost all of the Jing-Jin-Ji metropolitan area), and 1 km (d03; mesh size 205×270; Beijing as the area of interest) were designed for the experiments (Fig. 3). The National Centers for Environmental Prediction Global Final Analysis 6 h data (soil water, moisture, and temperature) were used for the first guess in the initial field and lateral boundary conditions. The MODIS-based land use classifications data provided in the WRF model described the real terrestrial and land cover characteristics of the regions of interest, and the default static data were used in the experiments. Climate summertime periods from 2000 to 2017 were averaged to 4 d to represent climatic May, June, July, and August. First, we obtained all of the data for May from 2000 to 2017, before averaging all these data to 1 d to represent climatic May. Finally, climatic June, July, and August were obtained by repeating these two steps. The first day (climatic May) was considered as the spin-up period. The schemes are shown in terms of the physical options in Table 3.
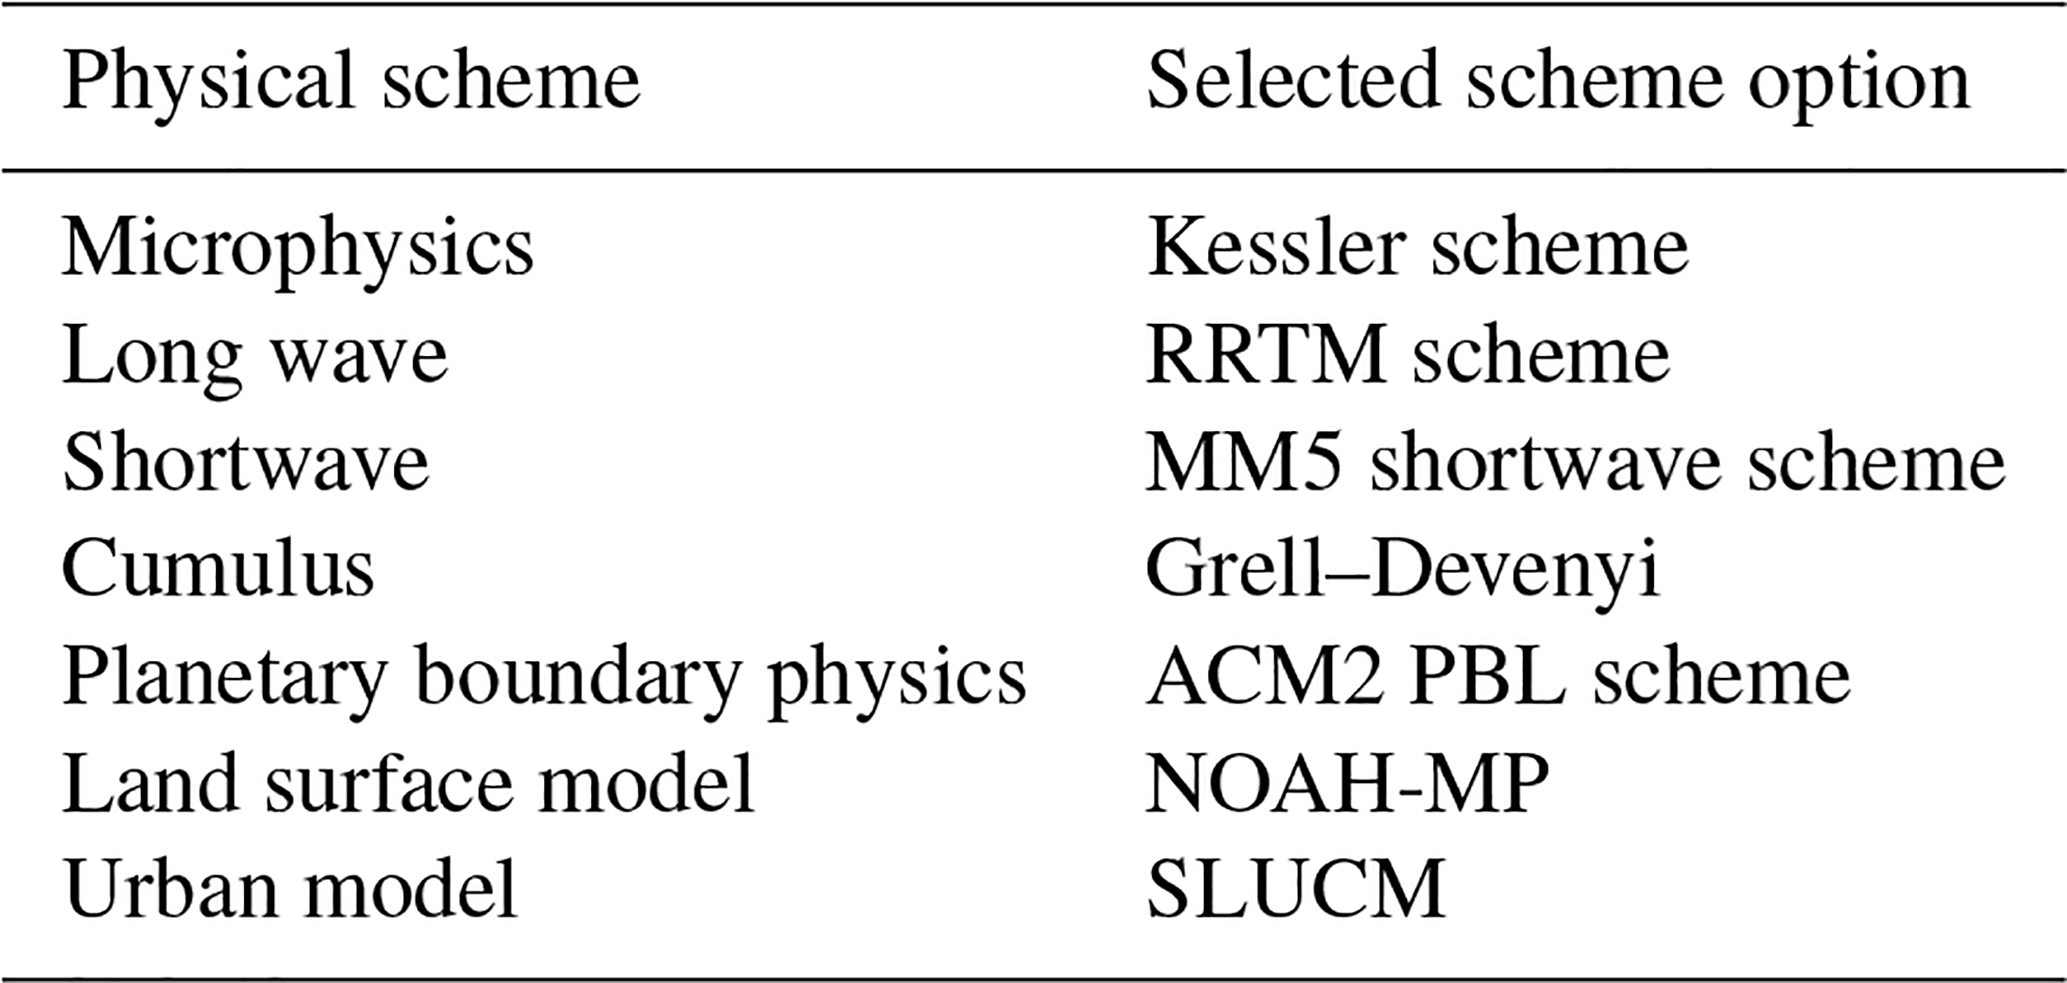
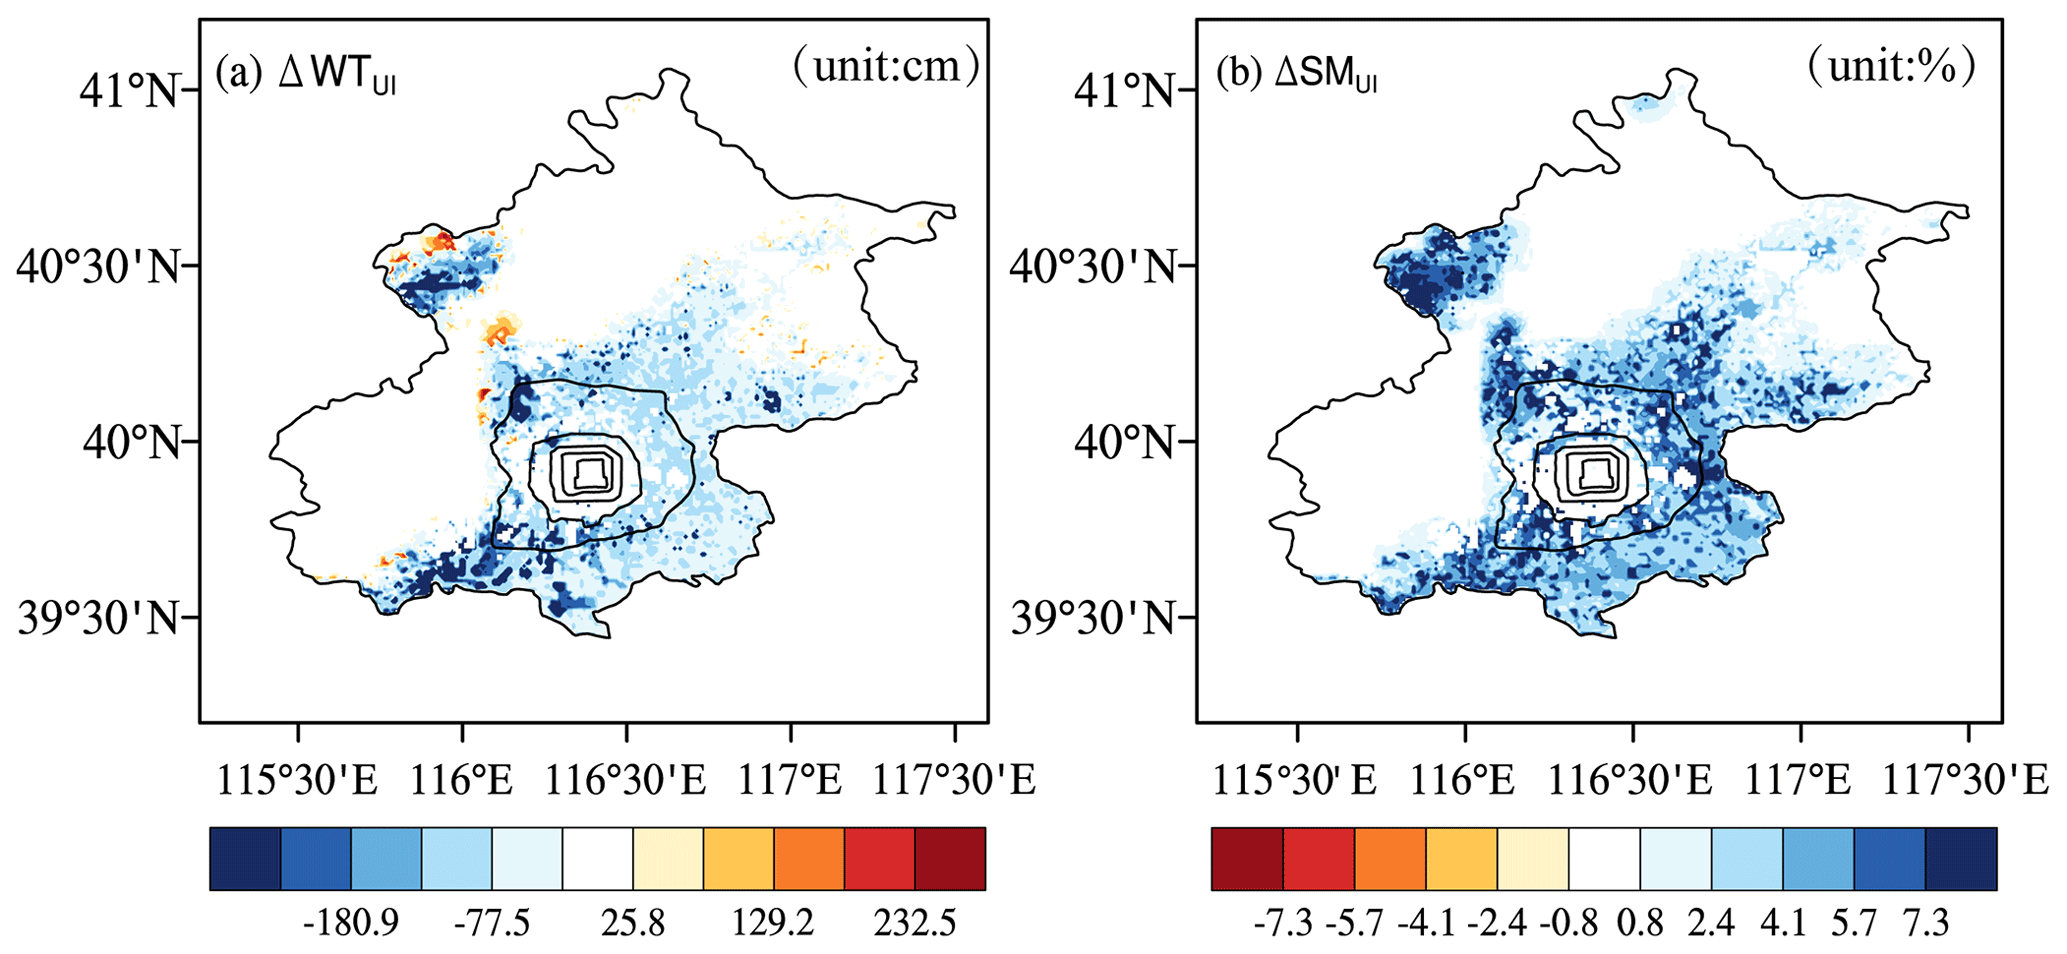
Figure 4Changes in (a) ground water table and (b) surface soil moisture due to urban irrigation.

Figure 5Changes in land surface variables due to urban irrigation (UI) and road sprinkling (RS). (a) Sensible heat flux under UI, (b) sensible heat flux under RS, (c) latent heat flux under UI, (d) latent heat flux under RS, (e) ground temperature under UI, (f) ground temperature under RS, (g) air temperature under UI, (h) air temperature under RS, (h) 10 m wind speed under UI, and (j) 10 m wind speed under RS.
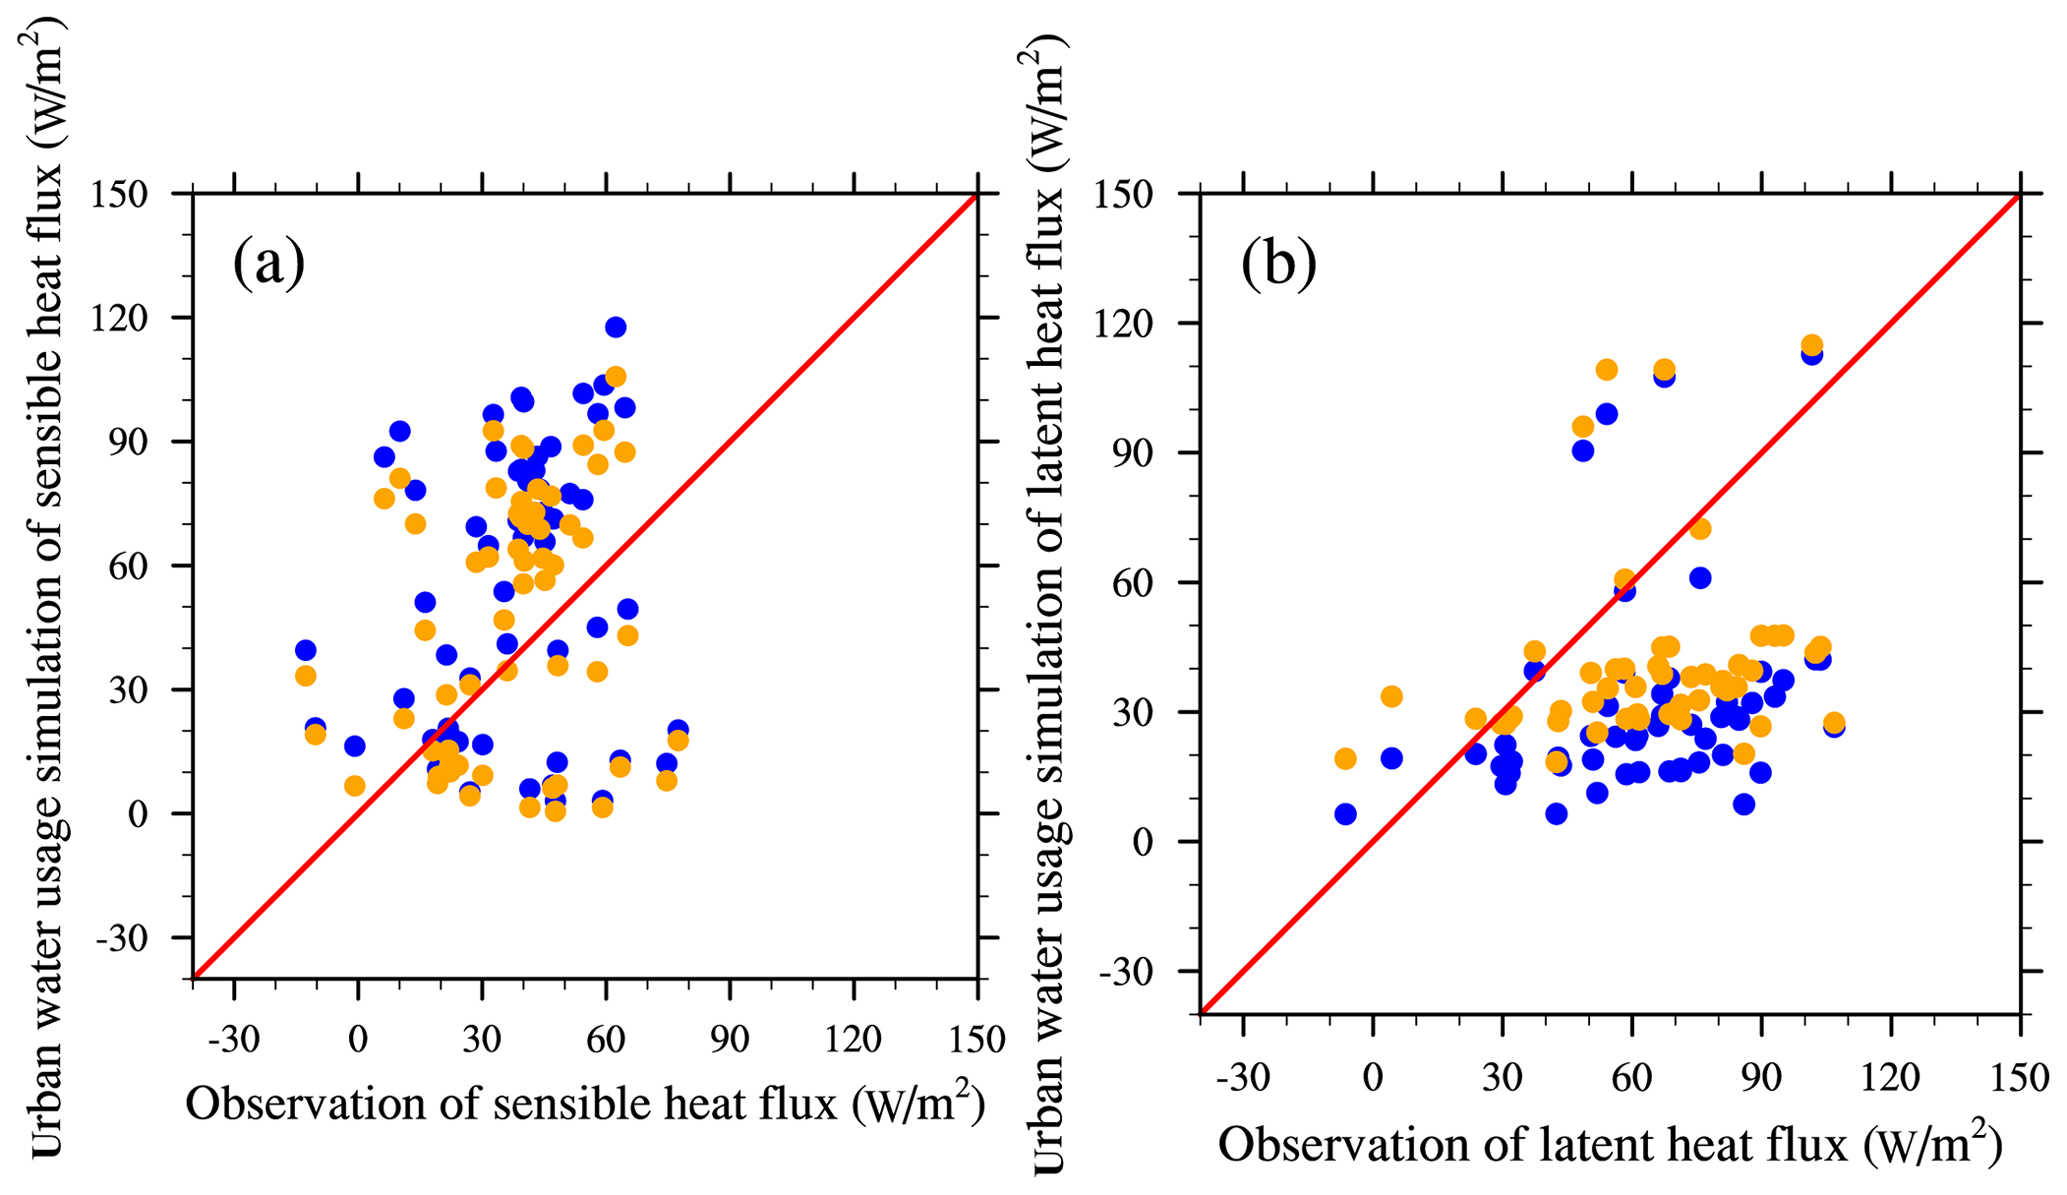
Figure 6(a) Comparisons of sensible heat flux and (b) latent heat flux according to station observations and community land model (CLM) simulations. Blue dots are the raw CLM simulation results, and orange dots are the CLM simulation results with urban water usage scheme.
3.1 Model validation
Considering that random processes in the atmosphere may lead to uncertainty regarding the cooling effect, offline comparative experiments were conducted to understand the cooling effects of urban irrigation and road sprinkling. These experiments comprised raw simulations without urban water usage and with urban irrigation and road sprinkling, using the community land model (CLM 4.5). The simulations were driven by atmosphere forcing data (June to August in the year 2012) obtained from the Data Assimilation and Modeling Center for Tibetan Multi-spheres, Institute of Tibetan Plateau Research, Chinese Academy of Science (Yang et al., 2010a). The simulation results showed that urban irrigation decreased the groundwater table due to groundwater extraction, as also shown by Yang et al. (2010b), and the surface soil moisture increased (Fig. 4). There were no changes in the water table and surface soil moisture from road sprinkling due to the lack of underground water processes below the impervious layer. Evapotranspiration was strengthened when more water was applied to irrigate soil or farmland, and heat from the ground and air was taken away. Similar results were obtained from road sprinkling, but the physical process was slightly different. As a result, both schemes decreased the sensible heat flux, ground temperature, air temperature, and wind speed, and increased the latent heat flux (Fig. 5). In addition, the impacts of land surface variables were limited to the areas where water was applied because the offline simulations did not consider climate effects between the atmosphere and land surface. Thus, the cooling effects were fairly obvious following urban irrigation and road sprinkling, as also shown in previous studies (Wang et al., 2019; Hendel and Royon, 2015). Moreover, road sprinkling has been conducted in Beijing and Tokyo. In addition, the sensible heat flux and latent heat flux results obtained from the urban water usage simulations (including both urban irrigation and road sprinkling) were better than the raw model results (Fig. 6). Flux station observations from July to August in 2012 and the station simulation results were interpolated from the regional simulation results in 2012. Comparisons of these data showed that the correlation coefficient increased slightly, and the root mean squared errors for sensible heat flux and latent heat flux decreased by 4.69 and 6.94 W/m2, respectively, while the absolute errors for sensible heat flux and latent heat flux decreased by 7.3 and 9.62 W/m2. Therefore, urban water usage, including urban irrigation and road sprinkling, should be considered when conducting weather and climate simulations.
In addition to the comparisons of station observations and offline model simulations, we conducted comparisons of the 7 year average summer temperatures in the CLDAS and WRF simulations, to evaluate the simulation capacity of the raw WRF model, where the temperatures were higher in the city center than the suburbs. The similar spatial distributions showed that the WRF physical scheme was reasonable. The correlation coefficients between the CLDAS temperatures and WRF simulation results were generally close to one, and the average root mean square error (RMSE) for the two data sets was 0.8 ∘C. The grid model results were interpolated to the sites according to the coordinates of the stations in urban and suburban areas, and comparisons of the site observations and WRF simulation results also showed that the temperature simulation results were in good agreement with the observations (see Fig. 7). The WRF model simulation results were reasonable, where the simulated temperatures were slightly higher than the observations, and RMSE was mostly less than 2.5 ∘C. Thus, the WRF model may be a suitable tool for this type of research.
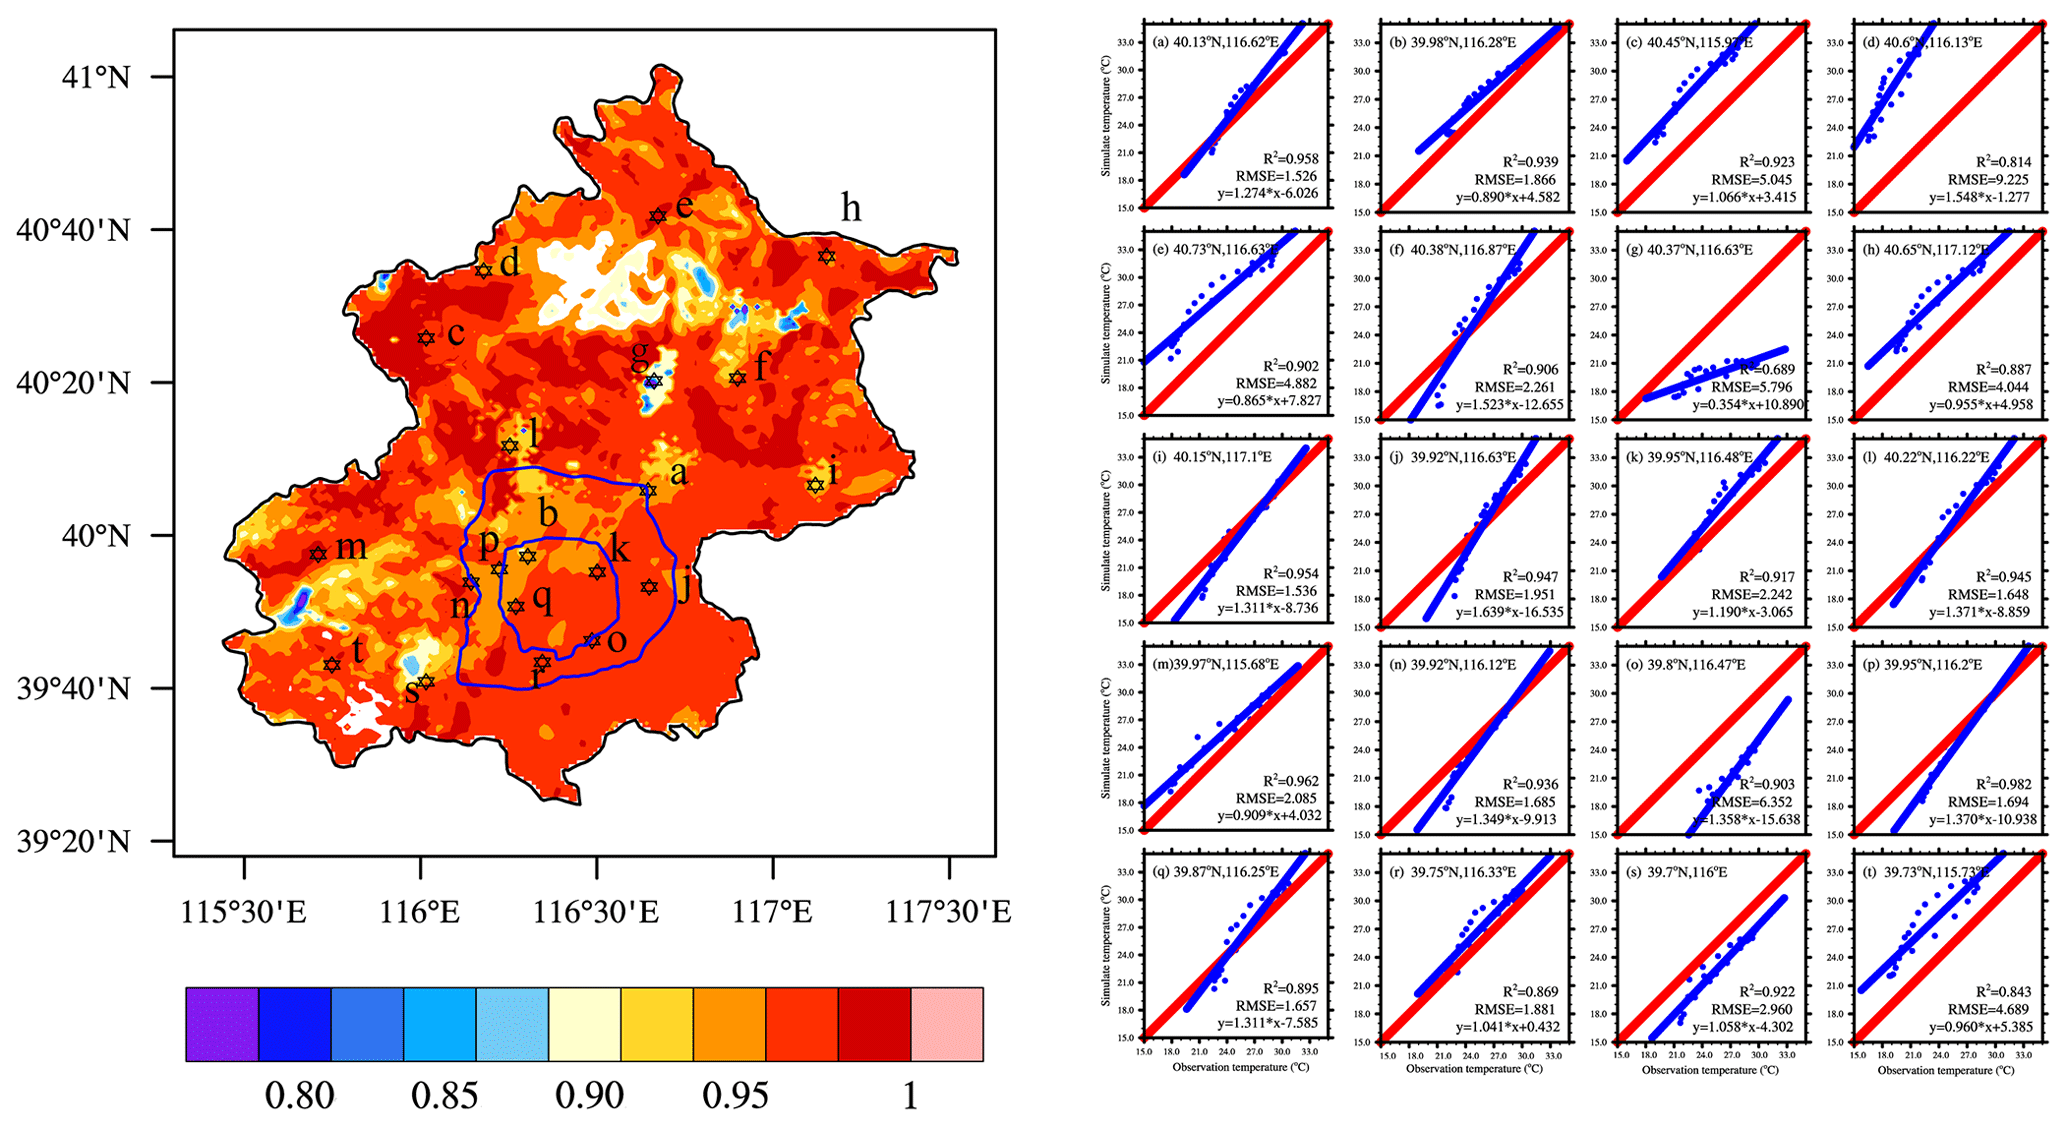
Figure 7Temperature validation based on comparisons of simulations and reanalysis or in situ data. Left: spatial distribution of correlation coefficients between simulations and CLDAS reanalysis data. Right: (a)–(t) regression lines, RMSE values, and coefficient coefficients between simulations and in situ data.
Also, WRF simulations with and without urban water usage schemes were conducted from July to August 2012. The comparisons of the reanalysis data (CLDAS) and station observations showed that the simulations with urban water usage were better than the raw WRF simulations in terms of the heat flux and temperature (Fig. 8). The mean absolute error of the air temperature decreased from 2.9 to 1.7 ∘C, compared with the CLDAS reanalysis data. Compared with the station observations, the correlation coefficients for sensible heat flux from simulations with and without water usage schemes changed little, and correlation coefficients for latent heat flux increased by 0.07, and the root mean square errors decreased from 57.6 to 52.6 W/m2 after applying urban water usage schemes.
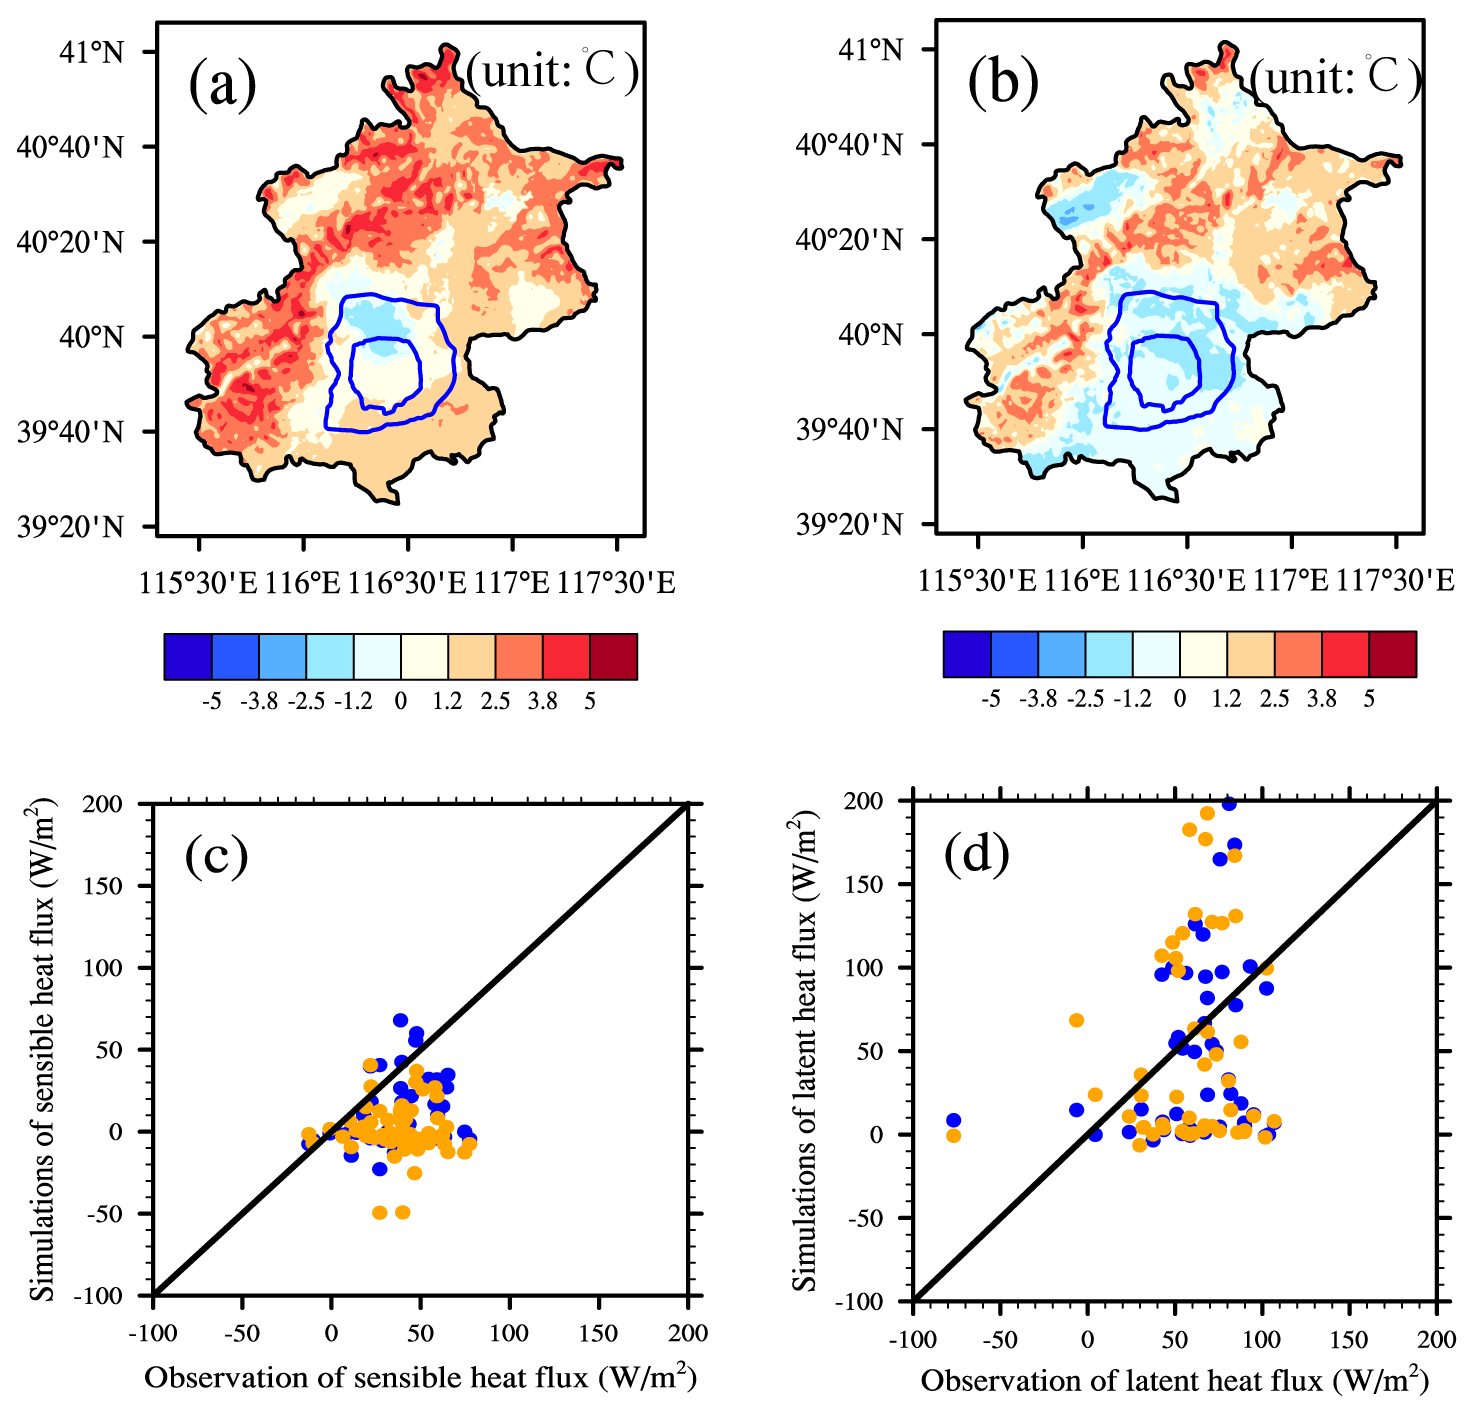
Figure 8Comparisons between WRF simulations with and without water usage schemes. (a) Temperature difference between WRF model simulations without urban water usage scheme and CLDAS. (b) Temperature difference between WRF model simulations with urban water usage scheme and CLDAS. (c) Sensible heat flux comparisons between station observation and WRF simulation. (d) Latent heat flux comparisons between station observation and WRF simulation. Blue dots are the raw simulation results, and orange dots are the simulation results with urban water usage schemes.
Table 4Relationships between the amounts of water applied and cooling effects.
3.2 Relationships between the amounts of water applied and the cooling effect
Figure 9 shows that road sprinkling and urban irrigation both decreased the air temperature. Road sprinkling was mainly conducted at night to avoid disturbing traffic. The simulation results in Fig. 9 show that the temperature decreased by a maximum of around 0.5–1 ∘C in the city center where most roads were found, whereas there were no significant decrease in the temperature in rural areas where the lowest amount of road sprinkling occurred due to the low quantity of road surfaces in these areas. However, urban irrigation during the daytime decreased the temperatures in the day and night. Figure 10 shows that urban irrigation in the city center decreased the temperature by more than 1 ∘C when large volumes of water were applied. In the rural areas, the water applied for farmland irrigation had a reasonable cooling effect in the daytime, and the cooling effect continued, but it was smaller in the nighttime due to the evaporation from farmland crops and urban plants after irrigating in the daytime. This effect was much more significant in the rural areas than in the city center and suburbs. In addition, localized water usage could influence all of the areas, whereas road sprinkling or urban irrigation in the city center could decrease the temperatures in the suburbs or rural areas, and this effect may also occur in other locations. In general, the cooling effect of urban irrigation was stronger than that of road sprinkling because the amount of water applied for urban irrigation was greater than that for road sprinkling.
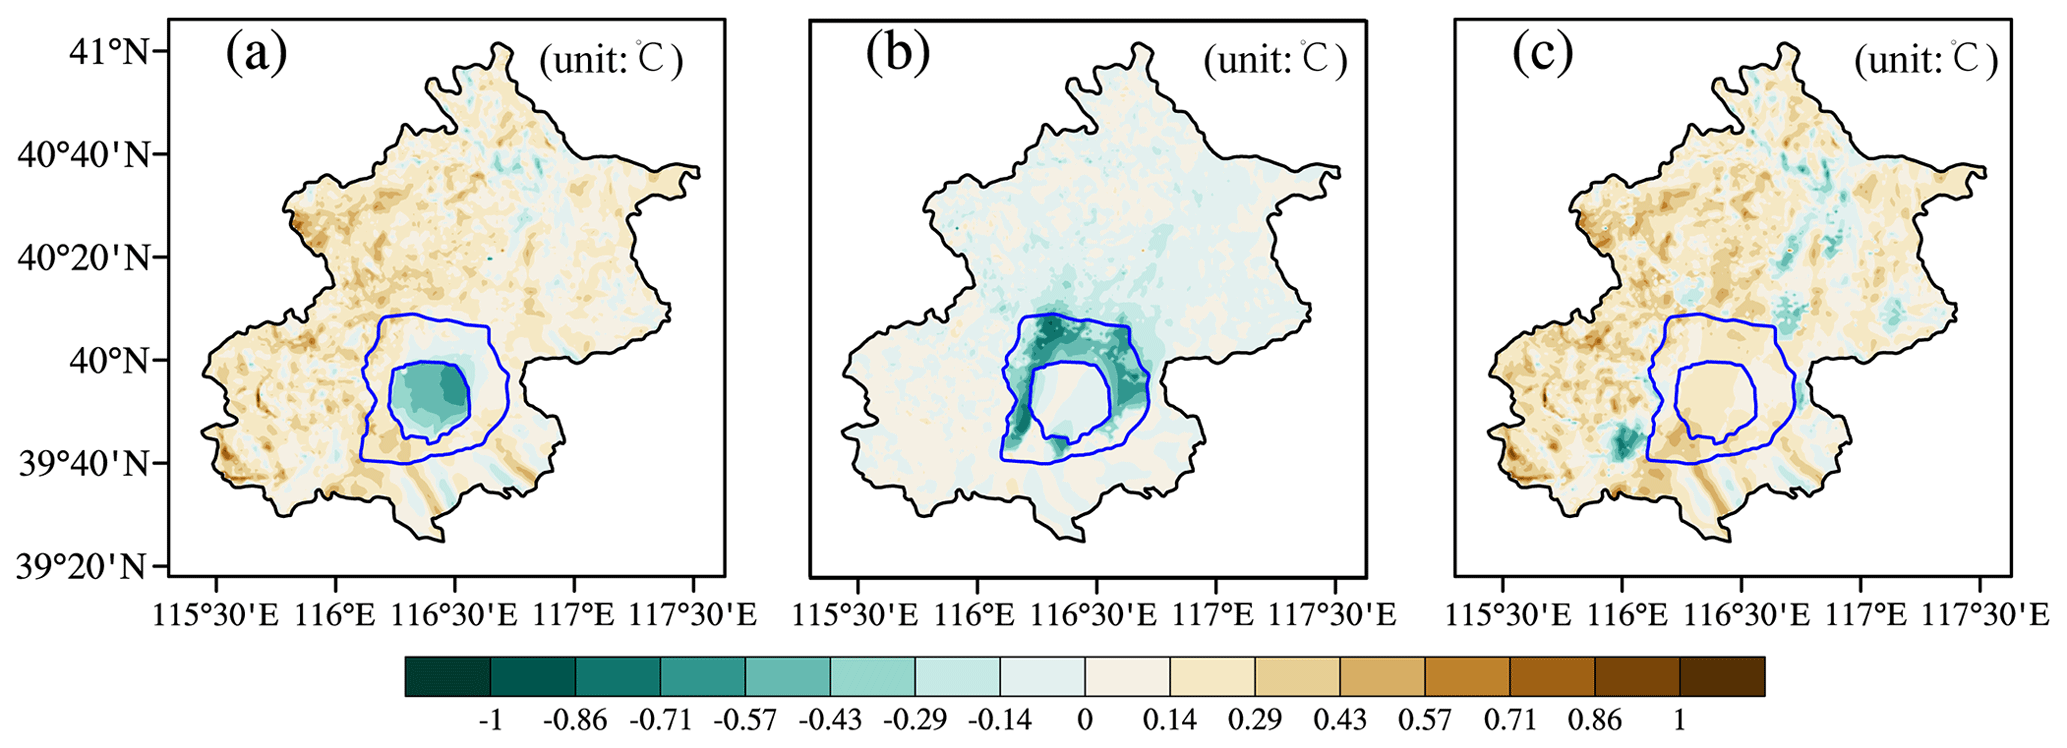
Figure 9Cooling effects in the city center (a), suburbs, (b) and rural areas (c) due to road sprinkling in the night. The amount of water was half the maximum water-holding capacity of the urban impervious layer.

Figure 10Cooling effects in the city center, suburbs, and rural areas due to urban irrigation during the day and night. (a) Cooling effect of urban irrigation in city center during the day. (b) Cooling effect of urban irrigation in suburbs during the day. (c) Cooling effect of urban irrigation in rural areas during the day. (d) Cooling effect of urban irrigation in city center during the night. (e) Cooling effect of urban irrigation in suburbs during the night. (f) Cooling effect of urban irrigation in rural areas during the night. The amount of water was the estimated urban irrigation.
The application of water in urban areas could change the energy cycles and dynamic processes. Figure 11 shows that the changes in these variables were most significant in the areas where road sprinkling or urban irrigation were conducted, and they could weaken the dynamic atmospheric processes. The application of water by road sprinkling or urban irrigation increased the latent heat flux, decreased the sensible heat flux, and lowered the boundary layer heights locally. However, changes could be more general throughout the whole region. For example, urban irrigation in the city center lowered the boundary layer height in the city center but also affected the suburbs and rural areas. Similar results were found for the latent heat flux and sensible heat flux, but they were not as significant.
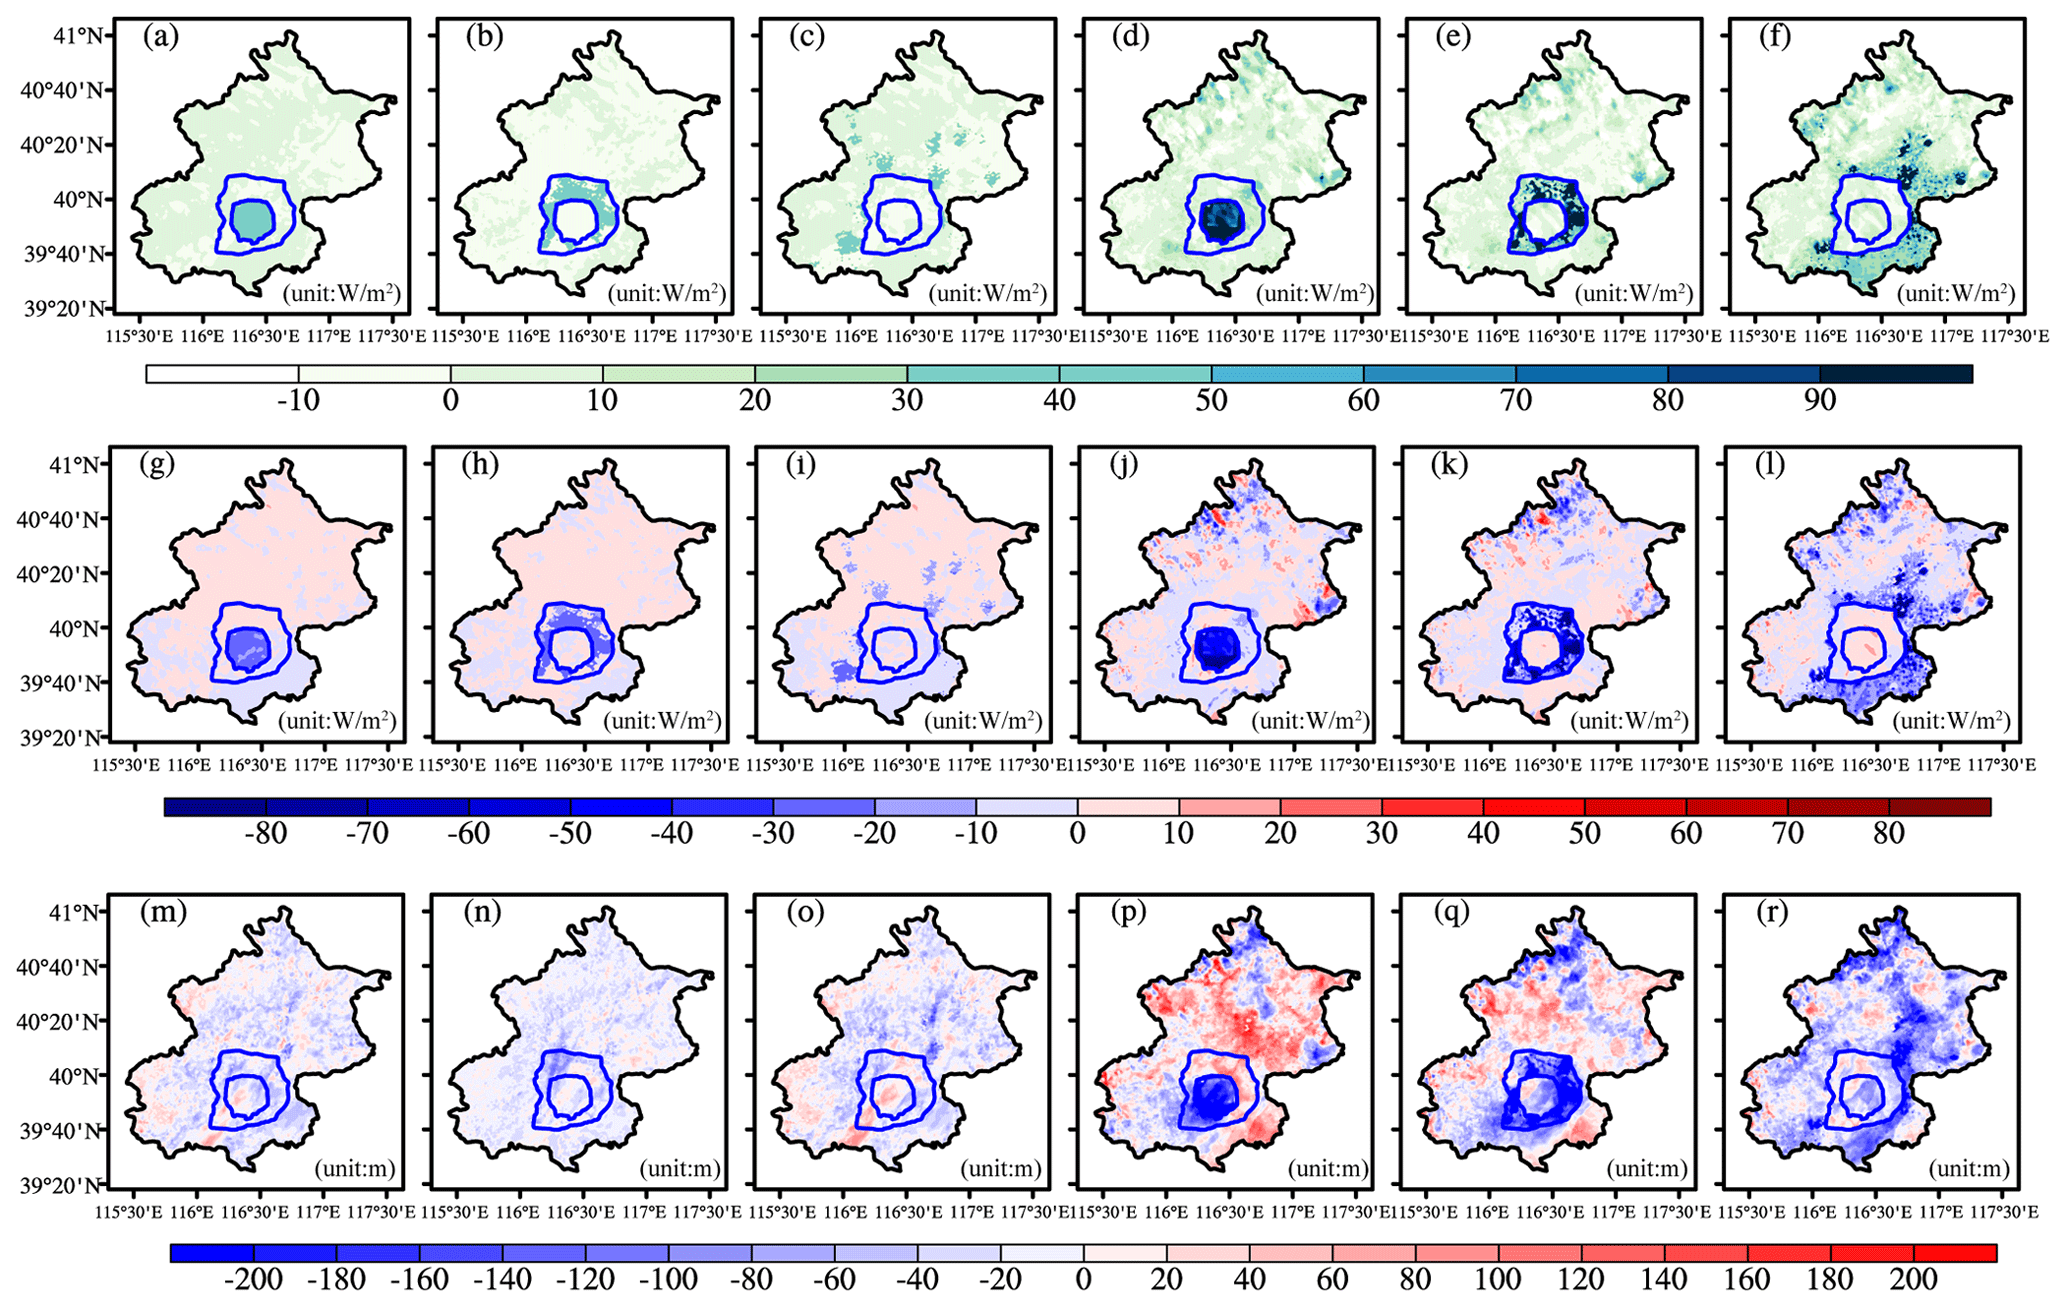
Figure 11Changes in the latent heat flux, sensible heat flux, and boundary layer height due to road sprinkling and urban irrigation. (a) Changes in latent heat flux (LH) due to road sprinkling in the city center. (b) Changes in LH due to road sprinkling in the suburbs. (c) Changes in LH due to road sprinkling in rural areas. (d) Changes in LH due to urban irrigation in the city center. (e) Changes in the LH due to urban irrigation in suburbs. (f) Changes in LH due to urban irrigation in rural areas. (g–l) Changes in sensible heat flux in a similar manner to panels (a–f). (m–r) Changes in the boundary layer height in a similar manner to panels (a–f).
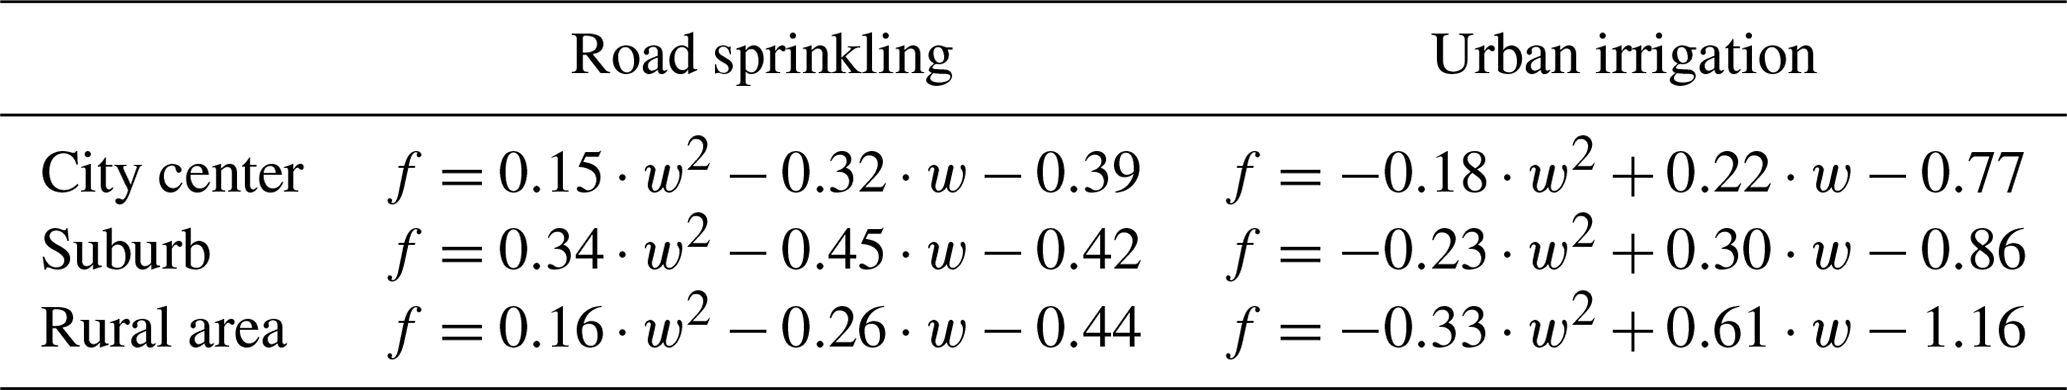
The quadratic functions fitted to the relationships between the amounts of water applied and the cooling effects in the simulations are shown in Fig. 12 and Table 4. The normalized amounts of water applied in the city center, suburbs, and rural areas for road sprinkling and urban irrigation were 0.528×10⁸, 0.2868×10⁸, and 0.039×10⁸, and 0.81×10⁸, 1.72×10⁸, and 4.45×10⁸ m3/month, respectively. The actual amounts of water applied can be determined by multiplying the values on the x axis and those given above. The results showed that the cooling effects of road sprinkling were similar in three parts of the city, where the temperature decreased by a maximum of about 0.55 ∘C, and the cooling effects remained stable when more water was sprinkled on the roads in the suburbs and rural areas. Sprinkling the roads in the city center changed the regional temperature more rapidly compared with sprinkling water in the suburbs and rural areas. However, the cooling efficiency did not increase according to the amount of water applied (for each normalized amount of water applied, the effect of water sprinkling in the city center was twice that in the suburbs and 10 times than that in the rural areas, but the cooling effect was similar where the cooling efficiency was lower in the city center than suburb and rural areas), possibly because the water sprinkled in the city center was concentrated in a smaller area where the wind was reduced, and this decreased the cooling efficiency. The cooling effect of urban irrigation was generally greater than that of road sprinkling, and it was most significant in rural areas. However, the cooling efficiency of urban irrigation was lower in rural areas than the city center and suburbs because, in order to apply the same normalized amount of water for irrigation, the actual amount of water applied in rural areas was almost five times that in the city center and two times that in the suburbs, but the temperature decrease in the rural areas was only 1.5 times higher than that of the city center and suburbs. Thus, the effect of urban irrigation was most efficient in the city center. The cooling effects in the city center and suburbs increased as the amount of water applied increased, which differed slightly from the effect of road sprinkling. We also found that some points deviated greatly compared with others in the city center, following road sprinkling, according to regression analysis (Fig. 12a), possibly because road sprinkling was limited to a small area in the city center with a low amount, and the overall effect could not be determined based on the cooling of the city center due to the occurrence of random processes in the atmosphere. Also, other researchers showed that the cooling effect varied with different water amounts, regions, and weather conditions (Broadbent et al., 2018; Wang et al., 2019; Gao et al., 2020).
3.3 Optimal water use strategies
The problem of distributing water to plants and roads in different parts of a city in order to obtain the optimal cooling effect can be solved using an optimization scheme. In this study, we divided the city into three parts according to the population density and urban type, i.e., the city center, suburbs, and rural areas. If the relationships between the amounts of water applied and the cooling effects were known for the three parts of city, then an optimal water usage scheme could be developed, where the optimization objective could be defined as the comprehensive temperature decrease attributable to both road sprinkling and urban irrigation in the city center, suburbs, and rural areas. The optimal water usage scheme could be described as follows:
where i represents road sprinkling and urban irrigation, with i equal to 1 or 2, respectively. j represents the city center, suburbs, and rural areas, with j equal to 1, 2, and 3, respectively. is a function of the normalized amount of water applied and the cooling effect, which can be fitted based on the model simulation results presented in Sect. 3.2.
Considering that the total amount of urban water supplied for road sprinkling and urban irrigation is a fixed value, the water demand for each part of city should satisfy the minimal needs for the municipal services and plants in terms of ecology, farmland, and roads. Thus, the constraint conditions for optimizing the usage of water are as follows:
where A represents the total water supplied for road sprinkling and urban irrigation. j represents the city center, suburbs, and rural areas, with j equal to 1, 2, and 3, respectively. bj represents the minimal water demand for road sprinkling, Bj represents the maximum water supply for road sprinkling, cj represents the minimal water demand for urban irrigation, and Cj represents the maximum water supply for urban irrigation. In addition, other water restrictions applied in each part of the city can be expressed as other equalities or inequalities in this optimal water usage scheme.
Table 5Constraint conditions for water usage in urban, suburban, and rural areas.
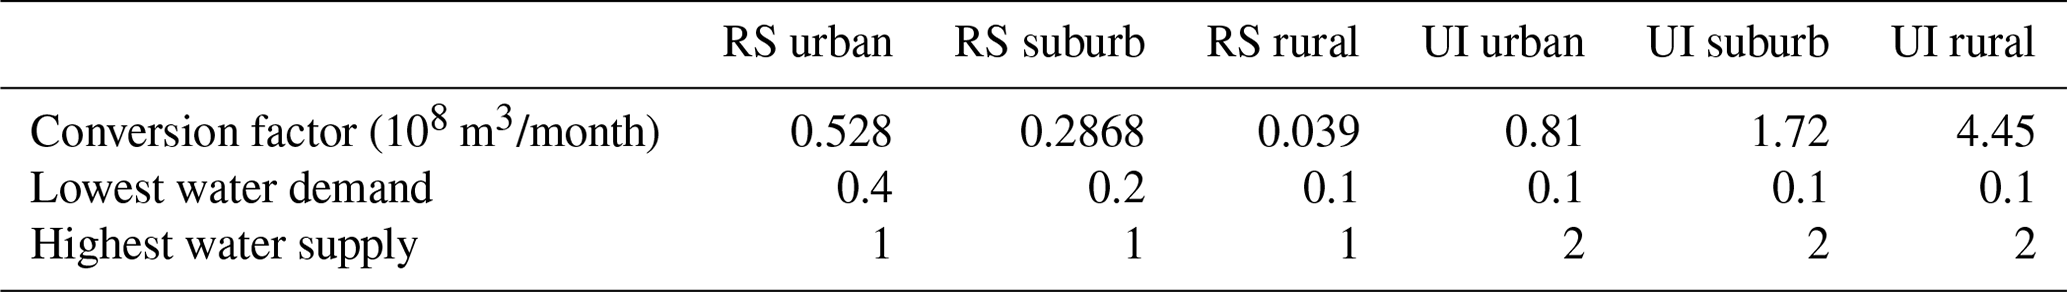
RS – road sprinkling; UI – urban irrigation.
Based on the historical water demand and supply for municipal services described in the Water Resources Bulletin of Beijing, the Requirements for Quality and Operation of City Road Sweeping and Cleaning, and the textbook entitled Water Supply Engineering, we set the constraint conditions given in Table 5. In addition, according to Beijing's 13th 5 Year Plan, the water supply for the whole city was set as 43×108 m3/year and the total amount of water for road sprinkling and urban irrigation as about 17×108 m3/year, which was mainly consumed in summer periods, excluding the water usage by industry and residents. Solving this optimization problem started by artificially assigning initial values to the solution and then solving the initial objective function value in Eq. (5) before assigning new values to the solution according to the search algorithms and the constraint conditions in Eqs. (6)–(8). A new objective function value was solved during this step. These two steps were repeated until the objective function value changed little. We used the Optimization Toolbox in MATLAB to solve the problem. After 24 loop iterations, the results showed that the normalized amounts of water applied for road sprinkling in the city center, suburbs, and rural areas were 0.4, 0.2, and 0.1 (the actual amounts of water applied were 0.21 ×10⁸, 0.06 ×10⁸, and 0.04 ×10⁷ m3/month, and road sprinkling in the whole city accounted for almost 10 % of the total water supply), respectively. The normalized amounts of water applied for urban irrigation in the city center, suburbs, and rural areas were 0.43, 0.36, and 0.40 (the actual amounts of water applied were 0.35 ×10⁸, 0.62 ×10⁸, and 1.78×10⁸ m3/month, respectively and urban irrigation in the whole city accounted for almost 90 % of the total water supply) to obtain the greatest cooling effect, with a temperature decrease of 1.9 ∘C. These results were reasonable because the enhanced cooling effect of road sprinkling decreased as the amount of water applied increased, so the lowest water demand was similar when more water was applied by road sprinkling. Urban irrigation in rural areas accounted for a large proportion of the total water supply in order to satisfy the needs for crop growth and environmental cooling.
The optimized results may be slightly higher than the actual requirements because the water usage in one part of a city will affect the cooling effects in other parts. The uncertainties related to the constraint conditions will also affect the results. The total amount of water applied for road sprinkling and urban irrigation (A in Eq. 6) must be considered among these uncertainties. Thus, we conducted sensitivity based on proportions ranging from 0.7 to 1.5 relative to 17×108 m3/year for the total amount of water applied. The results showed that the relationship between the total amount of water applied (A) and the cooling effect was nonlinear, where the temperature decreased sharply as the total amount of water applied (A) increased (see Fig. 13).
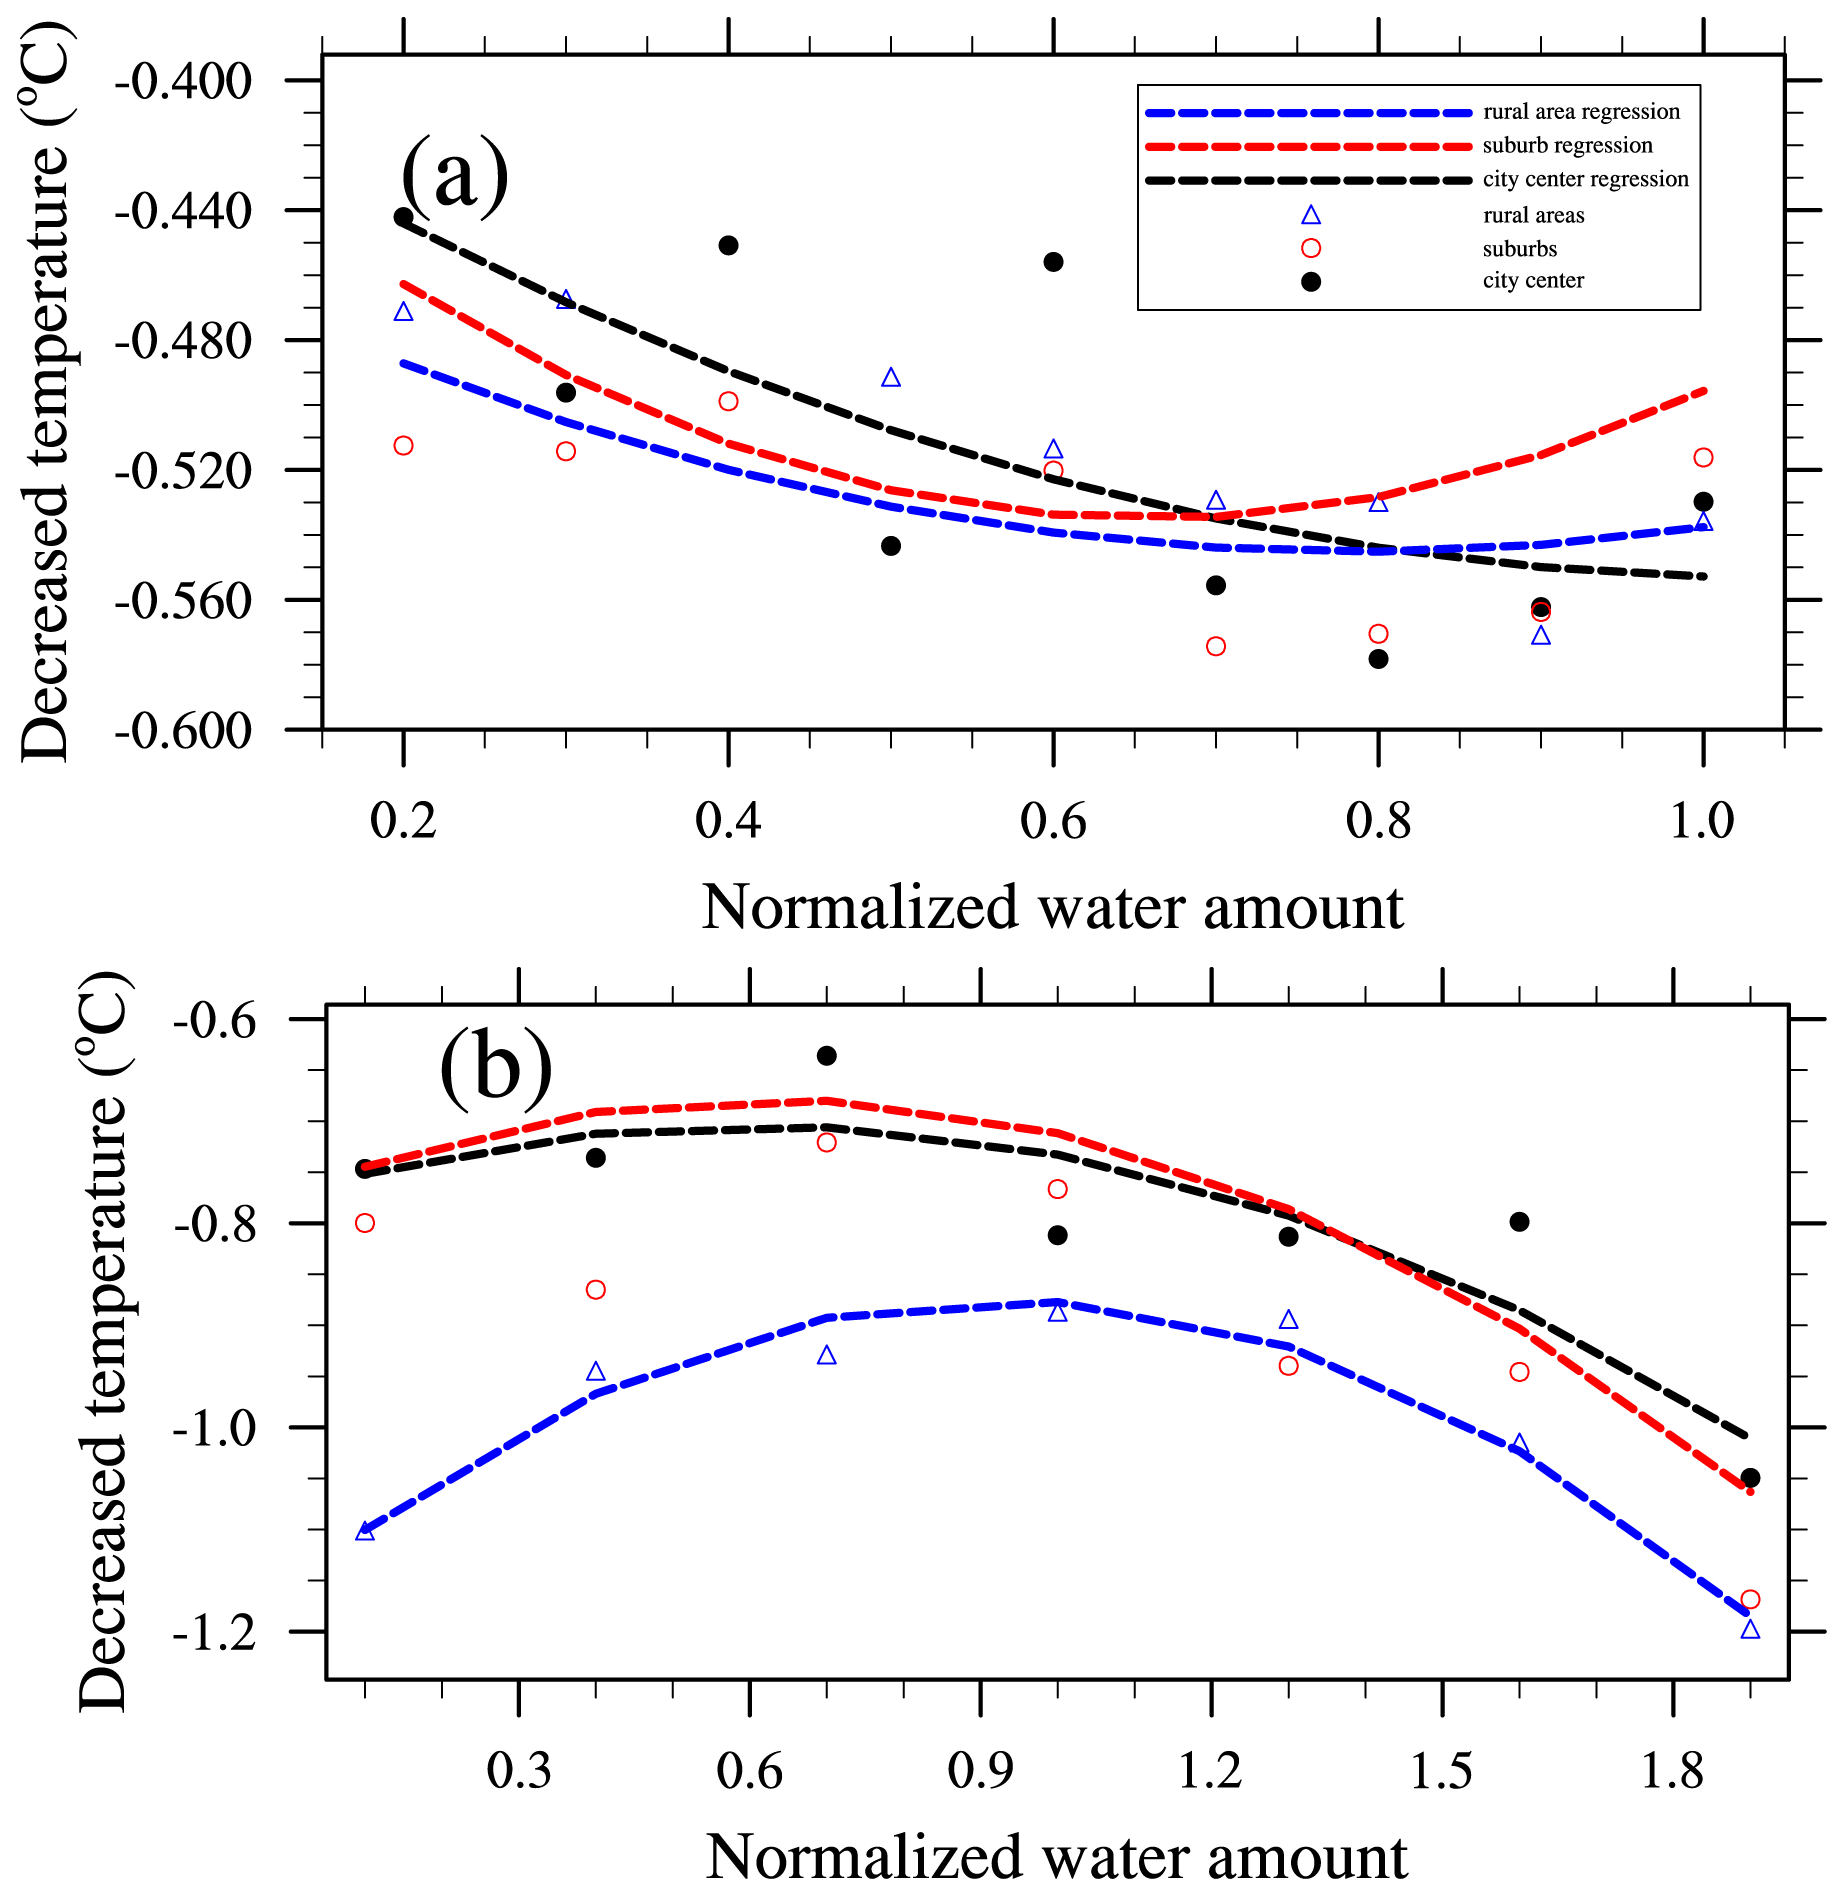
Figure 12Relationships between the amount of water applied and the cooling effect (a) for road sprinkling and (b) for urban irrigation. The black dots denote the cooling effect of water applied in the city center based on model simulations, red circles denote the cooling effect of water applied in suburbs based on model simulations, and blue triangles denote the cooling effect of water applied in rural areas based on model simulations. The lines are polynomial regression curves, and black, red, and blue represent the city center, suburbs, and rural areas, respectively.

Figure 13Sensitivity analysis based on the normalized total water supply and the cooling effect.
In this study, we coupled improved water usage schemes for road sprinkling and urban irrigation in the WRF model. The soil hydrological and urban canopy model were modified for this study. Simulations were then conducted at a resolution of 1 km, where different amounts of water were applied via road sprinkling and urban irrigation in a case study set in Beijing, China. We determined the relationships between the amounts of water applied and the cooling effects in different parts of the city. The efficiency of the cooling effect due to road sprinkling decreased as the amount of water applied increased, where the city center cooled the most because more roads were present in a small area, whereas sprinkling had no significant effect in rural areas. Urban irrigation in the daytime cooled the city during the day and night because evapotranspiration from the plants and soil was enhanced. The cooling effect was more general throughout the region and not limited to local areas. In addition, urban water usage locally increased the latent heat flux but decreased the sensible heat flux and the boundary layer height. Some uncertainties were evident in the simulations. Different land use type data changed the urban and plant distributions, and conducting the simulations with the default MODIS-based land use data may have led to cooling effect errors. The direct driving factor responsible for the cooling effect was the amount of water used for these land use types, and the differences were small. Obtaining better estimates of water use can reduce the errors due to land use data. In addition, the cooling effect in each part of the city was regionally averaged, which may have reduced the significance of specific land use types. However, these errors may increase in the future because of greater land use changes.
We also conducted an optimization process to determine the appropriate amounts of water for application by urban irrigation and road sprinkling in different parts of city, where we treated decreasing the temperature as the optimization objective and the total water supply, highest water supply in different parts of the city, and lowest water demands in the city center, suburbs, and rural areas as the constraint conditions. The optimization results showed that the temperature could be reduced by 1.9 ∘C by using road sprinkling and urban irrigation in the city center, suburbs, and rural areas when the normalized amounts of water are applied (i.e., 0.4, 0.2, and 0.1 for road sprinkling and 0.43, 0.36, and 0.40 for urban irrigation, respectively). A sensitivity analysis based on the total water supply for the whole city (A) detected a nonlinear relationship between the total water supply (A) and the optimized decrease in the temperature, where the cooling effect increased sharply as the amount of water applied increased. Considering Beijing's 13th 5 Year Plan, allocating about 90 % of the total water to urban irrigation and 10 % to road sprinkling is the most effective approach for mitigating high urban temperatures.
In addition, other large cities such as Tokyo, London, and Phoenix are affected by the threat of high temperatures in the summer. In these cities, urban water use management is an important part of municipal planning in order to balance the water demand and supply and to improve the urban climate. Road sprinkling might not be a common solution for mitigating high temperatures in other countries, but the optimal water usage scheme determined in the present study is still applicable to other cities where the road sprinkling supply can be set to zero if no road sprinkling occurs.
Model code can be obtained from the corresponding author, and the data used in this study are available from 4TU.Centre for Research Data (https://doi.org/10.4121/uuid:01621202-7ec4-4643-84b5-5f9ec2966004; Liu, 2019).
BL conducted the simulation analysis and prepared the paper. ZX helped with the paper preparation and editing. CS provided the validation data. SL and YZ developed the initial model. RL, LW, YW, and SC helped with data analysis. BJ, PQ, and JX offered valuable suggestions.
The authors declare that they have no conflict of interest.
The authors thank the National Meteorological Information Center, China Meteorological Administration, for data support.
This study was supported by the Strategic Priority Research Program of Chinese Academy of Sciences (grant no. XDA23090102), the National Natural Science Foundation of China (NSFC) project (grant nos. 41830967 and 41575096), the Key Research Program of Frontier Sciences, Chinese Academy of Sciences (CAS) (grant no. QYZDY-SSW-DQC012) and the National Key Research and Development Program of China (grant nos. 2018YFC1506602 and 2020YFA0608203).
This paper was edited by Xing Yuan and reviewed by two anonymous referees.
Alter, R. E., Im, E. S., and Eltahir, E. A. B.: Rainfall consistently enhanced around the Gezira Scheme in East Africa due to irrigation, Nat. Geosci., 8, 763–767, https://doi.org/10.1038/Ngeo2514, 2015.
Amir, I. and Fisher, F. M.: Analyzing agricultural demand for water with an optimizing model, Agr. Syst., 61, 45–56, https://doi.org/10.1016/S0308-521x(99)00031-1, 1999.
Beijing Municipal Bureau of quality and technical supervision (Beijing M.): Requirements for quality and operation of city road sweeping and cleaning, available at: http://www.bjhd.gov.cn/zfxxgk/auto4563_51859/auto4563_58246/auto4563/auto4563_58250/201810/P020170911550912062687.pdf (last access: 20 March 2020), 2014.
Broadbent, A. M., Coutts, A. M., Tapper, N. J., and Demuzered, M.: The cooling effect of irrigation on urban microclimate during heatwave conditions, Urban climate, 23, 309–329, 2018.
Chen, M. X., Zhang, H., Liu, W. D., and Zhang, W. Z.: The global pattern of urbanization and economic growth: Evidence from the last three decades, PLos One, 9, e103799, https://doi.org/10.1371/journal.pone.0103799, 2014.
Coutts, A. M., Tapper, N. J., Beringer, J., Loughnan, M., and Demuzere, M. J. P. i. P. G.: Watering our cities: The capacity for Water Sensitive Urban Design to support urban cooling and improve human thermal comfort in the Australian context, Prog. Phys. Geogr., 37, 2–28, 2013.
DeAngelis, A., Dominguez, F., Fan, Y., Robock, A., Kustu, M. D., and Robinson, D.: Evidence of enhanced precipitation due to irrigation over the Great Plains of the United States, J. Geophys. Res.-Atmos., 115, D15115, https://doi.org/10.1029/2010jd013892, 2010.
Ek, M. B. and Holtslag, A. A. M.: Influence of soil moisture on boundary layer cloud development, J. Hydrometeorol., 5, 86–99, https://doi.org/10.1175/1525-7541(2004)005<0086:Iosmob>2.0.Co;2, 2004.
Feinerman, E., Bresler, E., and Dagan, G.: Optimization of a spatially-variable resource – An illustration for irrigated crops, Water Resour. Res., 21, 793–800, https://doi.org/10.1029/WR021i006p00793, 1985.
Gao, K. and Santamouris, M.: The use of water irrigation to mitigate ambient overheating in the built environment: Recent progress, Build. Environ., 164, 106346, https://doi.org/10.1016/j.buildenv.2019.106346, 2019.
Gao, K., Santamouris, M., and Feng, J.: On the cooling potential of irrigation to mitigate urban heat island, Sci. Total Environ., 740, 139754, https://doi.org/10.1016/j.scitotenv.2020.139754, 2020.
Hendel, M. and Royon, L.: The effect of pavement-watering on subsurface pavement temperatures, Urban Climate, 14, 650–654, 2015.
Hendel, M., Gutierrez, P., Colombert, M., Diab, Y., and Royon, L.: Measuring the effects of urban heat island mitigation techniques in the field: Application to the case of pavement-watering in Paris, Urban Climate, 16, 43–58, 2016.
Kueppers, L. M., Snyder, M. A., and Sloan, L. C.: Irrigation cooling effect: Regional climate forcing by land-use change, Geophys. Res. Lett., 34, L03703, https://doi.org/10.1029/2006gl028679, 2007.
Kuschel-Otarola, M., Rivera, D., Holzapfel, E., Palma, C. D., and Godoy-Faundez, A.: Multiperiod optimisation of irrigated crops under different conditions of water availability, Water, 10, 1434, https://doi.org/10.3390/w10101434, 2018.
Liu, B.: Data from research on optimal water use strategies to mitigate high urban temperatures, https://doi.org/10.4121/uuid:01621202-7ec4-4643-84b5-5f9ec2966004, 2019.
Lobell, D. B., Bonfils, C. J., Kueppers, L. M., and Snyder, M. A.: Irrigation cooling effect on temperature and heat index extremes, Geophys. Res. Lett., 35, L09705, https://doi.org/10.1029/2008gl034145, 2008.
McCarthy, M. P., Best, M. J., and Betts, R. A.: Climate change in cities due to global warming and urban effects, Geophys. Res. Lett., 37, L09705, https://doi.org/10.1029/2010GL042845, 2010.
Moore, N. and Rojstaczer, S.: Irrigation-induced rainfall and the great plains, J. Appl. Meteorol., 40, 1297–1309, https://doi.org/10.1175/1520-0450(2001)040<1297:Iiratg>2.0.Co;2, 2001.
Mueller, N. D., Butler, E. E., McKinnon, K. A., Rhines, A., Tingley, M., Holbrook, N. M., and Huybers, P.: Cooling of US Midwest summer temperature extremes from cropland intensification, Nat. Clim. Change, 6, 317-322, https://doi.org/10.1038/Nclimate2825, 2016.
Pei, L. S., Moore, N., Zhong, S. Y., Kendall, A. D., Gao, Z. Q., and Hyndman, D. W.: Effects of irrigation on summer precipitation over the United States, J. Climate, 29, 3541–3558, https://doi.org/10.1175/Jcli-D-15-0337.1, 2016.
Puma, M. J. and Cook, B. I.: Effects of irrigation on global climate during the 20th century, J. Geophys. Res.-Atmos., 115, D16120, https://doi.org/10.1029/2010jd014122, 2010.
Shi, C., Xie, Z., Qian, H., Liang, M., and Yang, X.: China land soil moisture EnKF data assimilation based on satellite remote sensing data, Science China Earth Sciences, 54, 1430–1440, 2011.
Skamarock, W. C., Klemp, K. J., Dudhia, J., Gill, D. O., Barker, D. M., and Duda, M. G.: A description of the advanced research WRF version 3, NCAR Technical Note, Boulder, Colorado, USA, NCAR/TN–475+STR, 2008.
Tewari, M., Chen, F., Kusaka, H., and Miao, S. J. N. W. D.: Coupled WRF/Unified Noah/urban-canopy modeling system, NCAR, Boulder, 1–22, 2007.
Vahmani, P. and Hogue, T. S.: Incorporating an urban irrigation module into the Noah land surface model coupled with an urban canopy model, J. Hydrometeorol., 15, 1440–1456, 2014.
Wang, C., Wang, Z.-H., and Yang, J.: Urban water capacity: Irrigation for heat mitigation, Computers, Environment Urban Systems, 78, 101397, https://doi.org/10.1016/j.compenvurbsys.2019.101397, 2019.
WMO: The global climate 2001–2010: A decade of climate extremes, summary report, WMO, Geneva, Switzerland, 16, 2013.
Yamagata, H., Nasu, M., Yoshizawa, M., Miyamoto, A., and Minamiyama, M.: Heat island mitigation using water retentive pavement sprinkled with reclaimed wastewater, Water Sci. Technol., 57, 763–771, https://doi.org/10.2166/wst.2008.187, 2008.
Yang, K., He, J., Tang, W., Qin, J., and Cheng, C. C.: On downward shortwave and longwave radiations over high altitude regions: Observation and modeling in the Tibetan Plateau, Agr. Forest Meteorol., 150, 38–46, 2010a.
Yang, Z., Dou, Y., and Wang, Z.: Analysis on the reasons of the decline of ground water level in the primary water supply source area of Beijing and the countermeasures, China Water Resources, 19, 52–54, https://doi.org/10.3724/SP.J.1016.2015.00455, 2010b.
Yang, Z., Dominguez, F., Zeng, X. B., Hu, H. C., Gupta, H., and Yang, B.: Impact of irrigation over the California Central Valley on regional climate, J. Hydrometeorol., 18, 1341–1357, 2017.
Zeng, Y. J., Xie, Z. H., and Zou, J.: Hydrologic and climatic responses to global anthropogenic groundwater extraction, J. Climate, 30, 71–90, https://doi.org/10.1175/Jcli-D-16-0209.1, 2017.
Zhang, J., Li, T. T., Tan, J. G., Huang, C. R., and Kan, H. D.: Impact of temperature on mortality in three major Chinese cities, Biomed. Environ. Sci., 27, 485–496, 2014.