the Creative Commons Attribution 4.0 License.
the Creative Commons Attribution 4.0 License.
 | 23 Jun 2021
Probabilistic modeling of field-scale CO2 generation by carbonate–clay reactions in sedimentary basins
Giulia Ceriotti
Claudio Geloni
Matilde Dalla Rosa
Alberto Guadagnini
Giovanni Porta
This work explores a probabilistic modeling workflow and its implementation targeting CO2 generation rate and CO2 source location by the occurrence of carbonate–clay reactions (CCRs) in three-dimensional realistic sedimentary basins. We ground our study on the methodology proposed for a one-dimensional case study and a single CCR formulation by Ceriotti et al. (2017) which includes a framework to account for thermodynamic parameter uncertainties. This methodology is here extended to a realistic three-dimensional sedimentary basin setting and transferred to encompass different types of CCRs, including two newly formulated CCRs which account for minerals typically observed in sedimentary environments. While testing the ability of the selected procedure to model diverse CCRs in three-dimensional realistic subsurface sedimentary systems, we quantitatively compare the impact of CCR formulation on the spatial distribution of CO2 source location, temperature and pressure compatible with CO2 gaseous generation, and CO2 generation rate in three-dimensional environments characterized by complex and non-uniform stratigraphy. The application of the procedure to various types of CCRs enables us to provide an insight into the impact of mineralogical composition on the activation temperature and pressure and the amount of CO2 released by the different CCR mechanisms. Finally, we show the implementation of the proposed probabilistic framework to define scenarios associated with various levels of probability to be used as the input and boundary conditions for CO2 migration and transport models in the subsurface.
- Article
(6555 KB) - Full-text XML
-
Supplement
(171 KB) - BibTeX
- EndNote


Carbon dioxide (CO2) is ubiquitously found in gaseous mixtures accumulated across sedimentary basins together with hydrocarbon (e.g., CH4) and other non-hydrocarbon components (e.g., N2; Feng et al., 2016). With reference to gas reservoirs, it might constitute up to 90 % of the total gas volume (Wycherley et al., 1999), its presence often being the cause of dilution of the gas mixture and (sometimes marked) hampering of its energy content (Imbus et al., 1998). Possible sources of such large amounts of CO2 in a sedimentary basin are associated with transformation of organic carbon, carbonate mineral dissolution, inorganic chemical equilibrium of the feldspar–clay–carbonate mineral system, and magma degassing (Smith and Ehrenberg, 1989; Coudrain-Ribstein et al., 1998; Kotarba and Nagao, 2008; Li et al., 2008; Fischer et al., 2006; Ballentine et al., 2001). Processes of CO2 generation and accumulation may be of interest to the characterization of flow and geochemistry in deep subsurface systems as well as flow in relatively shallow groundwater bodies, as large CO2 accumulations may trigger vertical flow and transport processes (Kissinger et al., 2017; Marín-Moreno et al., 2019). Characterization and understanding of the key mechanisms that control the natural formation of carbon dioxide are not completely explored and are still a subject of research. A considerable body of studies (e.g., Giggenbach, 1980; Smith and Ehrenberg, 1989; Coudrain-Ribstein and Gouze, 1993; Coudrain-Ribstein et al., 1998; Xu and Pruess, 2001; Cathles and Schoell, 2007; Chiodini et al., 2007; van Berk et al., 2013; Hutcheon et al., 1990b; Hutcheon and Abercrombie, 1990; Hutcheon et al., 1990a, 1989, 1980, 1993) during the past 40 years has suggested that the interaction between carbonates, clays/aluminosilicates, and pore water might play a major role in controlling CO2 partial pressure in geologic systems. A relevant influence of mineral rock interactions on dissolved CO2 has been observed also in groundwater and surface water bodies (Shin et al., 2011). Considering a given sedimentary rock containing carbonates and clays/aluminosilicates, the amount of dissolved CO2 in the pore water is regulated by the chemical equilibrium among all mineral phases, such a buffering mechanism being typically denoted as carbonate–clay reaction (CCR; Hutcheon et al., 1990b). The CCR buffering mechanism involves a complex system of geochemical reactions which is typically condensed in terms of a schematic reaction of the kind
The possibility of occurrence of such a reaction in real (field-scale) sedimentary environments is supported by various studies (e.g., Coudrain-Ribstein et al., 1998; Hutcheon et al., 1990b; Hutcheon and Abercrombie, 1990). Several representations/formulations for carbonate–clay reactions that have been proposed share a reaction structure similar to CCR1 and differ in terms of the carbonate and aluminosilicate phases included therein (Cathles and Schoell, 2007; Coudrain-Ribstein et al., 1998; Hutcheon et al., 1990b; Zhang et al., 2000). Each of the available carbonate–clay reactions can be characterized by an equilibrium constant that quantifies the relative partitioning between reactants and products and the amount of CO2 released in the porewater when the system attains thermodynamic equilibrium.
Since the carbonate–clay buffering system is a reversible process, the CCR mechanism may act either as a CO2 sink or source depending on local temperature (T) and pressure (P), these quantities directly controlling the value of the equilibrium constant associated with the CCRs.
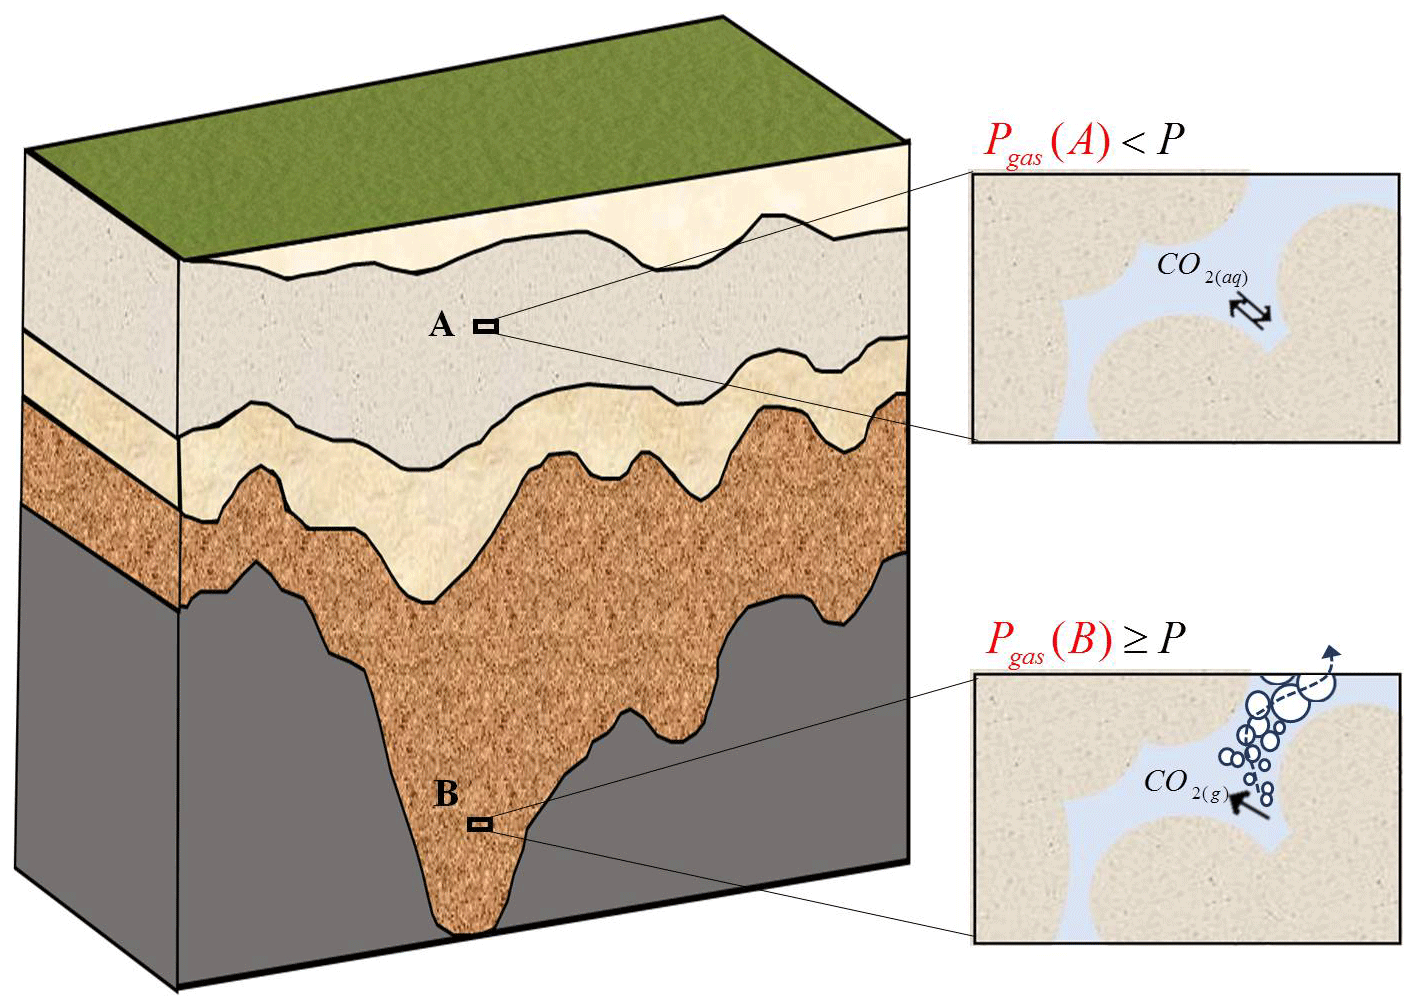
Figure 1Outline of the two possible alternative scenarios according to the conceptual approach proposed in Cathles and Schoell (2007). At location A (characterized by shallow location and moderate T–P values), the geochemical system is at equilibrium, the total gas pressure given by sum of all gases species partial pressures (Pgas) is smaller than porewater pressure (P), and the CO2 exists only as dissolved species. At location B (characterized by deep location where high T–P values are expected), the total gas pressure is larger than porewater pressure. Then a CO2-rich gaseous phase is formed, which migrates upwards, and a disequilibrium is promoted, leading to continuous release of CO2 until one of the reactants of the CCR is exhausted.
The study of Smith and Ehrenberg (1989) suggests that the equilibrium constant (KCCR1) characterizing CCR1 can take values larger than 1 for temperatures higher than 100–120 ∘C, thus favoring release of CO2 which can then be found as a dissolved species in porewater. Starting from this analysis, Cathles and Schoell (2007) propose a simple conceptual model which distinguishes two possible alternative CCR behaviors. These are exemplified in the depiction of Fig. 1, where we consider two points A and B located at different depths in a sedimentary environment, as described in the following.
-
Location A in Fig. 1 corresponds to shallow depths. Here, CO2 and all chemical species dissolved in the porewater are at equilibrium with the mineral assemblage. CO2 and other gaseous species (e.g., CH4) can appear only as dissolved phases. The moderate temperature and pressure typically associated with these shallow depths do not promote formation of large amounts of CO2. Thus, the sum of the partial pressures of all gaseous species attains values that are smaller than the porewater pressure (i.e., Pgas < P).
-
Location B corresponds to large depths. High temperature values that are expected to take place at such locations tend to remarkably shift the equilibrium towards the right-hand side of the CCR reaction, a high amount of CO2 being then released into the porewater. In this scenario, the partial pressure of CO2 (summed to other gaseous compounds, including, e.g., aqueous vapor) is typically higher than porewater pressure (i.e., Pgas > P). A CO2-rich gaseous phase is then separated and tends to migrate upwards through rock matrix fractures due to buoyancy effects. A disequilibrium between the rock mineral phases and the porewater is then promoted, and generation of CO2 takes place until at least one of the reactants of the CCR system is exhausted. The occurrence of the conditions corresponding to location B is hereafter denoted as CCR mechanism activation, implying that the geochemical disequilibrium and the formation of a separate CO2-rich gaseous phase have been triggered.
Cathles and Schoell (2007) provide a first implementation of the above-described conceptual approach by relying on the linear T–P trend proposed by Smith and Ehrenberg (1989), i.e., P (bar) =6 (T (∘C) −25), and using as a reference three CCR buffering mineral assemblages, corresponding to (i) calcite–laumontite–kaolinite–quartz, (ii) siderite–daphnite–kaolinite–quartz, and (iii) magnesite–daphnite–kaolinite–quartz. Results of their analysis (a) suggest that the formation of a separate CO2-rich gaseous phase is feasible for temperature higher than 330 ∘C and (b) represent the first quantitative estimation of the temperature and pressure of CCR activation as source of gaseous CO2 in a sedimentary environment. However, it should be noted that these results cannot be readily transferred to a generic realistic sedimentary basin scenario because they are associated with (i) mineral phases that are rarely observed in real sediments (e.g., laumontite and daphnite) and (ii) a linear simplified T–P relationship.
Otherwise, T and P evolution in real sedimentary basins often displays complex patterns, each scenario being characterized by site-specific T–P spatial and temporal distributions. These are a result of the diagenetic processes of rocks and the burial history of the sedimentary basin itself and should then be appropriately included in a CCR-based assessment of gaseous CO2 generation.
These aspects are fully recognized by Ceriotti et al. (2017), who combine a one-dimensional burial model with a geochemical model formulated according to the conceptual approach suggested in Cathles and Schoell (2007). A key point of novelty introduced by Ceriotti et al. (2017) is the reliance on a probabilistic framework to propagate uncertainty of thermodynamic parameters associated with reaction CCR1 to target modeling goals (i.e., CO2 source location and CO2 generation rate). Such a stochastic modeling framework allows assessment of the probability distribution of (i) the depth at which the source of gases is located, (ii) the amount of CO2 generated (conditional on a given mineralogy of the sediments involved in the basin formation process), and (iii) the range of T–P combinations associated with gaseous CO2 generation.
In this context, an appraisal of this probabilistic approach considering a fully three-dimensional scenario with the ensuing quantification of the amount of CO2 that can be realistically released by CCR reactions is still lacking. This is precisely the key goal of this study, which is geared to (i) providing a modeling workflow conducive to estimating the spatial distributions of CO2 sources and the associated generation rates in realistic three-dimensional sedimentary basins and (ii) assessing differences in the activation temperature and pressure characterizing various possible formulations of the CCR mechanism. We note that the evaluation of all these quantities is still a major element of study and debate in the literature (Jarvie and Jarvie, 2007). Modeling of CO2 generation and accumulation in large-scale geological systems is typically prone to considerable uncertainties, chiefly due to paucity of information and to the remarkably large spatial and temporal scales involved. In this context, we illustrate a modeling framework that leads to a probabilistic quantification of the generation of CO2 by a specific class of reactive processes (i.e., CCRs). As such, our study fills a knowledge gap by providing a methodology to support quantitative investigations of spontaneous CO2 generation in large-scale geological systems, these being otherwise typically based on mostly qualitative analyses. While we consider a simple geochemical model based on thermodynamic equilibrium, our probabilistic framework of analysis is flexible and can include treatment of model uncertainty (e.g., Walker et al., 2003; Neuman, 2003) as an additional element. Setting a given model structure is simply a convenient choice to limit computational and conceptual complexity while at the same time considering a mathematical model that can be characterized by information that is typically available in field-scale settings (in terms of, e.g., mineral composition, pressure, and temperature distributions). Values of equilibrium constants are here considered uncertain because temperature and pressure values observed in sedimentary systems lie outside the range of conditions where such parameters are usually characterized (Ceriotti et al., 2017; Blanc et al., 2012). In this work we investigate the propagation of this parametric uncertainty in the presence of various (alternative) CCR formulations by focusing on a three-dimensional scenario. When considering the framework proposed by Walker et al. (2003), our work allows combining uncertainty in model parameters (equilibrium thermodynamic constants) with input uncertainty, i.e., uncertainty in the description of the reference system. The latter type of uncertainty is reflected by our choice of considering diverse mineral assemblages leading to the occurrence of differing CCRs. Note that our approach is geared towards quantification on the space–time location and intensity of the CO2 source. This information can then be used as input to quantify scenario uncertainties by delineating the spatial and temporal extent of CO2 influx. Transport and accumulation of CO2 across the subsurface can then be analyzed through approaches such as those described, e.g., in Battistelli et al. (2017). From an operational standpoint, our approach could be applied to enhance our knowledge of the degree of compatibility of CO2 concentrations observed in field-scale systems with the occurrence of CCR, as opposed to the action of other processes which might be considered in a large-scale transport model of choice.
The study is structured as follows. Section 2 is devoted to the presentation of the three-dimensional sedimentary setting and of the CCR formulations we consider. These include a typically employed formulation and two additional models involving clay and silicate minerals (such as beidellite and illite) that are frequently observed in sedimentary basins. Section 3 summarizes the modeling and uncertainty quantification workflow and procedures employed. Results are presented and discussed in Sect. 4. Finally, concluding remarks are provided in Sect. 5.
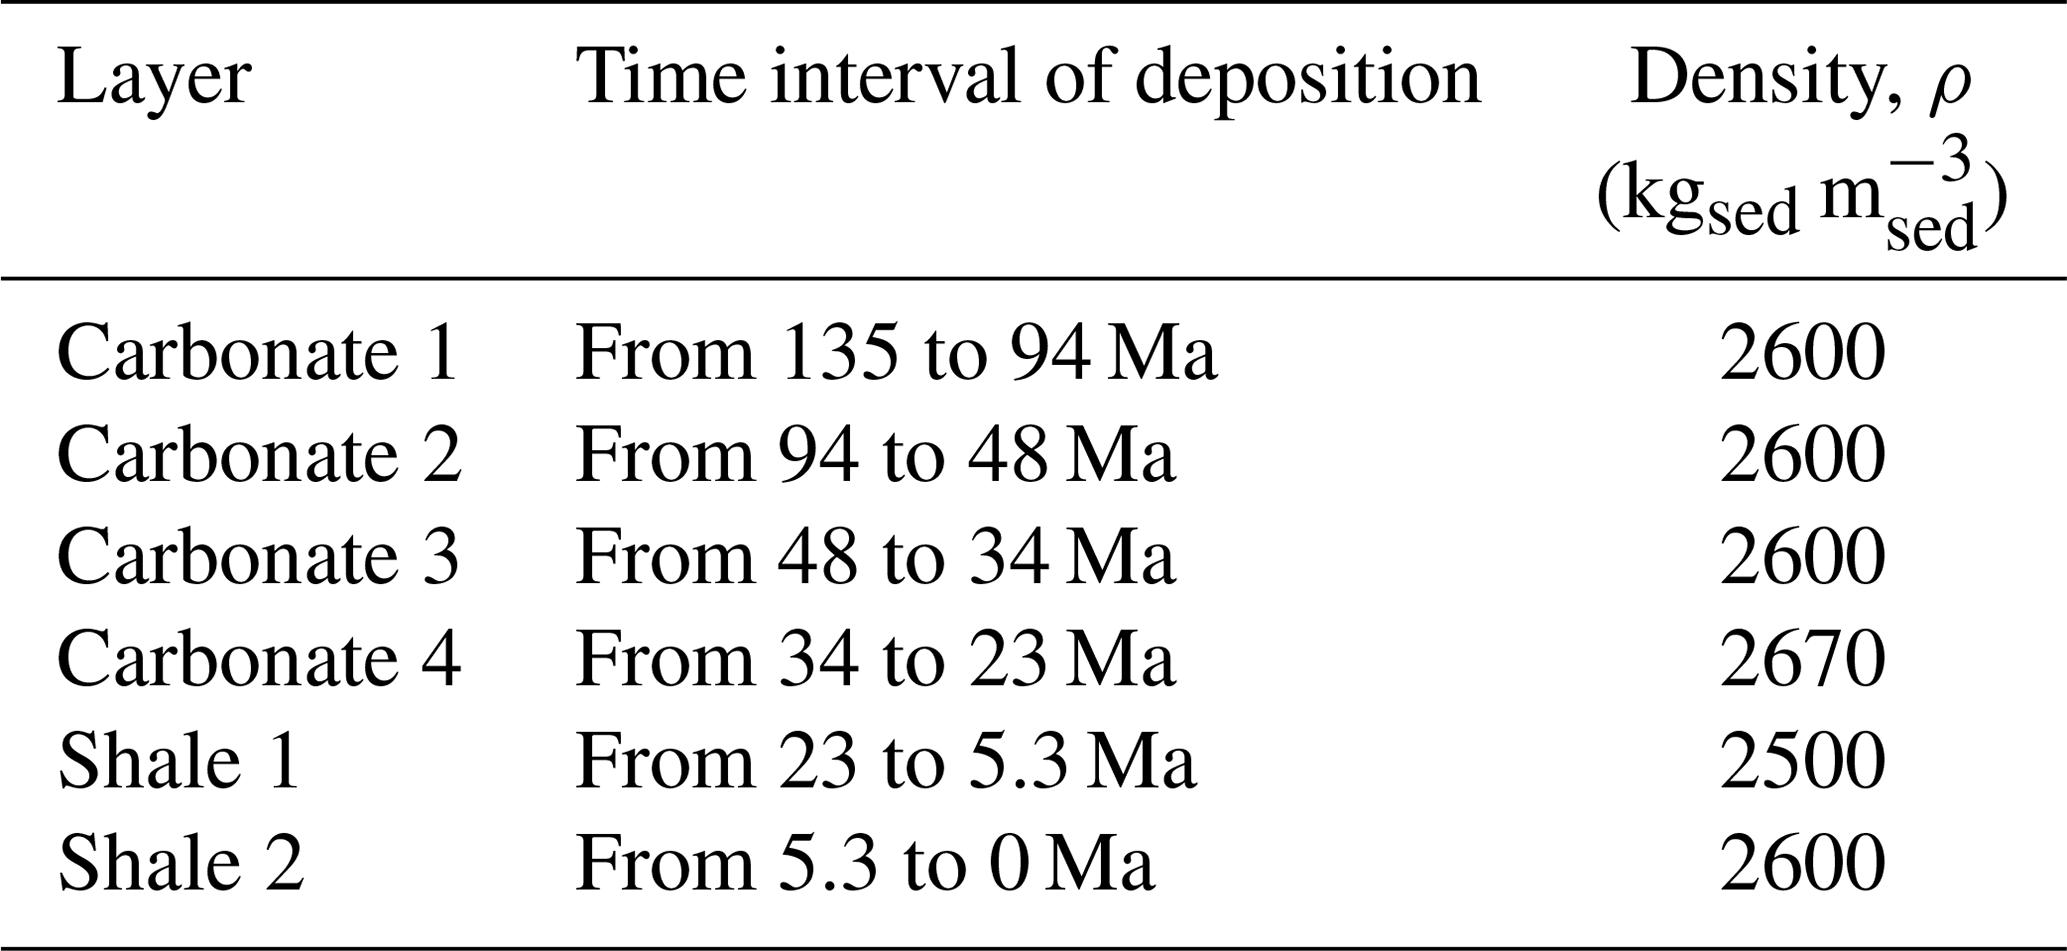
The reference system considered in this study is a three-dimensional realistic sedimentary basin with a deposition history spanning a temporal window of 135 Ma (millions of years before present) and characterized by the deposition sequence listed in Table 1.
Table 1Sequence of sediments deposited during the 135 Ma of basin deposition history and sediment density.
The basin stratigraphy at the present time (which is taken as t=0 Ma) is depicted in Fig. 2 and comprises six layers (corresponding to four carbonate and two shale rock systems). The planar surface of the basin covers an area of about 177.5 km × 155 km, the maximum depth (below sea level) reached by the volume filled by sediments being approximately 8 km.
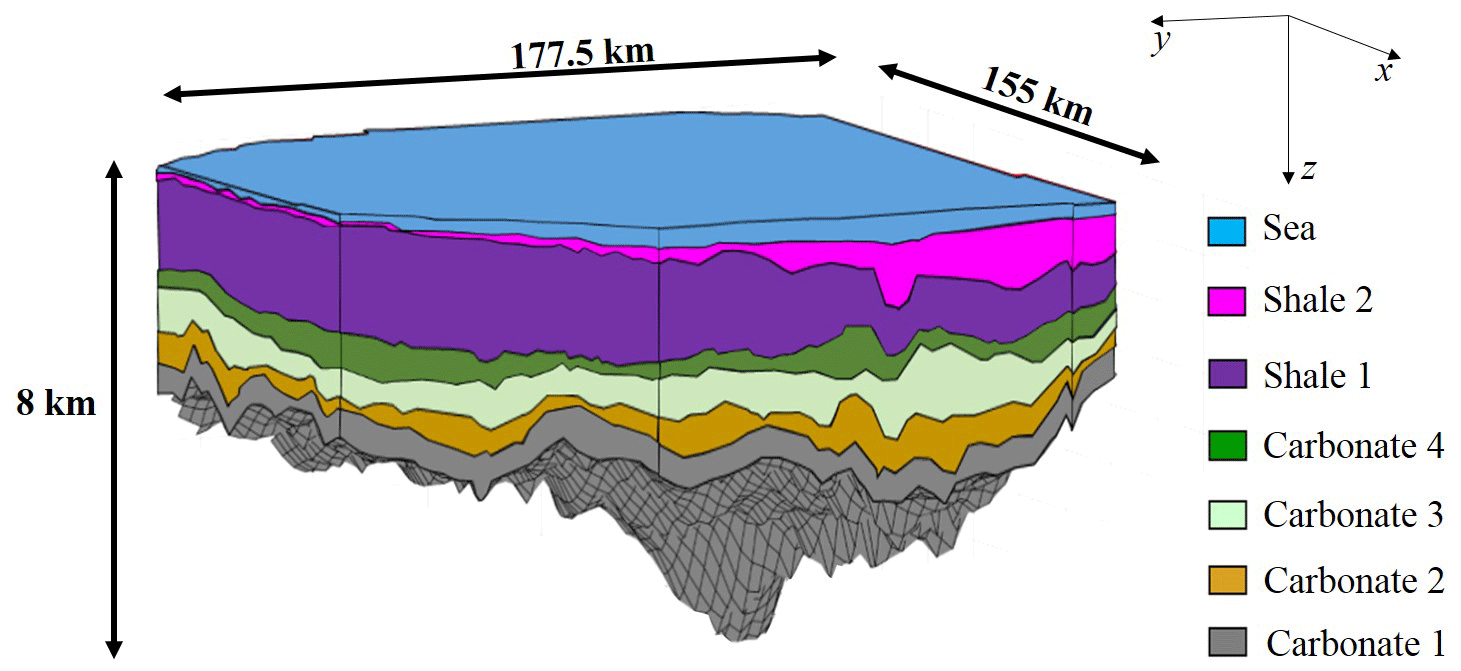
Figure 2Sketch of the three-dimensional sedimentary basin setting considered at the present time, i.e., t= 0 Ma.
The geo-history of the basin is reconstructed using the widely tested and documented burial model E-SIMBA™ (for details see, e.g., Grigo et al., 1993; Dalla Rosa et al., 2015; Zattin et al., 2016) which allows estimation of the three-dimensional dynamic evolution of stratigraphy as well as temperature, pressure and porosity distributions. These variables are here taken as input data.
Figure 3 depicts the spatial distribution of temperature (T [∘C] in panel a) and pressure (P [bar] – in panel b) along two perpendicular vertical cross sections located at x=32 km and y= 105 km, respectively (see the reference system indicated in Figs. 2–3). Note that the z axis points downwards; i.e., the value of z increases with depth. Each cell of the spatial mesh used to describe the evolution of T, P and porosity has a uniform size of 2500 m × 2500 m × 200 m (). Temperature and pressure display an overall increasing trend with depth which yields values of T and P close to those typically observed in real sedimentary basins (e.g., Colombo et al., 2017, 2018). The largest temperature and pressure values (corresponding to 330 ∘C and 800 bar, respectively) are observed at the deepest locations in the basin.
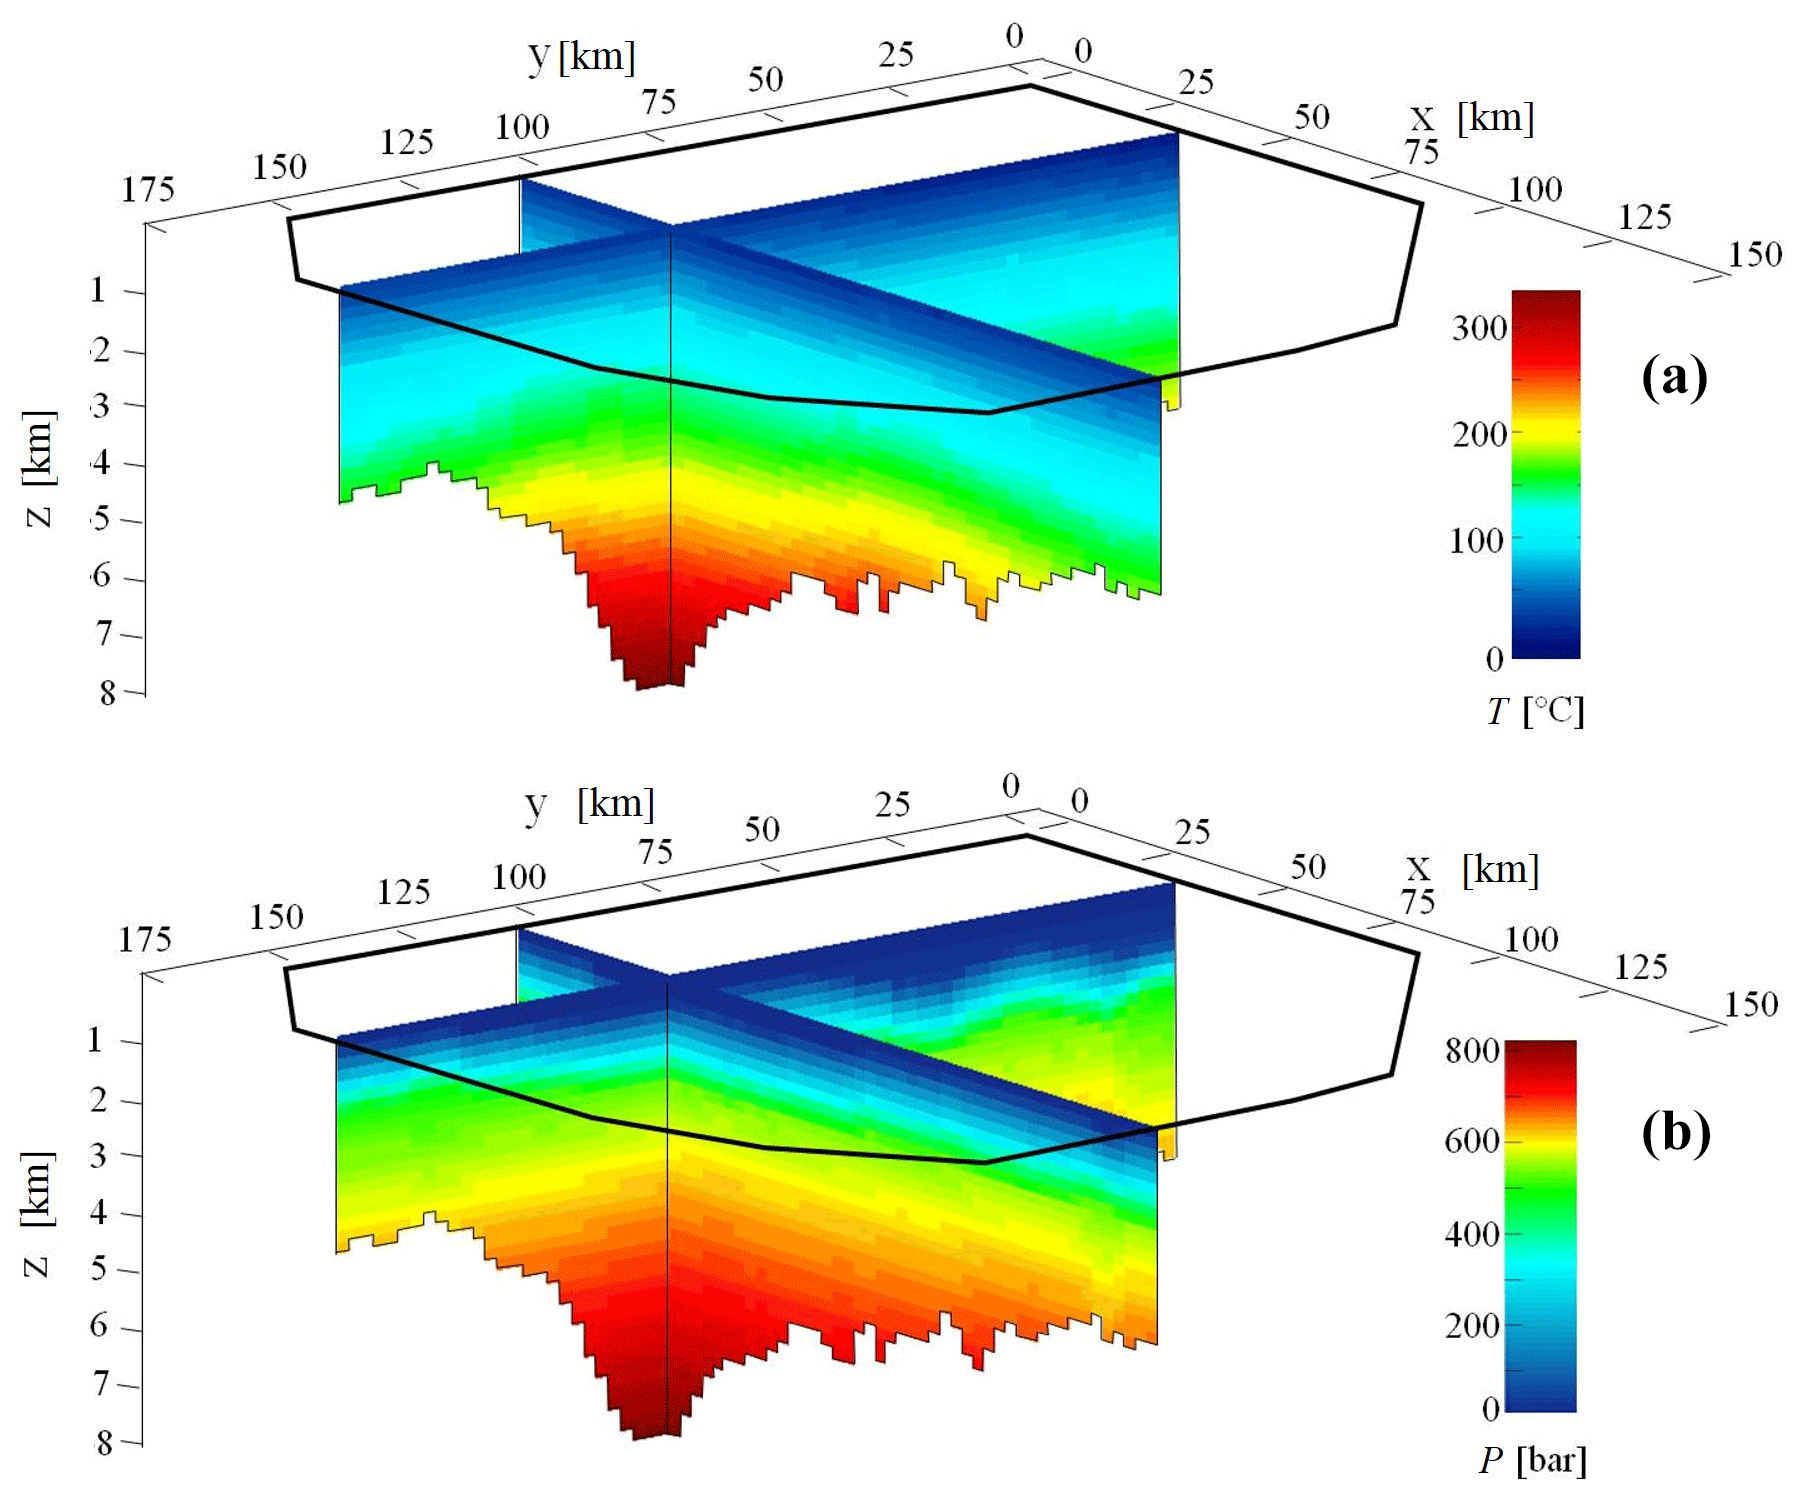
Figure 3Evolution of temperature (T, ∘C, panel a) and pressure (P, bar, panel b) simulated at the present time, i.e., t= 0 Ma, along two perpendicular planar sections at x= 32 km and y= 105 km.
Considering the reference geological setting described above, we investigate separately three differing CCR formulations which can be considered at the basis of CO2 generation. These include the classical reaction CCR1 (illustrated in Sect. 1 and recalled in the following) along with two alternative CCR models (labeled CCR2 and CCR3).
CCR2 and CCR3 are here proposed based on laboratory tests aimed at investigating the role of different types of clay in sedimentary environments (Panariti and Previde Massara, 2000). These formulations include mineral phases (such as beidellite, analcime and microcline) which can be considered a proxy of clays and feldspars that have been observed promoting the release of CO2 by dolomite in laboratory experiments. The ability of CCR2 and CCR3 to interpret field data is further discussed in Sect. 3.2.
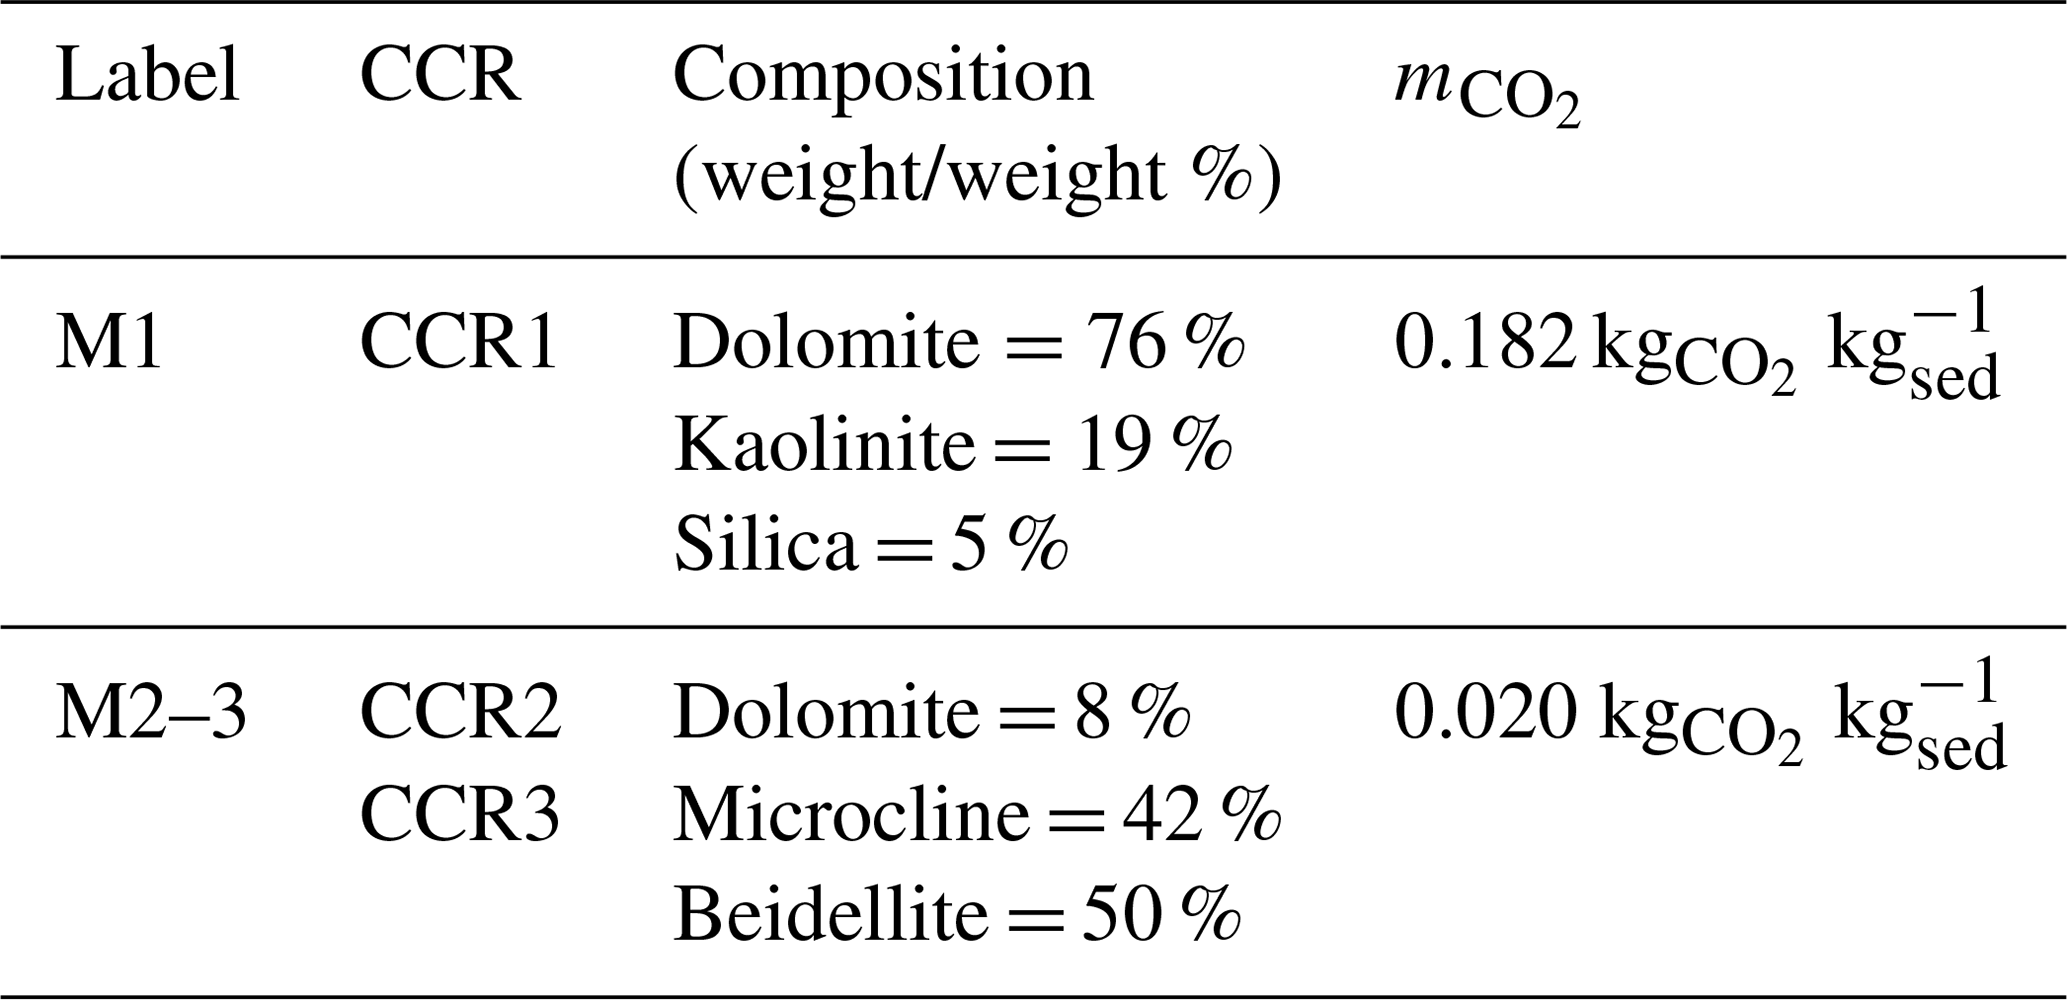
Depending on the CCR investigated, we consider a given mineralogical composition of sediments, as listed in Table 2. These mineralogies (termed M1 for CCR1 and M2–3 for CCR2 and CCR3) are selected to maximize the mass of CO2 that can potentially be generated by a unit mass of sediment ( – kg kg) when a prescribed CCR mechanism is activated. Details on the computation of are reported in the Supplement of Ceriotti et al. (2017). For simplicity, we assume here that the four carbonate rocks forming the sedimentary basin described in Fig. 2 are characterized by the same uniformly distributed mineralogical composition, i.e., M1 or M2–3 when modeling CO2 generation by CCR1 or CCR2 and CCR3, respectively. Otherwise, the shale rocks are assumed to be characterized by a negligible carbonate content, which is in turn incompatible with the occurrence of CCR (i.e., we assume that associated with shale layers is zero).
Table 2Composition of the mineralogical scenarios used for the investigation of the three CCRs considered. The mass of CO2 released by a unit mass of sediment ( – kg, kg) when the gaseous CO2 generation is activated is also listed for each setting.
Our study relies on a given model structure, thus neglecting uncertainty in the latter. We rest on the equilibrium-based approach employed by Ceriotti et al. (2017). Thus, we consider pure mineral phases while neglecting other factors which would eventually influence the model structure (e.g., the occurrence of other mineral transformations or effects associated with salinity of brine). Consistent with this model structure, we consider the equilibrium constant of speciation reactions as the key source of parametric uncertainty. We note that this choice is motivated by the observation that temperature and pressure values observed in sedimentary systems lie outside the range of conditions where thermodynamic equilibrium constants are usually characterized (Blanc et al., 2012). In addition to parametric uncertainty, we also consider input uncertainty, defined as the uncertainty related to the description of the system (Walker et al., 2003); i.e., we assume that diverse CCRs may take place depending on the mineralogical assemblage. These two sources of uncertainty are propagated to the quantities of interest, i.e., the CO2 source location, the CO2 generation rate, and the temperature and pressure of CCR activation. Note that, as detailed in Sect. 2, we consider a uniform mineral composition across the domain, a setting corresponding to an upper limit condition for each of the considered CCRs. While it would be interesting in principle to investigate the impact of a spatially heterogeneous mineralogic composition, doing so would require having access to a suitable dataset and would increase complexity. Yet it is worth emphasizing that the proposed methodological framework and modeling approach are fully compatible with the presence of a spatially variable mineralogical composition, which can be accommodated in the presence of appropriate data to characterize it. As such, our approach can also be employed to assess the impact of uncertainties associated with spatially heterogeneous arrangements of mineral and sediment composition on CCR-based CO2 generation. The latter could be tackled by relying on appropriate techniques, such as, e.g., functional compositional kriging (see, e.g., Menafoglio et al., 2016, and references therein). Analyzing this aspect is, however, beyond the scope of the present study.
3.1 Speciation reactions and uncertainty characterization
Given a generic mineral, aqueous or gaseous phase (Ph), it is always possible to describe the speciation in water of mineral phase Ph upon relying on a set of aqueous basis species (Anderson, 2005). A speciation reaction can then be characterized by an equilibrium constant (KS,Ph), whose value depends on the system temperature and pressure. Following Ceriotti et al. (2017), we assume that the equilibrium constant driving speciation of Ph can be expressed as
where T (K) is temperature and the symbol denotes (uncertain) random variables (to distinguish these from deterministic quantities). Note that this formulation holds for a given pressure of P=1 bar. The format of Eq. (1) resembles the one characterizing the expression of a temperature-dependent equilibrium constant derived from the Maier–Kelley heat capacity assumption (Maier and Kelley, 1932) which is typically used in thermodynamic databases (Parkhurst and Appelo, 2013; Blanc et al., 2012; Delany and Lundeen, 1990). The key difference between Eq. (1) and the classical expression for the (temperature-dependent) equilibrium constant is that the two parameters and are not considered deterministic effective parameters and are here interpreted as bivariate Gaussian random variables. We follow the approach of Ceriotti et al. (2017) to define the mean values (μA and μD for and , respectively) and the entries of the covariance matrix Ψ characterizing the bivariate Gaussian distribution of and . Characterization of the mean and covariance of bivariate Gaussian variables is grounded on data taken from Blanc et al. (2013, 2012). Given the structure of Eq. (1), it then follows that, for a given temperature value log is described by a normal distribution with parameters related to the statistical moments of and . Details about the characterization of and for all mineral, liquid, and gaseous phases appearing in this study are reported in the Supplement. Uncertainties associated with the characterization of and can be propagated to the Ph speciation equilibrium constant through Eq. (1). It then follows that is not a deterministic quantity but rather an uncertain variable described by a probability density function (pdf).
3.2 CO2 partial pressure computation
We introduce here a generalized CCR formulation in the form of
where the symbol Phi indicates the ith mineral phase (with ) appearing in the CCR, the term αi representing the stoichiometric coefficient of the mineral phase i; I and J quantify the number of CCR reactants and products, respectively, with the exception of CO2, which is explicitly accounted for on the right-hand side of the CCR with its stoichiometric coefficient, α0. Each of the mineral and gaseous phases involved in the CCR is associated with a speciation reaction and an uncertain speciation equilibrium constant, as described in Sect. 3.1. Note that the proposed generic CCR formulation can be readily recast into CCR1, CCR2, or CCR3.
We can express the equilibrium constant of the CCR () as (Anderson, 2005)
The quantities and correspond to the speciation equilibrium constants associated with CO2 and the ith mineral phase contributing to the CCR, respectively. The uncertain variables and are evaluated through Eq. (1) as a function of temperature. The value of resulting from Eq. (2) is then temperature-dependent and affected by uncertainty. The effect of pressure on is considered through a correction term (Millero, 1982)
where is the CCR equilibrium constant computed for a generic value of T and P; is the CCR equilibrium constant computed for a generic value of T and pressure P=1 bar as resulting from Eq. (2); ΔV∘ (m3 mol−1) represents the change in the molar volume associated with the CCR, and Rg is the ideal gas constant.
The partial pressure of CO2 () associated with the CCR can then be evaluated as (Coudrain-Ribstein et al., 1998; Cathles and Schoell, 2007; Ceriotti et al., 2017)
Equation (4) rests on the assumption that the CO2 fugacity coefficient is set to unity (Hutcheon et al., 1990b; Chiodini et al., 2007; Ceriotti et al., 2017). Equations (2)–(4) allow computation of the partial pressure of CO2 as a function of basin temperature and pressure, yielding a three-dimensional distribution of as a function of basin stratigraphy and burial history. To provide a preliminary assessment, Fig. 4 reports the mean values of log associated with CCR1, CCR2 and CCR3 as a function of temperature, assuming that P (bar) = 6 × (T (∘C) −22) (Smith and Ehrenberg, 1989). The log trends are compared against values of sampled in different sedimentary basins obtained from the literature (Coudrain-Ribstein et al., 1998). We note that, on the one hand, the mean log trend associated with CCR1 provides a good interpretation of data observed at temperatures higher than 100 ∘C (specifically for Norway, Texas and Thailand basins). On the other hand, the log mean trend resulting from CCR2 and CCR3 formulations appears to explain data observed at lower temperatures, ranging between 50 and 100 ∘C (Norway, Paris Basin and Arkansas). This is consistent with the considerations already provided by Coudrain-Ribstein et al. (1998), who suggest that CCR formulations accounting for complex clay phases (such as illite) can feasibly interpret low-temperature trends. We can conclude that the three formulations considered in this work are compatible with data observed in real sedimentary environments.
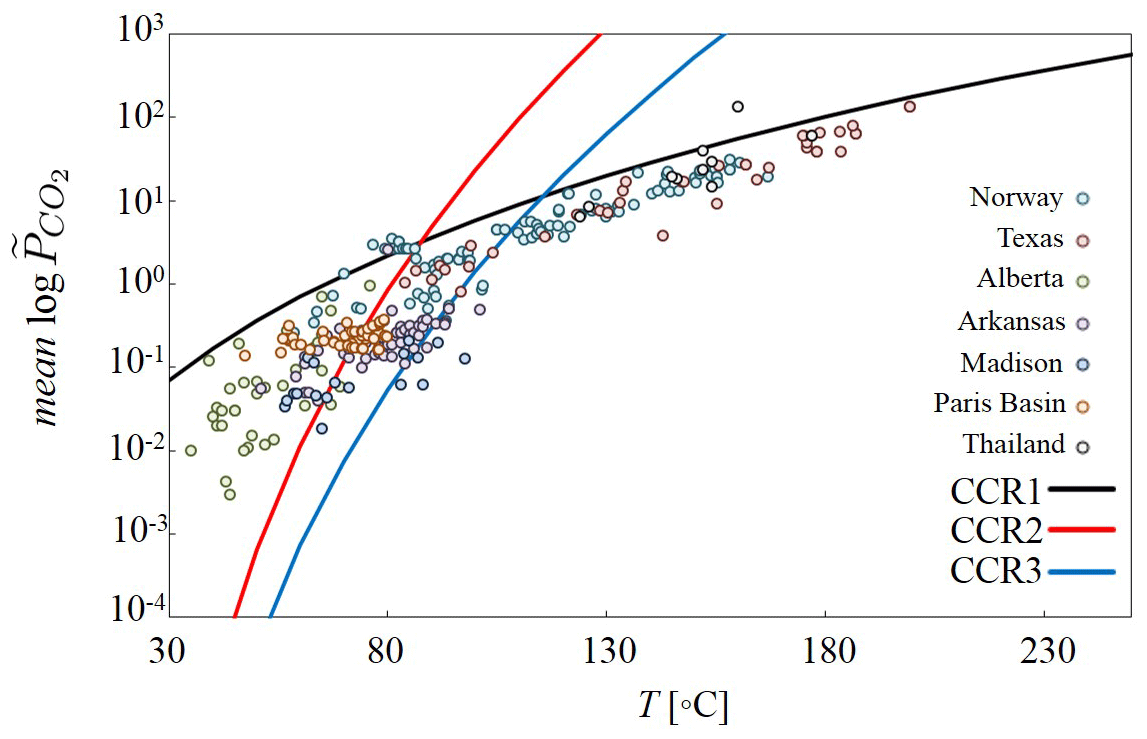
Figure 4Evolution of the mean log trend as a function of temperature computed for CCR1, CCR2 and CCR3 assuming that P and T are described by P (bar) = 6× (T (∘C) −22) suggested by (suggested by Smith and Ehrenberg, 1989). As a term of comparison, is measured in various sedimentary basins labeled Norway, Texas, Alberta, Arkansas, Madison, Paris Basin, and Thailand (reported in Coudrain-Ribstein et al., 1998).
3.3 CO2 source location
According to the conceptual model of Cathles and Schoell (2007), the CCR mechanism activates when the sum of the partial pressures of all gaseous species is higher than the porewater pressure (see Sect. 1). Here, we assume that only CO2 and aqueous vapor partial pressure might contribute to the formation of a CO2-rich separate gas phase, while the effect of other gas species (e.g., hydrocarbon gases) is neglected.
For a selected observation time () and location (identified by the coordinates and ) on the planar surface of the sedimentary basin, we define the quantity as
Here, the symbol Pv denotes the aqueous vapor partial pressure, which we evaluate according to the procedure described by Ceriotti et al. (2017). The variable is affected by uncertainty because it depends on the random variable and on elevation z and can undertake values equal to or larger than unity when a location is compatible with the activation of a CCR mechanism. The CO2 source () is then evaluated as the position corresponding to the shallowest vertical coordinate z where . Application of this procedure for all combinations of x and y coordinates enables us to delineate a CCR activation surface in the three-dimensional basin as the collection of points with coordinates (x, y, z) with , i.e., where the CCR mechanism is activated.
3.4 CO2 generation rate
We provide an estimate of the rate of CO2 generated by the CCR mechanism activation per unit area of the CCR activation surface ( – kg Ma−1 m−1) as
where (kg kgsed) is the mass of CO2 released by a unit mass of sediment upon activation of CCR, which depends on the CCR formulation and mineral composition (see Sect. 2); ϕ (–) and ρ (kgsed m) are the sediment porosity and density, respectively, and vb (m Ma−1) is the burial velocity of sediments, a quantity governing the rate at which the sediments reach the location of the source. The CO2 generation rate in Eq. (6) rests on the hypothesis that the water–rock system located at a certain depth attains equilibrium before being buried to a deeper level. As opposed to porosity, the density of a given sediment type can be taken as a constant, its value being listed in Table 1 for each type of rock. The quantity depends indirectly on the activation depth since both ϕ and vb are a function of z, their value in Eq. (6) being related to the depth of the CO2 source. Outputs of the burial model employed in this study (i.e., E-SIMBA™; see Sect. 2) do not include the space–time evolution of vb across the basin. Results from a series of preliminary investigations (not shown here) performed with a one-dimensional burial model (STREAM; see, e.g., Formaggia et al., 2013) at various planar locations of the three-dimensional basin investigated suggest that the burial velocity of sediments does not significantly vary along depth for z>2 km, where the CCR activation is more likely to occur. The value of vb in these regions is approximately equal to 40 m Ma−1. We take this as a representative value for vb in Eq. (6) in our analyses, thus disregarding the vertical variation of burial velocity.
We tackle probabilistic modeling of the CCRs introduced in Sect. 1 upon relying on a numerical Monte Carlo (MC) approach. Parameters and associated with each mineral phase Phi appearing in a given CCR are sampled N times (for a total of N=105 Monte Carlo replicates for each CCR mechanism) to yield N arrays
where Vn indicates the nth sampled array (with n= 1, …, N) and quantities Ai and Di represent the nth values sampled from the bivariate Gaussian distribution of and associated with the ith mineral phase (i.e., Phi) appearing in the generalized CCR formulation (see Sect. 3.2). The modeling approach detailed in Sect. 3 is applied for each sample Vn to yield N Monte Carlo realizations of the CCR mechanism occurrence as a function of space and time. The results presented and discussed in this section are all associated with t=0 Ma, i.e., the present time, corresponding to the setting when the basin structure reaches the largest depths and the highest temperature and pressure are observed (see Fig. 3, Sect. 2). Note that the modeling approach can be applied to any time level across the basin burial history.
4.1 Source location, activation temperature and pressure
By relying on the N MC realizations of our model, we compute the frequency at which the activation of the CCR mechanism is observed at each location in the sedimentary space (, i.e., the number of times of activation of a CCR at a given spatial location (x, y, z)). We start by focusing on the quantity
which quantifies the three-dimensional distribution of the relative frequency of the source location.
Figure 5 displays for CCR1 (A), CCR2 (B), and CCR3 (C) evaluated at t=0 Ma using Eq. (7) along the two cross sections of the basin depicted in Fig. 3. While the three CCRs analyzed yield similar qualitative patterns of , some key quantitative differences can be noted. The spatial region associated with non-zero probability to observe activation of the CCR mechanism (i.e., ) is broadest for CCR2. Moreover, Fig. 5 suggests that values of do not increase monotonically with depth and attain their largest values at different depths, depending on the considered CCR. These maximum values are located approximately at ≃ 7 km for CCR1, at depths ranging between 5 and 6 km for CCR2 and at ≃ 6.5 km for CCR3. The documented peak in and the ensuing decreasing trend observed for very large depths are consistent with the assumptions underlying our conceptual model, according to which the CO2 source is positioned in the shallowest point where a combination of temperature and pressure compatible with CO2 generation is first attained.
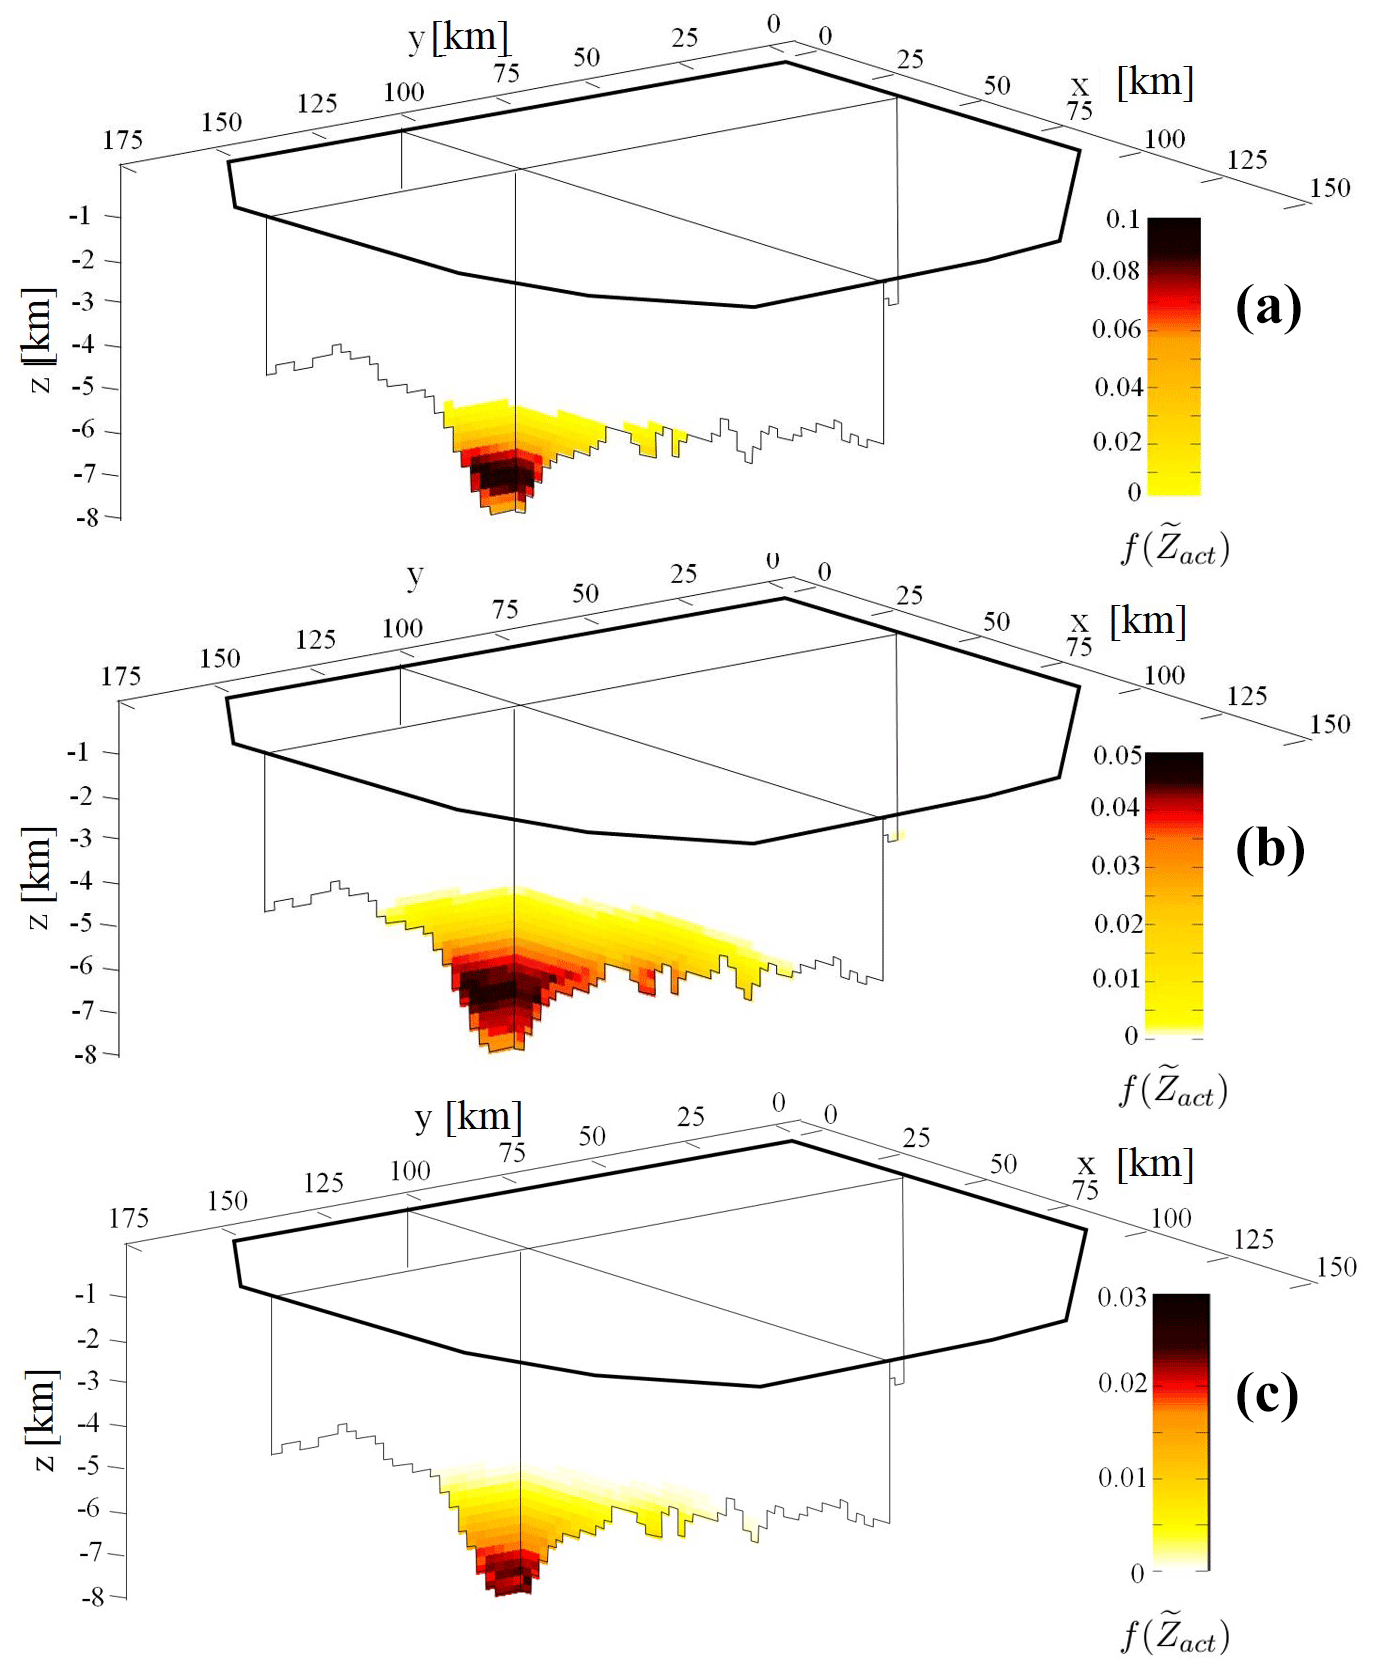
Figure 5Spatial distribution of computed at t= 0 Ma along two planar perpendicular sections of the basin case study located at x= 32 km and y= 105 km for CCR1 (a), CCR2 (b) and CCR3 (c).
Furthermore, our results show that the three CCRs examined yield markedly different ranges of values of , the largest observed value for CCR1 being 0.1 (i.e., the probability of activation of CCR1 at a given location can be as high as 10 %) while being considerably lower for CCR2 and CCR3 (corresponding to 5 % and 3 %, respectively). CO2 generation by CCR1 is associated with a high frequency in the thin layer of sediment located at ≃ 7 km depth. Otherwise, CCR2 and CCR3 display a smooth spatial distribution of , displaying a smaller maximum value of if compared with CCR1.
The differences observed in indicate that (i) the CO2 generation occurrence is sensitive to the selected buffering CCR mechanism and that (ii) relevant shifts in the source location, characteristic temperature and pressure of activation may be expected as a function of the CCR considered. This element is further explored through the analysis of the pdfs of and and their comparison against the pdf of . The latter is evaluated as
The pdfs of temperature () and pressure of activation () of the CCR mechanism are evaluated from the three-dimensional distribution of and the temperature and pressure computed in the burial basin model.
Figure 6 depicts the sample pdfs obtained for CCR1, CCR2, and CCR3. While these pdfs are characterized by a seemingly similar shape, each of them embeds the signature of the corresponding CCR mechanism, as seen in terms of spread, mean, and mode (see also Table 3). For example, the mean and mode of the activation temperature are lowest for CCR2, the highest values being associated with CCR1. This can be explained upon observing that the mean of log is more sensitive to temperature than log and log (see Fig. 4). This implies that, on average, CCR2 is activated at lower temperatures than CCR1 and CCR3. For the three considered CCRs, the mean temperature of activation is comprised between 246 and 287 ∘C, values which are significantly lower than the threshold of 330 ∘C reported by Cathles and Schoell (2007). The standard deviation (σ) of the distribution of depends on the CCR mechanism considered (Table 3). The combination of higher spread and lower mean characterizing the sample pdf of for CCR2 yields non-zero probability values even for quite low values of temperature (i.e., 159 ∘C; see Table 3) as compared to the results of the preliminary assessments of Cathles and Schoell (2007).
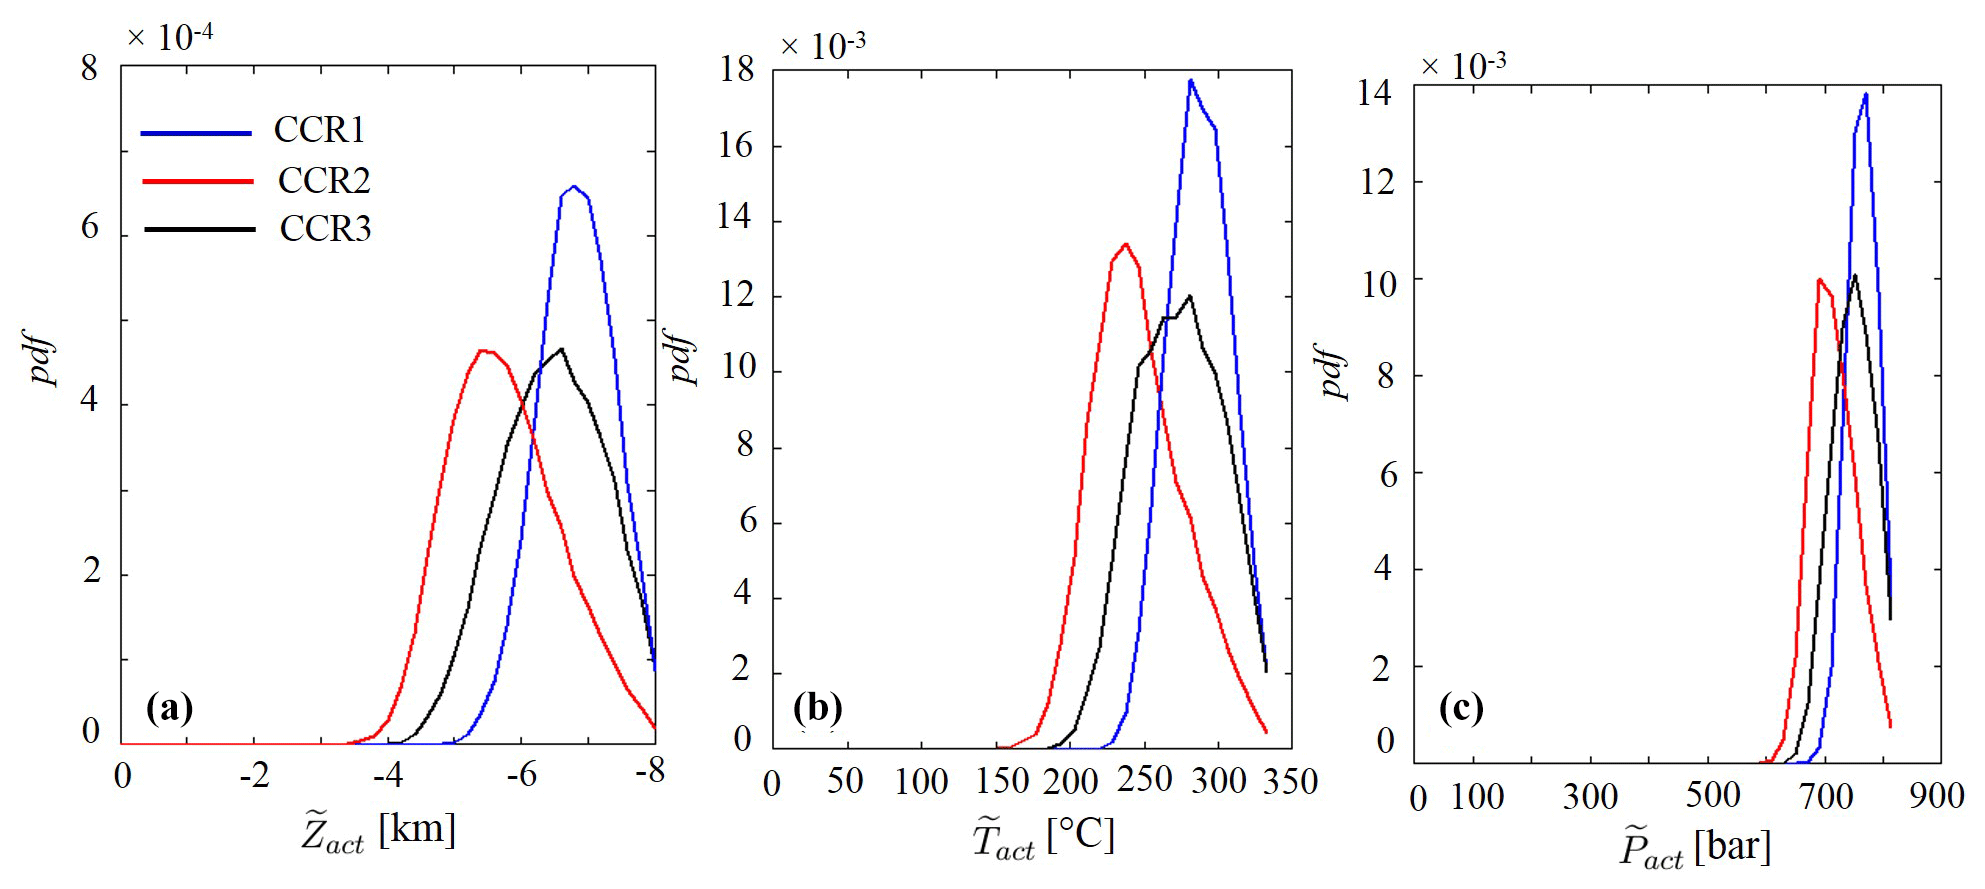
Figure 6Probability density functions (pdfs) of (a), (b) and (c) evaluated for CCR1 (solid blue line), CCR2 (solid red line) and CCR3 (solid black line) at t= 0 Ma.
Similar observations can be made from the sample pdf of depicted in Fig. 6b. While pressure is known to have a limited impact on equilibrium constants of reactions, our results reveal its major role in the activation of the CCR mechanism. This is related to the observation that pore water pressure sets the threshold that is required to be exceeded so that a separate gas phase can be found in the system. As such, the key statistics of depend on the CCR mechanism investigated (Table 3).
Figure 6 depicts the sample pdf of for the three CCR mechanisms analyzed. The behavior of these results mirrors the one displayed by the distributions of in Fig. 6a. According to our probabilistic modeling framework, the distribution of and the associated main statistics (Table 3) suggest that CCR2 is the activation mechanism which tends to take place at the shallowest depths. Indeed, while the mode and the mean of are larger than 6.60 km for CCR1 and CCR3, the source depth with the highest probability is found at about 5.78 km for CCR2. A similar behavior is shown for the mean of . The higher spread associated with the population of sampled values for CCR2 is mirrored by the behavior of . As a consequence, the shallowest depth where CO2 generation might take place under the action of CCR2 corresponds to 3.2 km from the sea level, which is about 1.4 km smaller than that observed for CCR1. Note that the distributions of and collected in Fig. 6 provide a first quantitative assessment of the temperature and pressure of activation of CO2 generation characterizing CCR1, CCR2, and CCR3. Thus, results of this kind can be used to perform preliminary probabilistic evaluations of CCR activation as a CO2 source.
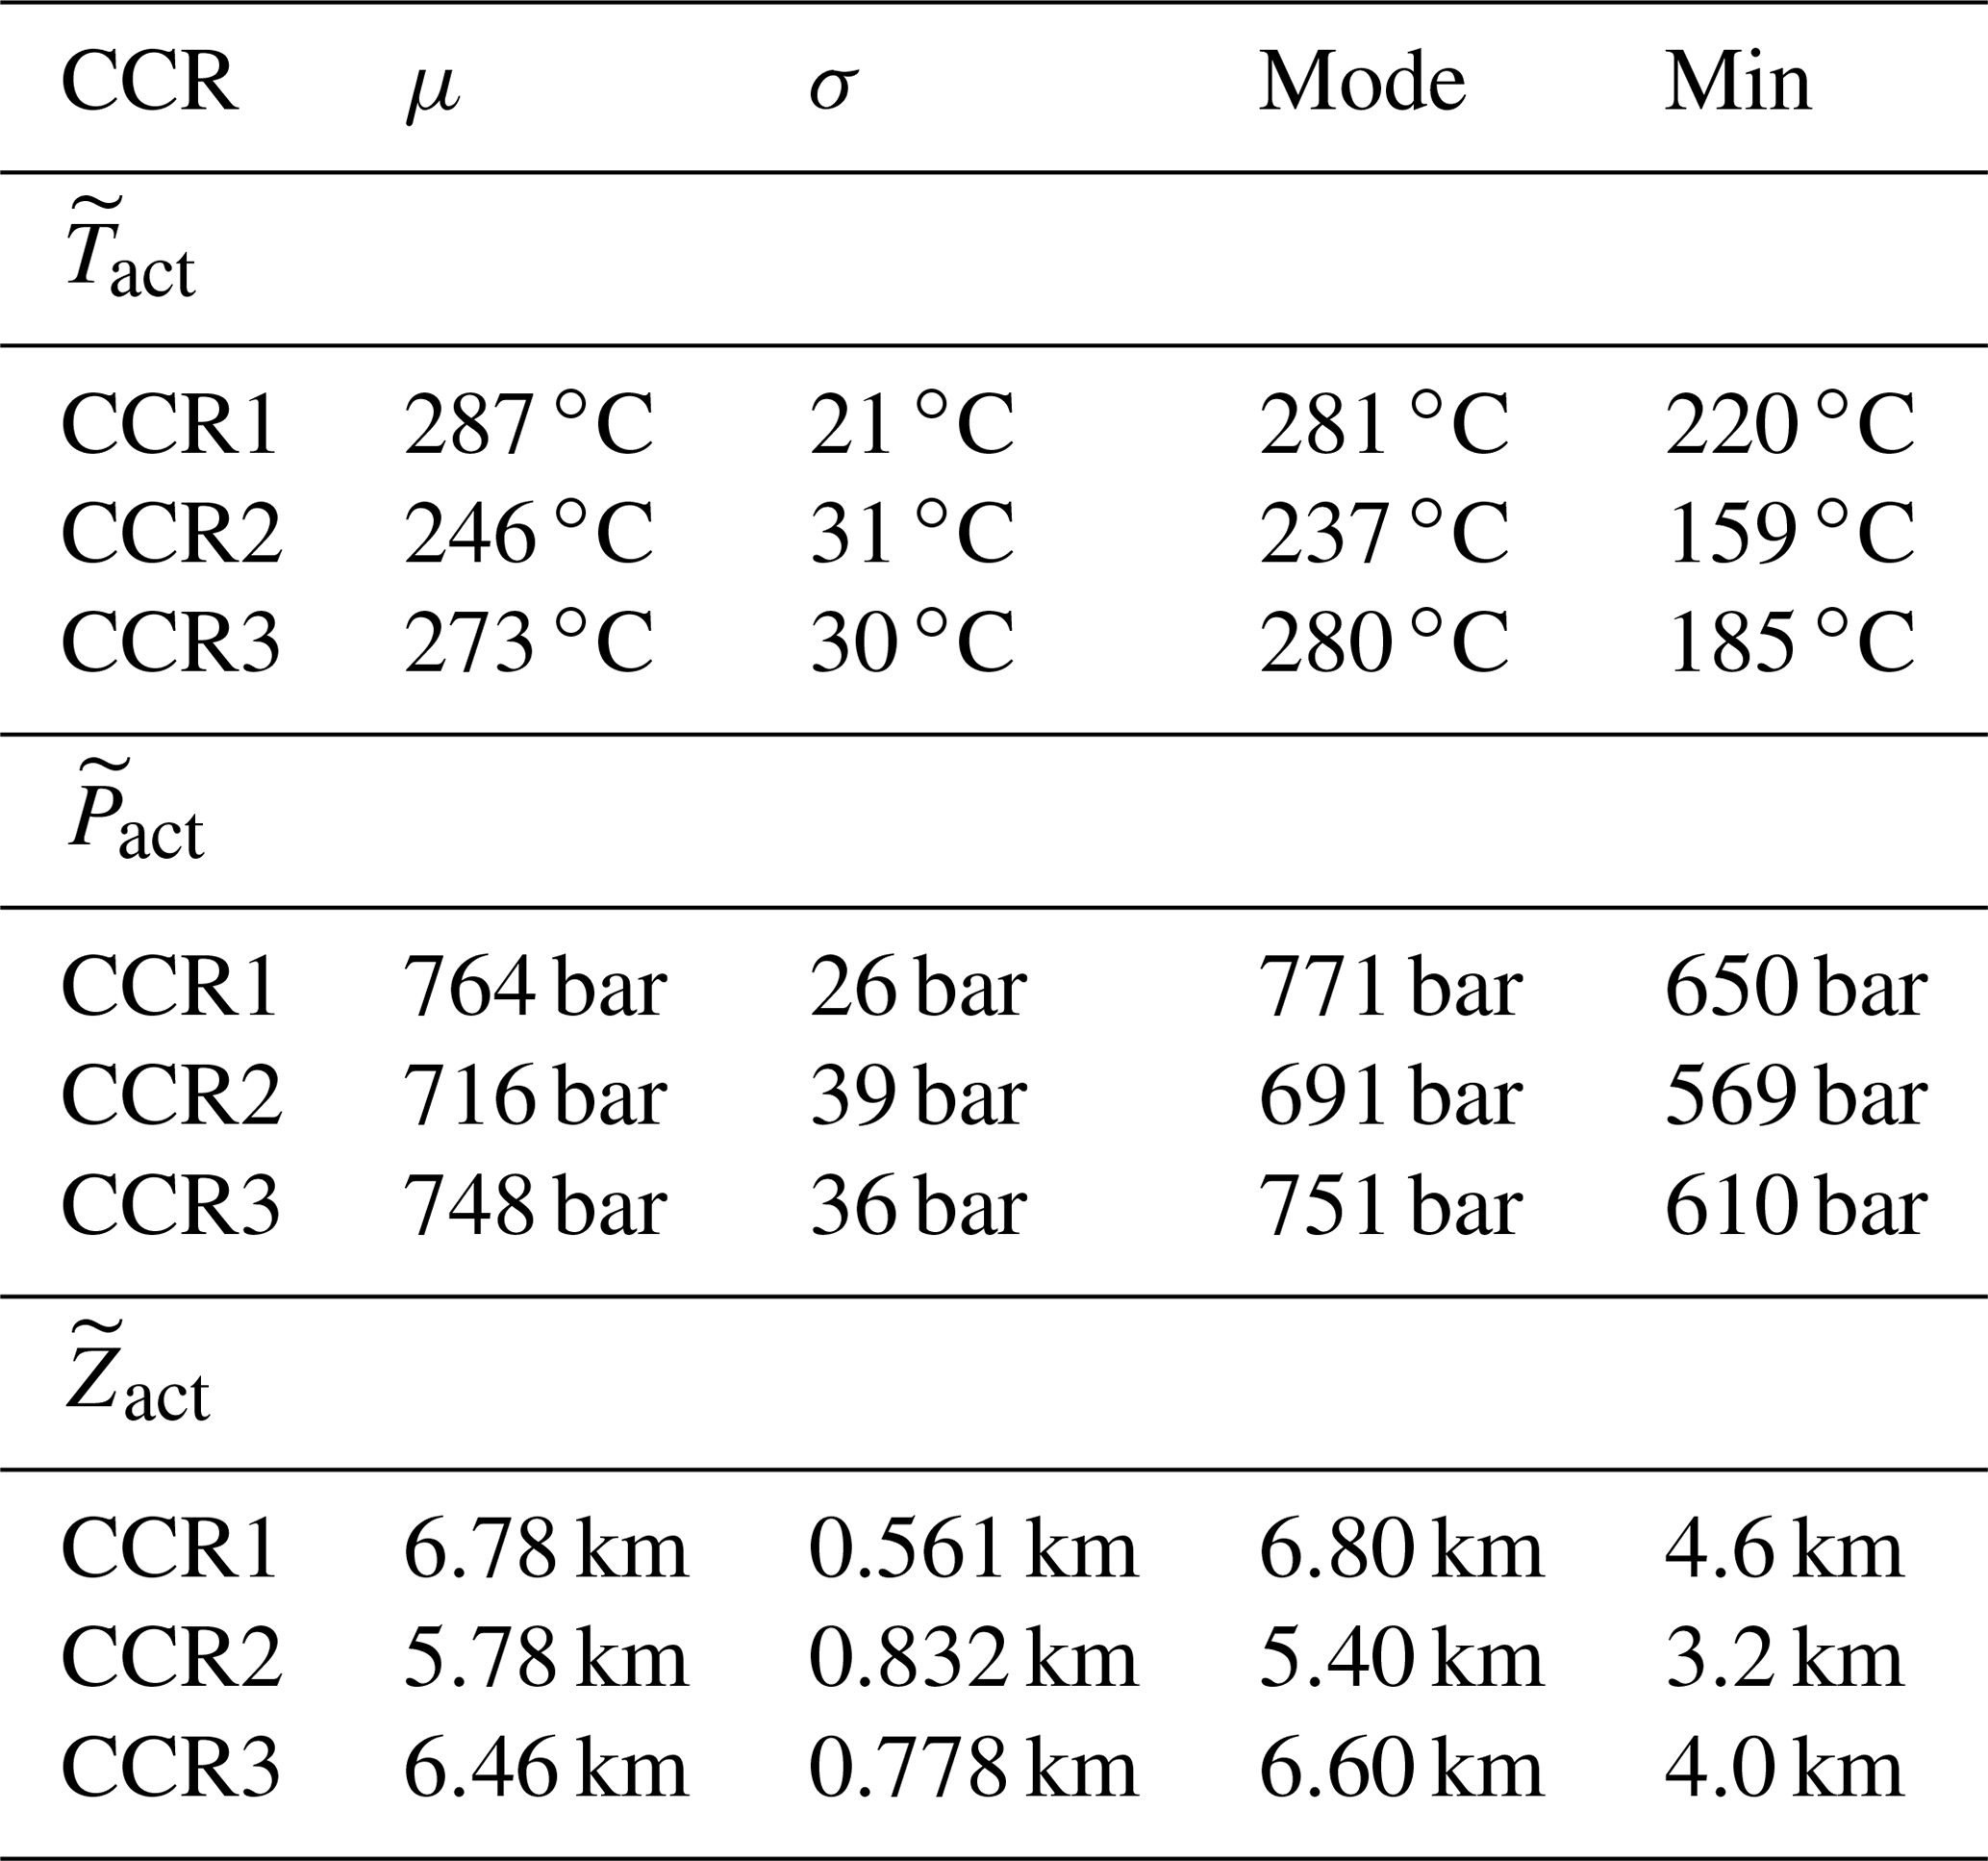
Table 3Mean (μ), standard deviation (σ), mode and minimum value associated with the sample pdfs of , and . Statistics are computed for CCR1, CCR2 and CCR3. The maximum values of , and are not listed as they correspond to the maximum temperature, pressure and depth observed in the selected setting, independent of the target CCR mechanism.
The extent of the impact of the CCR formulations considered on the occurrence of CO2 generation can also be assessed by analyzing the relative frequency of activation associated with each point of the basin planar surface (fA (x, y)). The latter is depicted in Fig. 7a and has been estimated as
where ZT is the maximum depth attained for each pair of coordinates (x, y) in the basin at t= 0 Ma. Figure 7b, c, and d depict the spatial distribution of fA(x, y) for CCR1, CCR2, and CCR3, respectively. These results indicate that the frequency of activation of the CCR mechanism is spatially heterogeneous. Its distribution shows a pattern that is closely dependent on the maximum depth attained by the sediments (see Fig. 7), being linked to the burial history of the considered basin. For all CCRs explored, the highest relative frequency of activation is observed at a location x and y where the basin stratigraphy is thickest (i.e., ≃ 8 km in our setting). This is consistent with the observation that sediments reaching deeper locations experience higher temperatures, thus leading to an overall increase in the probability that activation of CCR will be observed for a given location (x, y). We note that both CCR1 and CCR2 are characterized by a maximum value of fA(x, y) equal to 0.7; i.e., there is a planar location in the system where activation of these CCRs takes place in 70 % of the N MC realizations. On the other hand, the largest values of fA(x, y) for CCR3 attain values that are about 0.3, i.e., significantly smaller than those recorded for CCR1. This result is consistent with the observation that CC3 is less likely to activate than CCR1 at large depths, as suggested by the spatial distributions of reported in Fig. 5a and c.
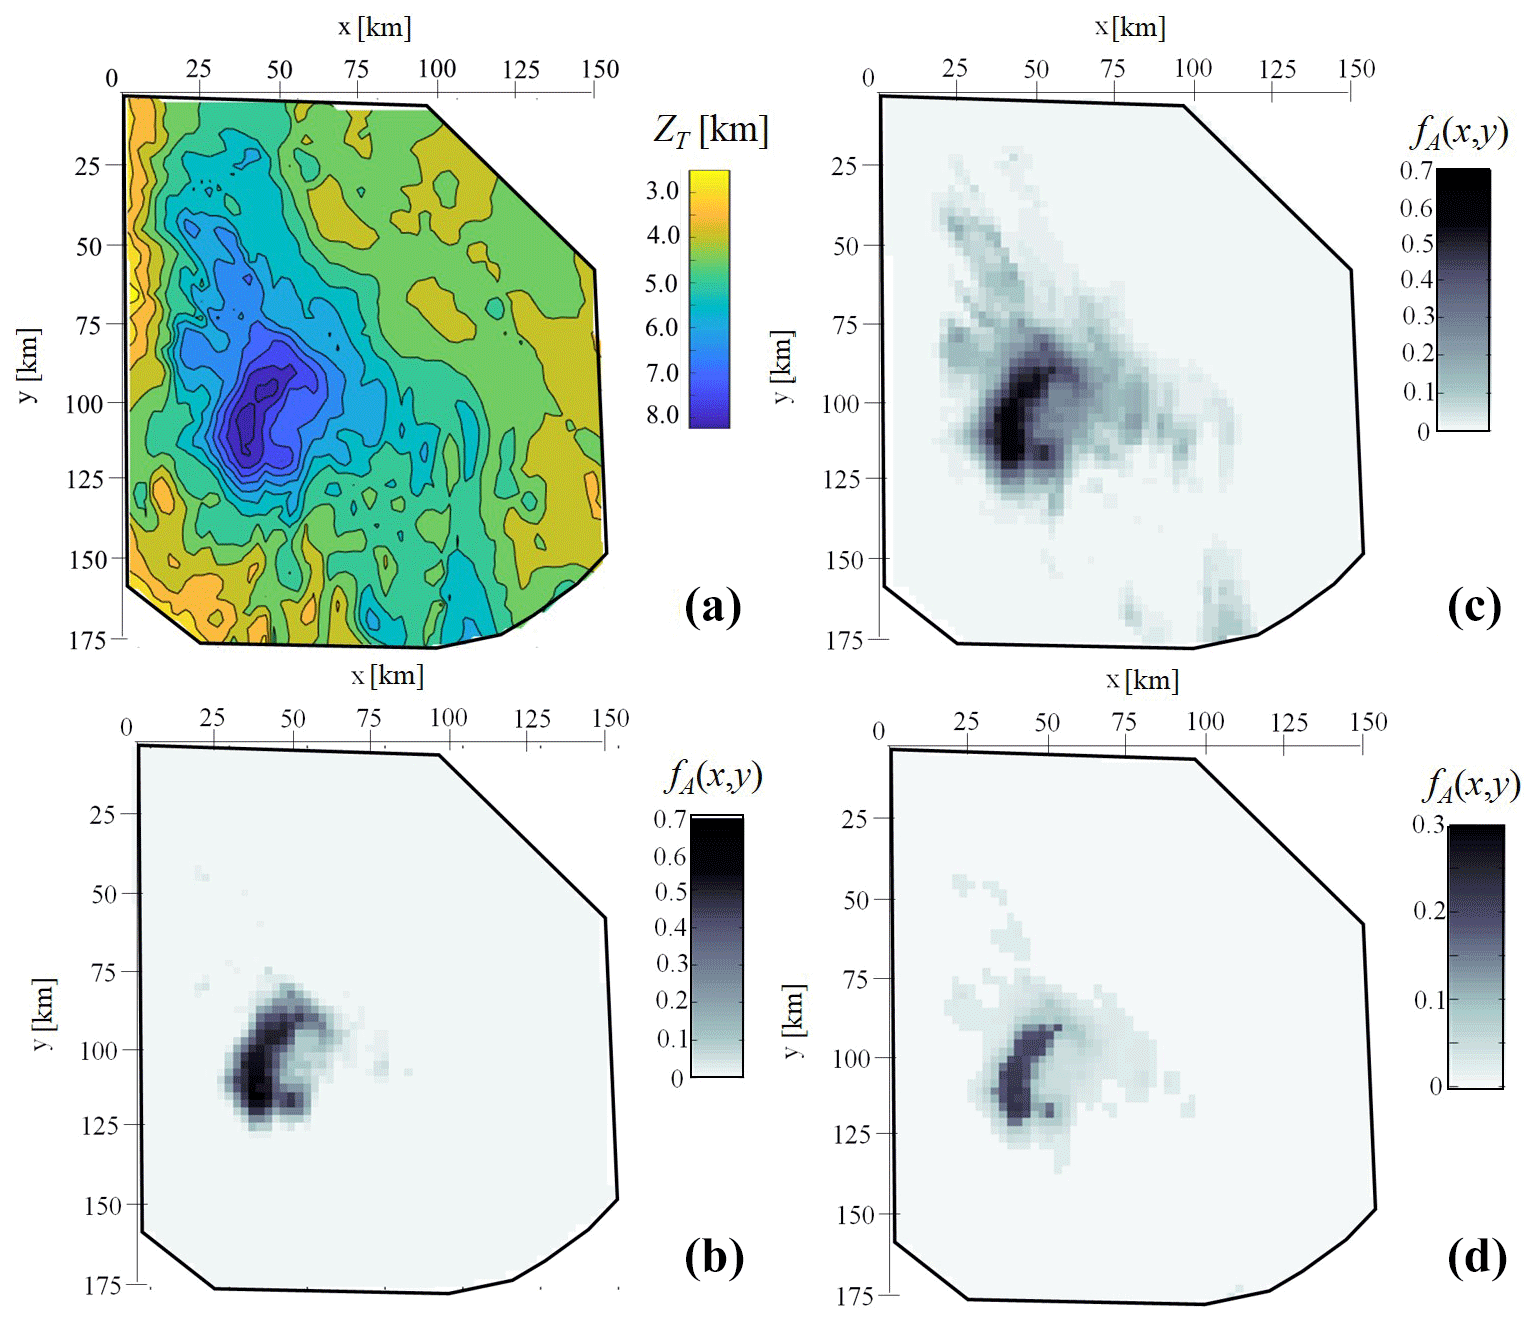
Figure 7Maximum depth attained at each point of the basin ZT (a) and spatial distribution of fA(x,y), i.e., the total frequency of CCR activation for each combination of x and y coordinates for the corresponding column of sediments, throughout the planar surface of the basin domain at t= 0 Ma associated with CCR1 (b), CCR2 (c), and CCR3 (d).
Our probabilistic workflow documents that the characteristic temperature and pressure associated with the activation of the CCR mechanism are driven by (a) the considered CCR formulation and (b) the mineralogical assemblage constituting the buffering systems. Thus, the probability of CO2 generation taking place at some depth in a sedimentary basin is markedly dependent on the three-dimensional temperature and pressure distribution as well as the selected buffering system.
The probabilistic delineation of the source location may profoundly depend on the CCR mechanism employed in the modeling workflow. This result is of key relevance in light of a subsequent analysis involving modeling of transport, migration, and accumulation of the generated CO2. Shallow sources are typically associated with a reduced traveling path of gaseous CO2 and a decreased possibility of CO2 re-mineralization. Therefore, a location of the CO2 source at relatively shallow depths may increase the probability of observing large accumulation in reservoirs of interest for oil and gas exploration as well as the probability that CO2 migration may influence vertical flow processes capable of influencing shallow groundwater bodies.
4.2 Implications for a scenario-based CO2 migration modeling
When dealing with subsurface CO2 migration modeling, a key step is the design of the input scenario, i.e., the definition of a location of the CO2 source (i.e., activation surface in a three-dimensional setting) and the CO2 generation rate. Our probabilistic framework can assist the design of multiple scenarios. In practice, this can be obtained through the following steps:
-
the solution of Eqs. (1)–(4) for all N Monte Carlo samples yields the pdf characterizing at each spatial location of the three-dimensional sedimentary basin, such a pdf being conditional to the T and P values rendered by the burial model;
-
starting from the cumulative probability distribution of , we obtain scenarios of CO2 partial pressure (ppw(CO2)), each associated with a given percentile (pw);
-
a given scenario ppw(CO2) constitutes the input to the system of Eqs. (5)–(6) for the evaluation of the spatial distribution of Zact and associated with the percentile (or probability level) w.
For the considered time t = 0 Ma, we exemplify the types of scenarios which can be used as input for CO2 transport modeling by (a) selecting the 25th, 50th, 75th and 99th percentiles of the sample pdf of at each point in the sedimentary basin and (b) building corresponding three-dimensional scenarios of CO2 partial pressure distribution (ppw(CO2), with w=25, 50, 75, and 99) for each of the CCRs investigated in this study.
Figure 8 depicts the spatial location of the activation source associated with the 50th, 75th and 99th percentiles of the distributions stemming from CCR1 (a), CCR2 (b), and CCR3 (c). Note that, regardless of the selected CCR formulation, when considering the 25th percentile of the CO2 partial pressure pdfs (corresponding to the pp25(CO2) scenarios), none of the locations in the basin satisfies the criterion of CCR mechanism activation. Thus, an activation surface is not observed for pp25(CO2) scenarios. The same reasoning underpins the lack of activation surfaces associated with pp50(CO2) and pp75(CO2) for CCR3 in Fig. 8c.

Figure 8Three-dimensional illustration of activation surfaces yielded by pp50(CO2) (dark blue), pp75(CO2) (light blue) and pp99(CO2) (red) for CCR1 (a), CCR2 (b) and CCR3 (c).
Comparison of Fig. 8a and b indicates that the scenarios corresponding to the 50th and 75th percentiles yield activation surfaces with a similar extent and average depth for CCR1 and CCR2. Otherwise, the scenario associated with the 99th percentile displays markedly different features across the CCRs analyzed, the activation surface characterizing CCR2 being located at considerably shallower depths (and hence being more extended) than its counterparts in CCR1 or CCR3 (Fig. 8). This result derives from the differences between the CCRs observed for the probability densities of the activation mechanism at relatively low temperature, i.e., Tact < 250 ∘C, as discussed in Sect. 4.1 and illustrated in Fig. 6. Therefore, the extent and location of the activation surface may deeply change, depending on the selected CCR as well as its characteristic activation temperature. This aspect is further elucidated in the detailed depiction of Fig. 9, which juxtaposes the activation surfaces associated with pp99(CO2) for CCR1 and CCR2, the color scale quantifying the CO2 generation rate per unit square meter ( – kg CO2 m−2 Ma−1). While CCR2 yields an activation surface with a larger spatial extent, CCR1 is characterized by a higher specific CO2 generation rate. Values of the mean and standard deviation of observed for both activation surfaces displayed in Fig. 9 are listed in Table 4. These results show that is almost 1 order of magnitude larger for the CCR1 activation surface than for CCR2. This is consistent with the values of associated with CCR1 (0.182 kg kg) and for CCR2 (0.02 kg kg) (see Table 2). Because we assume here a constant burial velocity in Eq. (6), is the main quantity affecting , which varies mildly across the activation surface for both CCRs (see values of standard deviations in Table 4), a result which is in line with the modest spatial variability of porosity resulting from the burial model.
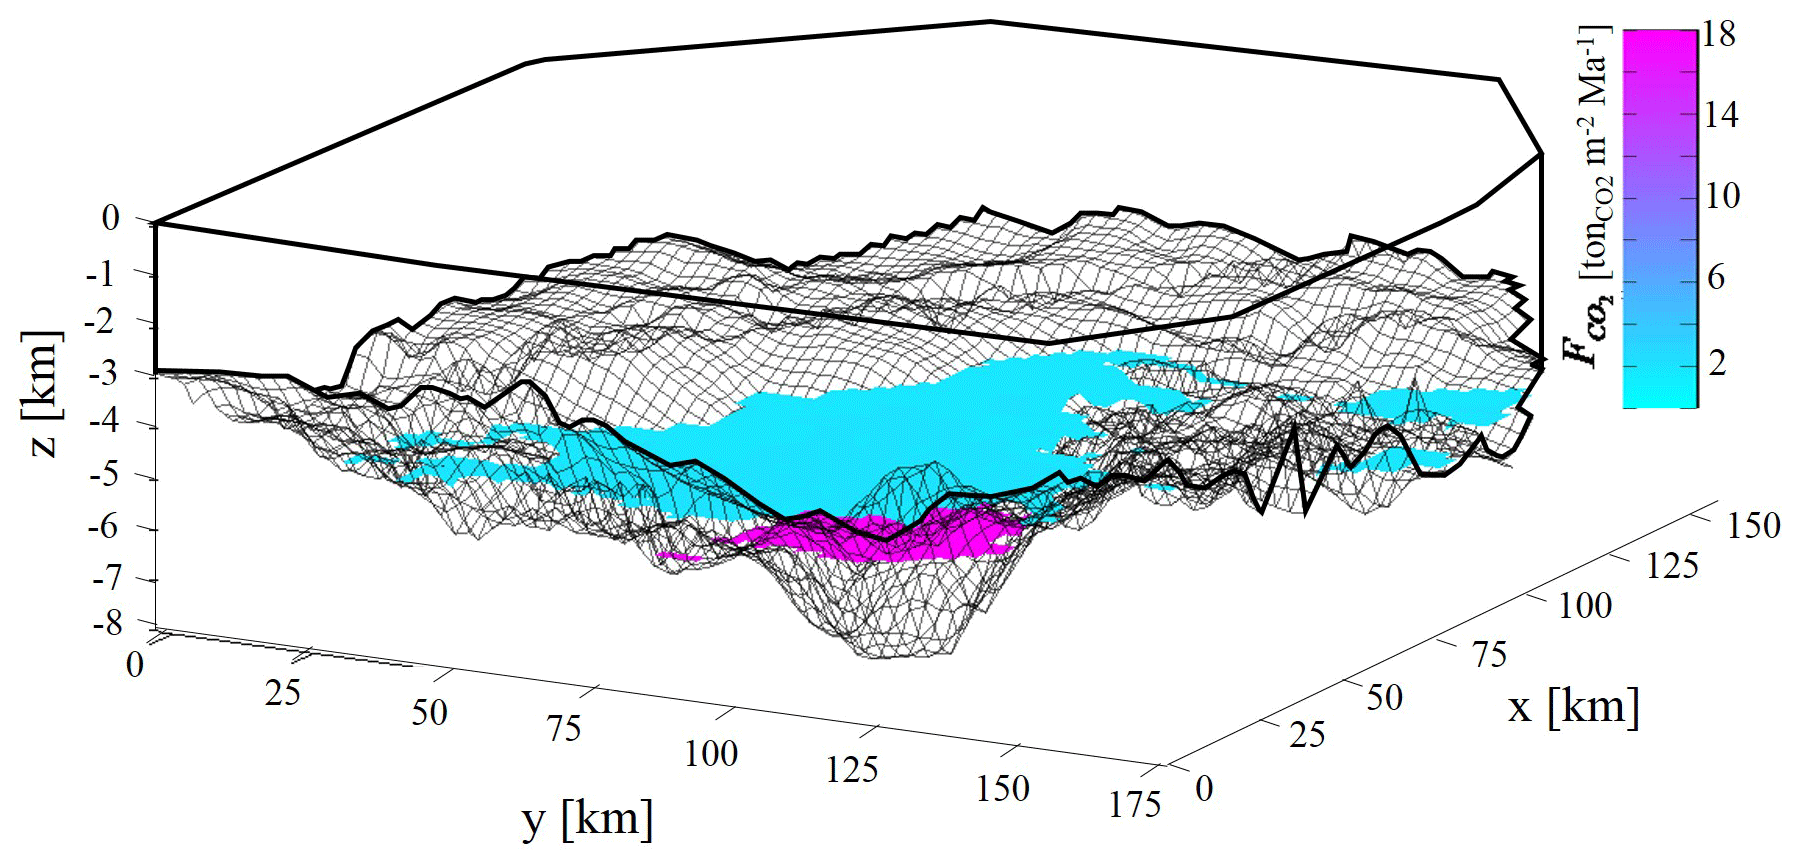
Figure 9Three-dimensional illustration of activation surface yielded by pp99(CO2) for CCR1 and CCR2 and the corresponding CO2 generation rate for each point of the activation surfaces (kg CO2 m−2 Ma−1).
The overall estimated CO2 rates of emission from the two surfaces depicted in Fig. 9 are equal to 3.42 × 10⁴ and 1.47 × 10⁴ kg yr−1 for CCR1 and CCR2, respectively. Even as the activation surface associated with CCR2 is characterized by a remarkably smaller specific rate of emission, the order of magnitude of the ensuing overall gas generation is similar to the one of CCR1. Moreover, the shape of the activation surface (in both Figs. 8–9) is significantly influenced by the basin structure, which may lead to discontinuities in the spatial structure of the CO2 sources. The basin structure and stratigraphy are then key factors driving the amount of CO2 potentially generated by CCR mechanisms. As such, while the methodological framework we present is general, the results are case-specific, and an appropriate quantification of the uncertainty associated with the geological setting is always required to constrain modeling results.
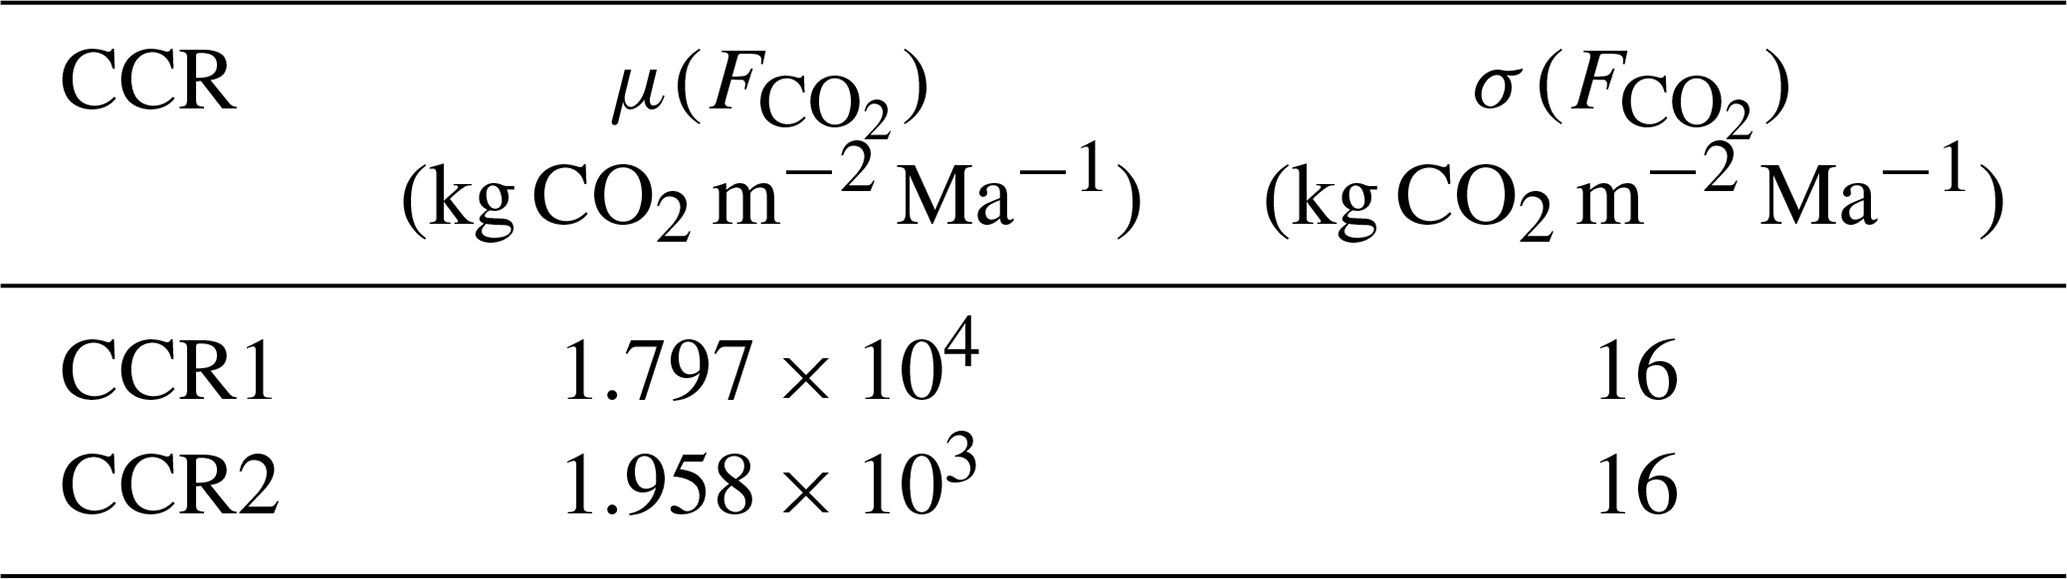
Table 4Mean(μ) and standard deviation (σ) computed for computed for activation surfaces depicted in Fig. 9.
We rely on a probabilistic modeling framework to model CO2 generation by considering the effect of a variety of carbonate–clay reactions in a realistic large-scale three-dimensional sedimentary setting. Our work is grounded on the probabilistic approach proposed by Ceriotti et al. (2017) to treat carbonate–clay reactions (CCRs). Such an approach embeds quantification of parametric uncertainty associated with the thermodynamic equilibrium constants driving CCR and has been showcased by these authors in a one-dimensional set-up. In summary, the methodological approach we propose and the ensuing results can contribute to enhancing our understanding of the strength of the controls of diverse geochemical mechanisms on CO2 dynamics in subsurface environments, with potential implications for several fields of practical interest, including, e.g., carbon capture and storage (CCS, Metz et al., 2005), large-scale groundwater flow modeling Kissinger et al. (2017) and enhanced oil recovery (EOR, Allis et al., 2001; Hutcheon and Abercrombie, 1990) practices.
Here, we consider a three-dimensional system with a diagenetic history feasibly encountered in a real geological setting. We analyze the impact of three different CCR formulations and mineral assemblage on (i) the probability of CCR activation as a function of temperature and pressure; (ii) the frequency of activation as a function of depth; and (iii) the shape and extent of the surface delimiting the three-dimensional CO2 source. Our study leads to the following major conclusions.
-
The temperature and pressure of activation depend on the CCR considered. Modifying the reference CCR can lead to a markedly different scenario in terms of depth of the source and extent of the activation surface. We rely on geochemical equilibrium and quantify uncertainty associated with model parameters and inputs, the latter source of uncertainty corresponding to the uncertainty in the information required to describe the reference system (i.e., input uncertainty; Walker et al., 2003). The presence of input uncertainties implies the possibility that diverse CCRs may occur and lead to differing degrees of importance of parametric uncertainty on CO2 generation. Our stochastic framework allows quantification of the (spatially and temporally dependent) probability distribution of the activation temperature and pressure associated with a given CCR. With reference to the depositional setting here analyzed, non-zero probabilities of CO2 generation are associated with temperature and pressure equal to 159 ∘C and 569 bar, respectively. These values are considered to be small if compared to those typically observed in sedimentary basins and support the potential of CCR mechanisms to act as a CO2 source in diagenetic environments. Notably, activation of CCR in our showcase scenario might be feasible even at a depth of 3.2 km, i.e., at a location compatible with the average depths of a typical gas extraction well (i.e., ≃ 2.5 km). This result is of particular interest because the occurrence of shallow CO2 sources reduces the CO2 migration path towards hydrocarbon reservoirs, thus increasing the probability that the CO2 generated by CCR might reach the shallow cap rock without being precipitated as newly formed carbonates, diluted or re-dissolved in water.
-
We quantify the way the considered input and parametric uncertainty propagates onto estimates of generated mass of CO2 in a three-dimensional system. This allows description of the extent and the shape of the CO2-generating source together with the associated CO2 generation rate. These are the two key elements contributing to the estimation of the amount of CO2 generated by a given CCR mechanism. Scenarios characterized by different surface-specific rates and source areas might lead to a similar overall amount of CO2 generated per unit of time. We document the benefits resulting from the implementation of a three-dimensional probabilistic quantification of the main features of CCR activation temperature and pressure and set the grounds for a quantitative stochastic appraisal of CO2 accumulation in subsurface systems.
-
We show that the shape of the CO2-generating source is closely dependent on the basin structure and stratigraphy. Thus, the overall amount of CO2 generated in a sedimentary basin requires a site-specific assessment, fully embedding uncertainty quantification. In this context, our modeling approach and probabilistic framework are readily transferable to other cases of interest to design site-specific studies.
Our methodology considers a single type of uncertainty source, i.e., the system thermodynamic parameters. As a future development, one can envision exploring the effects of multiple sources of uncertainty, including model and parametric uncertainties. Key points of interest include the study of (i) the impact of qualitatively and quantitatively different mineralogical compositions and heterogeneous spatial arrangement on CCR activation and CO2 generation rate, (ii) the joint occurrence of CCR and other processes, and (iii) the contribution to CCR characteristic activation temperature and pressure of uncertainties associated with parameters and factors embedded into the burial model (e.g., burial model boundary conditions, sediment thermal and mechanical properties).
Data can be accessed at https://data.mendeley.com/datasets/nmbzst46jm/draft?a=0c3d3bc7-4d9b-4a7d-911b-e5dcfdb31b86 (Ceriotti et al., 2021).
The supplement related to this article is available online at: https://doi.org/10.5194/hess-25-3539-2021-supplement.
GC performed numerical simulations, contributed to designing the research methodology, analyzed data, created figures, and wrote the first draft; CG contributed to designing the research methodology and contributed data; MDR provided research funding and contributed data; AG supervised the research, contributed to designing the research methodology, discussed the results, and contributed to the writing; GP supervised the research, contributed to designing the research methodology, discussed the results, and contributed to the writing.
Alberto Guadagnini is a member of the editorial board of the journal.
We are grateful to Brian Berkowitz and three anonymous reviewers for their constructive reviews and comments.
The study is financed by the Eni SpA R&D project “Gas Systems – Basin Gas Systems Risk Analysis”.
This paper was edited by Brian Berkowitz and reviewed by three anonymous referees.
Allis, R., Chidsey, T., Gwynn, W., Morgan, C., White, S., Adams, M., and Moore, J.: Natural CO2 reservoirs on the Colorado Plateau and southern Rocky Mountains: Candidates for CO2 sequestration, in: Proceedings of the First National Conference on Carbon Sequestration, US Department of Energy, National Energy Technology Laboratory Washington, DC., 14–17, 2001. a
Anderson, G. M.: Thermodynamics of natural systems, Cambridge University Press, 2005. a, b
Ballentine, C. J., Schoell, M., Coleman, D., and Cain, B. A.: 300-Myr-old magmatic CO2 in natural gas reservoirs of the west Texas Permian basin, Nature, 409, 327–331, 2001. a
Battistelli, A., Berry, P., Bonduà, S., Bortolotti, V., Consonni, A., Cormio, C., Geloni, C., and Vasini, E. M.: Thermodynamics-related processes during the migration of acid gases and methane in deep sedimentary formations, Greenhouse Gases: Science and Technology, 7, 295–312, 2017. a
Blanc, P., Lassin, A., Piantone, P., Azaroual, M., Jacquemet, N., Fabbri, A., and Gaucher, E. C.: Thermoddem: A geochemical database focused on low temperature water/rock interactions and waste materials, Appl. Geochem., 27, 2107–2116, 2012. a, b, c, d
Blanc, P., Vieillard, P., Gailhanou, H., and Gaboreau, S.: Thermodynamics of clay minerals, in: Developments in clay science, vol. 5, 173–210, Elsevier, 2013. a
Cathles, L. and Schoell, M.: Modeling CO2 generation, migration, and titration in sedimentary basins, Geofluids, 7, 441–450, 2007. a, b, c, d, e, f, g, h, i, j
Ceriotti, G., Porta, G., Geloni, C., Dalla Rosa, M., and Guadagnini, A.: Quantification of CO2 generation in sedimentary basins through carbonate/clays reactions with uncertain thermodynamic parameters, Geochim. Cosmochim. Ac., 213, 198–215, 2017. a, b, c, d, e, f, g, h, i, j, k, l
Ceriotti, G., Geloni, C., Dalla, R. M., Guadagnini, A., and Porta Giovanni:Probabilistic modeling of field-scale CO2 generation by Carbonate/Clay Reactions in sedimentary basins, available at: https://data.mendeley.com/datasets/nmbzst46jm/draft?a=0c3d3bc7-4d9b-4a7d-911b-e5dcfdb31b86, last access: 27 May 2021. a
Chiodini, G., Baldini, A., Barberi, F., Carapezza, M., Cardellini, C., Frondini, F., Granieri, D., and Ranaldi, M.: Carbon dioxide degassing at Latera caldera (Italy): evidence of geothermal reservoir and evaluation of its potential energy, J. Geophys. Res.-Sol. Ea., 112, B12204, https://doi.org/10.1029/2006JB004896, 2007. a, b
Colombo, I., Porta, G. M., Ruffo, P., and Guadagnini, A.: Uncertainty quantification of overpressure buildup through inverse modeling of compaction processes in sedimentary basins, Hydrogeol. J., 25, 385–403, 2017. a
Colombo, I., Nobile, F., Porta, G., Scotti, A., and Tamellini, L.: Uncertainty Quantification of geochemical and mechanical compaction in layered sedimentary basins, Comput. Meth. Appl. M., 328, 122–146, 2018. a
Coudrain-Ribstein, A. and Gouze, P.: Quantitative study of geochemical processes in the Dogger aquifer, Paris Basin, France, Appl. Geochem., 8, 495–506, 1993. a
Coudrain-Ribstein, A., Gouze, P., and de Marsily, G.: Temperature-carbon dioxide partial pressure trends in confined aquifers, Chem. Geol., 145, 73–89, 1998. a, b, c, d, e, f, g, h
Dalla Rosa, M., Ruffo, P., Grigo, D., Caldiero, L., Dolci, D., et al.: Hydrocarbon Retention: A New Way to Evaluate Source Rock and Unconventional Resource Potential With Petroleum System Modelling Applications, in: Offshore Mediterranean Conference and Exhibition, Offshore Mediterranean Conference, Ravenna, Italy, March 2015, 2015. a
Delany, J. and Lundeen, S.: The LLNL thermochemical database, Lawrence Livermore National Laboratory Report UCRL-21658, 150, 1990. a
Feng, Z., Liu, D., Huang, S., Gong, D., and Peng, W.: Geochemical characteristics and genesis of natural gas in the Yan’an gas field, Ordos Basin, China, Org. Geochem., 102, 67–76, 2016. a
Fischer, M., Botz, R., Schmidt, M., Rockenbauch, K., Garbe-Schönberg, D., Glodny, J., Gerling, P., and Littke, R.: Origins of CO2 in permian carbonate reservoir rocks (Zechstein, Ca2) of the NW-German Basin (Lower Saxony), Chem. Geol., 227, 184–213, 2006. a
Formaggia, L., Guadagnini, A., Imperiali, I., Lever, V., Porta, G., Riva, M., Scotti, A., and Tamellini, L.: Global sensitivity analysis through polynomial chaos expansion of a basin-scale geochemical compaction model, Comput. Geosci., 17, 25–42, 2013. a
Giggenbach, W. F.: Geothermal gas equilibria, Geochim. Cosmochim. Ac., 44, 2021–2032, 1980. a
Grigo, D., Maragna, B., Arienti, M., Fiorani, M., Parisi, A., Marrone, M., Sguazzero, P., and Uberg, A.: Issues in 3D sedimentary basin modelling and application to Haltenbanken, offshore Norway, Basin Modelling: Advances and Applications, Norwegian Petroleum Society (NPF), Special Publication, 3, 455–468, 1993. a
Hutcheon, I. and Abercrombie, H.: Carbon dioxide in clastic rocks and silicate hydrolysis, Geology, 18, 541–544, 1990. a, b, c
Hutcheon, I., Oldershaw, A., and Ghent, E. D.: Diagenesis of Cretaceous sandstones of the Kootenay Formation at Elk Valley (southeastern British Columbia) and Mt Allan (southwestern Alberta), Geochim. Cosmochim. Ac., 44, 1425–1435, 1980. a
Hutcheon, I., Abercrombie, H. J., Putnam, P., Gardner, R., and Krouse, H. R.: Diagenesis and sedimentology of the Clearwater Formation at Tucker Lake, B. Can. Petrol. Geol., 37, 83–97, 1989. a
Hutcheon, I., Abercrombie, H. J., and Krouse, H.: Inorganic origin of carbon dioxide during low temperature thermal recovery of bitumen: Chemical and isotopic evidence, Geochim. Cosmochim. Ac., 54, 165–171, 1990a. a
Hutcheon, I., Spencer, R. J., and Chou, I.: Clay carbonate reactions in the venture area, Scotian Shelf, Nova Scotia, Canada, Geo. Soc. S. P., 2, 199–212, 1990b. a, b, c, d, e
Hutcheon, I., Shevalier, M., and Abercrombie, H. J.: pH buffering by metastable mineral-fluid equilibria and evolution of carbon dioxide fugacity during burial diagenesis, Geochim. Cosmochim. Ac., 57, 1017–1027, 1993. a
Imbus, S. W., Katz, B. J., and Urwongse, T.: Predicting CO2 occurrence on a regional scale: Southeast Asia example, Org. Geochem., 29, 325–345, 1998. a
Jarvie, B. and Jarvie, D.: Thermal decomposition of various carbonates: Kinetics results and geological temperatures of conversion: 23rd International Meeting on Organic Geochemistry (IMOG) 2007, Torquay, UK, 311–312, 2007. a
Kissinger, A., Noack, V., Knopf, S., Konrad, W., Scheer, D., and Class, H.: Regional-scale brine migration along vertical pathways due to CO2 injection – Part 2: A simulated case study in the North German Basin, Hydrol. Earth Syst. Sci., 21, 2751–2775, https://doi.org/10.5194/hess-21-2751-2017, 2017. a, b
Kotarba, M. J. and Nagao, K.: Composition and origin of natural gases accumulated in the Polish and Ukrainian parts of the Carpathian region: Gaseous hydrocarbons, noble gases, carbon dioxide and nitrogen, Chem. Geol., 255, 426–438, 2008. a
Li, M., Wang, T., Liu, J., Lu, H., Wu, W., and Gao, L.: Occurrence and origin of carbon dioxide in the Fushan depression, Beibuwan Basin, South China Sea, Mar. Petrol. Geol., 25, 500–513, 2008. a
Maier, C. G. and Kelley, K.: An equation for the representation of high-temperature heat content data, J. Am. Chem. Soc., 54, 3243–3246, 1932. a
Marín-Moreno, H., Bull, J. M., Matter, J. M., Sanderson, D. J., and Roche, B. J.: Reactive transport modelling insights into CO2 migration through sub-vertical fluid flow structures, Int. J. Greenh. Gas Con., 86, 82–92, https://doi.org/10.1016/j.ijggc.2019.04.018, 2019. a
Menafoglio, A., Guadagnini, A., and Secchi, P.: Stochastic simulation of soil particle-size curves in heterogeneous aquifer systems through a Bayes space approach, Water Resour. Res., 52, 5708–5726, 2016. a
Metz, B., Davidson, O., De Coninck, H., Loos, M., and Meyer, L.: IPCC special report on carbon dioxide capture and storage, Tech. rep., Intergovernmental Panel on Climate Change, Geneva (Switzerland), Working Group III, 2005. a
Millero, F. J.: The effect of pressure on the solubility of minerals in water and seawater, Geochim. Cosmochim. Ac., 46, 11–22, 1982. a
Neuman, S. P.: Maximum likelihood Bayesian averaging of uncertain model predictions, Stoch. Env. Res. Risk A., 17, 291–305, 2003. a
Panariti, N. and Previde Massara, E.: Relazione tecnica: Generazione di CO2 da rocce carbonatiche, Eni SpA, Tech. rep., 2000. a
Parkhurst, D. L. and Appelo, C.: Description of input and examples for PHREEQC version 3: a computer program for speciation, batch-reaction, one-dimensional transport, and inverse geochemical calculations, Tech. rep., US Geological Survey, 2013. a
Shin, W. J., Chung, G. S., Lee, D., and Lee, K. S.: Dissolved inorganic carbon export from carbonate and silicate catchments estimated from carbonate chemistry and δ13CDIC, Hydrol. Earth Syst. Sci., 15, 2551–2560, https://doi.org/10.5194/hess-15-2551-2011, 2011. a
Smith, J. and Ehrenberg, S.: Correlation of carbon dioxide abundance with temperature in clastic hydrocarbon reservoirs: relationship to inorganic chemical equilibrium, Mar. Petrol. Geol., 6, 129–135, 1989. a, b, c, d, e, f
van Berk, W., Schulz, H.-M., and Fu, Y.: Controls on CO2 fate and behavior in the Gullfaks oil field (Norway): How hydrogeochemical modeling can help decipher organic-inorganic interactions, AAPG Bull., 97, 2233–2255, 2013. a
Walker, W., Harremoës, P., Rotmans, J., van der Sluijs, J., van Asselt, M., Janssen, P., and von Krauss, M. K.: Defining Uncertainty: A Conceptual Basis for Uncertainty Management in Model-Based Decision Support, Integrat. Ass., 4, 5–17, https://doi.org/10.1076/iaij.4.1.5.16466, 2003. a, b, c, d
Wycherley, H., Fleet, A., and Shaw, H.: Some observations on the origins of large volumes of carbon dioxide accumulations in sedimentary basins, Mar. Petrol. Geol., 16, 489–494, 1999. a
Xu, T. and Pruess, K.: On fluid flow and mineral alteration in fractured caprock of magmatic hydrothermal systems, J. Geophys. Res.-Sol. Ea., 106, 2121–2138, 2001. a
Zattin, M., Andreucci, B., de Toffoli, B., Grigo, D., and Tsikalas, F.: Thermochronological constraints to late Cenozoic exhumation of the Barents Sea Shelf, Mar. Petrol. Geol., 73, 97–104, 2016. a
Zhang, S., FitzGerald, J. D., and Cox, S. F.: Reaction-enhanced permeability during decarbonation of calcite quartz = wollastonite carbon dioxide, Geology, 28, 911–914, 2000. a