the Creative Commons Attribution 4.0 License.
the Creative Commons Attribution 4.0 License.
 | 09 Jun 2021
Global component analysis of errors in three satellite-only global precipitation estimates
Hanqing Chen
Pierre-Emmanuel Kirstetter
Leyang Wang
Yang Hong
Revealing the error components of satellite-only precipitation products (SPPs) can help algorithm developers and end-users understand their error features and improve retrieval algorithms. Here, two error decomposition schemes are employed to explore the error components of the IMERG-Late, GSMaP-MVK, and PERSIANN-CCS SPPs over different seasons, rainfall intensities, and topography classes. Global maps of the total bias (total mean squared error) and its three (two) independent components are depicted for the first time. The evaluation results for similar regions are discussed, and it is found that the evaluation results for one region cannot be extended to another similar region. Hit and/or false biases are the major components of the total bias in most overland regions globally. The systematic error contributes less than 20 % of the total error in most areas. Large systematic errors are primarily due to missed precipitation. It is found that the SPPs show different topographic patterns in terms of systematic and random errors. Notably, among the SPPs, GSMaP-MVK shows the strongest topographic dependency of the four bias scores. A novel metric, namely the normalized error component (NEC), is proposed as a means to isolate the impact of topography on the systematic and random errors. Potential methods of improving satellite precipitation retrievals and error adjustment models are discussed.
- Article
(19161 KB) - Full-text XML
-
Supplement
(157 KB) - BibTeX
- EndNote


As precipitation is a key input for the hydrological cycle system, accurately estimating precipitation is of great significance when studying the global water cycle (Hou et al., 2014; Kidd et al., 2017; Skofronick-Jackson et al., 2017; Chen et al., 2019a). Traditional methods depend on rain gauge networks to obtain precise point-scale precipitation observations (Kidd and Huffman, 2011). In addition, ground-based radars can provide remotely sensed observations for precipitation estimation over a range of approximately 250 km (Zhang et al., 2016; Chen et al., 2019b). However, these two methods for estimating precipitation are affected by a number of factors, including the local terrain, weather regimes, environment, and economy. It is challenging to obtain continuous spatiotemporal precipitation estimates for many regions of the world, especially over complex terrain and developing countries (Baez-Villanueva et al., 2020).
Satellite-based instruments have the ability to overcome the limitations of rain gauge networks and ground-based radar networks to provide precipitation estimates covering large areas globally (Kidd and Levizzani, 2011). However, satellite-based precipitation products are affected by biases and uncertainty, especially over mountainous areas (Tian and Peters-Lidard, 2010; Maggioni et al., 2016a; Chen et al., 2020b). Therefore, it is necessary to comprehensively analyze the structure of uncertainty in satellite-based precipitation products, especially those relying on satellite observations only. Over the past 20 years, a large body of literature investigating error features of satellite precipitation products at the global scale (e.g., Yong et al., 2015; Liu, 2016; Beck et al., 2017; Chen et al., 2020b) and the regional scale (e.g., AghaKouchak et al., 2011; Yong et al., 2010, 2013, 2016; Takido et al., 2016; Tan et al., 2017; Prakash et al., 2018; Sungmin and Kirstetter, 2018; Gebregiorgis et al., 2018; Beck et al., 2019; Chen et al., 2019b) has accumulated. These studies have provided a great deal of valuable information for algorithm developers and end-users. Most studies use the mean error to analyze the error features of SPPs, which could be misleading because the mean error averages different error components. In some cases, the error components compensate for each other and generate lower mean error values than the absolute values of the individual components (Chen et al., 2019b).
Tian et al. (2009) proposed an error decomposition scheme to separate the total bias into three independent components (i.e., hit bias, miss bias, and false bias). Several evaluation studies have investigated major bias components of satellite precipitation products over several regions, such as mainland China (Yong et al., 2016; Xu et al., 2016; Su et al., 2018; Chen et al., 2020b), the United States (Tian et al., 2009), and Central Asia (Guo et al., 2017). AghaKouchack et al. (2012) used an error decomposition technique proposed by Willmott (1981) to separate the total mean squared error into the systematic error and the random error to evaluate three satellite precipitation products (i.e., CMORPH, PERSIANN, and real-time TMPA) over the conterminous United States (CONUS). Maggioni et al. (2016b) further investigated the systematic errors of TMPA products for CONUS. However, those studies concentrated on limited regions and did not provide a global focus. Importantly, the question of the transferability of regional evaluation results to different but similar areas still needs to be investigated, as this has implications in terms of improving the performance of SPPs in regions of the world where no ground observations are available. Besides, investigations of the major component of the total bias – the component that produces the largest systematic errors – are still needed.
Topography is a crucial factor that influences satellite precipitation retrievals (Tapiador et al., 2012; Xu et al., 2017; Chen et al., 2019b). While several studies have strived to investigate the total bias of satellite precipitation retrievals over various topographies (e.g., Takido et al., 2016; Guo et al., 2017; Xu et al., 2017; Chen et al., 2019b), error components remain underexplored. In particular, literature that investigates the potential link between systematic (random) error and terrain features is lacking, which limits the characterization of satellite precipitation error. Furthermore, previous studies used the mean elevation as a way to describe the underlying terrain. As the mean elevation often does not objectively represent the complexity of the topography present, a more relevant metric is needed.
Precipitation intensity is another important factor driving the errors in satellite precipitation estimates (Tian et al., 2009; Kirstetter et al., 2013; Chen et al., 2013, 2020b). Previous efforts found that satellite precipitation products tend to overestimate light rainfall and underestimate heavy rainfall (Tian et al., 2009; Kirstetter et al., 2013; Chen et al., 2013). Tian et al. (2009) investigated the major components of the total bias in six SPPs (AFWA, the TMPA suite, CMORPH, PERSIANN, and NRL) for different rainfall intensities, and Maggioni et al. (2016b) quantified the relationship between the systematic (random) error of TMPA products and the rainfall intensity, while Kirstetter et al. (2018) revealed the relationship between the systematic (random) error in PERSIANN-CCS and the precipitation intensity. Nevertheless, the potential links between the systematic (random) error of IMERG-Late and GSMaP-MVK and the precipitation intensity are still absent.
The objective of this study is fourfold: (1) to reveal the major components of the errors (including the total bias and the total mean squared error) for three SPPs, including IMERG Late Run (IMERG-Late), GSMaP Microwave–IR Combined Product (GSMaP-MVK), and PERSIANN-CCS for four seasons across the global land area; (2) to investigate the transferability of regional assessment results to other similar regions; (3) to identify the factors that cause large systematic errors; and (4) to inform users and algorithm developers on how to improve these satellite precipitation products.
2.1 Study area
The study area covers all of the land globally between 60∘ N and 60∘ S. Figure 1a shows the topographic relief in terms of the standard deviation of elevation (SDE; see Sect. 2.3.3). The SDE is introduced here to better describe the topography in each grid cell. In terms of topography, the study area encompasses complex terrain areas that include the western CONUS, the Andean Mountains, southern Europe, Turkey, Iran, Afghanistan, the Tibetan Plateau (TP), the most humid regions in mainland China, and Japan. The studied land area can be divided into four climate regions, namely humid regions (average annual precipitation (AAP)>800 mm yr−1), semi-humid regions (AAP is 400–800 mm yr−1), semi-arid regions (AAP is 200–400 mm yr−1), and arid regions (AAP<200 mm yr−1), as shown in Fig. 1b. The geographical distribution of these climate regions can be found in Fig. 1c.

Figure 1(a) Global map of topography; (b) global map of mean annual precipitation from 1891 to 2018 (128 years) based on the Global Precipitation Climatology Centre (GPCC) monthly gauge analysis; (c) division of the study region into four climate areas (i.e., humid, semi-humid, semi-arid, and arid); (d) the spatial density of rain gauges used to obtain Climate Precipitation Center unified (CPCU) data and China Gauge-based Daily Precipitation Analysis (CGDPA) data.
2.2 Datasets
2.2.1 Reference products
Three high-accuracy rain-gauge datasets are employed as the references. Climate Precipitation Center unified (CPCU) data are used as the benchmark for the studied land area, except for mainland China. These are continuous daily precipitation data at a spatial resolution of 0.5∘ produced by the CPC using optimal interpolation (OI) based on >17 000 gauges (Xie et al., 2007; Chen et al., 2008). For the benchmark over mainland China, China Gauge-based Daily Precipitation Analysis (CGDPA) data are used. This dataset, with a spatial resolution of 0.25∘ and daily temporal resolution, is developed based on ∼2400 rain gauges using the OI method. Assessment results indicate that this ground-based precipitation dataset outperforms CPCU and the East Asia gauge analysis (EA_Gauge; Xie et al., 2007) data over mainland China (Shen and Xiong, 2016). To alleviate the effects of reference inconsistency on the analysis, the error scores of SPPs are calculated separately for mainland China and the rest of the world and subsequently merged. The detailed procedure is provided in the supplementary material. Regarding the component analysis of SPP errors for different topographies, high-accuracy and high spatiotemporal resolution (hourly and 0.1∘) ground observations derived from 25 982 rain gauges (Shen et al., 2014) are used as the benchmark. The spatial distribution of rain gauges can be found in Chen et al. (2019b, 2020b). However, this product has large uncertainties during cold seasons due to freezing weather. The analysis was executed at a spatial resolution of 0.1∘ to avoid smoothing topographic features as much as possible. In this study, only pixels with at least one rain gauge are considered. The spatial distribution of rain gauges, including those used to generate CPCU and CGDPA data, is shown in Fig. 1d.
2.2.2 Satellite-only precipitation products
The main focus of this study is on analyzing the error components of the three SPPs (i.e., IMERG-Late V6, GSMaP-MVK V7, and PERSIANN-CCS). The corresponding gauge-adjusted satellite precipitation products (IMERG Final Run, gauge-adjusted GSMaP, and PERSIANN Climate Data Record) that merge ground-based rain-gauge and satellite observations were not used in this study, thus ensuring an objective assessment with independent benchmarks (e.g., the gauge-adjusted GSMaP incorporates CPCU data). Note that other satellite-only SPPs are not included in this study because they are not released to the public (e.g., CMORPH) or they have been decommissioned (e.g., real-time TMPA; https://gpm.nasa.gov/, last access: 20 February 2021). A 5 year period (2015–2019) was chosen to investigate the SPP error components. Table 1 provides general information on the three SPPs; more detailed information about their production processes can be found in Chen et al. (2020b).
Table 1Information about the three satellite-only global precipitation estimates used in this study.
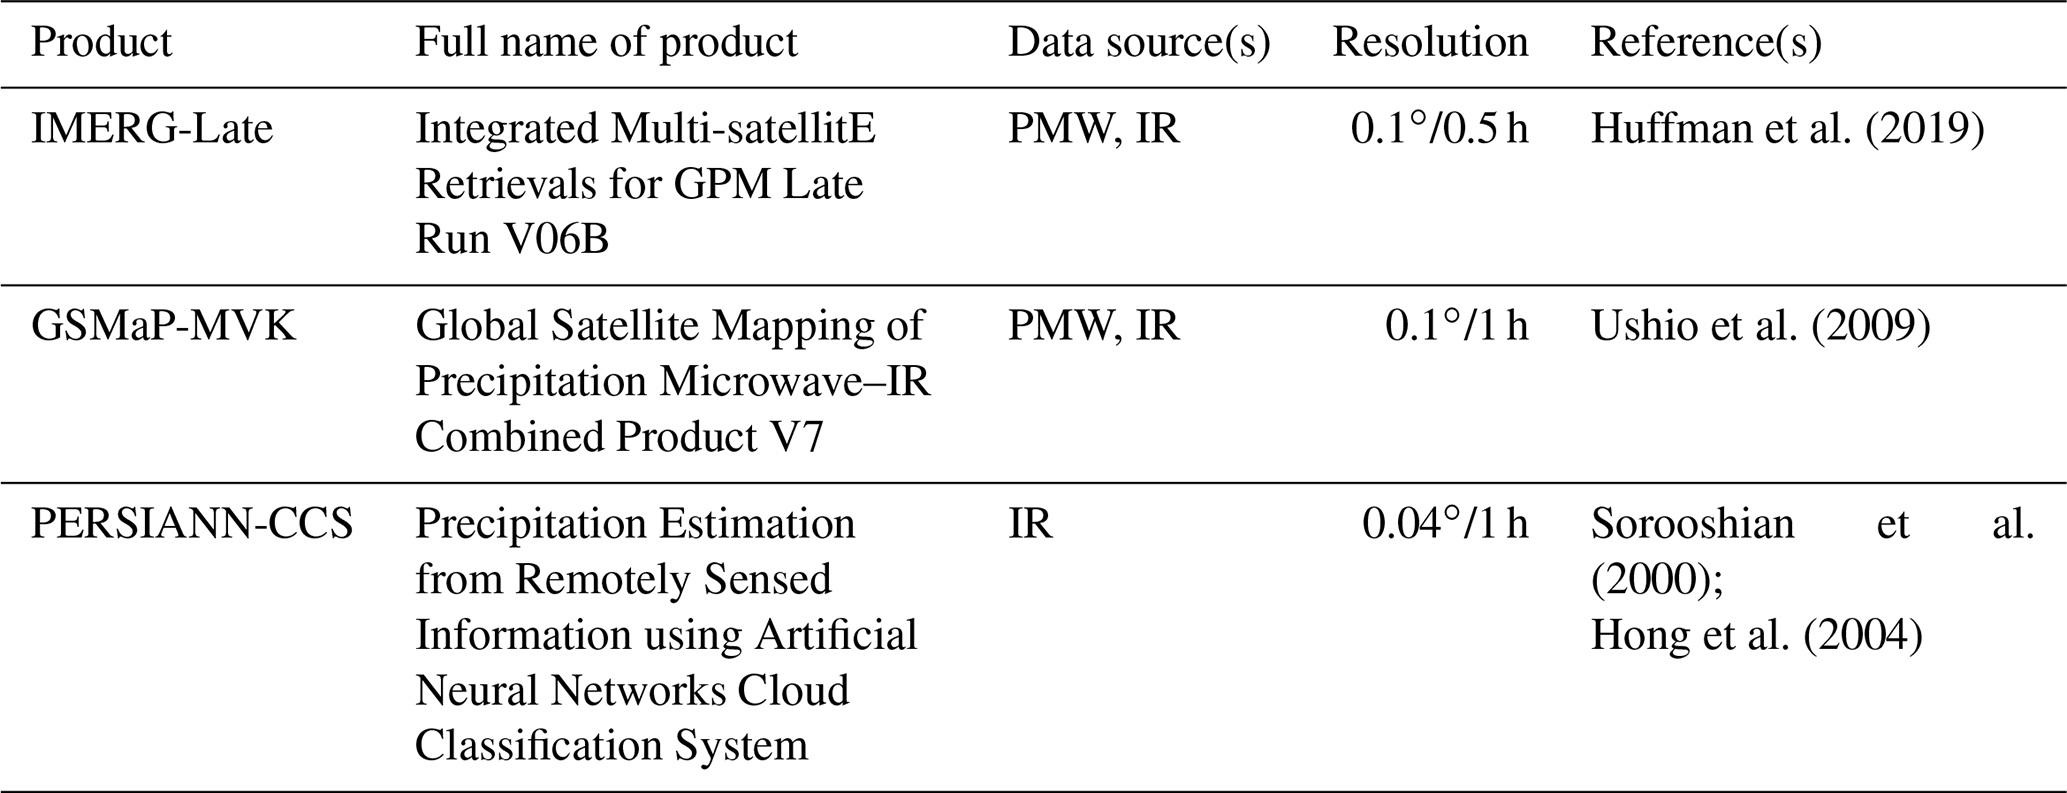
To be consistent with CPCU data (0.5∘, daily), all SPPs are resampled to the same spatial resolution (0.5∘) and aggregated to daily temporal resolution.
2.3 Methodology
2.3.1 Error decomposition technique
Tian et al. (2009) proposed an error decomposition scheme to separate the total bias (TB) into the hit bias (HB), miss bias (MB), and false bias (FB). This technique is effective at identifying the major error components of the total bias, and can provide valuable information to customize retrieval algorithms and mitigate errors. The four bias scores can be defined as follows (Tian et al., 2009):
where S and G are the satellite-measured and rain-gauge-measured precipitation, respectively; SH and GH are the satellite-derived and rain-gauge-derived precipitation estimates for hit rainfall events, respectively; GM denotes the precipitation missed by the satellite in miss rainfall events; and SF indicates the precipitation measured by the satellite in false rainfall events.
Another error decomposition technique decomposes the total mean squared error into systematic and random error components. This strategy was used by Willmott (1981) to separate the systematic and random errors in numerical weather prediction models. Subsequently, AghaKouchack et al. (2012) employed this technique to investigate the systematic and random errors in three satellite precipitation products (i.e., CMORPH, PERSIANN, and real-time TMPA) over CONUS. This error decomposition method can be defined as follows (Willmott, 1981; AghaKouchack et al., 2012):
where ES and ER represent the systematic and random error components, respectively; and a and b are the slope and intercept, respectively, which can be computed using the least squares method. Note that the systematic error component (ES) plus the random error component (ER) add up to 100 %.
2.3.2 Normalized error component
The systematic and random errors in SPPs are impacted by several key impact factors, such as season and rainfall intensity (AghaKouchack et al., 2012; Maggioni et al., 2016b; Kirstetter et al., 2013, 2018). To isolate the influence of topography on the systematic and random errors, a novel metric called the normalized error component (NEC) is proposed that filters the impact of precipitation intensity. This metric is defined as follows:
where indicates the mean value of ground-based observations for each topographic class. Note that the relationship between NEC and topography degenerates into the relationship between systematic error and topography when the mean precipitation (i.e., ) is similar for all topography classes. Thus, the NEC metric works only when the rainfall intensities are significantly different across all topographic categories.
2.3.3 Index of topography complexity
To better describe the variability of topography in each grid cell, the standard deviation of elevation (SDE) is used here instead of the average elevation. The larger the SDE value, the higher the terrain gradients within the grid cell, reflecting steeper topography. The SDE formula is defined as follows:
where indicates the mean elevation for each pixel; Ei denotes the ith elevation value of each grid cell; and n represents the elevation sample size for each pixel. The global map of SDE is shown in Fig. 1a. The SPP errors and their components are computed as functions of the SDE for different topographies. The relationship between error and precipitation intensity is similarly established for various rainfall rate classes to investigate the impact of rainfall intensity.
3.1 Global view of the error components
3.1.1 Spatial analysis of error components over different seasons
As a seasonal dependency of the errors in SPPs has been documented (Tian et al., 2009; Chen et al., 2019b), the analysis first focuses on different seasons. The following seasonal division scheme was implemented: (1) spring (March–May, hereafter referred to as MAM); (2) summer (June–August, hereafter referred to as JJA); (3) fall (September–November, hereafter referred to as SON); and (4) winter (December–February, hereafter referred to as DJF).
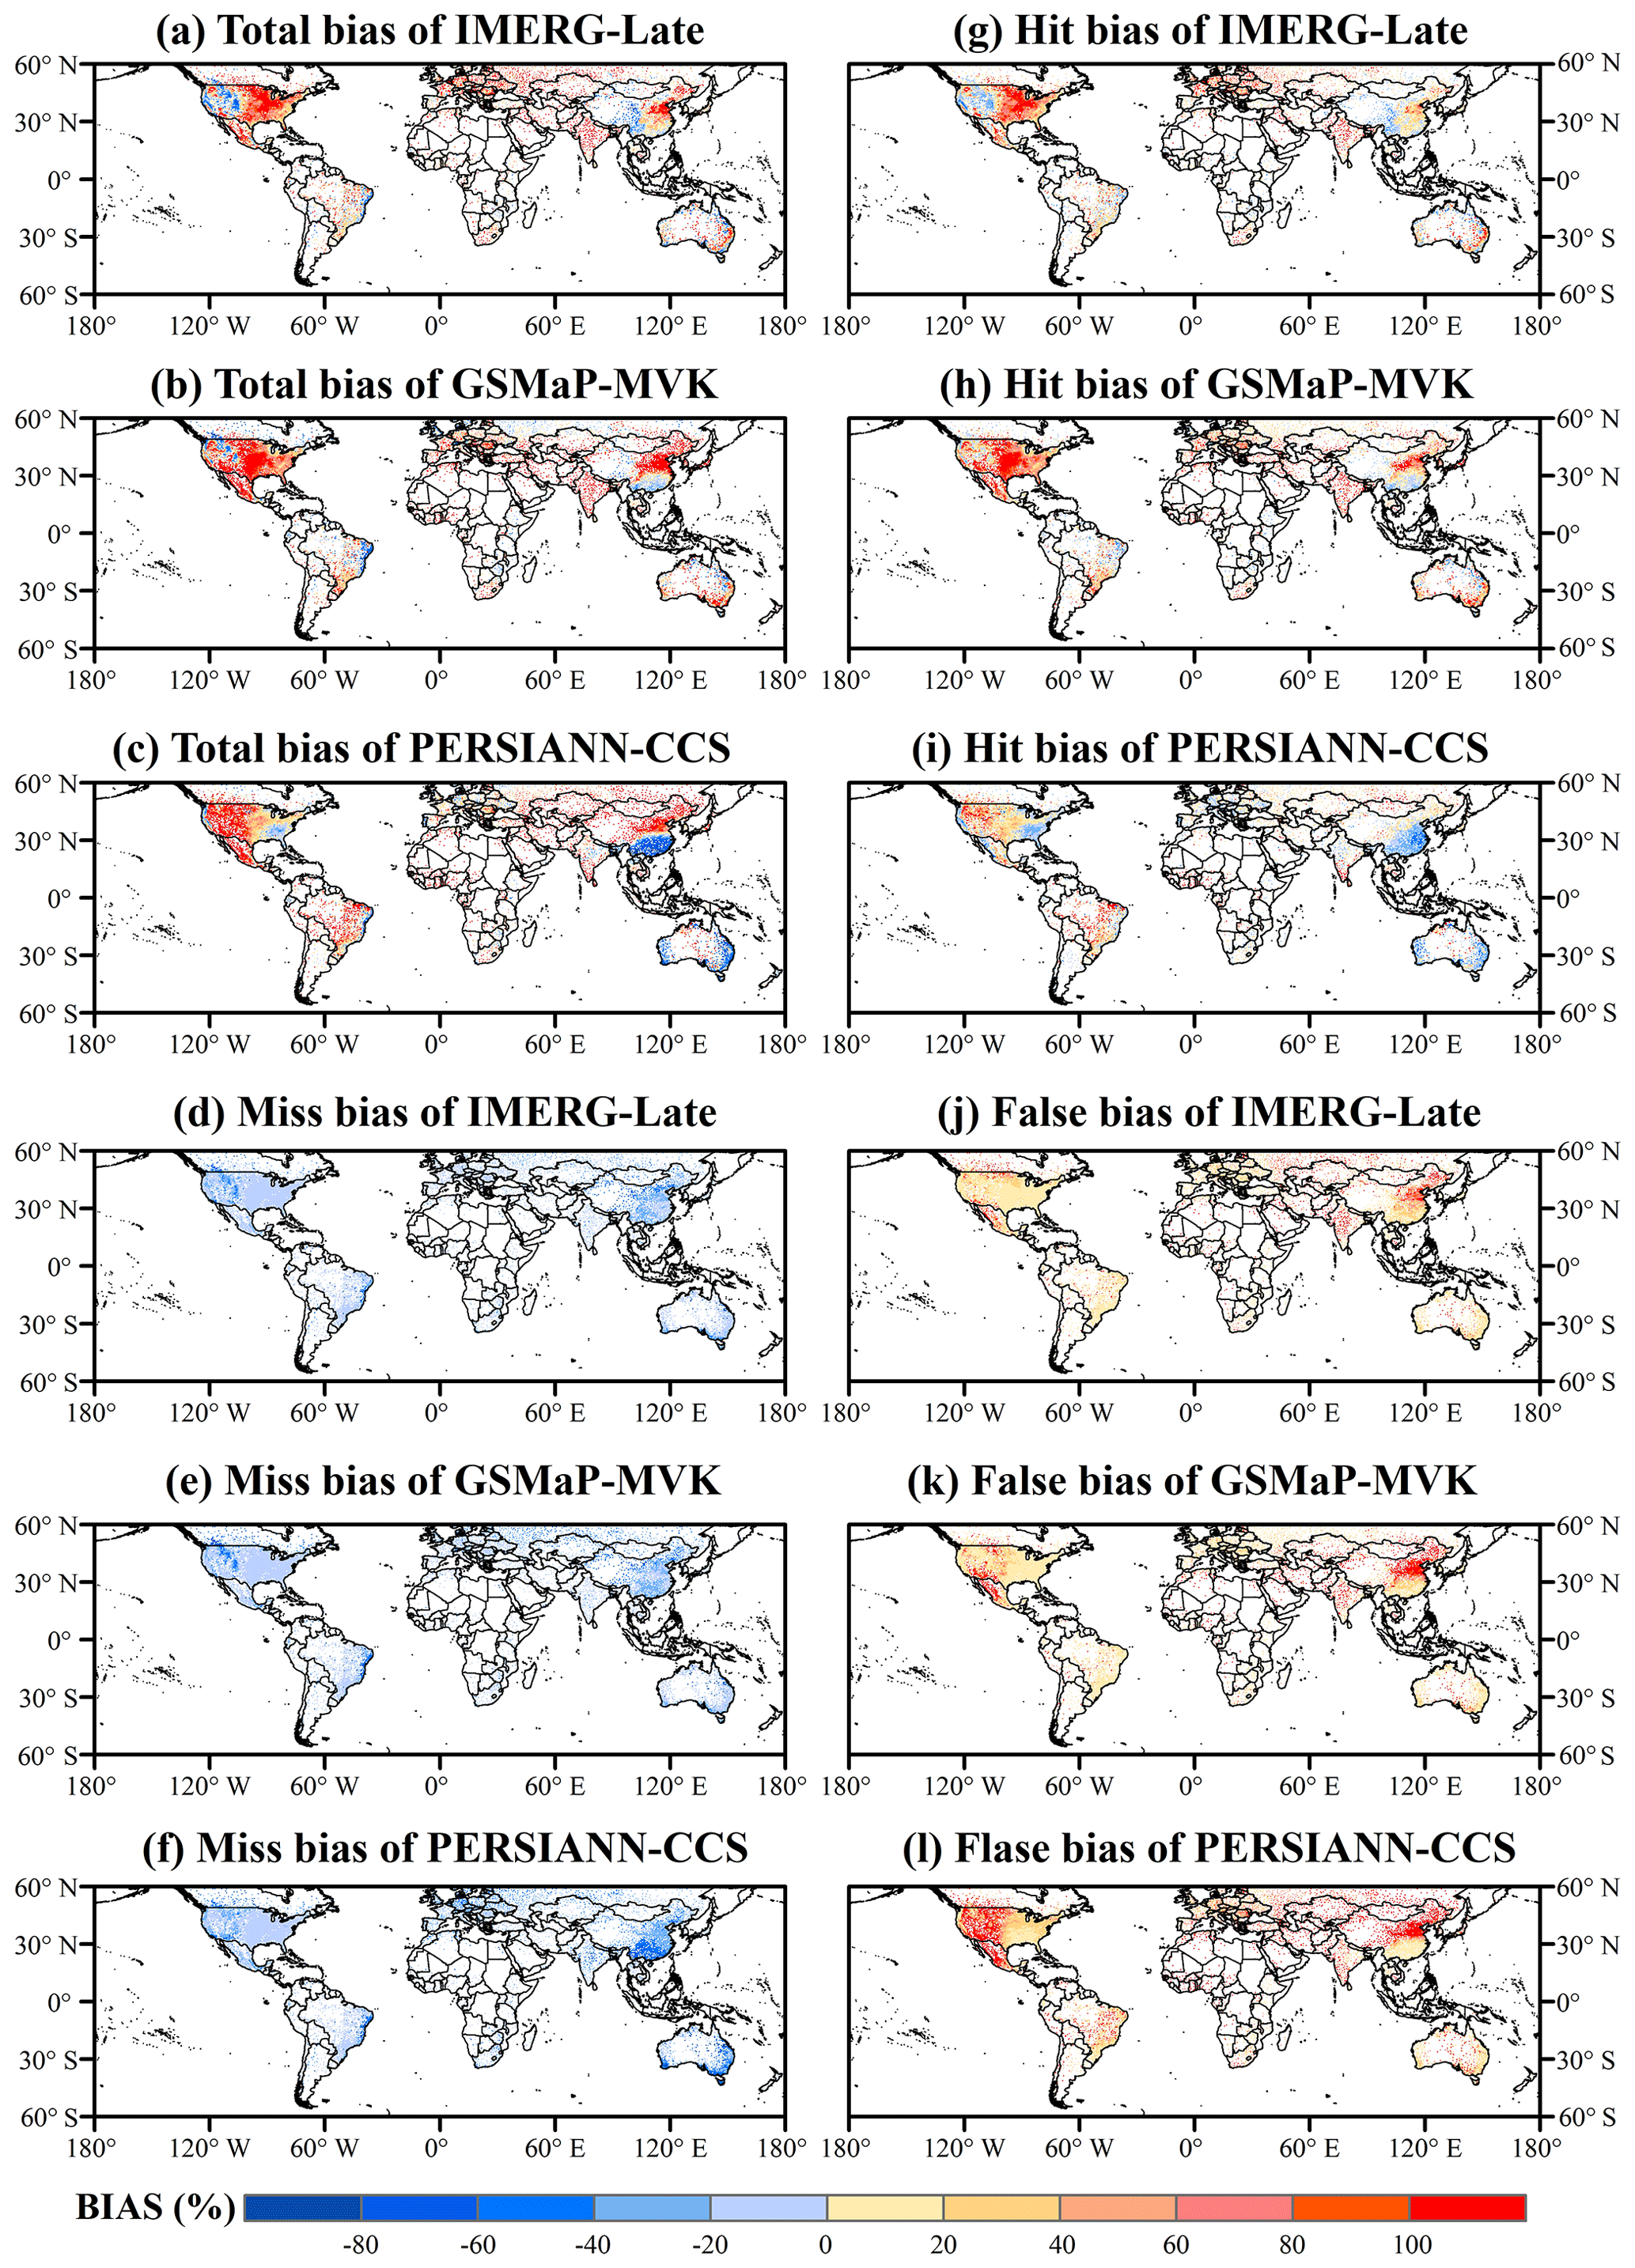
Figure 2Global land maps of the total bias and its three independent components for the three satellite-only global precipitation estimates (i.e., IMERG-Late, GSMaP-MVK, and PERSIANN-CCS) at a spatial resolution of 0.5∘ and daily temporal resolution during the MAM season (March–May) for the period from 2015 to 2019 (5 years): (a–c) total bias, (d–f) miss bias, (g–i) hit bias, (j–l) false bias.
For the MAM season (Fig. 2), the majority of the SPPs show considerable similarities in total bias. IMERG-Late and GSMaP-MVK seriously overestimate precipitation (total bias>100 %) over most regions of the globe, such as the humid regions of CONUS, Mexico, Europe, and India and the semi-humid areas of China (see Fig. 2a and e). However, the total biases come from different error components in different areas. The total biases in IMERG and GSMaP are mainly dominated by the hit component in CONUS and Europe, while hit and false errors dominate in Mexico, India, and mainland China. The largest total biases in PERSIANN-CCS primarily occur in CONUS (except for its humid regions), Mexico, Brazil, and most of Asia (except for humid regions in China). These larger total biases originate from hit and false components over CONUS and Brazil, while they are dominated by false errors over Asia and Mexico.
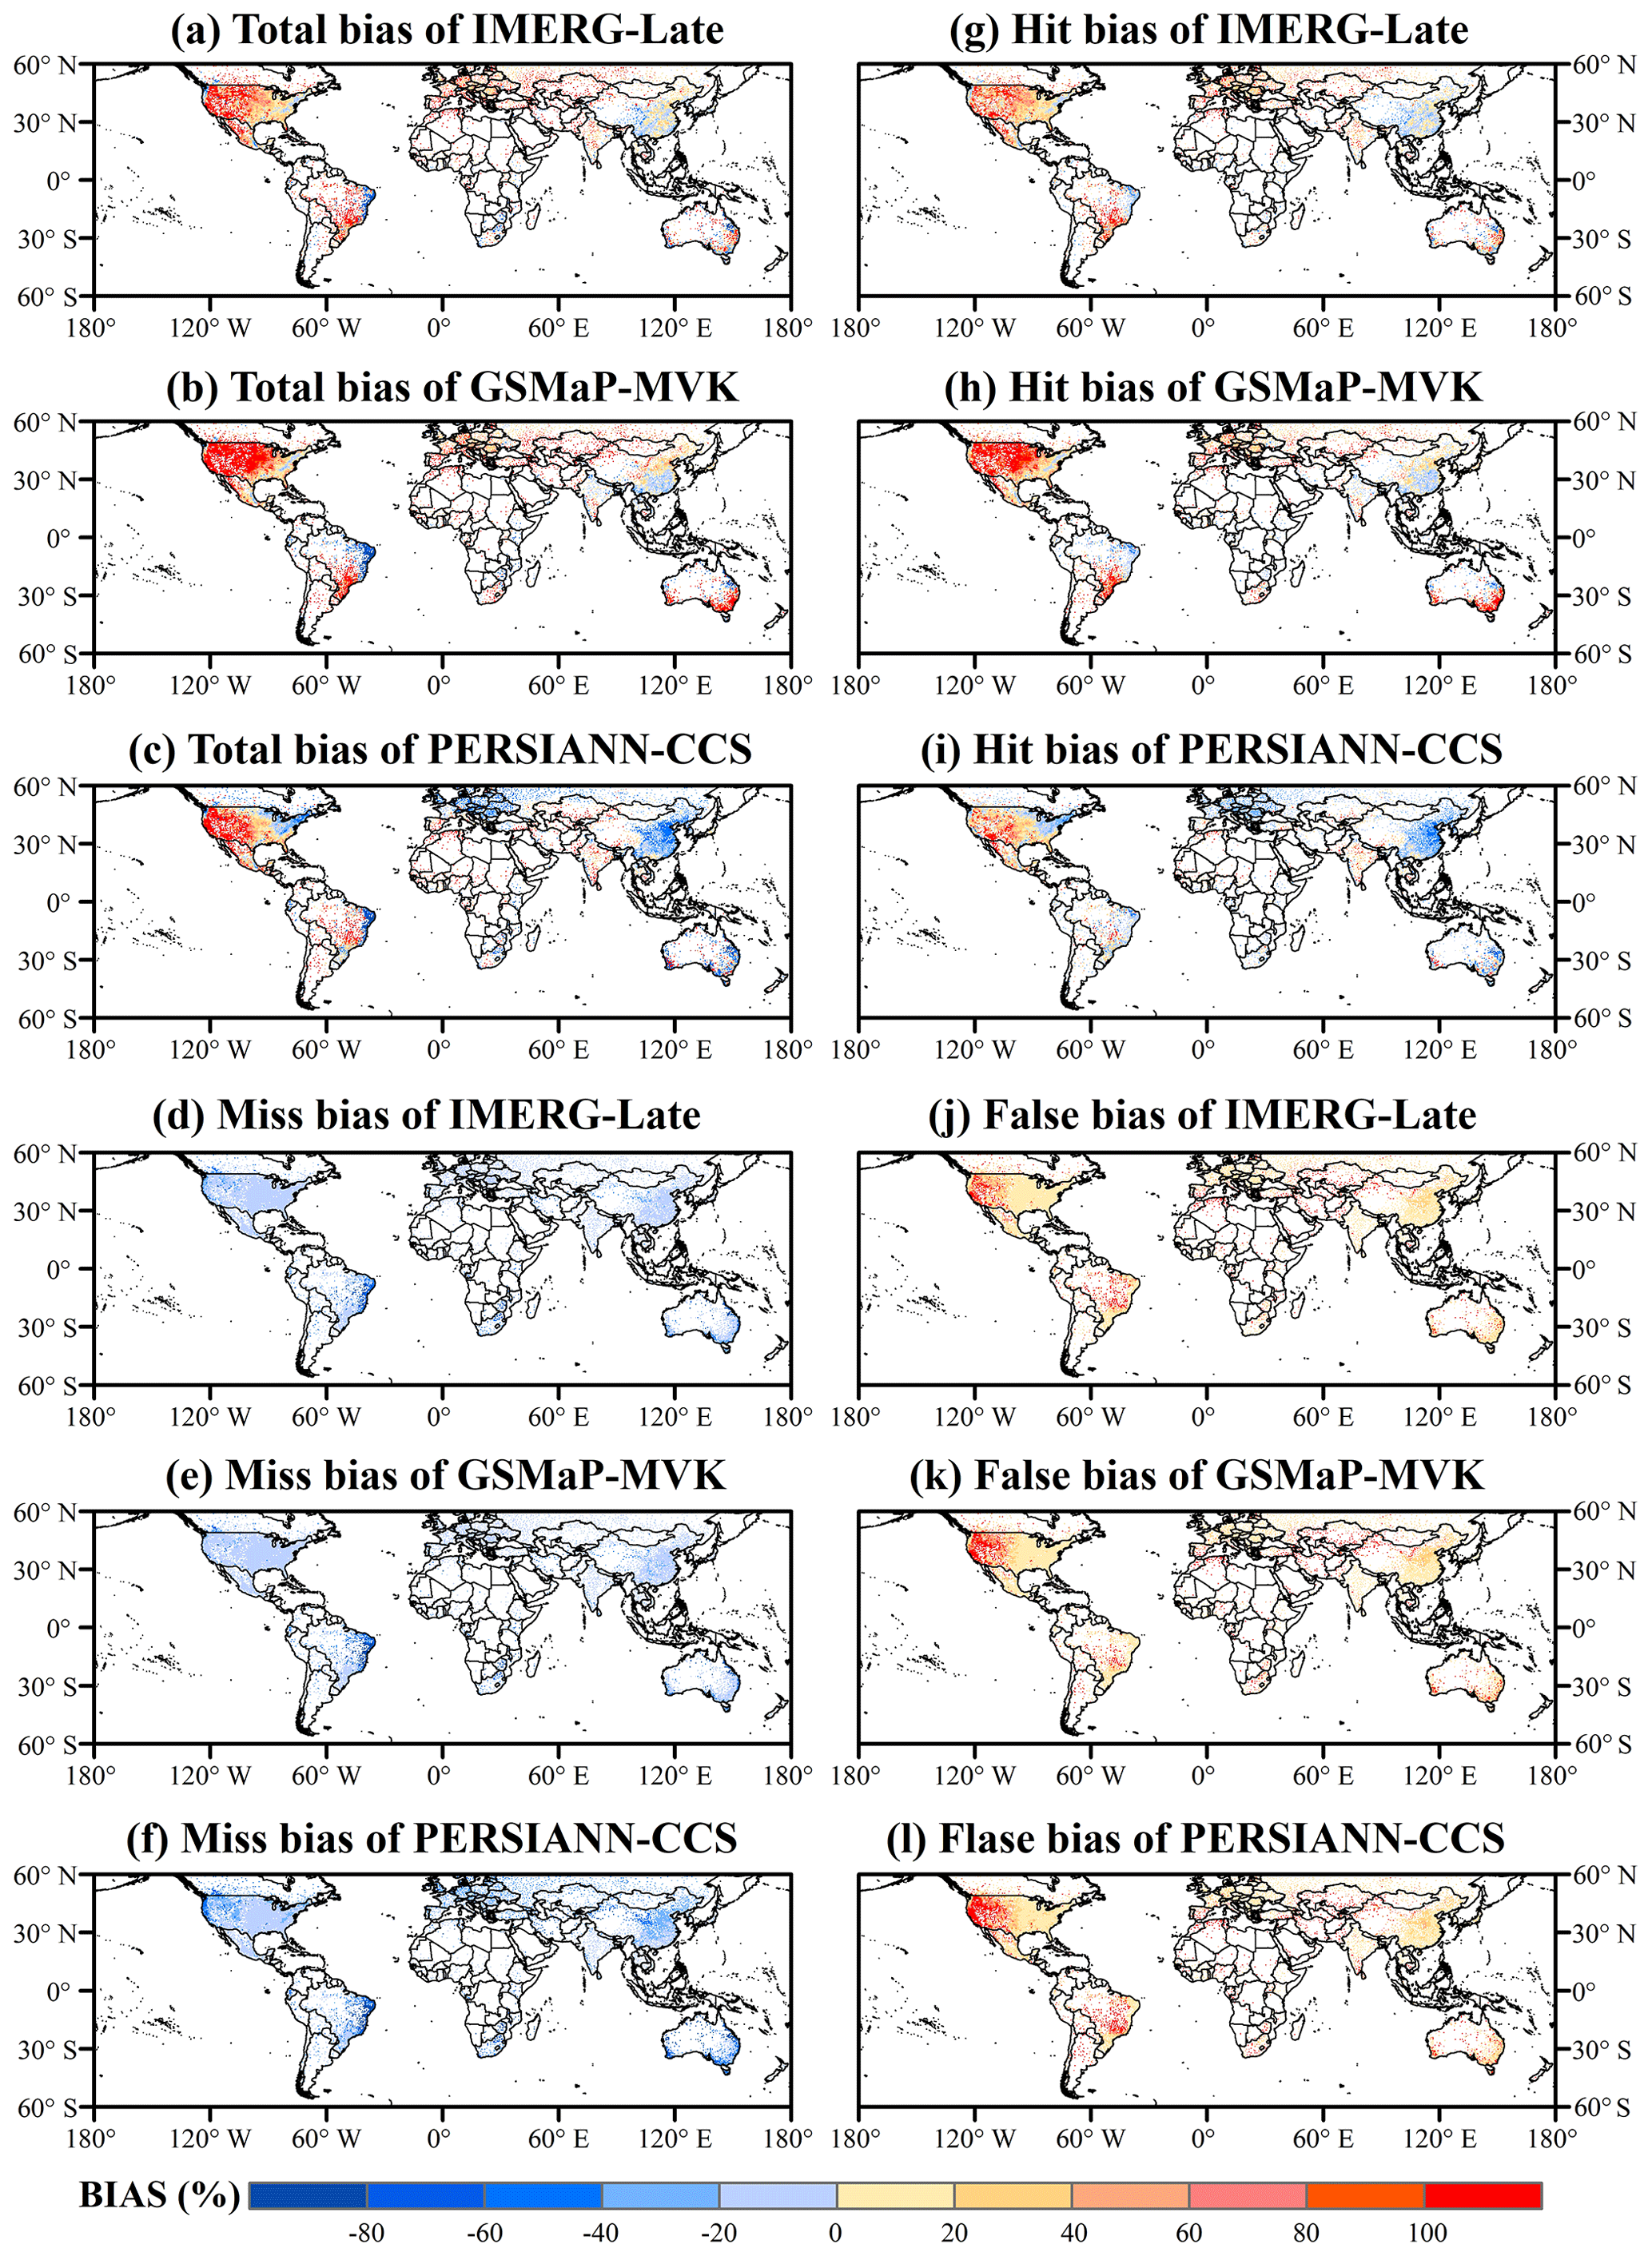
Figure 3Global land maps of the total bias and its three independent components for the three satellite-only global precipitation estimates (i.e., IMERG-Late, GSMaP-MVK, and PERSIANN-CCS) at a spatial resolution of 0.5∘ and daily temporal resolution during the JJA season (June–August) for the period from 2015 to 2019 (5 years): (a–c) total bias, (d–f) miss bias, (g–i) hit bias, (j–l) false bias.
Regarding the JJA season (Fig. 3), the three SPPs exhibit large overestimates over most of CONUS (total bias>80 %), which are primarily due to the hit error component for IMERG and GSMaP. For northwest Mexico, the precipitation is evidently overestimated due to hit bias in the three SPPs. Regarding Europe, the hit error is also the major error component for IMERG and GSMaP. PERSIANN-CCS underestimates the precipitation over most regions of Europe due to miss errors and hit errors. In addition, the SPPs show better performance for mainland China during the JJA season (summer), with a lower total bias of ±20 %.
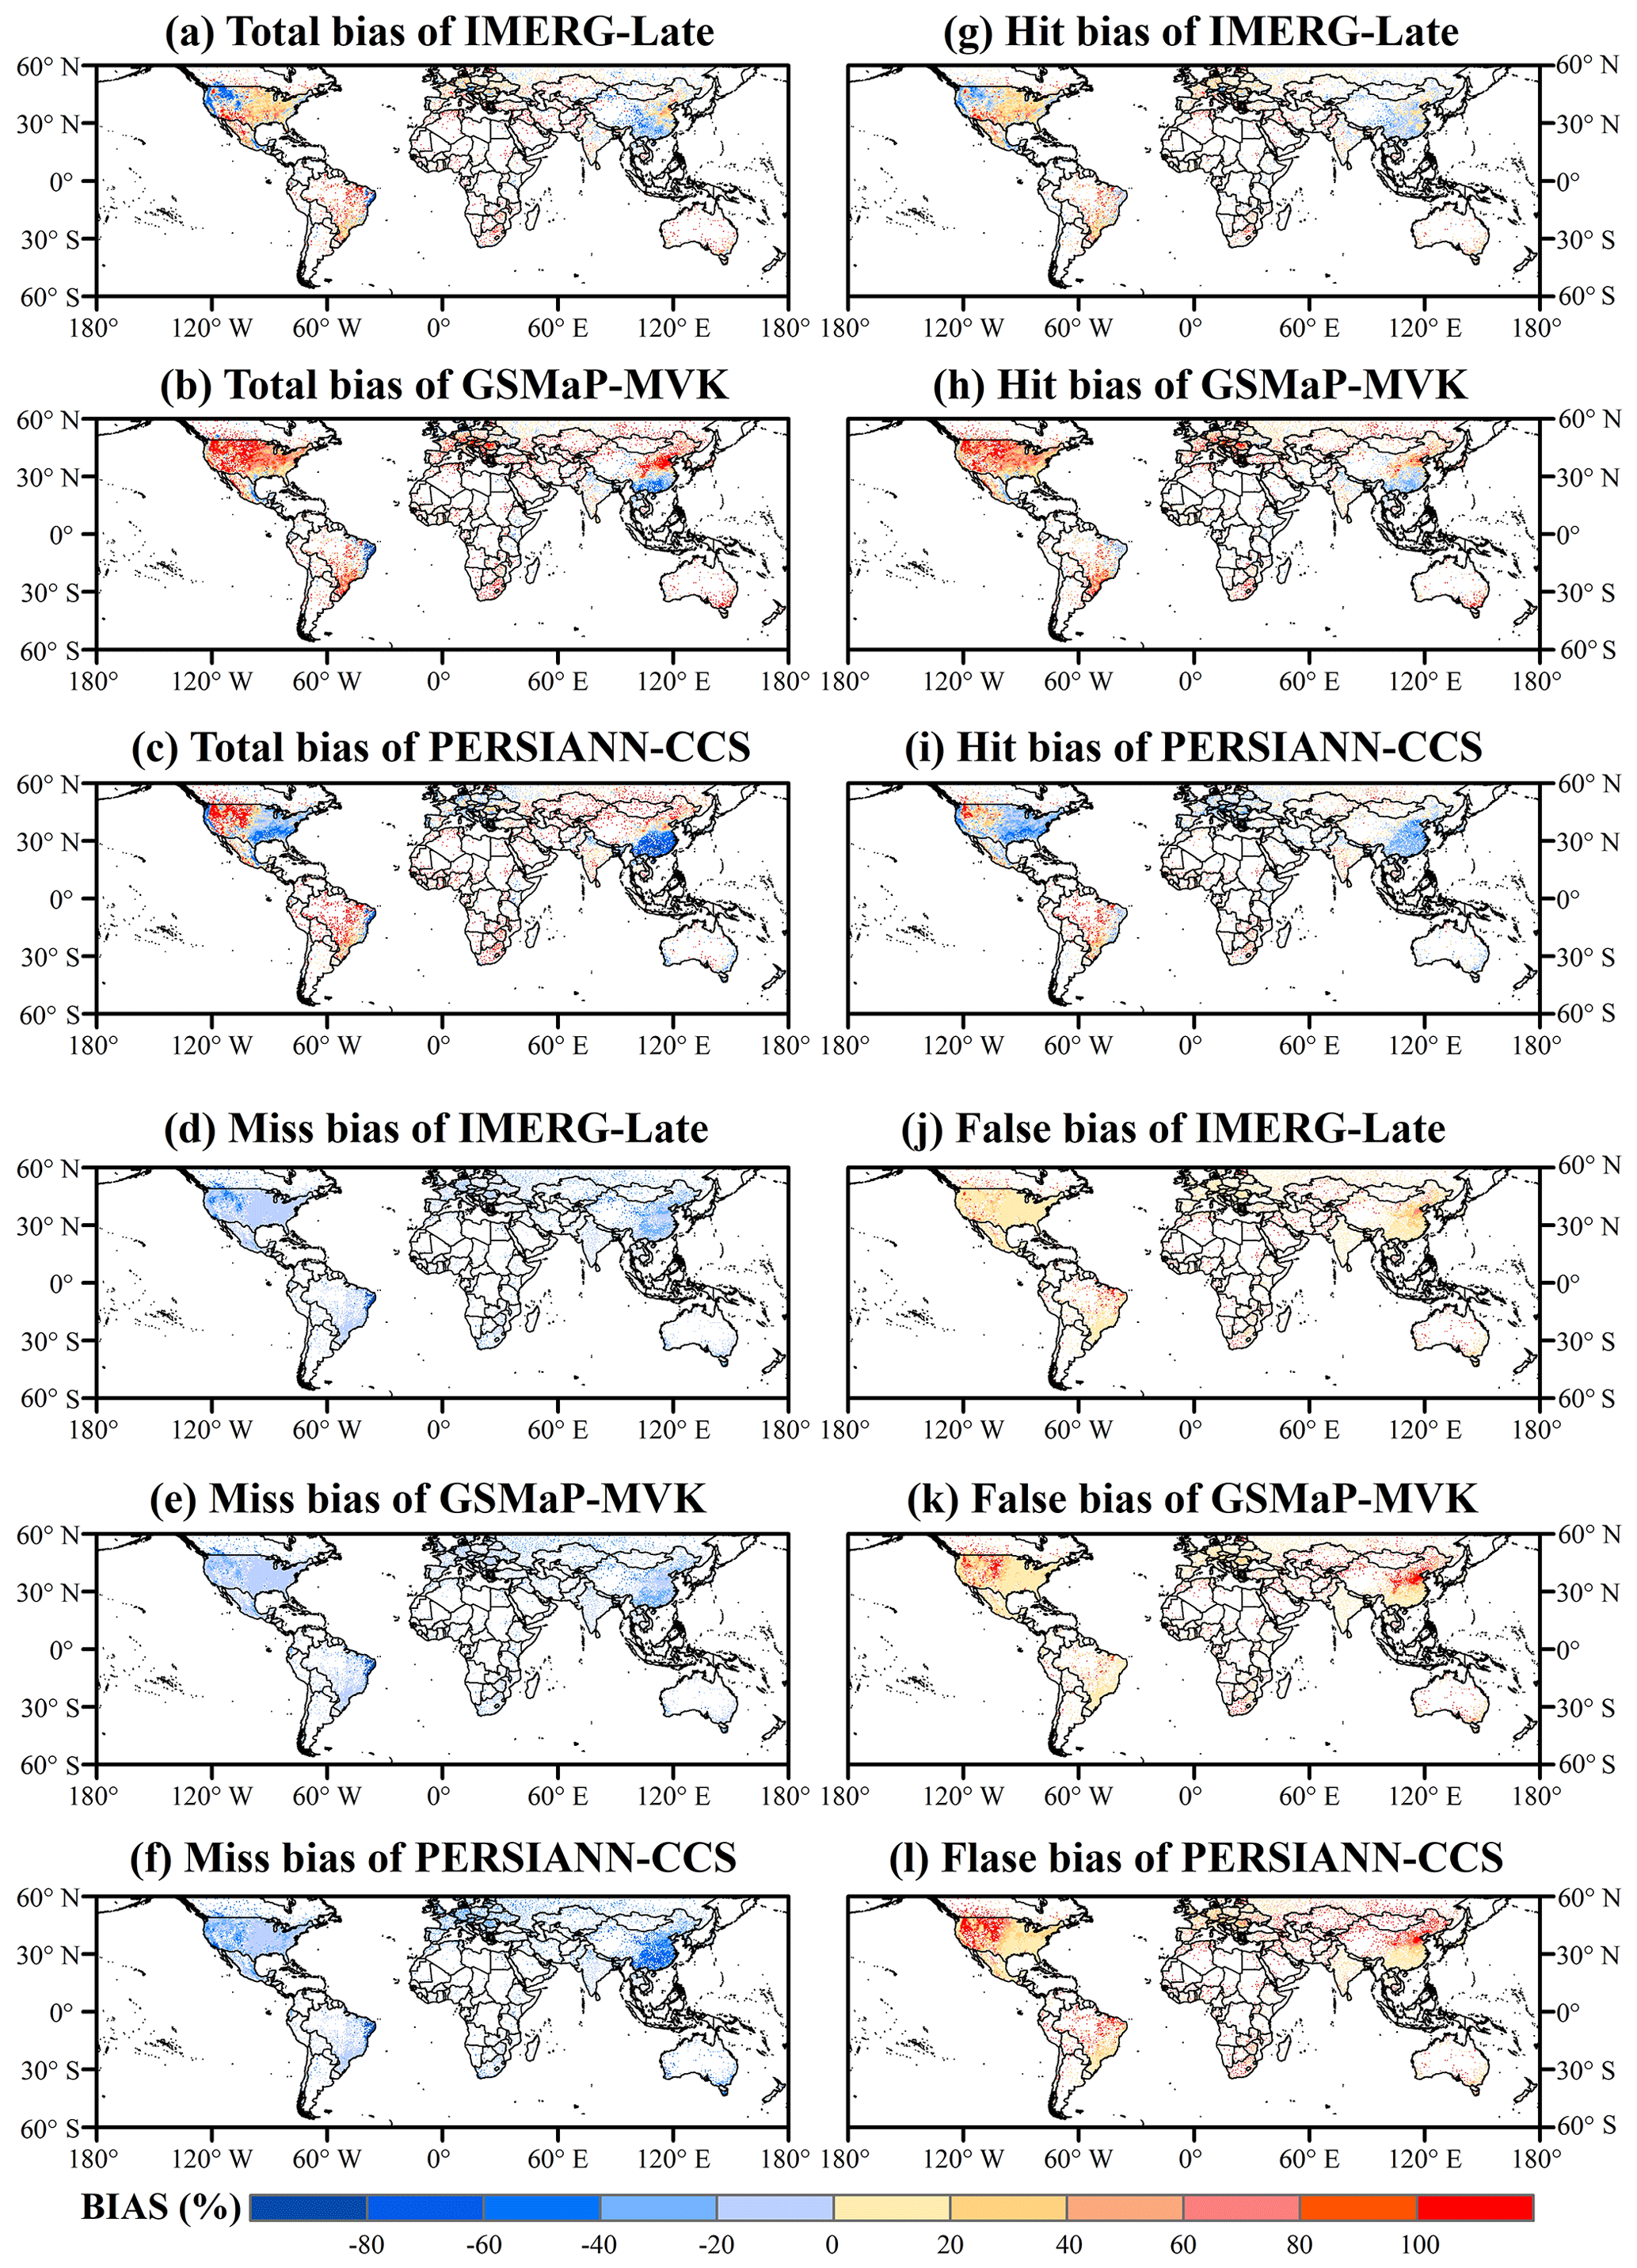
Figure 4Global land maps of the total bias and its three independent components for the three satellite-only global precipitation estimates (i.e., IMERG-Late, GSMaP-MVK, and PERSIANN-CCS) at a spatial resolution of 0.5∘ and daily temporal resolution during the SON season (September–November) for the period from 2015 to 2019 (5 years): (a–c) total bias, (d–f) miss bias, (g–i) hit bias, (j–l) false bias.
As for the SON season (Fig. 4), the SPPs show considerable differences in their error features. Over most regions of CONUS, IMERG displays relatively low overestimation and underestimation. However, GSMaP seriously overestimates the precipitation over CONUS due to its larger hit bias. PERSIANN-CCS overestimates the precipitation in arid and semi-arid regions of CONUS, which is attributed to the hit and false components, while it underestimates the precipitation over southeastern regions due to the hit error component. Over most regions of China, IMERG shows slight underestimation or overestimation. GSMaP and PERSIANN-CCS significantly underestimate the precipitation in humid areas (except for humid regions) due to a larger proportion of missed precipitation, but the also overestimate the precipitation in Chinese other areas due to a large false error component. On the other hand, one feature that all the SPPs have in common is that their total biases are very similar to their hit error components over Mexico, Brazil, Europe, and India, because the missed precipitation and false bias cancel each other out.
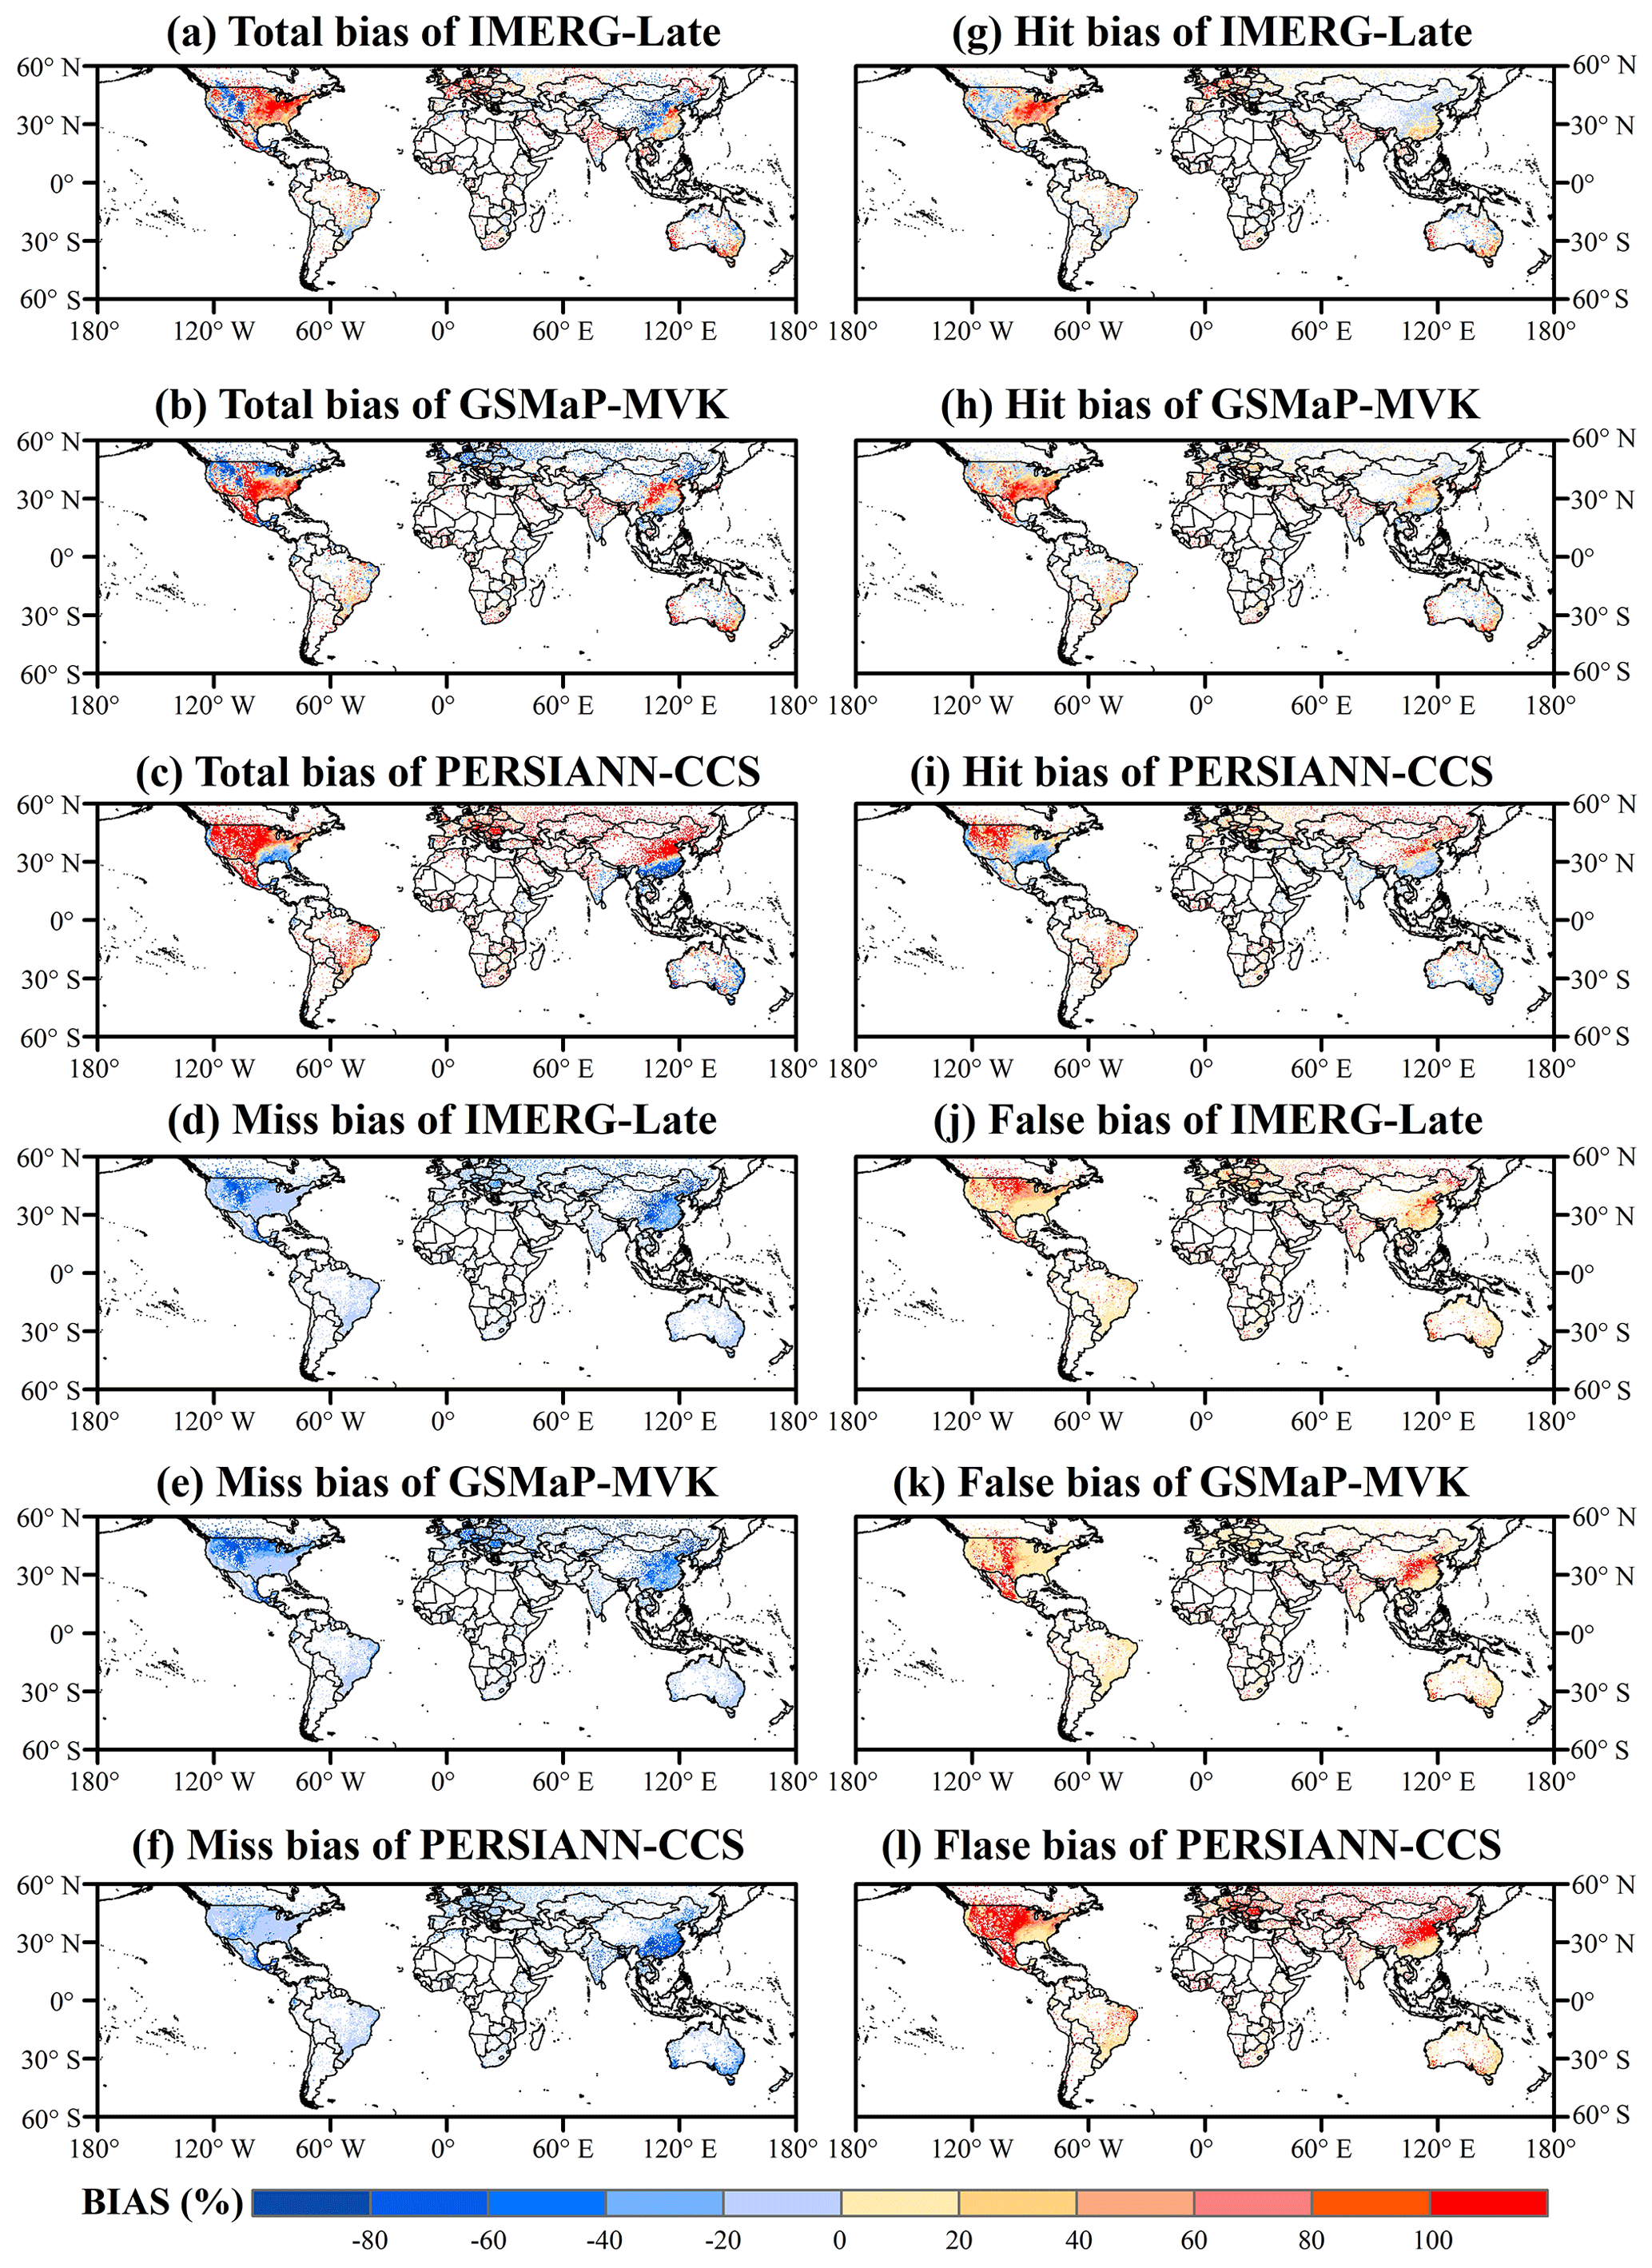
Figure 5Global land maps of the total bias and its three independent components for the three satellite-only global precipitation estimates (i.e., IMERG-Late, GSMaP-MVK, and PERSIANN-CCS) at a spatial resolution of 0.5∘ and daily temporal resolution during the DJF season (December–February) for the period from 2015 to 2019 (5 years): (a–c) total bias, (d–f) miss bias, (g–i) hit bias, (j–l) false bias.
Global maps of the four bias metrics for the three SPPs over the DJF season are shown in Fig. 5. One can notice that the three SPPs display an obvious similarity in error characteristics over Brazil and Australia. Again, their total biases are very similar to their respective hit error components. On the other hand, there are differences between the SPPs in the four bias scores for CONUS, Europe, and China. Differences in the retrieval algorithms and input sources used for the satellite products may explain these differences.
A summary of the total bias and its major error components in each of the three SPPs for the main regions of the world is listed in the supplementary material (Table S1 in the Supplement). Overall, global maps of the total bias and its three independent error components indicate that the hit and/or false error components are the major contributors to the total bias.
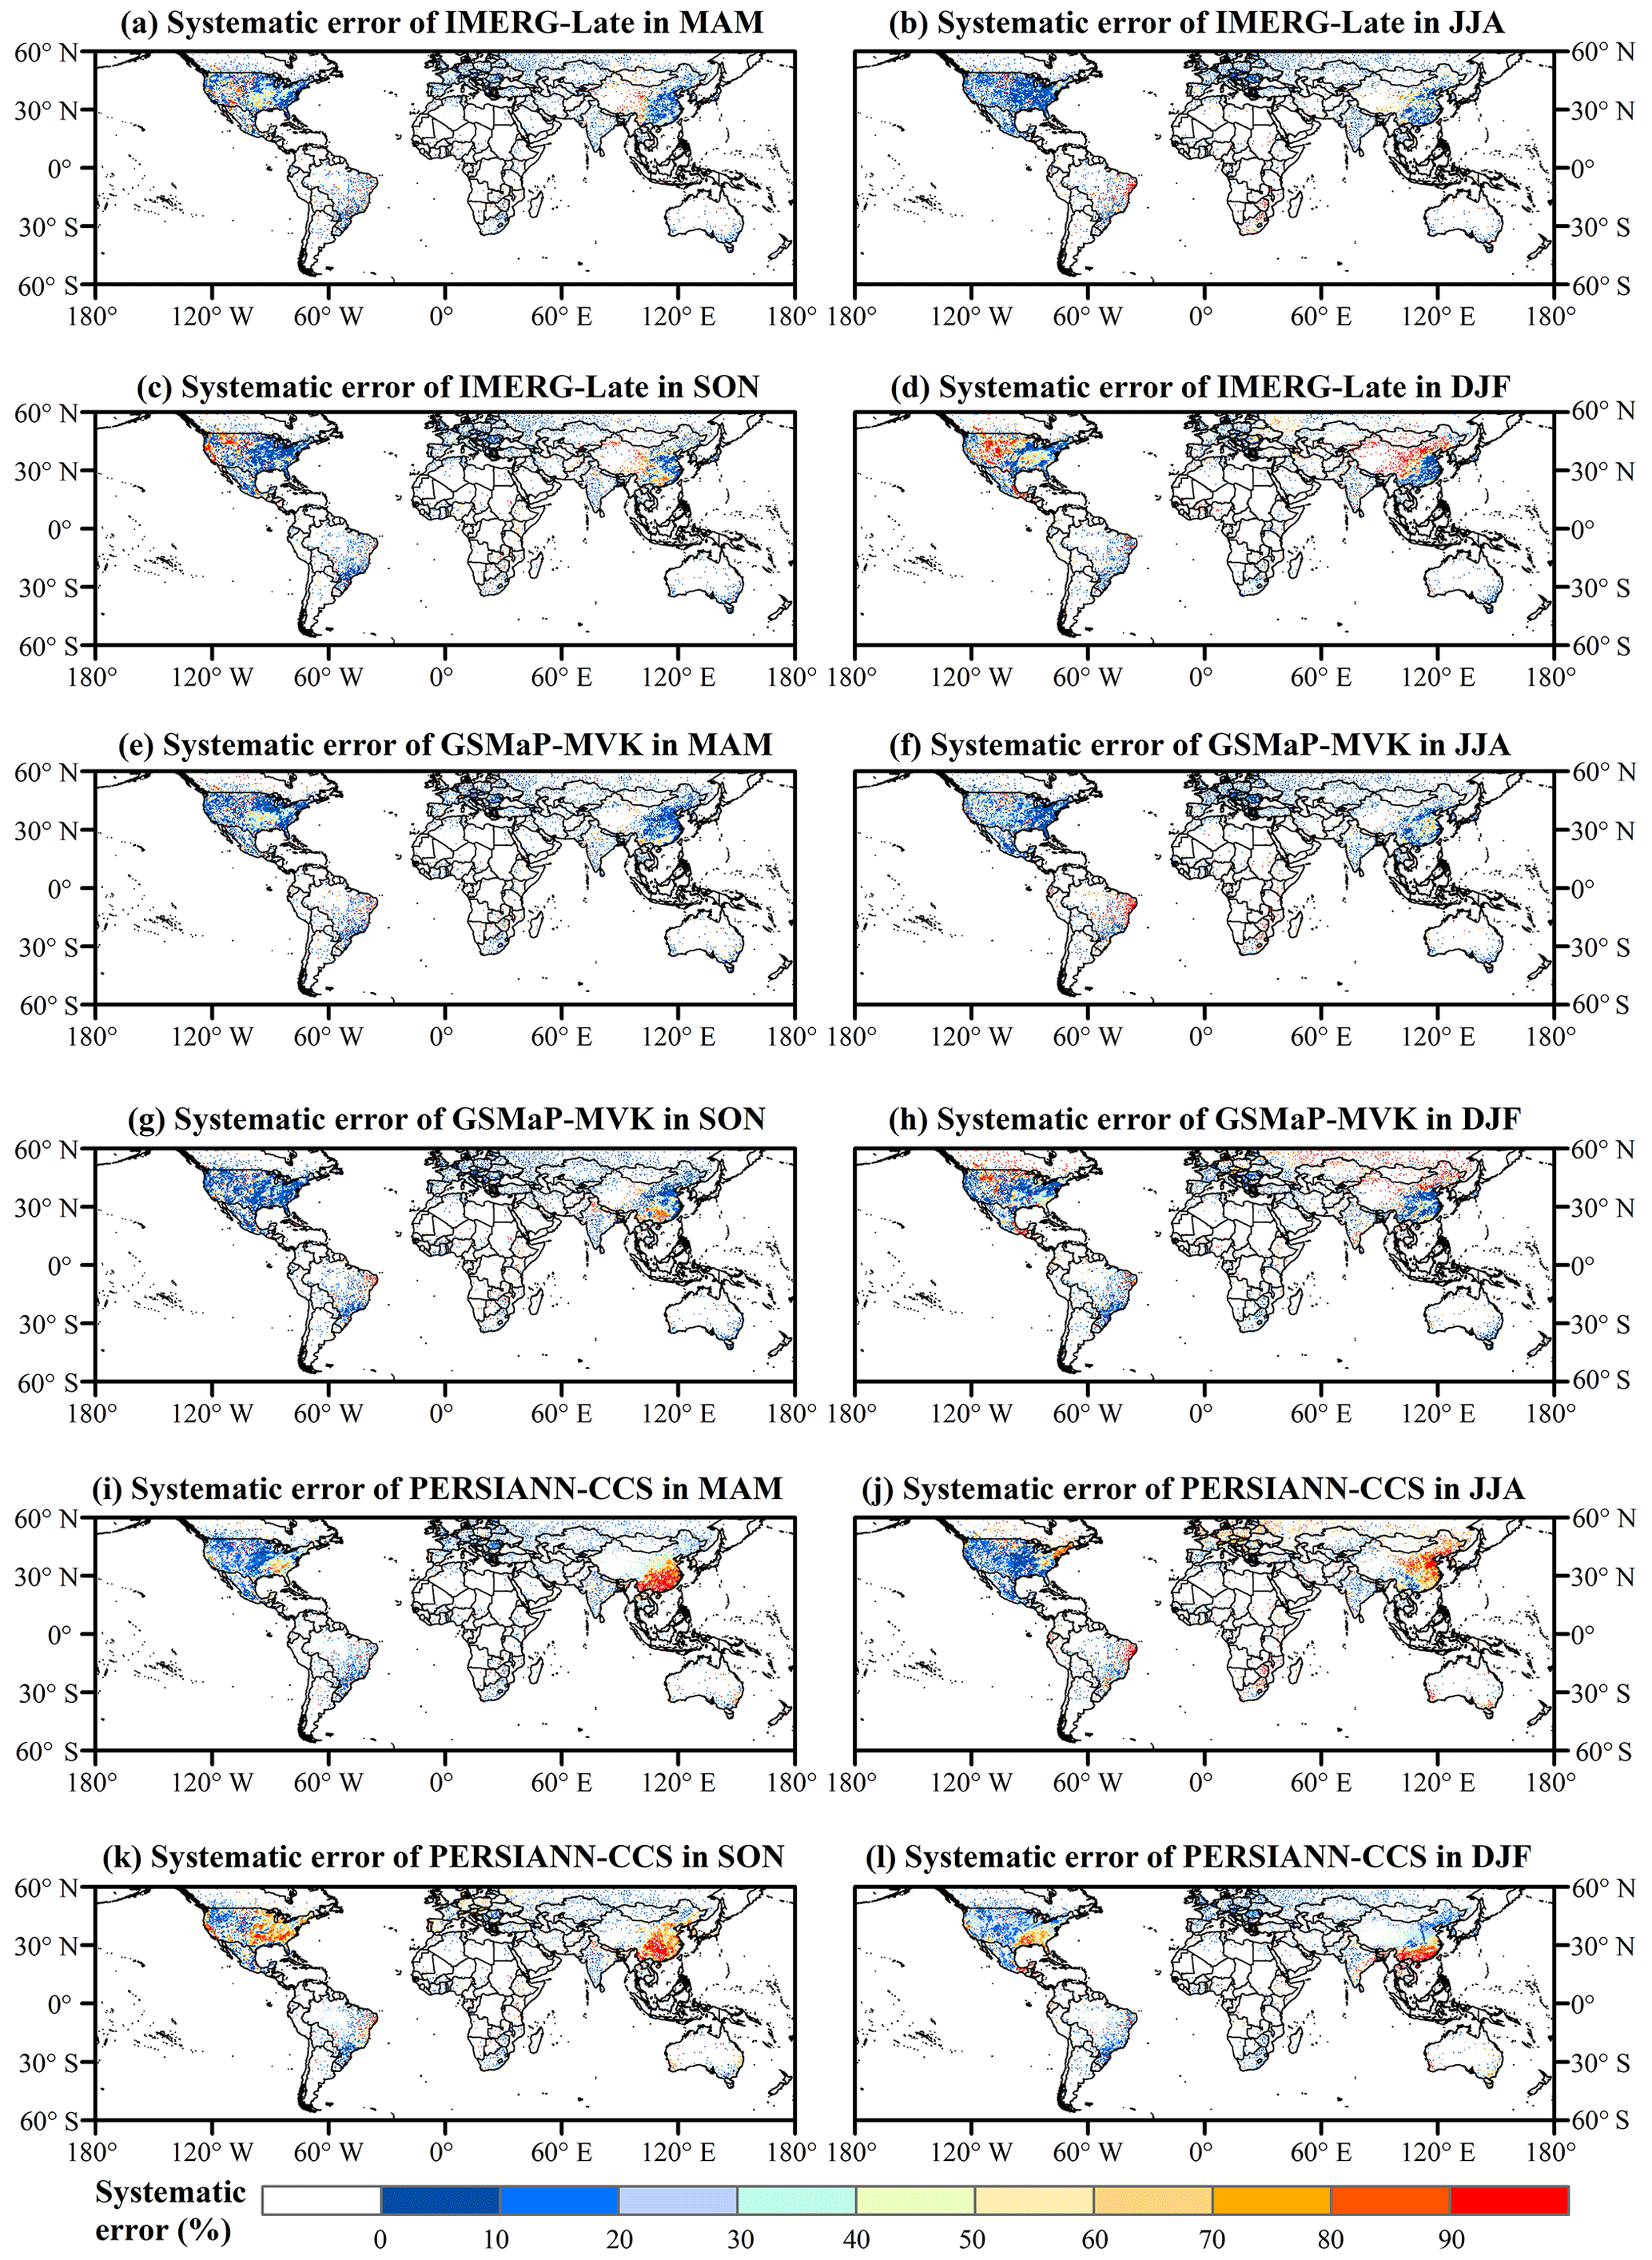
Figure 6Global land maps of systematic error for the three satellite-only global precipitation estimates (i.e., IMERG-Late, GSMaP-MVK, and PERSIANN-CCS) at a spatial resolution of 0.5∘ and daily temporal resolution over the four seasons (i.e., MAM, JJA, SON, and DJF) for the period from 2015 to 2019 (5 years): (a–d) IMERG-Late, (e–h) GSMaP-MVK, (i–l) PERSIANN-CCS.
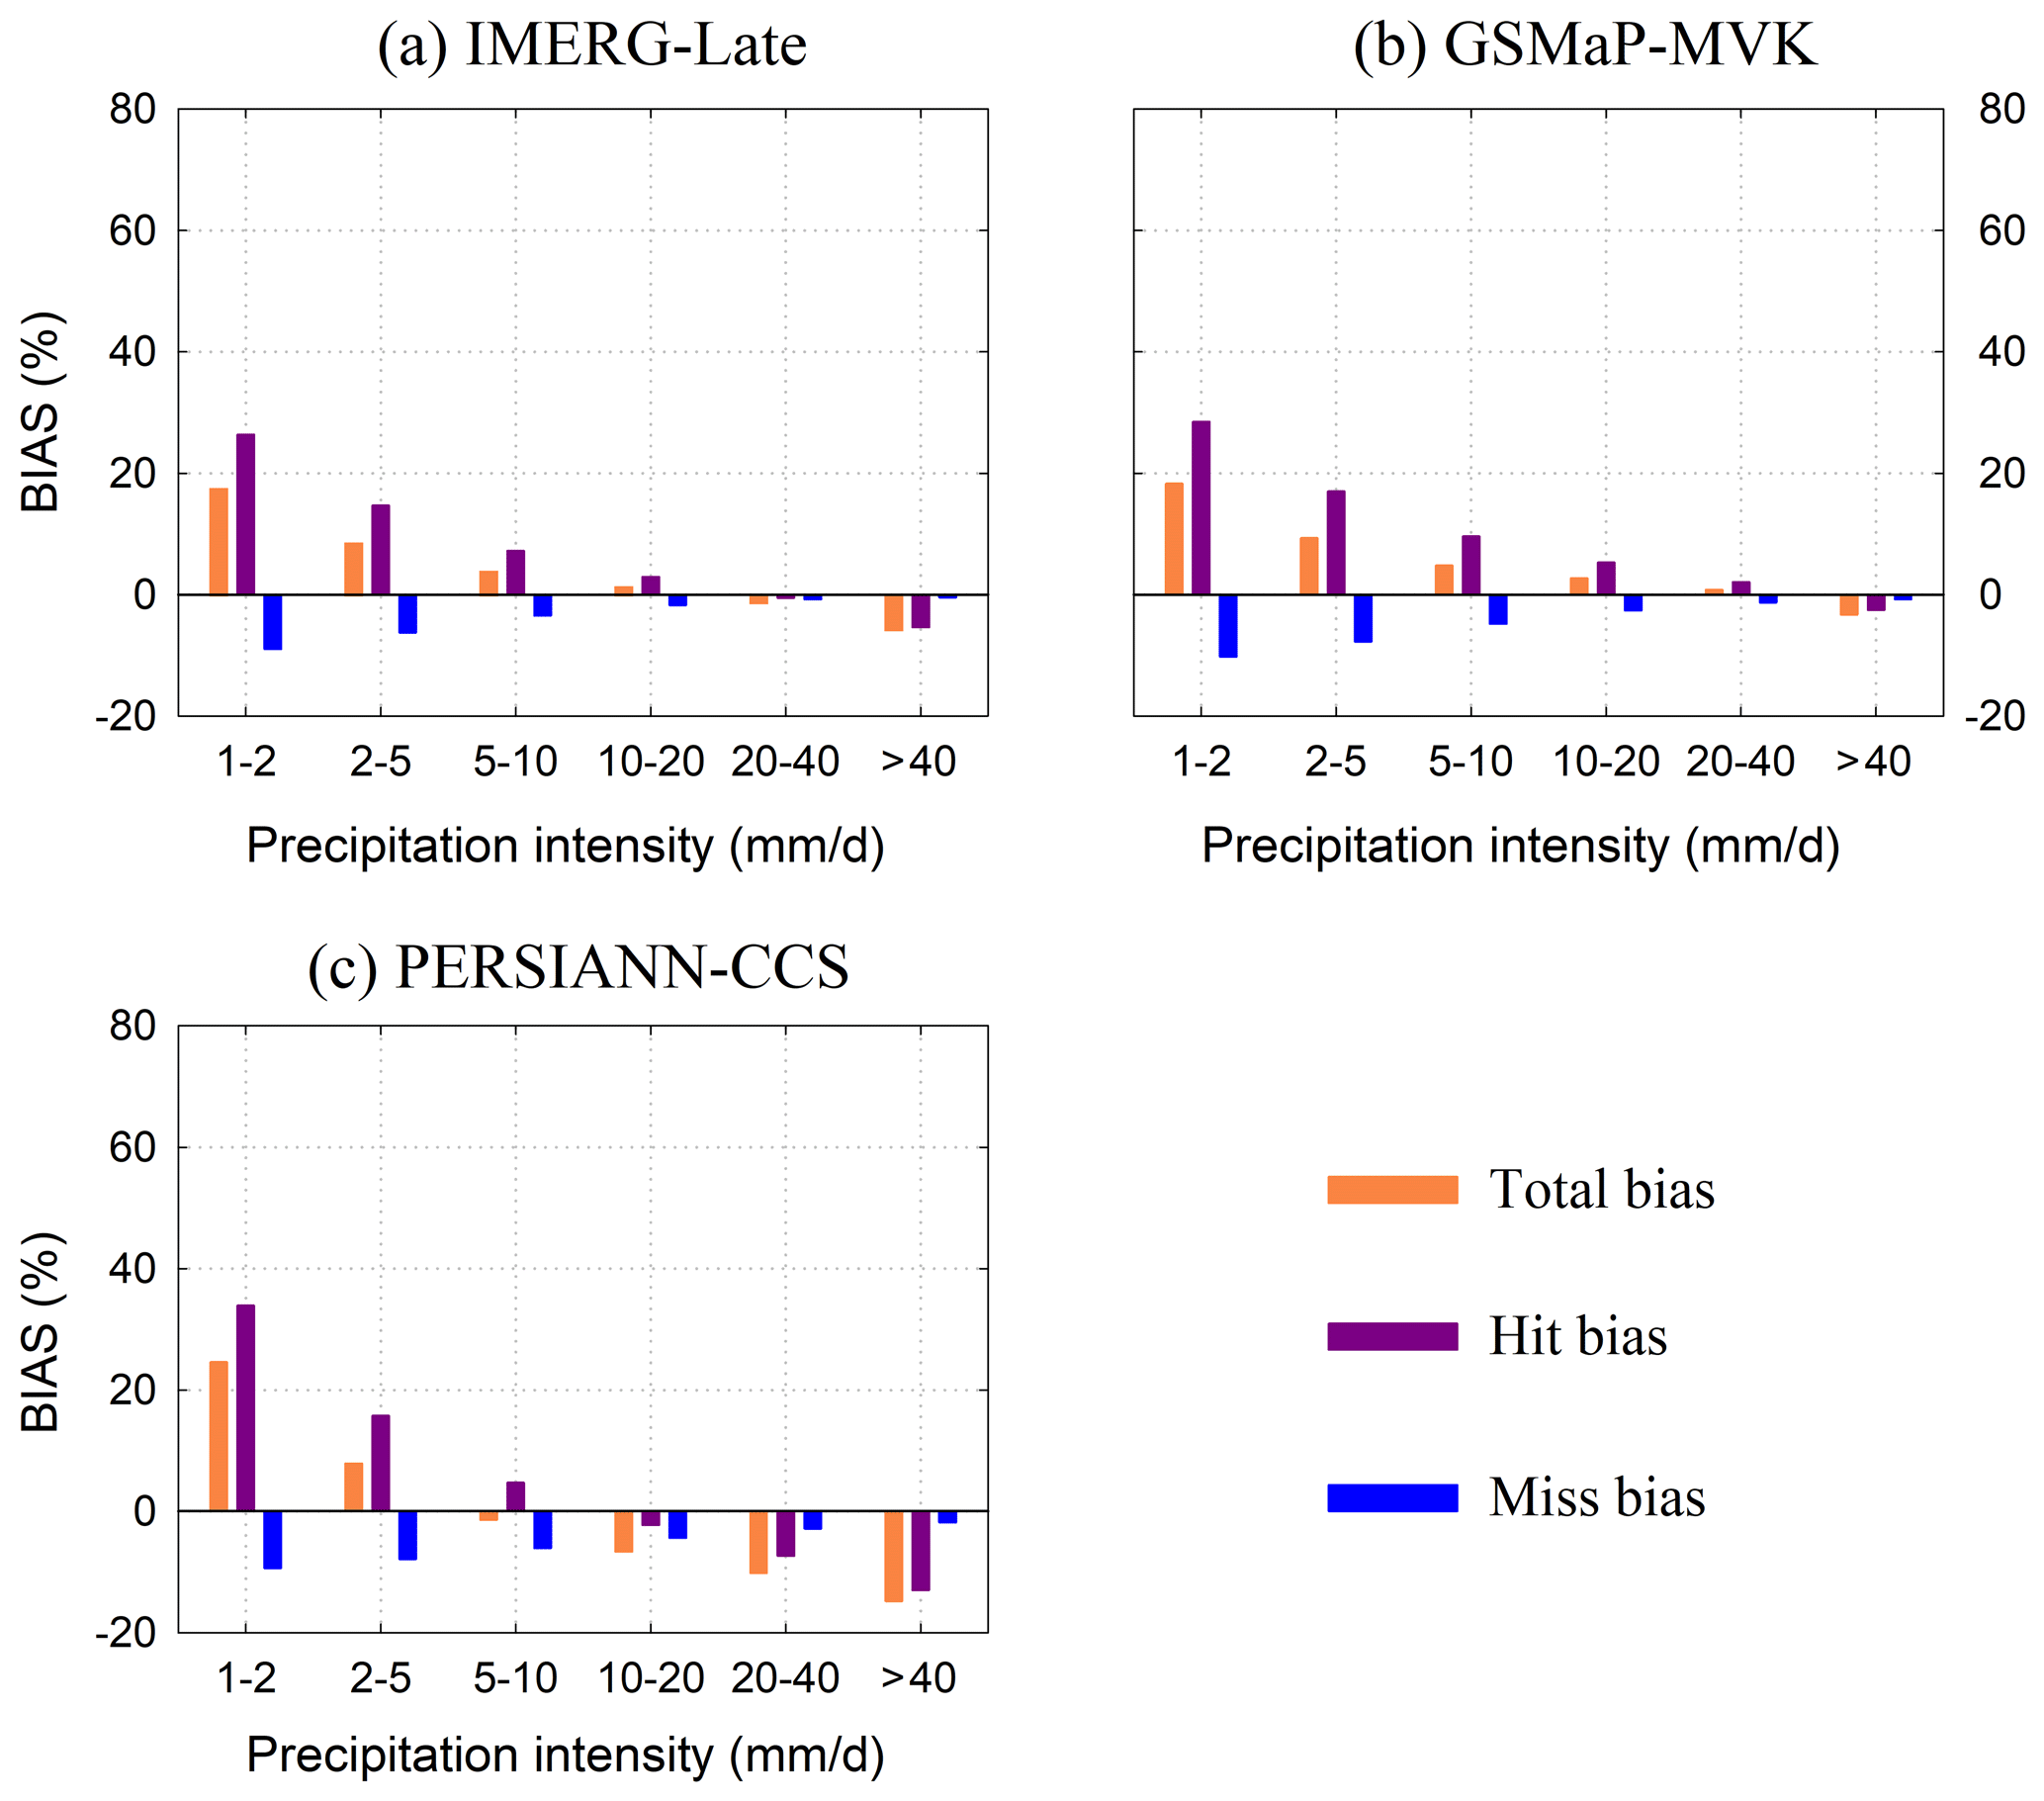
Figure 7The three bias scores (i.e., total bias, hit bias, and miss bias) for the three satellite-only global precipitation estimates (i.e., IMERGLate, GSMaP-MVK, and PERSIANN-CCS) at a spatial resolution of 0.5∘ and daily temporal resolution under different rainfall intensities. Note that the precipitation intensity categories are from references: (a) IMERG-Late, (b) GSMaP-MVK, (c) PERSIANN-CCS.
3.1.2 Spatial analysis of the systematic error over different seasons
The global maps of systematic error per season for the three SPPs show considerable similarities for most land areas. The systematic error is less than 20 % of the total mean squared error, as shown in Fig. 6. This means that random error is the leading error component of the total mean squared error in most regions. As discussed in the previous section, the SPPs show an evident seasonal dependency in several regions, such as CONUS, China, and Russia. IMERG has relatively large systematic errors (exceeding 80 %) in the semi-humid and semi-arid regions of CONUS during DJF. Similarly, the systematic errors of IMERG are very large (over 90 %) over mainland China (except for humid regions) during DJF. For GSMaP, the seasonal variations mainly occur in mainland China and Russia. Systematic errors are larger in DJF than in other seasons over Russia. Meanwhile, it cannot be ignored that GSMaP exhibits large proportions of systematic error during SON in southwest China. Finally, the systematic error of PERSIANN-CCS displays an obvious seasonality in mainland China, Europe, and eastern CONUS, and it is relatively large over mainland China.
3.2 Dependence of error components on the precipitation intensity
The three bias scores (i.e., total bias, hit bias, and miss bias) of the three SPPs are shown in Fig. 7 for different rainfall intensities. Note that the false error component does not exist because the reference precipitation is positive. In general, the SPPs show a high degree of consistency in the three bias scores for different precipitation intensity classes. The hit bias is the major error component in most classes.
The systematic errors of the three SPPs with six rainfall intensities are depicted in Fig. 8. Each SPP shows a unique variation in systematic error with increasing precipitation intensity. One can see that IMERG and GSMaP have less systematic error (close to 0 %) than PERSIANN-CCS for intensities of less than 40 mm d−1. In contrast, the systematic error of PERSIANN-CCS shows a strong and increasing relation with rainfall intensity. Additionally, all the SPPs have relatively large proportions of systematic error and underestimate the precipitation volume in rainfall events with intensities of over 40 mm d−1 (see Fig. 7). This underestimation for heavy rainfall events certainly results in large systematic errors.
3.3 Error components for different topographies
In this section, the analysis is performed at a finer spatiotemporal resolution (0.1∘, hourly). Additionally, the humid regions of mainland China during JJA are chosen to explore the major components of the total bias and total mean squared error in different topography categories in order to exclude interference from other factors (e.g., climate and season). Observations from 25 982 rain gauges are used as the benchmark to ensure the reliability of the error results (Chen et al., 2020a). The number of gauges in each topography category is displayed in Fig. 9.
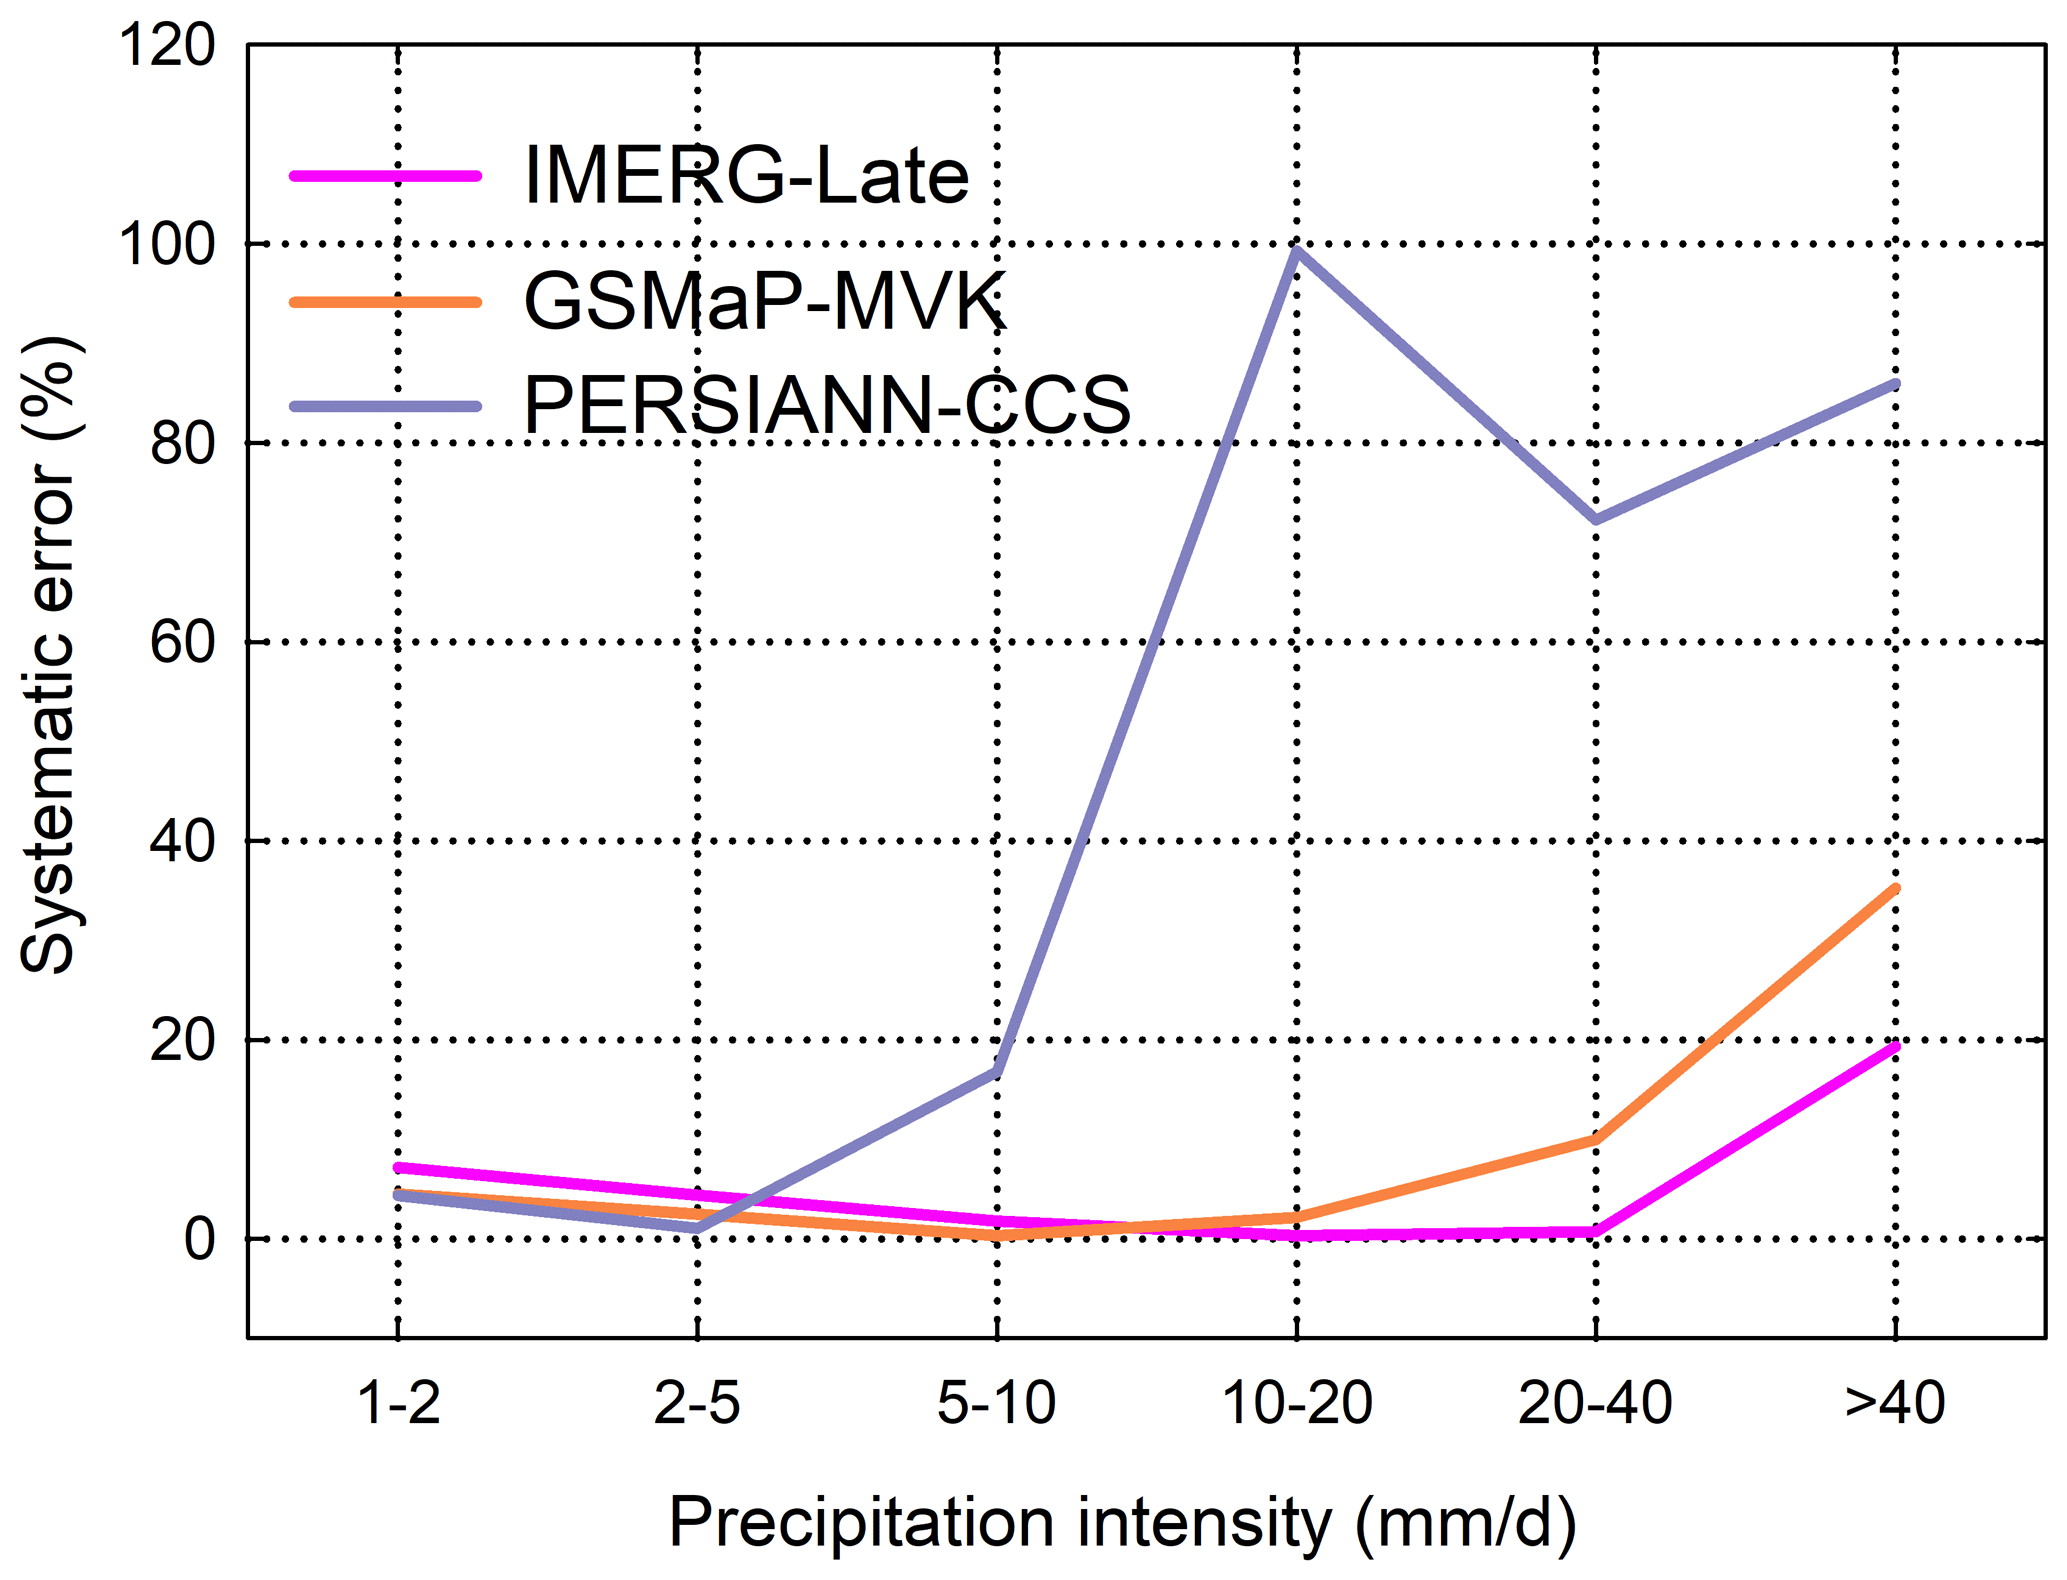
Figure 8Systematic errors of the three satellite-only global precipitation estimates (i.e., IMERG-Late, GSMaP-MVK, and PERSIANN-CCS) at a spatial resolution of 0.5∘ and daily temporal resolution under different rainfall intensities. Note that the precipitation intensity categories are from references.
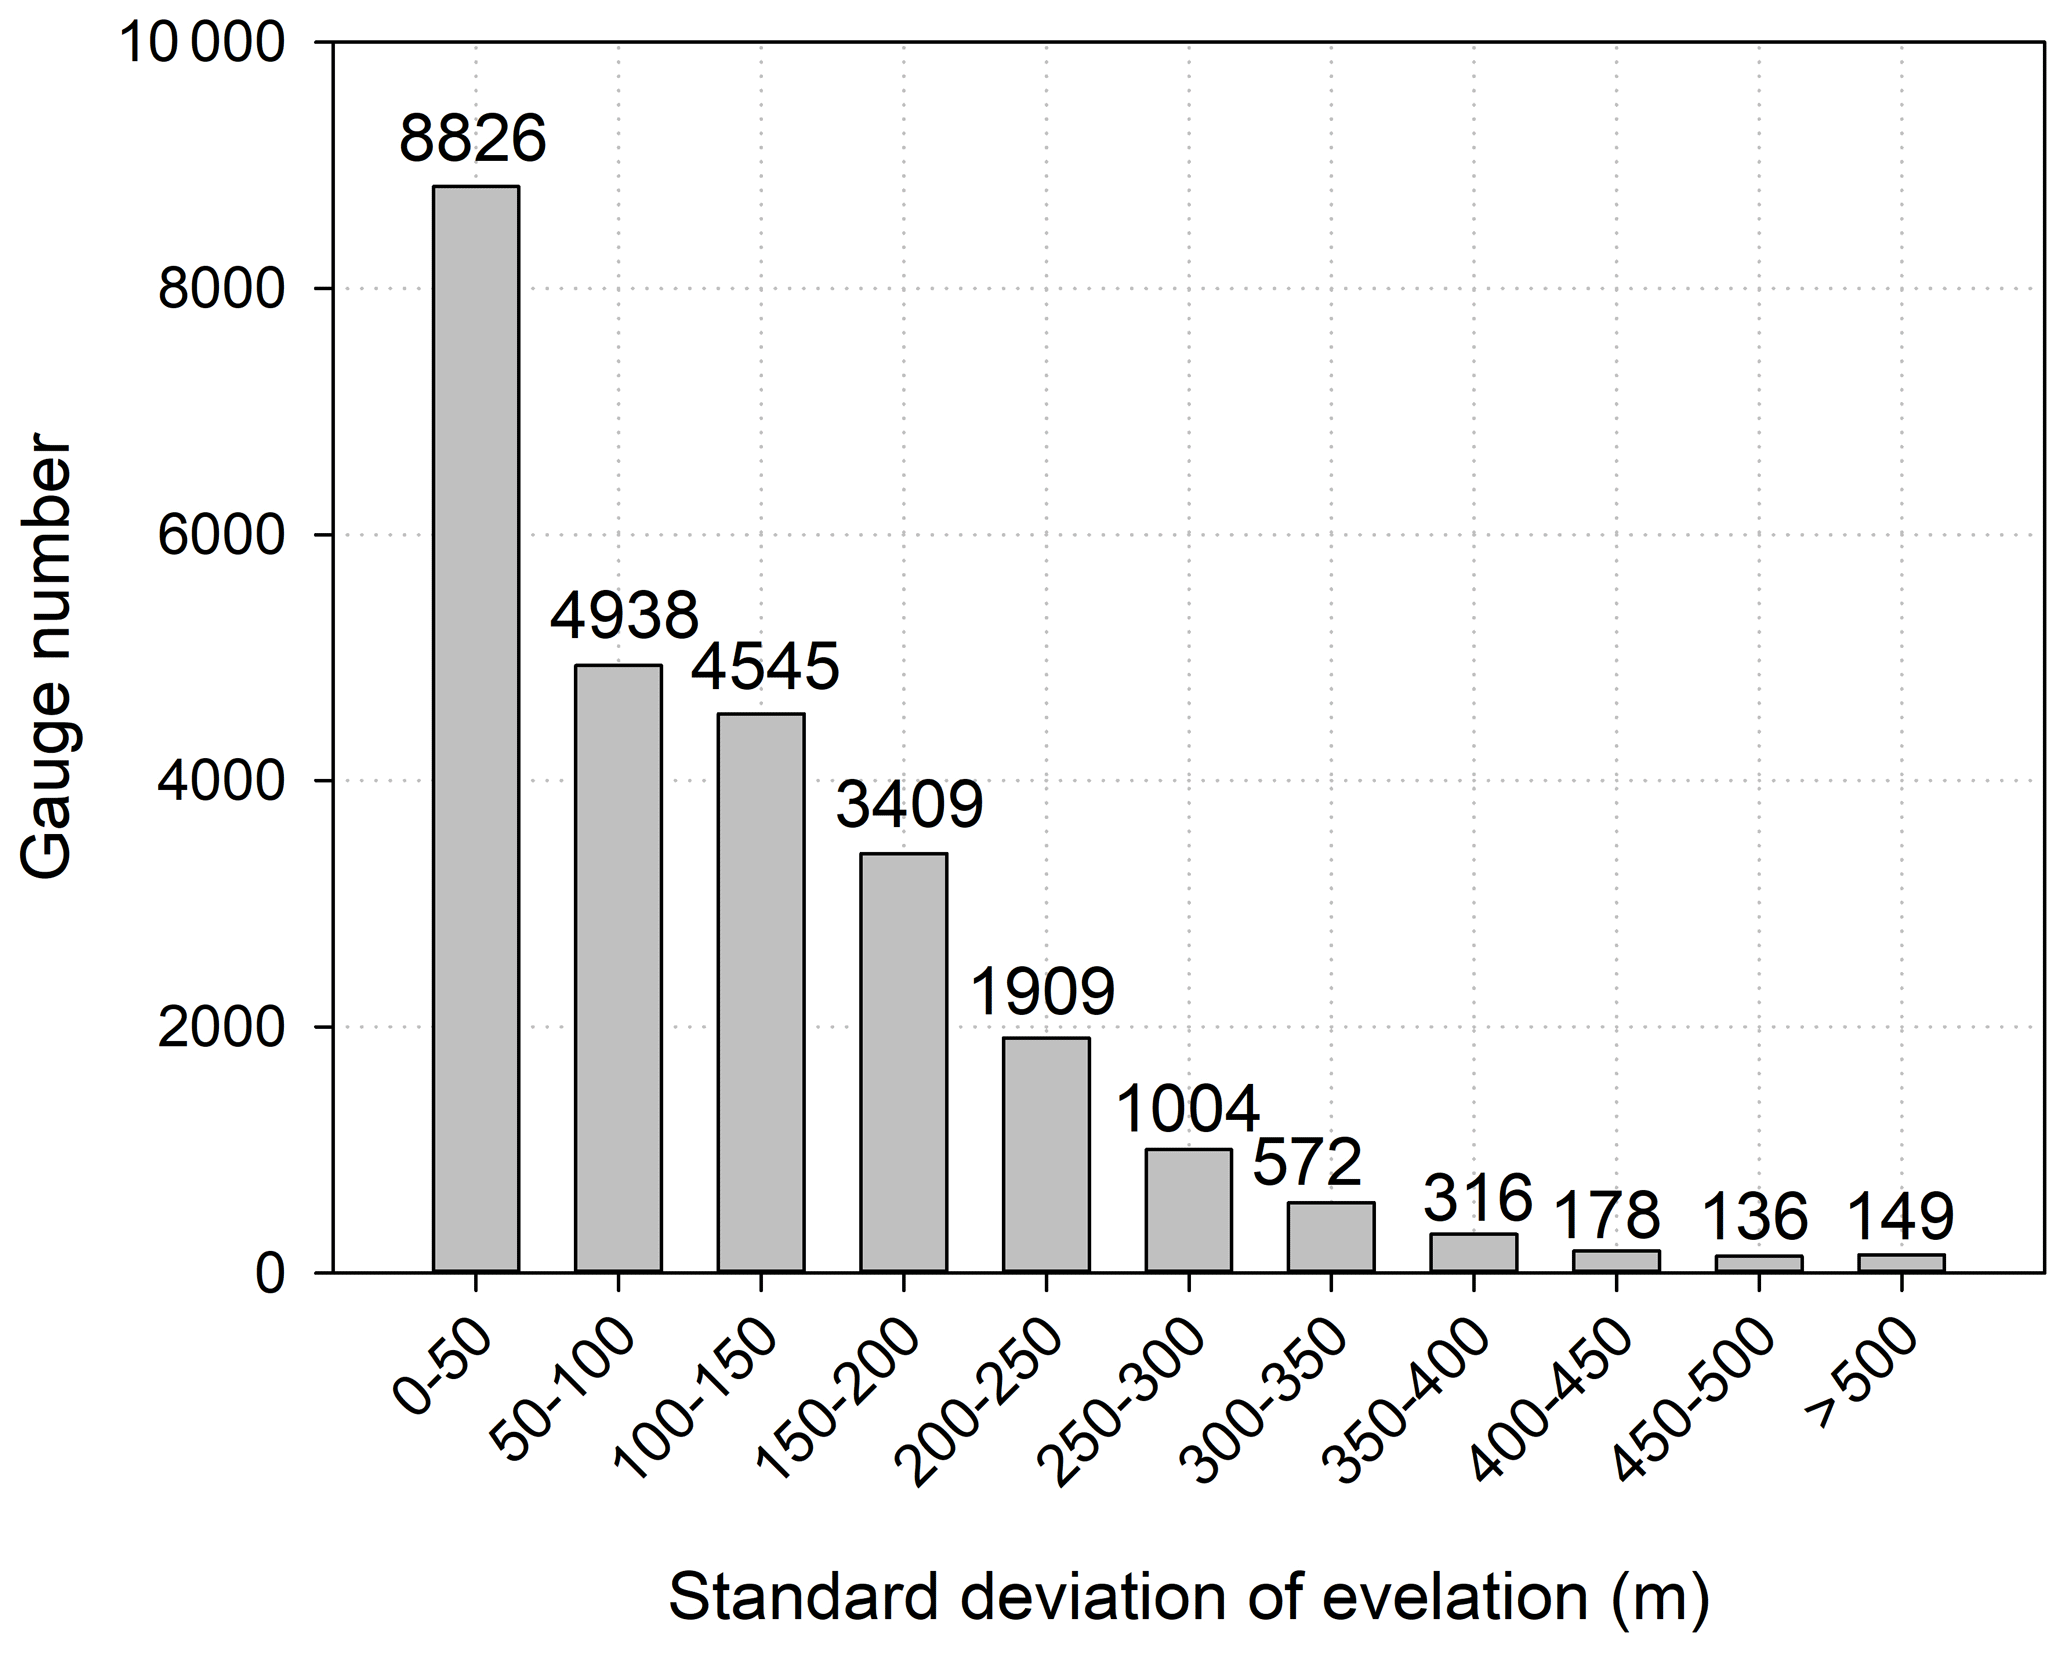
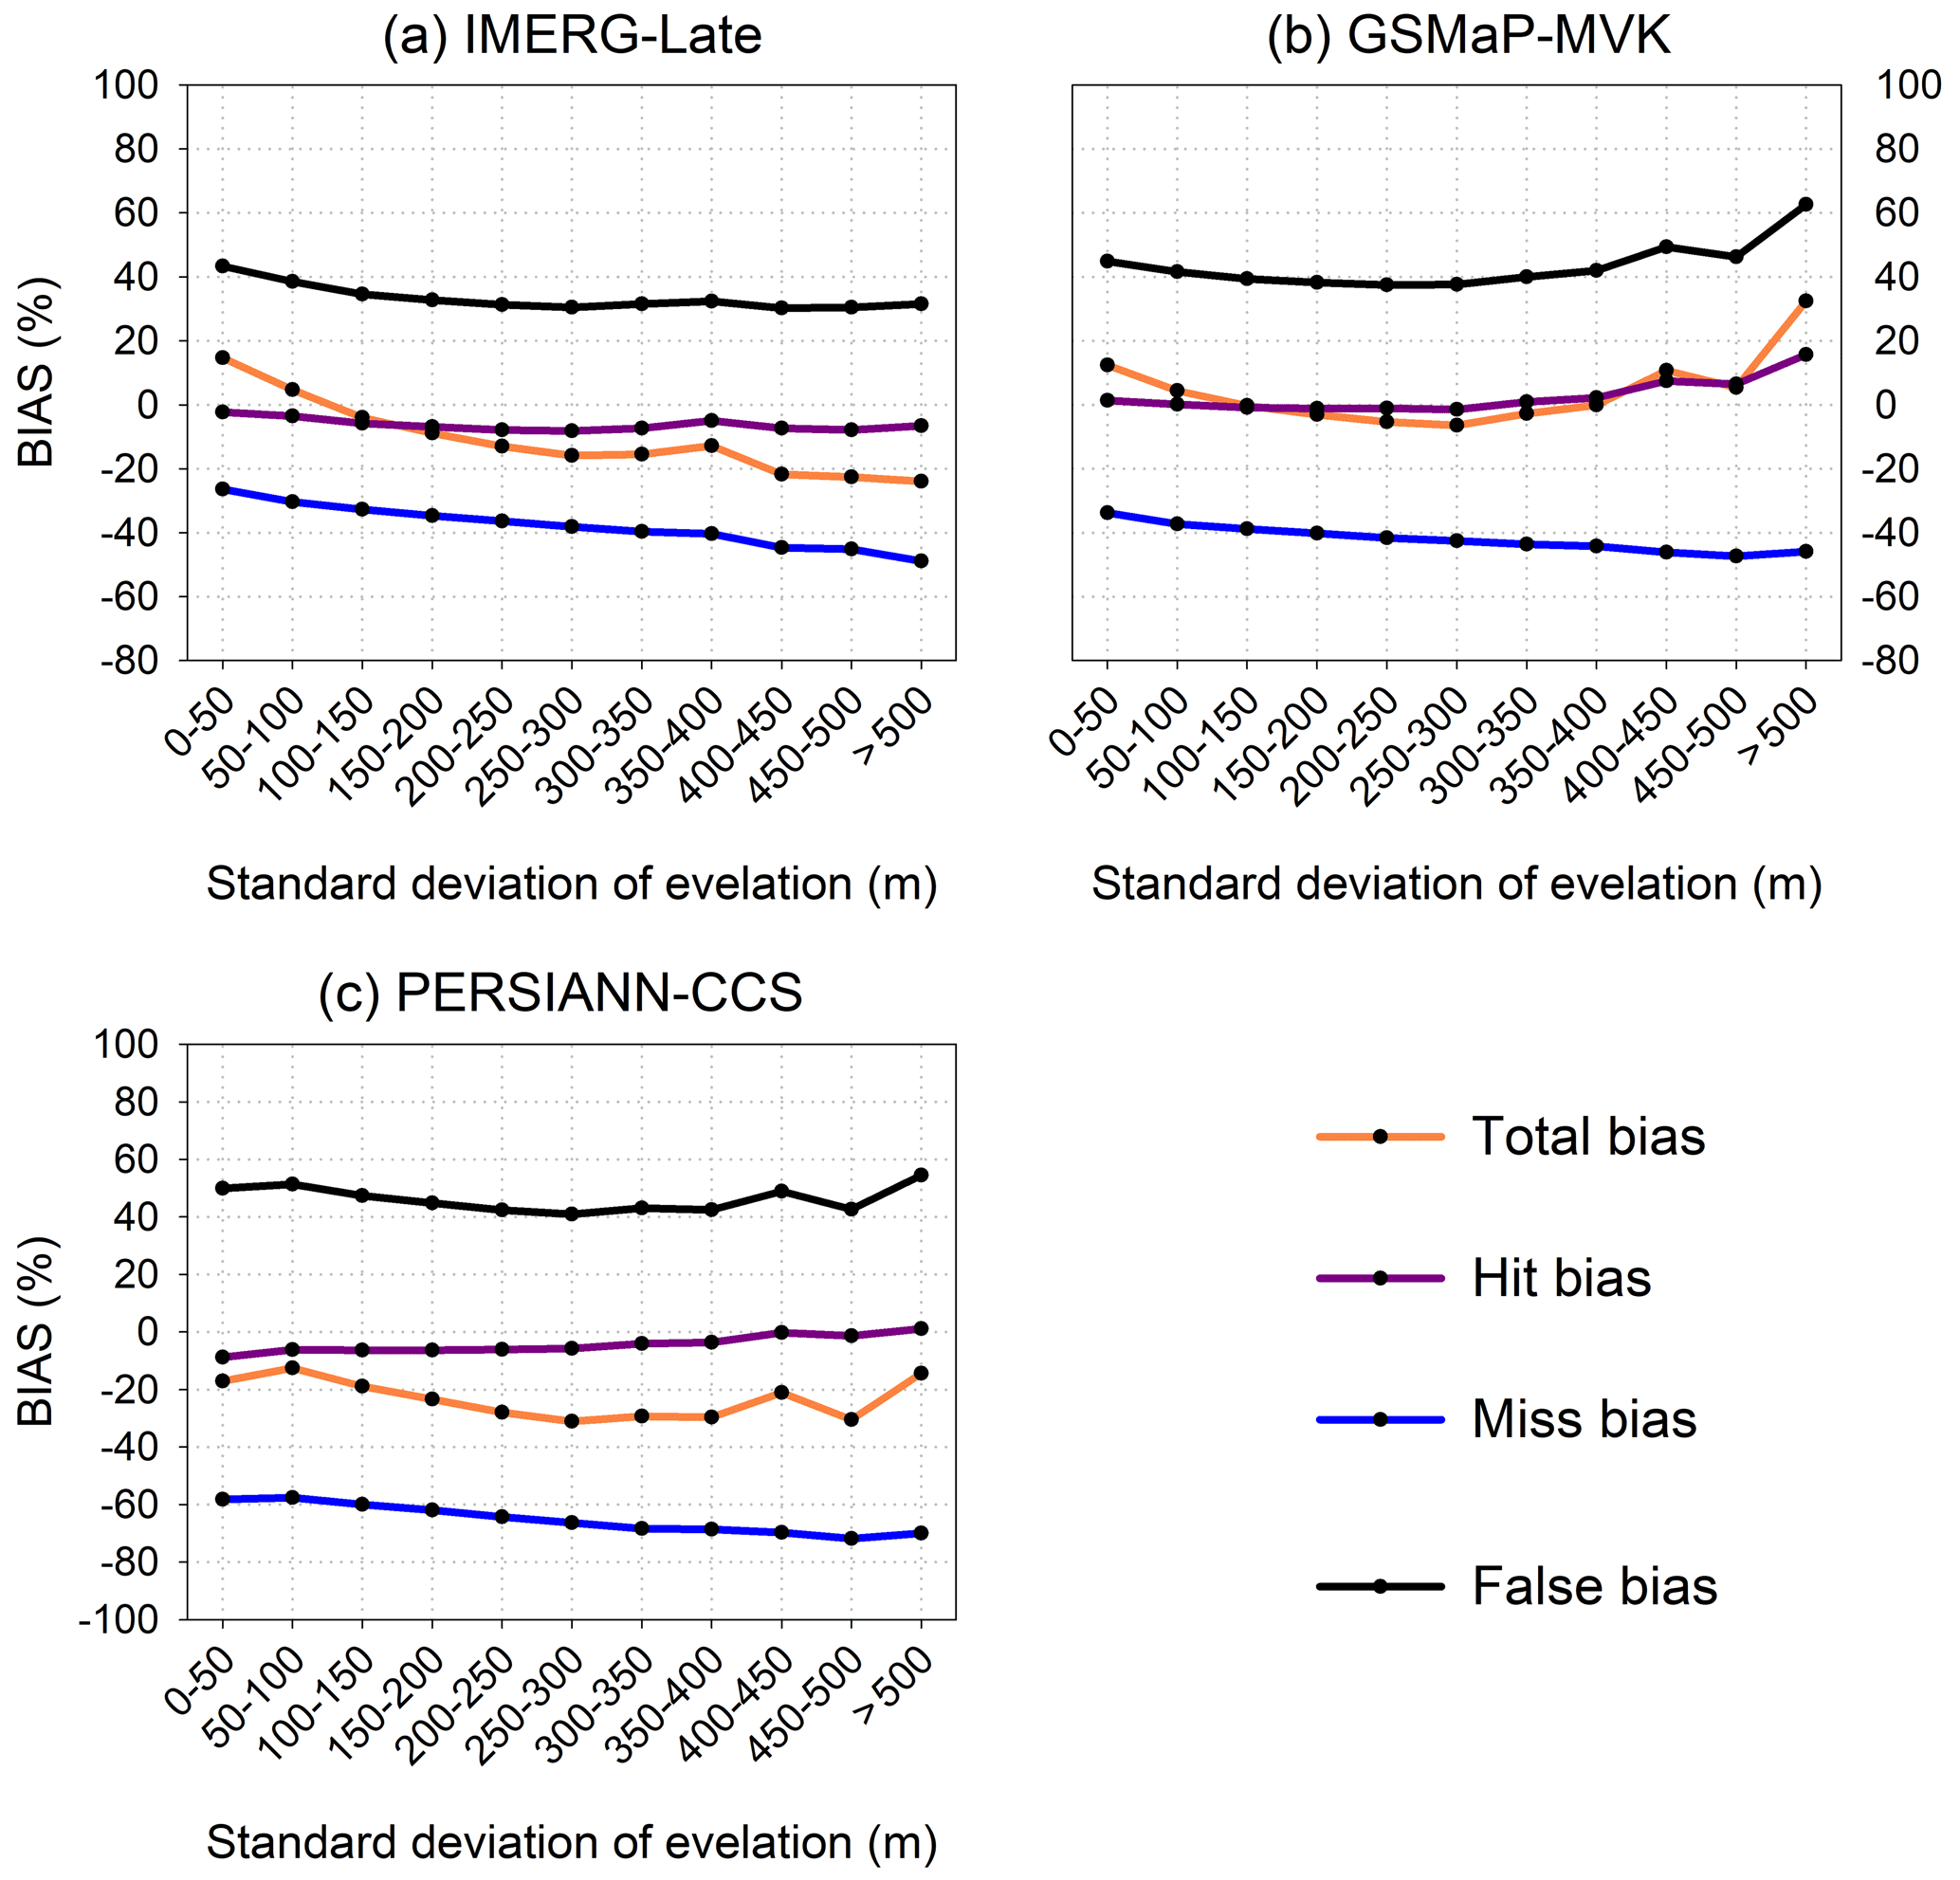
Figure 10The four bias scores (i.e., total bias, hit bias, miss bias, and false bias) of the three satellite-only global precipitation estimates (i.e., IMERG-Late, GSMaP-MVK, and PERSIANN-CCS) for different terrains. Note that the analysis was executed at a spatial resolution of 0.1∘ and hourly temporal resolution in the humid regions of mainland China over the JJA (summer) season for the period from 2015 to 2019 (5 years): (a) IMERG-Late, (b) GSMaP-MVK, (c) PERSIANN-CCS.
The four bias metrics are shown in Fig. 10 for different terrain classes. The SPPs show similarities in the variations of the four bias scores with terrain. The miss biases decrease with increasing SDE. Also, the miss (false) bias is the main contributor to the underestimation (overestimation) of the precipitation. SPP performance is influenced by the topography to different extents for different SPPs. Among the SPPs, the four bias metrics of GSMaP-MVK display the strongest topographic dependency, especially in terms of the false and hit error components. A possible explanation for this is that the orographic/nonorographic rainfall classification scheme used in the GSMaP retrieval tends to overestimate precipitation in hit orographic rainfall events and is affected by false positives for orographic rainfall (Yamamoto and Shige, 2015).
Figure 11a shows the systematic error proportions for the three SPPs in 11 terrain SDE categories. The systematic errors of all SPPs are strongly dependent on the topography, although the SPPs exhibit distinct dependency patterns. For IMERG-Late, the proportion of systematic error increases with the SDE. GSMaP-MVK and PERSIANN-CCS display similar trends in that the proportion of systematic error increases with the topographic complexity when the SDE is below 300 m but decreases with the topographic complexity when the SDE is above 300 m. Compared to the other SPPs, PERSIANN-CCS has larger systematic errors in all topographic categories. Nevertheless, the results shown in Fig. 11a may be influenced by the rainfall intensity, making it challenging to draw any inference about the influence of the topography. This issue is investigated in depth in Sect. 4.2.
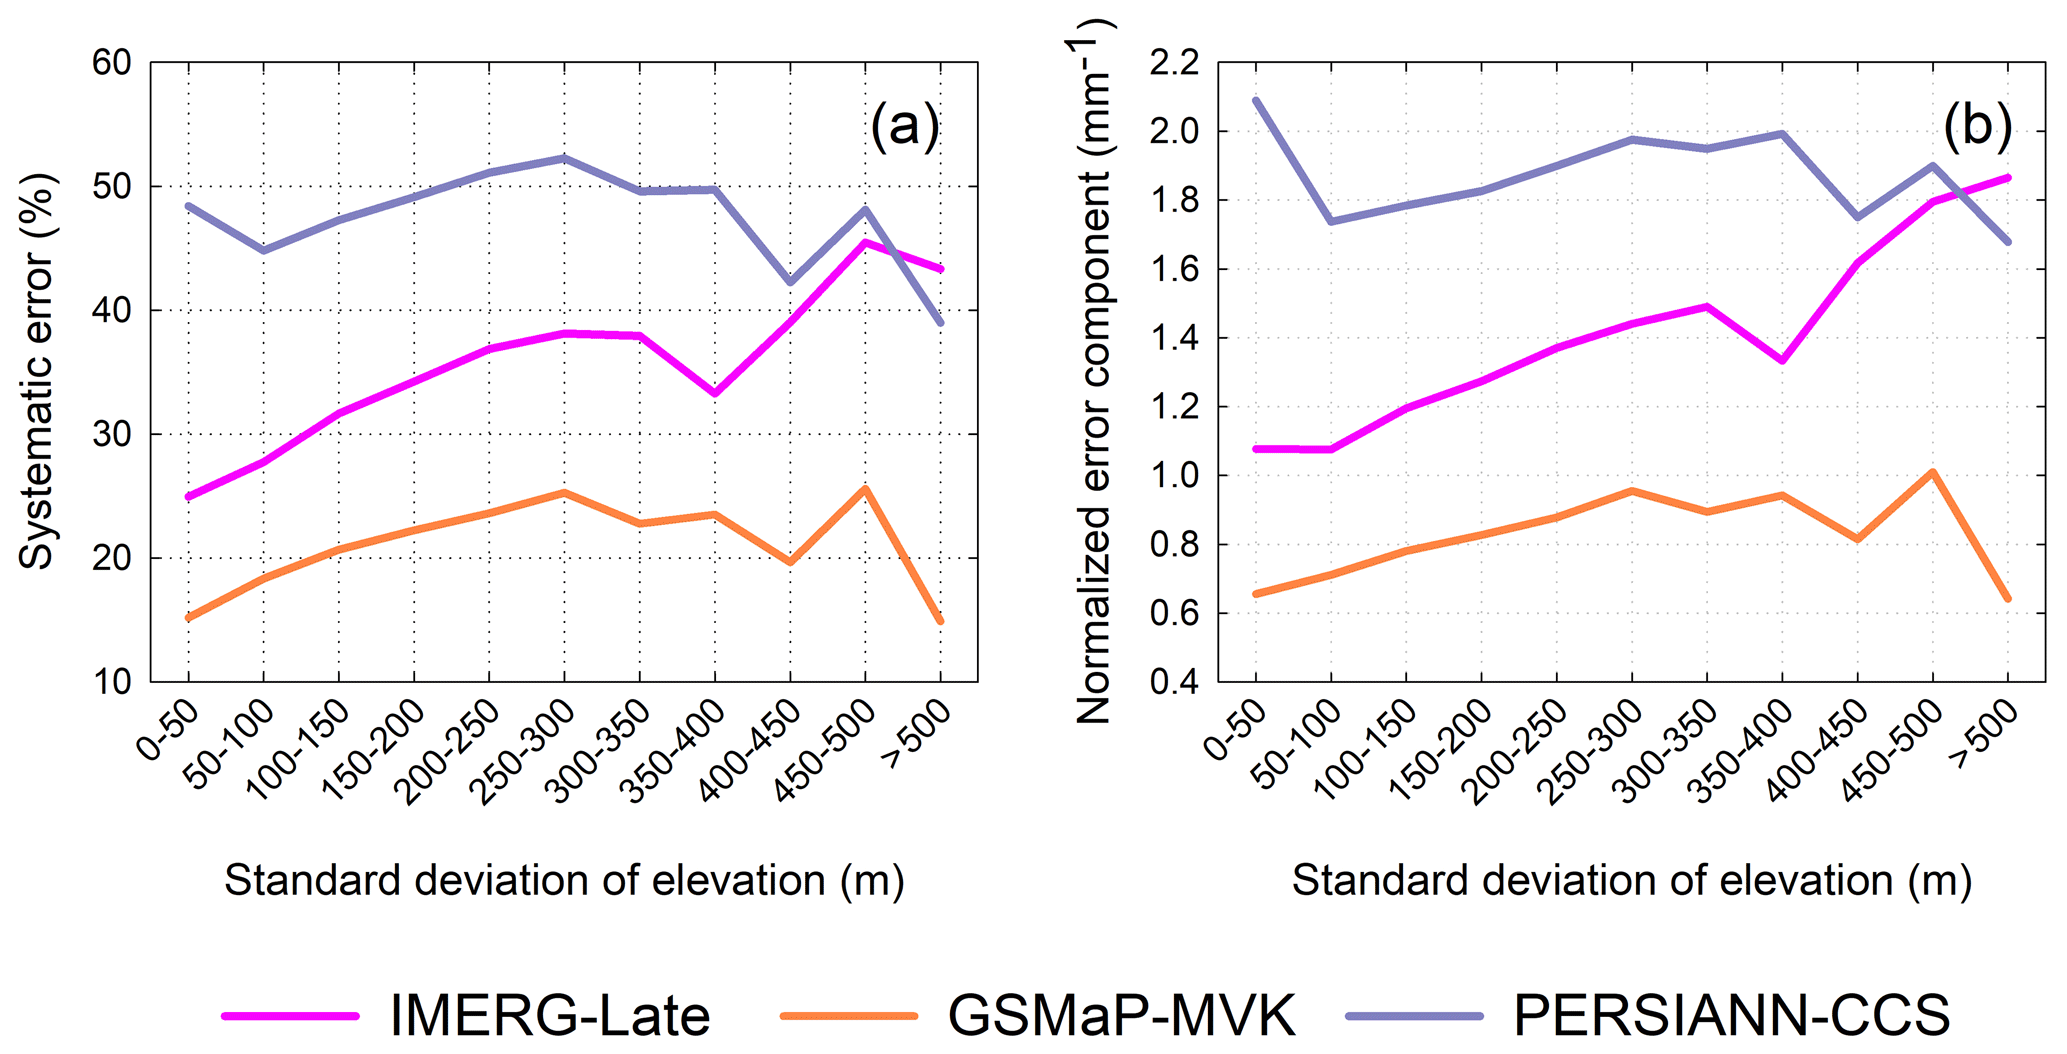
Figure 11(a) Systematic errors of the three satellite-only global precipitation estimates (i.e., IMERG-Late, GSMaP-MVK, and PERSIANN-CCS) for different topographies; (b) variation in the normalized error component (NEC) of each satellite-only global precipitation estimate with increasing terrain complexity. Note that the analysis was executed at a spatial resolution of 0.1∘ and hourly temporal resolution in the humid regions of mainland China over the JJA (summer) season for the period from 2015 to 2019 (5 years).
4.1 Potential transferability of the regional assessment to other areas
While there are numerous evaluations of mainstream SPPs over various regions around the globe such as CONUS, Europe, India, and China, many other regions such as Africa, central Australia, and Mongolia lack the ground networks needed to assess SPPs. This raises the important question of whether the results of such evaluations can be extrapolated to other similar areas where no ground observations are available. Thus, the transferability of evaluation results to other regions needs to be investigated.
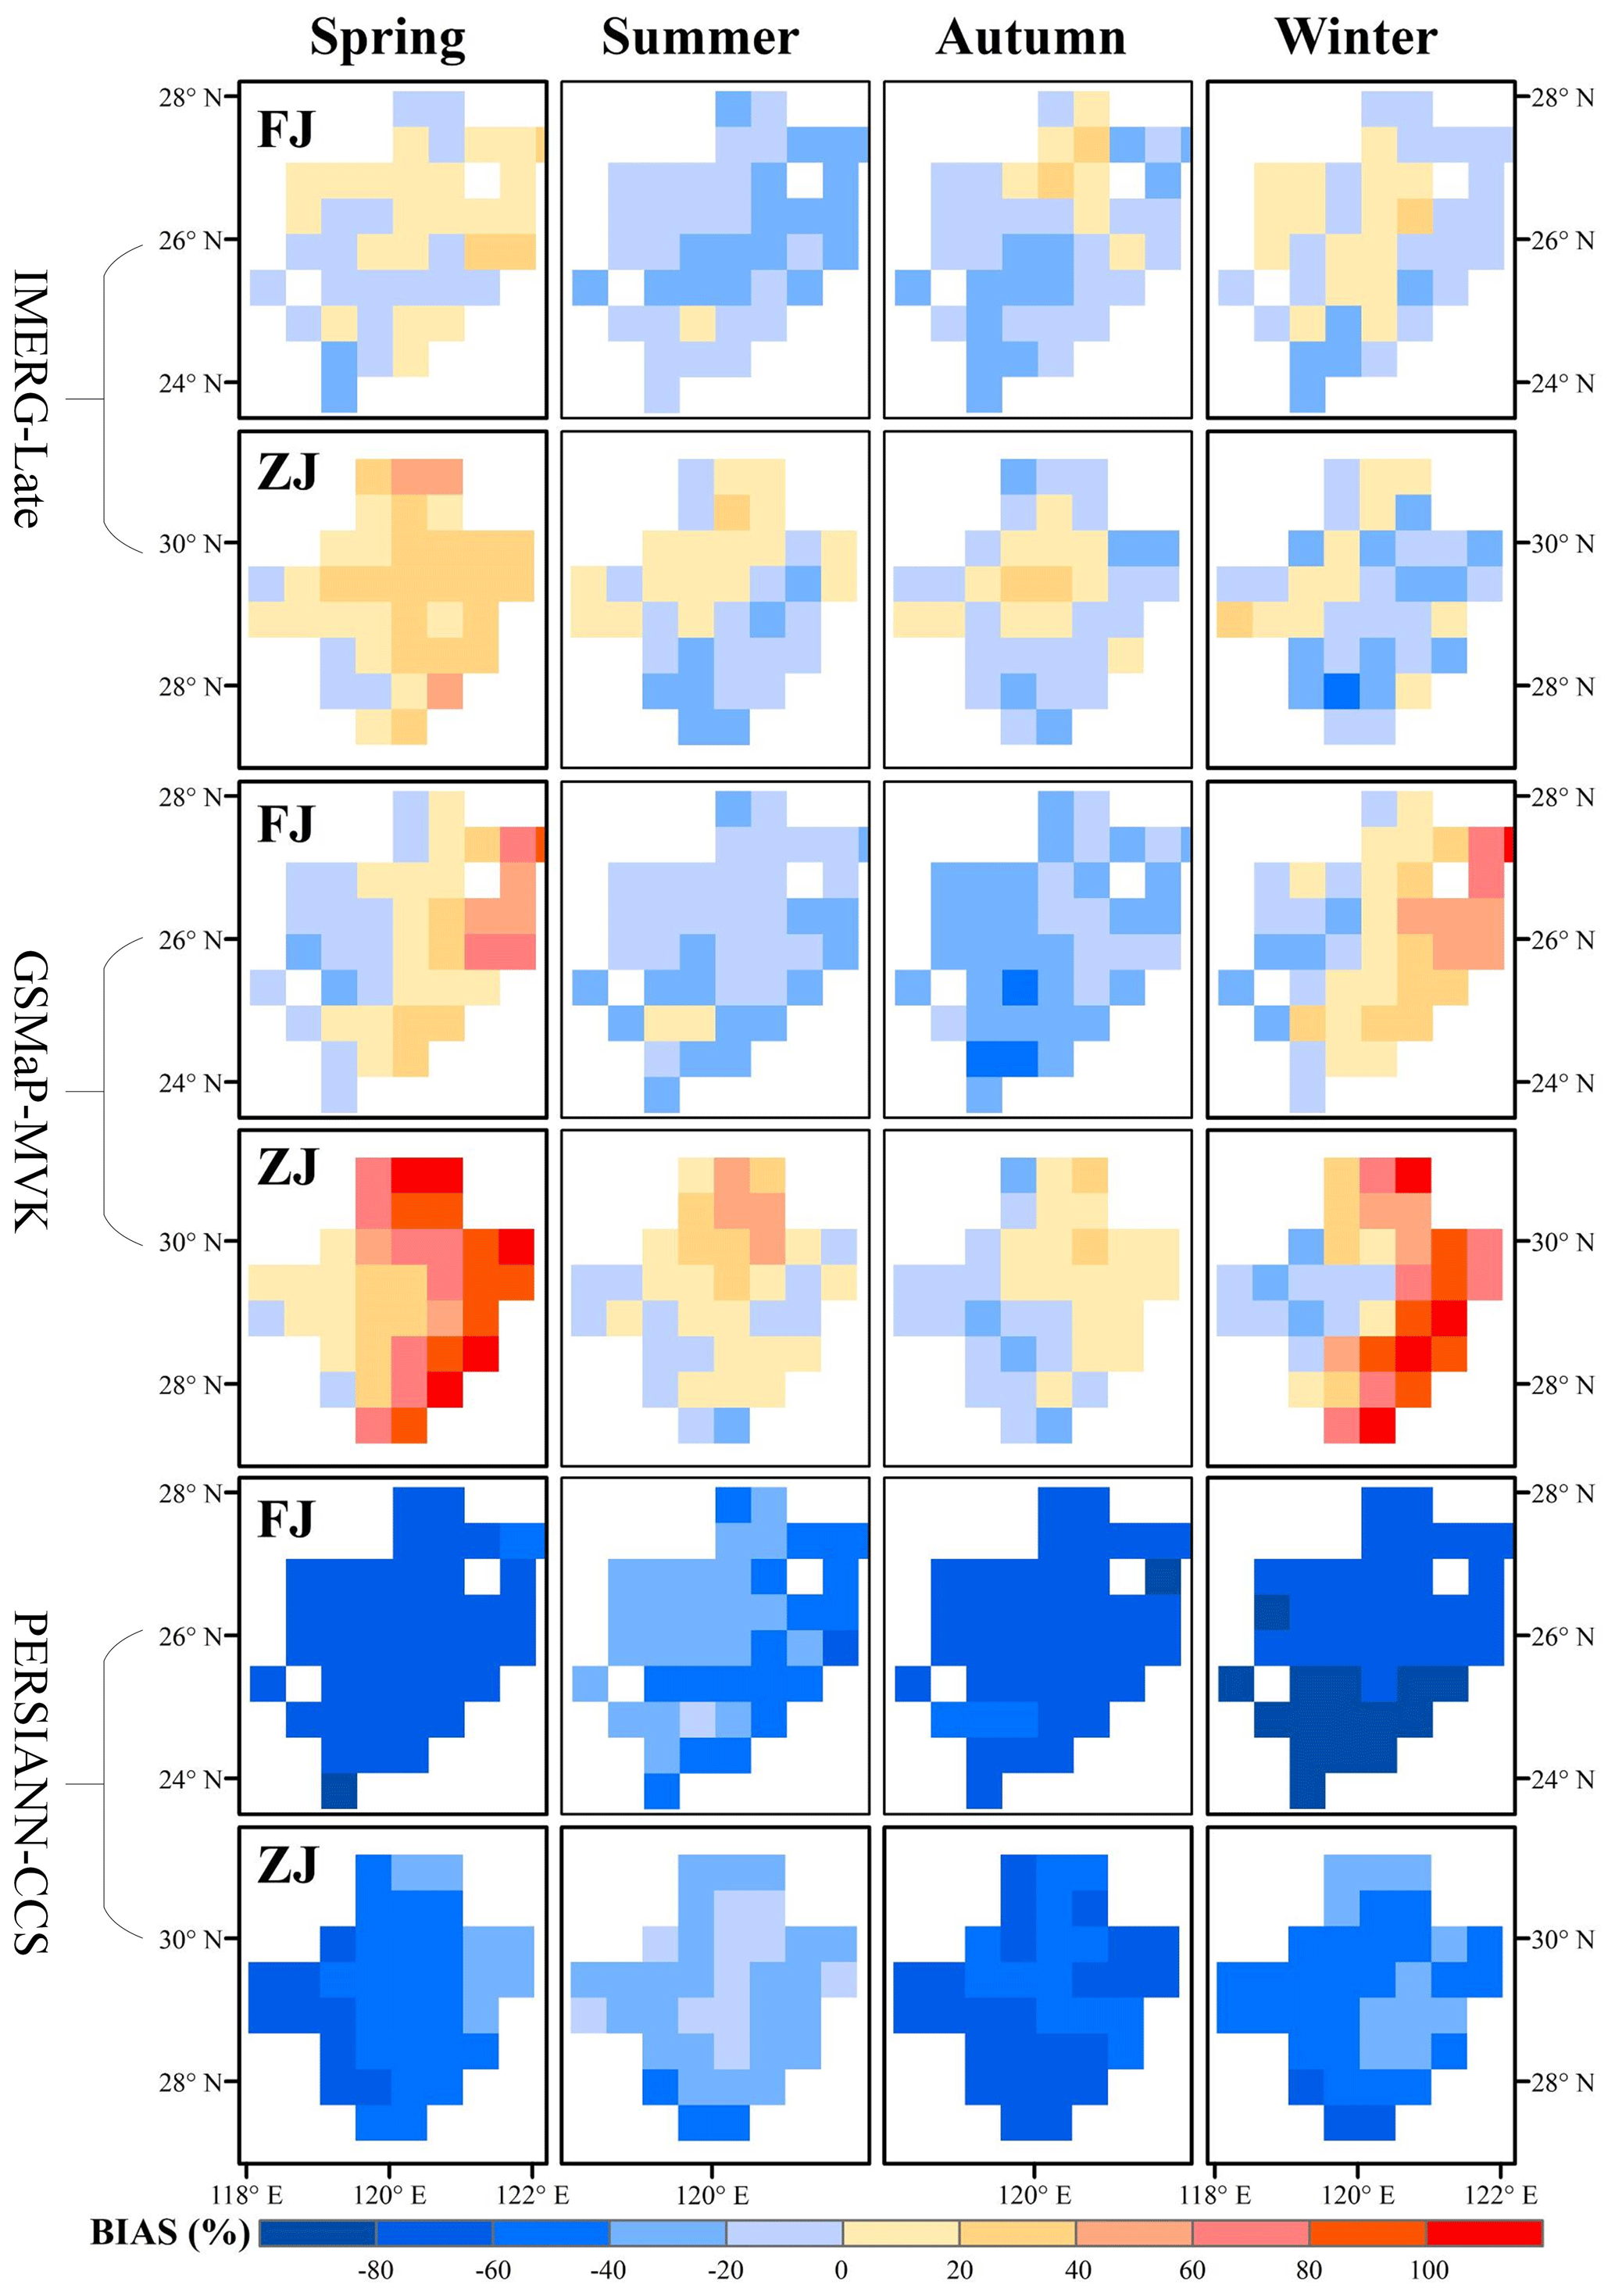
Figure 12Spatial maps of the total biases of the three SPPs over the Fujian (FJ) and Zhejiang (ZJ) provinces, respectively, for four seasons.
A comparison of the total bias between the Chinese Fujian (FJ) and Zhejiang (ZJ) provinces is regarded as a representative example of such an analysis. The two areas are located in the humid regions of mainland China. They are dominated by the same monsoon climate and have a similar topography. For each SPP, the spatial distribution of the total bias shows large differences between FJ and ZJ provinces, as shown in Fig. 12. It appears that the evaluation results for one area are not transferable to another similar area. Chen et al. (2019b) found that there are large differences in performance between various sensors onboard different satellites, which may be related to the sampling frequency (see Fig. 2 in Chen et al., 2019b). Differences in total bias between areas may also be caused by other factors (e.g., characteristics of precipitation regimes, such as precipitation types) not captured by satellites or the reference. Future evaluation efforts should focus on ungauged regions and explore novel methods that do not depend on ground observations.
4.2 Impact of topography on the systematic error
The results presented in Sect. 3.2 indicate that the systematic error is dependent on the rainfall intensity. Although the analysis focused on the humid regions of mainland China during the summer season to alleviate any interference from climate and seasonal factors in the systematic error, there are expected to be discrepancies between topography categories in precipitation intensity, which would in turn affect the systematic error proportions for the SPPs. The NEC metric is designed to exclude the impact of the precipitation intensity on the systematic error. It is used to extract the influence of topography on the systematic error.
Figure 11b shows the variations of the NEC with the SDE for the three SPPs over the summer season in the humid regions of mainland China. It is obvious that the relationship between the NEC and SDE is highly similar to that between the systematic error and SDE. The similarity of these two relationships can be explained by noting that the mean precipitation (i.e., , see Eq. 10) of all the SDEs is close to 0.24 mm h−1. The relationship between the NEC and SDE degenerates into the relationship between the systematic error and SDE if the mean precipitation is similar for all topographic classes. According to the results shown in Fig. 11b, the impact of topography on the systematic error for IMERG increases with terrain complexity. For GSMaP and PERSIANN-CCS, the systematic error increases (decreases) with topographic complexity when the SDE is less than (above) 300 m.
4.3 Which factors cause the largest systematic errors?
In general, the proportions of systematic error for the three evaluated SPPs are below 20 % for all four seasons and over most of the global land area. However, it cannot be ignored that these SPPs have larger systematic errors in several regions, such as parts of CONUS, China, and Russia (see Fig. 6). In addition, in these areas associated with larger systematic errors, the SPPs always have relatively large miss biases (see Figs. 2–6), implying that miss bias tends to produce larger systematic errors than hit and false biases do, according to the definition of systematic and random errors (see Eqs. 7 and 8).
4.4 Potential methods of improving satellite retrieval algorithms and error adjustment models
The results in this study suggest that the quality of the evaluated SPPs has significant room for further improvement. Several recent studies have attempted to reduce the errors in satellite precipitation retrievals by considering only seasonal rainfall intensity and/or topographic factors in their error adjustment models or blending algorithms (e.g., Tian et al., 2010b; Hashemi et al., 2017; Bhuiyan et al., 2018; Le et al., 2018; Choubin et al., 2019; Shen et al., 2019; Baez-Villanueva et al., 2020). In practice, the errors show significant regional features (at least for the three evaluated SPPs). The impact of several key factors (i.e., topography, season, climate, and rainfall intensity) is very significant, suggesting that the incorporation of all four factors (i.e., topography, season, climate region/different areas, and rainfall intensity) into error adjustment models and blending algorithms should further reduce the errors of satellite precipitation estimates.
Second, the global maps of total bias (total mean squared error) and its three (two) components indicate that hit and/or false errors are the major contributors to the total bias. Random error was found to be the major component of the total mean squared error. Consequently, satellite retrieval algorithms and error adjustment algorithms should focus on reducing the hit and false biases in these SPPs over most regions of the world.
Finally, the findings of this study are relevant to the improvement of gauge-adjusted versions of the satellite retrievals (e.g., GSMaP-Gauge blends GSMaP-MVK and CPCU data).
This paper has investigated the major components of the total error for three SPPs (i.e., IMERG-Late, GSMaP-MVK, and PERSIANN-CCS) over different seasons, rainfall intensities, and topographies. The major conclusions can be summarized as follows:
-
This study is the first to depict global maps of the total bias (total mean squared error) and its three (two) independent components for three SPPs over four seasons. The errors were found to have remarkably regional features, and the evaluation results showed that there was limited transferability from one region to another. This can be attributed to differences in satellite sampling between areas and may also be caused by other factors (e.g., characteristics of precipitation regimes, such as precipitation types) that cannot be captured by satellites or the reference. This finding highlights the need to assess satellite precipitation products over various regions of the world. Future efforts should focus on areas with a lack of evaluation and on investigating novel evaluation techniques that do not rely on ground-based observations.
-
Hit and/or false errors are the major components of the total bias for the three SPPs over most areas of the world (see Table S1). The systematic error proportions are below 20 % and display a strong seasonality in several regions such as CONUS, China, and Russia. It appears that missed precipitation is a decisive factor that produces large systematic errors. The evaluation results indicate that satellite retrieval algorithms and error adjustment algorithms should focus on reducing the hit and false biases in these SPPs over most regions of the world.
-
All the SPPs exhibit a high degree of consistency in the three bias scores (i.e., total bias, hit bias, and miss bias) with different rainfall intensities. Their total biases come primarily from the hit error component. Each SPP displays a specific relationship between the systematic error and precipitation intensity. All the SPPs have relatively large systematic errors for rainfall events with intensities exceeding 40 mm d−1.
-
All the SPPs show considerable similarities in terms of the four bias metrics (i.e., total bias, hit bias, miss bias, and false bias) for most SDE classes. Among the SPPs, the four bias scores of GSMaP show the strongest topographic dependency, especially for false bias and hit bias. The three SPPs exhibit different dependencies of the systematic error on the topography. The NEC metric was proposed as a means to isolate the influence of topography on the systematic error. It was found that the relationship between the NEC and topography degenerates into the relationship between the systematic error and topography, primarily because the mean precipitation (i.e., , see Eq. 10) was ∼0.24 mm h−1 in all terrain categories.
The new findings reported in this paper will be useful for improving satellite precipitation retrieval algorithms and error adjustment models, as well as the potential applications of the products.
The IMERG suite data can be obtained from https://pmm.nasa.gov/data-access/downloads/gpm (last access: 20 February 2021) (NASA, 2021); the GSMaP suite data can be obtained from ftp://rainmap:Niskur+1404@hokusai.eorc.jaxa.jp/ (last access: 20 February 2021); the ground-based data for mainland China can be downloaded from http://data.cma.cn (last access: 20 February 2021); and the CPCU data can be downloaded from ftp://ftp.cpc.ncep.noaa.gov/precip/ (last access: 20 February 2021). The MATLAB codes used in this study can be obtained by contacting the first author (hanqingchen1007@163.com).
The supplement related to this article is available online at: https://doi.org/10.5194/hess-25-3087-2021-supplement.
HC was responsible for the conceptualization, methodology, software, formal analysis, writing, and funding acquisition. BY was responsible for writing – reviewing and editing –, project administration, and funding acquisition. PEK was responsible for writing – reviewing and editing. LW was responsible for writing – reviewing and editing – and methodology. YH was responsible for the conceptualization.
The authors declare that they have no conflict of interest.
We would like to express our most sincere thanks to the editor Graham Jewitt, the reviewer Viviana Maggioni, and another anonymous reviewer for their efforts in improving the quality of this paper.
This research has been supported by the National Key Research and Development Program of China (grant no. 2018YFA0605402), the National Natural Science Foundation of China (grant no. 51979073), and the Key Laboratory for Digital Land and Resources of Jiangxi Province, East China University of Technology (grant no. DLLJ201907).
This paper was edited by Graham Jewitt and reviewed by Viviana Maggioni and one anonymous referee.
AghaKouchak, A., Behrangi, A., Sorooshian, S., Hsu, K., and Amitai, E.: Evaluation of satellite retrieved extreme precipitation rates across the central United States, J. Geophys., Res.-Atmos., 116, D02115, https://doi.org/10.1029/2010JD014741, 2011.
AghaKouchak, A., Mehran, A., Norouzi, H., and Behrangi, A.: Systematic and random error components in satellite precipitation data sets, Geophys. Res. Lett., 39, L09406, https://doi.org/10.1029/2012GL051592, 2012.
Baez-Villanueva, O. M., Zambrano-Bigiarini, M., Beck, H. E., McNamara, I., Ribbe, L., Nauditt, A., Birkel, C., Verbist, K., Giraldo-Osorio, J. D., and Thinh, N. X.: RF-MEP: A novel random forest method for merging gridded precipitation products and ground-based measurements, Remote Sens. Environ., 239, 111606, https://doi.org/10.1016/j.rse.2019.111606, 2020.
Beck, H. E., Vergopolan, N., Pan, M., Levizzani, V., van Dijk, A. I. J. M., Weedon, G. P., Brocca, L., Pappenberger, F., Huffman, G. J., and Wood, E. F.: Global-scale evaluation of 22 precipitation datasets using gauge observations and hydrological modeling, Hydrol. Earth Syst. Sci., 21, 6201–6217, https://doi.org/10.5194/hess-21-6201-2017, 2017.
Beck, H. E., Pan, M., Roy, T., Weedon, G. P., Pappenberger, F., van Dijk, A. I. J. M., Huffman, G. J., Adler, R. F., and Wood, E. F.: Daily evaluation of 26 precipitation datasets using Stage-IV gauge-radar data for the CONUS, Hydrol. Earth Syst. Sci., 23, 207–224, https://doi.org/10.5194/hess-23-207-2019, 2019.
Bhuiyan, M. A. E., Nikolopoulos, E. I., Anagnostou, E. N., Quintana-Seguí, P., and Barella-Ortiz, A.: A nonparametric statistical technique for combining global precipitation datasets: development and hydrological evaluation over the Iberian Peninsula, Hydrol. Earth Syst. Sci., 22, 1371–1389, https://doi.org/10.5194/hess-22-1371-2018, 2018.
Chen, H., Lu, D., Zhou, Z., Zhu, Z., Ren, Y., and Yong, B.: An overview of the evaluation of satellite precipitation Products for Global Precipitation Measurement (GPM) (in Chinese), Water Resour. Prot., 35, 27–34, 2019a.
Chen, H., Yong, B., Gourly, J. J., Liu, J., Ren, L., Wang, W., Hong, Y., and Zhang, J.: Impact of the Crucial Geographical and Climatic Factors on the Input Source Errors of GPM-based Global Satellite Precipitation Estimates, J. Hydrol., 575, 1–16, 2019b.
Chen, H., Yong, B., Qi, W., Wu, H., Ren, L., and Hong, Y.: Investigating the Evaluation Uncertainty for Satellite Precipitation Estimates Based on Two Different Ground Precipitation Observation Products, J. Hydrometeorol., 21, 2595–2606, 2020a.
Chen, H., Yong, B., Shen, Y., Liu, J., Hong, Y., and Zhang, J.: Comparison analysis of six purely satellite-derived global precipitation estimates, J. Hydrol., 581, 124376, https://doi.org/10.1016/j.jhydrol.2019.124376, 2020b.
Chen, M., Shi, W., Xie, P., Silva, V. B., Kousky, V. E., Wayne Higgins, R., and Janowiak, J. E.: Assessing objective techniques for gauge-based analyses of global daily precipitation, J. Geophys. Res.-Atmos., 113, D04110, https://doi.org/10.1029/2007JD009132, 2008.
Chen, S., Hong, Y., Cao, Q., Gourley, J. J., Kirstetter, P. E., Yong, B., Tian, Y., Zhang, Z. X., Shen, Y., Hu, J. J., and Hardy, J.: Similarity and difference of the two successive V6 and V7 TRMM multisatellite precipitation analysis performance over China, J. Geophys. Res.-Atmos., 118, 13060–13074, 2013.
Choubin, B., Khalighisigaroodi, S., Mishra, A. K., Goodarzi, M., Shamshirband, S., Ghaljaee, E., and Zhang, F.: A novel bias correction framework of TMPA 3B42 daily precipitation data using similarity matrix/homogeneous conditions, Sci. Total Environ., 694, 133680, https://doi.org/10.1016/j.scitotenv.2019.133680, 2019.
Gebregiorgis, A. S., Kirstetter, P.-E., Hong, Y. E., Gourley, J. J., Huffman, G. J., Petersen, W. A., Xue, X., and Schwaller, M. R.: To what extent is the day 1 GPM IMERG satellite precipitation estimate improved as compared to TRMM TMPA-RT?, J. Geophys. Res.-Atmos., 123, 1694–1707, 2018.
Guo, H., Bao, A., Ndayisaba, F., Liu, T., Kurban, A., and De Maeyer, P.: Systematical Evaluation of Satellite Precipitation Estimates Over Central Asia Using an Improved Error-Component Procedure, J. Geophys. Res.-Atmos., 122, 10906–10927, 2017.
Hashemi, H., Nordin, M., Lakshmi, V., Huffman, G. J., and Knight, R.: Bias Correction of Long-Term Satellite Monthly Precipitation Product (TRMM 3B43) over the Conterminous United States, J. Hydrometeorol., 18, 2491–2509, 2017.
Hong, Y., Hsu, K. L., Sorooshian, S., and Gao, X.: Precipitation estimation from remotely sensed imagery using an artificial neural network cloud classification system, J. Appl. Meteorol., 43, 1834–1853, 2004.
Hou, A. Y., Kakar, R. K., Neeck, S., Azarbarzin, A. A., Kummerow, C. D., Kojima, M., Oki, R., Nakamura, K., and Lguchi, T.: The global precipitation measurement mission, B. Am. Meteorol. Soc., 95, 701–722, 2014.
Huffman, G. J., Bolvin, D. T., Nelkin, E. J., and Tan, J.: Integrated Multi-satellitE Retrievals for GPM (IMERG) Technical Documentation, NASA/GSFC, 1, 2019.
Kidd, C. and Huffman, G. J.: Global precipitation measurement, Meteorol. Appl., 18, 334–353, 2011.
Kidd, C. and Levizzani, V.: Status of satellite precipitation retrievals, Hydrol. Earth Syst. Sci., 15, 1109–1116, https://doi.org/10.5194/hess-15-1109-2011, 2011.
Kidd, C., Becker, A., Huffman, G. J., Muller, C. L., Joe, P., Skofronick-Jackson, G., and Kirschbaum, D. B.: So, how much of the Earth's surface is covered by rain gauges?, B. Am. Meteorol. Soc., 98, 69–78, 2017.
Kirstetter, P. E., Hong, Y., Gourley, J. J., Schwaller, M., Petersen, W., and Zhang, J.: Comparison of TRMM 2A25 products, version 6 and version 7, with NOAA/NSSL ground radar-based National Mosaic QPE, J. Hydrometeorol., 14, 661–669, 2013.
Kirstetter, P. E., Karbalaee, N., Hsu, K., and Hong, Y.: Probabilistic precipitation rate estimates with space-based infrared sensors, Q. J. Roy. Meteor. Soc., 144, 191–205, 2018.
Le, H. M., Sutton, J. R., Du Bui, D., Bolten, J. D., and Lakshmi, V.: Comparison and Bias Correction of TMPA Precipitation Products over the Lower Part of Red-Thai Binh River Basin of Vietnam, Remote Sens., 10, 1582, https://doi.org/10.3390/rs10101582, 2018.
Liu, Z.: Comparison of ntegrated Multi-satellite Retrievals for GPM (IMERG) and TRMM Multi-satellite Precipitation Analysis (TMPA) monthly precipitation products: initial results, J. Hydrometeorol., 17, 777–790, 2016.
Maggioni, V., Meyers, P. C., and Robinson, M. D.: A review of merged high-resolution satellite precipitation product accuracy during the Tropical Rainfall Measuring Mission (TRMM) era, J. Hydrometeorol., 17, 1101–1117, 2016a.
Maggioni, V., Sapiano, M. R., and Adler, R. F.: Estimating Uncertainties in High-Resolution Satellite Precipitation Products: Systematic or Random Error?, J. Hydrometeorol., 17, 1119–1129, 2016b.
NASA: Precipitation Data Directory, available at: https://pmm.nasa.gov/data-access/downloads/gpm, last access: 20 February 2021.
Prakash, S., Mitra, A. K., AghaKouchak, A., Liu, Z., Norouzi, H., and Pai, D. S.: A preliminary assessment of GPM-based multi-satellite precipitation estimates over a monsoon dominated region, J. Hydrol., 556, 865–876, 2018.
Shen, G., Chen, N., Wang, W., and Chen, Z.: WHU-SGCC: a novel approach for blending daily satellite (CHIRP) and precipitation observations over the Jinsha River basin, Earth Syst. Sci. Data, 11, 1711–1744, https://doi.org/10.5194/essd-11-1711-2019, 2019.
Shen, Y. and Xiong, A.: Validation and comparison of a new gauge-based precipitation analysis over mainland China, Int. J. Climatol., 36, 252–265, 2016.
Shen, Y., Zhao, P., Pan, Y., and Yu, J.: A high spatiotemporal gauge-satellite merged precipitation analysis over China, J. Geophys. Res.-Atmos., 119, 3063–3075, 2014.
Skofronick-Jackson, G., Petersen, W. A., Berg, W., Kidd, C., Stocker, E. F., Kirschbaum, D. B., Kakar, R., Braun, S. A., Huffman, G. J., Lguchi, T., Kirstetter, P. E., Kummerow, C., Meneghini, R., Oki, R., Olson, W. S., Takayabu, Y. N., Furukawa, K., and Wilheit, T.: The Global Precipitation Measurement (GPM) mission for science and society, B. Am. Meteorol. Soc., 98, 1679–1695, 2017.
Sorooshian, S., Hsu, K. L., Gao, X., Gupta, H. V., Imam, B., and Braithwaite, D.: Evaluation of PERSIANN system satellite-based estimates of tropical rainfall, B. Am. Meteorol. Soc., 81, 2035–2046, 2000.
Su, J., Lü, H., Zhu, Y., Wang, X., and Wei, G.: Component analysis of errors in four GPM-based precipitation estimations over Mainland China, Remote Sens., 10, 1420, 2018.
Sungmin, O. and Kirstetter, P. E.: Evaluation of diurnal variation of GPM IMERG-derived summer precipitation over the contiguous US using MRMS data, Q. J. Roy. Meteorol. Soc., 144, 270–281, 2018.
Takido, K., Valeriano, O. C. S., Ryo, M., Tanuma, K., Ushio, T., and Kubota, T.: Spatiotemporal evaluation of the gauge-adjusted global satellite mapping of precipitation at the basin scale, J. Meteorol. Soc. Jpn., 94, 185–195, 2016.
Tan, J., Petersen, W. A., Kirstetter, P. E., and Tian, Y.: Performance of IMERG as a function of spatiotemporal scale, J. Hydrometeorol., 18, 307–319, 2017.
Tapiador, F. J., Turk, F. J., Petersen, W., Hou, A. Y., García-Ortega, E., Machado, L. A. T., Angelis, C. F., Salio, P., Kidd, C., Huffman, G. J., and de Castro, M.: Global precipitation measurement: methods, datasets and applications, Atmos. Res., 105, 70–97, 2012.
Tian, Y. and Peters-Lidard, C. D.: A global map of uncertainties in satellite-based precipitation measurements, Geophys. Res. Lett., 37, L24407, https://doi.org/10.1029/2010GL046008, 2010.
Tian, Y., Peters-Lidard, C. D., Eylander, J. B., Joyce, R. J., Huffman, G. J., Adler, R. F., Hsu, K. L., Turk, F. J., Garcia, M., and Zeng, J.: Component analysis of errors in satellite-based precipitation estimates, J. Geophys. Res.-Atmos., 114, D24101, https://doi.org/10.1029/2009JD011949, 2009.
Tian, Y., Peters-Lidard, C. D., and Eylander, J. B.: Real-Time Bias Reduction for Satellite-Based Precipitation Estimates, J. Hydrometeorol., 11, 1275–1285, 2010.
Ushio, T., Sasashige, K., Kubota, T., Shige, S., Okamoto, K. I., Aonashi, K., Inoue, T., Takahashi, N., Iguchi, T., Kachi, M., Oki, R., Morimoto, T., and Kawasaki, Z. I.: A Kalman filter approach to the Global Satellite Mapping of Precipitation (GSMaP) from combined passive microwave and infrared radiometric data, J. Meteorol. Soc. Jpn. Ser. II, 87, 137–151, 2009.
Willmott, J.: On the validation of model, Phys. Geogr., 2, 184–194, 1981.
Xie, P., Chen, M., Yang, S., Yatagai, A., Hayasaka, T., Fukushima, Y., and Liu, C.: A gauge-based analysis of daily precipitation over East Asia, J. Hydrometeorol., 8, 607–626, 2007.
Xu, R., Tian, F., Yang, L., Hu, H., Lu, H., and Hou, A.: Ground validation of GPM IMERG and TRMM 3B42V7 rainfall products over southern Tibetan Plateau based on a high-density rain gauge network, J. Geophys. Res.-Atmos, 122, 910–924, 2017.
Xu, S., Shen, Y., and Du, Z.: Tracing the source of the errors in hourly IMERG using a decomposition evaluation scheme, Atmosphere, 7, 161, https://doi.org/10.3390/atmos7120161, 2016.
Yamamoto, M. K. and Shige, S.: Implementation of an orographic/nonorographic rainfall classification scheme in the GSMaP algorithm for microwave radiometers, Atmos. Res., 163, 36–47, 2015.
Yong, B., Ren, L., Hong, Y., Wang, J. H., Gourley, J. J., Jiang, S., Chen, X., and Wang, W.: Hydrologic evaluation of Multisatellite Precipitation Analysis standard precipitation products in basins beyond its inclined latitude band: A case study in Laohahe basin, China, Water Resour. Res., 46, W07542, https://doi.org/10.1029/2009WR008965, 2010.
Yong, B., Ren, L., Hong, Y., Gourley, J. J., Tian, Y., Huffman, G. J., Chen X., Wang W. G., and Wen, Y. X.: First evaluation of the climatological calibration algorithm in the real-time TMPA precipitation estimates over two basins at high and low latitudes, Water Resour. Res., 49, 2461–2472, 2013.
Yong, B., Liu, D., Gourley, J. J., Tian, Y., Huffman, G. J., Ren, L., and Hong, Y.: Global view of real-time TRMM multisatellite precipitation analysis: Implications for its successor global precipitation measurement mission, B. Am. Meteorol. Soc., 96, 283–296, 2015.
Yong, B., Chen, B., Tian, Y., Yu, Z., and Hong, Y.: Error-component analysis of TRMM-based multi-satellite precipitation estimates over mainland China, Remote Sens., 8, 440, https://doi.org/10.3390/rs8050440, 2016.
Zhang, J., Howard, K., Langston, C., Kaney, B., Qi, Y., Tang, L., Grams, H., Wang, D., Cocks, S., Martinaitis, S., Arthur, A., Cooper, K., Brogden, J., and Kitzmiller, D.: Multi-Radar Multi-Sensor (MRMS) quantitative precipitation estimation: Initial operating capabilities, B. Am. Meteorol. Soc., 97, 621–638, 2016.