the Creative Commons Attribution 4.0 License.
the Creative Commons Attribution 4.0 License.
 | 13 Apr 2021
Signatures of human intervention – or not? Downstream intensification of hydrological drought along a large Central Asian river: the individual roles of climate variability and land use change
Artemis Roodari
Markus Hrachowitz
Farzad Hassanpour
Mostafa Yaghoobzadeh
The transboundary Helmand River basin (HRB) is the main drainage system for large parts of Afghanistan and the Sistan region of Iran. Due to the reliance of this arid region on water from the Helmand River, a better understanding of hydrological-drought pattern and the underlying drivers in the region is critically required for effective management of the available water. The objective of this paper is therefore to analyze and quantify spatiotemporal pattern of drought and the underlying processes in the study region. More specifically we test for the Helmand River basin the following hypotheses for the 1970–2006 period: (1) drought characteristics, including frequency and severity, systematically changed over the study period; (2) the spatial pattern and processes of drought propagation through the Helmand River basin also changed; and (3) the relative roles of climate variability and human influence on changes in hydrological droughts can be quantified.
It was found that drought characteristics varied throughout the study period but largely showed no systematic trends. The same was observed for the time series of drought indices SPI (standard precipitation index) and SPEI (standardized precipitation evapotranspiration index), which exhibited considerable spatial coherence and synchronicity throughout the basin, indicating that, overall, droughts similarly affect the entire HRB with few regional or local differences. In contrast, analysis of the SDI (streamflow drought index) exhibited significant negative trends in the lower parts of the basin, indicating an intensification of hydrological droughts. It could be shown that with a mean annual precipitation of ∼ 250 mm yr−1, streamflow deficits and thus hydrological drought throughout the HRB are largely controlled by precipitation deficits, whose annual anomalies on average account for ±50 mm yr−1, or ∼ 20 % of the water balance of the HRB, while anomalies of total evaporative fluxes on average only account for ±20 mm yr−1. Assuming no changes in the reservoir management practices over the study period, the results suggest that the two reservoirs in the HRB only played a minor role for the downstream propagation of streamflow deficits, as indicated by the mean difference between inflow and outflow during drought periods, which did not exceed ∼ 0.5 % of the water balance of the HRB. Irrigation water abstraction had a similarly limited effect on the magnitude of streamflow deficits, accounting for ∼ 10 % of the water balance of the HRB. However, the downstream parts of the HRB moderated the further propagation of streamflow deficits and associated droughts because of the minor effects of reservoir operation and very limited agricultural water in the early decades of the study period. This drought moderation function of the lower basin was gradually and systematically inverted by the end of the study period, when the lower basin eventually amplified the downstream propagation of flow deficits and droughts. Our results provide plausible evidence that this shift from drought moderation to drought amplification in the lower basin is likely a consequence of increased agricultural activity and the associated increases in irrigation water demand, from ∼ 13 mm yr−1 at the beginning of the study period to ∼ 23 mm yr−1 at the end, and thus in spite of being only a minor fraction of the water balance. Overall the results of this study illustrate that flow deficits and the associated droughts in the HRB clearly reflect the dynamic interplay between temporally varying regional differences in hydro-meteorological variables together with subtle and temporally varying effects linked to direct human intervention.
- Article
(6394 KB) - Full-text XML
-
Supplement
(1038 KB) - BibTeX
- EndNote


There is evidence that droughts have the potential to increasingly affect human societies as well as ecosystem functioning. In a world under change, decision-makers therefore need reliable quantitative information about drought characteristics to ensure the development and implementation of effective and sustainable water management procedures. To be reliable this information needs to be based on a solid understanding of how different types of droughts propagate through different hydrological systems. While meteorological droughts are controlled by precipitation deficits only, agricultural and hydrological droughts are caused by soil moisture and runoff deficits, respectively. As pointed out, amongst others, by Mishra and Singh (2010), the processes underlying droughts are complex because they are dependent on many interacting processes in terrestrial hydrological systems, such as the interaction between the atmosphere and the hydrological processes which feed moisture to the atmosphere. Therefore, monitoring and analysis of hydrological droughts have received increased attention in recent decades (van Huijgevoort et al., 2014; Pathak and Dodamani, 2016; Weng et al., 2015; Vicente-Serrano et al., 2012; Kubiak-Wójcicka and Ba̧k, 2018; Trambauer et al., 2014; Ahmadalipour et al., 2017; Jiao and Yuan, 2019; Moravec et al., 2019). In general, it is well understood that both agricultural and hydrological droughts are modulated by the interactions of climate and river basin characteristics, such as geology, as well as a human influence or any combination thereof (e.g., Van Lanen et al., 2013; Huang et al., 2016; Liu et al., 2016; Van Loon et al., 2019). For example, data show that reservoir operations can have both considerable positive and negative effects on downstream hydrological-drought pattern (e.g., Zhang et al., 2013; Piqué et al., 2016; Wu et al., 2017), which may politically be particularly sensitive for transboundary rivers in arid environments (Al-Faraj and Scholz, 2014; Wan et al., 2018).
The transboundary Helmand River system between Afghanistan and Iran is the primary contributor of water to the Hamun lake-and-wetland system in the Sistan Plain, which is the terminus of one of the largest endorheic basins in Central Asia. In this region, which is described as one of the driest, most remote deserts on Earth (Whitney, 2006), water from the Helmand River system plays a critical role not only in sustaining agricultural production, hydropower generation, and ecosystem stability but also for drinking water supply for some 1 million people living in the region, including the cities of Kandahar in Afghanistan and Zabol in Iran.
The area has recently experienced a severe, multi-year drought (1998–2004). Reduction in flow and episodic no-flow conditions in the Helmand River during this period have caused significant disruption of water supply. As a consequence, agricultural production dropped by almost 90 % as compared to average no-drought conditions, further resulting in food shortage and considerable economic damage (Ebrahimzadeh and Esmaelnejad, 2013). Given the region's extreme dependence on water from the Helmand River system and the associated vulnerability to hydrological droughts, a few recent studies started to analyze droughts in Afghanistan and the Helmand River basin (e.g. Ahmad and Wasiq, 2004; Miyan, 2015). For example, Alami and Tayfor (2018) analyzed meteorological droughts in the Helmand River basin using different methods and quantitatively documented the extreme drought in 2001. However, most of the research in this region focused on the application of hydrological models for the simulation of runoff to provide decision bases for integrated-water-management issues in the region. These studies include Hajihosseini et al. (2016), who assessed the Afghan–Iranian Helmand River Water Treaty (1973) using the Soil and Water Assessment Tool (SWAT) model (Arnold et al., 1998) and data from the Climatic Research Unit (CRU; Harris et al., 2014). A study by Wardlaw et al. (2013) formulated a model for the development of water resource systems in the Helmand River basin using the Water Evaluation and Planning (WEAP) model and established a list of scenarios for the future.
Similarly, Vining and Vecchia (2007) estimated future runoff conditions of the river to evaluate the effects of different reservoir operation strategies under different climate change scenarios on downstream water supply. Van Beek et al. (2008) developed methods and tools to build the capacity to sustain agriculture and ecosystems in the downstream Sistan Plain. In spite of this growing body of literature for the region, the scarcity of reliable meteorological and hydrological data has so far limited systematic, quantitative analysis of the spatiotemporal pattern of hydrological droughts and the underlying drivers and processes in the Helmand River basin.
Due to the reliance of the region on water from the Helmand River, a better understanding of hydrological-drought pattern and the underlying processes in the region is critically required for effective management of the available water. Most studies in the Helmand River basin have so far remained limited to mere documentation and/or general assessments of mostly meteorological-drought characteristics. Here we extend this scope also to hydrological drought and evaluate the meteorological drought under the additional role of atmospheric water demand. The overall objective of this paper is therefore to analyze and quantify changes in spatiotemporal pattern of drought characteristics and the underlying processes in the study region in an attempt to quantitatively attribute these changes to climate and human interventions, respectively. More specifically we test for the Helmand River basin the following hypotheses for the 1970–2006 period: (1) drought characteristics, including frequency and severity, systematically changed over the study period; (2) the spatial pattern and processes of drought propagation through the Helmand River basin also changed; and (3) the relative roles of climate variability and human influence on changes in hydrological droughts can be quantified.
The endorheic Helmand River basin (HRB; Fig. 1) covers approximately 105 000 km2, or 15 % of Afghanistan. From its source area, in the Koh-i-Baba mountains, an extension of the Hindu Kush west of Kabul with elevations of over 4600 m a.s.l., the Helmand River system drains into the Hamun lake-and-wetland system in the Sistan Plain of eastern Iran, a closed inland delta with a minimum elevation of 440 m a.s.l. in the southwest of the HRB, which covers 5 % of the total HRB area (Goes et al., 2016). Both long-term mean annual precipitation ( = 90–480 mm yr−1; Fig. 1d) and potential evaporation ( = 700–1800 mm yr−1; Fig. 1e) exhibit considerable spatial variability throughout the HRB. This results in a pronounced gradient of aridity from sub-arid in the northeast to hyper-arid conditions in the southwest, as expressed by the aridity index IA ( [–]; Fig. 1f). Precipitation falls mostly in the winter months and in the upper basin almost always occurs as snow. In general, snowmelt generates the annual runoff peaks in early spring and sustains flow in the HRB throughout the dry summers. For the following analysis, the HRB is divided into six sub-basins (Fig. 1c, Table 1): the upper Helmand River basin (UHRB) with the main stem of the Helmand River, the central Helmand River basin (CHRB), and the upper Arghandab River basin (UARB) as well as the lower Arghandab River basin (LARB) are nested in and drain into the lower Helmand River basin (LHRB) and subsequently into the Sistan Plain (SISP). The UHRB accounts for 80 % of the combined inflow into the LHRB. Flow in the LHRB is influenced by the operation of two upstream reservoirs (Fig. 1b, Table 1). While the reservoir at Kajakai Dam, with a storage capacity of 1800×106 m3, located at the outflow of the UHRB, is a multi-purpose structure for electricity production, flood control, and irrigation water supply, the smaller Dahla Dam, located at the outlet of the UARB into the LARB about 180 km upstream of the confluence with the LHRB, has a storage capacity of 450×106 m3 and is used mainly for irrigation of the lower Arghandab valley (Goes et al., 2016).
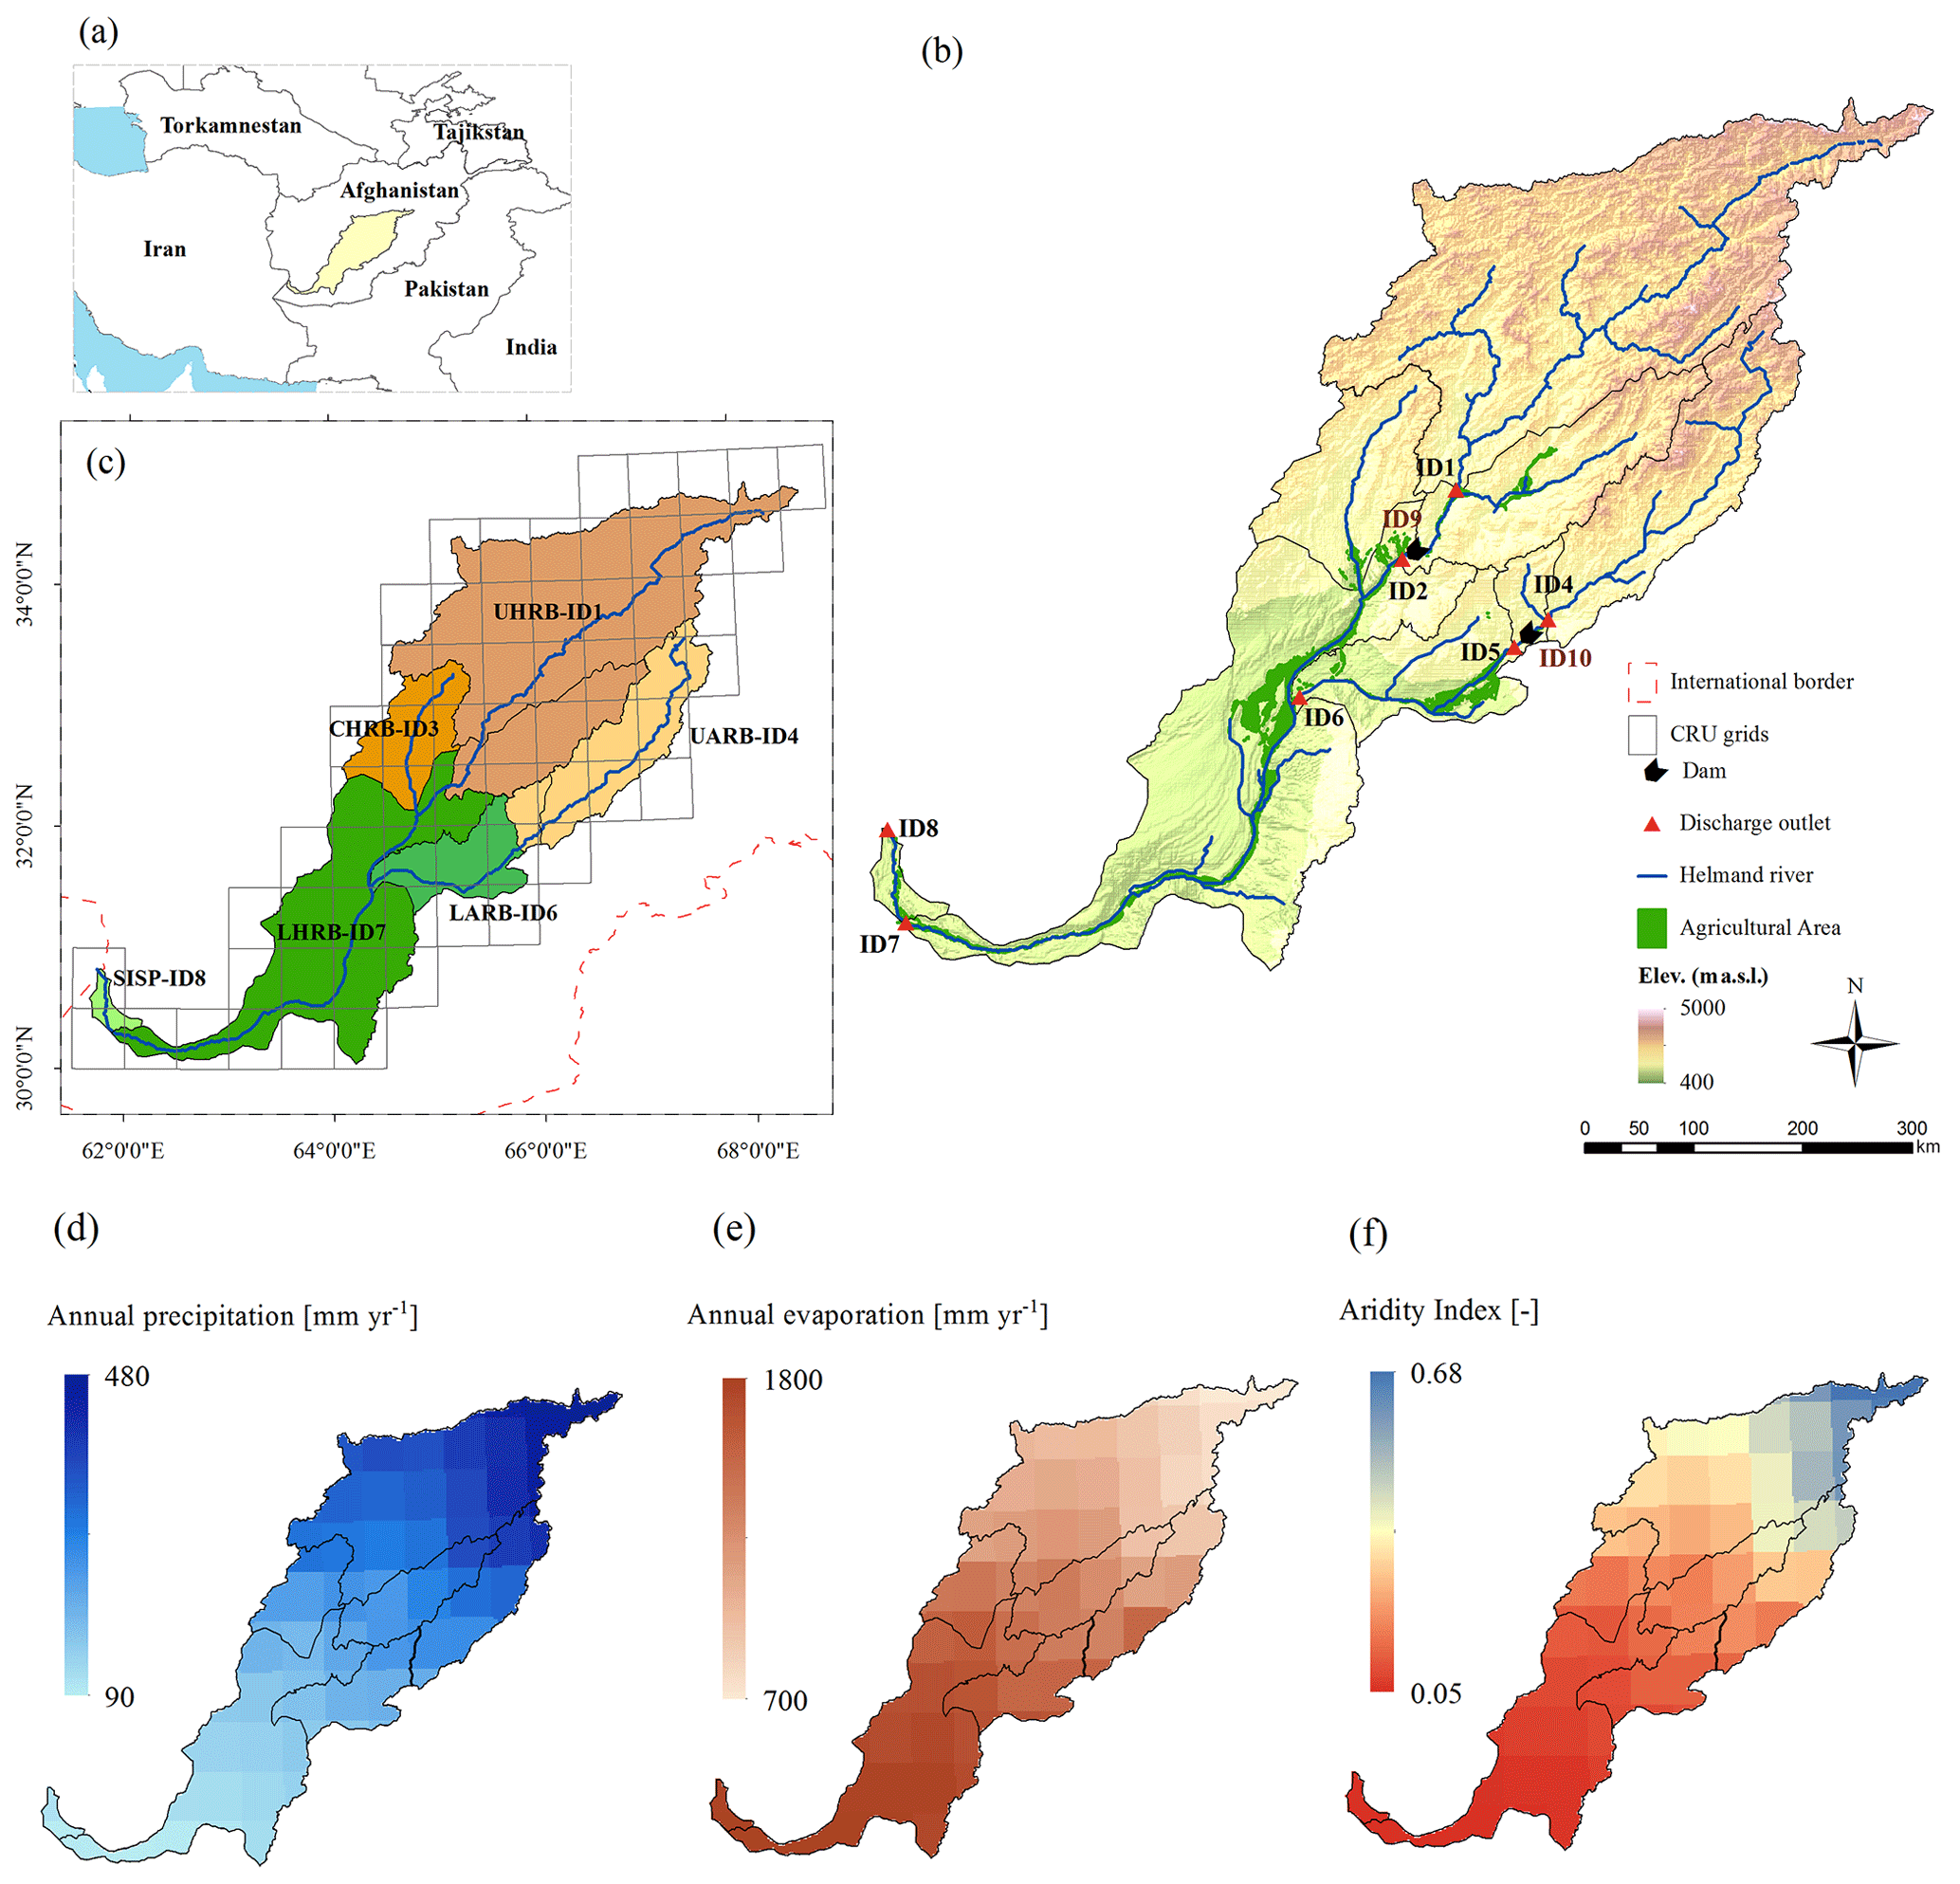
Figure 1(a) The location of Helmand River basin (HRB) in central Afghanistan; (b) elevation map of the HRB, also indicating the sub-basin boundaries, the locations of the sub-basin outlets, and the agriculturally used area (as of 2006); (c) outline of the sub-basins analyzed in this study, including the grid cells of CRU precipitation data used; (d) long-term mean annual precipitation P [mm yr−1]; (e) long-term mean annual potential evaporation EP [mm yr−1]; and (f) the aridity index [–].
Table 1Summary of sub-basins and reservoirs in the Helmand River basin. UHRB, CHRB, and LHRB denote the upper, central, and lower Helmand River basins, respectively; UARB and LARB are the upper and lower Arghandab River basins, respectively; and SISP is the Sistan Plain. The subscripts U and D are inflows into the reservoir upstream of the dams and outflows from the reservoirs downstream of the dams, respectively.

Due to the arid climate, natural vegetation is very scarce and mostly limited to seasonal grassland throughout the entire HRB. Irrigated agriculture is by far the largest consumer of water, accounting for 98 % of all abstractions (Goes et al., 2016). Except for a few recent irrigation projects in the LARB and LHRB, irrigation relies on traditional methods with irrigation canals and is thus largely confined to the valley floors along the main river channels (Fig. 1b). While the irrigated area in the LARB remained somewhat stable at around 370 km2 (∼ 0.3 % of the total HRB) over the last decades, satellite imagery (Landsat 7, ETM+) shows that the total irrigated area in the LHRB more than doubled, from <800 km2 (0.8 %) in the late 1970s to 1650 km2 (1.6 %) in 2011 (Fig. 2). More than 200 km2 of the increase in the irrigated area is due to the conversion of seasonal grasslands to high-water-requirement poppy cultivation since the 1990s (Hajihosseini et al., 2019). By 2006 around 690 km2 in the HRB was used for poppy cultivation (UNODC, 2006). In 2011, the main crops in the HRB were wheat (∼ 47 %), poppy (∼ 32 %–37 %), maize, and beans (∼ 16 %), with orchards in some areas (∼ 1 %–4 %) and large areas of opium poppy, mostly grown in the traditionally irrigated area (Wardlaw et al., 2013).
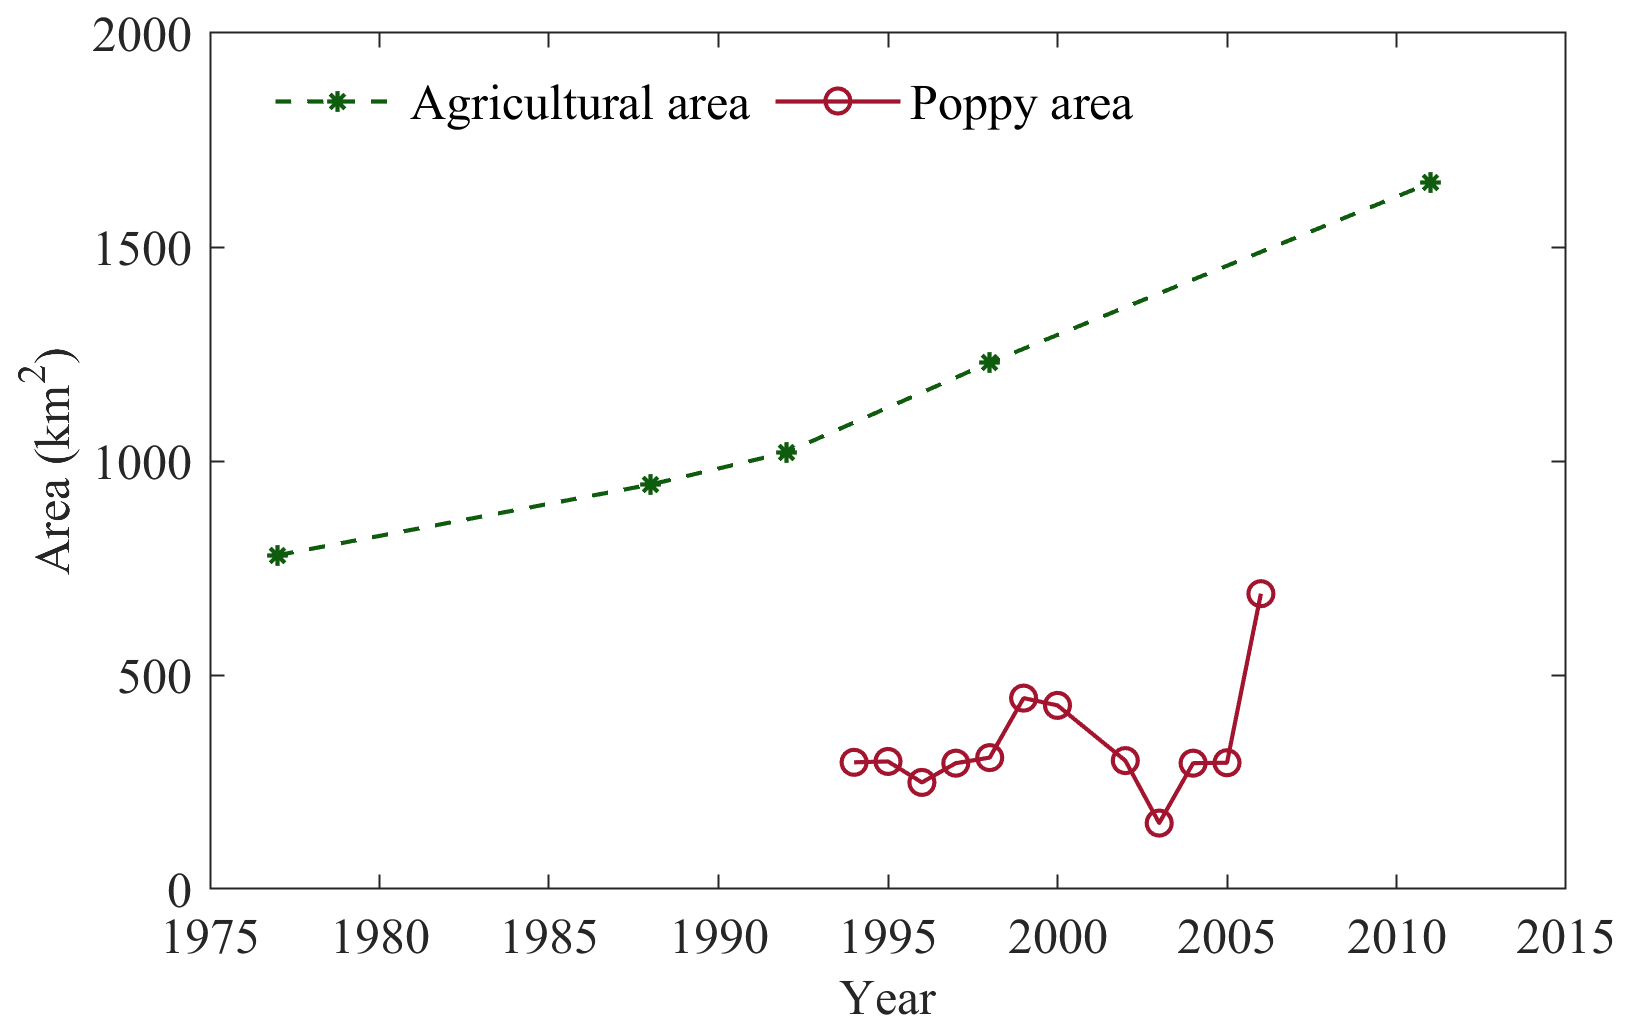
Figure 2Evolution of total agricultural area in the HRB (1976–2011) and poppy-cultivated area thereof (1994–2006).
The HRB is characterized by poor coverage of reliable historic in situ observations of hydro-climatic variables, particularly in the upper parts of the basin, where most of the water in the HRB originates from. Analysis of Hajihosseini et al. (2016) indicated that the spatiotemporal variation in the interpolated historical precipitation and temperature in the gridded Climatic Research Unit (CRU) dataset was largely consistent with available ground observations for Afghanistan. Therefore, we used daily precipitation and temperature estimates here for the 1970–2006 study period (Fig. 1a), downscaled from the monthly Climatic Research Unit time series (CRU TS) 3.10 dataset (Harris et al., 2014), based on the dGen algorithm (Geng et al., 1986) that was previously also applied in other studies (e.g., Schuol and Abbaspour, 2006; Schuol et al., 2008; Hajihosseini et al., 2016). The data were available from https://www.2w2e.com (last access: 20 October 2018; Ashraf Vaghefi et al., 2017) at a spatial resolution of 0.5∘ × 0.5∘.
Daily streamflow observations for the 1970–1979 period are available from the US Geological Survey (https://waterdata.usgs.gov, last access: 30 December 2017) at six gauging stations throughout the HRB (IDs 1–2, 4–7; Fig. 1, Table 1). Note that there were observations available from individual gauging stations at the inlets upstream of the Kajakai Dam (ID1 – UHRBU) and Dahla Dam reservoirs (ID4 – UARBU) as well as at the corresponding outlets downstream of the dams (ID2 – UHRBD; ID5 – UARBD). In addition, monthly flow observations for the 1970–2006 period were available at the inflow to the Sistan Plain (ID8 – SISP).
The analysis of the characteristics and pattern of hydrological droughts in the HRB over the recent decades in this study required a two-step approach. In a first step, the observed streamflow time series (1970–1979; Table 1) had to be extended to cover the full 1970–2006 study period using a hydrological model. In a second step, the modeled streamflow estimates for the 1970–2006 period at eight locations in the HRB were used to analyze hydrological droughts.
4.1 Hydrological model
We used a distributed implementation of a process-based hydrological model, based on the general concept of the flux exchange (FLEX) model family (e.g., Fenicia et al., 2008; Gharari et al., 2014; Bouaziz et al., 2018) to generate estimates of daily discharge from the sub-basins UHRBU (ID1), CHRB (ID3), UARBU (ID4), LARB (ID6), LHRB (ID7), and SISP (ID8). In addition, a simple reservoir-routing scheme was used to estimate outflow from the two reservoirs (ID9–ID10), located at the UHRBD (ID2) and UARBD (ID5). The distributed implementation of this model was chosen as the general model setup was previously successfully applied in climatically similar regions (e.g., Gao et al., 2014, 2017) but also in many other settings worldwide (e.g., Fenicia et al., 2006; Kavetski et al., 2011; Nijzink et al., 2018; Hulsman et al., 2021). In general, the FLEX modeling concept applied here is underlain by a philosophy of model customization and rigorous testing to ensure the implementation of suitable model formulations and the associated more reliable model outputs in different environments (e.g., Fenicia et al., 2011).
4.1.1 Model structure at grid cell scale
The core of the model is five storage components (Fig. 3) that are linked by fluxes and that conceptually represent snow storage Ssn [mm], interception storage Si [mm], storage in the unsaturated root zone Su [mm], a fast-responding component Sf [mm] that generates preferential and overland flow, and a slow-responding groundwater storage Ss [mm]. A lag function represents the lag time between storm and flood peak. The snow module is based on a simple degree-day method that has been effectively applied in many conceptual models (e.g., Parajka and Blöschl, 2008; Konz and Seibert, 2010; Gao et al., 2017; Nijzink et al., 2018; Mostbauer et al., 2018). When the average daily temperature is below a threshold temperature Tt [∘C], precipitation enters the system as snowfall Ps [mm d−1] and is stored in Ssn. When there is snow cover, and the temperature exceeds Tt, snowmelt M [mm d−1], specified by a melt factor Fm [mm ∘C−1 d−1], sets in from Ssn. Precipitation falling as rain Pr [mm d−1] first enters the interception reservoir Si, specified by an interception capacity Imax [mm]. Water evaporates as interception evaporation Ei [mm d−1] from Si at potential rates Ep [mm d−1], while water in Si that exceeds the storage capacity Imax reaches the soil as throughfall Ptf [mm d−1]. The total effective precipitation Pe [mm d−1] infiltrating into the unsaturated soil root zone Su at any given time step is then the sum of Ptf and M (Gao et al., 2014). Water in the unsaturated reservoir Su is, depending on the storage capacity SU,max [mm], either stored and eventually released by plant transpiration ET [mm d−1] or directly released as groundwater recharge Rs [mm d−1] or preferential flow Rf [mm d−1]. The response reservoirs Sf and Ss represent a fast-responding storage component and a slower-responding groundwater component, respectively, that both drain water to the river according to their associated timescales kf [d] and ks [d] so that the total flow can be expressed as [mm d−1]. All relevant model equations are provided in Table S1 in the Supplement.
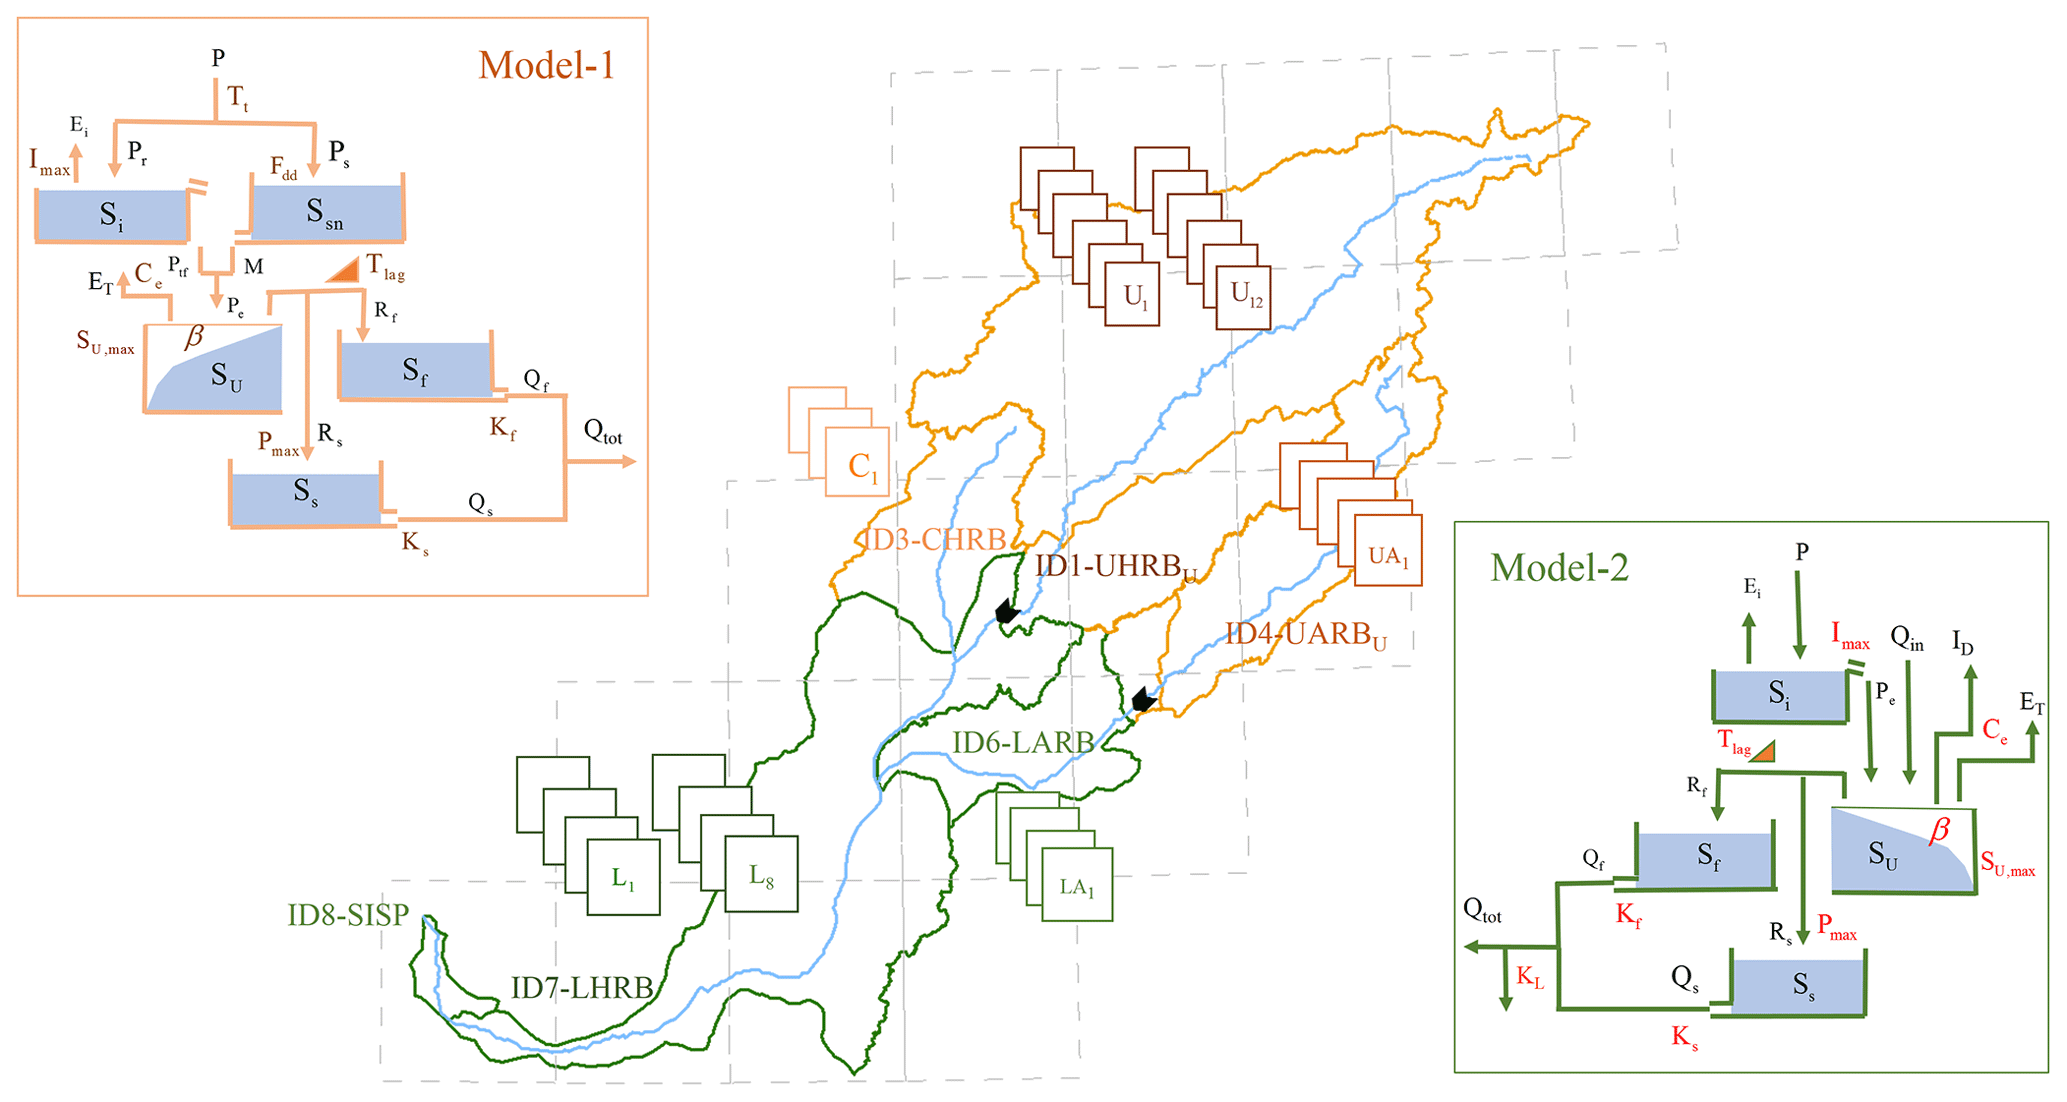
Figure 3The distributed model structure consisting of parallel components (the structure of model 1 used for the UHRB, CHRB, and UARB; model 2 is used in the LHRB, LARB, and SISP) and 32 units of the CRU grid cell, representing one sub-basin each, characterized by an individual parameter set. Variables: P – total precipitation [mm d−1]; Ps – snowfall [mm d−1]; Pr – rainfall [mm d−1]; M – snowmelt [mm d−1]; Ptf – throughfall [mm d−1]; Pe – effective precipitation [mm d−1]; ET – transpiration [mm d−1]; Ei – interception evaporation [mm d−1]; Rf – recharge of fast reservoir [mm d−1]; Rs – recharge of slow reservoir [mm d−1]; ID – irrigation demand for the LHRB and LARB, respectively; [mm d−1]; Qf – runoff from fast reservoir [mm d−1]; Qs – runoff from slow reservoir [mm d−1]; Qtot – total runoff [mm d−1]; Ssn – storage in snow reservoir [mm]; Si – storage in interception reservoir [mm]; SU – storage in unsaturated reservoir [mm]; Sf – storage in fast reservoir [mm]; Ss – storage in slow reservoir [mm]. Parameters: Tt – threshold temperature [∘], Fdd – melt factor [mm deg−1 d−1], Imax – interception capacity [mm], SU,max – storage capacity in unsaturated reservoir [mm], β – shape parameter [–], Pmax – percolation capacity [mm d−1], Ce – runoff generation coefficient [–], Kf – storage coefficient of fast reservoir [d−1], Ks – storage coefficient of slow reservoir [d−1], KL – loss factor [–], and Tlag – lag time [d].
4.1.2 Reservoir routing
Large reservoirs such as the Kajakai (ID9) and Dahla (ID10) Dam reservoirs in the HRB can considerably alter downstream flow regimes (Haddeland et al., 2014; Wada et al., 2016). This has recently received growing attention, and a number of studies have suggested methods to quantify reservoir outflow where reservoir operation rules are largely unknown (e.g., Coerver et al., 2018; Yassin et al., 2019). Here, the effects of the reservoirs were estimated with a simple water-accounting scheme based on elevation–storage and elevation–area relationships provided in a study by Vining and Vecchia (2007) and similar to previous work (e.g., Hanasaki et al., 2006; Wisser et al., 2010):
where Sr is the reservoir storage, and P and Ep are precipitation and potential evaporation over the surface area of the reservoir at the end of the previous time step, respectively. Qin is the inflow to the reservoir, Qout the outflow from the reservoir. Here, the inflows Qin to the two reservoirs were estimated by the hydrological models of the respective upstream sub-basins UHRBU (ID1) and UARBU (ID4). Due to the lack of more detailed data, Qout was estimated in this study based on empirical storage–outflow relationships that relate modeled reservoir storage Sr (Eq. 1) and Qin to observations of Qout, i.e., QID2 and QID5. We decided to develop separate linear relationships for high- and low-flow seasons, i.e., January to June and July to December, respectively, as preliminary analysis suggested that these were more robust than non-linear or piecewise linear relationships for the entire year, as used elsewhere (e.g., Yassin et al., 2019):
where a [d−1], b [–], and c [mm d−1] are coefficients, and the subscripts h and l indicate high- and low-flow seasons, respectively. Note that Qin becomes negligible in the low-flow season, and the relationship collapses to a simple linear regression. Also note that it is plausible to assume that reservoir operation is more careful during drier years than in wetter years and may have changed over the study period. Due to the lack of sufficient data, we developed here only one low-flow and one high-flow relationship for each reservoir over the entire study period.
4.1.3 Model implementation at (sub-)basin scale
The model was implemented in a distributed way, and the flows aggregated to the (sub-)basin scale. To limit the computational requirements, the meteorological input data, available at a spatial resolution of 0.5∘ × 0.5∘, were averaged to run the model at a grid cell size of 1∘ × 1∘ (Fig. 1). The snow (Ssn), interception (Si), and unsaturated (Su) reservoirs in each model grid cell were further stratified into 500 m elevation bands to account for elevation-dependent snow dynamics and the associated differences in liquid water input to the system. The combined groundwater recharge Rs and the combined preferential drainage Rf from all elevation zones in each model grid cell were then computed as the weighted average from all individual elevation zones, based on the areal proportion of each elevation zone (cf. Fenicia et al., 2008; Euser et al., 2015). The flow Qi generated in each of the N grid cells of a (sub-)basin j at any time step t was subsequently routed to the (sub-)basin outlet in a convolution operation with triangular lag functions (e.g. Fenicia et al., 2011) based on lag times τi, proportional to the mean flow distances from the individual i cells to the outlet. In addition, irrigation demand ID [mm d−1] for agriculture was accounted for by direct river water abstractions. The aggregated flow at the outlet of a (sub-)basin was then the sum of all flows routed to the outlet minus irrigation demand, i.e., , of that specific (sub-)basin j, i.e., ID1–ID7. At each time step, irrigation water was then reapplied as input to Su,i in grid cells i of the corresponding sub-basin j that featured agricultural use. Largely being an unregulated irrigation canal system and due to the lack of more detailed information, estimates of were here based on crop coefficients Kc, potential evaporation Ep, and effective precipitation Pe for each day k as well as the agriculturally used area in each year l (Allen et al., 1998), according to .
As a baseline, crop coefficients and the agriculturally used area were estimated based on crop pattern reported by Wardlaw et al. (2013). In that report, the irrigated areas were estimated using satellite imagery from 2010/2011. To account for land-use change over the 1970–2006 study period, the estimates were adjusted to changes in the agricultural area as extracted from available satellite imagery in 1977, 1988, and 1998.
The outflow of sub-basins UHRBU, i.e., QID1, and UARBU, i.e. QID4, was used as inflow to the Kajakai Dam (ID9) and Dahla Dam (ID10) reservoirs, respectively. The resulting estimates of reservoir outflows, i.e., QID2 and QID5 (Sect. 4.1.2), were then used as inflows into the LHRB (ID7) and LARB (ID6), respectively. In addition, the LHRB (ID7) received the outflows QID3 and QID6, while LHRB (ID7) outflow QID7 subsequently drained into the SISP (ID8).
The historical absence of significant snow cover in the sub-basins ID2 and ID5-8 allowed us to omit the snow component and the related parameters from the model in these sub-basins (Fig. 3) and to limit the adverse effects of equifinality (Beven, 2001). Furthermore, as agriculture is largely confined to the sub-basins LARB (ID6) and LHRB (ID7), the redistribution of river water for irrigation was only implemented in these two sub-basins. Similarly, an additional parameter KL was used to account for losses between ID7 (LHRB) and ID8 (SISP). The above differences resulted in two slightly different implementations of the model in the uplands and the downstream regions of the HRB, respectively and hereafter referred to as model 1 and model 2 (Fig. 3). Similar implementations of this model type have in the past proven successful in a range of different environments (e.g., Prenner et al., 2018; Hulsman et al., 2021).
4.1.4 Model calibration and post-calibration evaluation
The models were run on a daily time step in all sub-basins for the entire 1970–2006 period. However, in the absence of suitable data, the models could not be calibrated for all sub-basins and over the entire period. Rather, only the models of the five sub-basin outlets, the UHRBU (ID1), UARBU (ID4), LARB (ID6), LHRB (ID7), and SISP (ID8) (Table 1, Fig. 3), were individually calibrated for the 1970–1975 period to time series of observed flow. Note that all model grid cells in a given sub-basin were run with the same parameter sets but with spatially distributed hydro-climatic forcing (e.g., Ajami et al., 2004; Euser et al., 2015). To limit the effects of equifinality (Beven, 2001) and to ensure robust model implementation (Euser et al., 2013; Hrachowitz and Clark, 2017), we adopted a multi-objective (Gupta et al., 1998) calibration approach, simultaneously using the Nash–Sutcliffe Efficiency (Nash and Sucliffe, 1970) of flows (ENS,Q) and of the logarithm of flows (ENS,log (Q)) as objective functions. The 10 (UHRBU, UARBU) and 8 (LARB, LHRB, SISP) free calibration parameters, respectively, in the individual models were sampled in 106 realizations from uniform prior distributions following a Monte Carlo strategy. The model parameters together with their prior and posterior distributions are given in Table 2. To account for trade-offs in the multi-objective calibration and uncertainties in the modeling process, we kept all parameter sets that fall into the area spanned by the Pareto-optimal set of solutions as feasible (e.g., Fenicia et al., 2007; Gharari et al., 2013). For brevity, we hereafter refer to the solution with the minimum Euclidean distance DE as the “best” solution (Hrachowitz et al., 2014):
Model uncertainty intervals were constructed from the parameter sets that were retained as feasible using DE as an informal likelihood measure to weight each solution (cf. Freer et al., 1996).
Table 2Uniform prior and posterior distributions of model parameters for the calibrated models. The posterior column distributions show the parameter values of the best available parameter set as well as the 5th and 95th percentiles of feasible solutions (in brackets). Note that the loss factor KL had negligible influence and was thus set to 0 for the models of ID6 and ID7 to keep to the principle of model parsimony.

In addition, to estimate water release from the associated sub-basins downstream of the reservoirs UHRBD (ID2) and UARBD (ID5), storage–outflow relationships for the reservoirs (ID9–ID10; Eq. 2) were established as ordinary-least-square estimates based on inflows from the calibrated upstream sub-basins (UHRBU, ID1; UARBU, ID4), Eq. (1), and observations of reservoir water release in the 1970–1975 period. The parameter ranges for all solutions retained as feasible for all calibrated hydrological models and both reservoir-routing schemes are given in Table 2. Note that, due to physiographic similarity, the uncalibrated model for the CHRB (ID3) was run with the same parameter sets as the UHRBU (ID1).
The robustness of the calibrated model and its ability to reproduce the time series of daily flow with respect to ENS,Q and ENS,log (Q) in the four calibration sub-basins as well as downstream of the reservoirs were evaluated for the independent 1976–1979 test period, hereafter referred to as “validation period”. In addition, the model output was evaluated against the monthly time series of flow at the SISP (ID8; Table 1, Fig. 1) for the entire 1976–2006 study period.
4.2 Drought indices
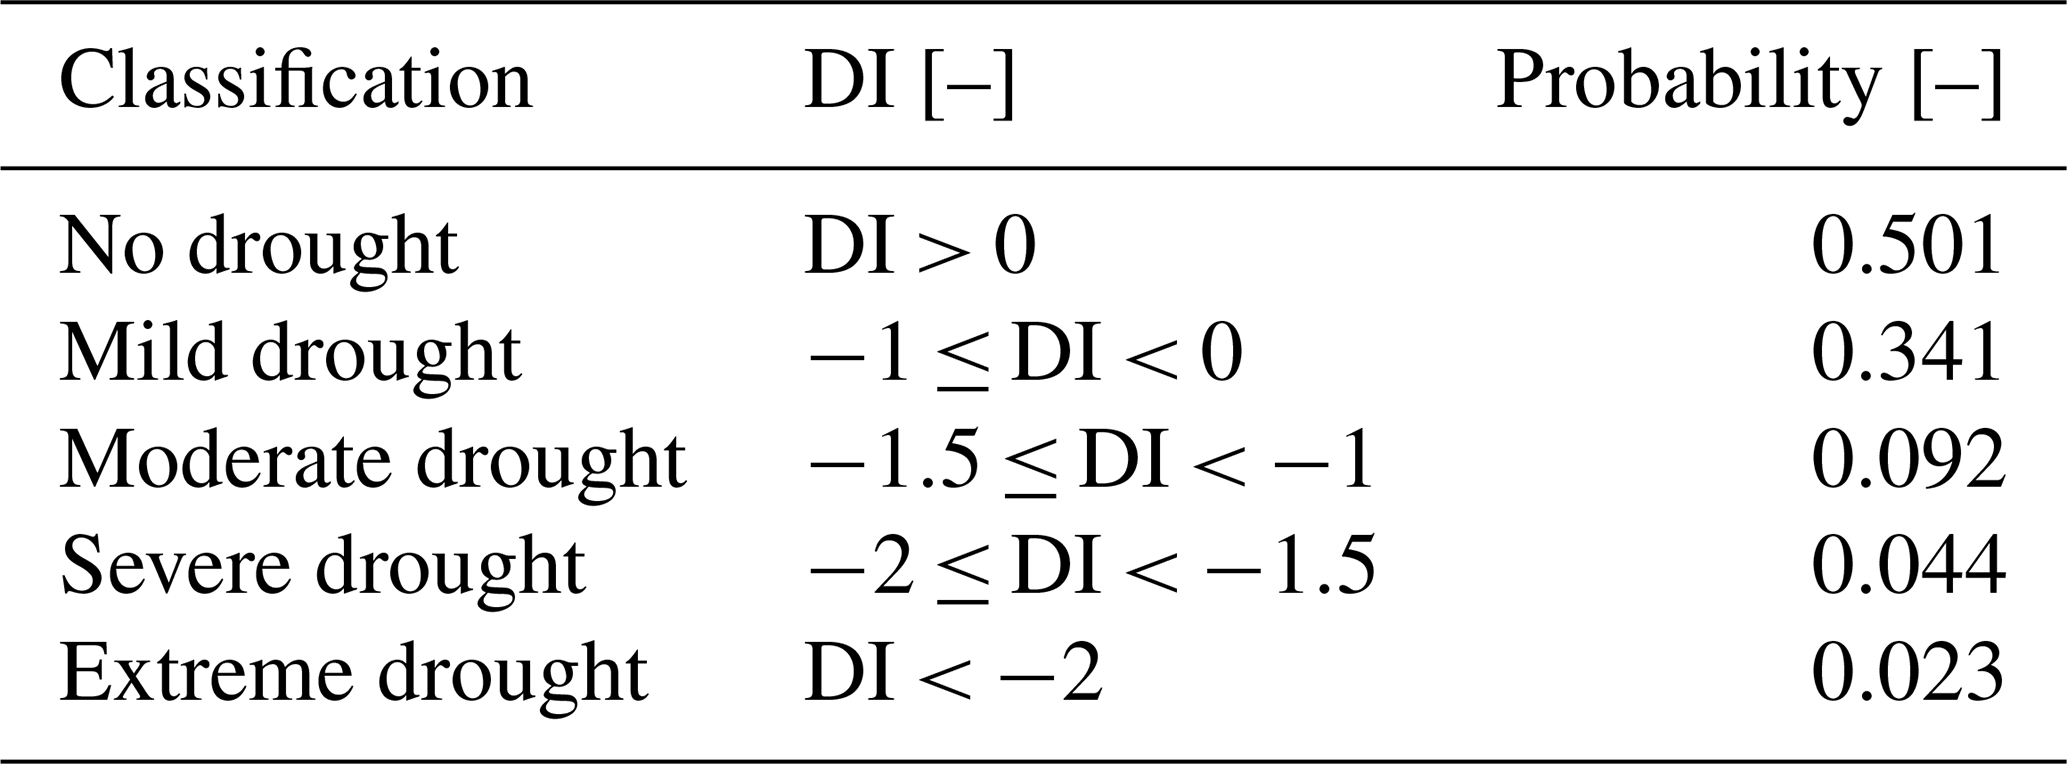
Three previously developed drought indices, based on the general concept of standardized deficits (e.g., Moravec et al., 2019), were used here to isolate the individual influences of different factors on hydrological drought in the HRB. The role of climatic variability and thus meteorological drought was quantified with the standard precipitation index (SPI) as introduced by McKee et al. (1993), which gives information about deficits in atmospheric water supply, and with the standardized precipitation evapotranspiration index (SPEI; Vicente-Serrano et al., 2010), which describes the interaction of precipitation and energy supply as moisture deficit , and thus the additional role of atmospheric water demand. In contrast, hydrological drought was quantified with the streamflow drought index (SDI; Nalbantis and Tsakiris, 2009). Differences between the SPI and SPEI on the one hand and between the SPI and SDI on the other hand were subsequently used to analyze for potential effects of anthropogenic influences, such as irrigation water abstraction. In a parametric approach, two-parameter gamma distribution functions were fitted here to precipitation P and flow Q and then mapped to standard normal distributions using equal probability transformations (Edwards and McKee, 1997) to estimate the dimensionless drought indices SPI and SDI, respectively (e.g., Lloyd-Hughes and Saunders, 2002; Nalbantis and Tsakiris, 2009; Mishra et al., 2018), whereas generalized extreme value (GEV) distributions were fitted to moisture deficit D to estimate the SPEI for each sub-basin (Stagge et al., 2015). The goodness of fit of two-parameter gamma distributions for the SPI and SDI as well as for the GEV distribution for the SPEI is provided in Figs. S1–S3 in the Supplement. The drought indices can be computed over different timescales, thus leading to differences in the accumulation of deficits for the corresponding variables (e.g., McKee et al., 1993; Van Loon and Laaha, 2015). Here the drought indices were computed for each month using a timescale of the 12 preceding months as accumulation periods as these were previously found to be the most balanced timescale that gives a balance between short-term and long-term effects (e.g., Raziei et al., 2009; Gocic and Trajkovic, 2013; Spinoni et al., 2014). All normalization was carried out relative to the full 1970–2006 study period. Droughts and their associated occurrence probabilities were classified according to the scheme suggested by McKee et al. (1993), as shown in Table 3. Since the drought indices are standardized, the same drought category thresholds were used here for all three of them.
Table 3Classification of standardized drought indices (DIs) used in this study (SPI, SPEI, and SDI).
In the following, the three drought indices were used to analyze different drought characteristics. It was investigated if drought frequency, duration, severity, and intensity exhibit systematic shifts over time or changes in their longitudinal propagation from upstream to downstream over the 37-year study period. Drought frequency DF [month yr−1] was here defined as the average number of months per year over a specific period in which the respective drought index, i.e., SPI, SPEI, or SDI, had a value (Table 3). Drought duration DD [month] was defined as the period of consecutive months with drought indices continuously . Drought severity is defined as the total deficit Dtot [–] of the SPI, SPEI, or SDI, respectively, accumulated during all individual continuous drought periods over a specified period and, to allow comparability, normalized by the total number of months N in the time period considered, i.e., [month−1]. Drought intensity is expressed as the ratio [month−1] (Huang et al., 2016).
5.1 Model performance
The hydrological models captured the magnitudes and dynamics of daily flow relatively well when compared to observations available for both the sub-basins upstream of the reservoirs, i.e., UHRBU (ID1; Fig. 4a) and UARBU (ID4), and for those further downstream, i.e., LARB (ID6) and LHRB (ID7; Fig. 4c). For the calibration period, the “best” solutions exceeded and for all five calibrated sub-basins (Table 4). Similar values were found for the validation period, with and . The empirical relationships to route flows through the reservoirs during high- and low-flow periods (Eq. 2) were characterized by R2=0.80 and 0.57, respectively, for the Kajakai Dam reservoir (ID9) and R2=0.92 and 0.76, respectively, for the Dahla Dam reservoir (ID10). Although the storage–discharge relationships are statistically significant (p<0.001), the effect size for low-flow periods remains modest. However, a preliminary sensitivity analysis, based on 100 low-flow time series of reservoir outflows, sampled from the 5th and 95th confidence intervals of the low-flow storage–discharge relationships, suggests that this uncertainty in the relationships has only very limited absolute effects on downstream outputs (Fig. S4 in the Supplement). Overall, the resulting flows at the UHRBD (ID2) and UARBD (ID5) could be reproduced with and for the calibration period and comparable performances during the validation period (Fig. 4b, Table 4). The ability of these models to reproduce flow in the upstream regions resulted in a robust representation of flow in the downstream Sistan Plain (SISP; ID8) for the entire validation period 1976–2006 without further calibration (Fig. 4d, Table 4). Hydrographs of sub-basins not shown in Fig. 4 are provided in Fig. S5 in the Supplement.
Table 4Model performance metrics for calibration and validation in all study sub-basins. The values include the best-performing model as well as the range of all solutions retained as feasible (in brackets).
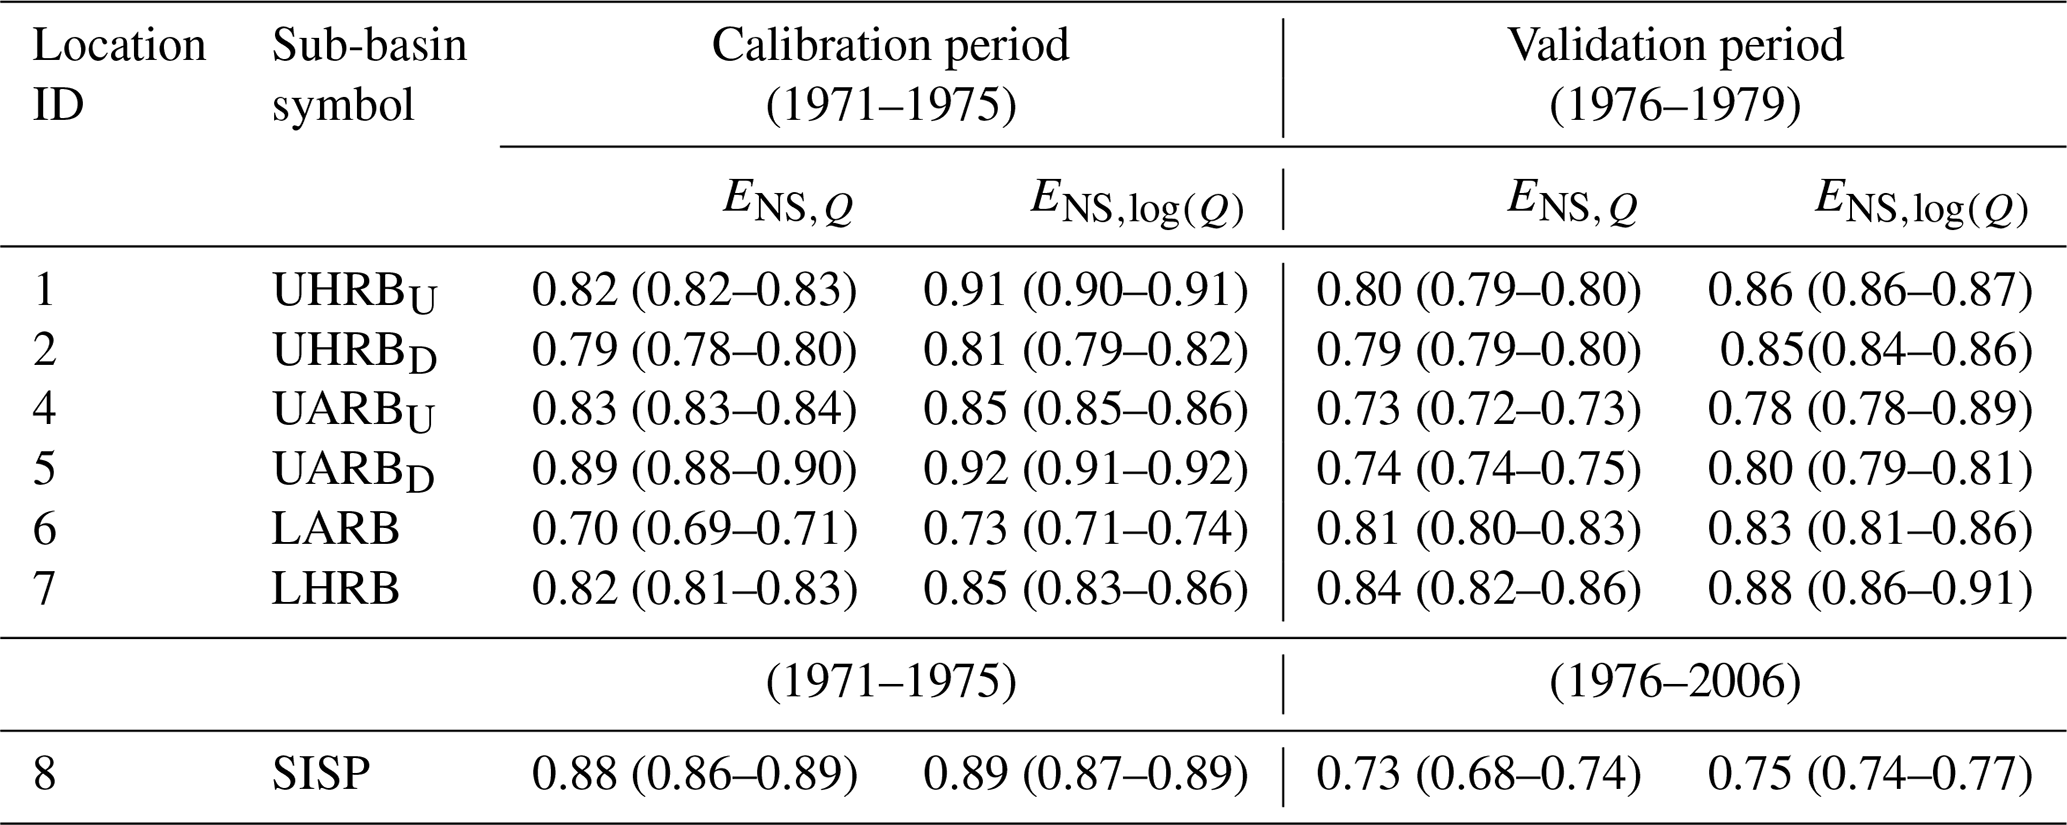
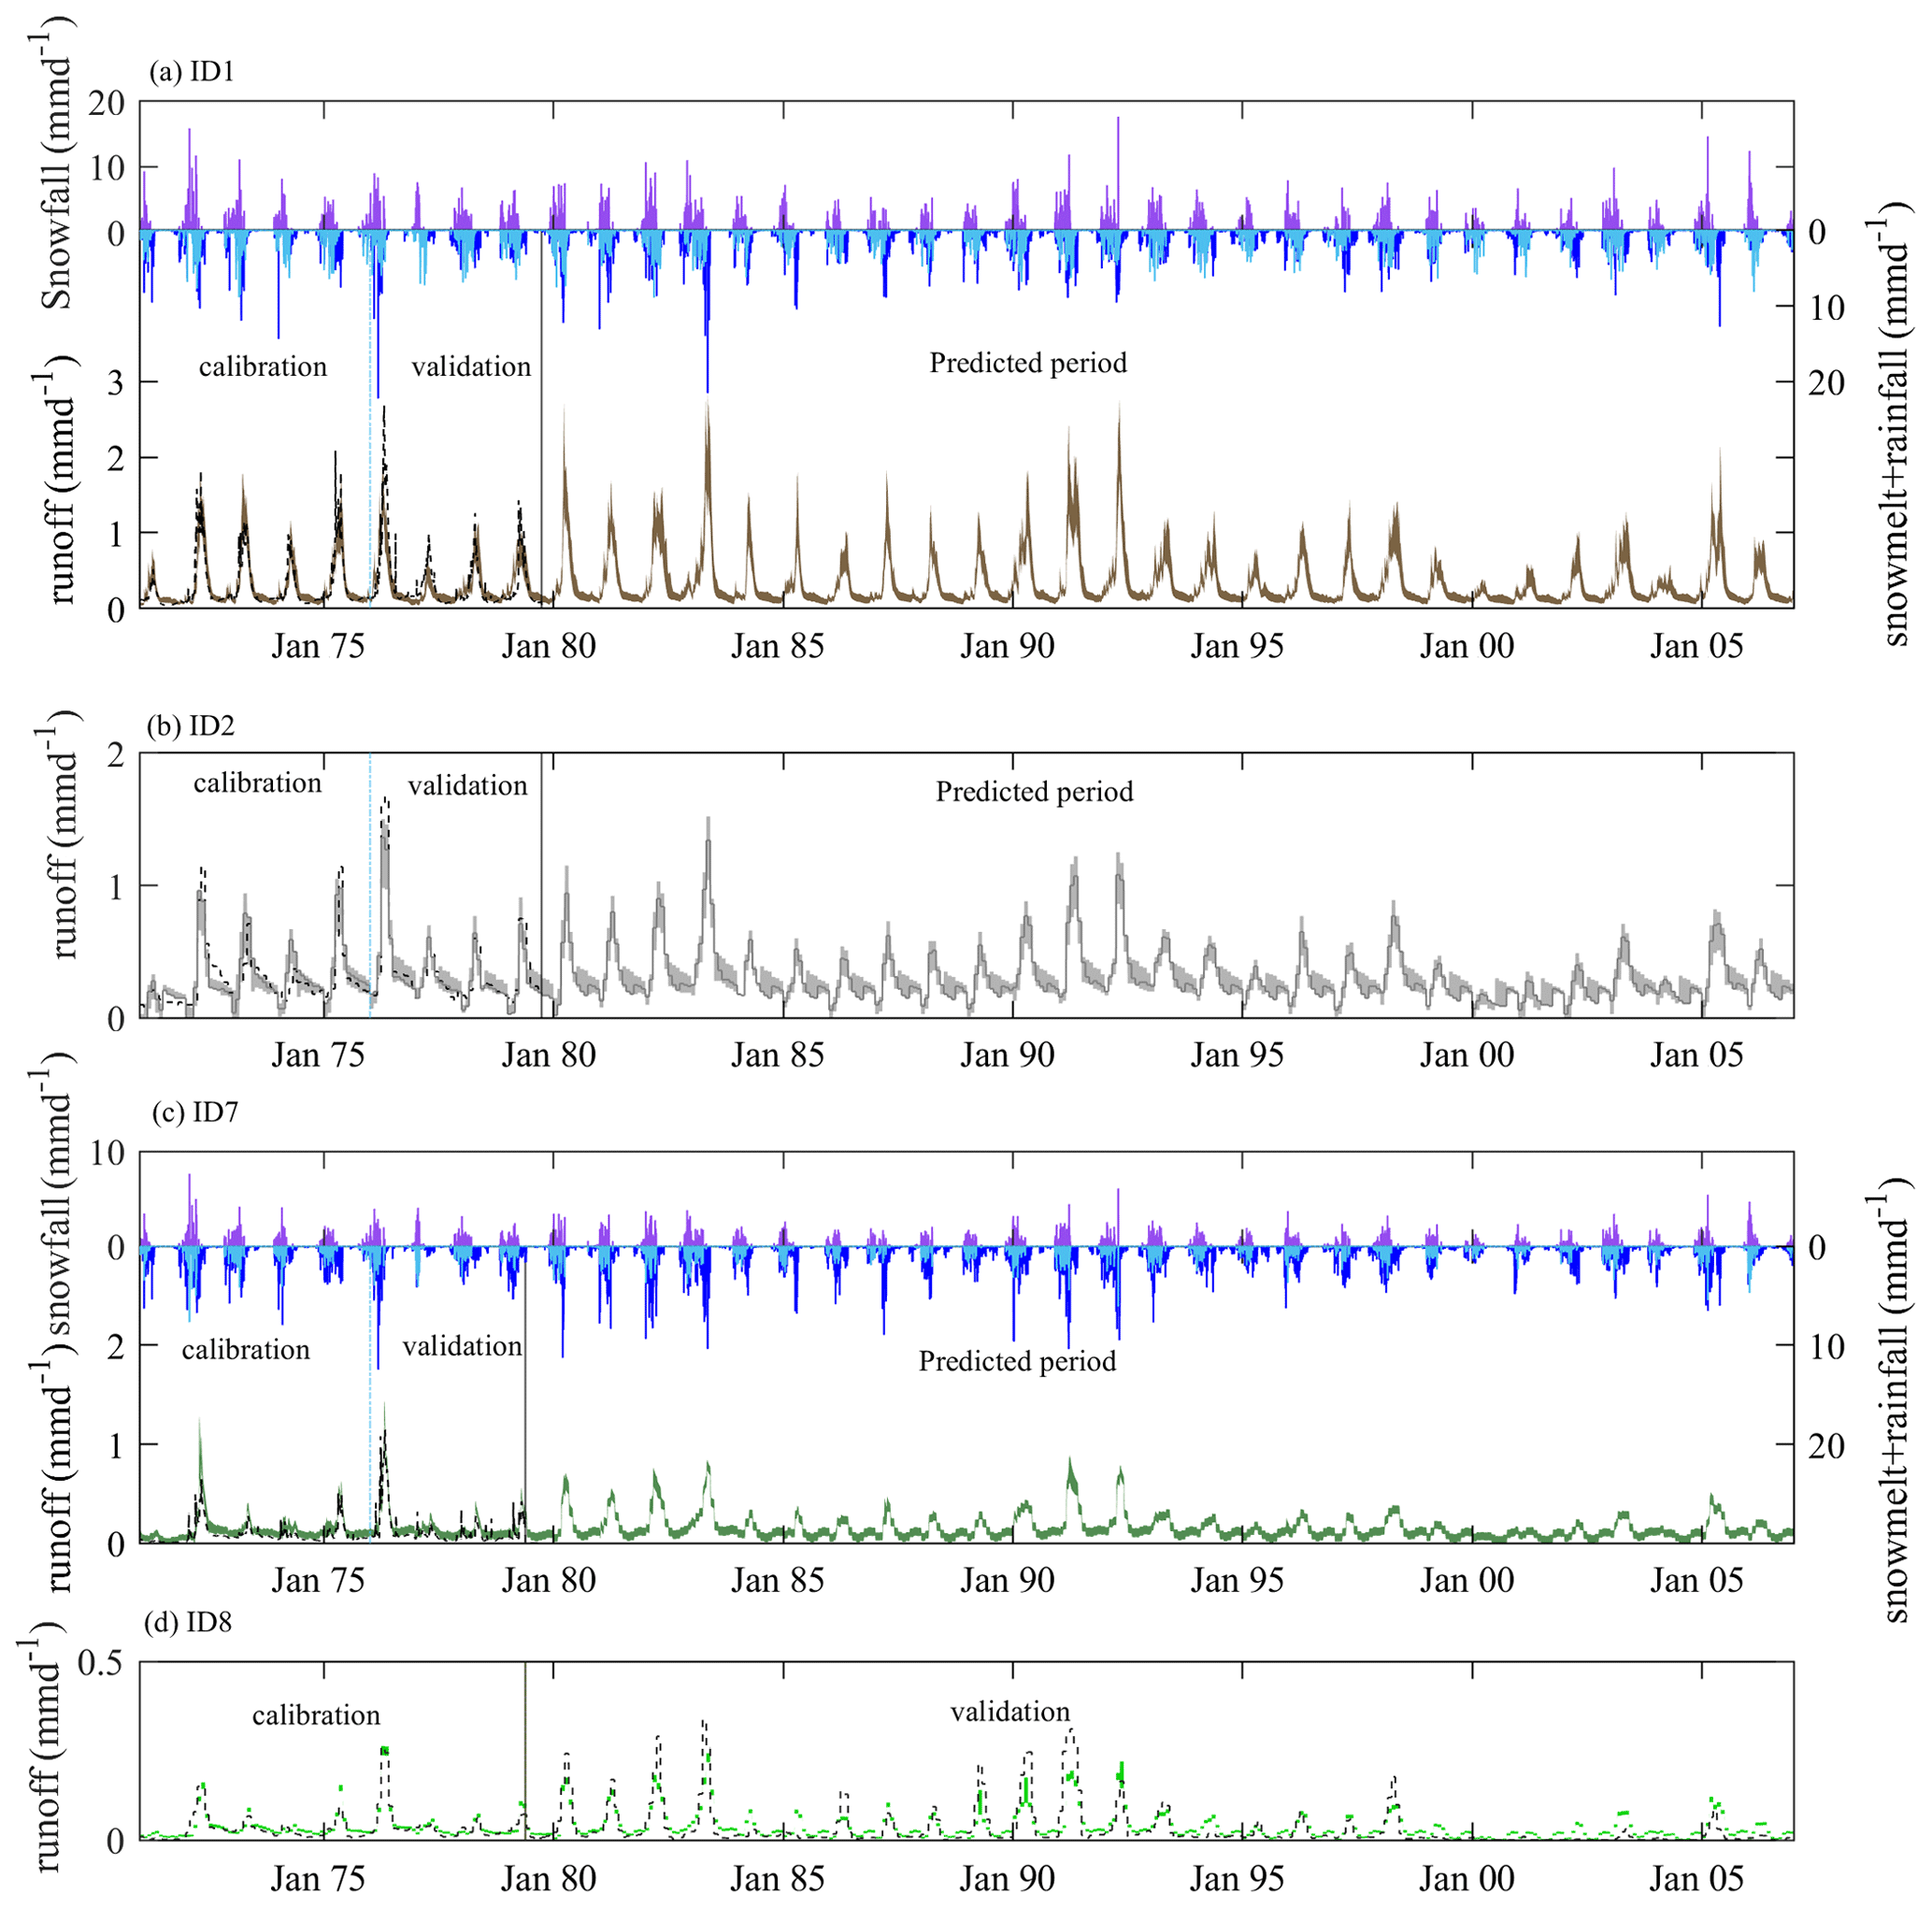
Figure 4Precipitation and streamflow in the UHRBU (ID1), UHRBD (ID2), LHRB (ID7), and SISP (ID8). The purple bars show the modeled snowfall PS [mm d−1], the dark-blue bars the modeled snowmelt M [mm d−1], and the light-blue bars the modeled rainfall PR [mm d−1]. The dashed black lines indicate the observed runoff and the shaded areas the uncertainty ranges of modeled runoff during calibration, validation, and prediction periods.
In general, the estimated water release from the reservoirs results in overall model outputs in all downstream basins being widely consistent with the observed daily river flow, which at station SISP (ID8) is even true for the entire 37-year study period. In spite of all other sources of uncertainty throughout the modeling process, this can be seen as an indication of the plausibility of the modeled reservoir outflow.
It could be observed that annual peak flows in spring are mostly generated by a combination of snowmelt from the high-elevation parts of the HRB, i.e. in sub-basins ID2, 3, and 4, and additional, relatively high-intensity rainfall events (Fig. 4). The filling of the two reservoirs attenuates downstream flows, including the annual peaks, throughout spring and into early summer. In turn, the gradual release of water from the reservoirs sustains downstream summer and autumn flows, almost doubling long-term average low-flow rates as compared to natural-flow conditions (Figs. 4, 5), to meet irrigation demand in the downstream Helmand valley and to satisfy flow requirements of the Sistan River in Iran under the Iranian–Afghan Helmand River Water Treaty (1973).

Figure 5Mean observed and modeled inflow, outflow, and storage volume at (a) the Kajakai and (b) Dahla Dam reservoirs during the 1970–1979 period.
Furthermore, the models adequately reproduced the losing character of the downstream sub-basins, including the LHRB (ID7) and SISP (ID8). Thus, in this highly water-limited environment, these sub-basins do not generate relevant volumes of flow. Rather, most of the precipitation and, in addition, significant volumes of water entering the LHRB (ID7) and eventually the SISP (ID8) as flow from upstream eventually evaporate. Besides this, streamflow draining into the LHRB (ID7) and crossing a hyper-arid desert region is reduced by about 60 % before reaching the SISP (ID8), as specified by the calibrated loss factor KL. These streamflow reductions cannot be explained by deep infiltration losses and soil evaporation alone in this essentially vegetation-free environment. There is another, even much more plausible source of these observed and modeled flow reductions: when the Helmand River reaches Iran, it bifurcates just upstream of the gauge at the SISP (ID8) into the Sistan River (SISP, ID8), which drains into the Hamun wetlands, and the completely ungauged Common Parian River, which follows the border between Iran and Afghanistan. The magnitudes of flow diversion are undocumented, and merely Burger (2005), in a study of the Helmand River of Afghanistan and Iran, loosely mentioned potential uncertainties arising from this diversion into the Common Parian River. Therefore the lumped loss factor (KL) combines the effects of deep infiltration (e.g., Schaller and Fan, 2009; Bouaziz et al., 2018; Condon et al., 2020), evaporation, and particularly the proportion of water which is diverted into the Common Parian River.
Overall, following a multi-objective calibration strategy, i.e. simultaneously using ENS,Q and ENS,log (Q) as calibration objectives to ensure good representation of both high and low flows, our model performances with respect to daily flow in all sub-basins (Table 4, Fig. 4) exceed those of the studies of Hajihosseini et al. (2016) but also those of Hajihosseini et al. (2019), who assessed the monthly flow with the SWAT model in the upper and lower Helmand basins, respectively.
5.2 Temporal pattern of drought
5.2.1 SPI
Multiple meteorological-drought events in terms of the SPI occurred in the HRB throughout the 1970–2006 study period (Fig. 6a). An average mean drought frequency across all sub-basins of the HRB of month yr−1 characterized the 1970–1979 decade. This is higher than in the subsequent 2 decades, during which DF,SPI reached 0.5 and 0.3 month yr−1, respectively. The last part of the study period, 2000–2006, experienced more precipitation deficits again, resulting in frequent drought spells with month yr−1. A similar pattern was found for drought duration. While the 2 decades in the middle of the study period experienced mean drought durations across all sub-basins between and 1.6 months, much longer droughts occurred in the first and last decades, with and 21.1 months, respectively, (Fig. 6a). Reflecting the above, the mean drought severity and intensity were also more pronounced at the beginning and towards the end of the study period, with the lowest mean and month−1, respectively, in the 2000–2006 period as compared to the highest and month−1 in the wetter period between 1980 and 1999. Notwithstanding the fluctuating pattern in these drought descriptors over the study period, pairwise comparisons of the decadal distributions of basin-average annual SPI values using Wilcoxon rank-sum tests indicated that there is no significant difference between any of the decadal SPI distributions (p>0.05), as also shown in Fig. 7a. Correspondingly, no temporal trends in the time series of the annual SPI could be detected based on Mann–Kendall tests (Kendall, 1975) for the HRB or any sub-basin therein (p>0.05; Fig. 7b). The outputs of the drought analysis with a discretization of the study period into two 20-year periods resulted in equivalent interpretations (Fig. S6a): in spite of slightly more pronounced DF,SPI, DD,SPI, and DS,SPI in the 1990–2006 period, the differences to the 1970–1989 period are statistically not significant (p>0.05).
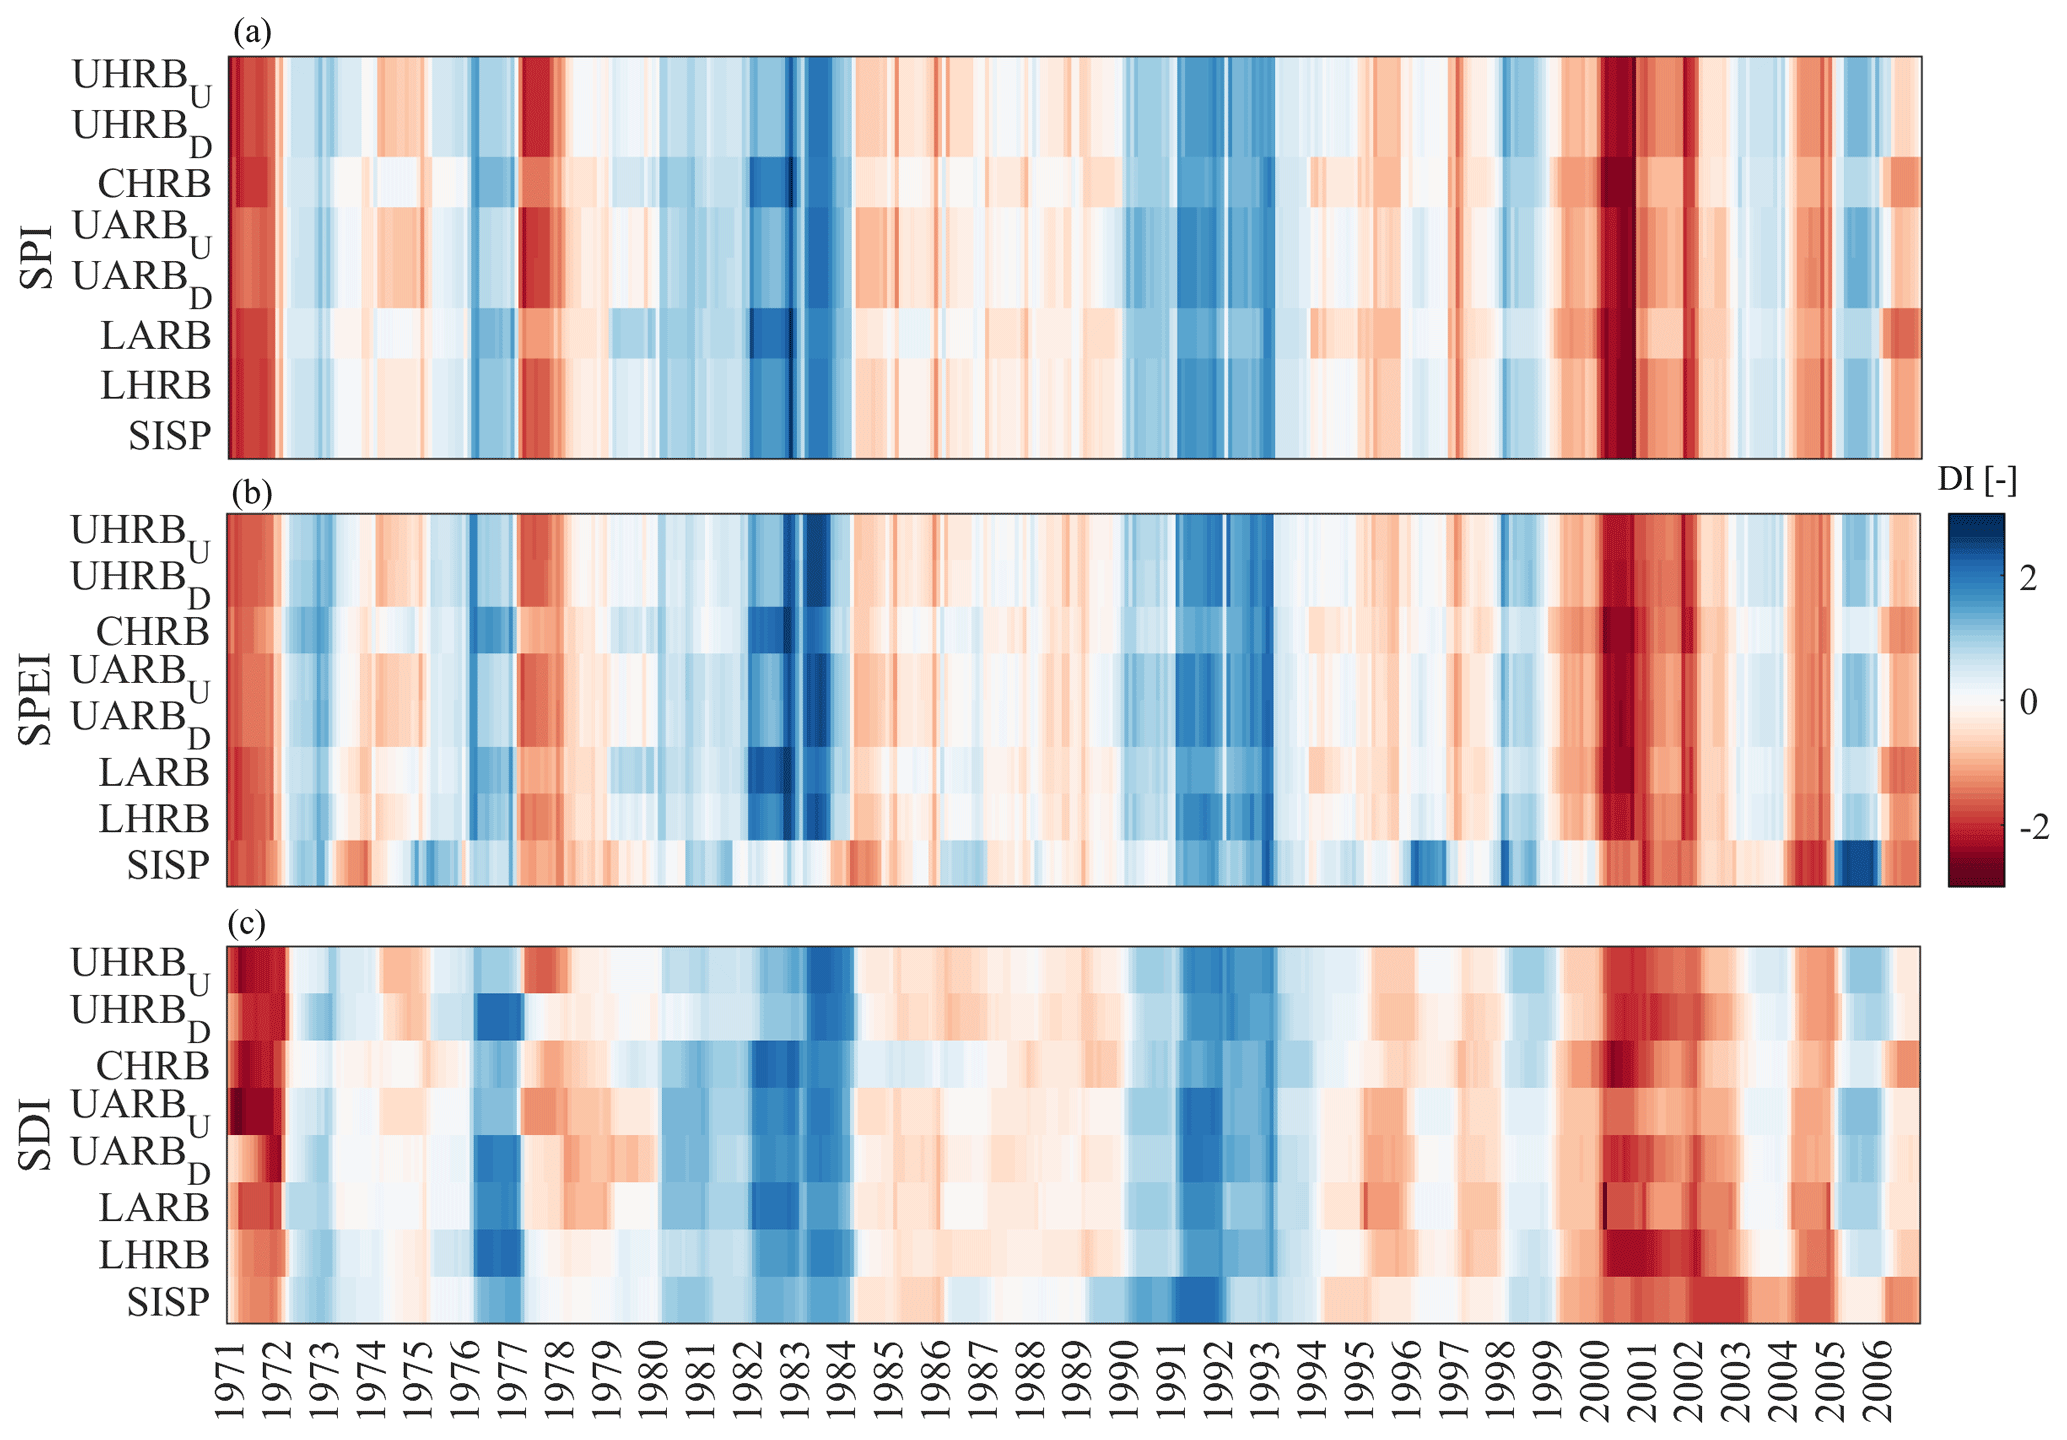
Figure 6Time series of monthly drought indices (based on 12 months of accumulation time) SPI, SPEI, and SDI for the sub-basins ID1–ID8 for the 1970–2006 study period.
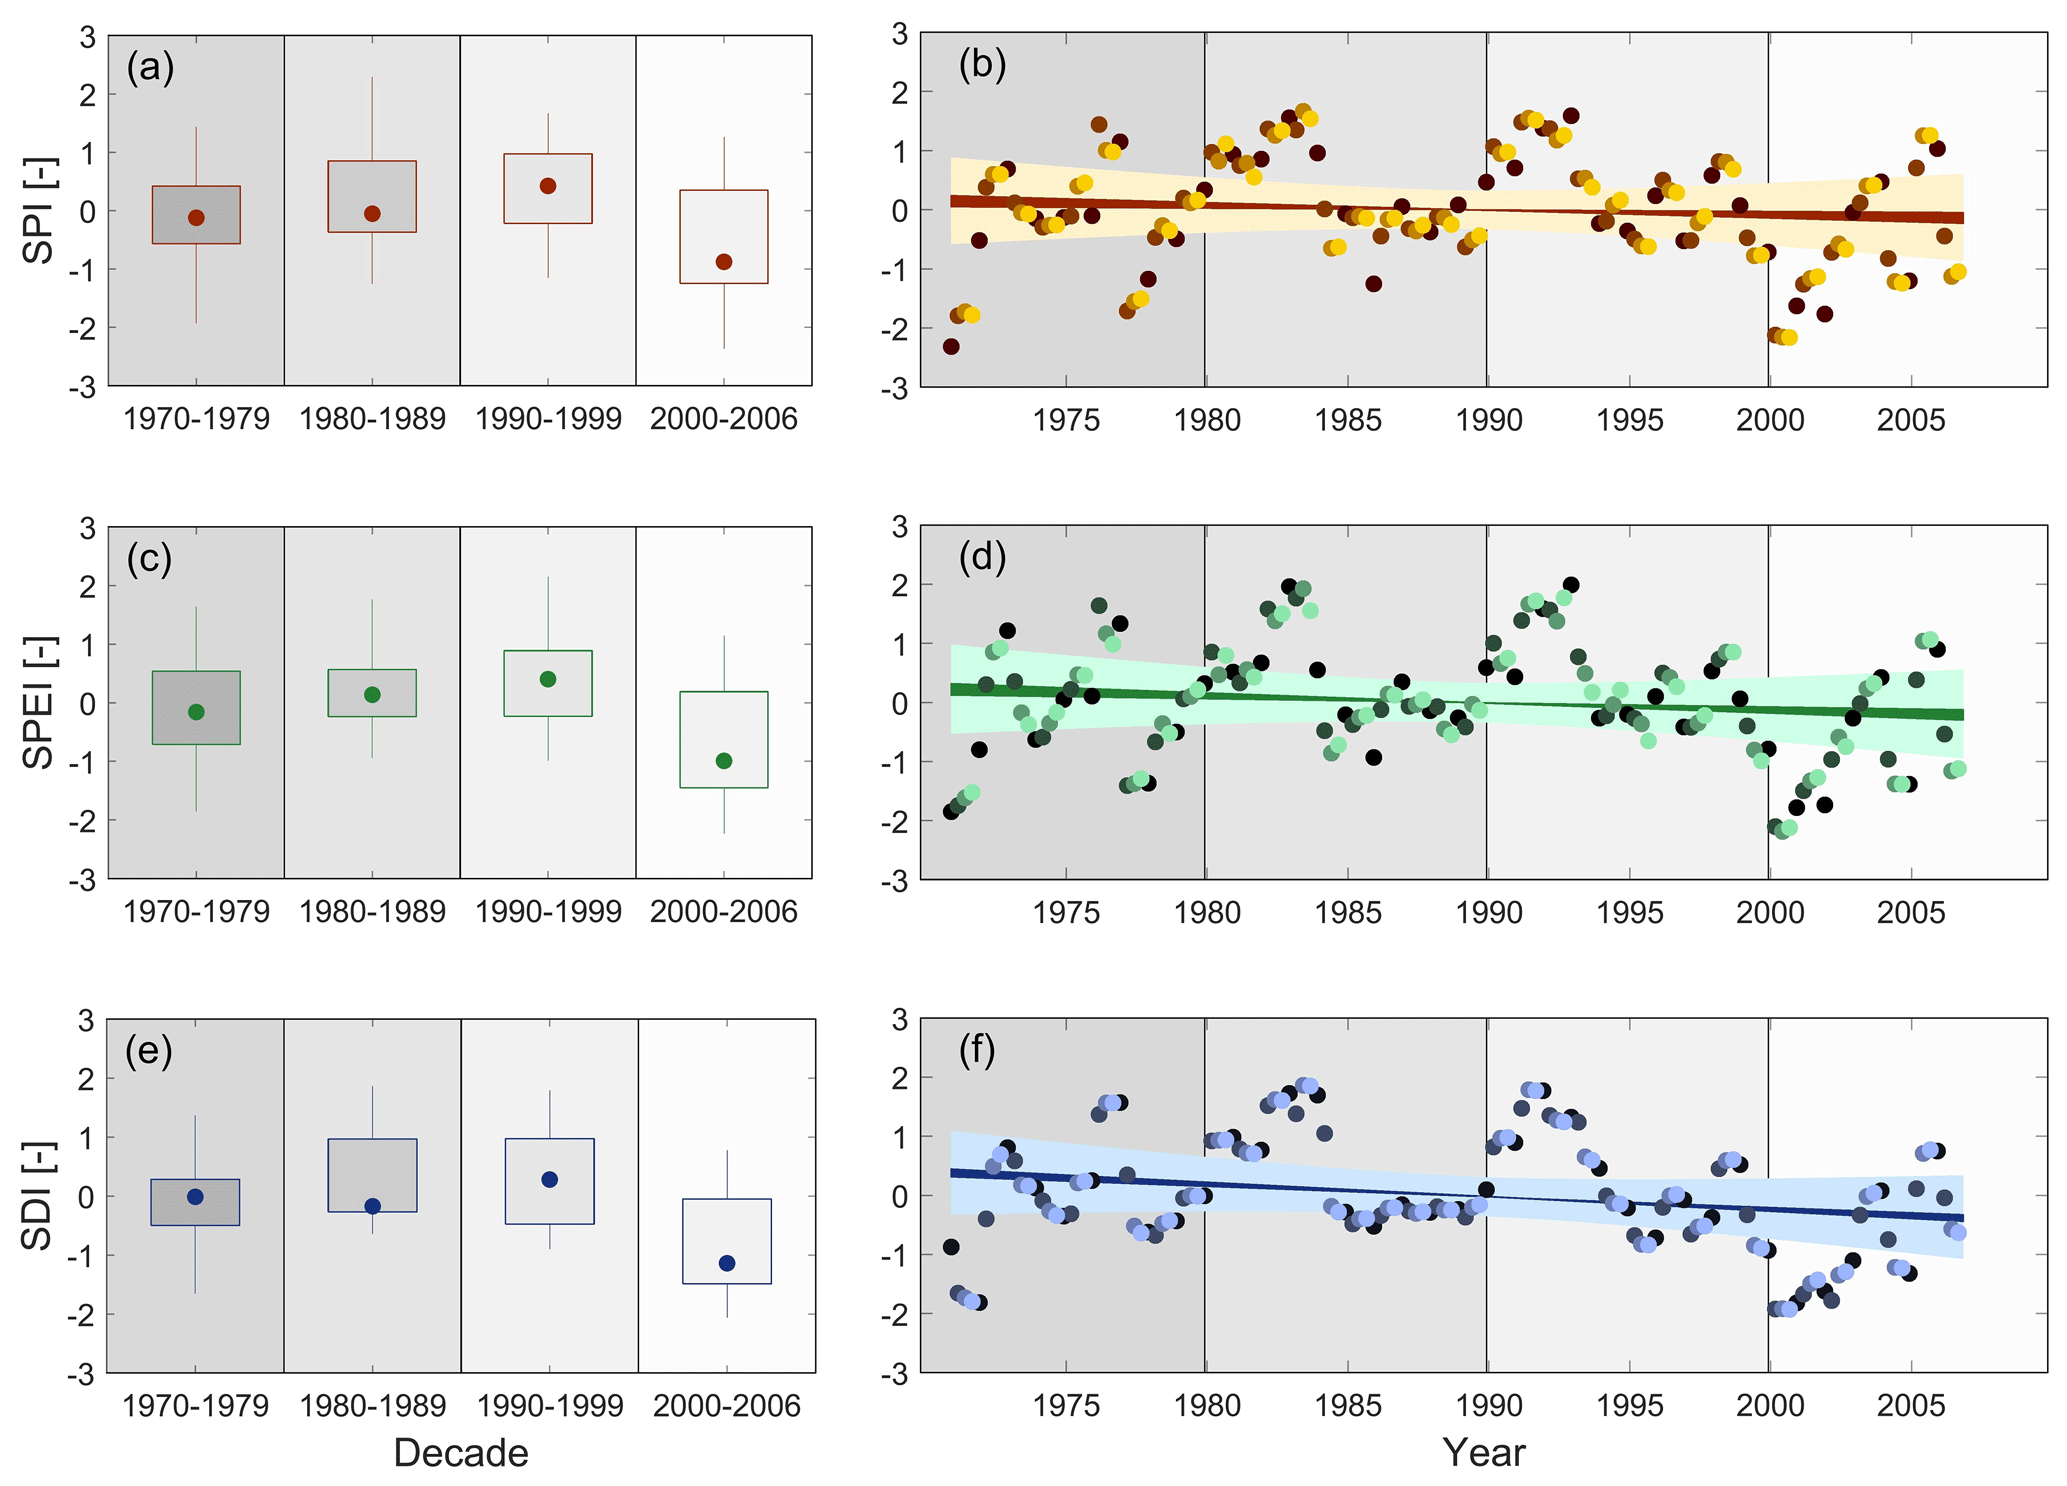
Figure 7Decadal distributions and time series of mean basin (a–b) SPI, (c–d) SPEI, and (e–f) SDI over the study period. The dots in the box plots indicate the median values and the whiskers the 5th and 95th percentiles. The dark-to-light shaded dots in the time series plots indicate the monthly drought indices (based on 12 months of accumulation time) for January, April, July, and October, respectively. The dark shaded areas indicate the envelope of trend lines for the trends estimated based on January, April, July, and October, respectively. The light shaded areas show the associated envelope of the 5th and 95th confidence intervals.
Although these results support the findings of Miyan et al. (2015), who reported that Afghanistan experienced unusual droughts from 1995 onwards until the heavy snow falling in the 2002–2003 winter season, precipitation and the associated meteorological drought did not, in spite of decadal fluctuations, experience a systematic change in the HRB over the 4 study decades.
5.2.2 SPEI
The temporal pattern of drought in terms of the SPEI, reflecting the combined effects of precipitation water supply and atmospheric water demand, similarly indicates the occurrence of multiple periods of severe drought in all sub-basins throughout the HRB during the 1970–2006 study period (Fig. 6b). The temporal fluctuations in the SPEI broadly correspond with those in the SPI, suggesting that most drought events are largely controlled by water supply and thus precipitation deficits rather than by increased atmospheric water demand in this arid region. More specifically, mean drought frequency across all sub-basins decreased from month yr−1 in the 1970–1979 decade to around 0.2 month yr−1 in the following 2 decades. In the last decade of the study period, however, a pronounced increase in drought frequency to month yr−1 was observed (Fig. 6b). While individual drought events had average durations between and 2.4 months in the 2 middle decades across all sub-basins, this was substantially higher, with DD,SPEI = 9.9 months, in the first decade and even increased to 15.8 months in the extreme drought of the 2000–2006 decade. Drought severity and intensity remained at relatively modest levels, not falling below and month−1, respectively, in the 1980–1999 period. In contrast, the first and last decade were characterized by much more pronounced severity and intensity, with the lowest mean and month−1, respectively, occurring during the 2000–2006 period. Similarly to the SPI, Wilcoxon rank-sum tests showed that there is mostly no systematic and significant difference between the decadal distributions of the basin-average SPEI (p>0.05), with the exception of the 2000–2006 decade, during which the SPEI is significantly lower than during the 1990–1999 decade for most sub-basins (p≤0.05), as shown in Fig. 7c. The temporal sequence of a slight SPEI increase during the first 3 decades followed by a sharp decrease during the multi-year drought in 2000–2006 likewise illustrates that there is no systematic trend in the time series of the SPEI in the HRB or any sub-basin therein over the study period (p>0.05; Fig. 7d). The results of the same analysis over two 20-year periods similarly suggest that the 1990–2006 period was slightly more drought-affected, with somewhat more frequent, longer, and more severe droughts as compared to the 1970–1989 period, yet the overall differences are statistically not significant (p>0.05; Fig. S6b).
5.2.3 SDI
Streamflow drought, as specified by the SDI, was quantified based on streamflow estimates as obtained from the best available model solution for each of the eight sub-basins. It could be observed that the SDI largely follows the temporal pattern in the SPI and SPEI (Fig. 6c), respectively, with a relatively low lag time of ≤1 month in all sub-basins throughout the HRB, as suggested by a cross-correlation analysis between time series of the monthly SPI, SPEI, and SDI in the individual sub-basins (r=0.66–0.91; p<0.05; not shown). However, it can also be observed that, overall, SDI drought events are less pronounced than SPI and SPEI droughts occurring at around the same time. More specifically it was found that the mean drought frequency across all sub-basins fluctuated between and 2.0 month yr−1 in the first 3 decades of the study period. In the 2000–2006 decade, it experienced a marked increase to month yr−1. Similarly, mean drought duration, with months, was highest in that decade. In the other decades the mean DD,SDI did not exceed 11.3 months. Closely reflecting the pattern of the SPI and SPEI, mean drought severity and intensity across all sub-basins were most pronounced in the first and last decades, with both DS,SDI and DI,SDI reaching minimum values of −0.9 and −1.5 month−1, respectively, in the 2000-2006 period. During the wetter decades in between, DS,SDI and DI,SDI did not decrease below values of −0.1 and −0.9 month−1, respectively.
Following a pairwise comparison of all decadal basin-average SDI distributions, the slight yet statistically insignificant increase in the decadal SPI and SPEI distributions (p>0.05; Fig. 7a, c) from 1970–1999 could not be observed in the SDI, which remained rather stable during the first 3 decades (Fig. 7e). In contrast, the decrease in the SPEI in the last decade is reflected in a correspondingly lower basin-average SDI in the 2000–2006 period (p≤0.05; Fig. 7e) (Li et al., 2019; Noorisameleh et al., 2020). However, the time series of the basin-average SDI did not exhibit a significant trend (p>0.05; Fig. 7f). In contrast, comparison of the two 20-year periods (1970–1989 and 1990–2006) suggests higher drought frequency, longer duration, and more pronounced severity and intensity, respectively, as compared to the 1970–1989 period. Based on a Wilcoxon rank-sum test, there is a systematic and significant difference between the basin-average SDI distributions for the two 20-year periods (p>0.05; Fig. S6c), indicating a shift from mild to severe hydrological drought in the study area.
5.3 Spatial pattern, synchronicity, and propagation of drought
5.3.1 SPI
In most years of the study period, meteorological drought, as specified by the SPI, exhibits considerable spatial coherence and synchronicity throughout the HRB (Fig. 6a). In other words, at any given time, the entire HRB experiences similar relative precipitation deficits (or surpluses), with a median r=0.97 (p < 0.05), as obtained from a Spearman rank correlation between the time series of the SPI across all sub-basins. Regional differences in the SPI remain limited to parts in the central HRB, i.e., CHRB (ID3) and LARB (ID6; Fig. 6a). In contrast to the remainder of the HRB, these two sub-basins are characterized by multiple periods that are, in relative terms, more humid, such as in 1974 or 1982, but also by periods that are, in comparison, considerably drier, such as 1987 or 1994. The elevated degree of spatial coherence and synchronicity in the SPI on the scale of the HRB is further illustrated by the comparison of the upstream and downstream decadal SPI distributions (Fig. 8a). No significant differences (p > 0.05) between the SPI distribution of the six most-upstream sub-basins (ID1–ID6) and the SPI distribution of the two most-downstream sub-basins, LHRB (ID7) and SISP (ID8), could be found in any of the 4 decades during the study period. To provide some more explicit spatial context, the spatial distribution of the SPI at the resolution of the individual model grid cells for 4 selected years is shown in Fig. 9a–d. Compared to the SPI aggregated at the scales of the individual sub-basins (Fig. 6a), this more detailed picture corroborates the level of large-scale spatial coherence in spite of somewhat increased local variations in the SPI (Fig. 9a–d). A rather rare exception is the year 1987, which was characterized by a substantial north–south gradient in SPI spatial variations and whose extent is largely masked by the aggregation of the SPI to the sub-basin scale in Fig. 6a.
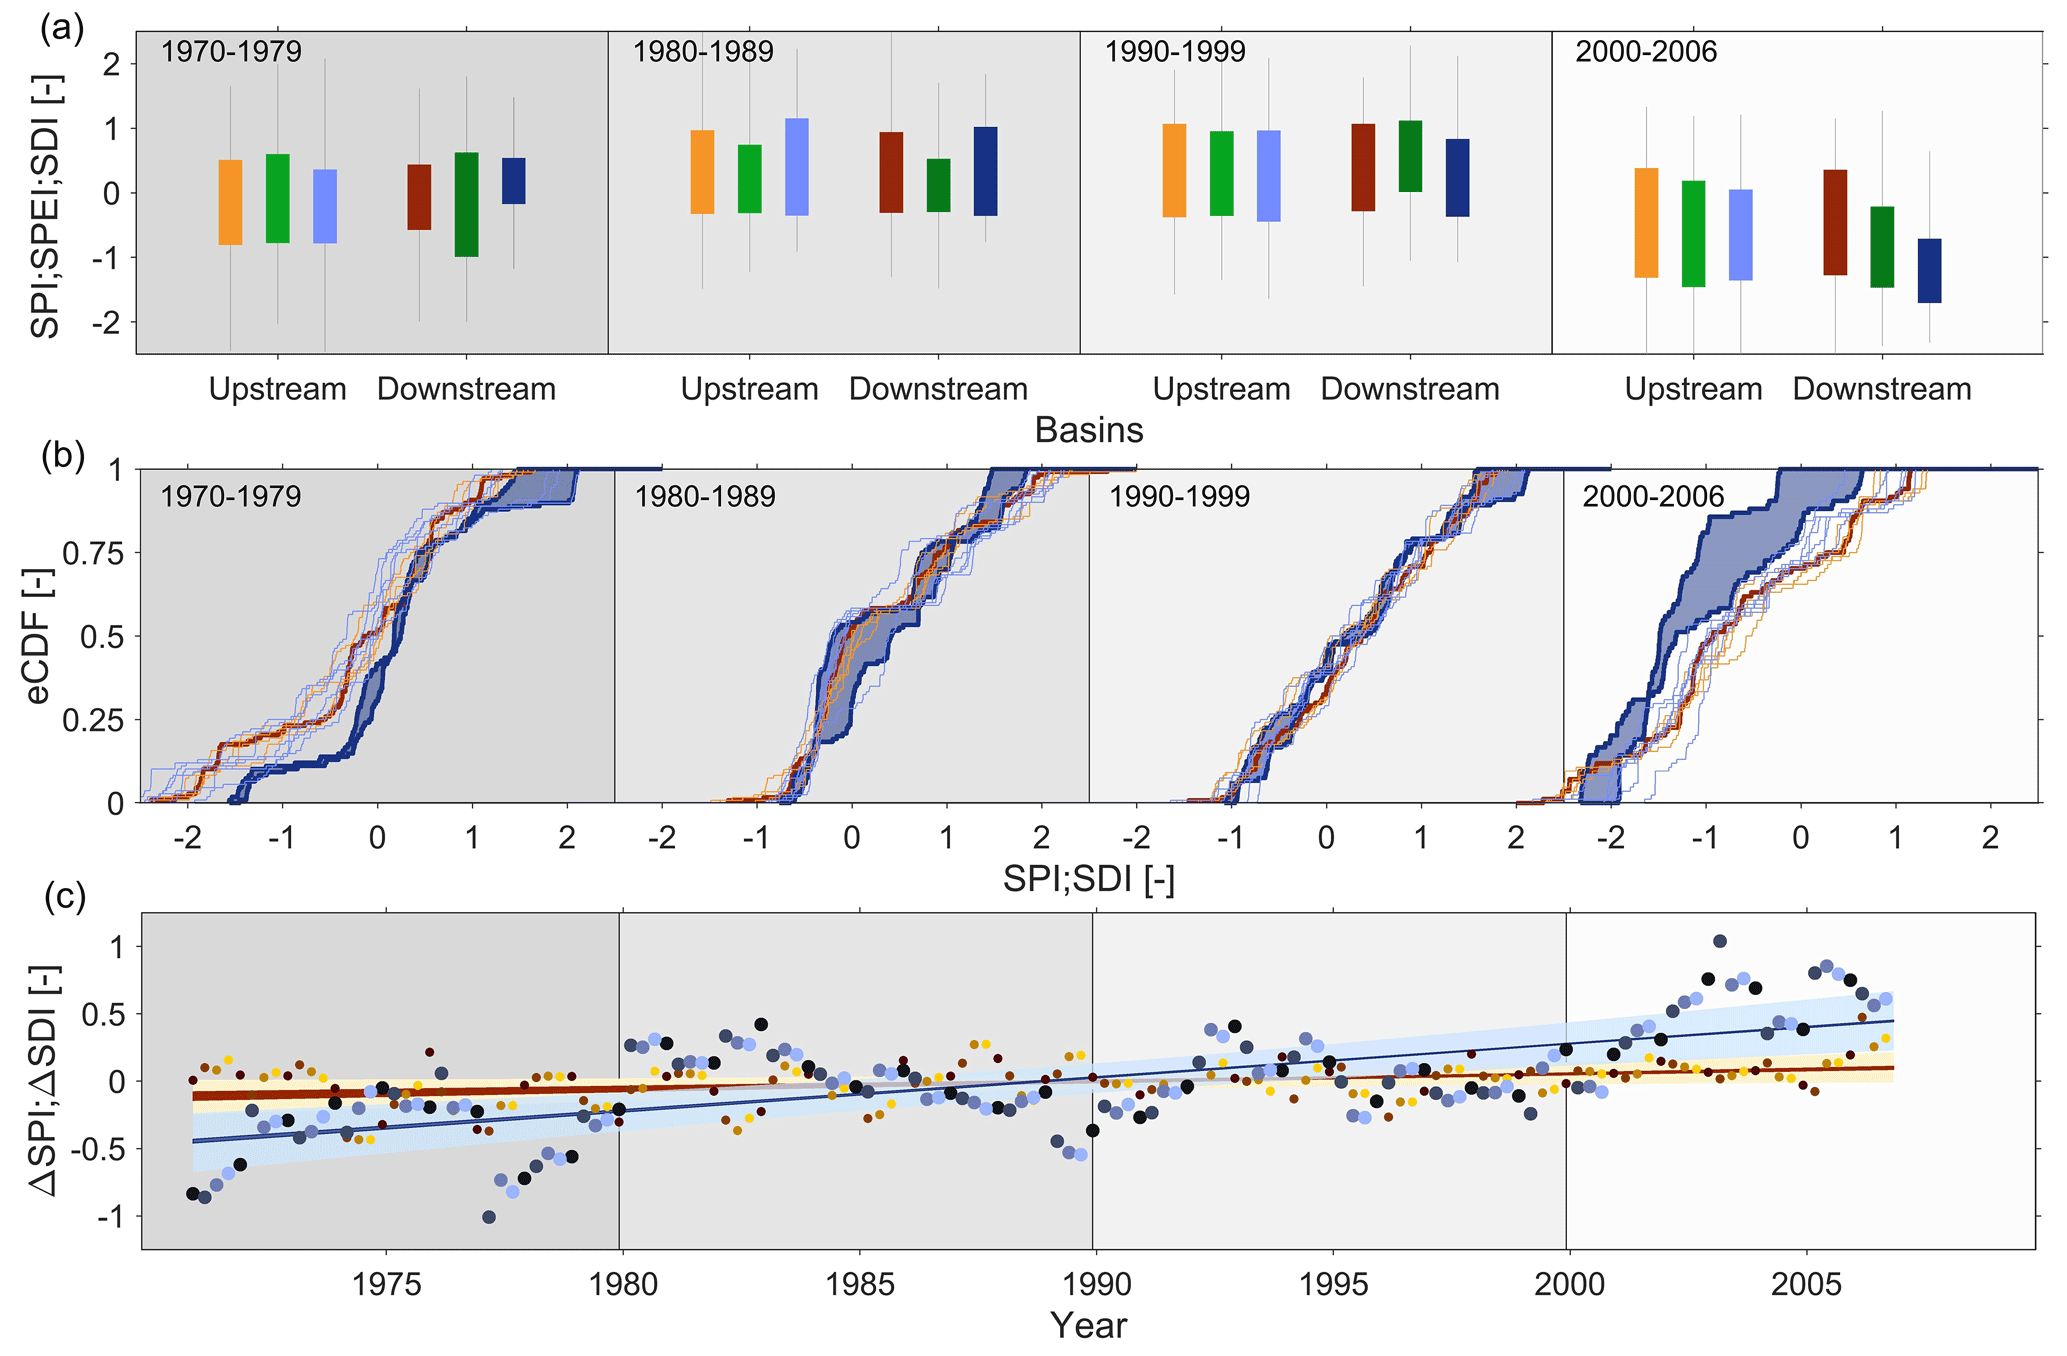
Figure 8(a) Decadal distributions of the SPI, SPEI, and SDI for the most-upstream sub-basins (ID1–ID6) and the downstream sub-basins (ID7–ID8); (b) decadal empirical cumulative distribution functions of the SPI (thin red lines: upstream basins; bold red lines: downstream basins) and SDI (thin blue lines: upstream basins; bold blue lines: downstream basins). Note that the blue shaded area is added for better visualization of the shifts in downstream basins only and does not have a specific meaning. (c) Time series of differences between the mean upstream and mean downstream SPI (ΔSPI: yellow and red shades) as well as between the mean upstream and mean downstream SDI (ΔSDI: blue shades). The symbols with shades from dark to light indicate the monthly SPI values (based on a 12-month accumulation period) for the months January, April, July, and October, respectively. The dark shaded areas indicate the envelope of trends in ΔSPI and ΔSDI, respectively, estimated based on the months of January, April, July, and October, respectively. The light shaded areas show the associated envelope of the 5th and 95th confidence intervals.
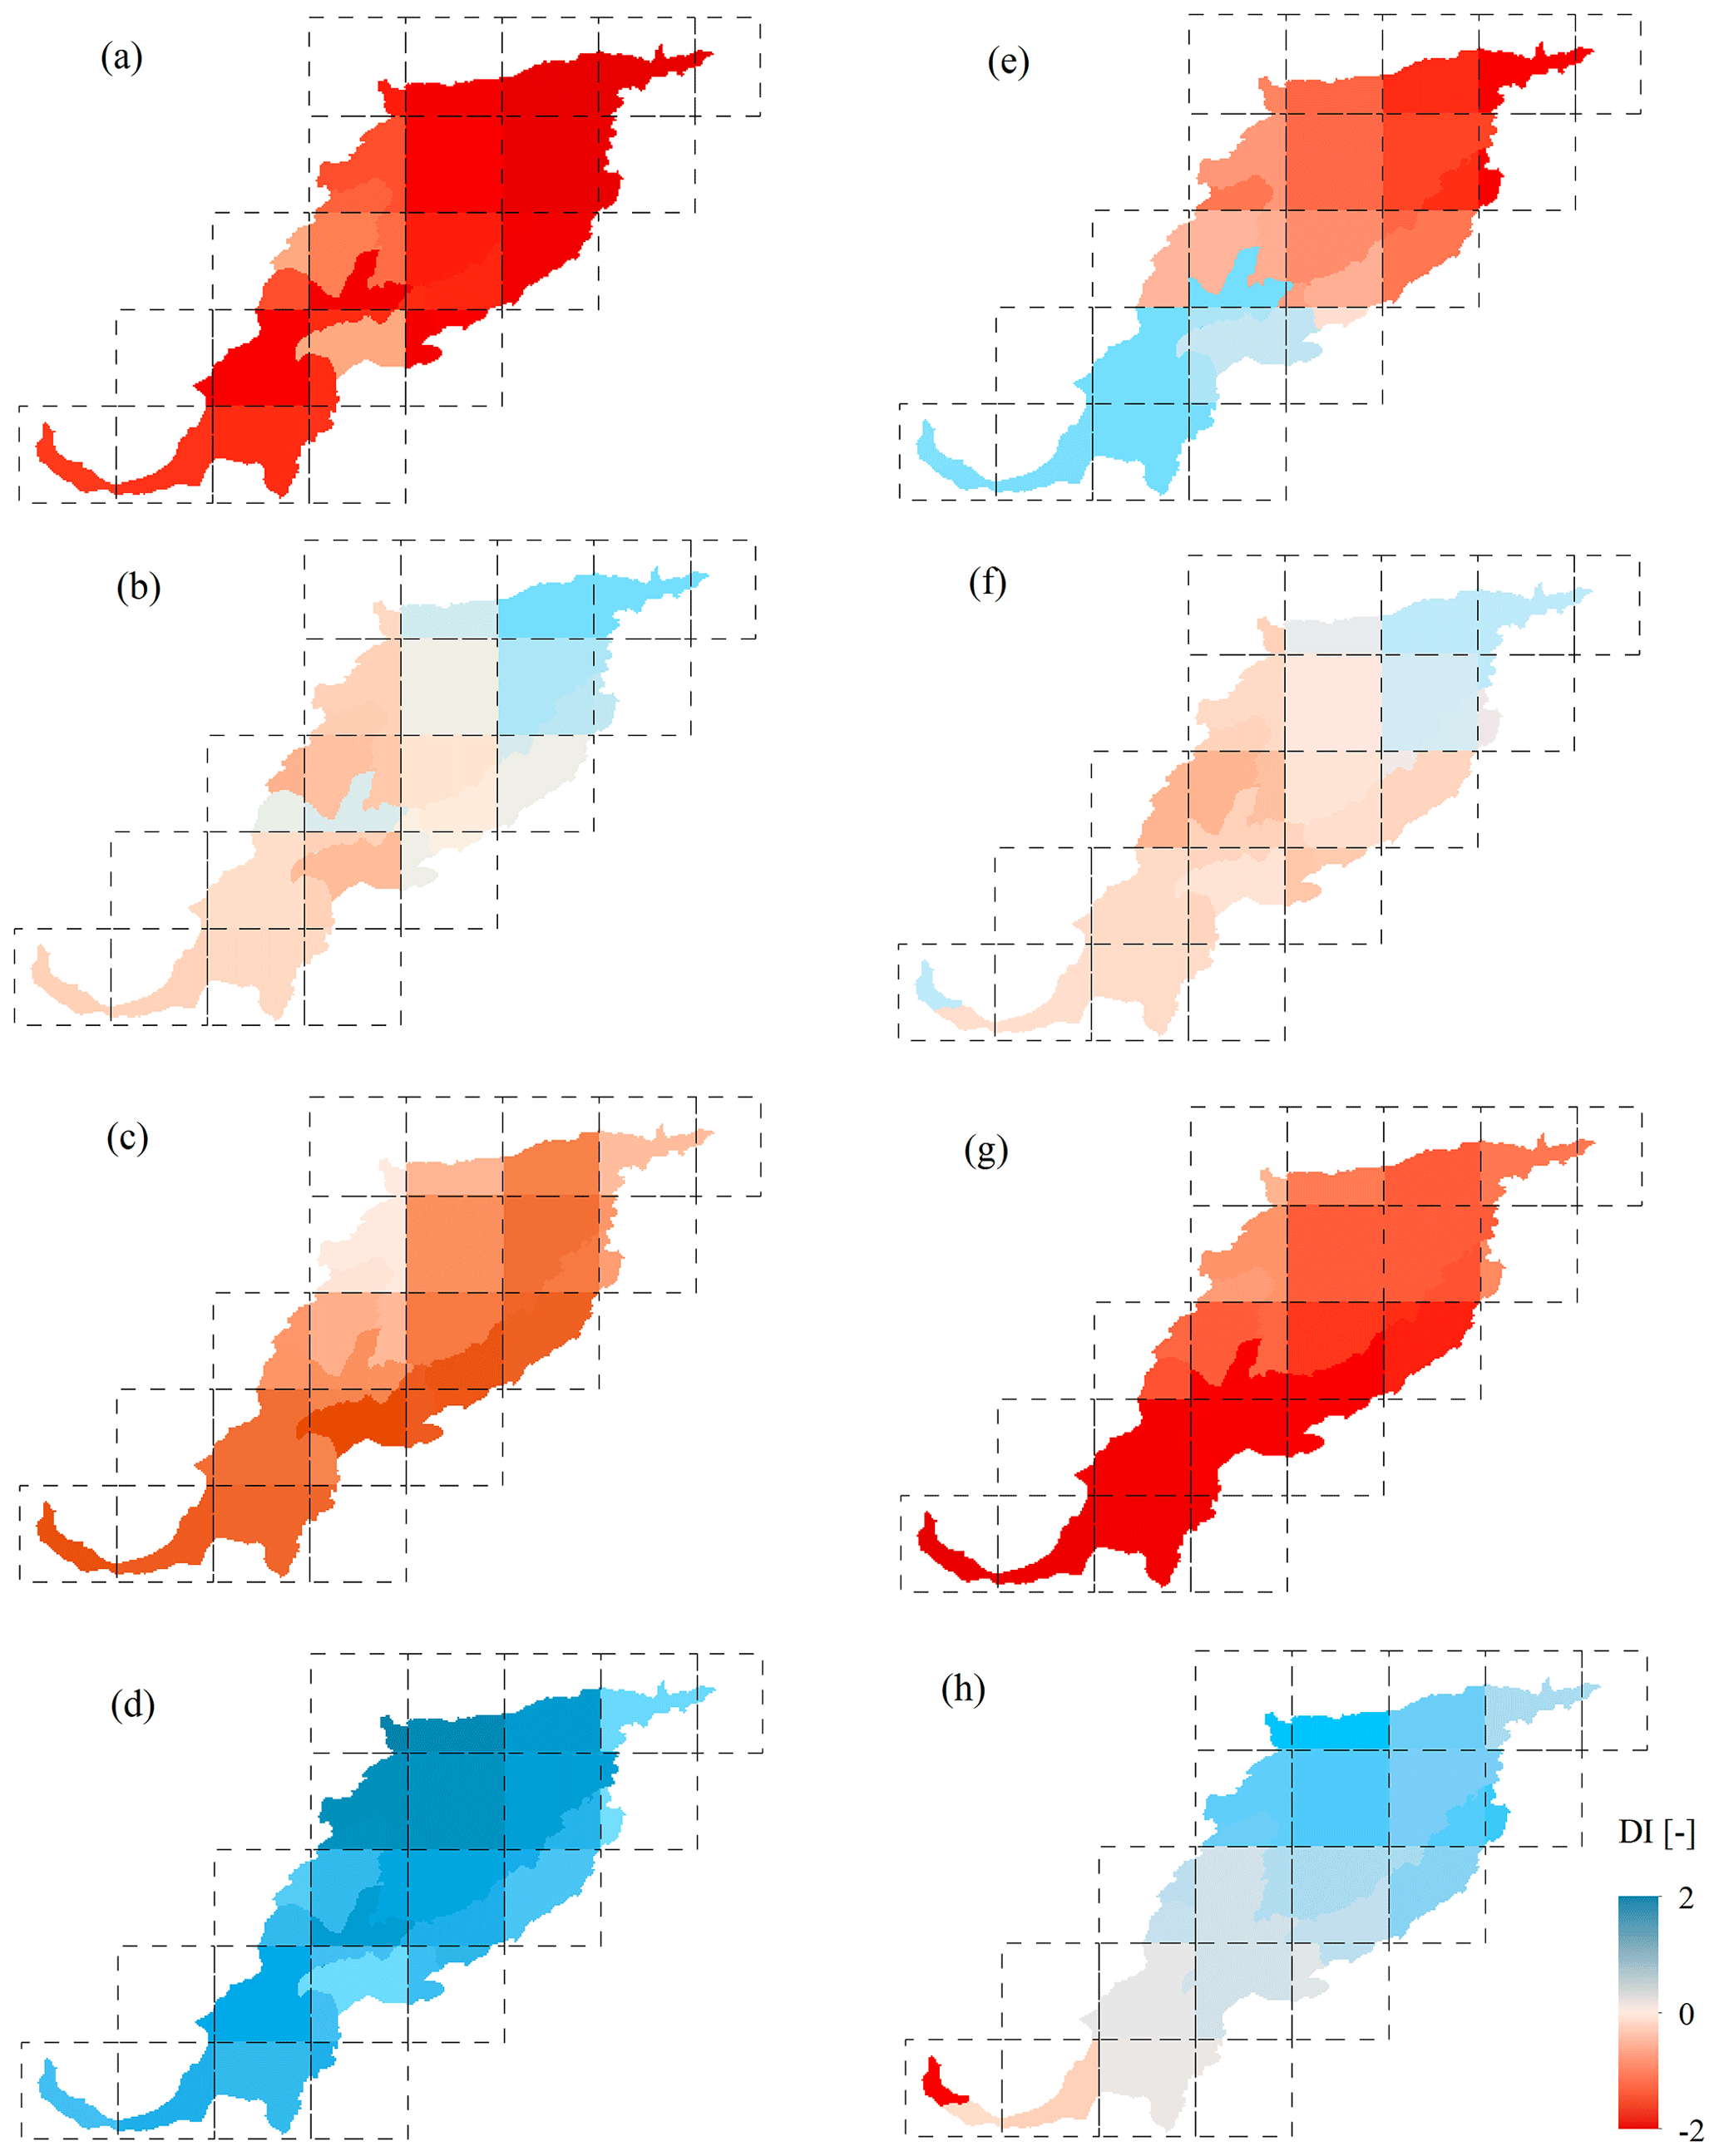
Figure 9Spatial distribution of the (a–d) SPI and (e–h) SDI for the years 1977, 1987, 2002, and 2003, based on the grid cells of the model application.
5.3.2 SPEI
While the SPEI is widely coherent (median r=0.94, p < 0.05) and spatially broadly follows the pattern of the SPI throughout large parts of the HRB, it can also be observed that inter-annual differences in atmospheric water demand, here estimated based on EP, lead to modest, yet contrasting effects (Fig. 6b). For some sub-basins and time periods characterized by comparably cool temperatures, water deficits are attenuated, and the SPEI thus remains higher than the SPI (e.g., UARBU-ID4 in 1986 or LARB-ID6 in 1989). For other sub-basins and warmer periods, increased atmospheric water demand reinforces water deficits (e.g., CHRB-ID3 in 1981). As shown in Fig. 8a, the distributions of the SPEI closely reflect the distributions of the SPI in the first decade of the study period. In the following 1980–1989 decade as well as in the 2000–2006 decade, the SPEI is lower than the SPI, potentially indicating the role of EP in intensifying water deficits in these periods. In contrast, the opposite effect can be observed during the 1990–1999 decade, where rather low EP had a moderating effect, leading to higher values of the SPEI than the SPI. Although these effects occur across the entire HRB, water deficits in terms of the SPEI are considerably more sensitive to fluctuations in atmospheric water demand, and the differences between the SPEI and SPI are thus more pronounced in the downstream parts of the HRB (Fig. 8a). In particular, the SPEI in the hyper-arid SISP (ID8; Fig. 6b) is characterized by a low degree of coherence and synchronicity compared to the upstream SPEI, exhibiting both markedly more severe water deficits (e.g., 1973, 1984 or 2003) and more pronounced water surpluses (e.g., 1986, 1996, or 2005). Notwithstanding these varying effects of EP on water deficits and thus on the differences between the SPEI and SPI, no systematic temporal trend of EP reinforcing or moderating water deficits could be detected. However, note that the applicability of the SPEI in arid areas such as the study region may be limited (Pei et al., 2020). In such environments, such fluctuations in EP will have a limited effect on EA and thus on water deficits as the systems are, by definition, water-limited rather than energy-limited. Changes in EP will therefore be less relevant for the intensification and moderation of drought in such arid regions than changes in precipitation.
5.3.3 SDI
Hydrological drought in terms of the SDI during the study period exhibited a lower degree of spatial coherence and synchronicity (Fig. 6c) across the HRB. This is reflected by a lower median r=0.85 (p < 0.05) from pairwise Spearman rank correlations between the individual time series of the SDI across all sub-basins. The spatially and temporally more heterogeneous mosaic of the SDI, however, allows a few insights. The data suggest that both reservoirs, at Kajakai Dam and Dahla Dam, respectively, have effects on the propagation of hydrological drought. This can be seen in the differences in the SDI between the sub-basins upstream (UHRBU-ID1, UARBU-ID4) and the associated sub-basins downstream of the dams (UHRBD-ID2, UARBD-ID5) in Fig. 6c. In the early phase of the study period, the reservoirs had some moderating effects on the propagation of hydrological droughts, most notably for the 1977 (both dams) and 1971 (Dahla Dam) droughts. The median SDI in the 1970–1979 decade was ∼ 0.2 higher downstream than upstream of both reservoirs (p < 0.05). However, over the following decades, both reservoirs largely lost their drought-attenuating functions, and the reservoir at Dahla Dam may have even contributed to amplifying the 1999–2002 drought downstream of the dam, with a median SDI over that period being ∼ 0.18 (p < 0.05) lower at the downstream UARBD (ID5) than the upstream UARBU (ID4).
While the distribution of the SDI broadly follows the distributions of the SPI and SPEI in the upstream part of the HRB (ID1–ID6), downstream hydrological drought is characterized by rather distinct dynamics (ID7–ID8; Fig. 8a). In contrast to the basin-average time series of the SDI (Fig. 7f), the SDI in the two downstream sub-basins exhibits clear negative trends over the 4 decades of the study period (p≤0.05; not shown). In addition, the data suggest that for the 1970–1979 decade, the median downstream SDI of ∼ 0.2 is significantly higher (p < 0.05) than the SPI, SPEI, and upstream SDI, which are all characterized by a median of about −0.1 (Fig. 8a). As also shown by the individual SDI distributions of all sub-basins in Fig. 8b, hydrological drought is considerably attenuated, and the relative river water deficits reduced compared to upstream parts of the HRB during that period. However, throughout the following 2 decades, the downstream moderation of hydrological drought weakens; i.e., the distributions of the downstream SDI more closely reflect those of the SPI, SPEI, and upstream SDI (Fig. 8b). This pattern then eventually fully inverts into a downstream drought amplification in the 2000–2006 decade, during which the median downstream SDI of −1.5 is significantly lower (p < 0.05) than not only the median upstream SDI of −0.9 but also than the SPI and SPEI (Fig. 8a, b). This shift from downstream drought moderation to drought amplification can be seen clearly for the 4 selected years in Fig. 9e–h. In spite of dry meteorological conditions throughout the HRB in 1977 (Fig. 9a) and severe hydrological drought in the north of the HRB, no drought occurred in the south of the study region (Fig. 9e). In 1987, similarly, the increasing precipitation deficits from upstream to downstream (Fig. 9b) were buffered and not reflected in the north–south gradient of the SDI, indicating the wettest conditions in the most-downstream part of the HRB (Fig. 9f). The extreme opposite of the above two examples occurred in the last decade of the study period. In both 2002 and 2003, respectively, a spatially relatively coherent precipitation pattern across the entire HRB (Fig. 9c–d) led to severe hydrological drought in the most-downstream parts of the HRB, in particular at the SISP (ID8; Fig. 9g–h). This is particularly striking for the rather wet year 2003, in which the SDI in the upstream sub-basins reflected the generally wet conditions of that year, while further downstream river water deficits developed, gradually amplifying to severe drought at the SISP (ID8). Further analysis of the time series of the difference between the upstream (ID1–ID6) and downstream (ID7–ID8) SDI (i.e., ΔSDI) shows that the inversion from a negative to a positive ΔSDI over the 37 years of the study period occurred gradually and, according to a Mann–Kendall test, following a significant trend (p < 0.05), while the differences in the SPI remain stable over time (Fig. 8c) (Ma et al., 2019). This suggests that it may not be implausible to assume that the inversion of downstream hydrological-drought moderation in the 1970–1979 decade into drought amplification in the 2000–2006 decade was, at least partly, an effect of systematic, longer-term shifts in the system rather than a short-term, synchronous occurrence of multiple drought-amplifying hydro-meteorological conditions, such as sustained high precipitation deficits and high atmospheric water demand (Van Loon, 2015). Such short-term influences of deficits in hydrological drivers would be likely to manifest themselves in the evolution of ΔSDI characterized by a more erratic temporal pattern.
5.4 Drought drivers and process attribution
The above drought indices provide only limited information to identify dominant drivers of droughts. To gain more understanding of the spatiotemporal pattern of hydrological drought and to eventually attribute droughts to physical processes, estimates of the absolute magnitudes of multiple modeled hydrological fluxes, as obtained from the best available model solution for each sub-basin, are analyzed in the following.
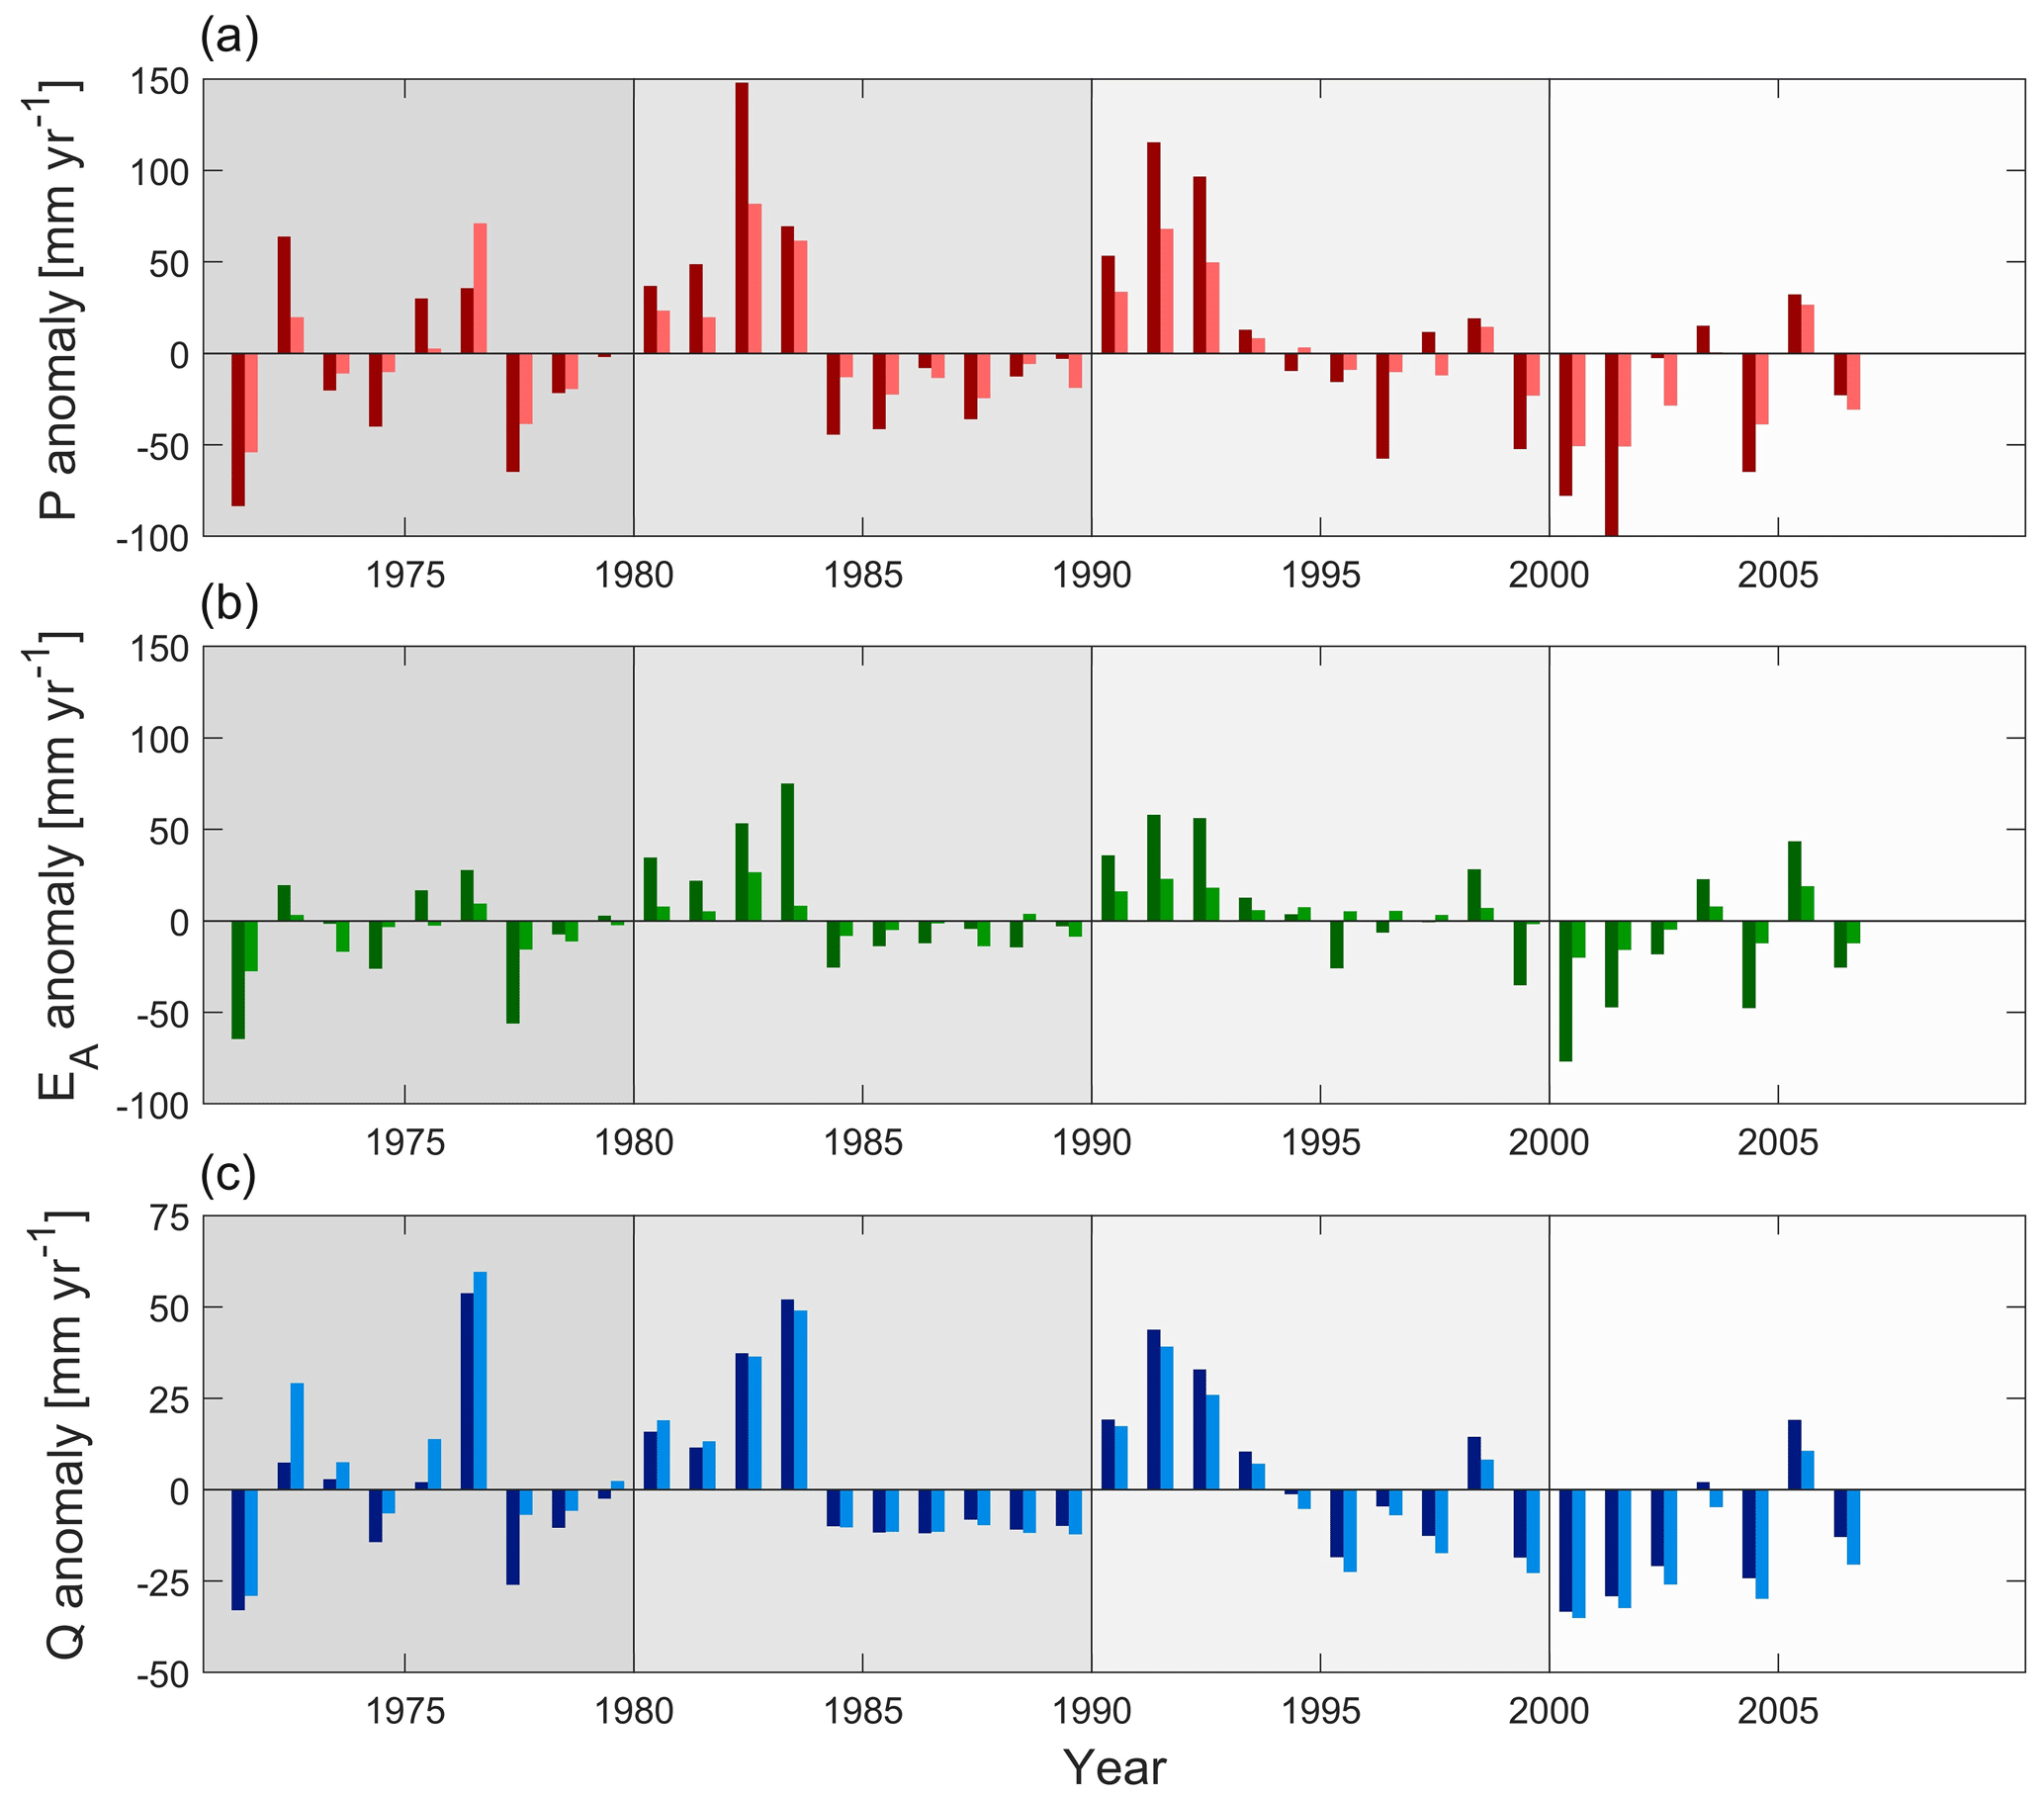
Figure 10(a) Precipitation anomalies, (b) actual evaporation anomalies (here: ), and (c) streamflow anomalies over the study period. All anomalies are calculated based on the 1970–2006 mean values. The dark shaded bars indicate the combined flows to and from the upper basin (ID1–ID6); the light shaded bars show the flows to and from the lower basin (ID7).
With a long-term mean annual precipitation of ∼ 250 mm yr−1 in the HRB, the overall magnitudes of streamflow deficits, and thus of hydrological droughts, are clearly dominated by fluctuations in precipitation anomalies (Fig. 10a), with a mean absolute anomaly of around ±50 mm yr−1 for the entire HRB, or ∼ 20 % of the long-term mean water balance. In contrast, anomalies in total evaporation EA (here: ) exhibit much lower variability in this arid environment, with a mean absolute anomaly of about ±20 mm yr−1. As water supply is the limiting factor for evaporation, the highest rates of EA occur in the wettest years (Fig. 10b). Conversely, EA has a proportionally lesser impact on streamflow in dry years. In general it can be seen that precipitation anomalies of ∼ −50 to −100 mm yr−1 lead to streamflow anomalies of ∼ −20 to −30 mm yr−1 (Fig. 10c). Although the SPEI is typically based on potential evaporation EP, arid and thus water-limited environments are rather insensitive to fluctuations in EP compared to fluctuations in P. In other words, there will be little difference in the partitioning of water fluxes if, under the same annual precipitation of, e.g., 500 mm yr−1, EP is 1000 or 1500 mm yr−1 as in both cases actual evaporation EA will be close to (or even exceed) 400 mm yr−1, and therefore most of the available water will be evaporated. In contrast, more water will be evaporated as EA (even if EP remains stable) in years when more water is available, and thus P is higher. By extension, the effects of evaporation on droughts in arid regions can only be meaningfully assessed by changes in EA. Huang et al. (2017) mentioned that actual evaporation strongly affected the propagation time of meteorological to hydrological drought in the Wei River basin (WRB), a typical arid and semi-arid region in China.
The modeled data suggest that during drought years, the reservoir at Kajakai Dam released slightly less water (UHRBD-ID2) than it received as an inflow (UHRBU-ID1), as shown in Fig. 4. The mean difference between drought period inflow to and outflow from the reservoir remained stable at ΔQ ∼ 0.9 mm yr−1 throughout the 4 decades of the study period. This implies that there is no evidence that the reservoir moderated or significantly amplified downstream propagation of streamflow deficits, underlining the very minor role of this reservoir for the drought pattern. In contrast, the modeled flow estimates for the reservoir at Dahla Dam suggest that this reservoir had some moderation effect on downstream flow deficits and thus drought propagation in the first decade of the study period (Wang et al., 2019). On average, the reservoir outflow (UARBD-ID5) during drought periods in that decade exceeded the inflow (UARBU-ID4) by ΔQ ∼ 1.1 mm yr−1 (Fig. S1). However, this difference gradually decreased over time and eventually converged towards zero in the 2000–2006 period. In spite of uncertainties arising from data and the modeling process, this nevertheless indicates the possibility that the Dahla Dam reservoir has lost its – albeit very minor – drought-moderating function over the study period. This broadly corresponds with the results of Wu et al. (2019), who found that the influence of reservoirs on long-term hydrological drought is limited and may even increase the duration and severity of a drought, whereas shorter hydrological droughts may be shortened and moderated by adequate reservoir operation.
For further analysis, the HRB was separated into an upper and a lower basin. The upper basin comprises the UHRBD (ID2), CHRB (ID3), and LARB (ID3), which together drain into the lower basin only, here defined as LHRB (ID7), for clarity of presentation excluding the SISP (ID8). As illustrated by Fig. 10 and consistent with the spatial analysis of drought indices in Sect. 5.3, the general pattern of anomalies corresponds well between the upper and the lower basin, suggesting a considerable level of spatial coherence and drought synchronicity. However, reflecting the evolution of ΔSDI (Fig. 8c), a subtle but gradual shift in the difference between streamflow anomalies of the upper and lower basins from, on average, −9.4 mm yr−1 in the 1970–1979 decade to 5.5 mm yr−1 in the 2000–2006 period is evident (Fig. 10c). Thus, while anomalies were less negative or more positive, therefore indicating proportionally “more” water, in the lower than in the upper basin at the beginning of the study period, the opposite was true at the end of the study period. This entails that in the first decade of the study period, streamflow deficits from the upper basin were to some degree attenuated in the lower basin. This effect was gradually reduced and finally completely inversed in the last decade of the study period. During the 2000–2006 period streamflow anomalies from the upper basin were systematically amplified in the lower basin. The absence of a similar systematic shift in the difference in precipitation anomalies between the upper and the lower basin (Fig. 10a) strongly suggests alternative reasons for the above effects. Mianabadi et al. (2020) similarly indicated that, in the lower Helmand River basin, water availability issues cannot be attributed to the changes in precipitation in the downstream area itself.
The analysis of the relative contributions of different water fluxes from the upper and lower basins, respectively, as well as their evolution over time as estimated from the models allowed some more detailed insights into these patterns. The combined water balance of all three sub-basins of the upper basin for the 1970–1979 period (Fig. 11a) shows that of the mean annual precipitation P∼202 mm yr−1 of the upper basin, 28 % drained away as streamflow (Q∼56 mm yr−1), and the remaining 72 % was released as combined evaporative fluxes (EA∼146 mm yr−1). While transpiration (ET∼130 mm yr−1) and interception evaporation (EI∼9 mm yr−1) played a role throughout the entire upper basin, irrigation demand (ID∼7 mm yr−1) was limited to the agriculturally used areas of the LARB (ID6) sub-basin and thus only accounted for ∼ 4 % of the water balance of the upper basin. The flow partitioning of the lower basin for the same period exhibited a considerably different pattern. It can be seen in Fig. 11a that of the available water in the lower basin (∼ 97 mm yr−1), i.e. precipitation over the LHRB (ID7) sub-basin plus the combined inflow from the upper basin, 51 % (Q∼49 mm yr−1) is drained as streamflow, and 49 % is released as evaporative flux (EA∼48 mm yr−1). In comparison to the upper basin, irrigation demand in the lower basin is, with ID∼13 mm yr−1, a substantially larger fraction of the water balance (∼ 14 %) than in the upper basin.
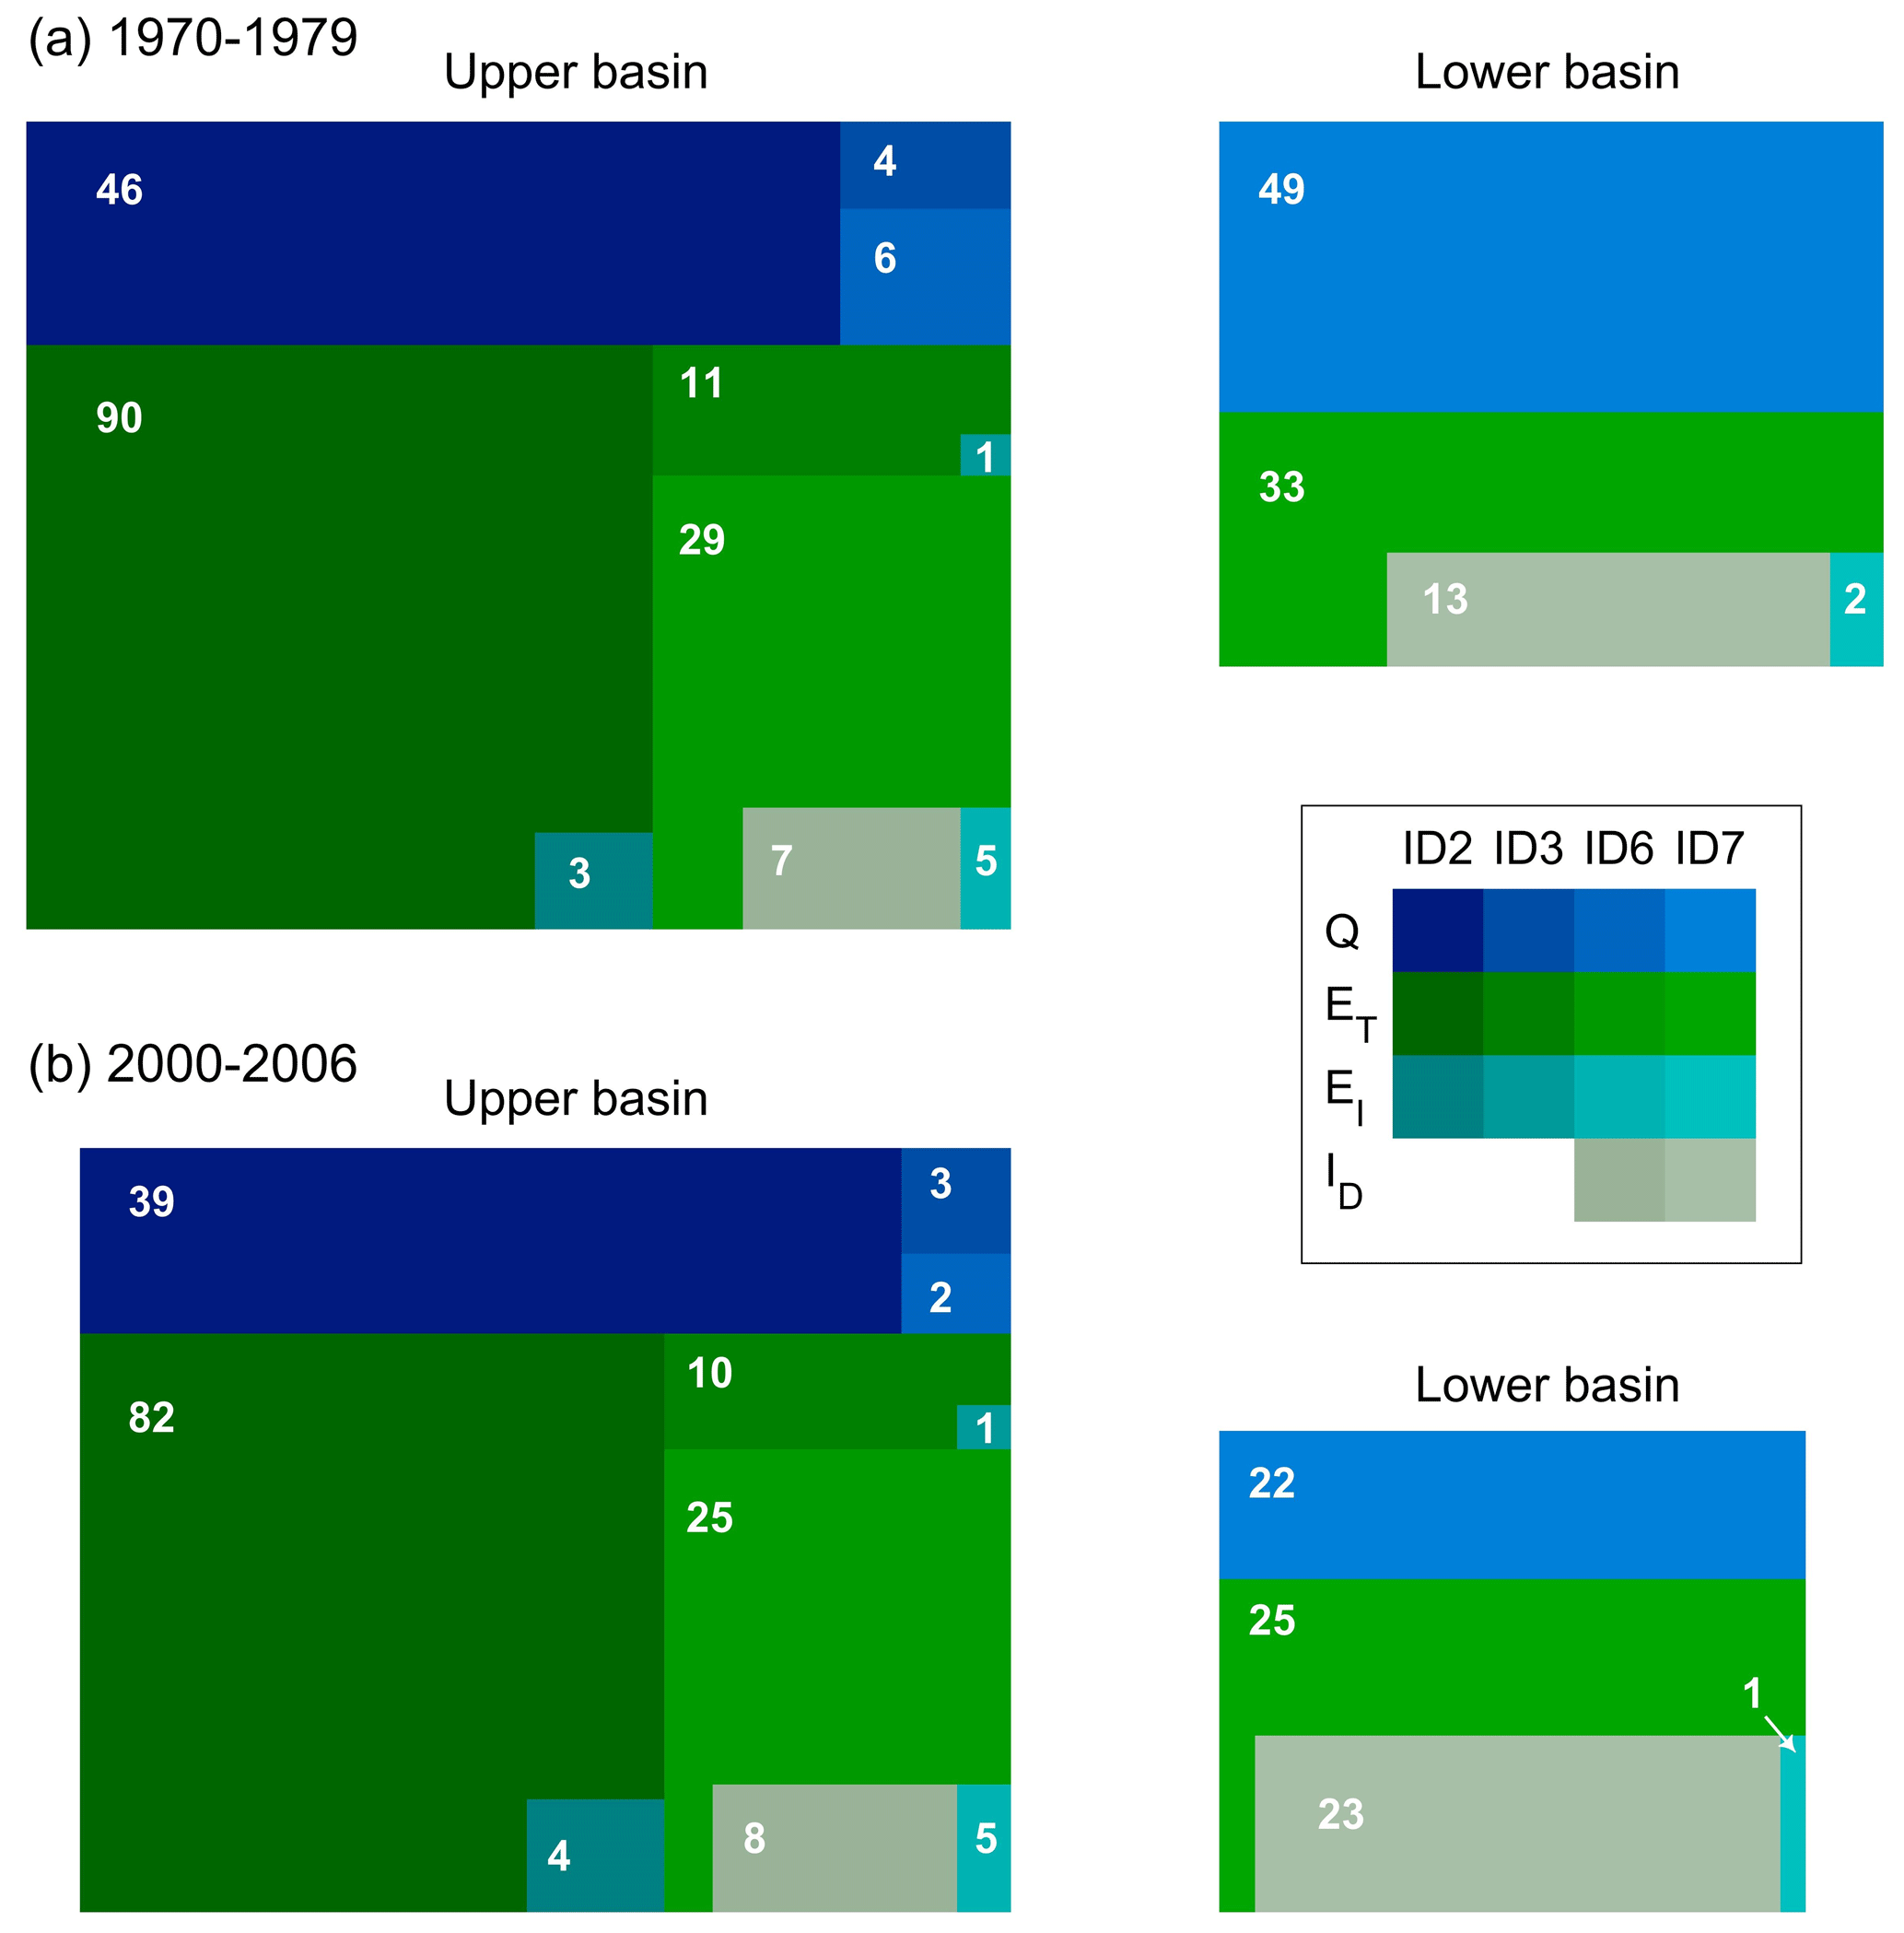
Figure 11Water balances of the upper and the lower basins, respectively, for (a) the 1970–1979 and (b) the 2000–2006 periods. The size of the outer squares is equivalent to the total water available, i.e., for the upper-basin precipitation P and for the lower-basin precipitation P plus the combined inflow Q from the upper basin. The size of the internal rectangles of each flux (Q: streamflow; ET: transpiration; EI: interception evaporation; and ID: irrigation demand) in each sub-basin is equivalent to its fraction of the total available water in the upper and lower basin, respectively. The fluxes represent the decadal mean values and are shown in mm yr−1.
During the 2000–2006 period (Fig. 11b), the upper basin received slightly less precipitation (P∼179 mm yr−1) than in the 1970–1979 period. However, the relative contributions of the different fluxes remained rather stable over time. The fraction of water drained as streamflow slightly decreased to 25 % (Q ∼ 44 mm yr−1), while the fraction of evaporative fluxes correspondingly increased to 75 % (EA ∼ 135 mm yr−1) of the water balance of the upper basin, with similar increases for all three evaporative components (Fig. 11b). In contrast, substantial shifts in the flux partitioning can be observed for the lower basin (Fig. 11b). In spite of a reduction in available water to ∼ 71 mm yr−1 in the 2000–2006 period, the evaporative release (EA∼ 49 mm yr−1) reached the same level as in the 1970–1979 decade. As illustrated by Fig. 11b, the high levels of evaporative release were sustained by significant absolute and relative increases in irrigation demand to ID∼23 mm yr−1, or 32 % of the water available in the lower basin (or ∼ 10 % of the water balance of the entire HRB). This, in turn, resulted in a reduction in streamflow to Q ∼ 22 mm yr−1, equivalent to a reduction from 51 % of the water balance in the 1970–1979 decade to 31 % in the 2000–2006 decade. The increases in ID and the corresponding decreases in Q are directly related to increases in the agricultural area over the study period (Fig. 2). It is therefore plausible to assume that the inversion of the function of the lower basin from moderation to amplification of flow deficits and the associated droughts are largely a consequence of increases in an agriculturally used area which resulted in increases in the related irrigation water demand (AghaKouchak et al., 2015; Van Loon et al., 2016; Haile et al., 2019b). In addition, inefficient irrigation schemes in the study region may lead to an underestimation of the actual irrigation water use. Therefore higher real-world irrigation water demand would even further strengthen the results showing that the shift form of downstream moderation to the intensification of hydrological drought over the study period is largely an effect of human intervention. Margariti et al. (2019) found that human activities prolonged drought durations in all the European catchments they analyzed. Ma et al. (2019) showed that human inventions are likely to have changed the positive correlation between meteorological and hydrological droughts to negative in the semi-arid Heile River basin, especially during warm and irrigation seasons.
Overall, the magnitudes of flow deficits and the associated hydrological droughts are largely driven by precipitation deficits across the HRB. The two reservoirs in the HRB had a very minor effect on the propagation of flow deficits, with levels not exceeding 0.5 % of the water balance of the HRB in the study period. Burger (2005) stated that the extreme drought in the Sistan region between 1999 and 2004 was not caused by the Afghan reservoirs, but rather this period was extremely dry in the whole catchment; but in the future, the drought condition downstream might be worsened due to the development of Kajakai reservoir. In contrast, the increase in agricultural area, mostly in LHRB (ID7), led to an increase in the basin-wide irrigation water demand (i.e., from LARB-ID6 and LHRB-ID7) from ∼ 7 % to ∼ 12 % of the water balance of the HRB. While at the scale of the entire HRB this remains of minor relevance for flow deficits and thus hydrological drought, it led to a continuous and gradual change in the downstream propagation of flow deficits from moderation to amplification throughout the study period. This clearly underlines the argument by Haile et al. (2019a), indicating that human activities such as expansion of cultivation and overexploitation of water resources, particularly for irrigation demands, have an impact on altering the hydrological processes which are directly linked to drought. Our results further illustrate that flow deficits and droughts in the HRB clearly reflect the dynamic interplay between temporally varying regional differences in hydro-meteorological variables together with subtle and temporally varying effects linked to direct human intervention (Jehanzaib et al., 2020; Jiang et al., 2019; Saidi et al., 2018; Wan et al., 2017).
5.5 Uncertainties, unresolved questions, and limitations
All the above results are necessarily conditional on a range of uncertainties and choices made during the modeling process (Beven, 2006; Hrachowitz and Clark, 2017). This is in particular relevant in the HRB, where detailed and reliable data are scarce. It entails further that although the results of this study are largely consistent with the available data, the data themselves may inaccurately reflect reality. In addition, although of sufficient quality, the available data may not have sufficient detail to accurately represent the underlying mechanistic processes and/or changes thereof over time in a model. Two major sources of uncertainty, due to the lack of detailed and high-quality data, need to be explicitly highlighted for this study. First, the routing of flows through the two reservoirs in the HRB was estimated with a simple empirical relationship (Eq. 2) based on data from the 1970–1979 period under the assumption that this relationship did not change over time. In reality, reservoir operation rules may have changed over the study period, yet this cannot be clarified with the available data. However, even if such changes occurred, their impact is likely limited as model evaluation at the SISP (ID8) showed that adequate model performances were achieved throughout the entire study period (Table 3, Fig. 4).
A second not completely resolved issue is the considerable observed and modeled reduction in streamflow between the LHRB (ID7) and SISP (ID8). The loss of ∼ 60 % of the streamflow as the river crosses the desert region between Afghanistan and Iran can plausibly be explained by the combined effects of evaporation, deep-infiltration losses, and most importantly river water diversion into the completely ungauged Common Parian River that bifurcates from the Helmand River just upstream of the SISP (ID8). In the model it was represented by an unspecified loss factor KL. A clearer mechanistic interpretation was not warranted by the available data. Another cause that cannot be completely ruled out is a potentially low quality of the available streamflow data either at the LHRB (ID7), at the SISP (ID8), or at both of them.
We explicitly reiterate here that although this modeling study allowed robust insights into the pattern of drought characteristics, including changes in downstream drought propagation over time, the absolute magnitudes of variables reported herein remain, for the above reasons, highly uncertain. These magnitudes should therefore, under no circumstances and without more detailed data and understanding of the underlying processes, be used for direct policy advice in this arid environment, where the transboundary nature of the HRB makes water scarcity a highly sensitive issue.
Clearly, the most reliable way forward to reduce uncertainties in flow estimations in the HRB is to do more observations and generate data, which can then be confronted with the model. Deficiencies in the model to reproduce these additional data will then, in an iterative process, allow model improvement (e.g., Fenicia et al., 2008; Hulsman et al., 2021). However, at this stage, further model improvement is problematic as the introduction of more complexity in the model will not be warranted by the available data and eventually merely lead to increased equifinality (Beven, 2006). Although beyond the scope of this study, a future comparison of alternative datasets to inform the model and an analysis of the associated potential differences in model results will be highly valuable to ensure reliable interpretations of the HRB and thus to limit uncertainty for better policy advice on water resource management in the HRB.
In a combined data analysis and modeling study in the transboundary Helmand River basin (HRB), we analyzed spatial patterns of drought and changes therein over the 1970–2006 study period based on the drought indices SPI, SPEI, and SDI as well as on absolute water deficits. The results provide some evidence of the following:
-
Drought characteristics varied throughout the study period. In general, the 2000–2006 and partly the 1970–1979 periods were drier than the decades in between. Depending on the drought index, mean drought duration reached DD ∼ 10–20 months and mean drought intensity DI ∼ −1.5 month−1 in these drier periods as compared to DD∼0–2 months and DI ∼ −0.1 to −1.0 in the 1980–1999 period.
-
The basin-average decadal distributions of the drought indices largely exhibited no statistically significant differences, with the exception of a significantly lower SPEI and SDI in 2000–2006 compared to the preceding decades. In addition, no systematic trend over time was detected for any of the basin-average drought indices.
-
All three drought indices exhibit considerable spatial coherence and synchronicity across the HRB throughout the study period. This indicates that in most cases, droughts similarly affect the entire HRB, with few regional or local differences.
-
The overall magnitudes of streamflow drought in the HRB are consistently controlled by precipitation deficits, while the effects of the two reservoirs as well as water abstraction for irrigation on flow deficits remain minor during drought years, accounting for only 0.5 % and ∼ 10 %, respectively, of the water balance of the HRB.
-
The downstream parts of the HRB moderated the further propagation of streamflow deficits and the associated droughts in the early decades of the study period. This drought moderation function of the lower basin was gradually and systematically inverted by the end of the study period, when the lower basin eventually amplified the downstream propagation of flow deficits and droughts.
-
The shift from drought moderation to drought amplification in the lower basin is very likely a consequence of agricultural activity and the associated increased irrigation water demand in spite of being only a minor fraction of the water balance.
Overall the results of this study illustrate that the flow deficits and associated droughts in the HRB clearly reflect the dynamic interplay between temporally varying regional differences in hydro-meteorological variables together with subtle and temporally varying effects linked to direct human intervention.
The model code used can be made available by the first author upon request. All the equations used in the model have been presented in the Supplement.
The meteorological data were available from https://www.2w2e.com (Ashraf Vaghefi et al., 2017). Daily streamflow observations were provided by the US Geological Survey (https://waterdata.usgs.gov, USGS, 2021).
The supplement related to this article is available online at: https://doi.org/10.5194/hess-25-1943-2021-supplement.
MH designed the experiment. AR developed the model. AR and MH did the analysis. AR and MH wrote the first draft. All the authors discussed the results and contributed to writing the final paper.
The authors declare that they have no conflict of interest.
We thank the editor and the reviewers for their instructive and insightful comments, which helped to strengthen this paper.
This paper was edited by Hilary McMillan and reviewed by two anonymous referees.
Afghan–Iranian Helmand River Water Treaty: available at: http://internationalwaterlaw.org/documents/regionaldocs/1973_Helmand_River_Water_Treaty-Afghanistan-Iran.pdf (last access: 3 October 2018), 1973.
AghaKouchak, A., Feldman, D., Hoerling, M., Huxman, T., and Lund, J.: Water and climate: Recognize anthropogenic drought, Nature News, 524, 409–411, 2015.
Ahmad, M. and Wasiq, M.: Water resources development in Northern Afghanistan and its implications for Amu Darya Basin, World Bank working paper series, Washington, D.C., World Bank Group. 36, 66 pp., 2004.
Ahmadalipour, A., Moradkhani, H., and Demirel, M. C.: A comparative assessment of projected meteorological and hydrological droughts: Elucidating the role of temperature, J. Hydrol., 553, 785–797, https://doi.org/10.1016/j.jhydrol.2017.08.047, 2017.
Ajami, N. K., Gupta, H., Wagener, T., and Sorooshian, S.: Calibration of a semi-distributed hydrologic model for streamflow estimation along a river system, J. Hydrol., 298, 112–135, https://doi.org/10.1016/j.jhydrol.2004.03.033, 2004.
Alami, M. M. and Tayfor, G.: Meteorological Drought Analysis by Different Methods in Helmand River Basin, Afghanistan, Int. J. Sci. Eng. Res., 8, 738–744, https://doi.org/10.14299/ijser.2018.02.004, 2018.
Al-Faraj, F. A. M. and Scholz, M.: Assessment of temporal hydrologic anomalies coupled with drought impact for a transboundary river flow regime: The Diyala watershed case study, J. Hydrol., 517, 64–73, https://doi.org/10.1016/j.jhydrol.2014.05.021, 2014.
Allen, R., Pereira, L., Raes, D., and Smith, M.: Crop evapotranspiration – Guidelines for computing crop water requirements, FAO Irrigation and drainage paper No. 56, 300 pp., FAO, Food and Agriculture Organization of the United Nations, Rome, Italy, 1998.
Arnold, J., Srinivasan, R., Muttiah, R., and Williams, J.: Large area hydrologic modeling and assessment part I: model development, J. Am. Water Resour. As., 34, 73–89, https://doi.org/10.1111/j.1752-1688.1998.tb05961.x, 1998.
Ashraf Vaghefi, S., Abbaspour, N., Kamali, B., and Abbaspour, K. C.: A toolkit for climate change analysis and pattern recognition for extreme weather conditions – Case study: California-Baja California Peninsula, Environ. Modell. Softw., 96, 181–198, https://doi.org/10.1016/j.envsoft.2017.06.033, 2017 (data available at: https://www.2w2e.com, last access: 20 October 2018).
Beven, K.: On hypothesis testing in hydrology, Hydrol. Process., 15, 1655–1657, https://doi.org/10.1002/hyp.436, 2001.
Beven, K. J.: A manifesto for the equifinality thesis, J. Hydrol., 320, 18–36, https://doi.org/10.1016/j.jhydrol.2005.07.007, 2006.
Bouaziz, L., Weerts, A., Schellekens, J., Sprokkereef, E., Stam, J., Savenije, H., and Hrachowitz, M.: Redressing the balance: quantifying net intercatchment groundwater flows, Hydrol. Earth Syst. Sci., 22, 6415–6434, https://doi.org/10.5194/hess-22-6415-2018, 2018.
Burger, A. S.: Calibration of a precipitation runoff model for the Hirmand River in Afghanistan and Iran using remote sensing data, master thesis, Delft University of Technology, Faculty of civil engineering and Geosciences, 77 pp., 2005.
Coerver, H. M., Rutten, M. M., and van de Giesen, N. C.: Deduction of reservoir operating rules for application in global hydrological models, Hydrol. Earth Syst. Sci., 22, 831–851, https://doi.org/10.5194/hess-22-831-2018, 2018.
Condon, L. E., Atchley, A. L., and Maxwell, R. M.: Evapotranspiration depletes groundwater under warming over the contiguous United States. Nat. Commun., 11, 873, https://doi.org/10.1038/s41467-020-14688-0, 2020.
Ebrahimzadeh, I. and Esmaelnejad, M.: Climate change and the role of recent droughts on agricultural economy of Sistan, Romanian Review of Regional Studies, IX, 11–22, 2013.
Edwards, D. C. and McKee, T. B.: Characteristics of 20th Century Drought in the United States at Multiple Time Scales, Department of Atmospheric Science, Colorado State University, Fort Collins, Climatology Report 97-2, 1997.
Euser, T., Winsemius, H. C., Hrachowitz, M., Fenicia, F., Uhlenbrook, S., and Savenije, H. H. G.: A framework to assess the realism of model structures using hydrological signatures, Hydrol. Earth Syst. Sci., 17, 1893–1912, https://doi.org/10.5194/hess-17-1893-2013, 2013.
Euser, T., Hrachowitz, M., Winsemius, H., and Savenije, H.: The effect of forcing and landscape distribution on performance and consistency of model structures, Hydrol. Process., 29, 3727–3743, https://doi.org/10.1002/hyp.10445, 2015.
Fenicia, F., Savenije, H. H. G., Matgen, P., and Pfister, L.: Is the groundwater reservoir linear? Learning from data in hydrological modelling, Hydrol. Earth Syst. Sci., 10, 139–150, https://doi.org/10.5194/hess-10-139-2006, 2006.
Fenicia, F., Savenije, H. H. G., Matgen, P., and Pfister, L.: A comparison of alternative multiobjective calibration strategies for hydrological modeling, Water Resour. Res., 43, 1–16, https://doi.org/10.1029/2006WR005098, 2007.
Fenicia, F., Savenije, H. H. G., Matgen, P., and Pfister, L.: Understanding catchment behaviour through stepwise model concept improvement, Water Resour. Res., 44, 1–13, https://doi.org/10.1029/2006WR005563, 2008.
Fenicia, F., Kavetski, D., and Savenije, H. H. G.: Elements of a flexible approach for conceptual hydrological modeling: 1. Motivation and theoretical development, Water Resour. Res., 47, 1–13, https://doi.org/10.1029/2010WR010174, 2011.
Freer, J., Beven, K., and Ambroise, B.: Bayesian Estimation of Uncertainty in Runoff Prediction and the Value of Data: An Application of the GLUE Approach, Water Resour. Res., 32, 2161–2173, https://doi.org/10.1029/95WR03723, 1996.
Gao, H., Hrachowitz, M., Fenicia, F., Gharari, S., and Savenije, H. H. G.: Testing the realism of a topography-driven model (FLEX-Topo) in the nested catchments of the Upper Heihe, China, Hydrol. Earth Syst. Sci., 18, 1895–1915, https://doi.org/10.5194/hess-18-1895-2014, 2014.
Gao, H., Ding, Y., Zhao, Q., Hrachowitz, M., and Savenije, H. H. G.: The importance of aspect for modelling the hydrological response in a glacier catchment in Central Asia, Hydrol. Process., 31, 2842–2859, https://doi.org/10.1002/hyp.11224, 2017.
Geng, S., Devries, F., and Supit, I.: A simple method for generating daily rainfall data, Agr. Forest Meteorol., 36, 363–376, https://doi.org/10.1016/0168-1923(86)90014-6, 1986.
Gharari, S., Hrachowitz, M., Fenicia, F., and Savenije, H. H. G.: An approach to identify time consistent model parameters: sub-period calibration, Hydrol. Earth Syst. Sci., 17, 149–161, https://doi.org/10.5194/hess-17-149-2013, 2013.
Gharari, S., Shafiei, M., Hrachowitz, M., Kumar, R., Fenicia, F., Gupta, H. V., and Savenije, H. H. G.: A constraint-based search algorithm for parameter identification of environmental models, Hydrol. Earth Syst. Sci., 18, 4861–4870, https://doi.org/10.5194/hess-18-4861-2014, 2014.
Gocic, M. and Trajkovic, S.: Analysis of precipitation and drought data in Serbia over the period 1980–2010, J. Hydrol., 494, 32–42, https://doi.org/10.1016/j.jhydrol.2013.04.044, 2013.
Goes, B. J. M., Howarth, S. E., Wardlaw, R. B., Hancock, I. R., and Parajuli, U. N.: Integrated water resources management in an insecure river basin: a case study of Helmand River Basin, Afghanistan, Int. J. Water Resour. Dev., 32, 3–25, https://doi.org/10.1080/07900627.2015.1012661, 2016.
Gupta, H. V., Sorooshia, S., and Yapo, P. O.: Toward improved calibration of hydrologic models: Multiple and noncommensurable measures of information, Water Resour. Res., 34, 751–763, https://doi.org/10.1029/97WR03495, 1998.
Haddeland, I., Heike, J., Biemans, H., Eisner, S., Flörke, M., Kanasaki, N., Konzmann, M., Ludwig, F., Masaki, Y., Schewe, J., Stacke, t., Tessler, Z. D., Wada, Y., and Wisser, D.: Global water resources affected by human interventions and climate change, PNAS, 111, 3251-3256, https://doi.org/10.1073/pnas.1222475110, 2014.
Haile, G. G., Tang, Q., Sun, S., Huang, Z., Zhang, X., and Liu, X.: Droughts in East Africa: Causes, impacts and resilience, Earth-Sci. Rev., 193, 146–161, 2019a.
Haile, G. G., Tang, Q., Li, W., Liu, X., and Zhang, X.: Drought: Progress in broadening its understanding, Wiley Interdisciplinary Reviews: Water, 7, e1407, https://doi.org/10.1002/wat2.1407, 2019b.
Hajihosseini, H., Hajihosseini, M., Morid, S., Delavar, M., and Booij, M. J.: Hydrological Assessment of the 1973 Treatyon the Transboundary Helmand River, Using the SWAT Model and a Global Climate Database, Water Resour. Manage., 30, 4681–4694, https://doi.org/10.1007/s11269-016-1447-y, 2016.
Hajihosseini, M., Hajihosseini, H., Morid, S., Delavar, M., and Booij, M. J.: Impacts of land use changes and climate variability on transboundary Hirmand River using SWAT, J. Water Clim. Change [Preprint], https://doi.org/10.2166/wcc.2019.100, 2019.
Hanasaki, N., Kanae, S., and Oki, T.: A reservoir operation scheme for global river routing models, J. Hydrol., 327, 22–41, https://doi.org/10.1016/j.jhydrol.2005.11.011, 2006.
Harris, I., Jones, P. D., Osborn, T. J., and Lister, D. H.: Updated high-resolution grids of monthly climatic observations – the CRU TS3.10 Dataset, Int. J. Climatol., 34, 623–642, https://doi.org/10.1002/joc.3711, 2014.
Hrachowitz, M. and Clark, M. P.: HESS Opinions: The complementary merits of competing modelling philosophies in hydrology, Hydrol. Earth Syst. Sci., 21, 3953–3973, https://doi.org/10.5194/hess-21-3953-2017, 2017.
Hrachowitz, M., Fovet, O., Ruiz, L., Euser, T., Gharari, S., Nijzink, R., Freer, J., Sanenije, H. H. G., and Gascuel-Odoux, C.: Process consistency in models: The importance of system signatures, expert knowledge, and process complexity, Water Resour. Res., 50, 7445–7469, https://doi.org/10.1002/2014WR015484, 2014.
Huang, S., Huang, Q., Chang, J., and Leng, G.: Linkages between hydrological drought, climate indices and human activities: a case study in the Columbia River basin, Int. J. Climatol., 36, 280–290, https://doi.org/10.1002/joc.4344, 2016.
Huang, S., Li, P., Huang, Q., Leng, G., Hou, B., and Ma, L.: The propagation from meteorological to hydrological drought and its potential influence factors, J. Hydrol., 547, 184–195, https://doi.org/10.1016/j.jhydrol.2017.01.041, 2017.
Hulsman, P., Savenije, H. H. G., and Hrachowitz, M.: Learning from satellite observations: increased understanding of catchment processes through stepwise model improvement, Hydrol. Earth Syst. Sci., 25, 957–982, https://doi.org/10.5194/hess-25-957-2021, 2021.
Jehanzaib, M., Ali Shah, S., Yoo, J., and Kim, T.: Investigating the impacts of climate change and human activities on hydrological drought using non-stationary approaches, J. Hydrol., 588, 125052, https://doi.org/10.1016/j.jhydrol.2020.125052, 2020.
Jiang, S., Wang, M., Ren, L., Xu, C., Yuan, F., Liu, Y., Lu, Y., and Shen, H.: A framework for quantifying the impacts of climate change and human activities on hydrological drought in a semiarid basin of Northern China, Hydrol. Process., 33, 1075–1088, https://doi.org/10.1002/hyp.13386, 2019.
Jiao, Y. and Yuan, X.: More severe hydrological drought events emerge at different warming levels over the Wudinghe watershed in northern China, Hydrol. Earth Syst. Sci., 23, 621–635, https://doi.org/10.5194/hess-23-621-2019, 2019.
Kavetski, D., Fenicia, F., and Clark, M. P.: Impact of temporal data resolution on parameter inference and model identification in conceptual hydrological modeling: Insights from an experimental catchment, Water Resour. Res., 47, W05501, https://doi.org/10.1029/2010WR009525, 2011.
Konz, M. and Seibert, J.: On the value of glacier mass balances for hydrological model calibration, J. Hydrol., 385, 238–246, https://doi.org/10.1016/j.jhydrol.2010.02.025, 2010.
Kendall, M. G.: Rank Correlation Methods, Griffin, London, 202 pp., 1975.
Kubiak-Wójcicka, K. and Bąk, B.: Monitoring of meteorological and hydrological droughts in the Vistula basin (Poland), Environ. Monit. Assess., 190, 691, https://doi.org/10.1007/s10661-018-7058-8, 2018.
Li, Y., Wang, Z., Zhang, Y., Li, X., and Huang, W.: Drought variability at various timescales over Yunnan Province, China: 1961–2015, Theor. Appl. Climatol., 138, 743–757, https://doi.org/10.1007/s00704-019-02859-z, 2019.
Lloyd-Hughes, B. and Saunders, M. A.: A drought climatology for Europe, Int. J. Climatol., 22, 1571–1592, https://doi.org/10.1002/joc.846, 2002.
Liu, Y. Ren, L., Zhu, Y., Yang, X., Yuan, F., Jiang, S., and Ma, M.: Evolution of Hydrological Drought in Human Disturbed Areas: A Case Study in the Laohahe Catchment, Northern China, Adv. Meteorol., 2016, 1–12, https://doi.org/10.1155/2016/5102568, 2016.
Ma, F., Luo, L., Ye, A., and Duan, Q.: Drought Characteristics and Propagation in the Semiarid Heihe River Basin in Northwestern China, J. Hydrometeorol., 20, 59–77, https://doi.org/10.1175/JHM-D-18-0129.1, 2019.
Margariti, J., Rangecroft, S., Parry, S., Wendt, D. E., and Van Loon, A. F.: Anthropogenic activities alter drought termination. Elem. Sci. Anth., 7, 1–20, https://doi.org/10.1525/elementa.365, 2019.
McKee, T. B., Doesken, N. J., and Kleist, J.: The relationship of drought frequency and duration to time scales, in: Eighth Conference on Applied Climatology, 17–22 January 1993, Anaheim, California, Proceedings of the 8th Conference on Applied Climatology, Anaheim, California, 1993.
Mianabadi, A., Davary, K., Mianabadi, H., and Karimi, P.: International Environmental Conflict Management in Transboundary River Basins, Water Resour. Manage., 34, 3445–3464, https://doi.org/10.1007/s11269-020-02576-7, 2020.
Mishra, A. K. and Singh, V. p.: A review of drought concepts, J. Hydrol., 391, 202–216, https://doi.org/10.1016/j.jhydrol.2010.07.012, 2010.
Mishra, V., Shah, R., Azhar, S., Shah, H., Modi, P., and Kumar, R.: Reconstruction of droughts in India using multiple land-surface models (1951–2015), Hydrol. Earth Syst. Sci., 22, 2269–2284, https://doi.org/10.5194/hess-22-2269-2018, 2018.
Miyan, M. A.: Droughts in Asian Least Developed Countries: Vulnerability and sustainability, Weather Clim. Extremes, 7, 8–23, https://doi.org/10.1016/j.wace.2014.06.003, 2015.
Moravec, V., Markonis, Y., Rakovec, O., Kumar, R., and Hanel, M.: A 250-Year European Drought Inventory Derived From Ensemble Hydrologic Modeling, Geophys. Res. Lett., 46, 5909–5917, https://doi.org/10.1029/2019GL082783, 2019.
Mostbauer, K., Kaitna, R., Prenner, D., and Hrachowitz, M.: The temporally varying roles of rainfall, snowmelt and soil moisture for debris flow initiation in a snow-dominated system, Hydrol. Earth Syst. Sci., 22, 3493–3513, https://doi.org/10.5194/hess-22-3493-2018, 2018.
Nalbantis, I. and Tsakiris, G.: Assessment of Hydrological Drought Revisited, Water Resour. Manage., 23, 881–897, https://doi.org/10.1007/s11269-008-9305-1, 2009.
Nash, J. E. and Sutcliffe, J. V.: River flow forecasting through conceptual models: part I —A discussion of principles, J. Hydrol., 10, 282–290, https://doi.org/10.1016/0022-1694(70)90255-6, 1970.
Nijzink, R. C., Almeida, S., Pechlivanidis, I. G., Capell, R., Gustafssons, D., Arheimer, B., Parajka, J., Freer, J., Han, D., Wagener, T., van Nooijen, R. R. P., Savenije, H. H. G., and Hrachowitz, M.: Constraining Conceptual Hydrological Models With Multiple Information Sources, Water Resour. Res., 54, 1–31, https://doi.org/10.1029/2017WR021895, 2018.
Noorisameleh, Z., Khaledi, S., Shakiba, A., Zeaiean Firouzabadi, P., Gough, W. A., and Qader Mirza, M. M.: Comparative evaluation of impacts of climate change and droughts on river flow vulnerability in Iran, Water Science and Engineering, 13, 265–274, https://doi.org/10.1016/j.wse.2020.05.001, 2020.
Parajka, J. and Blöschl, G.: Spatio-temporal combination of MODIS images – potential for snow cover mapping, Water Resour. Res., 44, 1–13, https://doi.org/10.1029/2007WR006204, 2008.
Pathak, A. A. and Dodamani, C. B. M.: Comparison of two hydrological drought indices, Perspect. Sci., 8, 626–628, https://doi.org/10.1016/j.pisc.2016.06.039, 2016.
Pei, Z., Fang, S., Wang, L., and Yang, W.: Comparative Analysis of Drought Indicated by the SPI and SPEI at Various Timescales in Inner Mongolia, China, Water, 12, 1925, https://doi.org/10.3390/w12071925, 2020.
Piqué, G., Batalla, R. J., and Sabater, S.: Hydrological characterization of dammed rivers in the NW Mediterranean region, Hydrol. Process., 30, 1691–1707, https://doi.org/10.1002/hyp.10728, 2016.
Prenner, D., Kaitna, R., Mostbauer, K., and Hrachowitz, M.: The Value of Using Multiple Hydro-meteorological Variables to Predict Temporal Debris Flow Susceptibility in an Alpine Environment, Water Resour. Res., 54, 6822–6843, https://doi.org/10.1029/2018WR022985, 2018.
Raziei, T., Saghafian, B., Paulo, A. A. Pereira, L. S., and Bordi, I.: Spatial patterns and temporal variability of drought in western Iran, Water Resour. Manage., 23, 439–455, https://doi.org/10.1007/s11269-008-9282-4, 2009.
Saidi, H., Dresti, C., Manca, D., and Ciampittiello, M.: Quantifying impacts of climate variability and human activities on the streamflow of an Alpine river, Environ. Earth Sci., 77, 690, https://doi.org/10.1007/s12665-018-7870-z, 2018.
Schaller, M. F. and Fan, Y.: River basins as groundwater exporters and importers: implications for water cycle and climate modeling, J. Geophys. Res.-Atmos., 114, D04103, https://doi.org/10.1029/2008JD010636, 2009.
Schuol, J. and Abbaspour, K. C.: Calibration and uncertainty issues of a hydrological model (SWAT) applied to West Africa, Adv. Geosci., 9, 137–143, https://doi.org/10.5194/adgeo-9-137-2006, 2006.
Schuol, J., Abbaspour, K. C., Yang, H., Srinivasan, R., and Zehnder, A. J. B.: Modeling blue and green water availability in Africa, Water Resour. Res., 44, 1–18, https://doi.org/10.1029/2007WR006609, 2008.
Spinoni, J., Naumann, G., Carrao, H., Barbosa, P., and Vogt, J.: World drought frequency, duration, and severity for 1951–2010, Int. J. Climatol., 34, 2792–2804, https://doi.org/10.1002/joc.3875, 2014.
Stagge, J. H., Tallaksen, L. M., Gudmundsson, L., van Loon, A. F., and Stahl, K.: Candidate distributions for climatological drought indices (SPI and SPEI), Int. J. Climatol., 35, 4027–4040, https://doi.org/10.1002/joc.4267, 2015.
Trambauer, P., Maskey, S., Werner, M., Pappenberger, F., van Beek, L. P. H., and Uhlenbrook, S.: Identification and simulation of space–time variability of past hydrological drought events in the Limpopo River basin, southern Africa, Hydrol. Earth Syst. Sci., 18, 2925–2942, https://doi.org/10.5194/hess-18-2925-2014, 2014.
UNODC (United Nation Office on Drugs and Crime): Afghanistan Opium Survey, Government of Afghanistan, Ministry of Counter Narcotics, Kabul, 150 pp., 2006.
USGS: Water Data for the Nation, available at: https://waterdata.usgs.gov, last access: 4 April 2021.
Van Beek, E., Bozorgi, B., Vekerdy, Z., and Meijer, K.: Limits to agricultural growth in the Sistan Closed Inland Delta, Iran, Irrig. Drain. Syst., 22, 131–143, https://doi.org/10.1007/s10795-008-9045-7, 2008.
Van Huijgevoort, M. H. J., van Lanen, H. A. J., Teuling, A. J., and Uijlenhoet, R.: Identification of changes in hydrological drought characteristics from a multi-GCM driven ensemble constrained by observed discharge, J. Hydrol., 512, 421–434, https://doi.org/10.1016/j.jhydrol.2014.02.060, 2014.
Van Lanen, H. A. J., Wanders, N., Tallaksen, L. M., and Van Loon, A. F.: Hydrological drought across the world: impact of climate and physical catchment structure, Hydrol. Earth Syst. Sci., 17, 1715–1732, https://doi.org/10.5194/hess-17-1715-2013, 2013.
Van Loon, A. F.: Hydrological drought explained, WIREs Water, 2, 359–392, https://doi.org/10.1002/wat2.1085, 2015.
Van Loon, A. F. and Laaha, G.: Hydrological drought severity explained by climate and catchment characteristics, J. Hydrol., 526, 3–14, https://doi.org/10.1016/j.jhydrol.2014.10.059, 2015.
Van Loon, A. F., Stahl, K., Di Baldassarre, G., Clark, J., Rangecroft, S., Wanders, N., Gleeson, T., Van Dijk, A. I. J. M., Tallaksen, L. M., Hannaford, J., Uijlenhoet, R., Teuling, A. J., Hannah, D. M., Sheffield, J., Svoboda, M., Verbeiren, B., Wagener, T., and Van Lanen, H. A. J.: Drought in a human-modified world: reframing drought definitions, understanding, and analysis approaches, Hydrol. Earth Syst. Sci., 20, 3631–3650, https://doi.org/10.5194/hess-20-3631-2016, 2016.
Van Loon, A. F., Rangecroft, S., Coxon, G., Breña Naranjo, J. A., Van Ogtrop, F., and Van Lanen, H. A. J.: Using paired catchments to quantify the human influence on hydrological droughts, Hydrol. Earth Syst. Sci., 23, 1725–1739, https://doi.org/10.5194/hess-23-1725-2019, 2019.
Vicente-Serrano, S. M., Beguería, S., and López-Moreno, J. I.: A Multiscalar Drought Index Sensitive to Global Warming: The Standardized Precipitation Evapotranspiration Index, J. Climate, 23, 1696–1718, https://doi.org/10.1175/2009JCLI2909.1, 2010.
Vicente-Serrano, S. M., López-Moreno, J. I., Beguería, S., and Lorenzo-Lacruz, J.: Accurate Computation of a Streamflow Drought Index, J. Hydrol. Eng., 17, 318–332, https://doi.org/10.1061/(ASCE)HE.1943-5584.0000433, 2012.
Vining, K. C. and Vecchia, A. V.: Water-Balance Simulations of Runoff and Reservoir Storage for the Upper Helmand Watershed and Kajakai Reservoir, Central Afghanistan, U.S. Agency for International Development, Sci. Invest. Rep., 24 pp., U.S. Department of the Interior, U.S. Geological Survey, 2007.
Wada, Y., Reager, J. T., Chao, B. F., Wang, J., Lo, M. H., Song, C., Li, Y., and Gardner, A. S.: Recent changes in land water storage and its contribution to sea level variations, Surv. Geophys., 38, 131–152, https://doi.org/10.1007/s10712-016-9399-6, 2016.
Wan, W., Zhao, J., Li, H.-Y., Mishra, A., Hejazi, M., Lu, H., Demissie, Y., and Wang, H.: A holistic view of water management impacts on future droughts: A global multimodel analysis, J. Geophys. Res.-Atmos., 123, 5947–5972, https://doi.org/10.1029/2017JD027825, 2018.
Wan, W., Zhao, J., Li, H.-Y., Mishra, A., Ruby Leung, L., Hejazi, M., Wang, W., Lu, H., Deng, Z., Demissisie, Y., and Wang, H.: Hydrological drought in the anthropocene: Impacts of local water extraction and reservoir regulation in the U.S., J. Geophys. Res.-Atmos., 122, 11313–11328, https://doi.org/10.1002/2017JD026899, 2017.
Wang, Y., Yang, J., Chang, J., and Zhang, R.: Assessing the drought mitigation ability of the reservoir in the downstream of the Yellow River, Sci. Total Environ., 646, 1327–1335, 2019.
Wardlaw, R., Goes, B., Parajuli, U., and Hancock, I.: Helmand River Basin Master Plan, Phase 3, Water Resources Modelling for Helmand River Basin, Ministry of Energy and Water, Kabul, Technical Report., 3, 251 pp., 2013.
Weng, B., Zhang, P., and Li, S.: Drought risk assessment in China with different spatial scales, Arabian J. Geosci., 8, 10193–10202, https://doi.org/10.1007/s12517-015-1938-9, 2015.
Whitney, J. W.: Geology, Water, and Wind in the Lower Helmand Basin, Southern Afghanistan, U.S. Agency for International Development, Sci. Invest. Rep., 2006–5182, 50 pp., U.S. Department of the Interior, U.S. Geological Survey, 2006.
Wisser, D., Fekete, B. M., Vörösmarty, C. J., and Schumann, A. H.: Reconstructing 20th century global hydrography: a contribution to the Global Terrestrial Network-Hydrology (GTN-H), Hydrol. Earth Syst. Sci., 14, 1–24, https://doi.org/10.5194/hess-14-1-2010, 2010.
Wu, J., Chen, X., Yao, H., Gao, L., Chen, Y., and Liu, M.: Non-linear relationship of hydrological drought responding to meteorological drought and impact of a large reservoir, J. Hydrol., 551, 495–507, https://doi.org/10.1016/j.jhydrol.2017.06.029, 2017.
Wu, J., Chen, X., Yu, Z, Yao, H., Li, W., and Zhang, D.: Assessing the impact of human regulations on hydrological drought development and recovery based on a “simulated-observed” comparison of the SWAT model, J. Hydrol., 577, 123990, https://doi.org/10.1016/j.jhydrol.2019.123990, 2019.
Yassin, F., Razavi, S., Elshamy, M., Davison, B., Sapriza-Azuri, G., and Wheater, H.: Representation and improved parameterization of reservoir operation in hydrological and land-surface models, Hydrol. Earth Syst. Sci., 23, 3735–3764, https://doi.org/10.5194/hess-23-3735-2019, 2019.
Zhang, D., Liu, X., Liu, C., and Bai, P.: Responses of runoff to climatic variation and human activities in the Fenhe River, China, Stoch. Env. Res. Risk A., 27, 1293–1301, https://doi.org/10.1007/s00477-012-0665-y, 2013.