the Creative Commons Attribution 4.0 License.
the Creative Commons Attribution 4.0 License.
 | 25 Mar 2021
The precipitation variability of the wet and dry season at the interannual and interdecadal scales over eastern China (1901–2016): the impacts of the Pacific Ocean
Tao Gao
Li Dan
Ming Li
Xiang Gong
Junjie Zhan
The spatiotemporal variability of rainfall in the dry (October–March) and wet (April–September) seasons over eastern China is examined from 1901–2016 based on the gridded rainfall dataset from the University of East Anglia Climatic Research Unit. Principal component analysis is employed to identify the dominant variability modes, wavelet coherence is utilized to investigate the spectral features of the leading modes of precipitation and their coherences with the large-scale modes of climate variability, and the Bayesian dynamical linear model is adopted to quantify the time-varying correlations between climate variability modes and rainfall in the dry and wet seasons. Results show that first and second principal components (PCs) account for 34.2 % (16.1 %) and 13.4 % (13.9 %) of the variance in the dry (wet) season, and their variations are roughly coincident with phase shifts of the El Niño–Southern Oscillation (ENSO) in both seasons. The anomalous moisture fluxes responsible for the occurrence of precipitation events in eastern China exhibit an asymmetry between high and light rainfall years in the dry (wet) season. The ENSO has a 4- to 8-year signal of the statistically positive (negative) association with rainfall during the dry (wet) season over eastern China. The statistically significant positive (negative) associations between the Pacific Decadal Oscillation (PDO) and precipitation are found with a 9- to 15-year (4- to 7-year) signal. The impacts of the PDO on rainfall in eastern China exhibit multiple timescales as compared to the ENSO episodes, while the PDO triggers a stronger effect on precipitation in the wet season than the dry half year. The interannual and interdecadal variations in rainfall over eastern China are substantially modulated by drivers originated from the Pacific Ocean. During the wet season, the ENSO exerted a gradually weakening effect on eastern China rainfall from 1901 to 2016, while the effects of the PDO decreased before the 1980s, and then shifted into increases after the 2000s. The finding provides a metric for assessing the capability of climate models and guidance of seasonal prediction.
- Article
(14853 KB) - Full-text XML
- BibTeX
- EndNote


As a densely populated area with lots of industrial and agricultural activities, eastern China is frequently affected by catastrophic floods and droughts due to the variability of precipitation events (Liu et al., 2015; Gao and Xie, 2016; Huang et al., 2017; Yang et al., 2017a; Luo and Lau, 2018; Ge et al., 2019). For example, intense rainfall in southern China resulted in disastrous floods over the lower reach of Yangtze River basin (YRB) in 1991, 1996, 1998 and 1999. Seriously deficient precipitation in northern China caused a severe drought of 226 d without stream discharge over the Yellow River basin (Qian and Zhou, 2014; Xu et al., 2015; Zhang and Zhou, 2015). It is therefore of great importance to investigate the rainfall variability in eastern China and its associated physical mechanisms.
Both the observed and simulated results demonstrated that the variations in rainfall over eastern China are more closely correlated with the Pacific sea surface temperature (SST) anomalies as compared to the Atlantic SST pattern, which plays a supplementary role on eastern China rainfall variability (Wang and Zhou, 2005; Huang et al., 2017; Yang et al., 2017b). At the interannual scale, heavy rainfall events often occur over southern China during El Niño episodes (e.g., Zhang et al., 1996; Wang et al., 2000; He et al., 2017; Gao et al., 2020). The variations in precipitation events over eastern China are remarkably impacted by the tropical Pacific SST and the western Pacific subtropical high at the interdecadal scale (WPSH; Chang et al., 2000a; Zhu et al., 2011; Li et al., 2019). SST anomalies over the tropical Indian Ocean and tropical eastern Pacific also account for the shifts of the positive–negative–positive rainfall patterns in eastern China via their influences on WPSH (Chang et al., 2000b; Hu et al., 2018). Thus, a better understanding of interannual and interdecadal changes stemming from the variability of air–sea interactions over the Pacific Ocean is instrumental to the interpretation and seasonal prediction of the rainfall variability over eastern China.
The El Niño–Southern Oscillation (ENSO) is a strong air–sea coupled mode at the interannual scale over the tropics. It is also the important source of interannual variability of the global climate system (Webster et al., 1998). The ENSO significantly impacts rainfall over eastern China by means of atmospheric teleconnections (e.g., Wang et al., 2008; Jin et al., 2016; Liu et al., 2016; Sun et al., 2017; Gao et al., 2017). Wang et al. (2000) proposed that the key system of the Pacific–East Asian teleconnection responsible for linkages between the ENSO and precipitation anomalies in eastern China is an anomalous low-level anticyclone located over the western North Pacific (WNP), which is induced by local air–sea interactions and large-scale equatorial heating anomalies. Wu et al. (2003) further argued that the similar positive correlation between springtime rainfall over the mid-lower reaches of the YRB and the ENSO is linked to the evolution of ENSO-related seasonal rainfall anomalies over East Asia. Moreover, the summertime rainfall amount over the YRB and to its south is expected to increase (decrease) during El Niño (La Niña) years. Huang and Wu (1989) documented that the drought in northern and southern China as well as the flood over central China are associated with the developing stage of warm ENSO episodes, and the reversed relationship occurs in the decaying stage of the warm events. These patterns of rainfall in eastern China can also be related to strong convective activities in the Philippines because the western Pacific warm pool shifts the WPSH northward (Huang and Sun, 1992; Jin et al., 2016). The latest research suggested that the patterns of seasonal rainfall anomaly in eastern China are impacted by the different types of La Niña decay; these are attributed to the responses of large-scale circulation anomalies induced by different types of La Niña episodes (Chen et al., 2019).
At the interdecadal scale, northern China experienced alternating dry and wet years with above-normal rainfall around the 1950s and severe droughts around the 1970s and 1980s, while the YRB and southern China suffered apparent shifts of precipitation patterns in the 1970s and 1990s (Zhu et al., 2015). A growing body of studies indicated that these shifts of rainfall distribution over eastern China are caused by the shifts in Pacific decadal oscillation (PDO) phases. Yang and Lau (2004) reported a close relationship between the positive PDO and decreasing trends of summertime rainfall events over eastern China. Based on surface wetness indices, Ma (2007) further pointed out an anti-correlation between rainfall in northern China and PDO phases, suggesting more droughts during the positive phase of the PDO and vice versa. The relatively high (low) precipitation over the Huang-Huai (Yangtze) River basin from 2000 to 2008 in comparison with 1979–1999 is triggered by the transition from the warm to cold phase of the PDO around the 2000s, which is attributed to the weakened westerly winds and warming over Lake Baikal induced by a negative PDO phase after the 2000s (Zhu et al., 2011). The possible modulation of the PDO on the East Asian summer monsoon (EASM) and East Asian winter monsoon (EAWM), which are associated with summer and winter rainfall changes in eastern China, respectively, has been documented in previous studies (e.g., Yu, 2013; Chen et al., 2013). Zhou et al. (2013) pointed out an anti-correlation between the PDO and EASM since the 1950s, and negative phases of the PDO correspond to a stronger EASM with more precipitation events over northern China. A much stronger EASM tends to appear after a weak EAWM in positive phases of the PDO than in negative phases of the PDO (Chen et al., 2013). Existing studies also reported a similar relationship between the positive phase of the PDO and dryness in northern China and revealed that a warm phase of the PDO in 1976–1977 resulted in a weakened EASM associated with aridity in northern China in the 1980s and 1990s (Qian and Zhou, 2014; Zhu et al., 2015; Yang et al., 2017b; Gao and Wang, 2017). Furthermore, the relationship between interdecadal variability of rainfall patterns over eastern China and phase transitions of the PDO is also identified and verified by coupled climate model simulations (e.g., Li et al., 2010; Yu et al., 2015).
Most previous studies that assessed the impacts of the ENSO and PDO on eastern China rainfall are limited to relatively short dataset records. Ouyang et al. (2014) and Yang et al. (2017a) performed century-scale analyses of the linkage between rainfall pattern across China and the ENSO and PDO, while their time-varying relationships are not sufficiently considered. The latest research documented that rainfall over northern China displays an unstable relationship with the ENSO at the centennial scale (Wang et al., 2020); particularly, the predictability of seasonal rainfall over the East Asia largely depends on the relationship between large-scale modes and regional precipitation (Chan and Zhou, 2005). Moreover, the variations in climatological seasonal rainfall are employed in the aforementioned analyses, while the main rainy season in China, in particular for eastern China, does not follow conventional seasonal boundaries, since the rainfall in eastern China is principally concentrated from April–September (Bao, 1987; Domroes and Peng, 1988; Zhai et al., 2005). Usage of boreal standard seasons may therefore unavoidably break the natural rainy distribution at the temporal scale, affecting the robustness of the analytical results. Zhai et al. (2005) have investigated trends of precipitation extremes during the wet season (April–September) and dry season (October–March) in China and suggested that the utilization of six months as the dry (wet) half year facilitates characterization of the variations in extreme events. The contribution of both the ENSO and PDO to the interannual and interdecadal rainfall variability in major rainy seasons over eastern China remains unclear. In this study, we consider April–September as the wet half year (wet season) and October–March as the dry half year (dry season) to examine the time-varying effects of the ENSO and PDO on the precipitation variability in eastern China based on long-term datasets. The data and methods are described in Sect. 2. The results are provided in Sect. 3. Section 4 presents the discussion and conclusions.
2.1 Data
A dataset of daily accumulated rainfall amounts at 756 meteorological stations from 1960–2015 across China is employed in this study. This dataset is managed by the Climate Data Center of the National Meteorological Center of the China Meteorological Administration (http://data.cma.cn, last access: 27 October 2020), including almost all the first- and second-class national climatological stations. We conduct accurate quality control procedures to check the temporal inhomogeneity and missing values and screen the related stations in the following analyses, meaning that the stations having too many missing rainfall values are dropped. For example, a year is considered as a missing year if there exists more than 10 % missing days, and a station with less than 5 % missing years is retained. After these procedures, 436 stations meet these criteria and are retained in the subsequent analyses. Another rainfall dataset is a global land monthly precipitation dataset from University of East Anglia Climatic Research Unit (CRU), which has a high resolution of 0.5∘ × 0.5∘ over land from 1901 to 2016. The CRU data cover a longer period compared to observed counterpart. Further information about this dataset is available in Harris et al. (2014). The observed rainfall datasets at 436 stations are used to access the robustness of reliability and representativeness of the CRU gridded data with much longer time series over eastern China, since the long-term gridded precipitation data from 1901–2016 are more suitable for examining multi-decadal variability.
The reanalysis datasets are utilized to detect the physical mechanisms responsible for the interannual and interdecadal variability of eastern China rainfall. We select monthly global circulation variables from the National Centers for Environmental Prediction/National Center for Atmospheric Research (NCEP/NCAR) reanalysis data (Kalnay et al., 1996). SST data are obtained from the Met Office Hadley Centre (Rayner et al., 2003). The ENSO index is obtained from the Climate Prediction Center of NOAA (https://psl.noaa.gov/gcos_wgsp/Timeseries/Data/nino34.long.data, last access: 21 October 2020). The PDO index is extracted from the Earth System Research Laboratory of NOAA (https://psl.noaa.gov/data/correlation/pdo.data, last access: 21 October 2020).
2.2 Method
2.2.1 Principle component analysis
The gridded CRU precipitation dataset is subjected to principle component analysis (PCA), which is a widely applied method to extract the dominant temporal and spatial modes of the variability based on mutually correlated dataset. The leading principal component (PC) explains most of the variance, with the second PC decreasing thereafter. Moreover, the leading PCs can reduce the dimension of the original dataset, because they capture most of the variance. A detailed description of PCA is available in Hannachi et al. (2007). To identify the effects of climate variability modes on spatiotemporal changes in rainfall over eastern China, the correlations between the leading PCs and climate variability modes are calculated to examine the telecommunications. The composited maps of the variables (e.g., sea surface temperature, sea level pressure and vertically integrated water vapor) are analyzed to detect the physical mechanisms responsible for the rainfall variability by utilizing the high and light 25th percentile values of the daily rainfall in the wet and dry seasons, respectively.
2.2.2 Wavelet coherence
The wavelet coherence is a widely employed technique based on how coherent the cross-wavelet transform is in time–frequency space. It can preferably assess the detailed relationships between two time series with different time periods and disparate frequency ranges (e.g., Grinsted et al., 2004; Coulibaly and Burn, 2005). Given two particular time series X and Y, the wavelet coherence of them can be expressed as
where * represents their complex conjunction. Correspondingly, the cross-wavelet power can be expressed as |WXY|. Complex argument arg (WXY) is considered as local relative phases between the time series X and Y, which are applicative in both frequency and time domains. The wavelet coherence of the time series can be defined according to Torrence and Webster (1999) by the following equation:
where s is the wavelet scale and the subscript n is defined as the time series length. S is the smoothing operator, which is further written as
where Sscale and Stime denote the smoothing along wavelet scale axis and time, respectively. It is natural to design the smoothing operator so that it has a similar footprint as the wavelet.
The related codes for the wavelet coherence used in the present study can be freely downloaded from https://www.alivelearn.net/?p=1561 (last access: 21 September 2020). The wavelet coherence is used to investigate the correlations between the ENSO/PDO and rainfall over eastern China.
2.2.3 Bayesian dynamic linear model
The increases in amplitude of the SST anomaly patterns over the Pacific Ocean in the context of global warming trigger non-stationarity changes in regional rainfall (Wang et al., 2013; Krishnaswamy et al., 2015; Rajagopalan and Zagona, 2016). The Bayesian dynamic linear model (BDLM) is utilized to examine the non-stationarity and epochal fluctuations between the climate variability modes and rainfall in eastern China. The description of BDLM model is as follows:
where kt are the leading PCs of rainfall over eastern China, jt is the covariate (climate variability modes, i.e., the ENSO and PDO) and αt and βt are the dynamic intercept and slope coefficients at time t. ωt is the corresponding evaluation error and Wt is the corresponding scalar greater than zero.
Unlike traditional linear regression methods that cannot characterize the robust time-varying relationship, the BDLM can model and understand the non-stationarity in the relationships between large-scale modes of climate variability and regional precipitation with time. This method has been used to model monsoonal precipitation variability in India and China and shows better performance and more interesting insights than the traditional regression method (Krishnaswamy et al., 2015; Gao et al., 2017). For the BDLM, the regression coefficient varies with time compared to the traditional regression, in which the coefficient remains fixed.
3.1 Comparison between observed and CRU rainfall datasets
The variations in monthly and annual rainfall over eastern China based on both the observed stations and CRU gridded points from 1960 to 2015 are illustrated in Fig. 1. The monthly mean precipitation is shown with dashed lines and the climatological average is depicted with solid red lines (Fig. 1a, b). Figure 1 shows that the climatological variability of observed rainfall with months is quite similar to the CRU gridded dataset. The slight disagreement is that the annual mean rainfall is larger and smaller than 80 mm for the CRU and observed datasets, respectively. The climatological rainfall is greater (lesser) than annual mean value from April to September (October to March), consistent with the periods of the wet (dry) season (half year) selected in this study. These changes in rainfall confirm that it is reasonable to categorize the wet and dry seasons over eastern China. We further compare the time series of mean rainfall between the observation and CRU datasets during the wet and dry seasons (Fig. 1c, d), which indicate a strong level of similarity between observed and CRU datasets. High spatial similarity of the observed and CRU datasets during the dry (Fig. 2a, c) and wet (Fig. 2b, d) seasons suggests that the spatial patterns from these two datasets are also consistent. In addition, the spectral analysis is performed using the time series of mean rainfall based on the two datasets (not shown) and similar results are obtained. This indicates that the rainfall variability for the CRU dataset coincides with observations over eastern China. We use the CRU dataset since it covers a much longer period and is therefore more suitable to investigate the interdecadal variability. We present the following analyses in the wet and dry seasons, respectively, to provide a concise result.
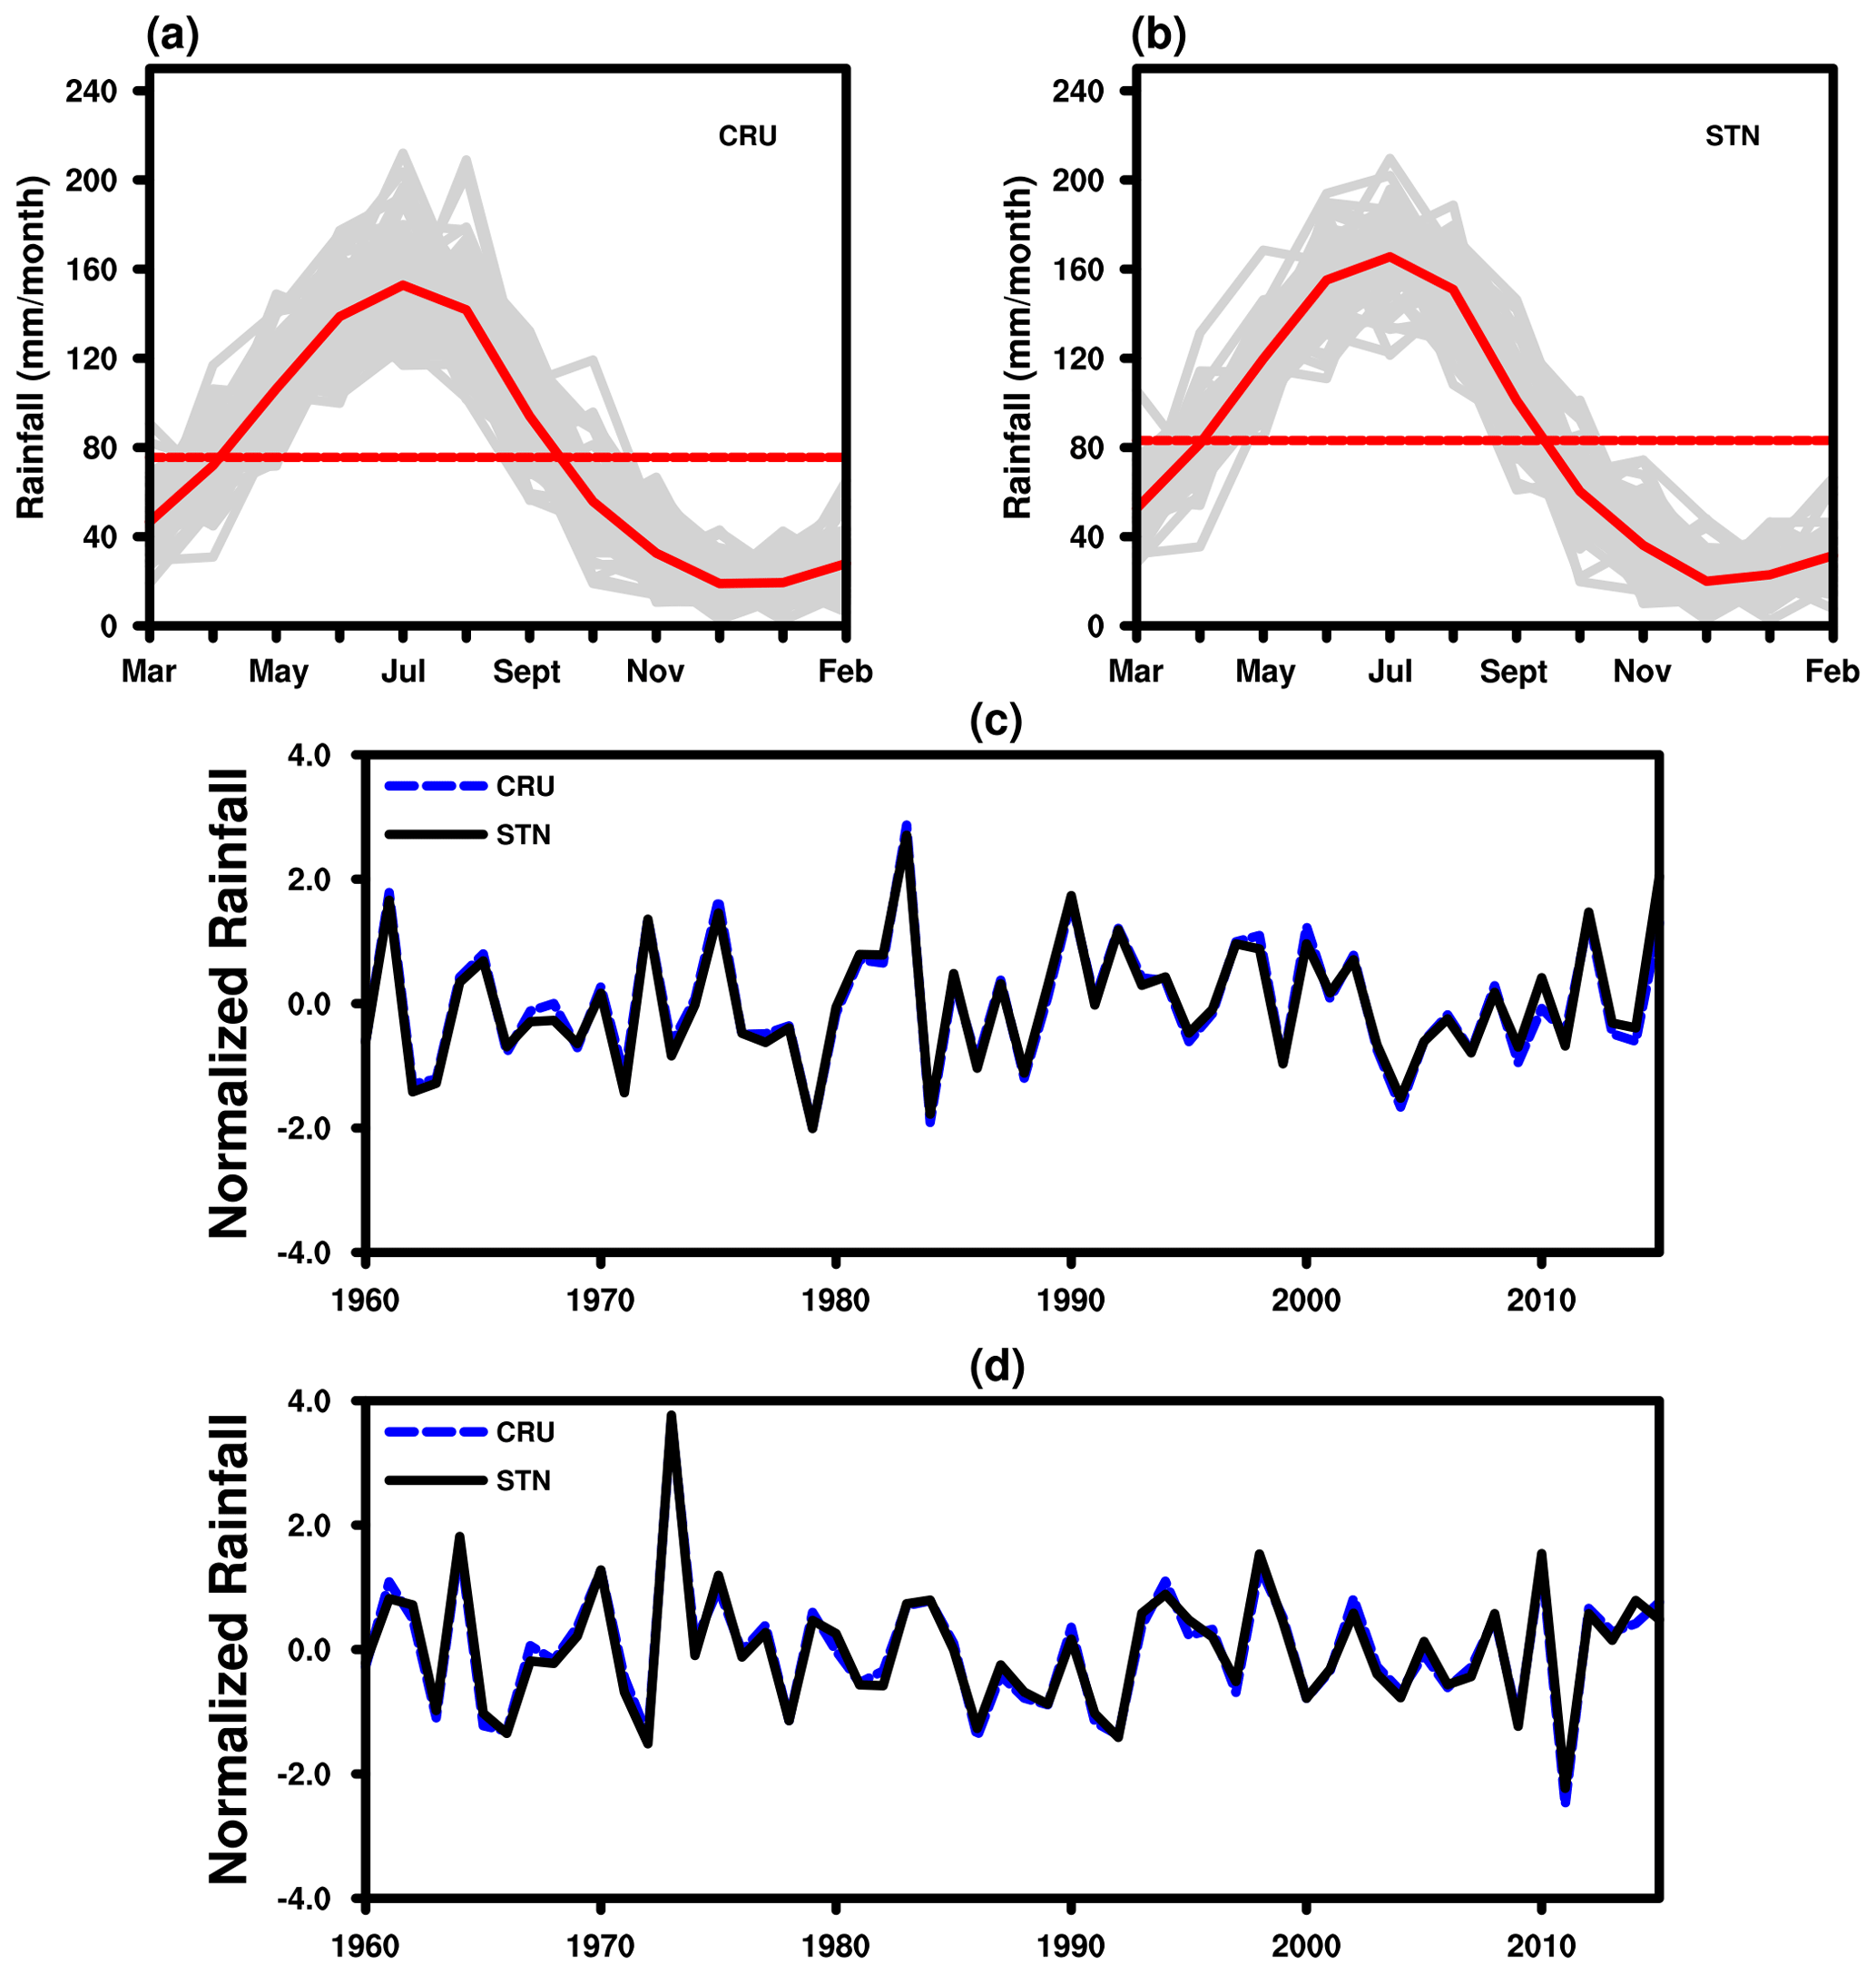
Figure 1Annual rainfall at all stations (STN) and grid (CRU) points shown as gray lines and their mean in a solid red line: (a) observation and (b) CRU. Seasonal mean precipitation anomalies from observation (black) and CRU (blue) for (c) the dry season and (d) the wet season.
3.2 Dry season
The two leading PCs explain 34.22 % and 13.44 % of the total variance; they together capture around 50 % of the variance. Figure 3 depicts the time series of the first PC that is flipped for convenient comparison, which is consistent with the spatial mean rainfall. The first two eigenvectors, including spatial components and corresponding PCs, are shown in Fig. 4. The spatial pattern of the first eigenvector exhibits similar magnitudes and signs, indicating that the dominant pattern is coherent in eastern China, especially over southern China and coastal regions (Fig. 4a); this may be associated with the propagation of the EAWM into mainland China. The second eigenvector displays a southeast–southwest dipole over southern China; this feature is coincident with the location and movement of the EASM (Ding et al., 2009). The time series of PCs also show considerable temporal changes with time, which are discussed in the spectral analysis.
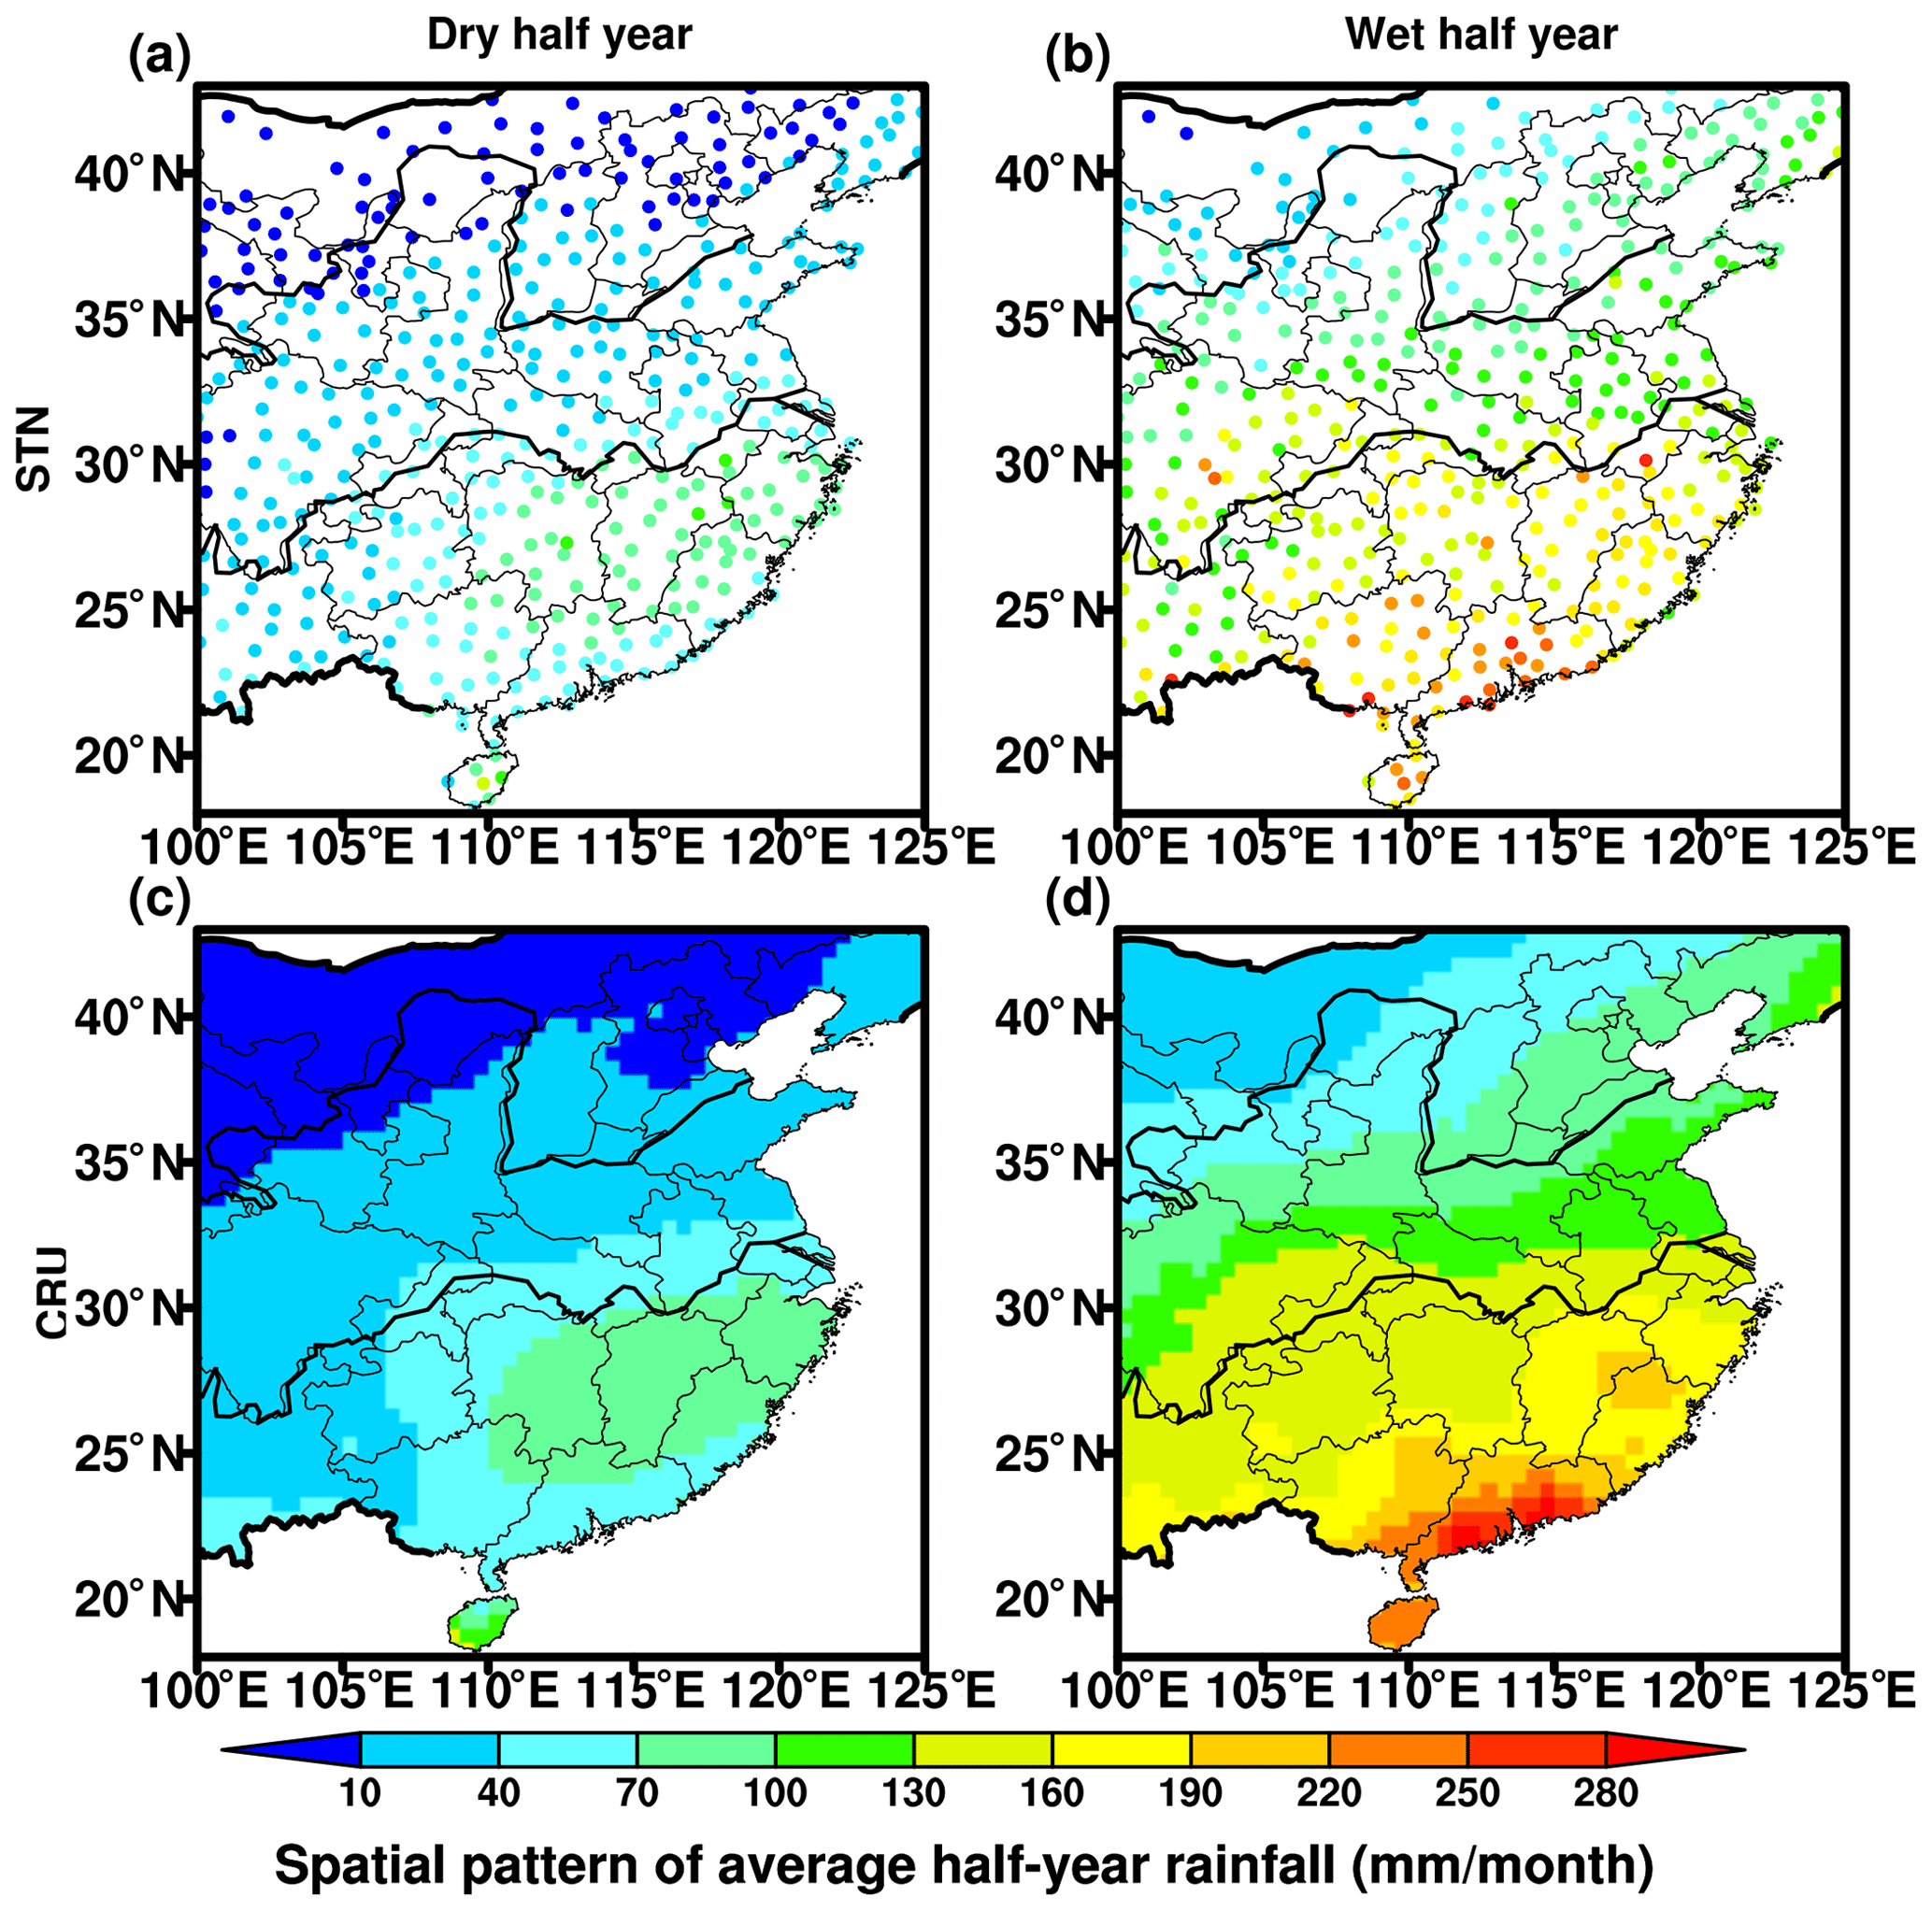
Figure 2Spatial distribution of seasonal mean precipitation (mm/month) from 1960–2015 over eastern China from the observation and CRU datasets. Panels (a) and (c) are for the dry season; panels (b) and (d) are for the wet season.
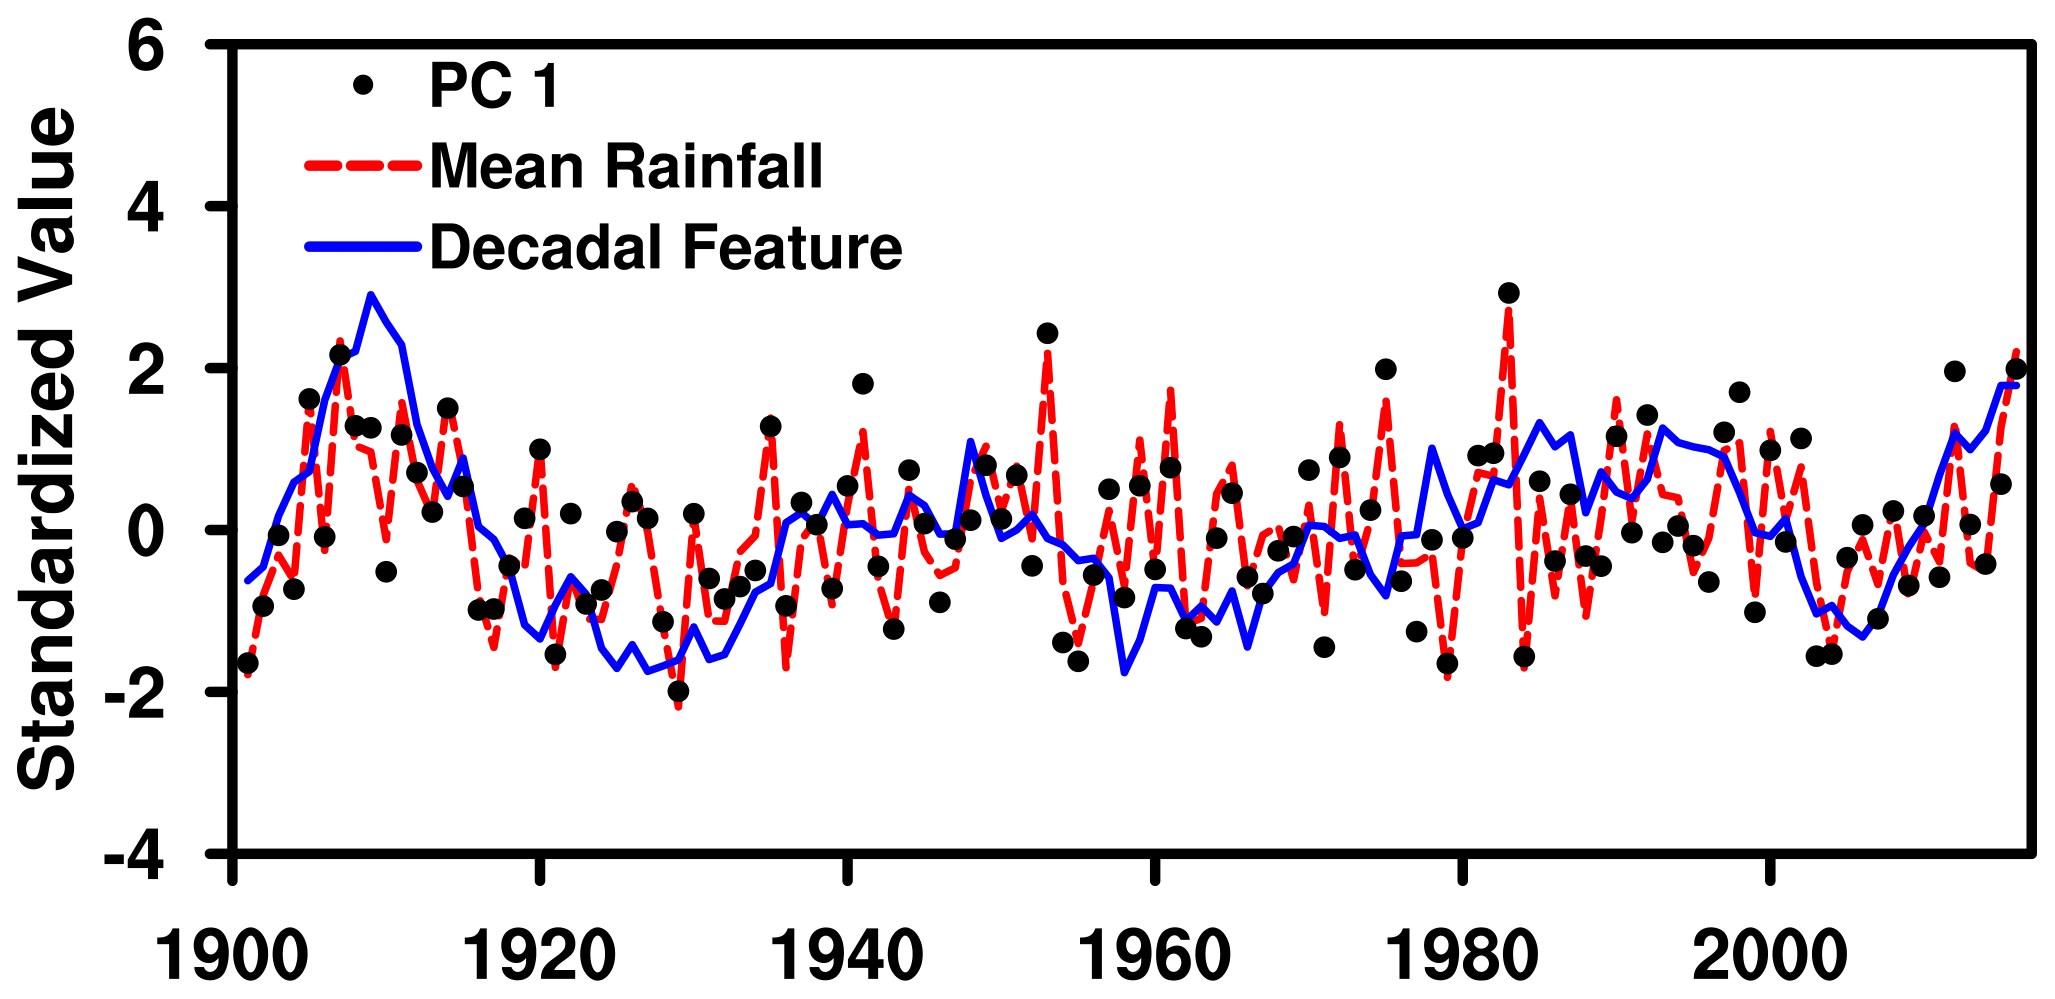
Figure 3Standardized time series of all dry season precipitation over eastern China as shown by the red dashed line. The black dots denote flipped PC1 and the blue lines denote the decadal features of dry season precipitation.

Figure 4The first (a) and second(b) empirical orthogonal function (EOF) for the rainfall in the dry season. The first (c) and second(d) principal components (PCs) correspond to these EOFs from the rainfall in the dry season. Both time series are normalized with respect to the corresponding standard deviations.
Figure 5 shows the correlation maps of the climate variables and PC1 and PC2. Note that the signs of the PCs are flipped to ensure that the correlations are directly inferred as rainfall variability over eastern China. The correlation between PC1 and SSTs displays strong positive coefficients over the equatorial tropical Pacific and North Pacific. The negative connections are mainly found over the South China Sea (SCS) and the central-east Pacific, where it is featured by a La Niña SST pattern (Fig. 5a). This indicates that when the eastern Pacific is colder, as is the case in La Niña episodes, the strengthened convections may occur over southern China and adjacent areas, leading to strengthened rainfall events and vice versa in El Niño episodes. The pattern of correlation with sea level pressure (SLP) is inconsistent with the ones for SSTs; the significant positive correlations are principally seen over the South Pacific and some tropical regions immediate close to the Indian and Pacific oceans (Fig. 5b). Whereas some significant positive coefficients are located over the East China Sea, this may enhance the southeastern wind anomalies that transport more water vapor fluxes into southern China, providing conducive environmental backgrounds of forming more rainfall events. Considering correlations with the geopotential heights at 500 hPa (Fig. 5c), the significant negative coefficients over the tropical central-East Pacific suggest a weakened EAWM. When the EAWM weakens, the strengthened cold and dry air intrudes into southern China and converges with warm and wet air from the oceans, facilitating the occurrence of convective activities resulting in heavy precipitation events (Huang et al., 2018).
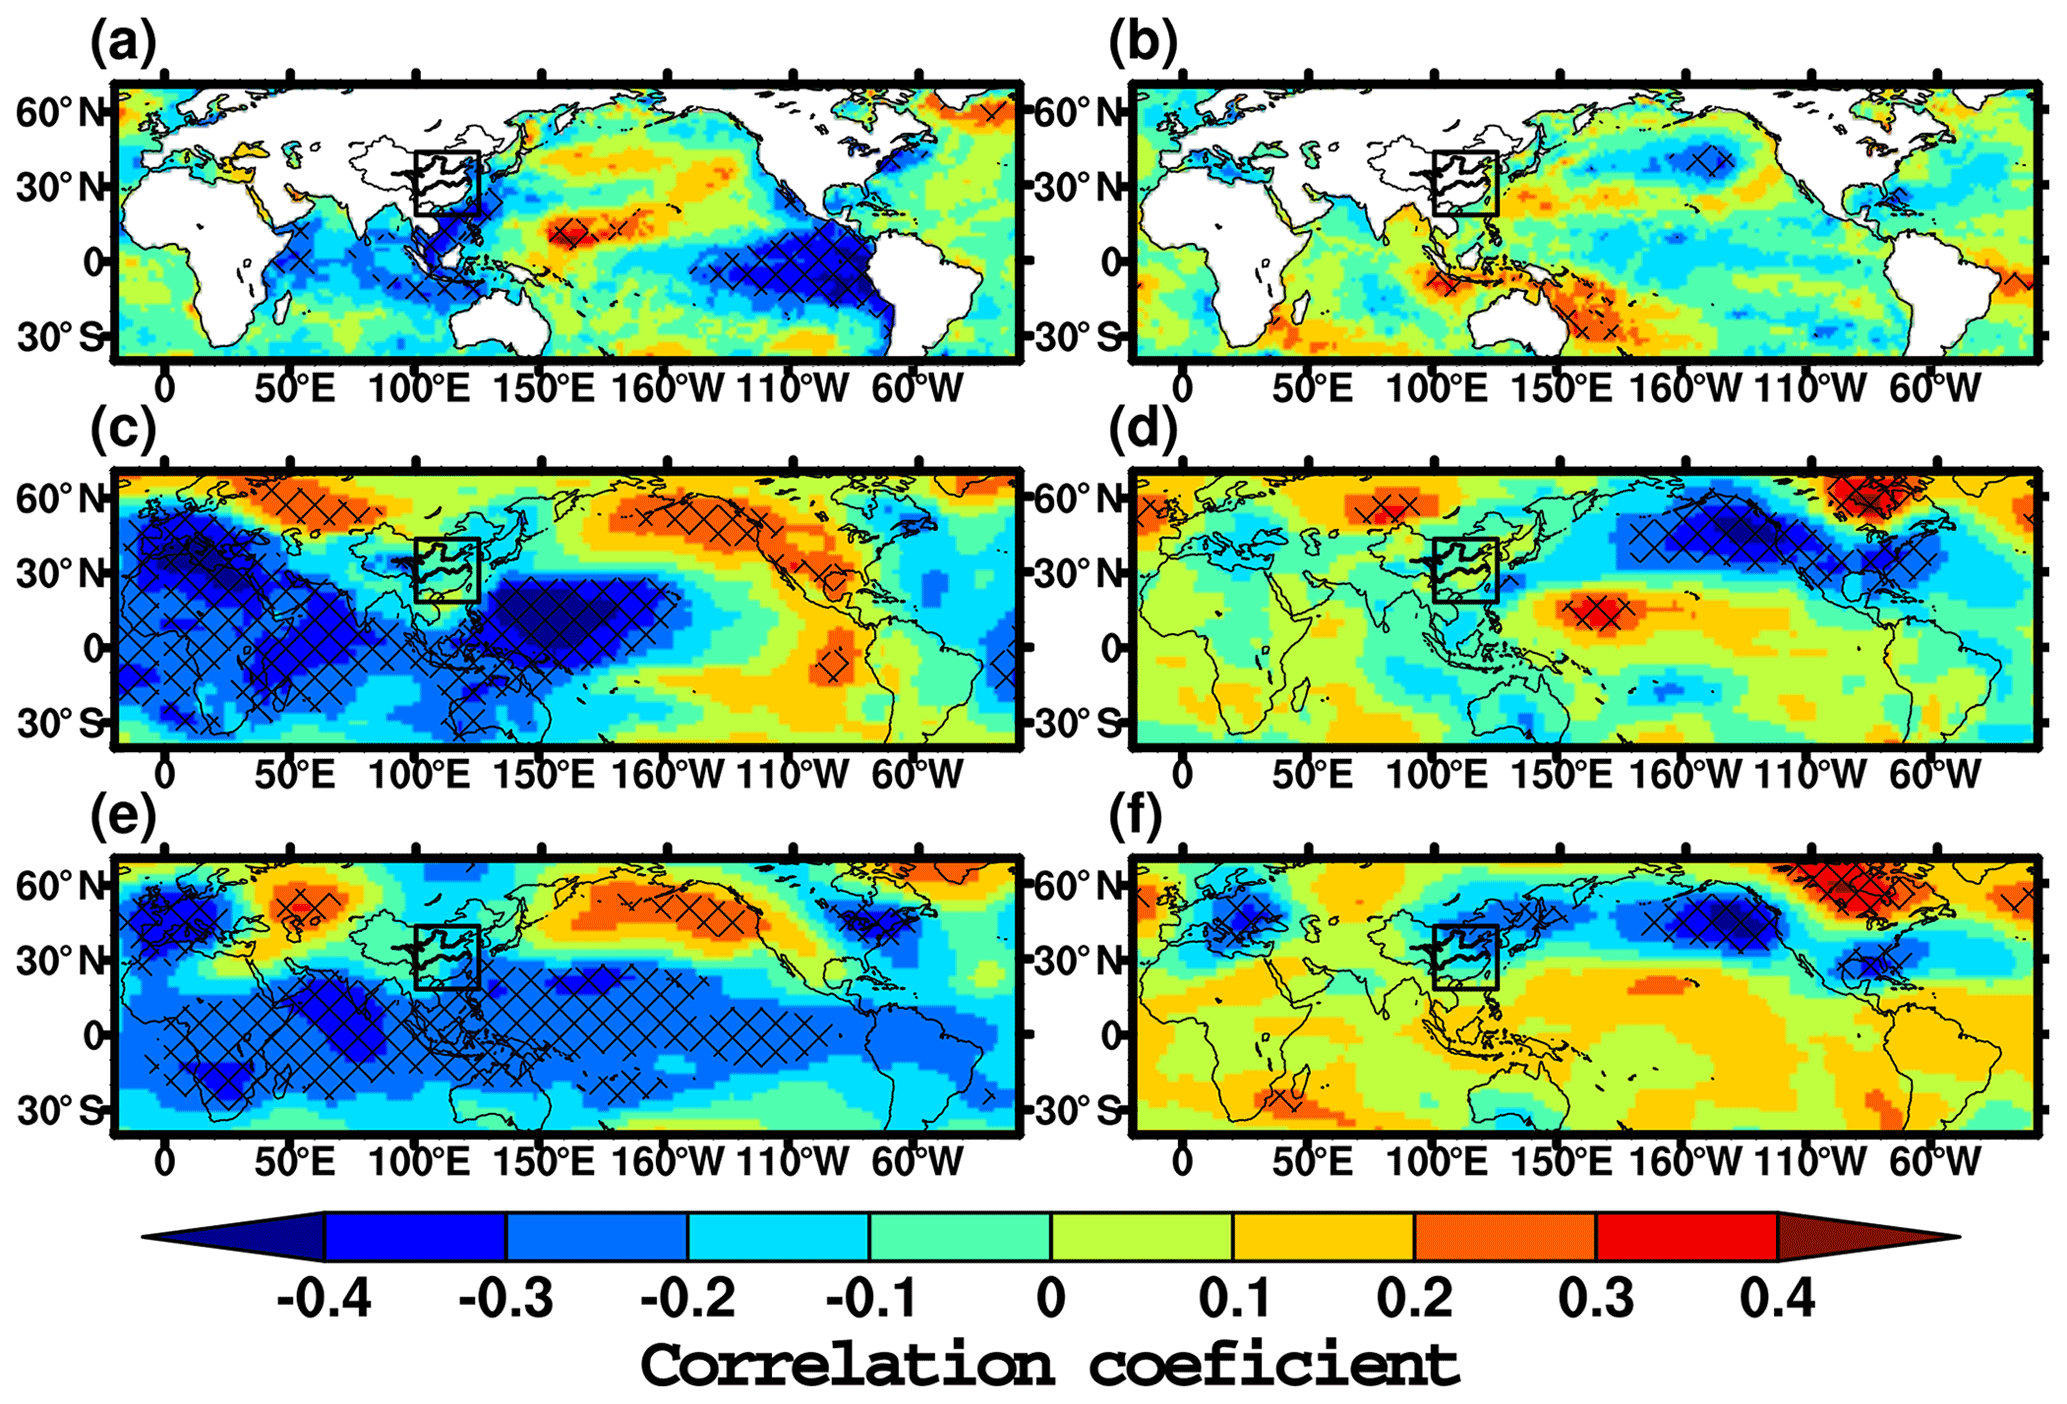
Figure 5Correlation coefficients in the dry season. (a) Sea surface temperature and PC1, (b) mean sea level pressure with PC1, (c) geopotential height at 500 hPa and PC1, (d) sea surface temperature and PC2, (e) mean sea level pressure with PC2 and (f) geopotential height at 500 hPa with PC2. Hatching denotes the regions with statistical significance at the 95 % confidence level. The black rectangle denotes eastern China.
The correlation of SSTs with PC2 is reminiscent of the El Niño pattern. Even though it is not evident (Fig. 5d), an indication suggests that an El Niño episode yields a dipole pattern of the rainfall over southern China during the dry season. The correlations with SLP exhibiting positive coefficients are mainly distributed in the North Pacific and Siberia, while the negative coefficients are principally situated over the equatorial Pacific and Indian Oceans (Fig. 5e). The correlation coefficient between PC2 and 500 hPa is relatively smaller and barely remarkable (Fig. 5f). This implies that the larger portion of the variability induced by climate variables occurs in the first mode.
Composited analyses of anomalous water vapor fluxes and divergence based on the highest 75th and lightest 25th percentile rainfall values, respectively, during the dry season are shown in Fig. 6. Considering the 25th percentile conditions, an anomalous anticyclone appears over the WNP, while one branch of anomalous moisture fluxes to the southern flank is transported eastward to the eastern Pacific. Meanwhile, another branch is transported westward to the Indian Ocean (Fig. 6a). As a result, the divergence occurs over eastern China, which is not suitable for the formation of precipitation events. The adverse phenomena are found for the 75th percentile events (Fig. 6b). The westward transportation of anomalous water vapor fluxes is prominent over the equatorial pacific, converging with the eastward transportation of moisture flux anomalies from the Indian Ocean over the SCS. Then the converged moisture fluxes are transported northward, forming an anomalous cyclone over the WNP. The anomalous water vapor fluxes over northern and western flanks of the WNP are transported into eastern China, and anomalous terrestrial water vapor fluxes from Eurasia are also transported into the study domain. Those patterns provide a favorable environmental background and sufficient moisture supply for the formation of the convergence, which is conducive to the occurrence of heavy rainfall events.
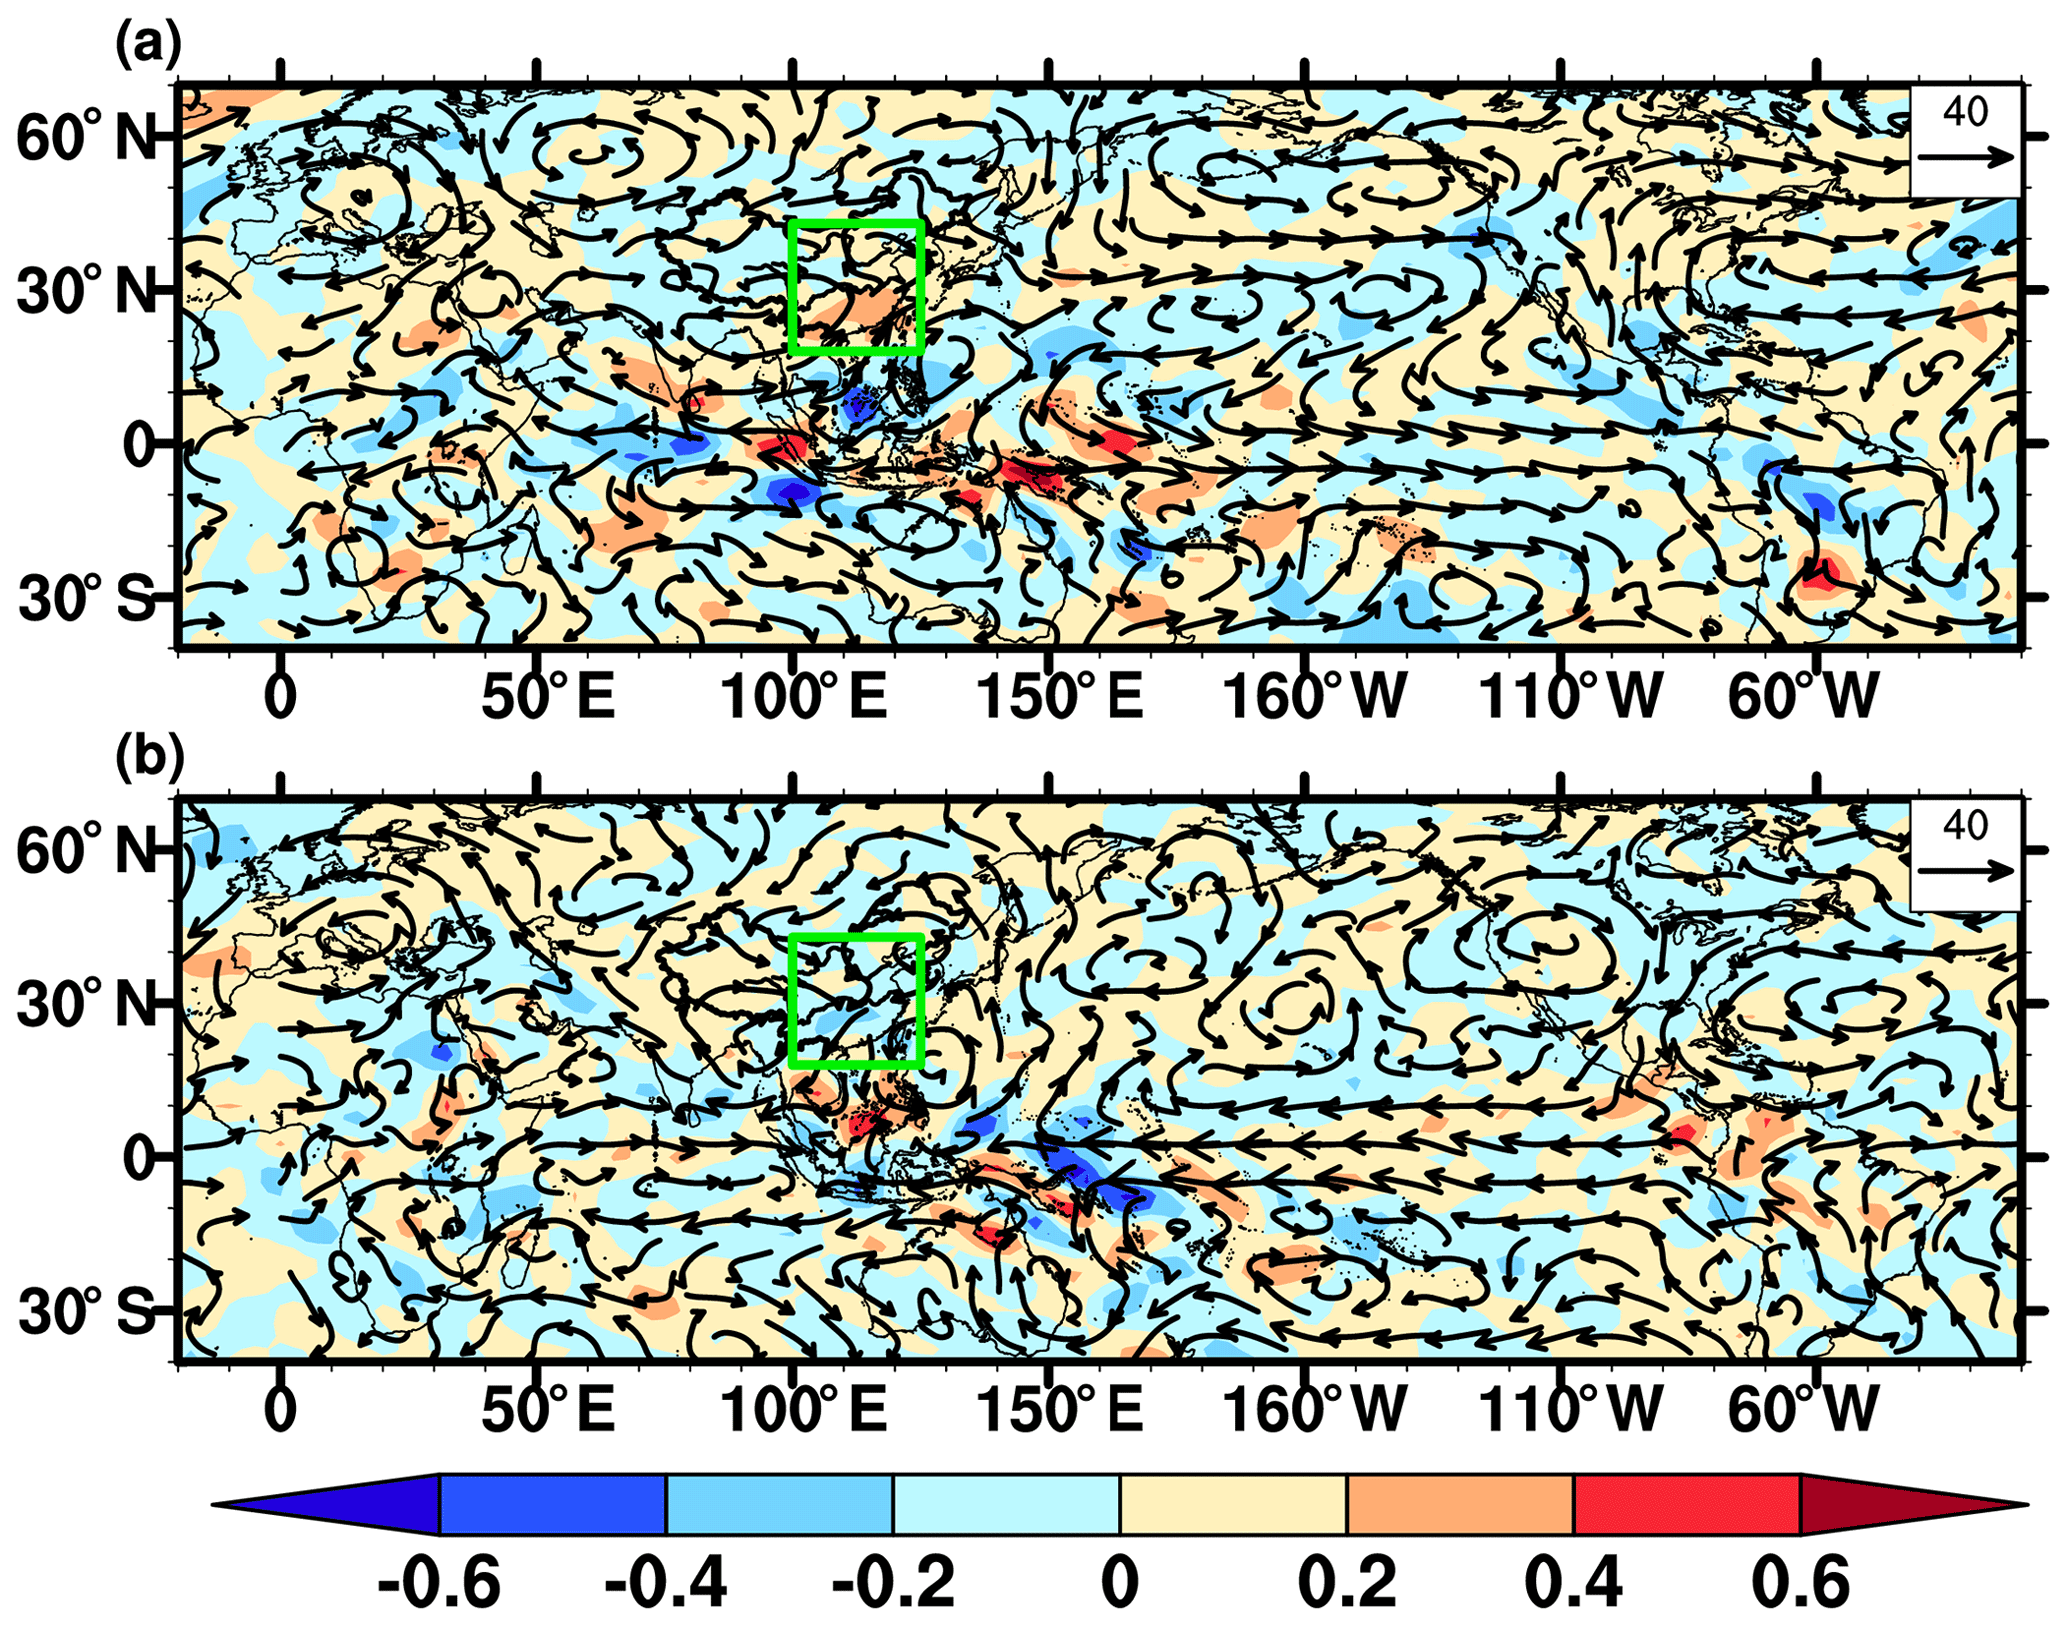
Figure 6Vertically integrated water vapor anomalies (vector) and water vapor flux divergence (shading) composited from the lightest 25th (a) and highest 75th (b) percentile rainfall events in the dry season. The water vapor flux unit is kg m−1 s−1 and for the water vapor flux divergence is kg m−2 s−1. The green rectangle denotes eastern China.
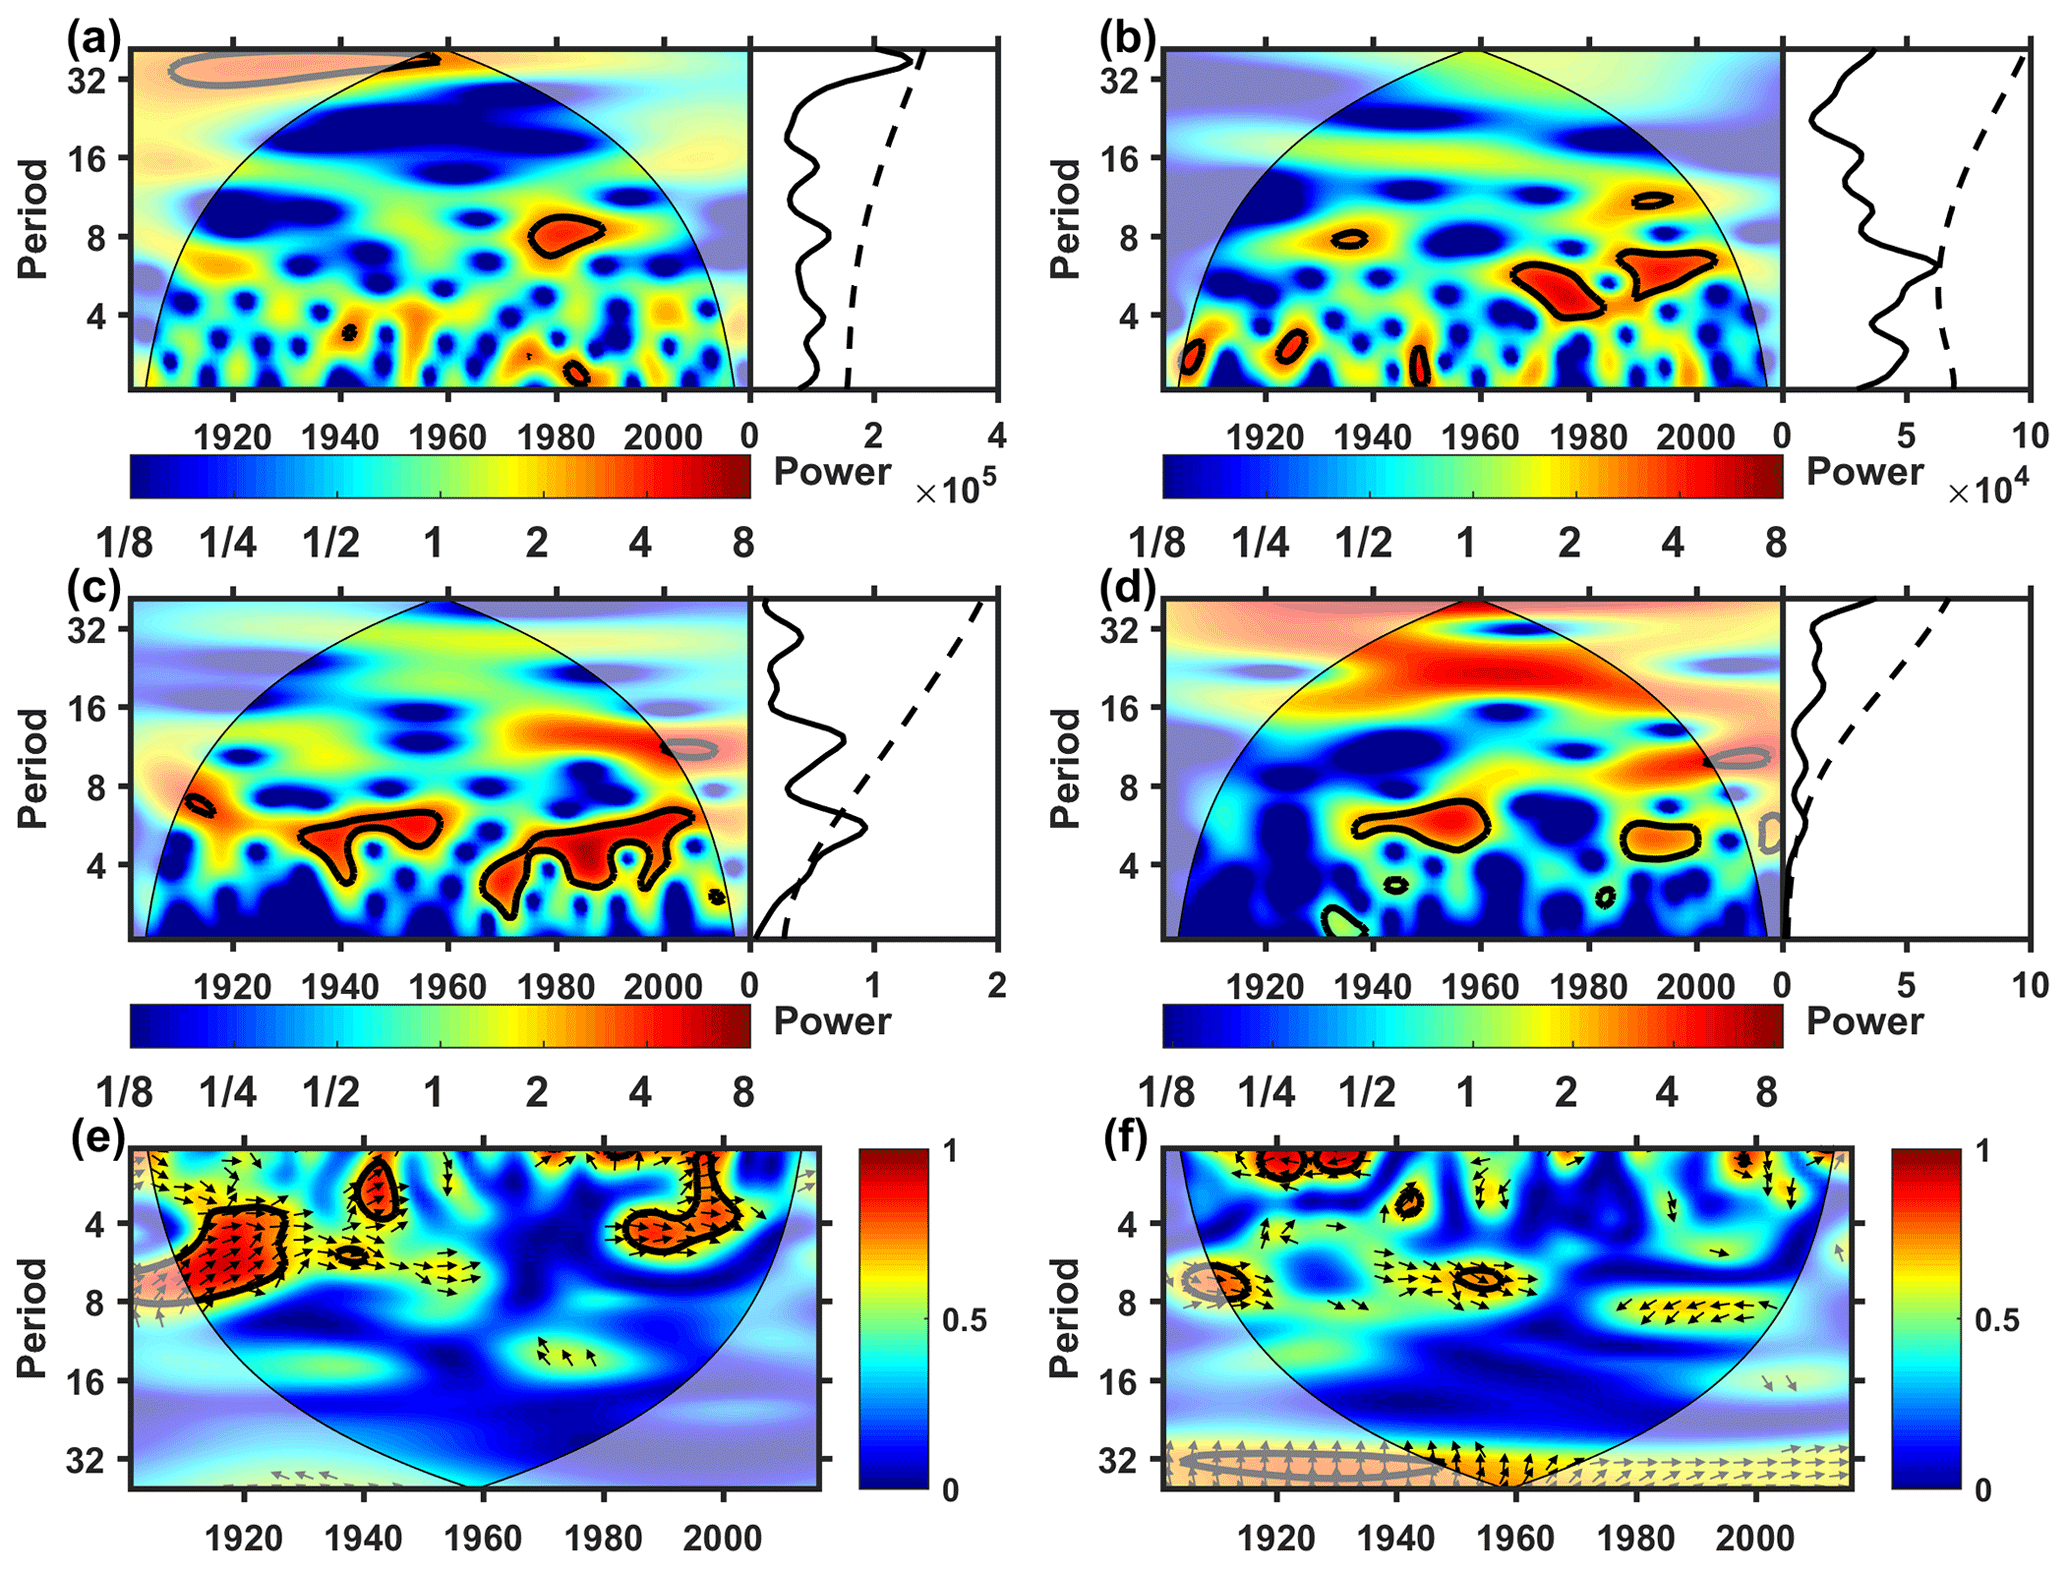
Figure 7Wavelet spectra for the dry season. (a) PC1, (b) PC2, (c) Niño3.4 index, (d) PDO index, (e) wavelet spectral coherence of PC1 and Niño3.4 and (f) wavelet spectral coherence of PC2 and PDO. The global spectra are shown on the right side of the time-varying wavelet spectra and the black lines denote the statistical significance at the 95 % confidence level.
The wavelet coherence is performed on the PCs with large-scale ocean–atmosphere circulation patterns to investigate the temporal variability of leading modes of rainfall (Fig. 7). The local and global spectrums of PC1 indicate spectral peaks in the 1- to 4-year band and 6- to 10-year band, which seems to be active in recent decades (Fig. 7a). For PC2, the 1- to 4-year band is active before the middle part of the 20th century, while the 5- to 7-year band is concentrated in recent decades (Fig. 7b). The ENSO index (Niño3.4) exhibits a significant peak of a 2- to 7-year period and a relatively weaker peak of an 8- to 16-year period (Fig. 7c). Figure 7e displays that the ENSO has a positive association with rainfall from 1900 to 1930, with a 4- to 8-year signal. There is also a positive relationship from 1980 to 2010, with a 1- to 6-year signal. These suggest that the ENSO has a statistically positive impact on precipitation over eastern China in the dry season. Wavelet filtering of PC1 in the 4- to 8-year period with the ENSO being coherent (Fig. 7c) is also made and illustrated in Fig. 3 as the solid line. The PDO has a statistically positive connection with rainfall from 1940 to 1970, with a 7- to 8-year signal. While a negative association is seen from 1980 to 2000, with an 8- to 9-year signal (Fig. 7f). Particularly, the PDO is closely correlated with precipitation over eastern China.
3.3 Wet season
The total variance captured by the first two PCs is about 30 %, with PC1 and PC2 explaining 16.06 % and 13.93 %, respectively, during the wet season. These are smaller than the total variances explained by the two leading PCs of rainfall during the dry season. The spatial mean precipitation is also captured by the first PC (Fig. 8), which is flipped for easy comparison with the spatial pattern. The solid line indicates the decadal smoothing average of the first PC and will be discussed later. The low frequency of temporal variability is seen in Fig. 8. The spatial components and corresponding PCs of first two eigenvectors are shown in Fig. 9. A north–south dipole pattern is found for the first eigenvector, with strong negative values located over southern China (Fig. 9a), which has a close correlation with the variability of spatial mean precipitation (Fig. 8). This rainfall pattern is also associated with the location and propagation of the EASM (Jin et al., 2016). In a wet season, the northward advance of the EASM circulations is followed by three major rainy seasons sequentially: from May to mid-June, the early summer rainy season presents in southern China; then the mei-yu season occurs over the Yangtze–Huai river basins; then the late summer rainy season ultimately forms over northern China (Ding and Chan, 2005). Correspondingly, multiple synoptic and climatological systems contribute to the occurrence of these rainfall events (Gao et al., 2016; Luo et al., 2016). The second eigenvector exhibits the magnitudes of the coherent signs in eastern China, with the peaks over the mid-lower reaches of the YRB (Fig. 9b). Moreover, the first two PCs display considerable temporal changes (Fig. 9c, d) that are described in the discussion of spectral analysis.
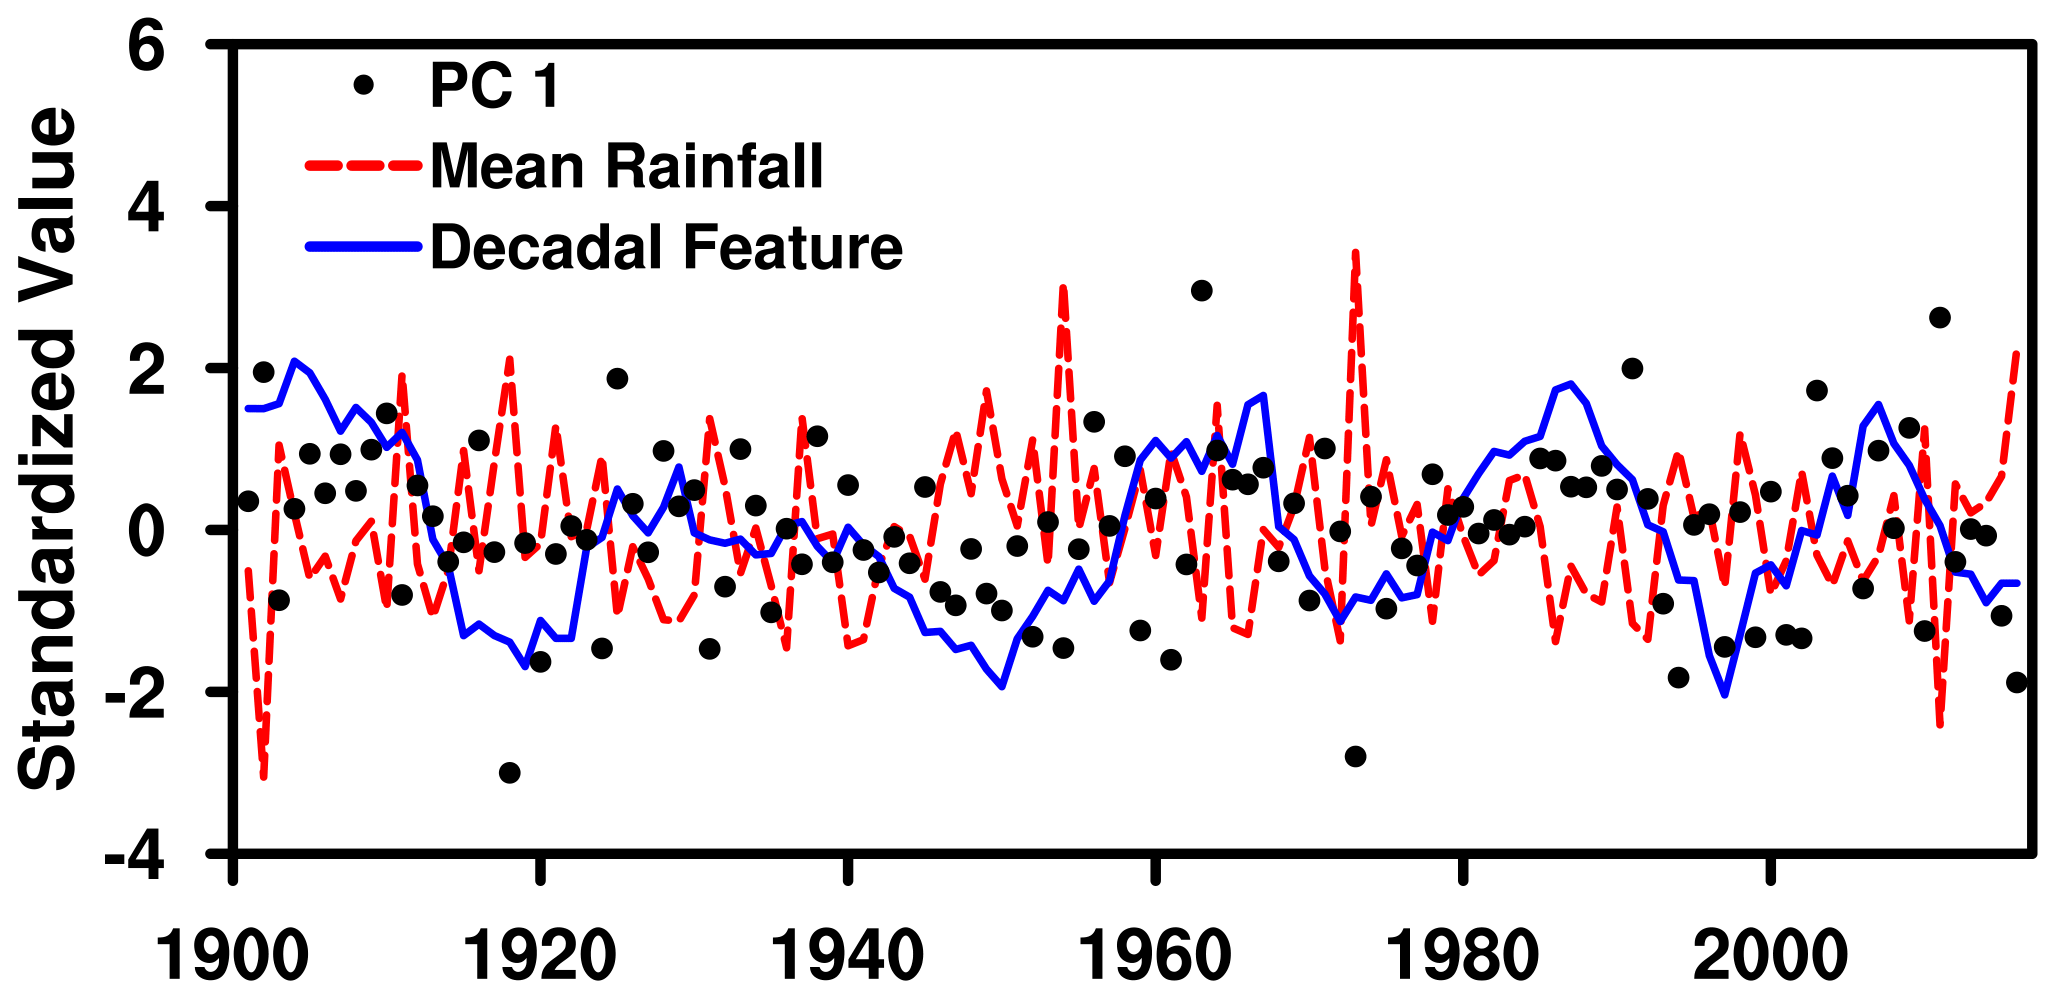
Figure 8Standardized time series of all wet season precipitation over eastern China as shown by the red dashed line. The black dots denote flipped PC1 and the blue lines denote the decadal features of wet season precipitation.
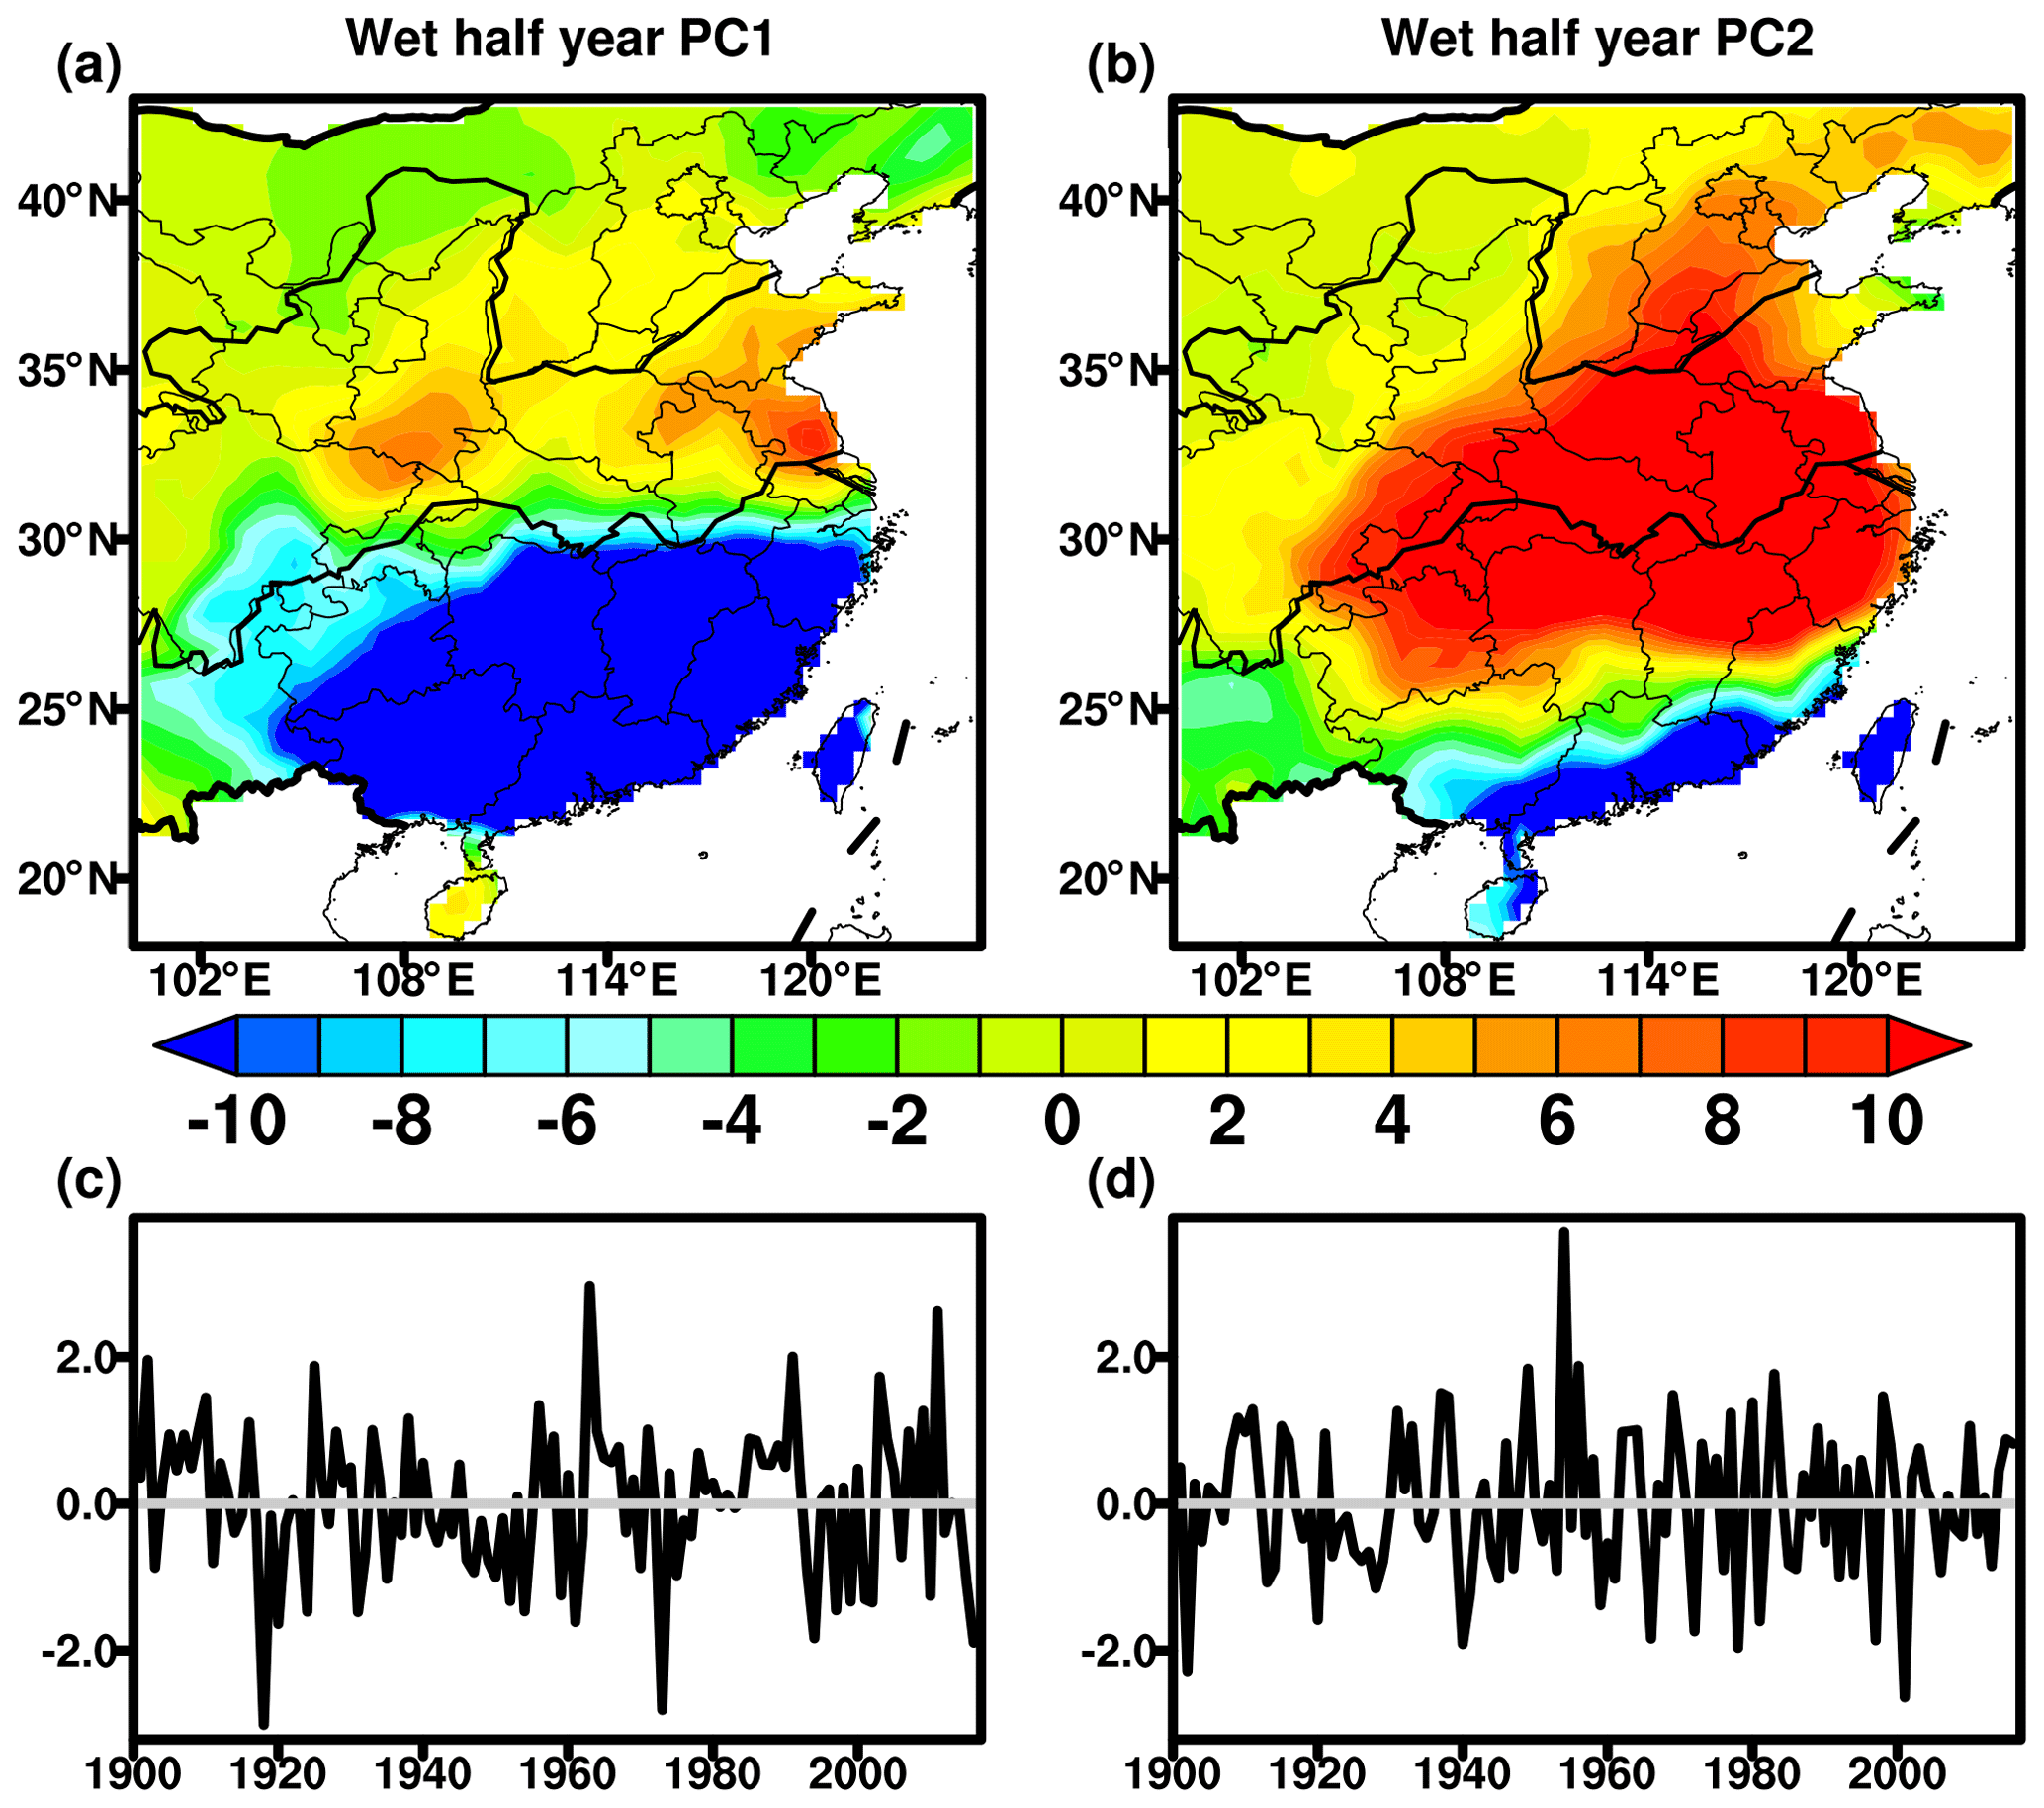
Figure 9The first (a) and second (b) EOFs for the rainfall in the wet season. The first (c) and second(d) principal components (PCs) correspond to these EOFs from the rainfall in the wet season. Both time series are normalized with respect to the corresponding standard deviations.
The correlation map of PC1 with SSTs shows the strong positive coefficients over the North Pacific and western tropical Pacific (Fig. 10a), while some statistically negative correlations are distributed over the WNP. The positive correlations with SLP exhibiting statistical significance are seen over the eastern Pacific and the negative values are found over the WNP and oceans to eastern Australia (Fig. 10b). This is roughly an opposite correlation pattern of SLP compared to the dry season (Figs. 5b and 10b). For 500 hPa, the positive correlations are mainly located over the WNP, with positive values principally situated over the equatorial western Pacific, which are weaker in comparison with the correlations in the dry season. The correlation between SSTs and PC2 exhibits evident spatial features (Fig. 10d). Statistically significant negative coefficients are principally discovered over the eastern Pacific, reminiscent of the La Niña episode. This is suggestive of the La Niña telecommunication mechanisms responsible for the rainfall over eastern China during the wet season. Note that statistically significant positive coefficients are mainly distributed over the northern Indian Ocean, resembling the Indian Ocean basin mode. In response to the basin-wide warming of the Indian Ocean, the strengthened convective heating in the tropical Indian Ocean will drive the Kelvin-wave-like eastern anomalies to the east. Then, the anticyclonic shear of the Kelvin-wave-like easterlies may drive the boundary layer divergence over the WNP by Ekman pumping and therefore suppress convection there. These suppressed convections simulate an anomalous anticyclone to the west. Ultimately, the anomalous anticyclone in the tropical WNP intensifies rainfall in eastern China (Li et al., 2017; Cao et al., 2020). The correlation of PC2 with SLP is much weaker compared to that of PC1, with significant negative coefficients located over the far WNP (Fig. 10e). There also exists a weaker correlation with 500 hPa in comparison with PC1 and negative values mainly situate over the WNP (Fig. 10f).
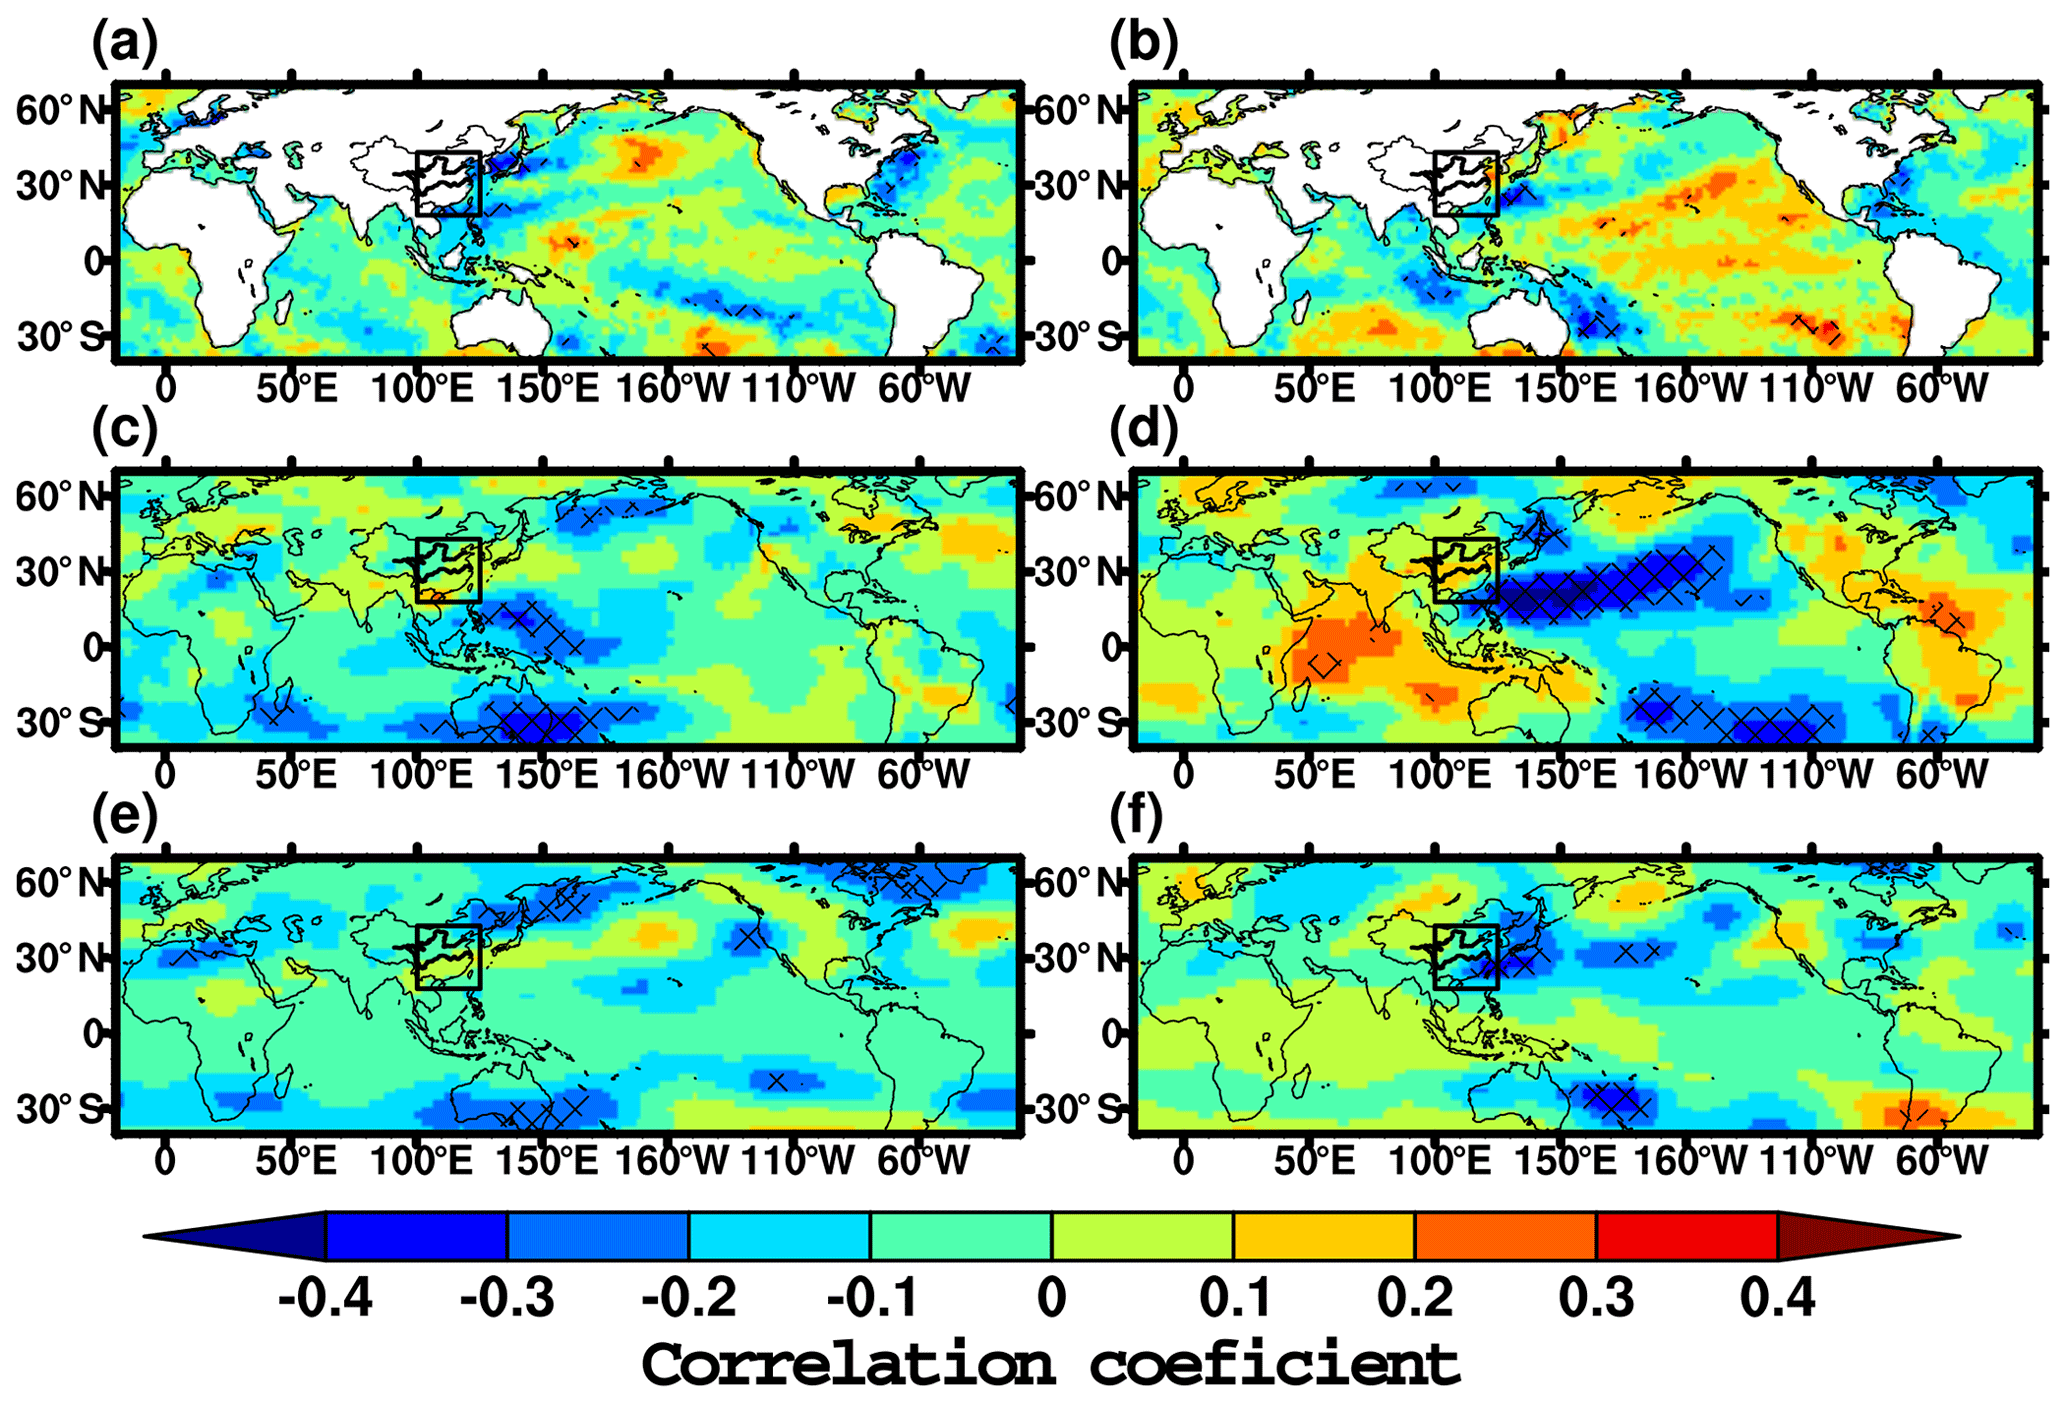
Figure 10Correlation coefficients in the wet season. (a) Sea surface temperature and PC1, (b) mean sea level pressure with PC1, (c) geopotential height at 500 hPa and PC1, (c) sea surface temperature and PC2, (e) mean sea level pressure with PC2 and (f) geopotential height at 500 hPa with PC2. Hatching denotes the regions with statistical significance at the 95 % confidence level. The black rectangle denotes eastern China.
Composited maps of moisture fluxes and divergence in high and light precipitation years during the wet season are illustrated in Fig. 11. Unlike the anomalous changes in the dry season (Fig. 6), the anomalous westward transportation of water vapor fluxes is found over the equatorial Pacific for the 25th percentile precipitation events, while the water vapor anomalies that are transported from the Indian Ocean into eastern China are not apparent (Fig. 11a). However, anomalous moisture fluxes are transported northeastward passing eastern China and therefore fail to from convergence there, which is not conducive to the occurrence of rainfall events. Figure 11a shows that eastern China is principally dominated by divergence during light rainfall years. For the 75th percentile precipitation events, an anomalous cyclone appears over the WNP even though it is relatively weak. The water vapor anomalies originating from the WNP converge with those from Eurasia over eastern China (Fig. 11b). Most of eastern China is dominated by convergence, providing conducive environmental backgrounds of the occurrence of heavy rainfall events. In addition, anticyclones and cyclones are seen over the Indian Ocean during low and high rainfall years, respectively, which is generally consistent with the Indian Ocean capacitor effects on the Indo–western Pacific climate in summer (Xie et al., 2009).
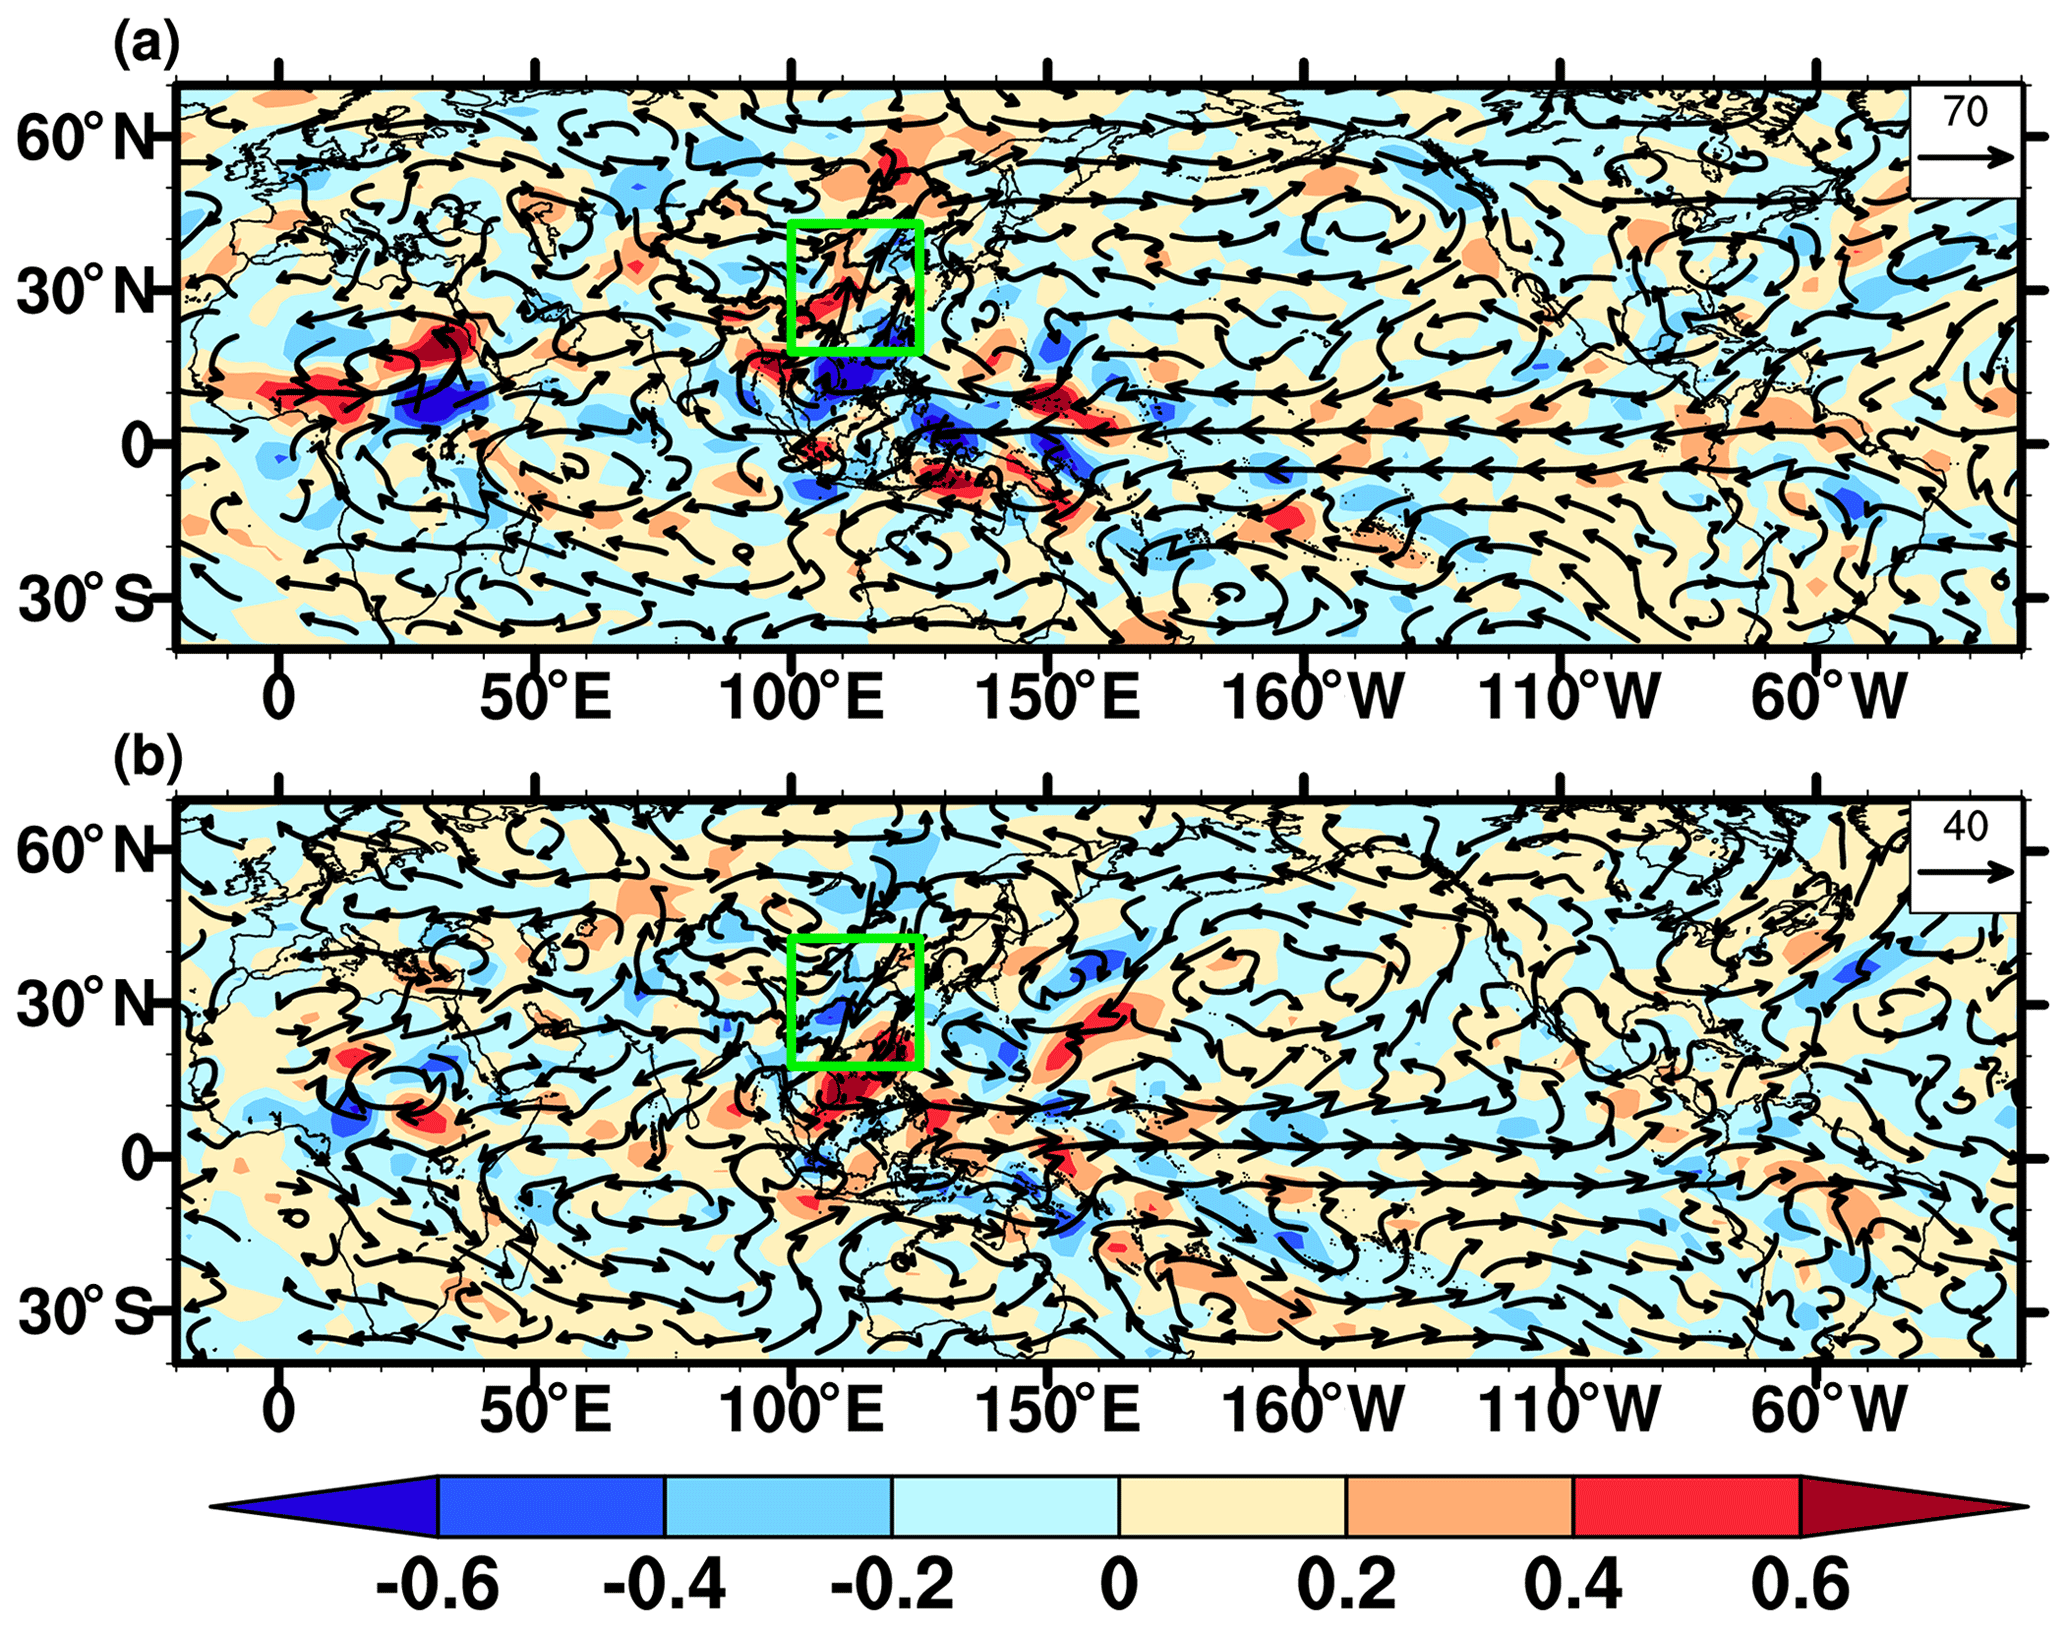
Figure 11Vertically integrated water vapor anomalies (vector) and water vapor flux divergence (shading) composited from the lightest 25th (a) and highest 75th (b) percentile rainfall events in the wet season. The water vapor flux unit is kg m−1 s−1 and for the water vapor flux divergence is kg m−2 s−1. The black rectangle denotes eastern China.
The local and global spectrum of PC1 suggests the spectral peaks in the 1- to 5-year and 6- to 10-year bands, as well as the 16- to 32-year band. These periods are likely more active in recent decades (Fig. 12a). On the other hand, PC2 shows 2- to 5-year and 5- to 8-year bands, as well as a 16- to 24-year band. The first period seems to be active in recent decades and the second and third periods are active from 1920 to 1980 (Fig. 12b). The ENSO index exhibits remarkable peaks of the 3- to 7-year period, which is active after the 1950s (Fig. 12c). ENSO events have a statistically negative relationship with rainfall over eastern China in the wet seasons, with a 4- to 8-year signal, while other signals are not evident enough, although they occur intermittently during the entire 20th century (Fig. 12e). This suggests that the modulation of the ENSO on the wet season precipitation is mainly concentrated at the interannual scale, consistent with those in the dry season. This also coincides with the interannual band of the wavelet filtering of PC1 (Fig. 8). Figure 12f shows that PDO events have statistically significant positive associations with wet season rainfall from 1920 to 1940, with a 9- to 15-year signal. The significant negative connection with rainfall exhibits a 4- to 7-year signal from 1930 to 1950. It can be seen from Figs. 7f and 12f that PDO events have a stronger influence on rainfall in the wet season than in the dry season.
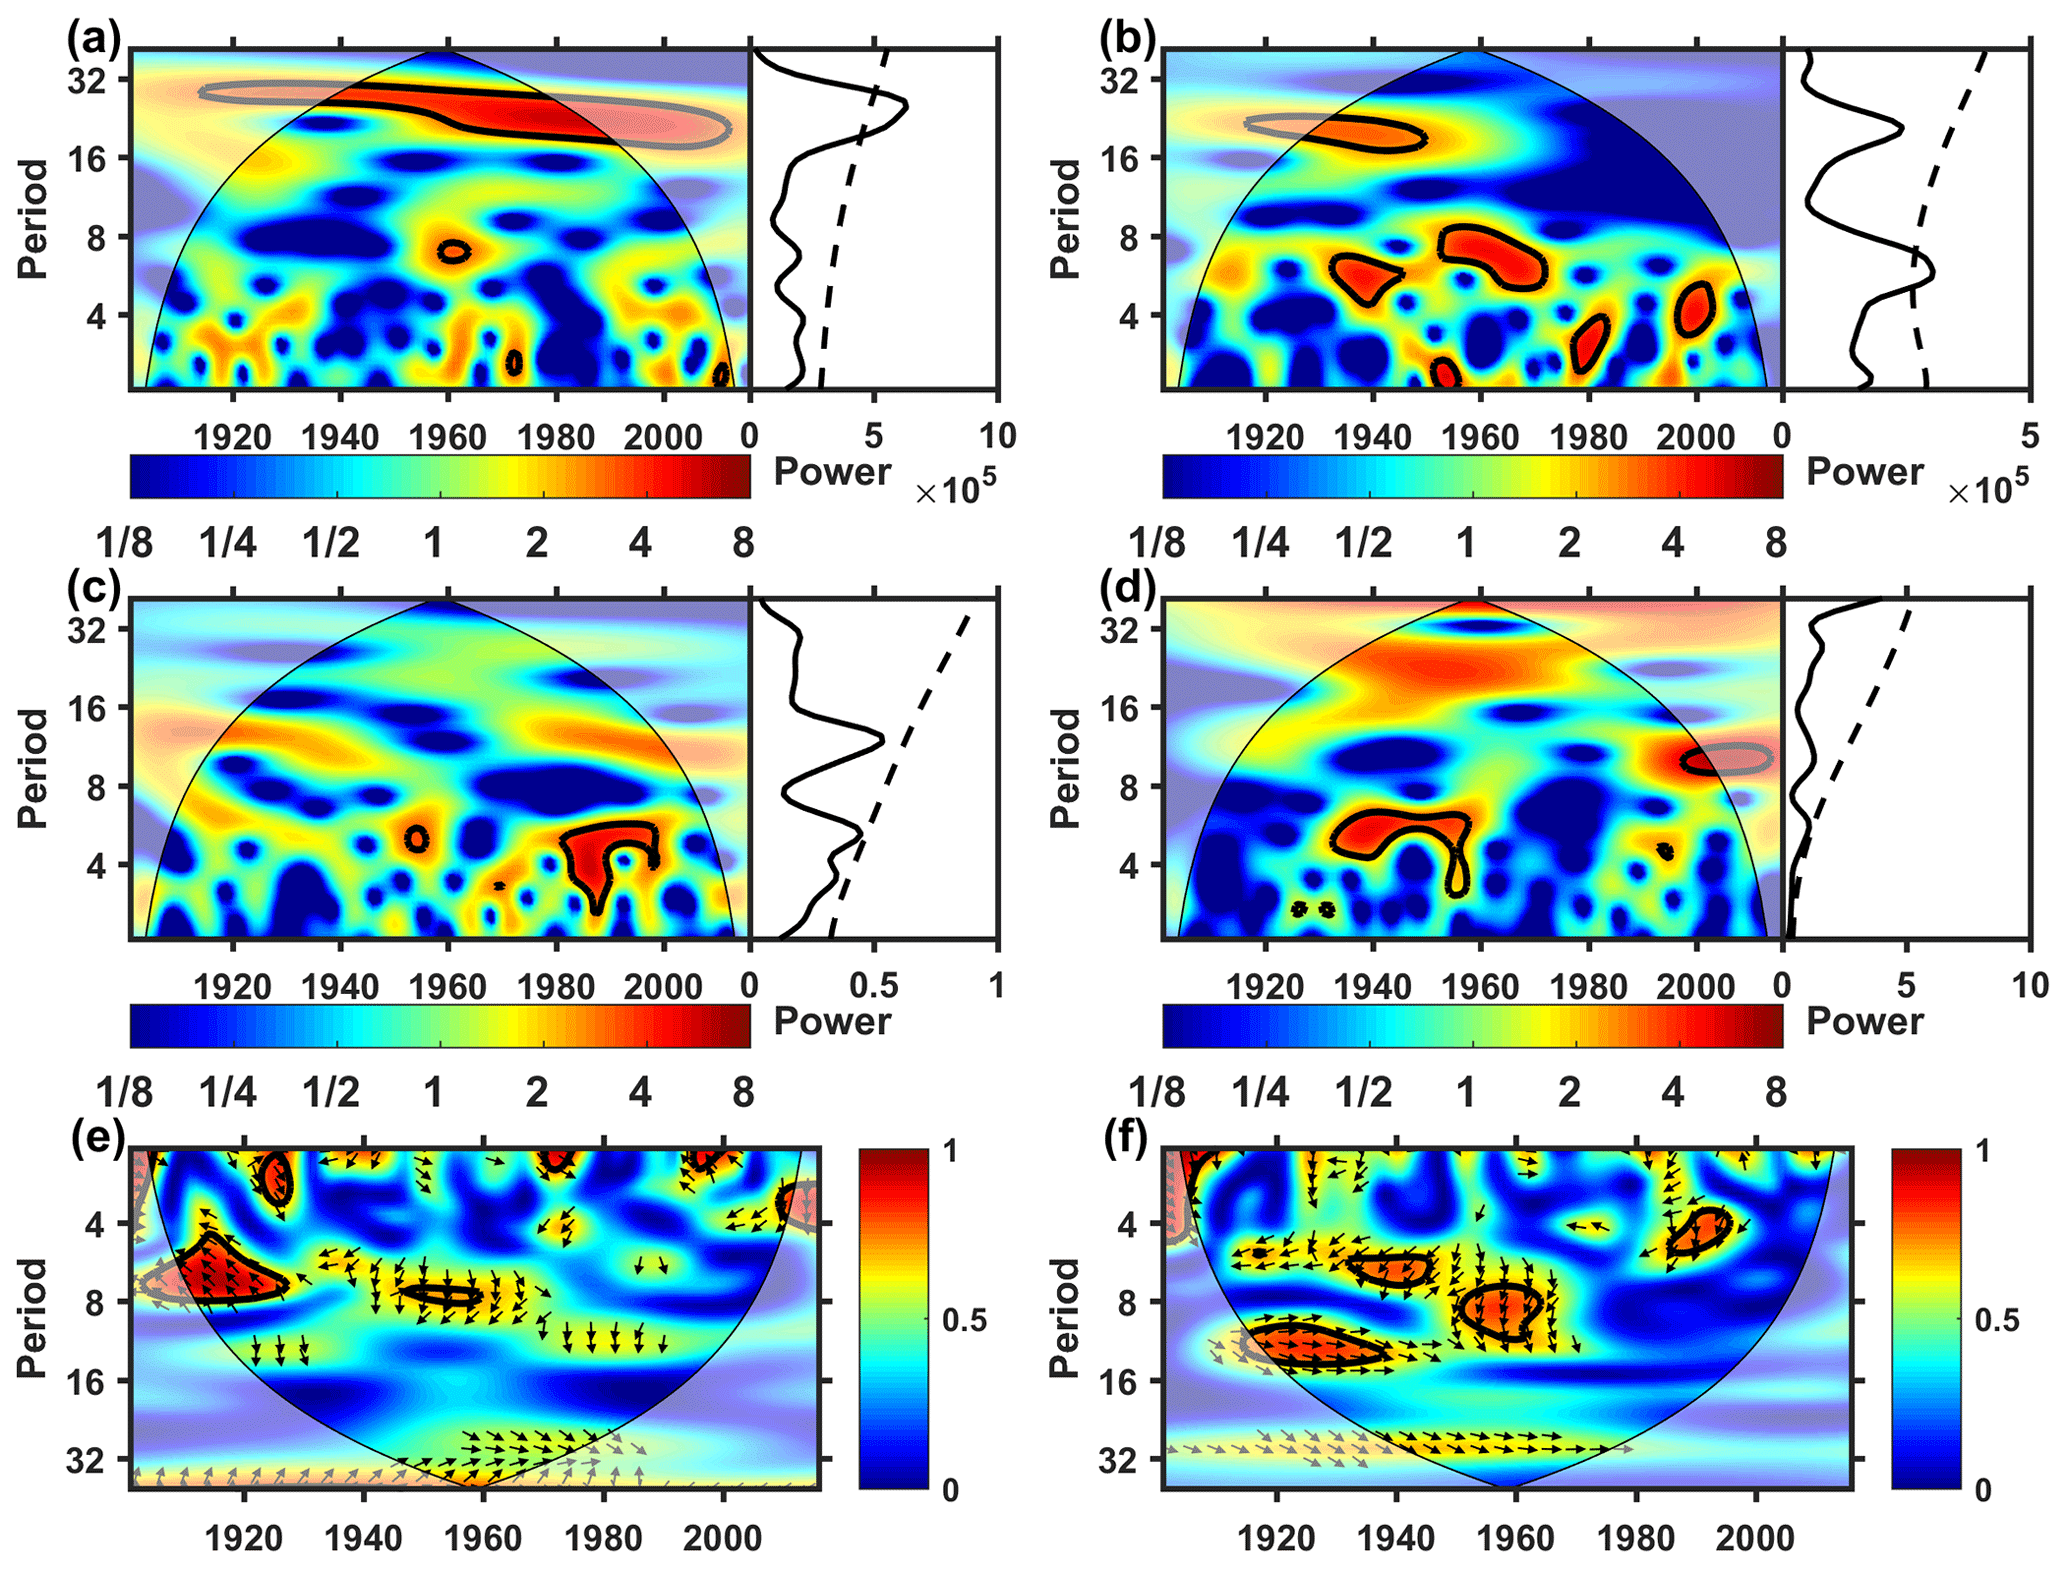
Figure 12Wavelet spectra for the wet season. (a) PC1, (b) PC2, (c) Niño3.4 index, (d) PDO index, (e) wavelet spectral coherence of PC1 and Niño3.4 and (f) wavelet spectral coherence of PC2 and PDO. The global spectra are shown on the right side of the time-varying wavelet spectra and the black lines denote the statistical significance at the 95 % confidence level.
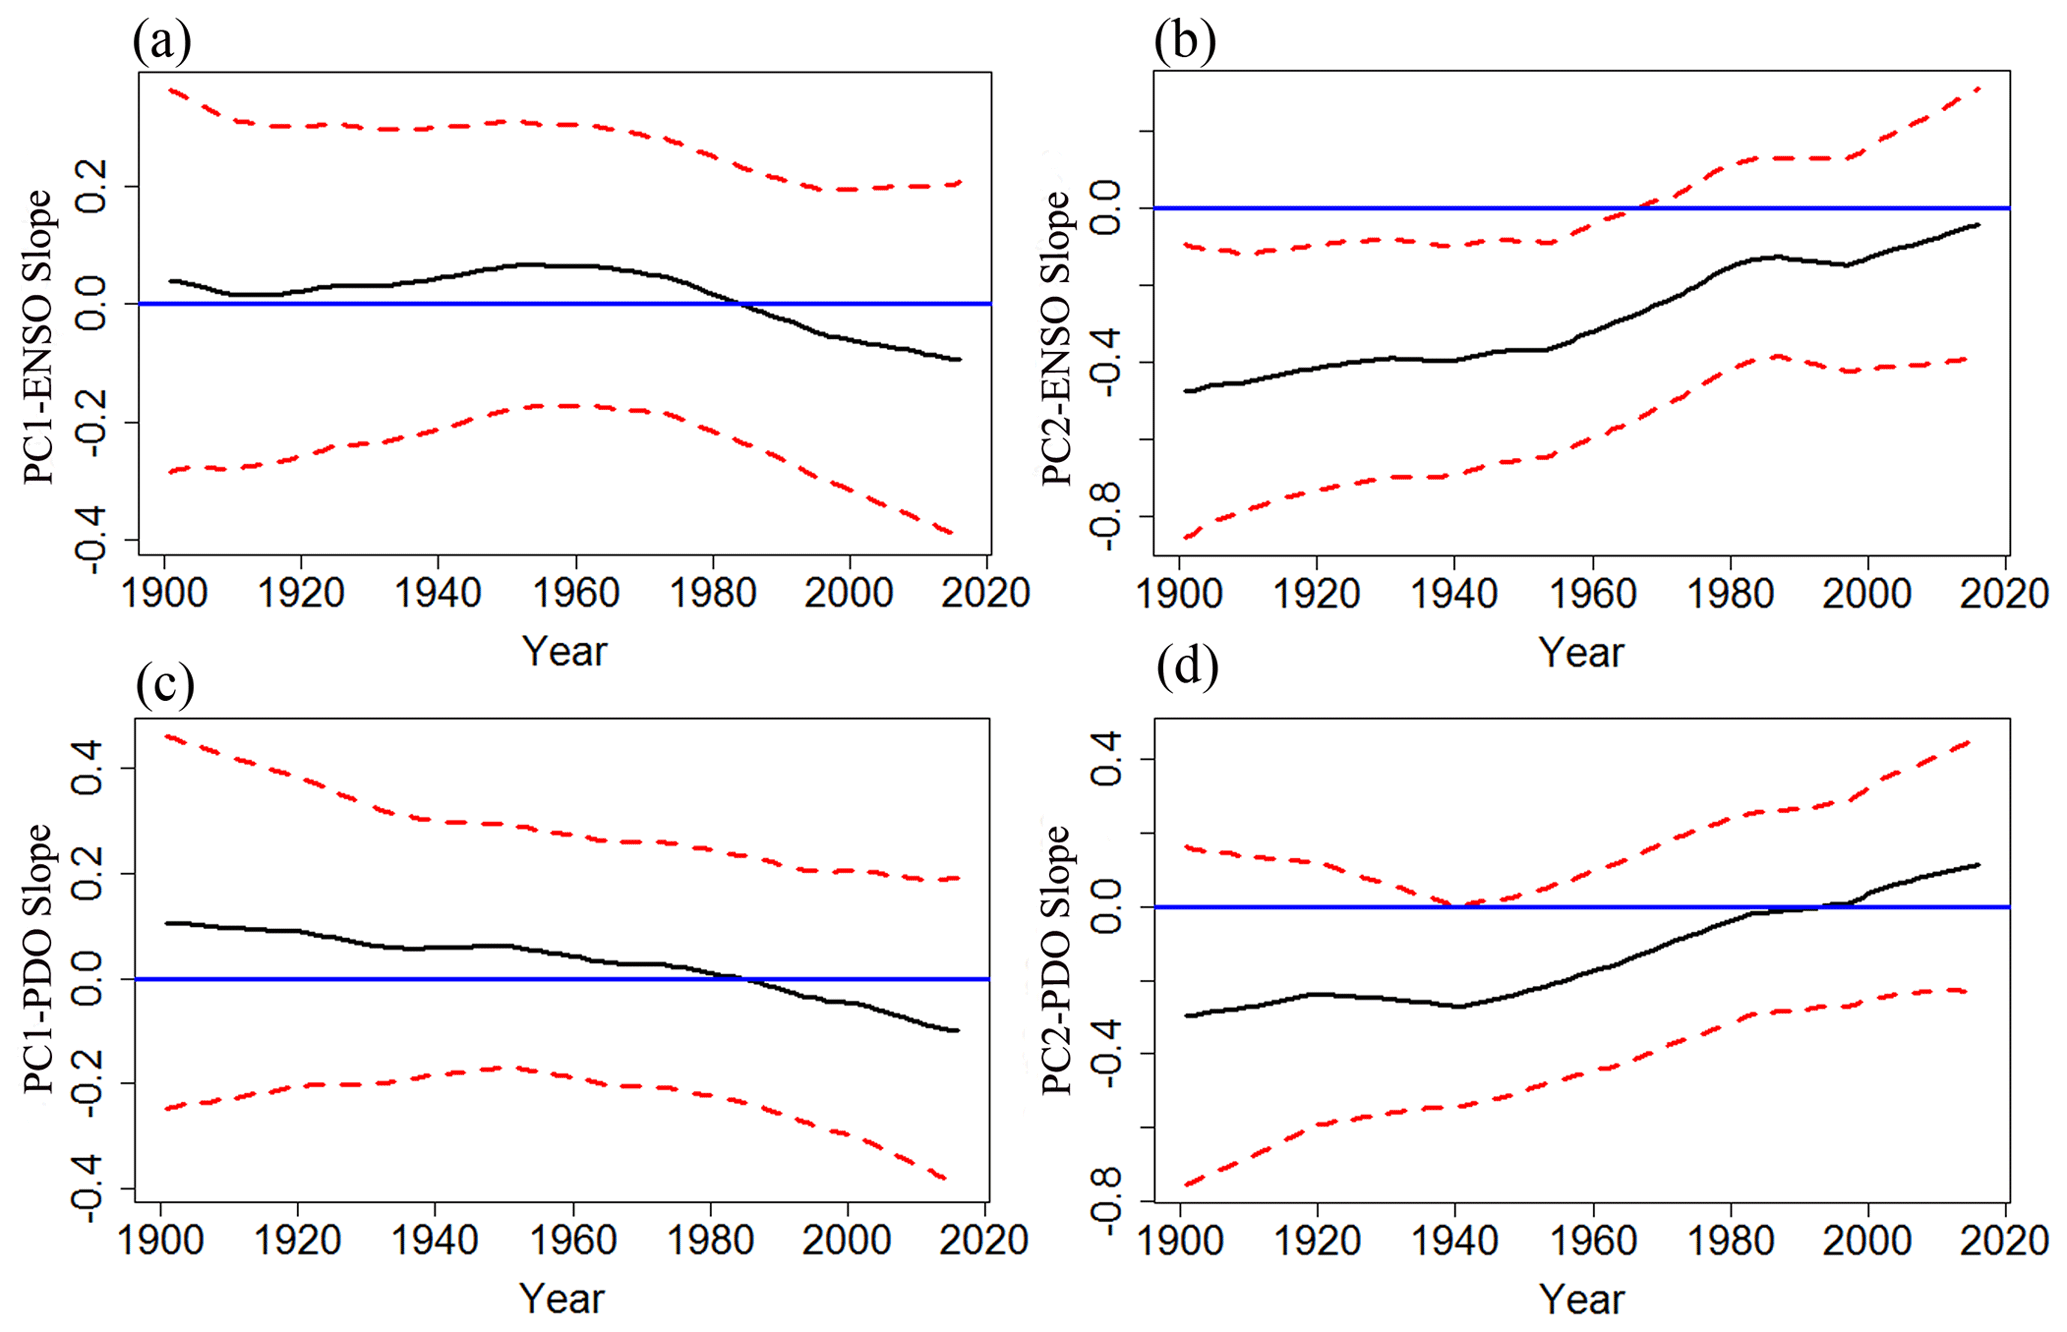
Figure 13Changes in the relationships between rainfall and the ENSO/PDO over time from 1901–2015. Black solid lines denote the estimated time-varying slopes, along with the 25th and 75th percentile credible interval lines (red dotted lines) from the Bayesian dynamic linear model analysis.
The changing connections between leading modes of precipitation and large-scale modes of climate variability with time are assessed by BDLM (Fig. 13). We display the results that have discernable changes along with time and ignore the results without discernable variations. The intercept from BDLM of PC1 and the ENSO exhibits a slight increase from 1920 to 1960, then turns into a decrease condition and experiences zero value around the 1980s (Fig. 13a), suggesting that the ENSO triggers a negative (positive) impact before (after) the 1980s and that the influences of the ENSO strengthen in recent decades. The intercept of PC2 and ENSO shows negative values and is gradually decreasing with time, which indicates that the impacts of the ENSO on PC2 are weakening during the entire century (Fig. 13b). Considering the effects of the PDO, the positive connection between the PDO and PC1 exhibits a decrease until the 1980s, then the impacts of the PDO on rainfall over eastern China strengthen in recent decades (Fig. 13c). However, almost the opposite phenomenon is found for the connection between PC2 and PDO (Fig. 13d). The negative intercept gets close to zero before the 1980s, implying that the impact of the PDO on PC1 is decreasing during this period. Then the positive connection of PC2 and PDO become strengthened after the 2000s, suggesting that the effect of the PDO on PC2 is enhanced after this period. These results have important applications on the predictability of the rainfall events over eastern China based on the ENSO and PDO (Gao et al., 2017), since the ENSO and PDO has impacted the predictability of early summer monsoon precipitation in south China with the changes in connections between climate variability modes and rainfall (Chan and Zhou, 2005).
Space–time variability of rainfall during the dry and wet seasons over eastern China is examined by utilizing PCA, wavelet coherence and BDLM based on the CRU gridded and observed rainfall datasets. In the overlapping period of 1960–2015, these two rainfall datasets are consistent in their temporal and spatial patterns during the wet and dry seasons over eastern China, while the CRU gridded data have a much longer period (1901–2016) and is more suitable to examine the interdecadal variability of rainfall.
The PCs exhibit notable temporal changes at the interannual and interdecadal scales. In the dry seasons, the first and second eigenvectors account for 34.2 % and 13.4 % of the variance and they exhibit coherent and dipole patterns of rainfall over southeastern and southern China, respectively, which are generally coincident with the shifts of the ENSO phases. Particularly, the strengthened rainfall over southeastern China is associated with the La Niña episodes and the dipole pattern of precipitation in southern China occurs during El Niño years. Moreover, the variations in rainfall over eastern China during the dry season are also affected by the intensity of the EAWM and the patterns of SLP. In the wet seasons, the first and second eigenvectors show the dipole and coherence of rainfall patterns, respectively, which are approximately contrary to that in the dry season. The two leading PCs account for 16.1 % and 13.9 % of the variance. The circulations responsible for the changes in rainfall over eastern China are also generally opposite to those during the dry season.
Composited analyses illustrate the southeastward and southwestward transportations of moisture flux anomalies from the southern portion of eastern China and there is no convergence over the study region for 25th percentile rainfall events during the dry season. In the years with the highest (75th percentile) rainfall events, the anomalous moisture fluxes from the equatorial Pacific and Indian Ocean are transported into eastern China through the SCS, leading to the convergence with the anomalous water vapor fluxes from the WNP and Eurasia over eastern China, providing sufficient moisture supply and environmental backgrounds for the occurrence of precipitation events. In the wet seasons, the anomalous variations in moisture fluxes are different from the dry seasons. For low rainfall years, the water vapor anomalies that are transported from the equatorial Pacific pass through eastern China; this northeastward transportation of water vapor anomalies fails to form a convergence in the study region. Thus, most of eastern China is consequently dominated by the divergence. However, the opposite phenomena are found for the 75th percentile events; the water vapor anomalies from the WNP converge with the anomalous moisture fluxes from Eurasia and are transported southwestward into eastern China, resulting in heavy precipitation events. It is worth noting that the anticyclone and cyclone in the Indian Ocean also play an important role in the occurrence of rainfall events over eastern China in addition to the forcing factors originating from the Pacific Ocean (Xie et al., 2009; Li et al., 2017).
The ENSO has a statistically positive (negative) association with rainfall during the dry (wet) season in eastern China, with a 4- to 8-year signal. The impacts of the ENSO on rainfall are principally concentrated at the interannual scale in both the dry and wet seasons. The PDO has a statistically positive (negative) relationship with rainfall in both seasons, exhibiting a 7- to 8-year (8- to 9-year) signal in the dry season. The statistically significant positive (negative) associations between the PDO and precipitation over eastern China is seen with a 9- to 15-year (4- to 7-year) signal. In short, the effects of the PDO on rainfall show multiple timescales compared to those of the ENSO. Moreover, the PDO triggers a stronger impact on precipitation over eastern China in the wet season than the dry season. Previous studies have revealed that the PDO has a significant effect on the movement of the rain belt over eastern China during the rainy seasons, which influences the spatial distribution of rainfall events (i.e., southern flood and northern drought) (Li et al., 2010; Gao et al., 2017). Our findings further confirm the occurrence of those phenomena in eastern China at the interdecadal scale.
The analyses using BDLM suggest that there exists no significant time-varying relationship between large-scale modes of climate variability and rainfall over eastern China in the dry season. In the wet season, the intercept of the ENSO and PC2 gradually decreases with time, suggesting that the influences of the ENSO on PC2 are gradually weakening in the entire century. The effect of the PDO on PC1 decreases before the 1980s, then shifts into positive connection after the 2000s. The results advance the understanding of the time-varying linkage between climate variability modes and regional rainfall in China. In addition, using a century-scale rainfall dataset allows us to obtain insight into the long-term time-varying correlations with precipitation events over eastern China. The insights into the spatiotemporal variability of rainfall over eastern China at different timescales and quantifying the temporal variability of the strengths between climate variability modes (ENSO and PDO) and rainfall will be of great importance for developing a skillful precipitation forecasting model (Zhang et al., 2014). Moreover, BDLM provides a flexible regression method to incorporate the predictors with varying strengths. The model parameters are therefore estimated dynamically at each time, enabling us to capture the time-varying predictors. The results in this study can also be adopted to develop seasonal precipitation forecasting models. Particularly, the asymmetry of the rainfall over eastern China and the ENSO teleconnections in the dry and wet seasons indicate the different underlying causes during El Niño and La Niña episodes, which can potentially improve the forecasting skills, these phenomena are also true for different phases of PDO episodes. Human infrastructure over eastern China has suffered from severe floods and droughts; therefore, the skillful hydroclimate projections of space–time variability of rainfall will help policymakers develop effective mitigation strategies.
The code employed to conduct all analyses in this paper is available by contacting the corresponding author Fuqiang Cao (wq2006126@126.com). Observed daily rainfall datasets used in this study are available by contacting the authors of this paper.
GT and CF designed all the experiments. GT and CF conducted all the experiments and analyzed the results. All the authors contributed to the preparation of the English manuscript.
The authors declare that they have no conflict of interest.
We are very grateful to our editor, Dominic Mazvimavi, for his generous encouragement and great kindness for providing us with an opportunity to improve the quality of this paper. We cordially thank two anonymous reviewers for their professional comments and suggestions that were greatly helpful for further improvement of the quality of this paper. This study is jointly supported by the Natural Science Foundation and Sci-tech Development Project of Shandong Province (No. ZR2018MD014; J18KA210), the Key Research and Development Plan of Shandong province in 2019 (No. 2019GGX105021), the China Postdoctoral Science Foundation (Nos. 119100582H; 1191005830) and the National Natural Science Foundation of China (No. 41630532).
This study is being jointly supported by the Natural Science Foundation and Sci-tech 10 Development Project of Shandong Province (grant nos. ZR2018MD014 and J18KA210), the Key Research and Development Plan of Shandong province in 2019 (grant no. 2019GGX105021), the China Postdoctoral Science Foundation (grant nos. 119100582H and 1191005830) and the National Natural Science Foundation of China (grant no. 41630532).
This paper was edited by Dominic Mazvimavi and reviewed by two anonymous referees.
Bao C. L.: Synoptic Meteorology in China, China Ocean Press, Beijing, 82–117, 1987.
Cao, F., Gao, T., Dan, L., Ma, Z., Chen, X., Zou, L., and Zhang, L.: Synoptic-scale atmospheric circulation anomalies associated with summertime daily precipitation extremes in the middle–lower reaches of the Yangtze River Basin, Clim. Dynam., 53, 3109–3129, https://doi.org/10.1007/s00382-019-04687-3, 2020.
Chan, J. C. and Zhou, W.: PDO, ENSO and the early summer monsoon rainfall over south China, Geophys. Res. Lett., 32, L08810, https://doi.org/10.1029/2004GL022015, 2005.
Chang, C. P., Zhang, Y., and Li, T.: Interannual and interdecadal variations of the East Asian summer monsoon and tropical Pacific SSTs. Part I: Roles of the subtropical ridge, J. Climate, 13, 4310–4325, https://doi.org/10.1175/1520-0442(2000)013<4326:IAIVOT>2.0.CO;2, 2000a.
Chang, C. P., Zhang, Y., and Li, T:, Interannual and interdecadal variations of the East Asian summer monsoon and tropical Pacific SSTs. Part II: Meridional structure of the monsoon, J. Climate, 13, 4326–4340, https://doi.org/10.1175/1520-0442(2000)013<4326:IAIVOT>2.0.CO;2, 2000b.
Chen, S., Zhu, Z., Ge, Z., Kang, Z., and He, J.: The diversity of La Niña decay and the corresponding spring and summer precipitation anomalies over eastern China, Int. J. Climatol., 39, 33963441, https://doi.org/10.1002/joc.6100, 2019.
Chen, W., Feng, J., and Wu, R.: Roles of ENSO and PDO in the link of the East Asian winter monsoon to the following summer monsoon, J. Climate, 26, 622–635, https://doi.org/10.1175/JCLI-D-12-00021.1, 2013.
Coulibaly, P. and Burn, D. H.: Spatial and temporal variability of Canadian seasonal streamflows, J. Climate, 18, 191–210, https://doi.org/10.1175/JCLI-3258.1, 2005.
Domroes, M. and Peng, G.: The Climate of China, Springer-Verlag, Berlin, Heidelberg, 361 pp., 1988.
Ding, Y., Sun, Y., Wang, Z., Zhu, Y., and Song, Y.: Inter-decadal variation of the summer precipitation in China and its association with decreasing Asian summer monsoon Part II: Possible causes, Int. J. Climatol., 29, 1926–1944, https://doi.org/10.1002/joc.1615, 2009.
Ding, Y. H. and Chan, J. C.: The East Asian summer monsoon: an overview, Meteorol. Atmos. Phys., 89, 117–142, https://doi.org/10.1007/s00703-005-0125-z, 2005.
Gao, T. and Wang, H.: Trends in precipitation extremes over the Yellow River basin in North China: Changing properties and causes, Hydrol. Process., 31, 2412–2428, https://doi.org/10.1002/hyp.11192, 2017.
Gao, T. and Xie, L.: Spatiotemporal changes in precipitation extremes over Yangtze River basin, China, considering the rainfall shift in the late 1970s, Global Planet. Change, 147, 106–124, https://doi.org/10.1016/j.gloplacha.2016.10.016, 2016.
Gao, T., Xie, L., and Liu, B.: Association of extreme precipitation over the Yangtze River Basin with global air–sea heat fluxes and moisture transport, Int. J. Climatol., 36, 3020–3038, https://doi.org/10.1002/joc.4534, 2016.
Gao, T., Wang, H. J., and Zhou, T.: Changes of extreme precipitation and nonlinear influence of climate variables over monsoon region in China, Atmos. Res., 197, 379–389, https://doi.org/10.1016/j.atmosres.2017.07.017, 2017.
Gao, T., Zhang, Q., and Luo, M.: Intensifying effects of El Niño events on winter precipitation extremes in southeastern China, Clim. Dynam., 54, 631–648, https://doi.org/10.1007/s00382-019-05022-6, 2020.
Ge, J., You, Q., and Zhang, Y.: Effect of Tibetan Plateau heating on summer extreme precipitation in eastern China, Atmos. Res., 218, 364–371, https://doi.org/10.1016/j.atmosres.2018.12.018, 2019.
Grinsted, A., Moore, J. C., and Jevrejeva, S.: Application of the cross wavelet transform and wavelet coherence to geophysical time series, Nonlin. Processes Geophys., 11, 561–566, https://doi.org/10.5194/npg-11-561-2004, 2004.
Hannachi, A., Jolliffe, I. T., and Stephenson, D. B.: Empirical orthogonal functions and related techniques in atmospheric science: A review, Int. J. Climatol., 27, 1119–1152, https://doi.org/10.1002/joc.1499, 2007.
Harris, I., Jones, P. D., Osborn, T. J., and Lister, D. H.: Updated high-resolution grids of monthly climatic observations–the CRU TS3. 10 Dataset, Int. J. Climatol., 34, 623–642, https://doi.org/10.1002/joc.3711, 2014.
He, C., Lin, A., Gu, D., Li, C., Zheng, B., and Zhou, T.: Interannual variability of Eastern China Summer Rainfall: the origins of the meridional triple and dipole modes, Clim. Dynam., 48, 683–696, https://doi.org/10.1007/s00382-016-3103-x, 2017.
Hu, C., Chen, D., Huang, G., and Yang, S.: Dipole Types of Autumn Precipitation Variability Over the Subtropical East Asia-Western Pacific Modulated by Shifting ENSO, Geophys. Res. Lett., 45, 9123–9130, https://doi.org/10.1029/2018GL078982, 2018.
Huang, D., Dai, A., Zhu, J., Zhang, Y., and Kuang, X.: Recent Winter Precipitation Changes over Eastern China in Different Warming Periods and the Associated East Asian Jets and Oceanic Conditions, J. Climate, 30, 4443–4462, https://doi.org/10.1175/JCLI-D-16-0517.1, 2017.
Huang, R. and Sun, F.: Impacts of the tropical western Pacific on the East Asian summer monsoon, J. Meteorol. Soc. Jpn. Ser. II, 70, 243–256, https://doi.org/10.3878/j.issn.1006-9895.2006.06.01, 1992.
Huang, R. and Wu, Y.: The influence of ENSO on the summer climate change in China and its mechanism, Adv. Atmos. Sci., 6, 21–32, https://doi.org/10.1007/BF02656915, 1989.
Huang, W., He, X., Yang, Z., Qiu, T., Wright, J. S., Wang, B., and Lin, D.: Moisture sources for wintertime extreme precipitation events over South China during 1979–2013, J. Geophys. Res.-Atmos., 123, 6690–6712, https://doi.org/10.1029/2018JD028485, 2018.
Jin, D., Hameed, S. N., and Huo, L.: Recent changes in ENSO teleconnection over the western Pacific impacts the eastern China precipitation dipole, J. Climate, 29, 7587–7598, https://doi.org/10.1175/JCLI-D-16-0235.1, 2016.
Kalnay, E., Kanamitsu, M., Kistler, R., Collins, W., Deaven, D., Gandin, L., Iredell, M., Saha, S., White, G., and Woollen, J.: The NCEP/NCAR 40-year reanalysis project, B. Am. Meteorol. Soc., 77, 437–471, https://doi.org/10.1175/1520-0477(1996)077<0437:TNYRP>2.0.CO;2, 1996.
Krishnaswamy, J., Vaidyanathan, S., Rajagopalan, B., Bonell, M., Sankaran, M., Bhalla, R. S., and Badiger, S.: Non-stationary and non-linear influence of ENSO and Indian Ocean Dipole on the variability of Indian monsoon rainfall and extreme rain events, Clim. Dynam., 45, 175–184, https://doi.org/10.1007/s00382-014-2288-0, 2015.
Li, H., Dai, A., Zhou, T., and Lu, J.: Responses of East Asian summer monsoon to historical SST and atmospheric forcing during 1950–2000, Clim. Dynam., 34, 501–514, https://doi.org/10.1007/s00382-008-0482-7, 2010.
Li, Y., Ma, B., Feng, J., and Lu, Y.: Influence of the strongest central Pacific El Niño–Southern Oscillation events on the precipitation in eastern China, Int. J. Climatol., 39, 3076–3090, https://doi.org/10.1002/joc.6004, 2019.
Li, T., Bin, W., Bo, W. U., Tianjun, Z., and Chih-Pei Chang, R. Z.: Theories on Formation of an Anomalous Anticyclone in Western North Pacific during El Niño: A Review, J. Meteorol. Res., 31, 987–1006, https://doi.org/10.1007/s13351-017-7147-6, 2017.
Liu, J., Wang, H., Lu, E., and Kumar, A.: Decadal modulation of East China winter precipitation by ENSO, Clim. Dynam., 52, 72097223, https://doi.org/10.1007/s00382-016-3427-6, 2016.
Liu, R., Liu, S. C., Cicerone, R. J., Shiu, C., Li, J., Wang, J., and Zhang, Y.: Trends of extreme precipitation in eastern China and their possible causes, Adv. Atmos. Sci., 32, 1027–1037, https://doi.org/10.1007/s00376-015-5002-1, 2015.
Luo, M. and Lau, N. C.: Increasing heat stress in urban areas of eastern China: Acceleration by urbanization, Geophys. Res. Lett., 45, 13–60, https://doi.org/10.3390/su11123413, 2018.
Luo, Y., Wu, M., Ren, F., Li, J., and Wong, W.: Synoptic situations of extreme hourly precipitation over China, J. Climate, 29, 8703–8719, https://doi.org/10.1175/JCLI-D-16-0057.1, 2016.
Ma, Z.: The interdecadal trend and shift of dry/wet over the central part of North China and their relationship to the Pacific Decadal Oscillation (PDO), Chinese Sci. Bull., 52, 2130–2139, https://doi.org/10.1007/s11434-007-0284-z, 2007.
Ouyang, R., Liu, W., Fu, G., Liu, C., Hu, L., and Wang, H.: Linkages between ENSO/PDO signals and precipitation, streamflow in China during the last 100 years, Hydrol. Earth Syst. Sci., 18, 3651–3661, https://doi.org/10.5194/hess-18-3651-2014, 2014.
Qian, C. and Zhou, T.: Multidecadal variability of North China aridity and its relationship to PDO during 1900–2010, J. Climate, 27, 1210–1222, https://doi.org/10.1175/JCLI-D-13-00235.1, 2014.
Rajagopalan, B. and Zagona, E.: Space-time variability of Indonesian rainfall at inter-annual and multi-decadal time scales, Clim. Dynam., 47, 2975–2989, https://doi.org/10.1007/s00382-016-3008-8, 2016.
Rayner, N. A., Parker, D. E., Horton, E. B., Folland, C. K., Alexander, L. V., Rowell, D. P., Kent, E. C., and Kaplan, A.: Global analyses of sea surface temperature, sea ice, and night marine air temperature since the late nineteenth century, J. Geophys. Res.-Atmos., 108, 4407, https://doi.org/10.1029/2002JD002670, 2003.
Sun, Q., Miao, C., Qiao, Y., and Duan, Q.: The nonstationary impact of local temperature changes and ENSO on extreme precipitation at the global scale, Clim. Dynam., 49, 4281–4292, https://doi.org/10.1007/s00382-017-3586-0, 2017.
Torrence, C. and Webster, P. J.: Interdecadal changes in the ENSO–monsoon system, J. Climate, 12, 2679–2690, https://doi.org/10.1175/1520-0442(1999)012<2679:ICITEM>2.0.CO;2, 1999.
Wang, B., Wu, R., and Fu, X.: Pacific-East Asian teleconnection: how does ENSO affect East Asian climate?, J. Climate, 13, 1517–1536, https://doi.org/10.1175/1520-0442(2000)013<1517:PEATHD>2.0.CO;2, 2000.
Wang, B., Liu, J., Kim, H., Webster, P. J., Yim, S., and Xiang, B.: Northern Hemisphere summer monsoon intensified by mega-El Niño/southern oscillation and Atlantic multidecadal oscillation, P. Natl. Acad. Sci. USA, 110, 5347–5352, https://doi.org/10.1073/pnas.1219405110, 2013.
Wang, B., Luo, X., and Liu, J.: How Robust is the Asian Precipitation–ENSO Relationship during the Industrial Warming Period (1901–2017)?, J. Climate, 33, 2779–2792, https://doi.org/10.1175/JCLI-D-19-0630.1, 2020.
Wang, L., Chen, W., and Huang, R.: Interdecadal modulation of PDO on the impact of ENSO on the East Asian winter monsoon, Geophys. Res. Lett., 35, L20702, https://doi.org/10.1029/2008GL035287, 2008.
Wang, Y. and Zhou, L.: Observed trends in extreme precipitation events in China during 1961–2001 and the associated changes in large-scale circulation, Geophys. Res. Lett., 32, L9707, https://doi.org/10.1029/2005GL022574, 2005.
Webster, P. J., Magana, V. O., Palmer, T. N., Shukla, J., Tomas, R. A., Yanai, M., and Yasunari, T.: Monsoons: Processes, predictability, and the prospects for prediction, J. Geophys. Res.-Oceans, 103, 14451–14510, https://doi.org/10.1029/97JC02719, 1998.
Wu, R., Hu, Z., and Kirtman, B. P.: Evolution of ENSO-related rainfall anomalies in East Asia, J. Climate, 16, 3742–3758, https://doi.org/10.1175/1520-0442(2003)016<3742:EOERAI>2.0.CO;2, 2003.
Xie, S., Hu, K., Hafner, J., Tokinaga, H., Du, Y., Huang, G., and Sampe, T.: Indian Ocean capacitor effect on Indo-western Pacific climate during the summer following El Niño, J. Climate, 22, 730–747, https://doi.org/10.1175/2008JCLI2544.1, 2009.
Xu, K., Yang, D., Yang, H., Li, Z., Qin, Y., and Shen, Y.: Spatio-temporal variation of drought in China during 1961–2012: A climatic perspective, J. Hydrol., 526, 253–264, https://doi.org/10.1016/j.jhydrol.2014.09.047, 2015.
Yang, F. and Lau, K. M.: Trend and variability of China precipitation in spring and summer: linkage to sea-surface temperatures, Int. J. Climatol., 24, 1625–1644, https://doi.org/10.1002/joc.1094, 2004.
Yang, Q., Ma, Z., Fan, X., Yang, Z., Xu, Z., and Wu, P.: Decadal Modulation of Precipitation Patterns over Eastern China by Sea Surface Temperature Anomalies, J. Climate, 30, 7017–7033, https://doi.org/10.1175/JCLI-D-16-0793.1, 2017a.
Yang, Q., Ma, Z., and Xu, B.: Modulation of monthly precipitation patterns over East China by the Pacific Decadal Oscillation, Clim. Change, 144, 405–417, https://doi.org/10.1007/s10584-016-1662-9, 2017b.
Yu, L.: Potential correlation between the decadal East Asian summer monsoon variability and the Pacific decadal oscillation, Atmos. Ocean. Sci. Lett., 6, 394–397, https://doi.org/10.3878/j.issn.1674-2834.13.0040, 2013.
Yu, L., Furevik, T., Otterå, O. H., and Gao, Y.: Modulation of the Pacific Decadal Oscillation on the summer precipitation over East China: a comparison of observations to 600-years control run of Bergen Climate Model, Clim. Dynam., 44, 475–494, https://doi.org/10.1007/s00382-014-2141-5, 2015.
Zhai, P., Zhang, X., Wan, H., and Pan, X.: Trends in total precipitation and frequency of daily precipitation extremes over China, J. Climate, 18, 1096–1108, https://doi.org/10.1175/JCLI-3318.1, 2005.
Zhang, W., Jin, F. F., and Turner, A.: Increasing autumn drought over southern China associated with ENSO regime shift, Geophys. Res. Lett., 41, 4020–4026, https://doi.org/10.1002/2014GL060130, 2014.
Zhang, L. and Zhou, T.: Drought over East Asia: a review, J. Climate, 28, 3375–3399, https://doi.org/10.1175/JCLI-D-14-00259.1, 2015.
Zhang, R., Sumi, A., and Kimoto, M.: Impact of El Niño on the east Asian monsoon: A Diagnostic Study of the '86/87 and '91/92 Events, J. Meteorol. Soc. Jpn. Ser. II, 74, 49–62, https://doi.org/10.2151/jmsj1965.74.1_49, 1996.
Zhu, Y., Wang, H., Zhou, W., and Ma, J.: Recent changes in the summer precipitation pattern in East China and the background circulation, Clim. Dynam., 36, 1463–1473, https://doi.org/10.1007/s00382-010-0852-9, 2011.
Zhu, Y., Wang, H., Ma, J., Wang, T., and Sun, J.: Contribution of the phase transition of Pacific Decadal Oscillation to the late 1990s' shift in East China summer rainfall, J. Geophys. Res.-Atmos., 120, 8817–8827, https://doi.org/10.1002/2015JD023545, 2015.
Zhou, T., Song, F., Lin, R., Chen, X., and Chen, X.: Explaining extreme events of 2012 from a climate perspective, B. Am Meteorol Soc., 94, S1–S74, https://doi.org/10.1175/BAMS-D-13-00085.1, 2013.