the Creative Commons Attribution 4.0 License.
the Creative Commons Attribution 4.0 License.
 | 03 Mar 2020
Controls of fluorescent tracer retention by soils and sediments
Marcus Bork
Jens Lange
Markus Graf-Rosenfellner
Friederike Lang
Fluorescent dyes like uranine (UR) and sulforhodamine B (SRB) have been used for decades as artificial tracers in hydrological studies. Recently, attempts have been made to trace organic pollutants in soil with such dyes, but the knowledge of the controls of sorption of UR and SRB in soils is still incomplete and poorly standardised. For this reason, we selectively controlled clay, organic matter (OM) and pH within batch experiments and quantified systematically the impact and possible interactions of these controls on the adsorption of UR and SRB. Sorption isotherms were determined using a sandy sediment and a silty loamy subsoil and topsoil (0.6–2.8 % organic carbon (OC)) at pH values of 5.5, 6.5 and 7.5. Additionally, OM was removed from topsoil and subsoil samples by H2O2 treatment and the clay mineral montmorillonite was added to the sandy sediment. We found a negative relationship between the linear sorption coefficient Kd and pH that was stronger for UR than for SRB. Increasing repulsion forces between negative sorption sites and tracer functional groups at higher pH values might explain these results. Adsorption of UR and SRB increased with increasing clay content due to more specific surface area and associated sorption sites. An addition of 4 % of the clay mineral montmorillonite sufficed to adsorb nearly 100 % of both tracers. The influence of OM was more complex: while the adsorption of UR increased with increasing OC concentration, the opposite was observed for SRB. Our study indicates the high relevance of physico-chemical properties of soils and sediments for the fate of applied tracers and for their more conservative or non-conservative behaviour. Overall, the reported results will help to optimise the use of fluorescent tracers in terrestrial ecosystems and to increase their potential as a cheap and fast tool to gain insights into the fate of pollutants in soils and sediments.
- Article
(1319 KB) - Full-text XML
-
Supplement
(173 KB) - BibTeX
- EndNote


Fluorescent dyes are used in various applications, such as chemical sensing (Basabe-Desmonts et al., 2007), dye lasers (Li and Psaltis, 2008) or fluorescent labeling of biomolecules (Giepmans et al., 2006; Resch-Genger et al., 2008; Gonçalves, 2009). They are detectable at low concentrations, simple to handle and characterised by low toxicity (Flury and Wai, 2003; Leibundgut et al., 2009). For this reason, fluorescent dyes have also been used for decades as artificial tracers in hydrological studies to investigate transport processes in surface waters and groundwater (Omoti and Wild, 1979b; Sabatini and Austin, 1991; Vanderborght et al., 2002; Hillebrand et al., 2015, e.g.). One of the most frequently used fluorescent tracers is the xanthene dye uranine (UR) that is applied to analyse flow pathways, measure water velocities and determine hydrodynamic dispersion mainly in groundwater (Flury and Wai, 2003). Uranine is subject to photolysis but is assumed to be largely conservative in the dark (Flury and Wai, 2003), so that transport in aquifers is mainly influenced by convection, diffusion, and dispersion. Recently, researchers additionally used non-conservative tracers, such as sulforhodamine B (SRB) in mixture with conservative tracers. This “multi-tracer approach” characterises environmental compartments and predicts the fate of chemically similar substances such as pesticides (e.g. Sabatini and Austin, 1991; Passeport et al., 2010; Lange et al., 2011; Schuetz et al., 2012; Maillard et al., 2016). So far, UR has mainly been used in surface waters as a tracer for light decay (Lange et al., 2011; Gutowski et al., 2015), while SRB was found to be suitable to mimic adsorption on sediments (Durst et al., 2013; Dollinger et al., 2017). Since many different processes like volatilisation, sorption and degradation by light or microorganisms affect the fate of substances in environmental compartments, different tracers are necessary to mimic these individual processes. The development of multi-tracer approaches results from an increasing need to assess the capacity of natural or artificial soil and wetland systems to retain pollutants and prevent water bodies from pollution. Since the detection and quantification of organic micropollutants (e.g. pesticides) are time-consuming and expensive, it is desirable to have faster and cheaper analysis tools.
Some studies suggest that it might generally be possible to use fluorescent tracers to mimic the transport of organic pollutants (Sabatini and Austin, 1991; Passeport et al., 2010; Lange et al., 2011; Durst et al., 2013), although detailed knowledge of mobility-controlling processes, especially for soil systems, is largely missing. Prerequisites for successful multi-tracer experiments in soils and sediments are similar sorption properties of both the organic pollutant and the respective tracer. This work focuses on the prominent fluorescent tracers UR and SRB. Due to their functional groups (carboxyl group for UR and sulfonic groups for SRB) it is likely that their sorption behaviour will strongly depend on the pH, organic matter (OM) and texture of the sorbing matrix. The physico-chemical environment thus dictates a conservative or non-conservative tracer behaviour.
Dollinger et al. (2017)Durst et al. (2013)Schuetz et al. (2012)Albrecht et al. (2003)Sabatini (2000)Sabatini (2000)Vanderborght et al. (2002)Hadi et al. (1997)Sabatini and Austin (1991)Mägdefessel (1990)Mägdefessel (1990)Dervey (1985)Wernli (1986)Wernli (1986)Omoti and Wild (1979a)Table 1Kd values for UR and SRB found by several researchers.
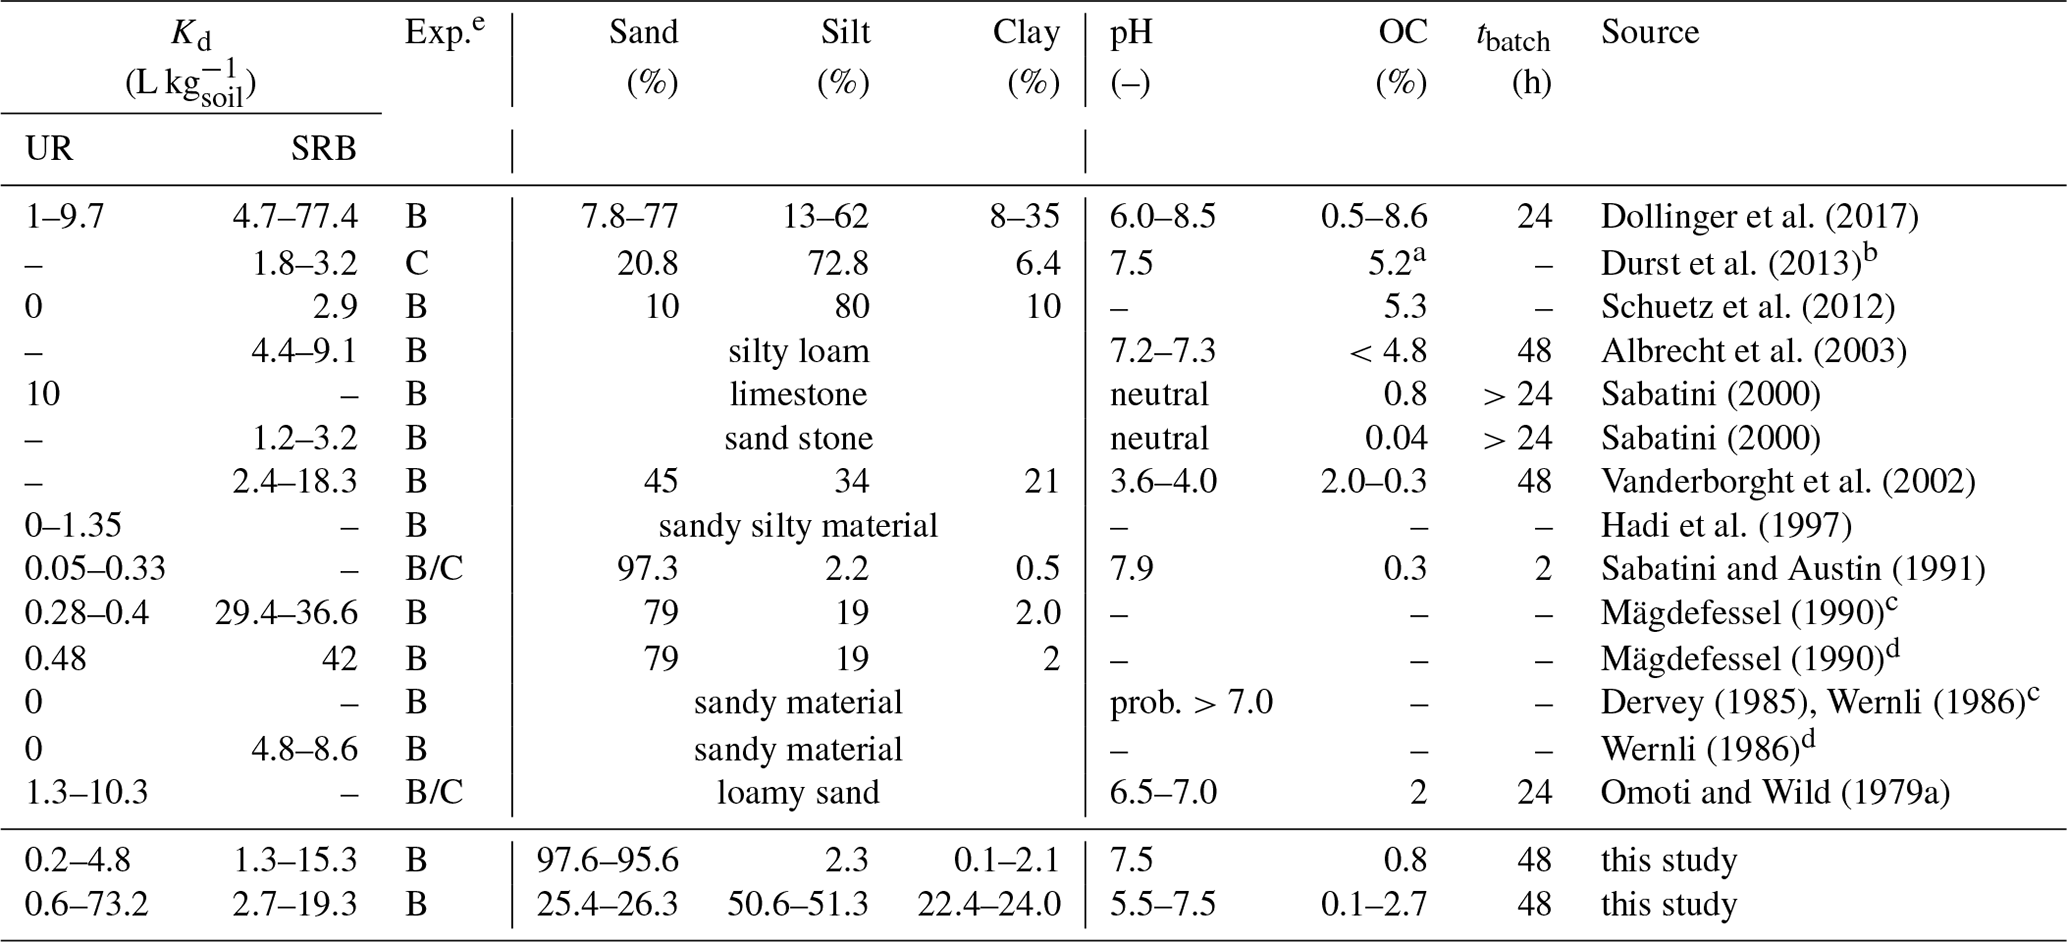
a Total organic carbon. b Boundaries of sand and silt size ranges differ slightly in this study: sand (50–1000 µm); silt (2–50 µm). c Cited in Leibundgut et al. (2009). d Cited in
Wernli (2011). e B: batch experiment. C: column experiment.
A few sorption studies of fluorescent tracers were carried out using pure organic or inorganic sorbents. However, the controls of sorption were not examined by systematically controlled experiments (Table 1) that varied only one parameter and left all others constant. Smart and Laidlaw (1977) investigated the sorption of several dye tracers, including UR and SRB, on different organic (humus, sawdust) and inorganic (kaolinite, limestone, orthoquartzite) materials. For UR they found moderate adsorption to organic and inorganic materials, whereas SRB showed low adsorption on organic materials but higher sorption on mineral surfaces. However, since the pH was not controlled, tracer adsorption to humus could have been enhanced by a pH effect in addition to the presence of OM. Kasnavia et al. (1999) and Sabatini (2000) conducted sorption experiments with UR and SRB at neutral pH on inorganic materials like negatively charged silica (SiO2) and sandstone and positively charged alumina (Al2O3) and limestone. UR and SRB showed stronger adsorption on positively than on negatively charged surfaces. They also found a strong decrease in UR sorption and a less strong decrease in SRB sorption when they increased the pH from 7 to 9. Recently, Dollinger et al. (2017) found that sorption of SRB in soils mainly correlated with clay content, while sorption of UR mainly followed the content of organic carbon (OC) and pH.
As described above, UR and SRB have mainly been used in systems where sorption plays a minor role. However, in order to use these tracers in soils and sediments, i.e. systems where sorption is the main process that controls solute retention, their sorption properties must be very well known. For this reason, the present study aims to identify the main controls of UR and SRB adsorption in soils and sediments. In particular, we investigated the influence of clay, OM, pH and their interactions on tracer adsorption by selectively controlling each factor in batch experiments. These types of experiments have the main advantage that experimental conditions can exactly be defined. Batch experiments are appropriate tools to investigate the influence of a single factor independent of transport processes (i.e. preferential flow) or transport-related soil properties (i.e. porosity). To face the challenge of experiments with complex matrices, such as soils and sediments, we not only compared natural substrates, but also manipulated them in a controlled way.
Several researchers have used KOC values (e.g. Sabatini and Austin, 1991; Keefe et al., 2004; Durst et al., 2013) to investigate and simulate the adsorption behaviour of fluorescent dye tracers on organic matter, despite KOC values having various limitations (U.S. Environmental Protection Agency, 1999; OECD, 2000). This study therefore evaluates the suitability of KOC values for assessing adsorption of UR and SRB on organic matter.
2.1 The substrates
In the following section, characterisation of soils and sediment and the analysis of physico-chemical soil properties are described. We collected soil samples from an urban grassland site in Freiburg (Germany) at depths of 5–15 cm (topsoil) and 50–60 cm (subsoil). The samples had similar pH but different OC content (Table 2). Furthermore, we used a sandy sediment (quartz sand) purchased from Kepes Handesgesellschaft mbH Sand und Kies (Freiburg, Germany). Below, topsoil and subsoil, as well as the sandy sediment, are subsequently termed substrates. For the experiments, stones and roots were removed by hand. Then, all samples were air-dried and passed through a 2 mm sieve. The residual gravimetric water content was determined as the difference between the sample weight of an air-dried sample and the sample weight after 24 h of drying at 105 ∘C. Residual water contents ranged from 0.1 % (sediment) to 2.2 % (topsoil) (see Table S1 in the Supplement). Therefore, we decided to omit the correction of air-dried samples by water content and used the air-dried soil mass as a reference. Texture was determined using sieving, sedimentation and the pipette method (Gee and Or, 2002). The pH was measured at room temperature (approx. 23±2 ∘C) after overnight equilibration of a 10 g sample in 25 mL solution (ultrapure water and 0.01 M CaCl2 solution) with a pH meter (Metrohm, Germany). Additionally, we analysed the content of dissolved organic carbon (DOC) in centrifuged (2490 g, 1 h, Heracus Megafuge 40 Centrifuge, Thermo Scientific, MA, USA) and filtered (folded filter, 125 mm, 80 g m−2, Munktell Filter AB, Sweden) soil extracts with a soil–solution ratio of 1 : 5 after acidification using a TOC analyser (multi N/C 2100 S, Analytik Jena, Germany). Centrifugation and filtration of the samples were necessary to remove solid organic matter and mineral particles.
Table 2Texture, pH values, OC and metal oxide contents (mean of three measurements), DOC concentrations (median of two measurements) and specific surface area (median of two measurements) of topsoil and subsoil and the sediment in dependence of the respective treatment (high or low OC). Treatments “high OC” are the untreated samples and “low OC” the H2O2-treated samples. Meo is the summed content of all oxalate extractable metal oxides () and Med is the summed content of all dithionite extractable metal oxides ().

a Montmorillonite. b Addition of 1 % or 2 % of the clay mineral montmorillonite. c Values are calculated from clay content and SSA for sediment and the pure clay mineral.
d Mean and standard deviation of three measurements. e Range of two measurements. f Standard deviation of four measurements. g pH in H2O∕pH in 0.01 M CaCl2 solution.
As a measure of OM we determined the OC of the substrates, which was measured with a CNS analyser (Vario El Cube, Elementar, Germany) after grinding the samples with a vibratory disc mill (Siebtechnik GmbH, Germany). Since the sediment contained carbonate-bound carbon (1.13 %), its OC content was determined as the difference of the total carbon content before and after heating the sample at 550 ∘C. At this temperature, it is assumed that all OC had transformed into CO2 (Bisutti et al., 2004).
The specific surface area (SSA) was determined using the N2-adsorption method with a Quantachrome Autosorb-1 instrument (Quantachrome Instruments, FL, USA). Samples were degassed at 80 ∘C and the SSA was calculated using the Brunauer–Emmett–Teller (BET) equation by Brunauer et al. (1938).
Amorphous Fe, Al and Mn oxides (Feo, Alo and Mno) were extracted by oxalate according to Schwertmann (1964) and crystalline and amorphous Fe, Al and Mn oxides (Fed, Ald and Mnd) by dithionite according to Mehra and Jackson (1958) in order to estimate their contribution to tracer sorption. The molar concentrations of amorphous and crystalline metals equal the sum of oxalate-extracted metals (Meo) and dithionite-extracted metals (Med), respectively. In addition, we calculated the Meo∕Med ratio, which indicates the fraction of more amorphous metal oxides in relation to the more crystalline oxides. All element concentrations were determined by ICP-OES (Spectro Ciros CCD, Spectro Analytical Instruments GmbH, Germany).
2.2 The tracers
Tracer solutions of UR (Simon & Werner, Flörsheim, Germany) and SRB (Chroma, Münster, Germany) were dissolved in 0.01 M CaCl2 and stored at approximately 6 ∘C. To prevent photolytic decay, the amber-glass bottles were wrapped with aluminium foil. The tracer fluorescence was measured in a synchronous scan method (Δλ=25 nm, wavelength range: 250–650 nm) at maxima of 488 nm (UR) and 560 nm (SRB) using luminescence spectrometer LS-50B (Perkin Elmer, MA, USA). To ensure 100 % fluorescence intensity for both tracers during measurement, the pH was raised to 9–10 using one drop of 1.5 M EDTA solution. This step was necessary due to the pH dependence of tracer fluorescence (Smart and Laidlaw, 1977) (Table 3). The calibration of the fluorescence measurements was conducted in watery electrolyte extracts of each substrate in order to exclude matrix effects. For this purpose, 20 g substrate material was dispersed in 100 mL 0.01 M CaCl2 and was agitated overnight using a rotating shaker (3040 GFL, Burgwedel, Germany). After centrifuging at 2490 g for 1 h and filtration by a folded filter, the extracts were diluted with ultrapure water by a factor of 10 to reduce the background fluorescence. The calibration solutions were prepared in the ranges of 0–5 µg L−1 (UR) and 0–100 µg L−1 (SRB). These concentrations were chosen to ensure a linear calibration range.
Table 3Characterisation of fluorescent tracers.
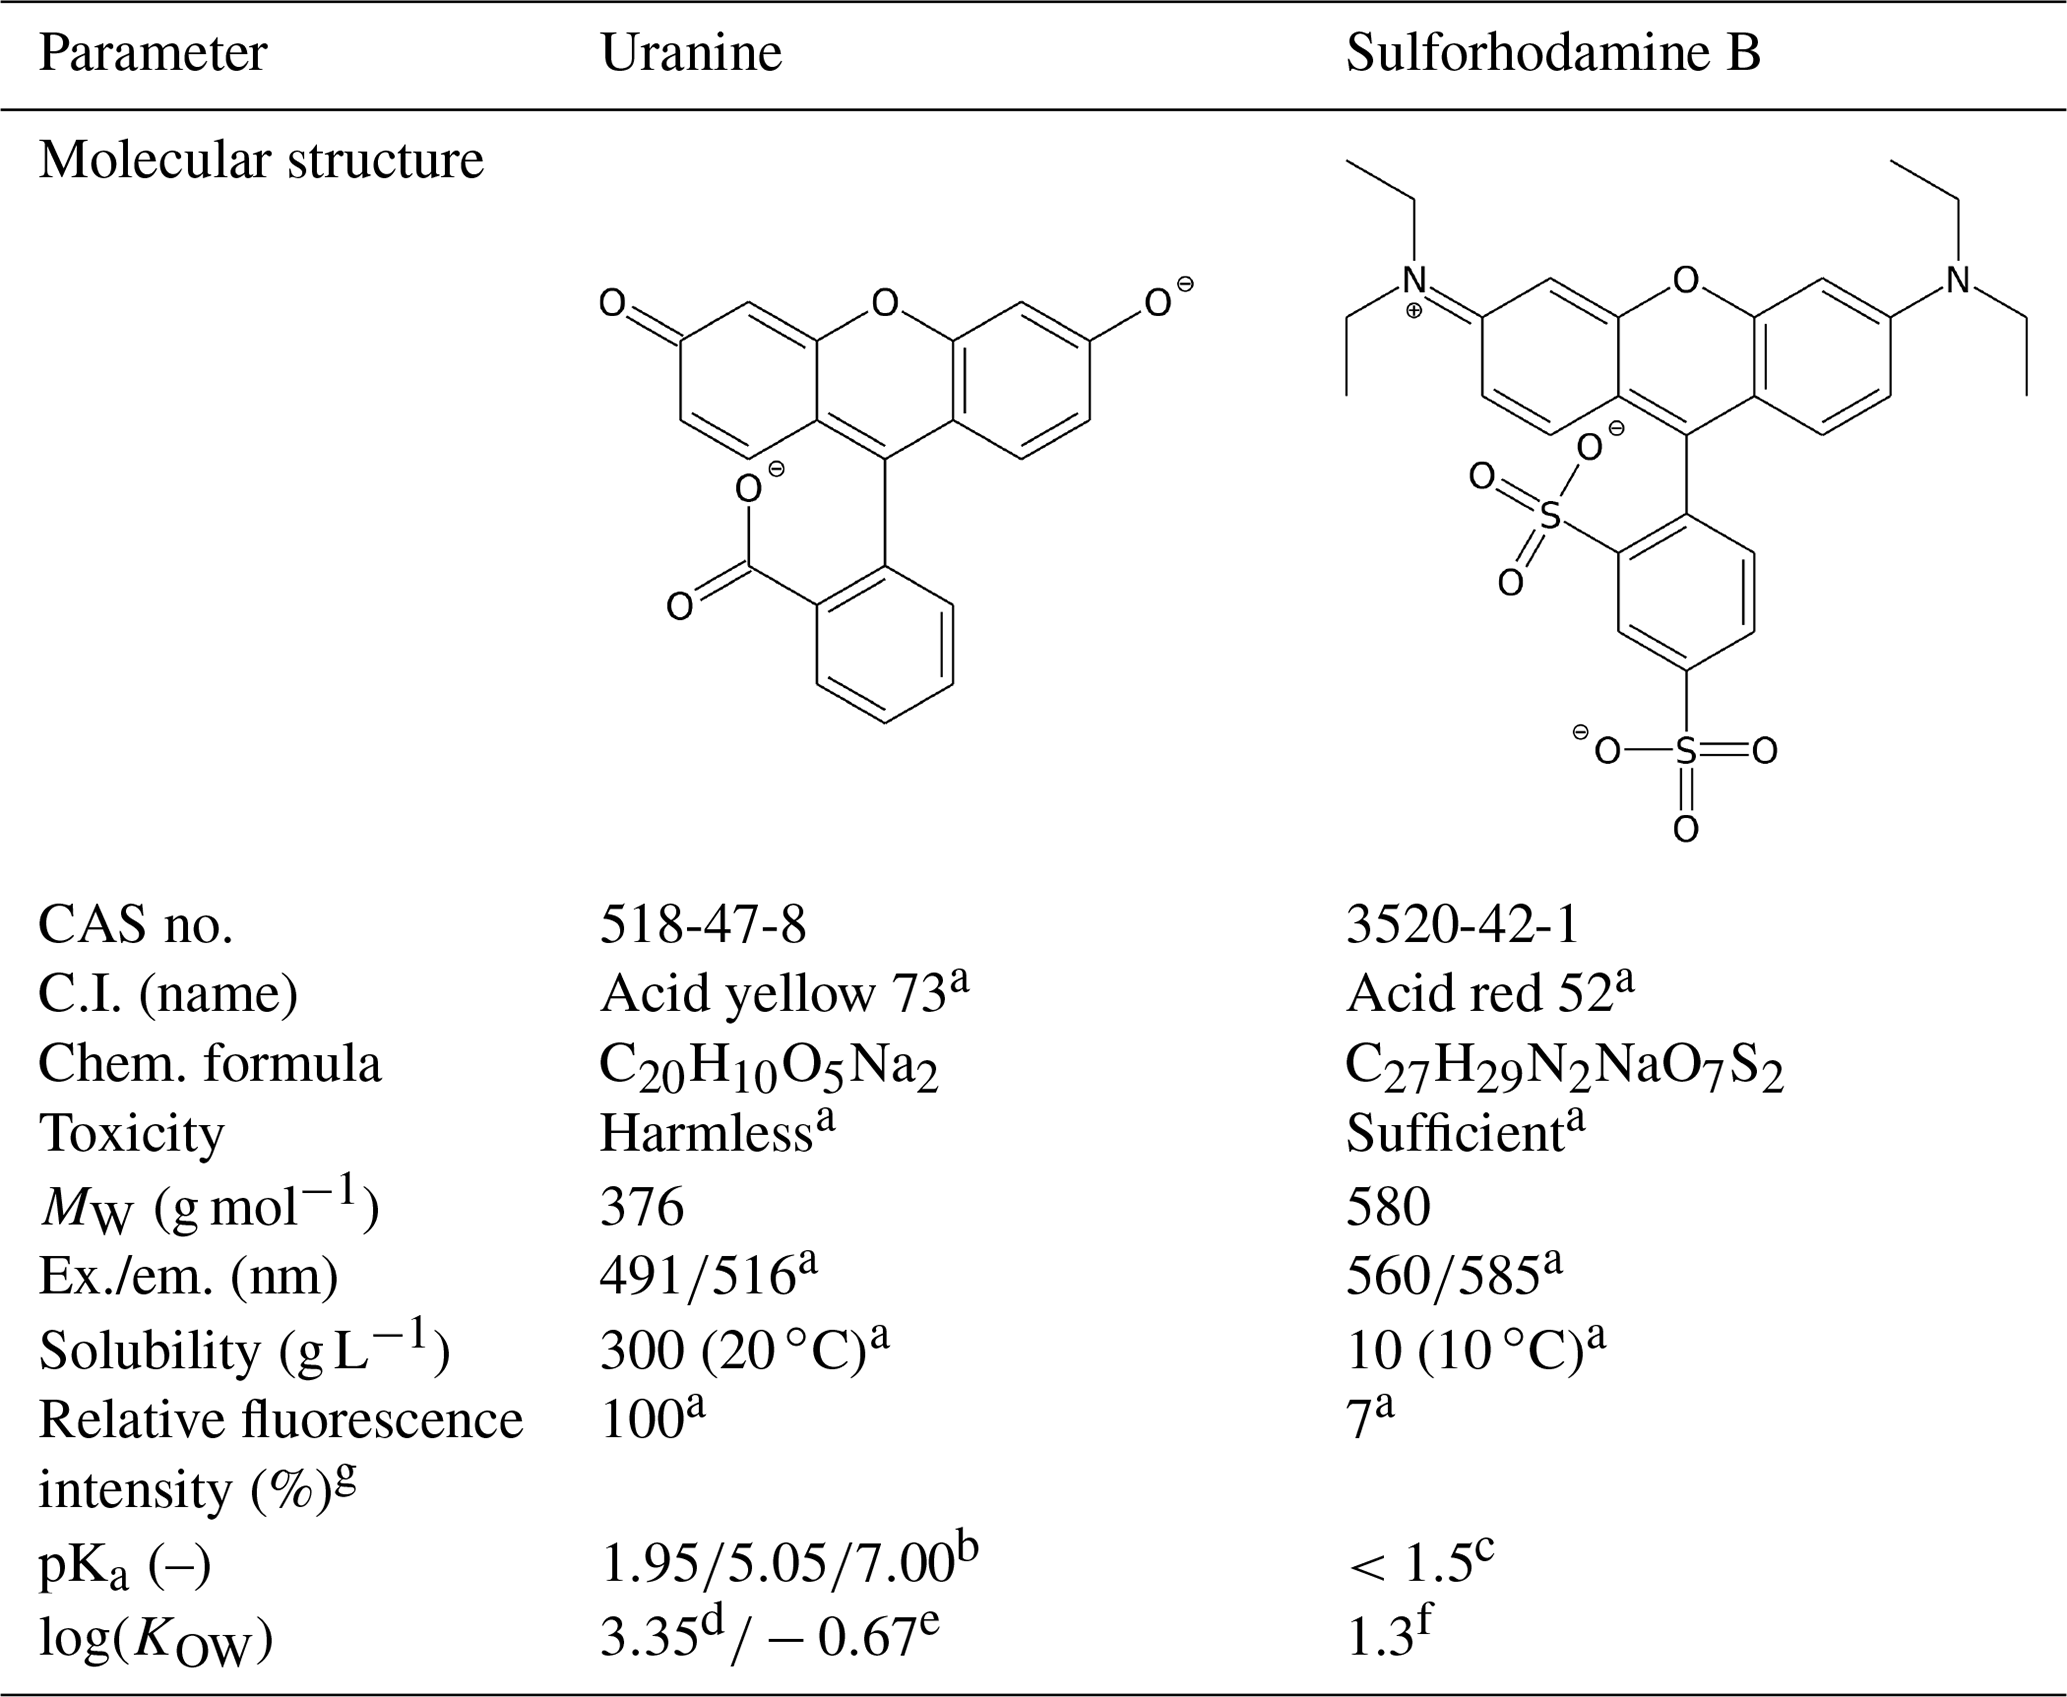
a Source: Leibundgut et al. (2009). b Source: Zanker and Peter (1958). c Source: Kasnavia et al. (1999). d log(KOW) for the 2-fold protonated (neutral) species (dominant species between pH 1.95 and 5.05), calculated with the U.S. Environmental Protection Agency (2012). e log(KOW) for the disodium salt (2-fold negative charged) species (dominant species above pH 7.00), calculated with the U.S. Environmental Protection Agency (2012). f log(KOW) at pH 7.15; source: Scientific Committee on Consumer Products (2008). g Values in pure natural water (groundwater).
2.3 Batch experiments
2.3.1 Substrate treatments
In the following section, we describe how we have prepared the various treatments to investigate the influence of pH, OC and clay on UR and SRB adsorption (Fig. 1). To investigate the influence of the pH, the initial pH values of all samples were adjusted to 7.5, 6.5 and 5.5 using HCl and NaOH in variable concentrations (Fig. 1) as done, for example, by Boxall et al. (2002). At pH 5.5 and 6.5 only the first and sixth concentrations were measured in triplicate, while the other four concentrations in between were single measurements. The small variance of the triplicate measurements (6.2 % ± 4.5 %; see Fig. S1) made this simplification possible. The effect of varying OC and clay contents was studied at pH 7.5. Below, altered substrates, either by H2O2 treatment (low and high OC) in the case of topsoil and subsoil or by the addition of clay (Clay0, Clay1 and Clay2) in the case of sediment or by adjusting the pH, are termed treatments.
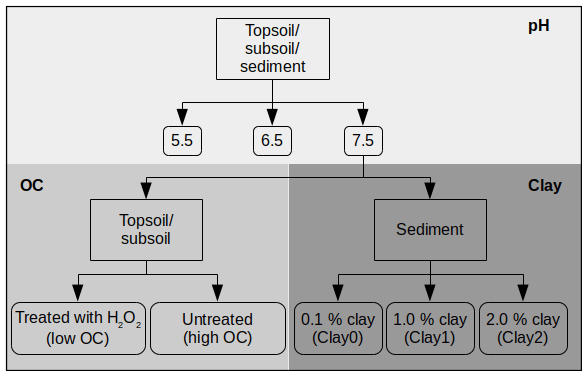
To decrease the OC content as was for example done by Kaiser and Zech (2000), approximately 200 g of each soil sample (topsoil and subsoil) was dispersed in a H2O2 solution (w = 30 %) and equilibrated at 20 ∘C for 15 h. Afterwards, the suspension was heated for approximately 2 weeks at 80 ∘C until evolvement of CO2 ended. Within this time, H2O2 was repeatedly added to the suspension. Subsequently, the sample was rinsed with ultrapure water on a folded filter and dried at 40 ∘C. By this treatment the OC content decreased from 2.8 to 0.7 % OC (topsoil) and from 0.6 to 0.1 % OC (subsoil) (Table 2).
The clay content was modified by adding different quantities of the clay mineral montmorillonite (K10, powder, Sigma Aldrich, St. Louis, MO) to the sediment, as was for example done by Tahir and Marschner (2016). To investigate the influence of the clay content on the tracer sorption for a broader range of clay contents, we first conducted single adsorption measurements at different quantities of clay addition (0.1 %, 0.5 %, 1.0 %, 2.0 %, 2.5 %, 5 % and 10 % clay). In a second step, we chose three clay contents and used the following treatments (Fig. 1) for analysing sorption isotherms: Clay0 (sediment, 0.1 % clay), Clay1 (sediment +1 % clay) and Clay2 (sediment +2 % clay).
2.3.2 Sorption isotherms
Isotherms for fluorescent tracer adsorption were prepared using the batch equilibrium method according to OECD guideline 106 (OECD, 2000). For each substrate, 10 g was suspended in 45 mL 0.01 M CaCl2 solution in 100 mL amber-glass bottles and agitated overnight in a rotating shaker (3040 GFL, Burgwedel, Germany) at 10 rpm. Subsequently, 5 mL of the tracer solution was added to the suspension and the pH was adjusted to 5.5, 6.5 or 7.5 by adding HCl or NaOH. The tracer solution contained both tracers at the same time. The tracer concentrations were low and still in the range of linear sorption. In this case, sorption sites are in excess and far from being saturated (Schwarzenbach et al., 2002). Therefore, we assumed that the tracers did not compete during sorption. Then, the tracer-soil suspension was agitated for 42 h until sorption equilibrium. This time was identified in pre-tests where we tested the tracer adsorption by conducting the batch experiment for 24, 48 and 72 h. During the equilibration time, the pH was measured two times (after approx. 16–24 h) and was, if necessary, corrected again by adding HCl or NaOH. After equilibration, solid and liquid phases were separated by centrifugation at 2490 g for 45 min. Following this, 5 mL of the supernatant was separated and diluted by 45 mL ultrapure water in order to suppress DOC fluorescence and therefore increase the limit of quantification (LOQ) of tracers. For each sorption isotherm six tracer concentrations in ranges of 20–45 µg L−1 (UR) and 400–900 µg L−1 (SRB) were prepared in triplicate. According to our pre-tests, these tracer concentrations were in the linear sorption range and were high enough to obtain a clear tracer signal to background ratio. At pH 5.5 and 6.5 the highest and lowest concentrations of the sorption isotherms were prepared in triplicate; the other concentrations were only prepared once. At pH 7.5 all concentrations were prepared in triplicate. Moreover, the experiments were conducted at room temperature (approx. 23±2 ∘C); Fernández-Pascual et al. (2018) showed that adsorption of UR and SRB is not temperature dependent at this temperature range.
2.3.3 Data analysis
The content of adsorbed tracer q(eq) (µg kg−1) at chemical equilibrium was calculated as follows (OECD, 2000):
where c0 (µg L−1) is the initial tracer concentration, caq (eq) (µg L−1) is the measured tracer concentration in the liquid phase at chemical equilibrium, V0 (L) is the sample volume and msample (g) is the sample weight. Since sorption data were still in the linear range, the adsorption percentage xadsorbed (%) was calculated according to the equation
with msorb (µg) the mass of adsorbed tracer on the soil and m0 (µg) initial mass of tracer. The linear sorption coefficient Kd (L kg) is defined as follows:
It is determined as a slope of the linear sorption isotherms and a measure of sorption strength. We decided to use this equation because it is widely used and enables comparison with literature data. To evaluate the goodness of Kd values, standard errors and 95 %-confidence intervals were calculated. Linear regression was performed using the lm function of the R programming language (R Development Core Team, 2008). Relating the Kd to the fraction of organic matter (fOC, kgC kg) yields the KOC (L kg), a measure for adsorption on organic matter:
Data analysis was performed using the R programming language (R Development Core Team, 2008).
3.1 Physico-chemical properties of substrates and treatments
The three substrates topsoil, subsoil and sediment were chosen to represent some commonly occurring natural materials. In agreement, the OC content of the topsoil (2.7 %, Table 2) was in accordance with that of other terrestrial European topsoils (de Brogniez et al., 2015). In contrast to the topsoil, the subsoil showed a low OC content (0.6 %), which is related to the relatively low depth of the taken sample (50–60 cm). This was intended to have samples with similar texture but a preferably different OC content. In the sediment we measured a slightly higher OC content (0.8 %) than in the subsoil. However, this value has to be considered carefully because the high inorganic carbon content of the sediment could have influenced the accuracy of the measurement of organic carbon. In contrast to OC, the clay contents of topsoil and subsoil are similar (24.0 % and 22.4 %) and differ clearly from that of the sediment (0.1 %), which was intended to examine the influence of the clay on the adsorption of the tracers. In general, topsoil and subsoil are comparable to those used for example by Dollinger et al. (2017) for examining sorption of UR and SRB, whereas the sediment is similar to the substrates used by Sabatini (2000).
In general, metal oxide and hydroxide contents of our samples were comparable to soils in central Germany (Wiseman and Puttmann, 2005). They increased in the following order: sediment ≪ topsoil < subsoil. The Med (amorphous and crystalline Fe, Al and Mn oxides) was higher in the subsoil than in the topsoil, indicating more positive sorption places in the subsoil. The Meo∕Med ratio was nearly twice as high in the topsoil (0.67) than in the subsoil (0.38), indicating more amorphous metal oxides in the topsoil. Since iron oxides like ferrihydrite and goethite are positively charged at high pH values (Cornell and Schwertmann, 2003), they are important sorbents for molecules with negatively charged functional groups like UR and SRB.
The SSA was twice as high in the subsoil (24 m2 g−1) as in the topsoil (12 and 10 m2 g−1, Table 2) despite a slightly higher clay content in the topsoil (24.0 %) than in the subsoil (22.4 %). This could be related to a different composition of the clay fraction in both soils or by clogging of clay mineral interlayers by organic matter, especially in the topsoil, which was also observed e.g. by Mikutta et al. (2006a, b). Furthermore, the SSA slightly increased after the H2O2 treatment, which was also observed by Feller et al. (1992). They explained this observation as follows: the organic matter (OM) partially sticks soil particles together or clocks soil pores, which, after the removal of OM, become accessible again for N2 during the measurement. The lowest SSA was, as expected, measured for the sediment (1.1 m2 g−1). By the addition of the pure clay mineral montmorillonite with a high SSA (249 m2 g−1), the clay content of treatments Clay1 and Clay2 was increased to 3.6 and 6.1 m2 g−1.
3.2 Influence of pH
3.2.1 Sorption of UR
The adsorption of UR in topsoil and subsoil strongly decreased with increasing pH (Figs. 2, 3; data can be found in the Supplement: Tables S2, S3 and S4). The Kd value decreased from pH 5.5 to 7.5 by a factor of 22 in the topsoil and 12 in the subsoil (Table 4). Similar observations concerning the direction of the relation between pH and UR adsorption were made by other researchers, e.g. by Smart and Laidlaw (1977) and Peterson (2010). Omoti and Wild (1979a) reported a Kd value of 10.3 L kg−1 at pH 6.5–7.0 for UR adsorption in the batch experiment (Table 1), which is approximately between the values that we measured (3.3±0.4 L kg−1 at pH 7.5 and 46.7±7.7 L kg−1 at pH 6.5). At high pH values, most solid surfaces in soils (variable charges of functional groups of OM and edges of clay minerals as well as permanent charges of clay minerals) are negatively charged and become, with decreasing pH, neutral or, under more acidic conditions, positively charged (Blume et al., 2016). The same applies to the carboxyl and hydroxyl groups of the UR molecule, which are determined by its pKa values (Zanker and Peter, 1958). Therefore, attracting forces between UR and various sorbents at low pH turn into repulsive forces between negative charges at higher pH and, thus, a reduced affinity for adsorption.
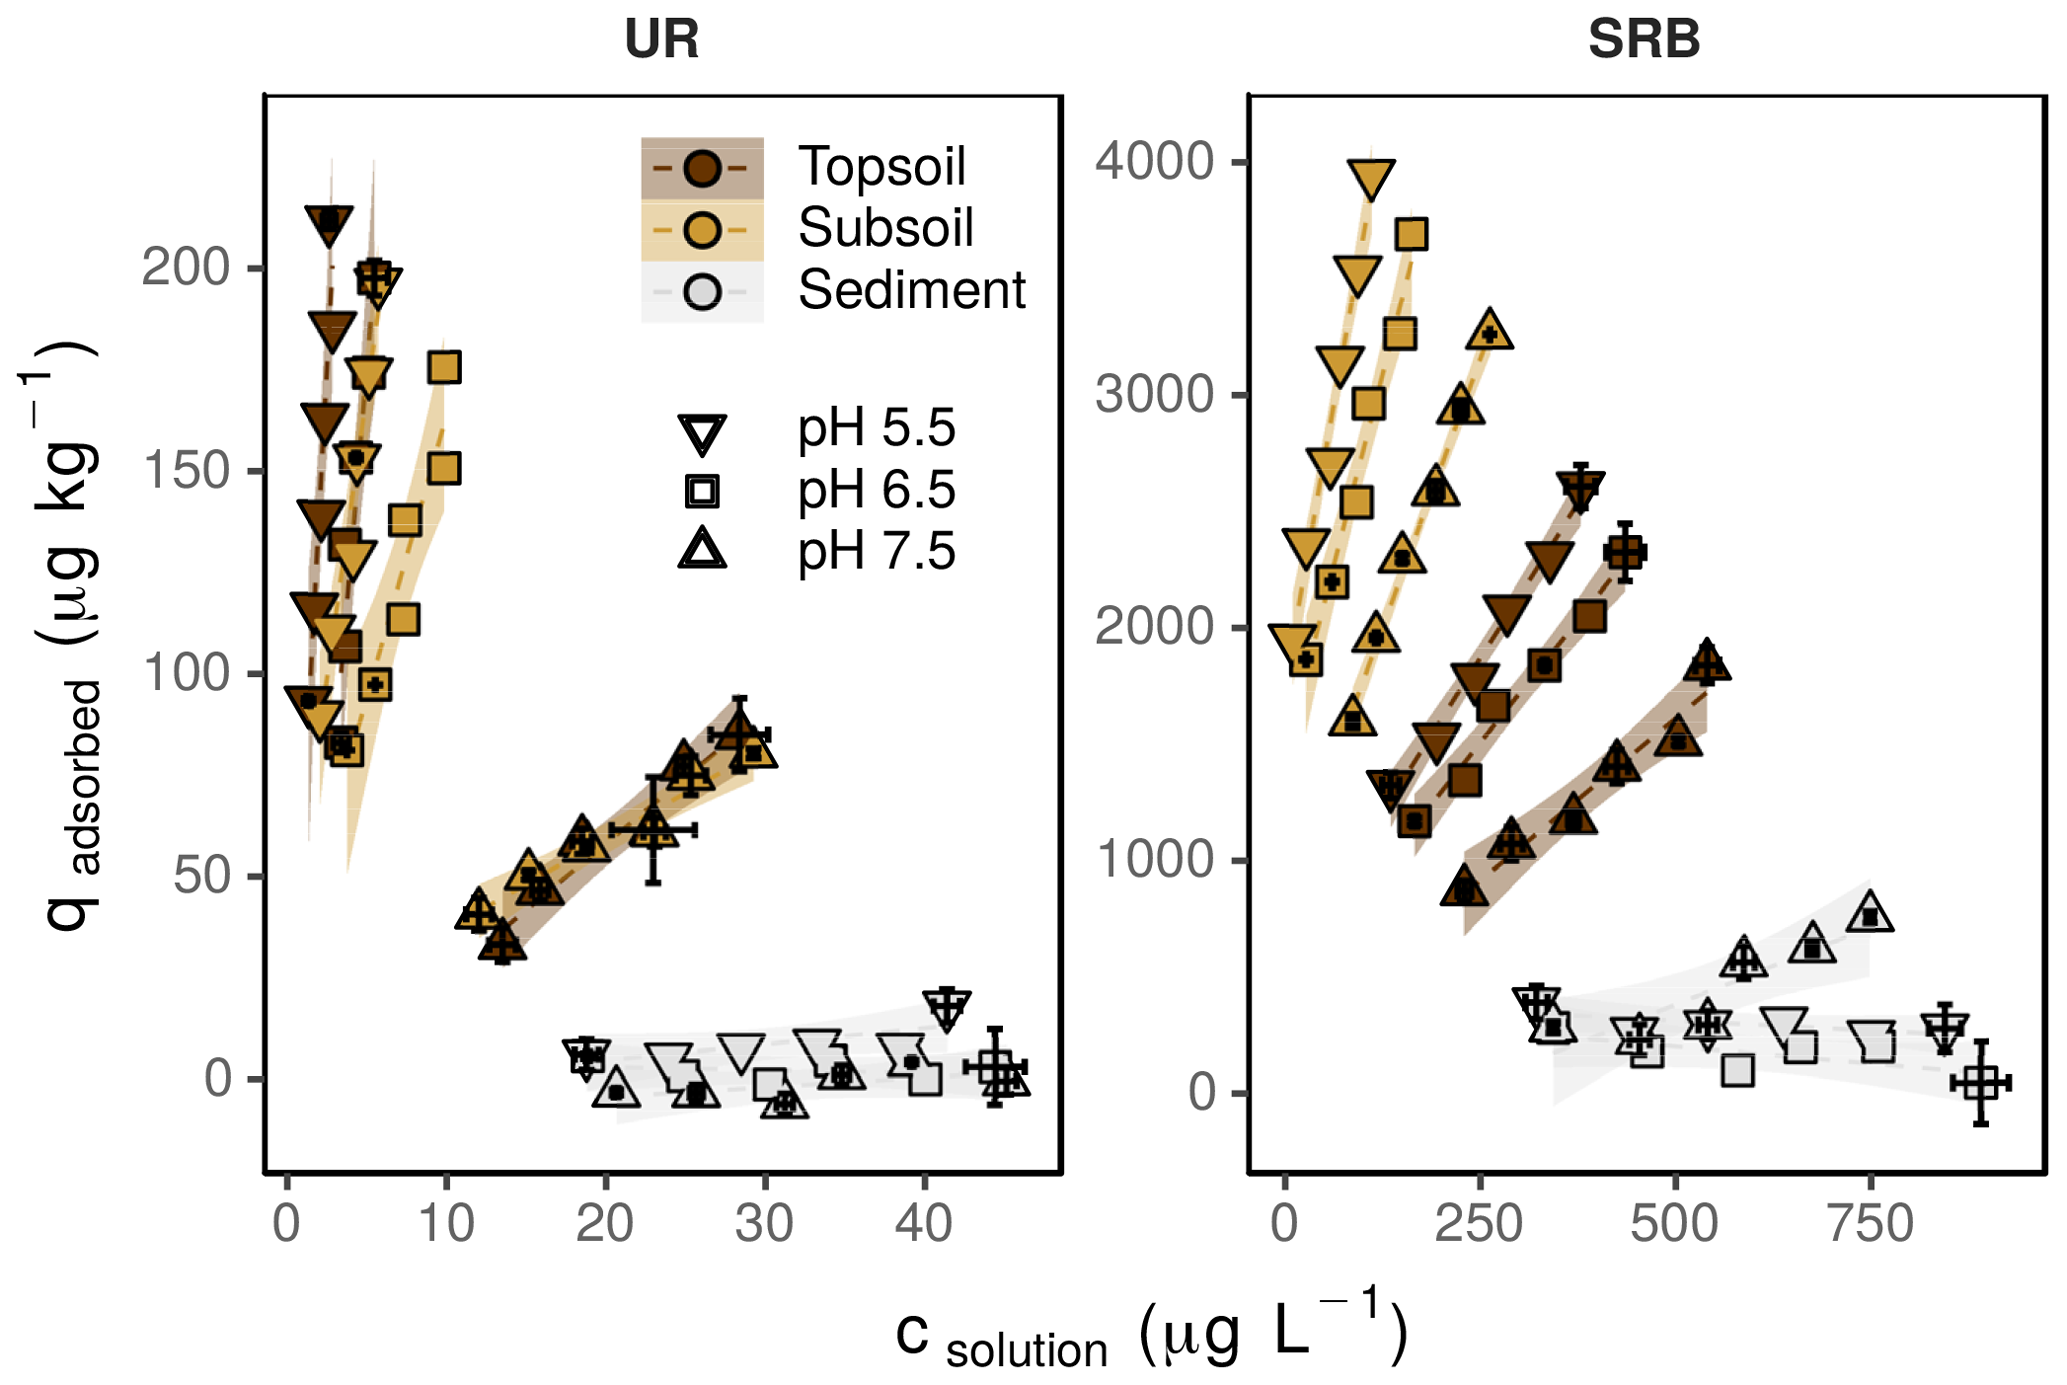
Figure 2Sorption isotherms for UR and SRB determined at pH 5.5 (down-pointing triangle), 6.5 (square) and 7.5 (up-pointing triangle) in topsoil (brown), subsoil (yellow) and sediment (grey). The error bars represent the standard deviation of the tracer concentration measured in solution (csolution) and the calculated content of the adsorbed tracer (qadsorbed) (n=3). Note the different concentration ranges of UR and SRB. The transparent areas around the regression lines represent the 95 %-confidence intervals.
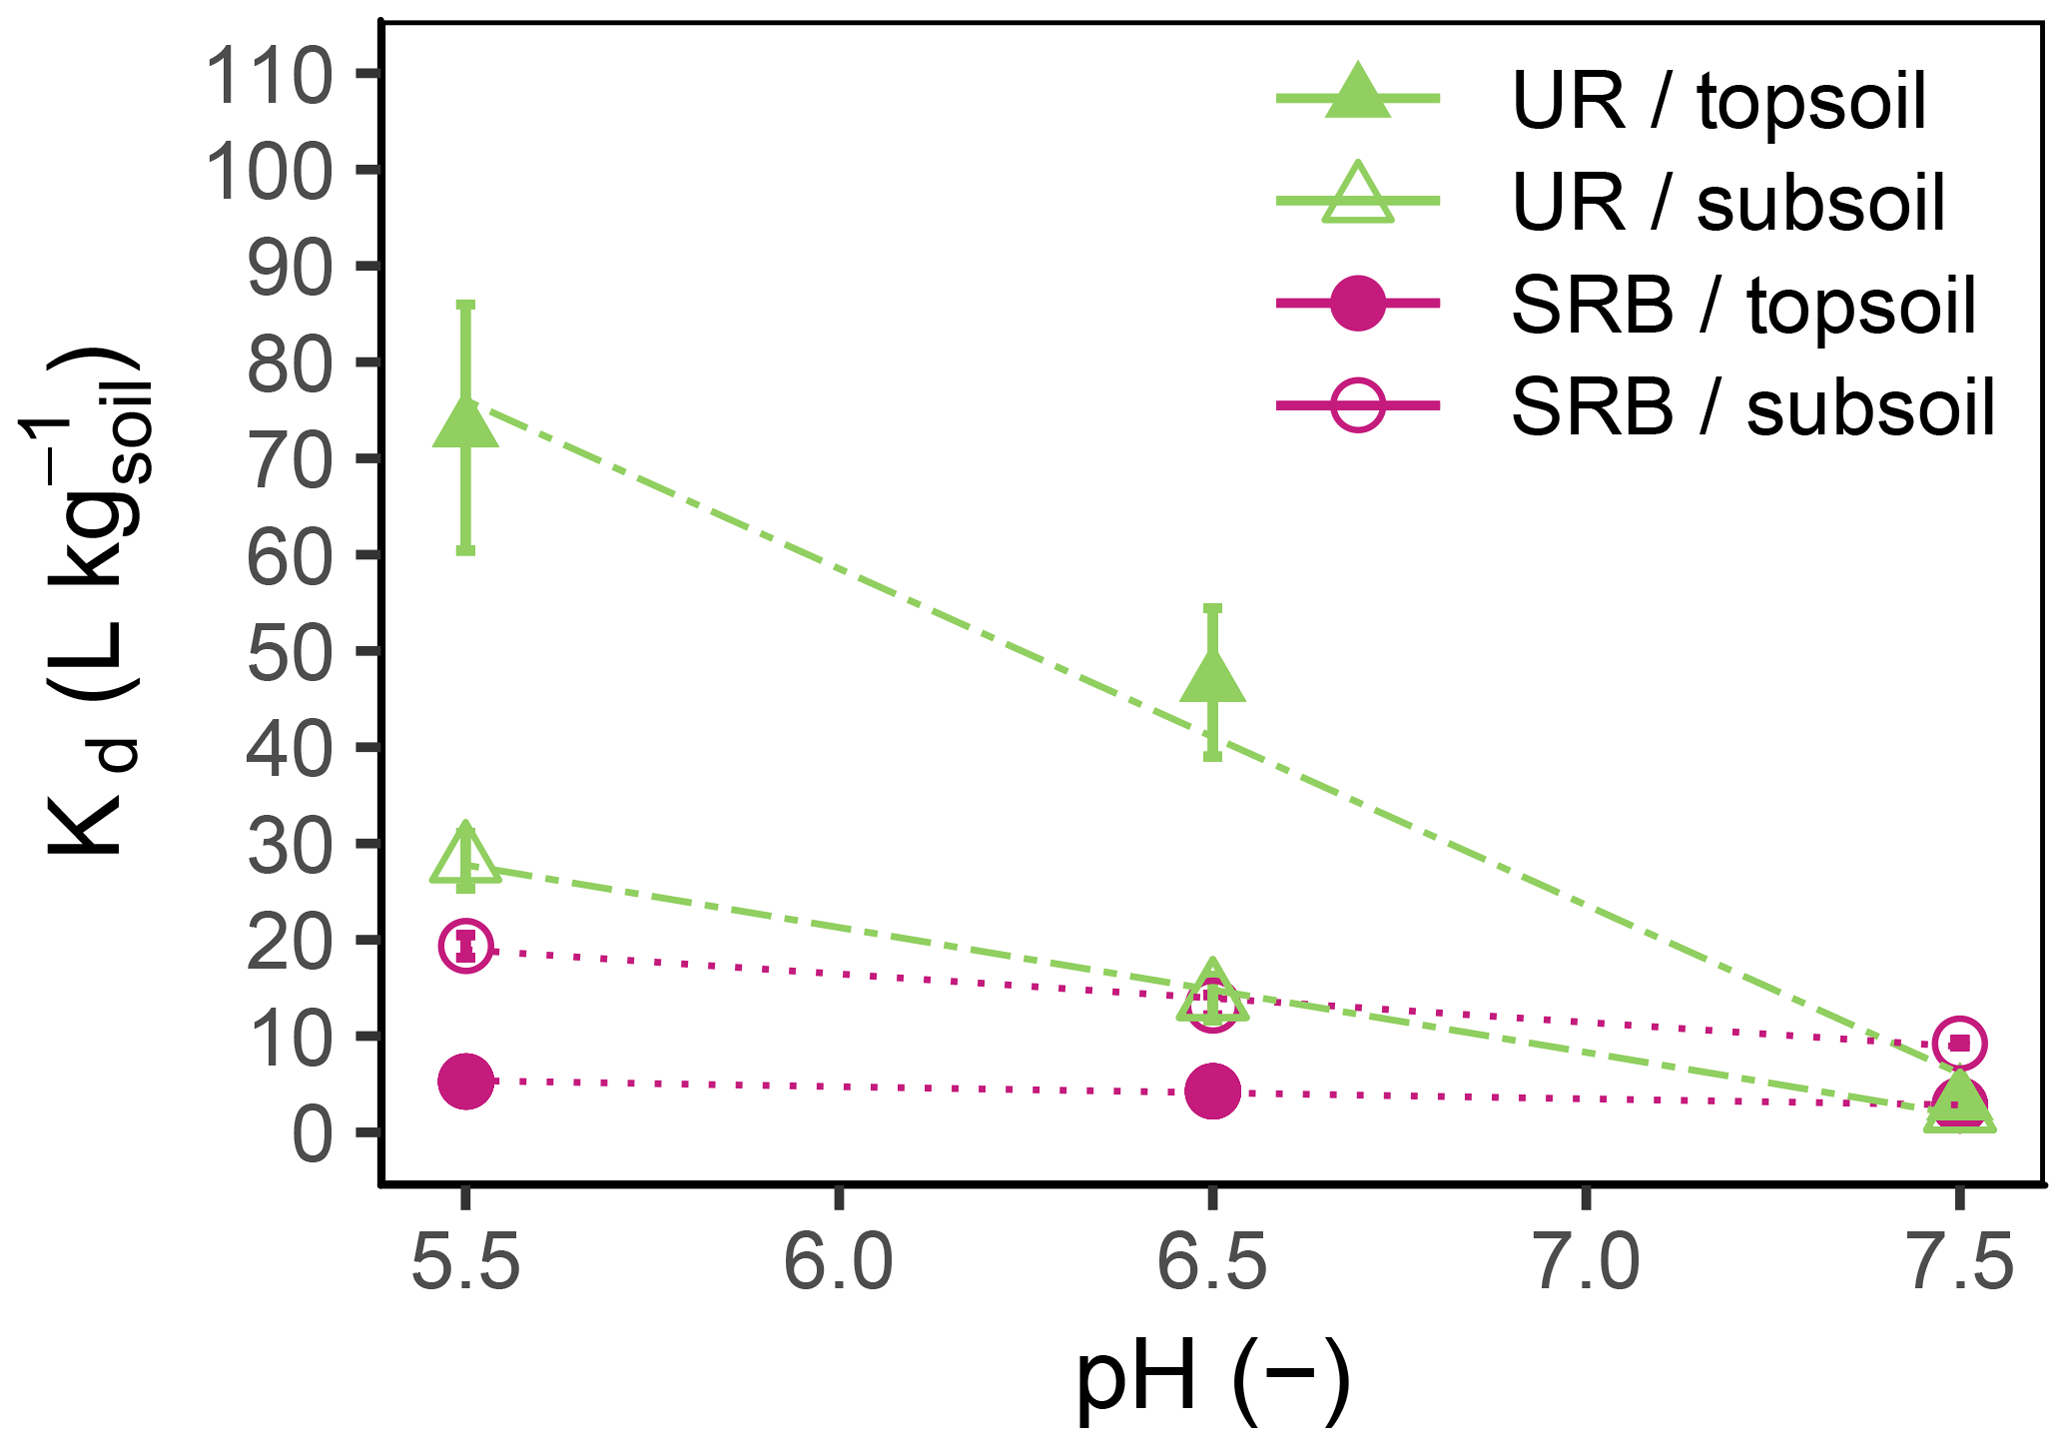
Figure 3Kd values as a function of pH for UR (triangles, dash-dotted lines) and SRB (circles, dotted lines) in topsoil (filled symbols) and subsoil (open symbols). The error bars represent the standard errors of Kd values from linear regression (n=18).
Table 4Kd values for UR and SRB adsorption in topsoil, subsoil and sediment at pH 5.5, 6.5 and 7.5 with different clay and OC treatments. OC treatment “high OC” represents the untreated samples and “low OC” the H2O2-treated samples. Clay treatments Clay0, Clay1 and Clay2 represent the sediment with 0 %, 1 % and 2 % clay additions, respectively.
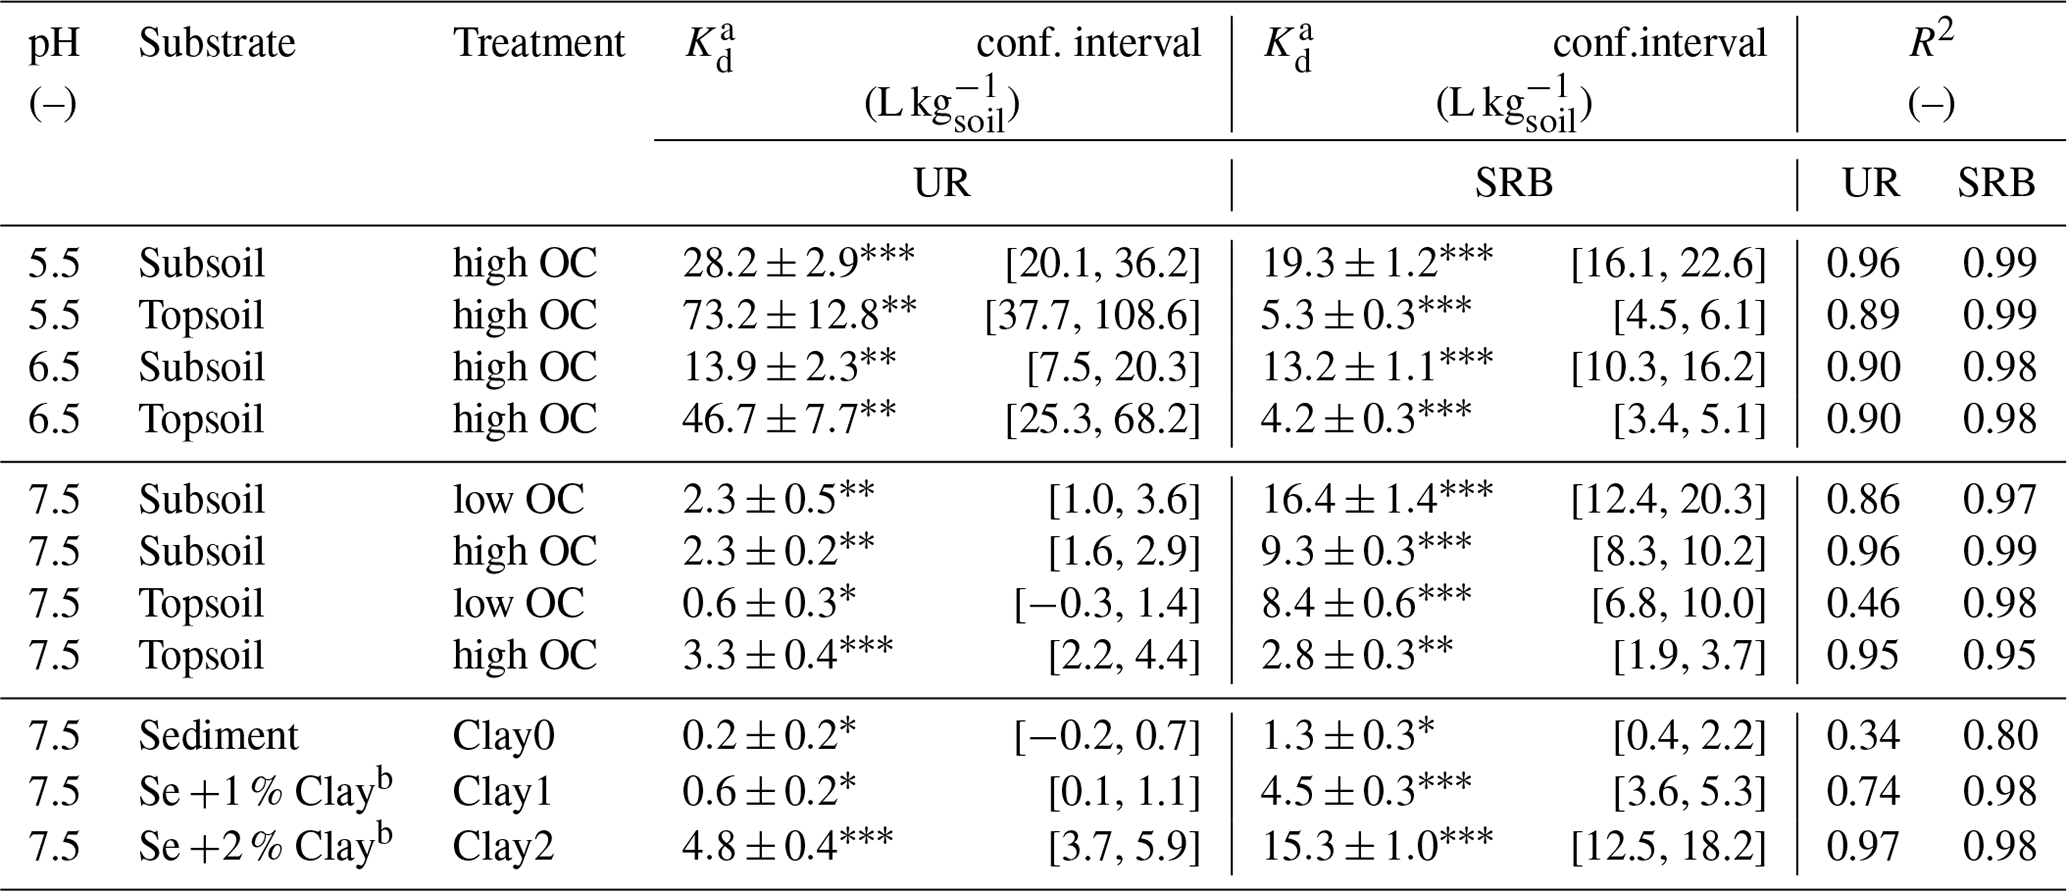
a Kd values were determined by linear regression and are presented ± standard error. b Addition of 1 % or 2 % of the clay mineral montmorillonite.
Significance levels of Kd values: ; ; .
At pH 5.5 and 6.5, the adsorption of UR was much higher in the topsoil than in the subsoil (Fig. 3). This difference vanished at pH 7.5. Assuming that the OM content is the main difference between topsoil and subsoil, we can conclude that the influence of OM on the adsorption of UR is higher in more acidic soils. An explanation could be the following: at pH 7.5 most variable charged sorption places in the soil are negatively charged and the adsorption of UR depends only slightly on the content of OM. In contrast, a large part of the variable charged sorption places are protonated and available for UR adsorption at pH 5.5. In this case, UR adsorption distinctly depends on the OM content.
In our experiments, we observed much higher Kd values (max. 73.2±12.8 L kg−1, Table 4) than other researchers reported before (max. approximately 10 L kg−1 measured e.g. by Sabatini, 2000 or Dollinger et al., 2017). The reason is that, in the past, UR was mainly used as a conservative tracer, i.e. under conditions where UR did not show adsorption (high pH, sandy texture). However, if we use UR in a multi-tracer approach to mimic the (sorption) behaviour of similar substances, we could use its sorption properties.
3.2.2 Sorption of SRB
In contrast to UR, the adsorption of SRB in topsoil and subsoil decreased only slightly with increasing pH (Figs. 2, 3). This observation can be explained by its two sulfonic groups that are negatively charged at pH values above 1.5 and one positive charge (Kasnavia et al., 1999). Therefore, the charge of SRB does not change over a wide range of pH values. Furthermore, Polat et al. (2011) have shown that SRB is an amphiphilic molecule, which means that the molecule possesses both hydrophilic and hydrophobic properties. Consequently, SRB has a complex sorption behaviour and is attracted by a wide range of surfaces, including hydrophobic and negatively or positively charged surfaces. This results in a low pH dependence of SRB adsorption.
3.2.3 Comparison of sorption of UR and SRB
The Kd value declined linearly with increasing pH (Fig. 3). This effect was more pronounced for UR than for SRB, indicating a stronger pH dependence of UR adsorption. We explain this observation by different functional groups of UR and SRB. The sulfonic groups of SRB have the same negative charge over a wide range of pH due to its low pKa value (pKa<1.5, Kasnavia et al., 1999), while the carboxyl and hydroxyl groups of UR become more negatively charged with increasing pH due to deprotonation (Zanker and Peter, 1958). Therefore, we assume that UR adsorption increasingly happens through hydrophobic interactions with OM when the pH decreases, but not for SRB because its functional group remains negatively charged. This observation could be a hint that the variations in molecular charge in the sorbant with changing pH are much more important than that of the adsorbing surfaces in the soil.
3.3 Influence of OC content
3.3.1 Sorption of UR
In both subsoil treatments and the untreated topsoil, approx. 35 % of UR was adsorbed, which corresponded to Kd values of 2.3±0.5–3.3±0.4 L kg−1 (Figs. 4 and 5; data can be found in the Supplement: Tables S2, S3 and S4). These Kd values are in accordance with those of other researchers who worked with similar substrates under comparable conditions (Table 1). For example, Dollinger et al. (2017) calculated Kd values of 1–5 L kg−1 for UR adsorption in soil samples with 19 %–29 % clay, with 1 %–5 % OC at pH above 8.0. Moreover, these results also suggest a low dependence of UR adsorption on OM at pH 7.5. Hence, we assume that it is not the number of sorption sites that controls the adsorption of UR, but the electrochemical repulsion of UR by negatively charged sorbents.

Figure 4Sorption isotherms for UR and SRB in topsoil (brown), subsoil (yellow) and sediment (grey) under different OC (filled symbols) and clay (open symbols) conditions. The high OC treatments (square) represent the untreated samples, low OC (circle) the H2O2-treated samples. Clay0 (down-pointed triangle) represents the sediment without clay addition, and Clay1 (diamond) and Clay2 (up-pointed triangle) are sediment plus 1 % and 2 % clay addition. The error bars represent the standard deviation of the tracer concentration measured in solution (csolution) and the calculated content of the adsorbed tracer (qadsorbed) (n=3). Note the different concentration ranges of UR and SRB. The transparent areas around the regression lines represent the 95 %-confidence intervals.

Figure 5Kd values as function of OC (%) for UR (triangles) and SRB (circles) in topsoil (filled symbols) and subsoil (open symbols). For each tracer and type of substrate (topsoil or subsoil) the Kd value at a lower OC value results from the H2O2 treatment. The error bars represent the standard errors of Kd values from linear regression.
Nevertheless, despite mainly negative sorption sites, almost one-third of UR was adsorbed at pH 7.5. Under these conditions, adsorption potentially took place by cation bridges (e.g. by Ca2+ ions) between the negative functional groups of OM and the UR molecule (Guggenberger and Kaiser, 2003; Schaumann and Thiele-Bruhn, 2011) or took place on positively charged metal oxides. More or less organic sorption sites thus do not crucially influence the sorption behaviour of UR. At first sight, these observations contradict findings of other researchers. Dollinger et al. (2017) found that adsorption of UR mainly depends on OC content and pH, and Smart and Laidlaw (1977) also found increasing UR adsorption with increasing humus concentration. However, as both studies did not control the pH, their findings may have been influenced by low pH rather than by increased OC content.
In the H2O2-treated topsoil UR adsorption was 3 times lower than in the other treatments (Kd value of 0.6±0.3 L kg−1, Fig. 5). This result might be attributed to sample treatment. H2O2 did not oxidise the entire OC to CO2, but produced a number of smaller organic molecules (Mikutta et al., 2005) that remained in the soil pores as indicated by higher DOC concentrations (Table 2). These small organic molecules competed with UR for sorption sites and reduced overall UR adsorption.
3.3.2 Sorption of SRB
In contrast to UR, Kd values of SRB decreased monotonically with increasing OC content from 16.4±1.4 L kg−1 at 0.1 % OC to 2.8±0.3 L kg−1 at 2.7 % OC (Figs. 4 and 5), which corresponded to a 50% reduction of adsorption from 83 % to 40 %. Only at the highest OC content were SRB and UR adsorptions similar. Furthermore, we measured stronger SRB adsorption in the subsoil than in the topsoil at all pH values (Fig. 2), as was also observed by Vanderborght et al. (2002). Based on this result, we assume that SRB adsorption mainly took place in the mineral phase, e.g. on metal oxides and hydroxides that are positively charged due to their high point of zero charge (PZC) (Cornell and Schwertmann, 2003). Coating of mineral surfaces by organic substances reduced mineral sorption places and therefore positively charged sorption sites that led to a reduced adsorption of SRB. This result is in accordance with findings of Smart and Laidlaw (1977), who observed lower SRB adsorption on organic rather than mineral surfaces. When solute retention is determined by adsorption and not by transport processes (like preferential flow) and transport-related properties (i.e. porosity), results from batch and column experiments with similar soils are comparable. In contrast to our results, Albrecht et al. (2003) found higher Kd values for SRB adsorption in the upper horizon (9.1 L kg−1) than in the lower horizon (4.4 L kg−1). However, these results are probably related not only to the OC content, which changed only slightly from top to bottom, but also to the texture, which became much coarser from the upper to lower horizons. Furthermore, the results from our batch experiment are in accordance with results from column experiments in Durst et al. (2013). They used a silty sediment with an high OC content of 5.2 % at pH 7.5 and also calculated a relatively low Kd value of 3.2 L kg−1 for SRB adsorption (Table 1). However, decreasing adsorption of SRB with increasing OC content has not been reported before.
3.4 Influence of clay content
3.4.1 Sorption of UR
UR adsorption in the sediment samples without clay addition (Clay0) was minimal (Figs. 4 and 6; data can be found in the Supplement: Tables S2, S3 and S4). This minimal adsorption tendency of UR at low clay content (and simultaneous low OC, oxide and hydroxide content) was likely caused by the lack of sorption places and by repulsive forces due to negative charges of the sand particles and the UR molecule. This has been observed by many other researchers (e.g. Smart and Laidlaw, 1977; Hadi et al., 1997; Kasnavia et al., 1999; Sabatini, 2000) and is the reason why UR is generally assumed to be a conservative tracer in groundwater studies (e.g. Leibundgut et al., 2009).
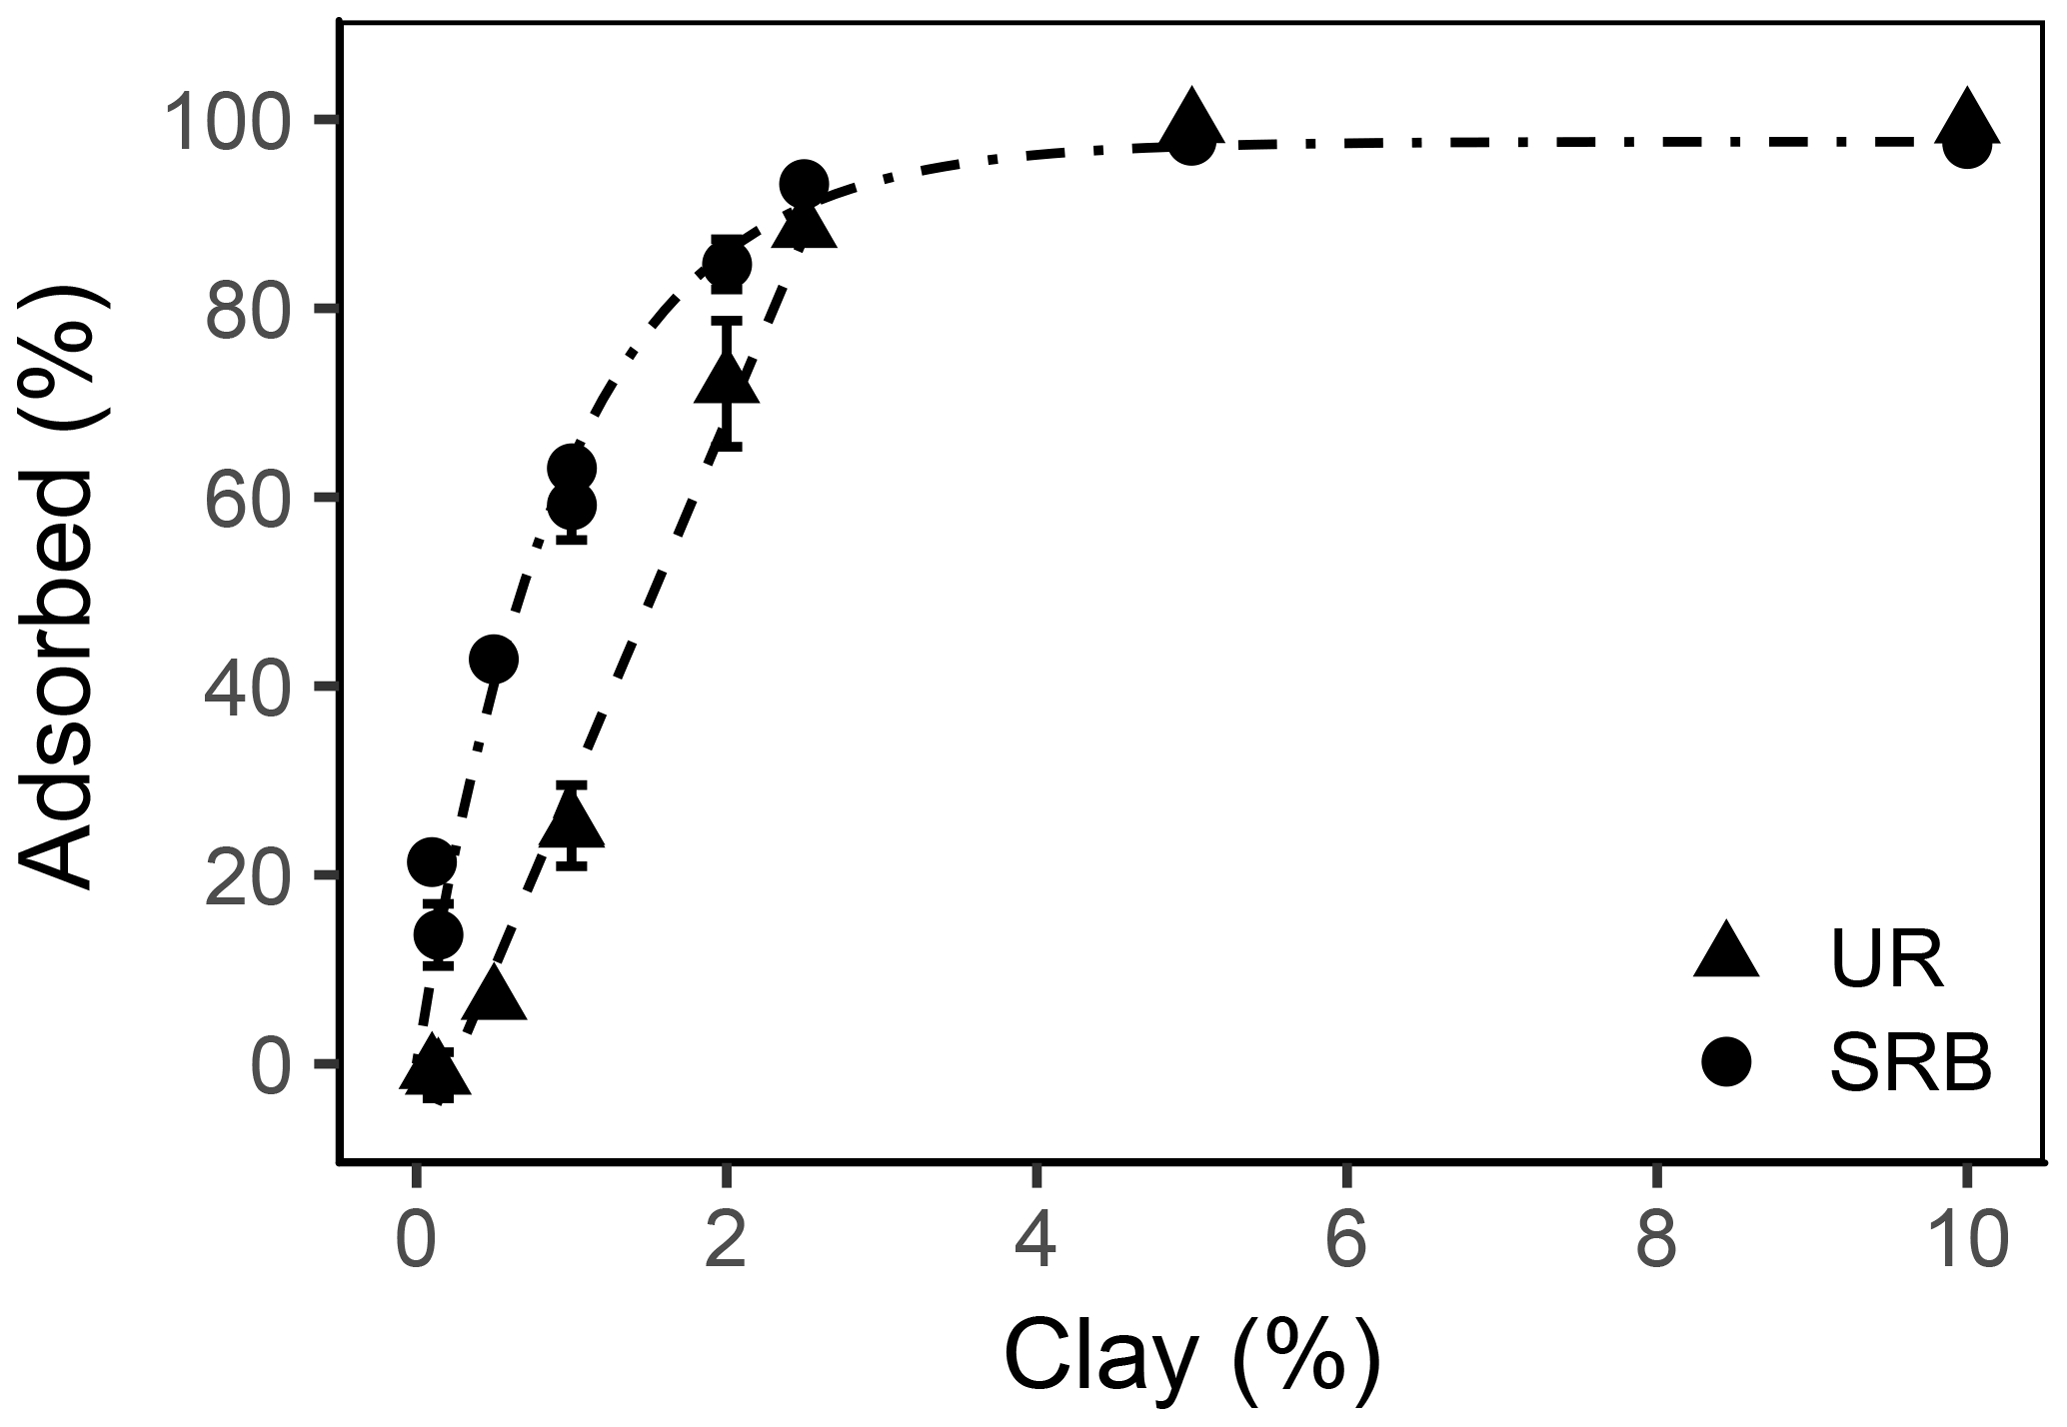
Figure 6Adsorbed percentage as a function of the clay content for UR (triangles) and SRB (circles) in the sediment (n=18 for data points at 0.14 %, 1 % and 2 % clay addition and n=1 for all other data points). The error bars represent the standard deviation. The dashed line is the linear regression line of UR adsorption and the dot-dashed line is the exponential regression line of SRB adsorption.
However, adsorption of UR increased linearly with clay content (, r2=0.988) and reached 100 % adsorbed tracer until 2.5 % clay addition (Fig. 6). In general, more clay leads to higher adsorption due to the increase in SSA. In our samples the SSA increased from 1.1 m2 g−1 in treatment Clay0 to 3.6 m2 g−1 and nearly doubled (6.1 m2 g−1) in treatment Clay2 (Table 2).
Not only the clay quantity and the SSA influenced adsorption of UR in our experiments; other effects may also play a role. That became apparent in the comparison between Kd values of the untreated subsoil (high OC) and that of the sediment with 2 % clay addition (Clay2). Although the untreated subsoil had 10 times the clay content (22.4 %) and 4 times the SSA (24 m2 g−1) than the sediment, its Kd value was only half (2.3±0.2 L kg−1, Table 4). This suggests that the type and composition of the clay fraction influenced UR adsorption. In our batch experiments, we used the clay mineral montmorillonite with a very high specific surface (249 m2 g−1). The soil contained a mix of clay minerals that probably had fewer total or less accessible sorption places than the fresh montmorillonite. The pores of the topsoil clay fraction could be clogged by organic matter (Mikutta et al., 2006a, b) and, thus, be less accessible than those of the fresh clay mineral montmorillonite.
3.4.2 Sorption of SRB
SRB only slightly adsorbed to the sediment without clay addition (Clay0, Figs. 4 and 6) due to the lack of sorption places. With increasing clay addition, the fraction of adsorbed SRB increased exponentially () and reached nearly 100 % at 3 % clay content. This result is in accordance with Dollinger et al. (2017), who concluded that SRB adsorption is strongly correlated with clay content. In contrast to UR, the adsorption of SRB in relation to clay content increased faster, which potentially could be explained by its higher affinity for mineral surfaces, as also observed by Smart and Laidlaw (1977).
As with UR, the quality of clay affected the adsorption of SRB. SRB adsorption in treatments Clay2 and topsoil compared to adsorption in treatments with low OC at pH 7.5 (Figs. 5 and 6) showed similar SRB adsorption (approx. 80 %), although the clay content differs by a factor of 10 (Table 2). A different composition of the clay fraction of the topsoil in comparison to the fresh montmorillonite can also explain these results.
3.5 Limitations of KOC values
The most import assumptions for the calculation of KOC values are (i) that the main sorption of the target substance occurs on OM and (ii) that adsorption mainly occurs by nonpolar interactions (OECD, 2000). Hence, the sorption mechanism should mainly be simple partitioning between the liquid and organic phases. The U.S. Environmental Protection Agency (1999) listed further limitations of the KOC concept, including an organic fraction (fOC) between 1 % and 20 % and that the content of swelling clays like montmorillonite has to be low. Due to their KOW values (Table 3) and their charged functional groups, UR and SRB can be regarded as more polar tracers. This was also demonstrated by this study and by Kasnavia et al. (1999), who calculated KOW values, found a strong pH dependence for both tracers, and reported a high hydrophobicity for UR. Therefore, we expect polar sorption interactions like electrochemical interactions and ligand exchange and also adsorption on mineral surfaces rather than partitioning between the liquid and organic phases. A calculation of KOC values from our data would thus be inappropriate. For example, increasing KOC values for both tracers would have been calculated for the sediment treatments with rising clay content, although the content of OM – and adsorption to OM – did not change. The adsorption of the tracers was instead related to more abundant adsorbing mineral surfaces of the clay mineral montmorillonite. Moreover, a decreasing KOC value with rising pH can be expected due to increasing repulsive forces between negative functional groups of tracers and sorbents. In both cases, a parameter other than the OM content would lead to different KOC values. Hence, KOC values should be regarded as inappropriate parameters to describe or compare adsorption characteristics of UR and SRB.
Overall, our systematic batch experiments indicated that increasing clay content led to a strong increase in adsorption of both UR and SRB. In contrast, higher OM contents mainly caused lower adsorption of SRB and had only a small effect on UR (Fig. 7). Increased pH led to increased adsorption of both tracers. Thus, we conclude that (i) adsorption of UR is mainly influenced by pH, while (ii) adsorption of SRB is mainly influenced by the quality of the substrate: positively by clay and negatively by OM. Furthermore, we conclude that (iii) SRB has a higher affinity for mineral surfaces and (iv) UR has a higher affinity for organic surfaces, especially at low pH values. Moreover, KOC values should not be used to characterise the sorption of polar fluorescent tracers.
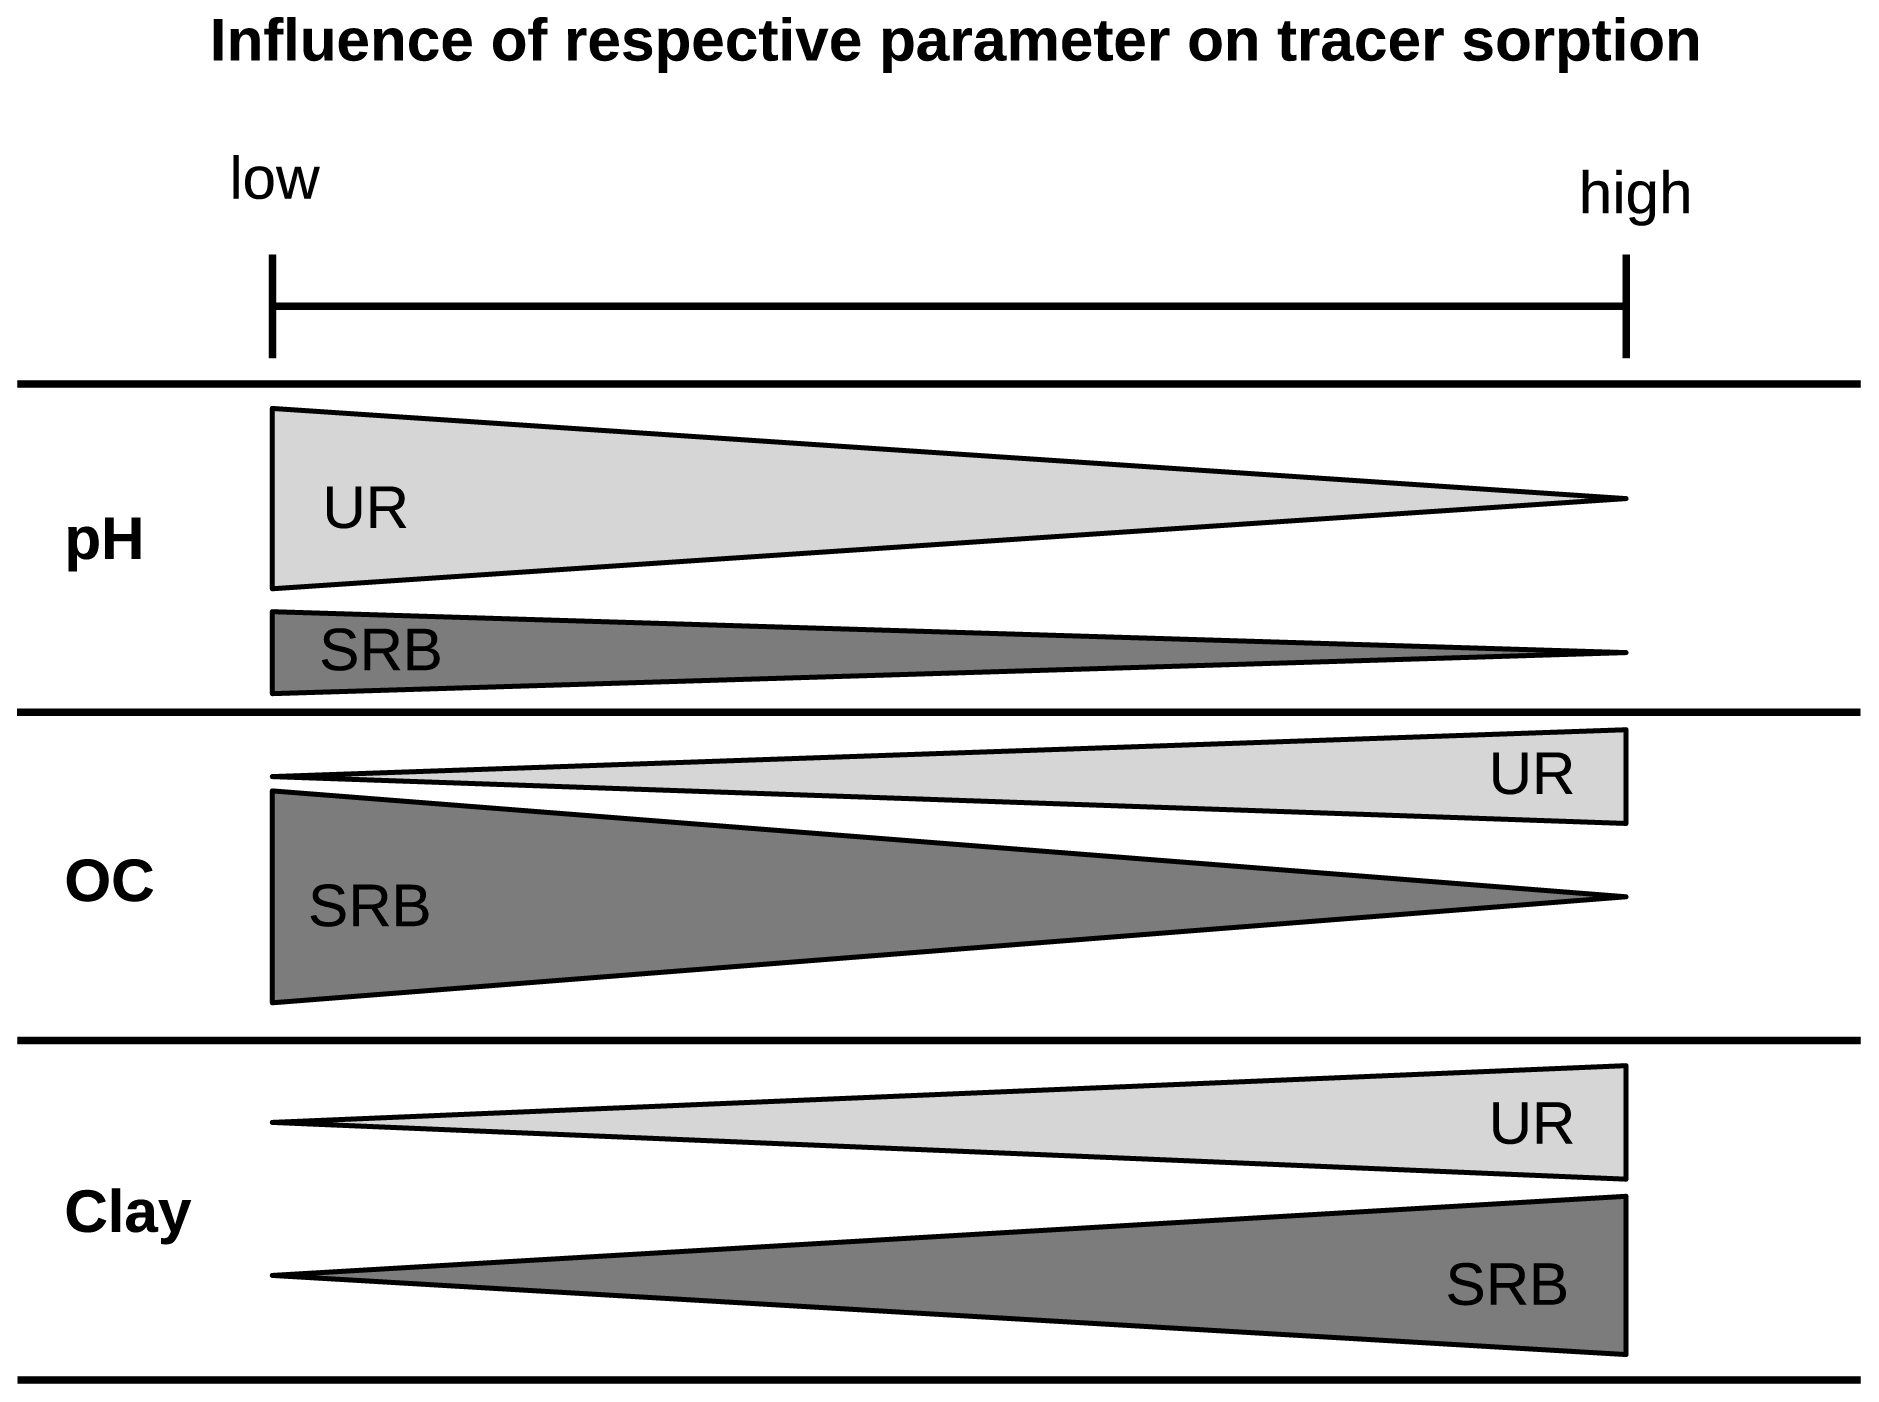
Figure 7Schematic figure of the influence of the parameters OC, clay and pH on the adsorption of the fluorescent tracers UR and SRB. The width of the bars represents the measure of sorption and “low” and “high” refer to the soil properties.
From our experiments no general assumptions can be derived regarding the comparative sorption strength or mobility of the tracers in a given soil. Rather, the conditions under which they are used have to be specified. Only then does a statement like “SRB is more sorptive than UR” have validity. Due to the complex adsorption behaviour of UR and SRB in soils and sediments, it will be difficult to find a suitable tracer to completely mimic the sorption characteristics of a specific organic pollutant. Nevertheless, this approach is promising if organic pollutants are classified into larger groups with similar properties and if tracers are identified representing the sorption and transport of these groups. The potential benefits of such a cheaper, faster and easier-to-operate approach for first approximations of the environmental fate of organic pollutants make further experiments worthwhile. Our analyses stress the substrate dependence of tracer substances and help standardise procedures to characterise and evaluate the tracer capacities of fluorescent substances for use in specific substrates.
Measured concentration data are provided in Tables S1 to S4 in the Supplement and calculated Kd values are listed in Table 4.
The supplement related to this article is available online at: https://doi.org/10.5194/hess-24-977-2020-supplement.
MB investigated, analysed, validated and visualised the measured data and wrote the original draft. MB, JL, MGR and FL were responsible for the conceptualisation and methodology and were involved in the editing and revision of the manuscript. JL, MGR and FL acquired the funding. JL was responsible for project administration.
The authors declare that they have no conflict of interest.
We thank Lars Best and especially Stefanie Bittner for their extraordinary support during the extensive laboratory analysis. Furthermore, we thank Kenton Stutz for his detailed and very helpful linguistic and technical corrections of the manuscript.
This research has been supported by the Federal Ministry of Education and Research (BMBF) (grant no. 02WRM1366B). The article processing charge was funded by the German Research Foundation (DFG) and the University of Freiburg in the Open Access Publishing funding programme.
This paper was edited by Roberto Greco and reviewed by two anonymous referees.
Albrecht, A., Schultze, U., Bugallo, P., Wydler, H., Frossard, E., and Flühler, H.: Behavior of a surface applied radionuclide and a dye tracer in structured and repacked soil monoliths, J. Environ. Radioactiv., 68, 47–64, https://doi.org/10.1016/S0265-931X(03)00029-8, 2003. a, b
Basabe-Desmonts, L., Reinhoudt, D. N., and Crego-Calama, M.: Design of fluorescent materials for chemical sensing, Chem. Soc. Rev., 36, 993–1017, https://doi.org/10.1039/b609548h, 2007. a
Bisutti, I., Hilke, I., and Raessler, M.: Determination of total organic carbon – an overview of current methods, TrAC-Trend. Anal. Chem., 23, 716–726, https://doi.org/10.1016/j.trac.2004.09.003, 2004. a
Blume, H.-P., Brümmer, G. W., Fleige, H., Horn, R., Kandeler, E., Kögel-Knabner, I., Kretzschmar, R., Stahr, K., and Wilke, B.-M.: Scheffer/Schachtschabel Soil Science, Springer Berlin Heidelberg, Berlin, Heidelberg, https://doi.org/10.1007/978-3-642-30942-7, 2016. a
Boxall, A. B., Blackwell, P., Cavallo, R., Kay, P., and Tolls, J.: The sorption and transport of a sulphonamide antibiotic in soil systems, Toxicol. Lett., 131, 19–28, https://doi.org/10.1016/S0378-4274(02)00063-2, 2002. a
Brunauer, S., Emmett, P. H., and Teller, E.: Adsorption of Gases in Multimolecular Layers, J. Am. Chem. Soc., 60, 309–319, https://doi.org/10.1021/ja01269a023, 1938. a
Cornell, R. M. and Schwertmann, U.: The iron oxides: Structure, properties, reactions, occurences and uses, Wiley-VCH, Weinheim, Germany and Cambridge, UK, 2nd edn., 2003. a, b
de Brogniez, D., Ballabio, C., Stevens, A., Jones, R. J. A., Montanarella, L., and van Wesemael, B.: A map of the topsoil organic carbon content of Europe generated by a generalized additive model, Eur. J. Soil Sci., 66, 121–134, https://doi.org/10.1111/ejss.12193, 2015. a
Dervey, A.: Beitrag zum Sorptionsverhalten von Fluoreszenztracern: Pubplikation Gewässerkunde, 63, Diploma thesis, University of Bern, Bern, Switzerland, 1985. a
Dollinger, J., Dages, C., and Voltz, M.: Using fluorescent dyes as proxies to study herbicide removal by sorption in buffer zones, Environmental Science And Pollution Research International, 24, 11752–11763, https://doi.org/10.1007/s11356-017-8703-4, 2017. a, b, c, d, e, f, g, h
Durst, R., Imfeld, G., and Lange, J.: Transport of pesticides and artificial tracers in vertical-flow lab-scale wetlands, Water Resour. Res., 49, 554–564, 2013. a, b, c, d, e
Feller, C., Schouller, E., Fabien, T., Rouiller, J., and Herbillon, A. J.: N2-BET specific surface areas of some low activity clay soils and their relationships with secondary constituents and organic matter contents, Soil Sci., 153, 293–299, https://doi.org/10.1097/00010694-199204000-00005, 1992. a
Fernández-Pascual, E., Zaman, S., Bork, M., Lang, F., and Lange, J.: Long-term mesocosm experiments to investigate degradation of fluorescent tracers, J. Hydrol., 2, 100014, https://doi.org/10.1016/j.hydroa.2018.100014, 2018. a
Flury, M. and Wai, N. N.: Dyes as tracers for vadose zone hydrology, Rev. Geophys., 41, 1, https://doi.org/10.1029/2001RG000109, 2003. a, b, c
Gee, G. W. and Or, D.: Particle-size analysis, in: Methods of Soil Analysis: Part 4 Physical Methods, edited by: Dane, J. H. and Topp, C. G., vol. 5 of SSSA Book Series, 255–293, Soil Science Society of America, Madison, Wisconsin, USA, 2002. a
Giepmans, B. N. G., Adams, S. R., Ellisman, M. H., and Tsien, R. Y.: The fluorescent toolbox for assessing protein location and function, Science, 312, 217–224, https://doi.org/10.1126/science.1124618, 2006. a
Gonçalves, M. S. T.: Fluorescent labeling of biomolecules with organic probes, Chem. Rev., 109, 190–212, https://doi.org/10.1021/cr0783840, 2009. a
Guggenberger, G. and Kaiser, K.: Dissolved organic matter in soil: Challenging the paradigm of sorptive preservation, Geoderma, 113, 293–310, https://doi.org/10.1016/S0016-7061(02)00366-X, 2003. a
Gutowski, L., Olsson, O., Lange, J., and Kümmerer, K.: Photolytic transformation products and biological stability of the hydrological tracer Uranine, Sci. Total Environ., 533, 446–453, https://doi.org/10.1016/j.scitotenv.2015.07.002, 2015. a
Hadi, S., Leibundgut, C., Friedrich, K., and Maloszewski, P.: New fluorescent tracers, in: Tracer hydrology 97, edited by: Kranjc, A., Balkema, Rotterdam, the Netherlands, 1997. a, b
Hillebrand, O., Nödler, K., Sauter, M., and Licha, T.: Multitracer experiment to evaluate the attenuation of selected organic micropollutants in a karst aquifer, Sci. Total Environ., 506–507, 338–343, https://doi.org/10.1016/j.scitotenv.2014.10.102, 2015. a
Kaiser, K. and Zech, W.: Dissolved organic matter sorption by mineral constituents of subsoil clay fractions, J. Plant Nutr. Soil Sc., 163, 531–535, 2000. a
Kasnavia, T., Vu, D., and Sabatini, D. A.: Fluorescent Dye and Media Properties Affecting Sorption and Tracer Selection, Ground Water, 37, 376–381, https://doi.org/10.1111/j.1745-6584.1999.tb01114.x, 1999. a, b, c, d, e, f
Keefe, S. H., Barber, L. B., Runkel, R. L., Ryan, J. N., McKnight, D. M., and Wass, R. D.: Conservative and reactive solute transport in constructed wetlands, Water Resour. Res., 40, W01201, https://doi.org/10.1029/2003WR002130, 2004. a
Lange, J., Schuetz, T., Gregoire, C., Elsässer, D., Schulz, R., Passeport, E., and Tournebize, J.: Multi-tracer experiments to characterise contaminant mitigation capacities for different types of artificial wetlands, Int. J. Environ. An. Ch., 91, 768–785, https://doi.org/10.1080/03067319.2010.525635, 2011. a, b, c
Leibundgut, C., Maloszewski, P., and Klls, C.: Tracers in Hydrology, John Wiley & Sons, Ltd, Chichester, UK, 2009. a, b, c, d
Li, Z. and Psaltis, D.: Optofluidic dye lasers, Microfluid. Nanofluid., 4, 145–158, https://doi.org/10.1007/s10404-007-0225-9, 2008. a
Mägdefessel, J.: Zum Fliessverhalten von Tracern und Schadstoffen im Porengrundwasser, Diploma thesis, University of Freiburg, Freiburg i. Br., Germany, 1990. a, b
Maillard, E., Lange, J., Schreiber, S., Dollinger, J., Herbstritt, B., Millet, M., and Imfeld, G.: Dissipation of hydrological tracers and the herbicide S-matolachlor in batch and continuous-flow wetlands, Chemosphere, 144, 2489–2496, https://doi.org/10.1016/j.chemosphere.2015.11.027, 2016. a
Mehra, O. P. and Jackson, M. L.: Iron Oxide Removal from Soils and Clays by a Dithionite-Citrate System Buffered with Sodium Bicarbonate, Clay. Clay Miner., 7, 317–327, https://doi.org/10.1346/CCMN.1958.0070122, 1958. a
Mikutta, C., Lang, F., and Kaupenjohann, M.: Citrate impairs the micropore diffusion of phosphate into pure and C-coated goethite, Geochim. Cosmochim. Ac., 70, 595–607, https://doi.org/10.1016/j.gca.2005.10.032, 2006a. a, b
Mikutta, C., Krüger, J., Lang, F., and Kaupenjohann, M.: Acid Polysaccharide Coatings on Microporous Goethites, Soil Sci. Soc. Am. J., 70, 1547, https://doi.org/10.2136/sssaj2005.0340, 2006b. a, b
Mikutta, R., Kleber, M., Kaiser, K., and Jahn, R.: Review: Organic Matter Removal from Soils using Hydrogen Peroxide, Sodium Hypochlorite, and Disodium Peroxodisulfate, Soil Sci. Soc. Am. J., 69, 120–135, https://doi.org/10.2136/sssaj2005.0120, 2005. a
OECD: OECD Guideline for the testing of chemicals 106: Adsorption – Desorption Using a Batch Equilibrium Method, Paris, France, https://doi.org/10.1787/9789264069602-en, 2000. a, b, c, d
Omoti, U. and Wild, A.: Use of fluorescent dyes to mark the pathways of solute movement through soils under leaching conditions: 1. Laboratory experiments, Soil Sci., 128, 28–33, 1979a. a, b
Omoti, U. and Wild, A.: Use of fluorescent dyes to mark the pathways of solute movement through soils under leaching conditions: 2. Field experiments, Soil Sci., 128, 98–104, 1979b. a
Passeport, E., Tournebize, J., Jankowfsky, S., Prömse, B., Chaumont, C., Coquet, Y., and Lange, J.: Artificial Wetland and Forest Buffer Zone: Hydraulic and Tracer Characterization, Vadose Zone J., 9, 73–84, https://doi.org/10.2136/vzj2008.0164, 2010. a, b
Peterson, C.: pH Dependence and Unsuitability of Fluorescein Dye as a Tracer for Pesticide Mobility Studies in Acid Soil, Water Air Soil Poll., 209, 473–481, https://doi.org/10.1007/s11270-009-0215-5, 2010. a
Polat, B. E., Lin, S., Mendenhall, J. D., VanVeller, B., Langer, R., and Blankschtein, D.: Experimental and molecular dynamics investigation into the amphiphilic nature of sulforhodamine B, J. Phys. Chem. B, 115, 1394–1402, https://doi.org/10.1021/jp109866q, 2011. a
R Development Core Team: R: A Language and Environment for Statistical Computing, available at: http://www.R-project.org (last access: 26 February 2020), 2008. a, b
Resch-Genger, U., Grabolle, M., Cavaliere-Jaricot, S., Nitschke, R., and Nann, T.: Quantum dots versus organic dyes as fluorescent labels, Nat. Methods, 5, 763–775, https://doi.org/10.1038/NMETH.1248, 2008. a
Sabatini, D. A.: Sorption and Intraparticle Diffusion of Fluorescent Dyes with Consolidated Aquifer Media, Ground Water, 38, 651–656, https://doi.org/10.1111/j.1745-6584.2000.tb02700.x, 2000. a, b, c, d, e, f
Sabatini, D. A. and Austin, T. A. I.: Characteristics of Rhodamine WT and Fluorescein as Adsorbing Ground-Water Tracers, Ground Water, 29, 341–349, https://doi.org/10.1111/j.1745-6584.1991.tb00524.x, 1991. a, b, c, d, e
Schaumann, G. E. and Thiele-Bruhn, S.: Molecular modeling of soil organic matter: Squaring the circle?, Geoderma, 166, 1–14, https://doi.org/10.1016/j.geoderma.2011.04.024, 2011. a
Schuetz, T., Weiler, M., and Lange, J.: Multitracer assessment of wetland succession: Effects on conservative and nonconservative transport processes, Water Resour. Res., 48, W06538, https://doi.org/10.1029/2011WR011292, 2012. a, b
Schwarzenbach, R. P., Gschwend, P. M., and Imboden, D. M.: Environmental Organic Chemistry, John Wiley & Sons, Inc, Hoboken, NJ, USA, https://doi.org/10.1002/0471649643, 2002. a
Schwertmann, U.: Differenzierung der Eisenoxide des Bodens durch Extraktion mit Ammoniumoxalat-Lösung, Z. Pflanz. Bodenkunde, 105, 194–202, https://doi.org/10.1002/jpln.3591050303, 1964. a
Scientific Committee on Consumer Products: Opinion on Acid Red 52, 24 June 2008, European Commision, Brussels, Belgium, 2008. a
Smart, P. L. and Laidlaw, I. M. S.: An evaluation of some fluorescent dyes for water tracing, Water Resour. Res., 13, 15–33, https://doi.org/10.1029/WR013i001p00015, 1977. a, b, c, d, e, f, g
Tahir, S. and Marschner, P.: Clay amendment to sandy soil—effect of clay concentration and ped size on nutrient dynamics after residue addition, J. Soil. Sediment., 16, 2072–2080, https://doi.org/10.1007/s11368-016-1406-5, 2016. a
U.S. Environmental Protection Agency: Understanding variation in partition coefficient, Kd, values, volume I: the Kd model, methods of measurement, and application of chemical reaction codes, Washington, D.C., USA, 1999. a, b
U.S. Environmental Protection Agency: Estimation Programs Interface Suite™ for Microsoft® Windows, v 4.11. United States Environmental Protection Agency, Washington, D.C., USA, 2012. a, b
Vanderborght, J., Gähwiller, P., and Flühler, H.: Identification of Transport Processes in Soil Cores Using Fluorescent Tracers, Soil Sci. Soc. Am. J., 66, 774–787, https://doi.org/10.2136/sssaj2002.0774, 2002. a, b, c
Wernli, H. R.: Naphtionat – ein neuer Fluoreszenztracer zur Wassermarkierung, Deutsche Gewässerkundliche Mitteilungen, 30, 16–19, 1986. a, b
Wernli, H. R.: Einführung in die Tracerhydrologie: Hydrologisches Praktikum, Institute of Geography, University of Bern, Bern, Switzerland, 2011. a
Wiseman, C. L. S. and Puttmann, W.: Soil organic carbon and its sorptive preservation in central Germany, Eur. J. Soil Sci., 56, 65–76, https://doi.org/10.1111/j.1351-0754.2004.00655.x, 2005. a
Zanker, V. and Peter, W.: Die prototropen Formen des Fluoresceins, Chem. Ber., 91, 572–580, https://doi.org/10.1002/cber.19580910316, 1958. a, b, c