the Creative Commons Attribution 4.0 License.
the Creative Commons Attribution 4.0 License.
 | 17 Dec 2020
Reservoir evaporation in a Mediterranean climate: comparing direct methods in Alqueva Reservoir, Portugal
Carlos Miranda Rodrigues
Madalena Moreira
Rita Cabral Guimarães
Miguel Potes
Alqueva Reservoir is one of the largest artificial lakes in Europe and is a strategic water storage for public supply, irrigation, and energy generation. The reservoir is integrated within the Multipurpose Alqueva Project (MAP), which includes almost 70 reservoirs in a water-scarce region of Portugal. The MAP contributes to sustainability in southern Portugal and has an important impact on the entire country. Evaporation is the key component of water loss from the reservoirs included in the MAP. Evaporation from Alqueva Reservoir has been estimated by indirect methods or pan evaporation measurements; however, specific experimental parameters such as the pan coefficient were never evaluated. Eddy covariance measurements were performed at Alqueva Reservoir from June to September in 2014 as this time of the year provides the most representative evaporation volume losses in a Mediterranean climate. This period is also the most important period for irrigated agriculture and is, therefore, the most problematic period of the year in terms of managing the reservoir. The direct pan evaporation approach was first tested, and the results were compared to the eddy covariance evaporation measurements. The total eddy covariance (EC) evaporation measured from June to September 2014 was 450.1 mm. The mean daily EC evaporation in June, July, August, and September was 3.7, 4.0, 4.5, and 2.5 mm d−1, respectively. A pan coefficient, Kpan, multivariable function was established on a daily scale using the identified governing factors: air temperature, relative humidity, wind speed, and incoming solar radiation. The correlation between the modelled evaporation and the measured EC evaporation had an R2 value of 0.7. The estimated Kpan values were 0.59, 0.57, 0.57, and 0.64 in June, July, August, and September, respectively. Consequently, the daily mean reservoir evaporation (ERes) was 3.9, 4.2, 4.5, and 2.7 mm d−1 for this 4-month period and the total modelled ERes was 455.8 mm. The developed Kpan function was validated for the same period in 2017 and yielded an R2 value of 0.68.
This study proposes an applicable method for calculating evaporation based on pan measurements in Alqueva Reservoir, and it can be used to support regional water management. Moreover, the methodology presented here could be applied to other reservoirs, and the developed equation could act as a first evaluation for the management of other Mediterranean reservoirs.
- Article
(3240 KB) - Full-text XML
- BibTeX
- EndNote


Reservoirs and water storage are essential in the Mediterranean region for securing urban and industrial water supply, irrigation, and energy generation due to the huge challenges presented by water scarcity in this region (Hoekstra et al., 2012; Alcon et al., 2017; Tomas-Burguera et al., 2017; Rivas-Tabares et al., 2019). Reservoir evaporation is one of the most important components of the water balance, and thus it should be accurately evaluated (Liu et al., 2016). This is particularly important in southern Europe as large investments have been made in the irrigation sector here. For instance, in southern Portugal, the Multipurpose Alqueva Project (MAP) with almost 70 reservoirs is the most important example of such an investment. The MAP contributes to sustainability in southern Portugal and has an important impact on the entire country. Alqueva Reservoir is the largest surface water reservoir in southern Europe, with a submerged area of 250 km2 and a total storage volume of 4150×106 m3 at full capacity. Each 10 mm of evaporation represents a water loss of 2.5×10⁶ m3, which is sufficient to irrigate almost 8.5 km2 of land containing olive trees and, therefore, corresponds to an estimated annual return of EUR 1.1 million.
The methodology of Kohli and Frenken (2015), used to estimate evaporation for artificial reservoirs, is based on crop evapotranspiration; it assumes a crop coefficient equal to 1.0, which means that reservoir evaporation is equal to the reference evapotranspiration. Most reservoir managers in the MAP estimate evaporation based on the reference evapotranspiration. Some water system managers use 1000 mm as the reservoir annual evaporation for simplification. In the case of Alqueva Reservoir, with an average reference evapotranspiration of ∼1270 mm yr−1 (calculated by the Penman–Montheith method), the evaporation can be 325×106 m3, or 10 % of the total usage volume. This means that the local water budget balance has to be well studied to guarantee the sustainability of this important upstream reservoir. An increased accuracy in the evaporation estimation for Alqueva Reservoir is required because of the projected increase in the irrigation area of the MAP and the importance of regional socio-economic development. A previous study on evaporation from Alqueva Reservoir used indirect methods, including the energy budget approach, aerodynamic methods, a combination of approaches, and a lake model (“FLAKE”) (Rodrigues, 2009). This work was based on measurements from a Class A evaporation pan, located on a floating platform in Alqueva Reservoir, between 2002 and 2006, and its comparison with evaporation values obtained by the energy budget approach to establish monthly pan coefficients. However, there has not been a systematic analysis of the governing factors relating to pan evaporation and reservoir evaporation in Alqueva Reservoir. Accordingly, the current study reports on direct evaporation measurements using eddy covariance (EC) equipment installed on the existing floating platform in Alqueva Reservoir, which is a part of the framework of the ALEX project (http://www.alex2014.cge.uevora.pt/, last access: 29 May 2020). Offshore measurements were conducted from June to September 2014, as this is the most representative period of the year for the evaporation volume in a Mediterranean climate, representing ∼60 % of the total reference evapotranspiration. This period is also very important for irrigation and is, therefore, the most problematic period of the year for the management of Alqueva Reservoir.
The turbulent fluxes over the water surface, which can be obtained with direct and continuous measurements, evaluate the exchange of water and energy between the surface and the atmosphere (Arya, 2001; Potes et al., 2017). The EC method is usually applied in research because it is a non-invasive technique and provides the most accurate and reliable method for estimating evaporation (Stull, 2001; Allen and Tasumi, 2005; Tanny et al., 2008; Rimmer et al., 2009). The method is theoretically based on the correlation between the vertical wind speed and air moisture content fluctuation and is a reliable and accurate method to measure open-water evaporation in a location where it is installed (Blanken et al., 2000; Tanny et al., 2008; Nordbo et al., 2011; Richardson et al., 2012; Vesala et al., 2012; Liu et al., 2015; Ning et al., 2015; Ma et al., 2016). However, it requires sophisticated instrumentation that is capable of accurately recording the minimum variations in wind speed, air temperature, and humidity with a high sampling frequency. Furthermore, the equipment is quite expensive and requires continuous maintenance, which means that it is not possible to perform regular measurements. Several studies using EC measurements to evaluate reservoir evaporation have been conducted in various places worldwide (Blanken et al., 2000; Nordbo et al., 2011; Zhang and Liu, 2014; Metzger et al., 2018; Jansen and Teuling, 2020). Another technique to estimate the actual reservoir evaporation based on direct measurements is the pan evaporation method (Riley, 1966). The World Meteorological Organization suggests pan evaporation as the standard method for measuring open-water evaporation (Gangopadhyaya, 1966). However, the relationship between evaporation and meteorological parameters in the pan and in open-water bodies differs. Pan measurements generally overestimate evaporation from large water bodies because, in contrast to a lake, a pan receives large quantities of energy through its base and sides and thus becomes much hotter than a lake. Moreover, the surface area of the water in the pan is much smaller than that of a lake, thus allowing a greater air renewal over the free surface (Jacobs et al., 1998; Lim et al., 2013; Yu et al., 2017). The measured pan evaporation rates are generally 30 % higher than that of lake evaporation at the annual scale. The monthly pan coefficients can differ from the commonly used coefficient of 0.7 by more than 100 % (Kohler et al., 1955; Linsley et al., 1982; Ferguson et al., 1985). It is expected that the relationship between pan evaporation and lake evaporation should be a function of meteorological parameters through the modelled Kpan. The pan evaporation method remains the cheapest and simplest method; hence, this evaporimeter remains the most commonly used instrument to quantify reservoir evaporation. The application of a pan coefficient to convert measured pan evaporation to reservoir evaporation is a method frequently applied in reservoir studies, and this pan coefficient could be calculated as a function of meteorological parameters (Allen et al., 1998; Pereira et al., 1995; Pradhan et al., 2013).
The Portuguese public company (Empresa de Desenvolvimento e Infraestruturas do Alqueva – EDIA) that is responsible for the construction and operation of the MAP has a meteorological station with a Class A evaporation pan. The parameterisation of a pan coefficient to convert the measured pan evaporation to reservoir evaporation would provide the MAP with an expeditious reservoir management tool.
Accordingly, the aims of this study were as follows: (i) to evaluate the actual evaporation rates from Alqueva Reservoir at the EC and Class A pan evaporation locations and to then analyse their variability with meteorological parameters (i.e. air temperature, relative humidity, wind speed, and radiation); (ii) to estimate the pan coefficient, Kpan, for the reservoir as an indirect multivariable function and assess the efficiency of pan evaporation in retrieving the evaporation component when EC measurements are unavailable. The study used daily data for the period from June to September 2014 and was validated using data from the same period in 2017.
The paper is organised as follows. Section 2 presents the measurement site, instrumentation, and data. The methodology used in this study is detailed in Sect. 3, and the results are presented and discussed in Sect. 4. Finally, Sect. 5 summarises the major conclusions.
2.1 Alqueva Reservoir
Alqueva Reservoir is located within the Guadiana River in Alentejo, southern Portugal (Fig. 1). The reservoir is the largest artificial lake in southern Europe (EDIA, 2020), with an average depth of 16.6 m and a maximum depth of 92.0 m at full capacity. The reservoir has a total capacity of 4150×106 m3 and a water surface area of 250 km2. Alqueva Reservoir is the upstream reservoir of the MAP, which supplies water to approximately 200 000 inhabitants, irrigates 1200 km2 (to be expanded to 1650 km2 in the near future), and has an installed hydroelectric power capacity of 530 MW. The Alqueva River basin covers 55 289 km2, and 85 % of the area is in Spain. The mean annual precipitation in the Alqueva River basin is less than 550 mm (in the Portuguese area) and the mean annual runoff at the border gauging station (Monte da Vinha station) is 23 mm. At the reservoir, the annual reference evapotranspiration is 1270 mm, as determined by the Food and Agriculture Organization (FAO) Penman–Monteith equation. More than 80 % of rainfall occurs between October and April, and during the summer the maximum air temperature ranges on average from 31 to 35 ∘C (July and August), often reaching values of >40 ∘C. The region is classified as a Csa region according to the Köppen climate classification, which corresponds to a Mediterranean climate (i.e. a temperate climate with dry, hot summers). The summer local time (LT) in Portugal is coordinated universal time (UTC)+1.
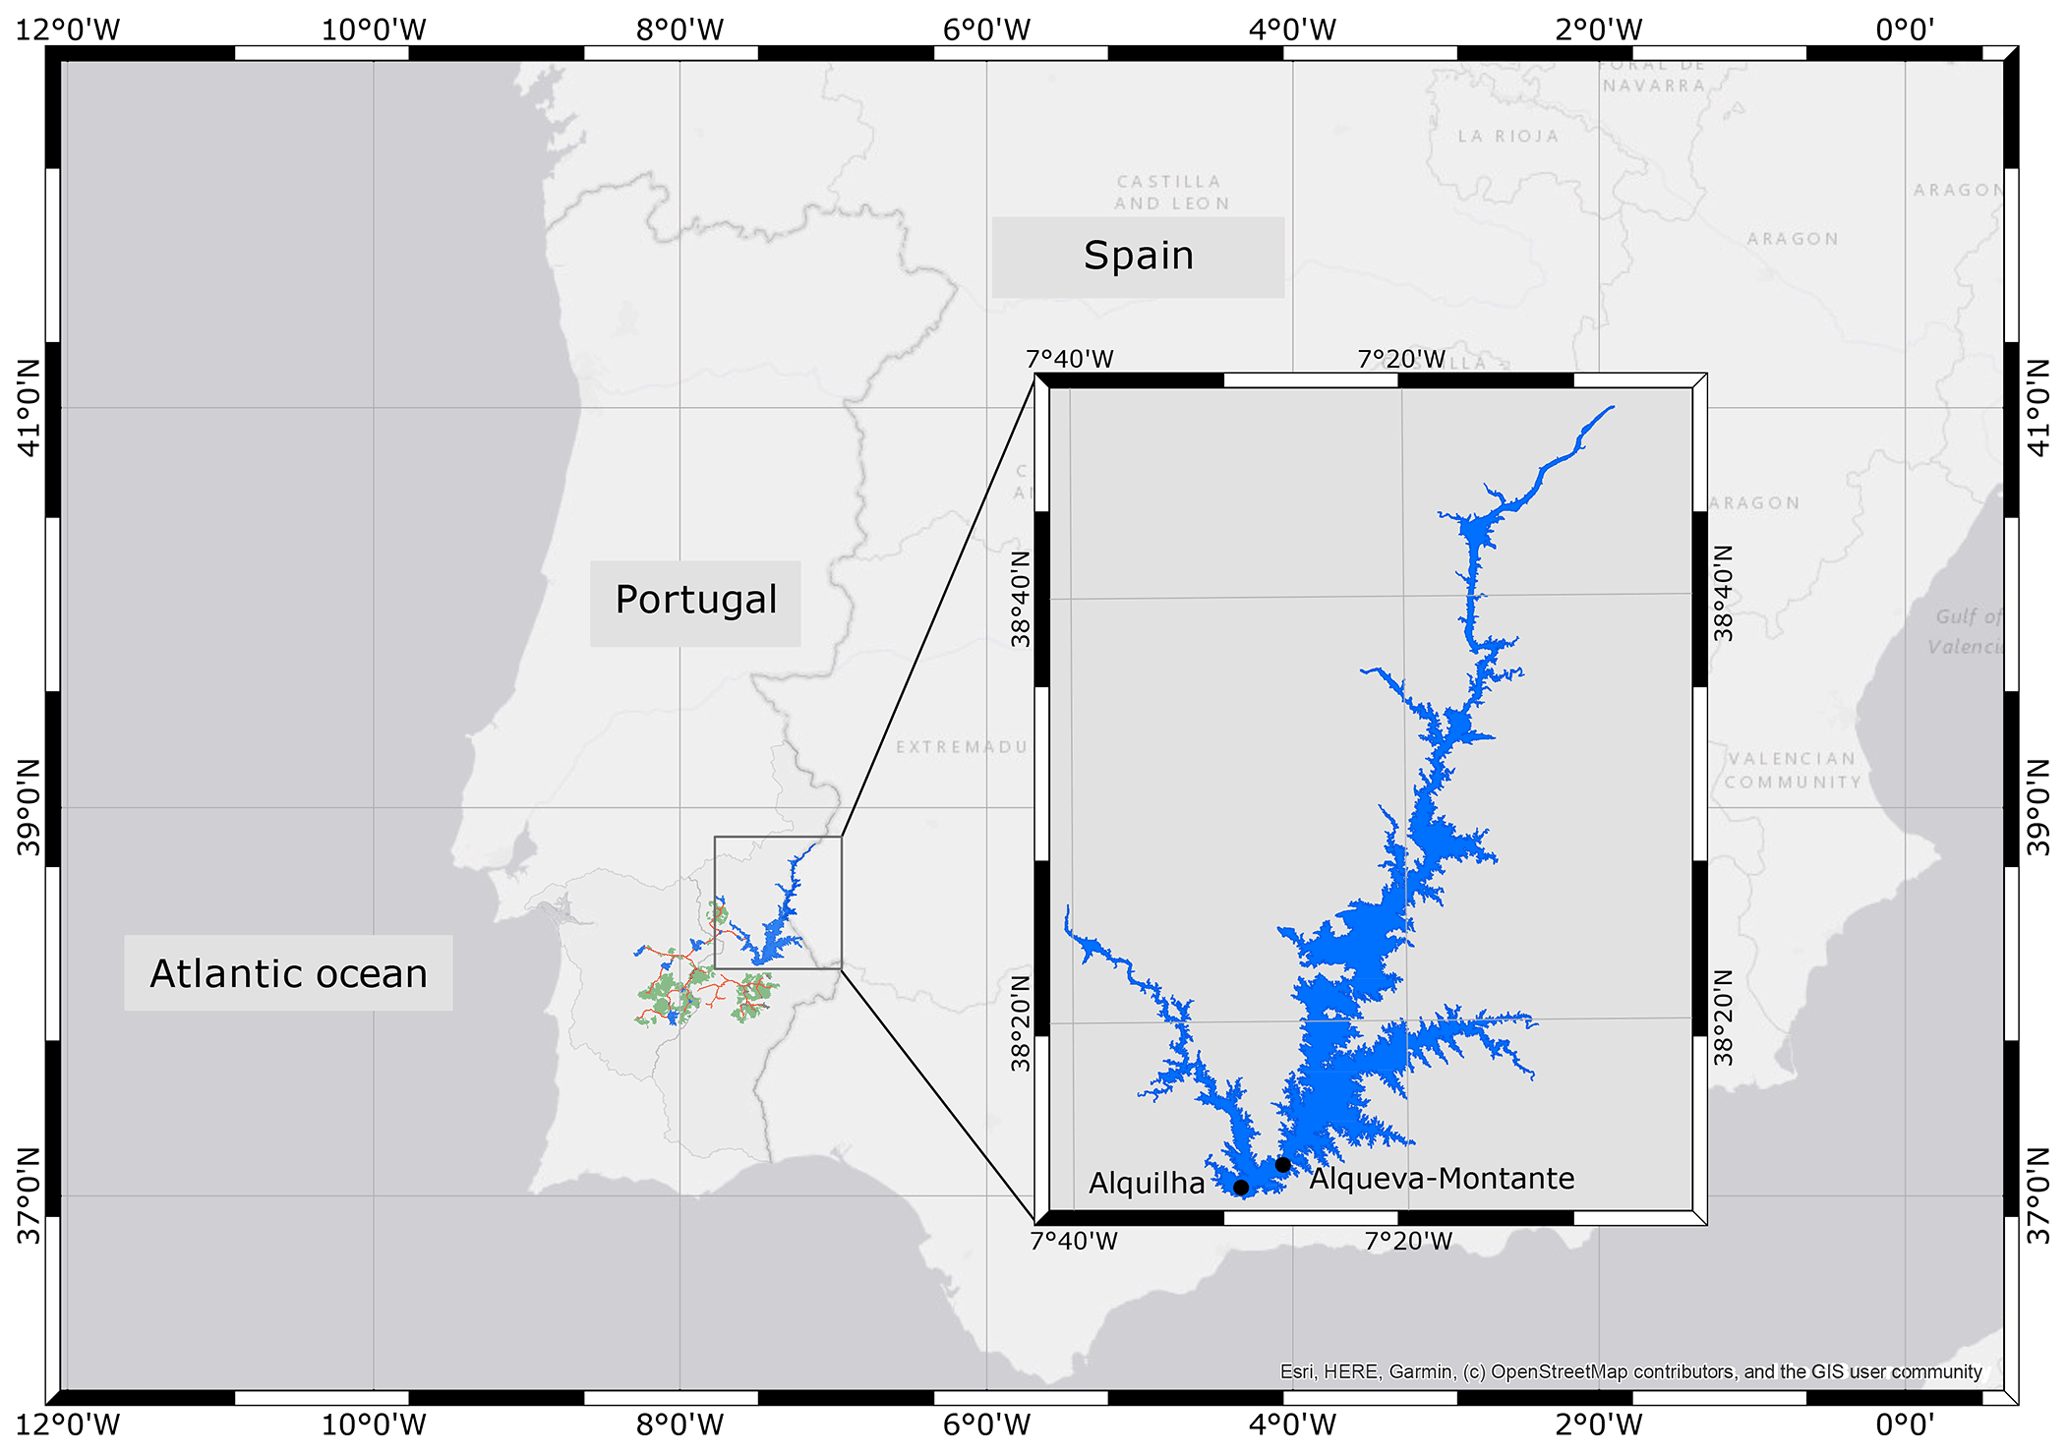
Figure 1Multipurpose Alqueva Project (MAP) location. The expanded map is of Alqueva Reservoir, showing two meteorological stations: Alquilha and Alqueva-Montante.
2.2 Instrumentation, data sources, and quality
2.2.1 Class A pan evaporation
Alquilha meteorological station (38∘13′22.80′′ N, 07∘30′03.60′′ W; elevation of 162 m) is located on the first island upstream of the dam (Fig. 1). The station is part of the environmental monitoring network of Alqueva Reservoir and is monitored by EDIA, which manages the MAP. The hourly weather variables measured at the station include rainfall (rain gauge: YOUNG/52202), air temperature and relative humidity (combined sensor: HYDROCLIP), wind speed (3 m above ground) and direction (anemometer and direction sensor: CLIMA), incoming solar radiation (irradiance sensor: IMTSolar/Si-01TCext), and water-level readings in a Class A pan (level sensor: Druck/1830). Considering the fact that the station is located on a small island within the reservoir, a very large water fetch upwind of the pan was accounted for this study. The hourly Class A pan evaporation was equal to the hourly level depletion, accounted for the rainfall effect, and discarded the 3 h period after each refill of the pan. The daily pan evaporation was calculated by considering the starting time water level, the ending time water level, and the upward (water out of the pan) and downward (water into the pan) water-level changes during a day. The values obtained when the water level in the pan was below a threshold value (10 cm), according to Allen et al. (1998) and WMO (2018), were discarded. Anomalous values were also discarded. For the study period (June to September 2014), 18 % and 15 % of the data were discarded at hourly and daily scales, respectively, during the quality control process. Discarded and missing data were filled with the average value calculated for the study period (June–September).
2.2.2 Eddy covariance system
Alqueva-Montante (38∘13′24.75′′ N, 07∘27′34.18′′ W) meteorological and hydrologic station (Fig. 1) is part of the Portugal Network for Water Resource Monitoring (https://snirh.apambiente.pt, last access: 29 May 2020). The measuring equipment is installed on a floating platform to measure air temperature, relative humidity, wind speed/direction, downward radiation, pressure, and precipitation. These parameters (except for precipitation as this is accumulated during a given period) are measured at a frequency of one value per minute, while averages are calculated for 30 min. The weather station also measures the reservoir water temperature and water quality parameters, which are not used in the present study. The maximum water depth is ∼65 m at the station site, and the shore distance is greater than 300 m; however, these values vary slightly with the type of platform anchorage (i.e. by ropes tied to three sunken blocks), thus allowing longitudinal displacements and rotation on itself.
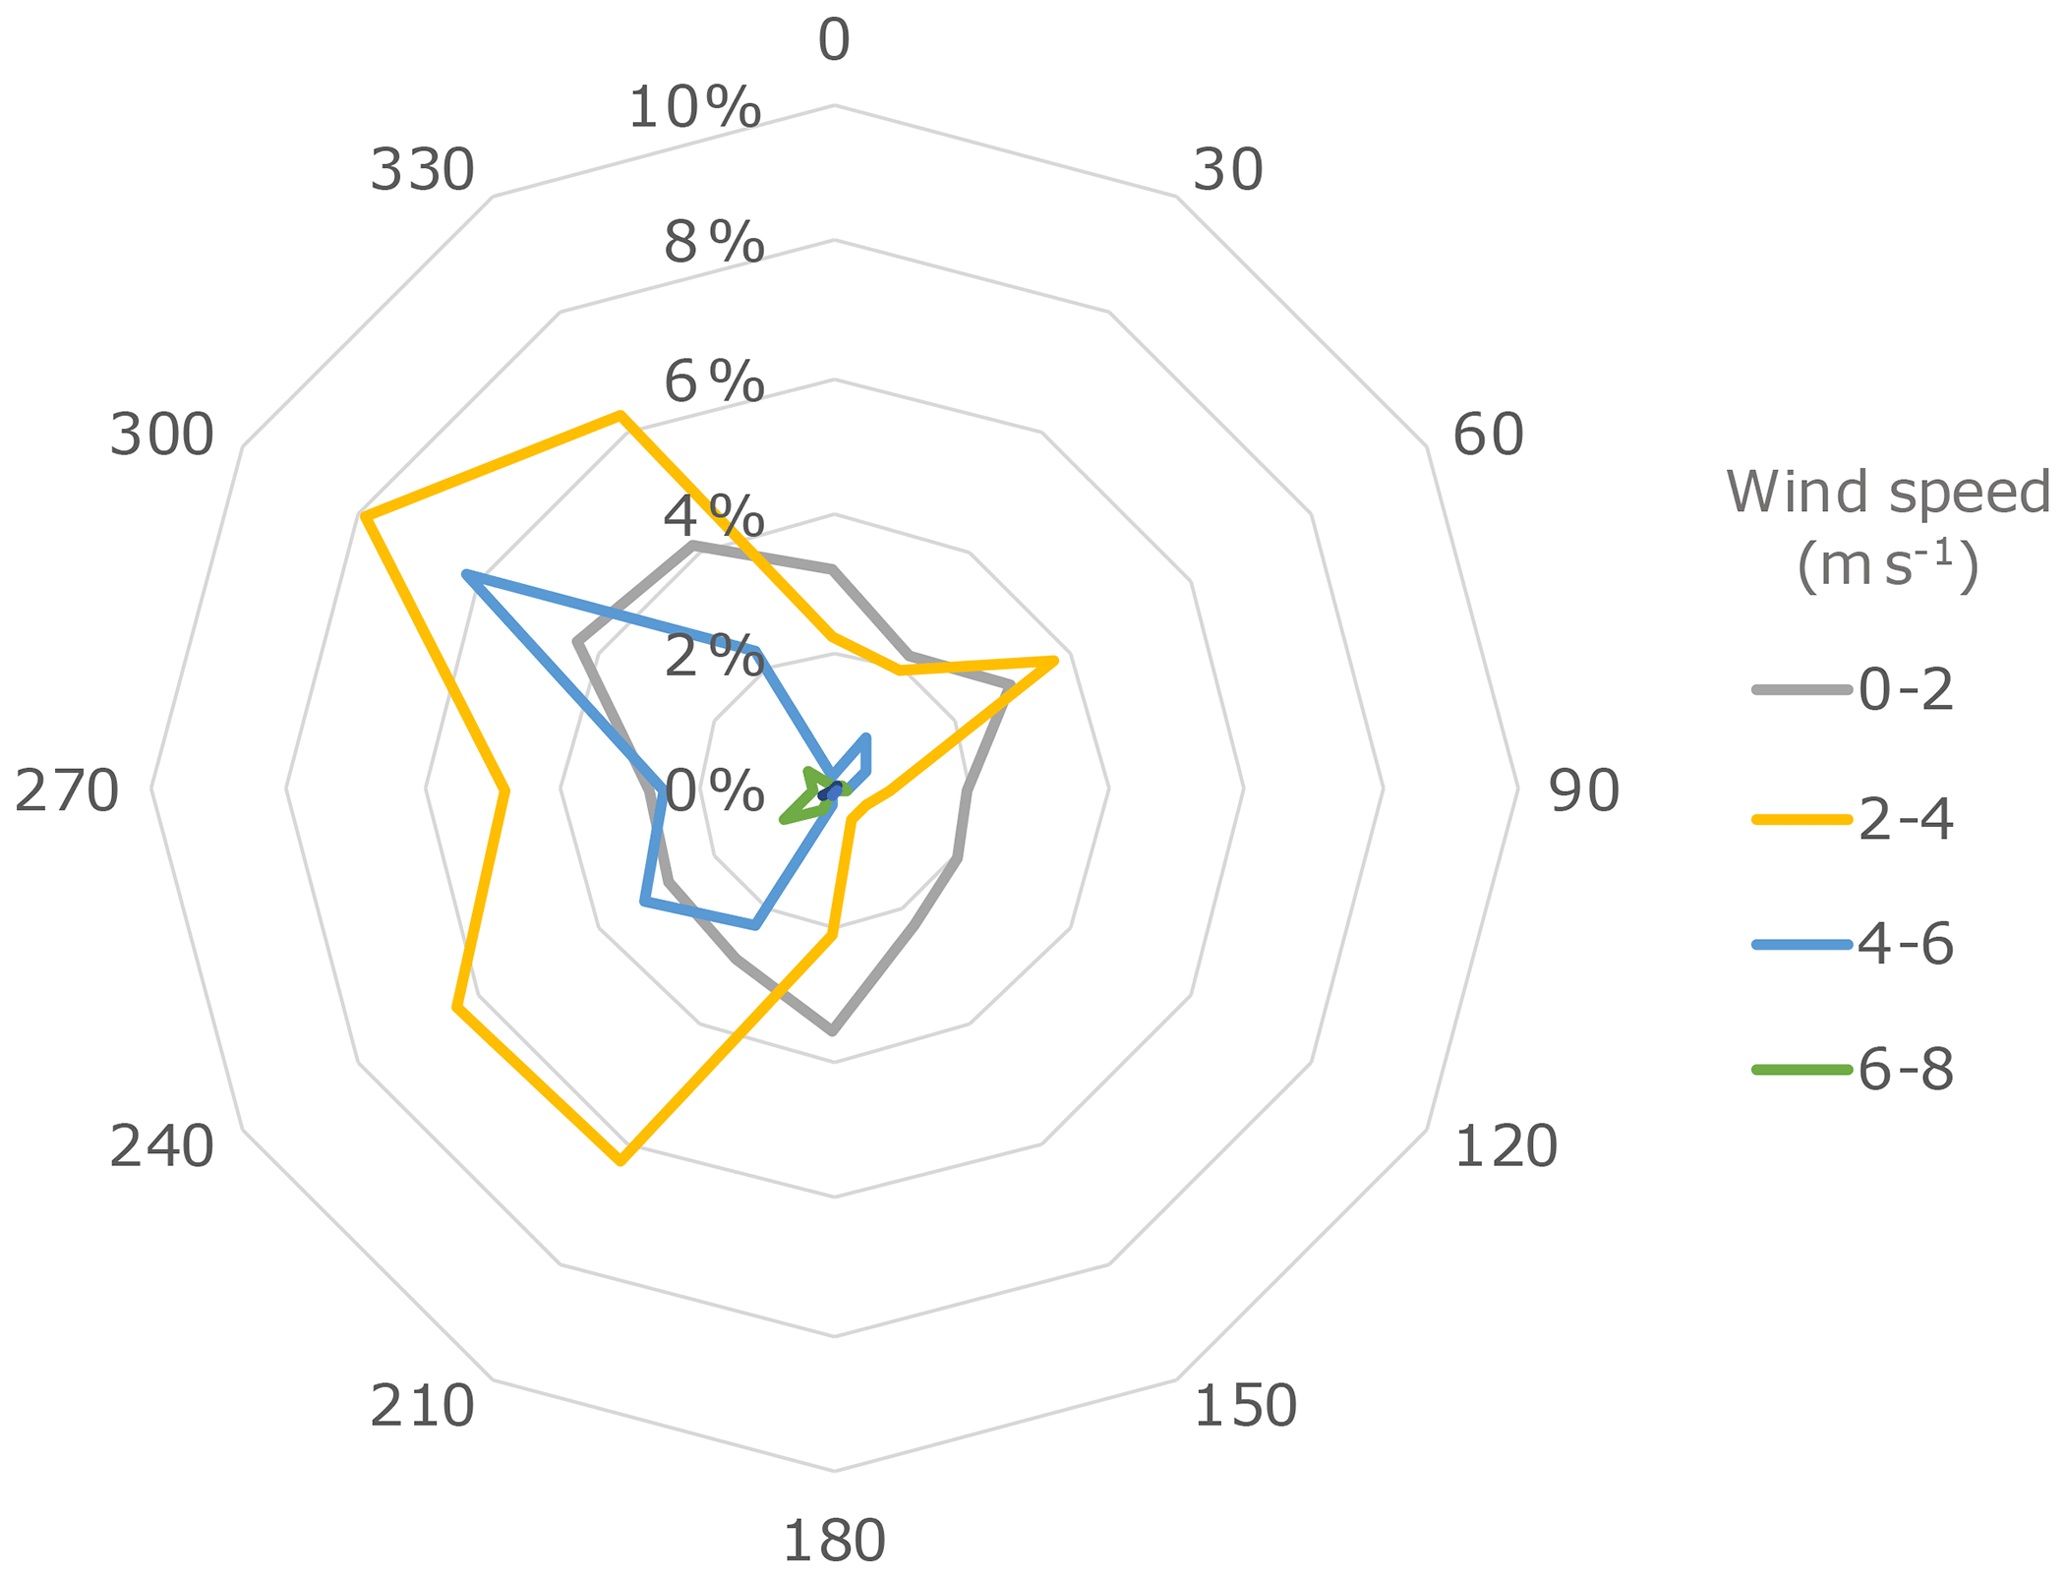

Figure 3(a) Daily cycle of the eddy covariance (EC) evaporation (EEC) with and without wind direction filters; (b) correlation between the EC evaporation with a 180∘ wind direction filter (“Evap_fil180”) and without the filter (“Evap_fil 0”); (c) correlation between the EC evaporation with a 100∘ wind direction filter (“Evap_fil100”) and without the filter (“Evap_fil 0”), for Alqueva-Montante station from June to September 2014.
Within the framework of the ALEX project (http://www.alex2014.cge.uevora.pt/, last access: 29 May 2020), this instrumented floating platform was equipped with one EC system – an integrated open path CO2∕H2O gas analyser and a 3D sonic anemometer (IRGASON; Campbell Scientific) – at a height of 2 m above the reservoir surface. The variables measured by the IRGASON were u, v and w components of wind speed, sonic temperature (computed from the measured sound speed), H2O and CO2 concentration, and sonic anemometer and gas analyser quality flags. Data were sampled at 20 Hz and the filter time delay was 200 ms (Potes et al., 2017). Turbulent time series were linearly detrended and a double-axis rotation was applied to the wind speed components. The turbulent fluxes of momentum, heat, and mass (H2O) were calculated as 30 min covariances between the fluctuations of the vertical wind component (w), temperature, and the H2O concentration, respectively. The air density fluctuations were corrected for thermal expansion and water vapour dilution, and the sonic temperature was corrected for humidity. These corrections were, then, applied to the flux calculations (Potes et al., 2017). Furthermore, data quality criteria and filters were applied for the study period. Approximately 3 % of the original data were discarded based on (i) a signal strength (from the gas analyser) of <0.7, (ii) footprints (fetch) with values of X90 of >300 m, and iii) all data leading to negative values for the H2O covariances resulting in negative latent heat (evaporation) fluxes. Discarded data were filled with the average value calculated for the study period (June–September). The predominant wind direction was between 210 and 360∘ (68 % with 30 min resolution), and 97 % of the mean speed wind measurements (with 30 min resolution) were <6 m s−1 (Fig. 2). In order to assess for the possible contamination for the floating platform on the EC evaporation measurement, two wind direction filters (having as reference the EC system orientation) were applied to flux data. The two filters considered (Evap_fill180 and Evap_fill100) were from wind directions between 90 and 270∘ and 130 and 230∘, as they represent winds that pass through the platform before reaching the EC instrument. To understand the impact of applying a filter of wind direction on the EC evaporation dataset, a comparison was made between the daily cycle without any wind direction filter and with a wind direction filter of (i) 180∘ and (ii) 100∘ (Fig. 3a). The correlations between the daily cycle with a 180∘ filter and without a filter (R2=0.985) and between the daily cycle with a 100∘ filter and without a filter (R2=0.993) are presented in Fig. 3b and c. By analysing these figures, we can conclude that the platform does not affect the flux data, according to the wind direction.
This section describes the methodology used to estimate evaporation from Alqueva Reservoir based on the measurements taken at Alquilha station. It is proposed that the actual evaporation from the reservoir could be estimated using the relationship between the Class A pan evaporation measurements (at Alquilha station) and a pan coefficient multivariable function, as determined by Allen et al. (1998), but for reference evapotranspiration. Although the conditions surrounding a site can influence the pan coefficient, this aspect is not considered here as the fetch in the wind direction was irrelevant, as mentioned in Sect. 2.2. Processed data of pan and EC evaporation (Sect. 2.2) were used to develop a multivariable pan function.
First, relationships between the EC measurements and meteorological parameters (air temperature, relative humidity, wind speed, and solar radiation) measured at Alqueva-Montante station were determined. These four meteorological parameters were selected primarily because they are the factors governing evaporation, as usually described in the literature (e.g. Allen et al., 1998), and are the parameters measured in Alquilha meteorological station. The daily cycle of evaporation and normalised meteorological parameters were analysed to assess their behaviours during the day. A sensitive analysis at the hourly scale was also performed for the factors governing evaporation from Alqueva Reservoir.
Second, the relationships between pan evaporation measurements and the same meteorological parameters, but as measured at Alquilha station (at hourly and daily scales), were determined.
Third, the correlation between EC evaporation and pan evaporation was determined and the daily cycles of the normalised pan evaporation and normalised EC evaporation were compared.
Fourth, a sensitivity analysis was performed, calculating the correlation of the daily pan evaporation and daily EC evaporation with air temperature, relative humidity, wind speed, and solar radiation.
Fifth, the daily multivariable pan coefficient series was calculated by dividing the daily values of EC evaporation by the corresponding daily values of pan evaporation.
Sixth, a function was fitted to this series based on the physical relationships among the different meteorological parameters measured at Alquilha station (at the daily scale). Several functions were attempted, and the one with the best determination coefficient (R2) was chosen. To determine the optimal parameter estimates, the generalised reduced gradient (GRG) method (Lasdon et al., 1974) was used with the aid of the Excel solver tool. The best parameter estimates were those that minimised the residual sum of squares.
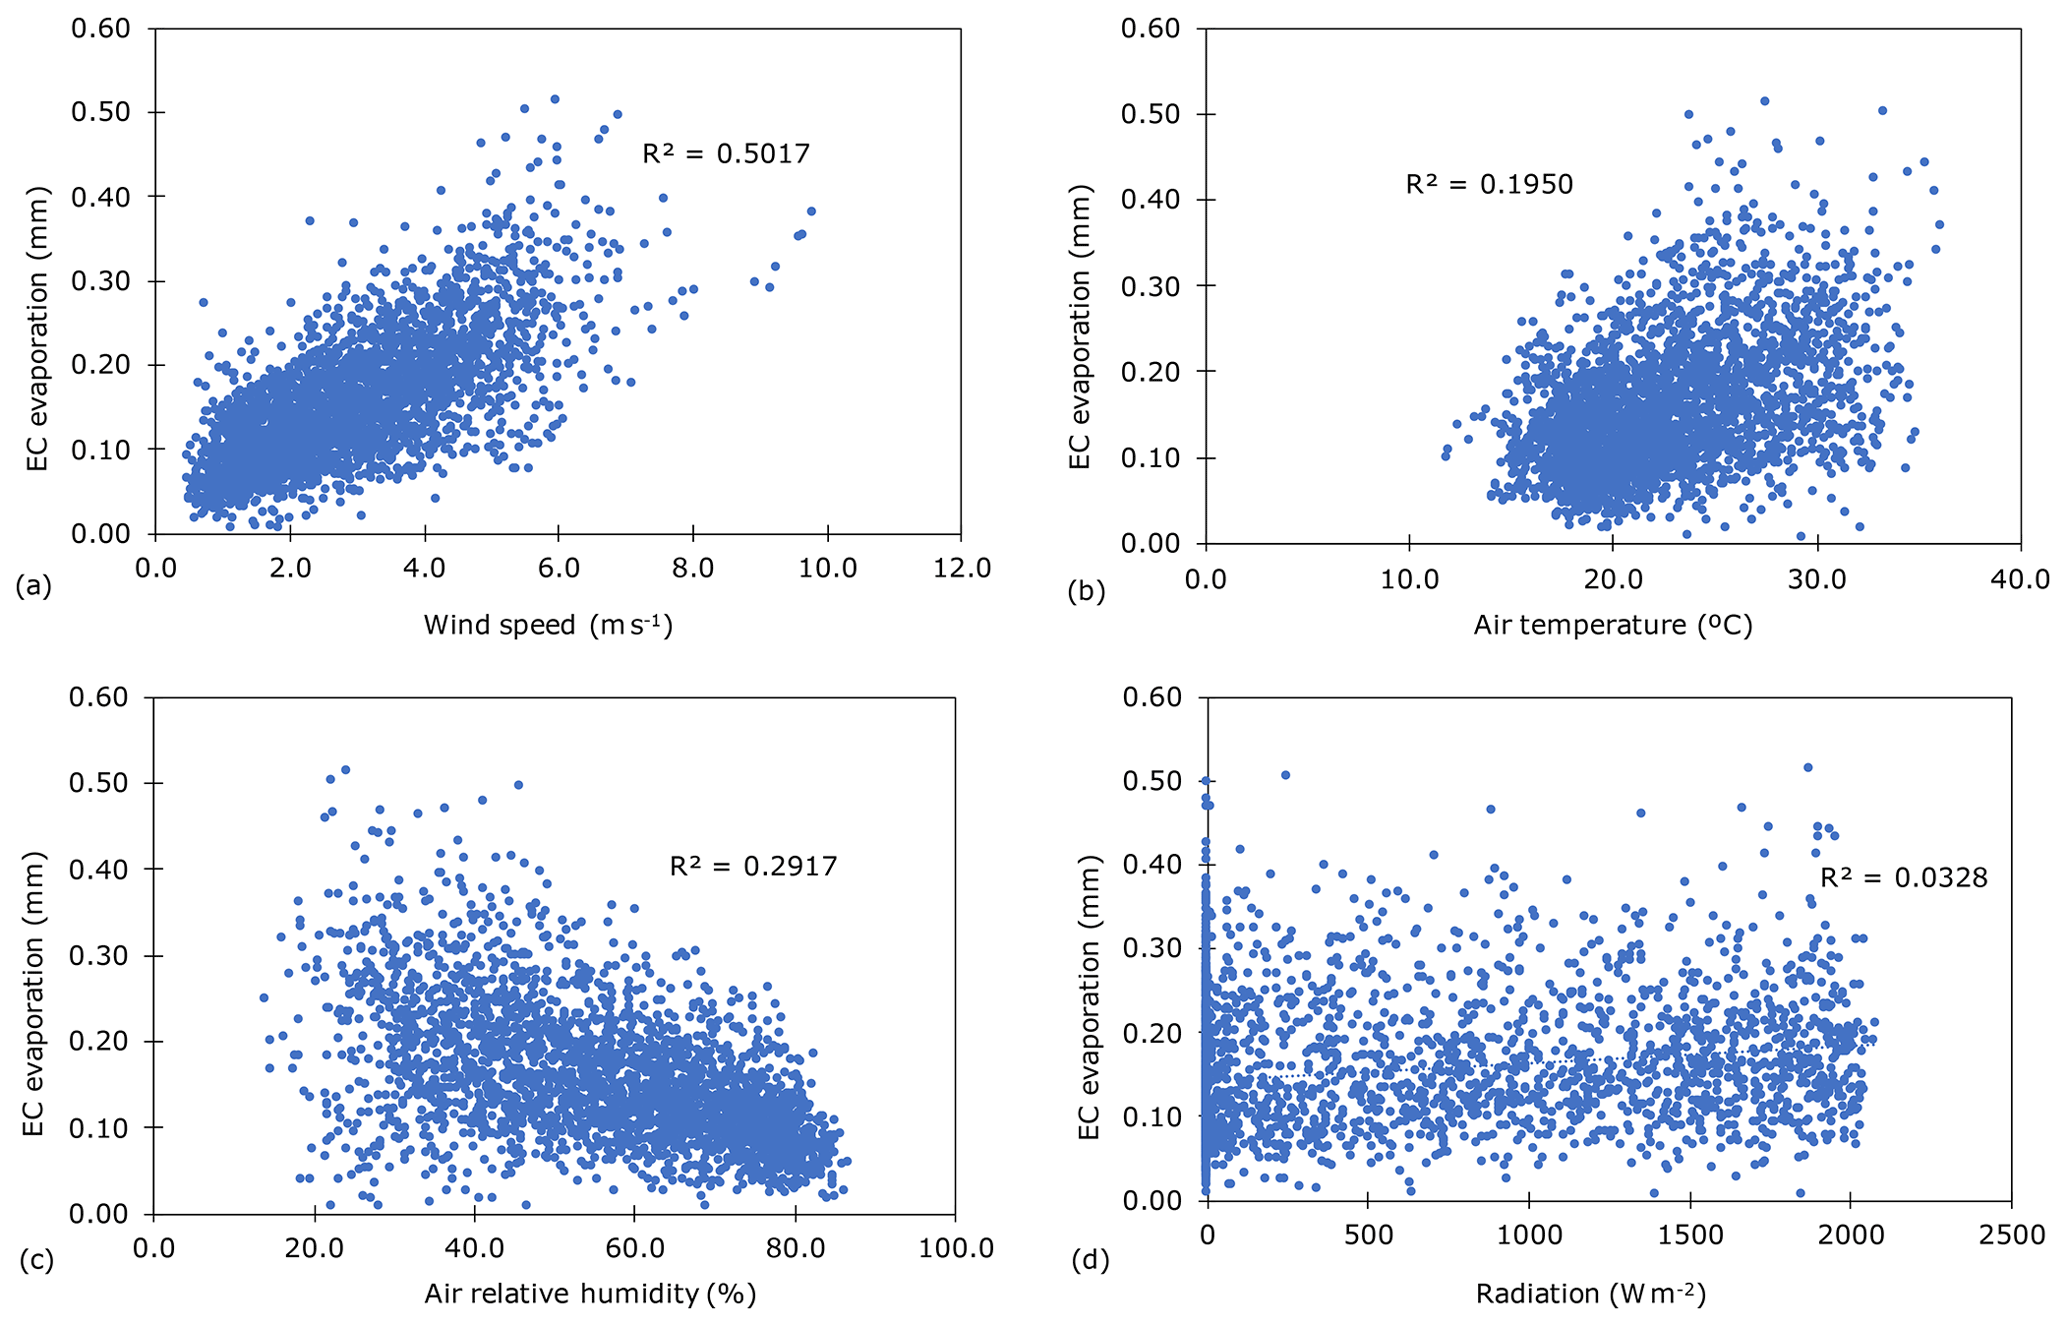
Figure 4Hourly correlation between the EC evaporation (EEC) and (a) wind speed (U), (b) air temperature (Ta), (c) relative humidity (RH) of air, and (d) solar radiation (Rad) at Alqueva-Montante station.
4.1 Eddy covariance evaporation
The total EC evaporation measured from June to September 2014 was 450.1 mm. The mean daily EC evaporation in June, July, August, and September was 3.7, 4.0, 4.5, and 2.5 mm d−1, respectively. The correlations between the hourly EC evaporation and wind speed, air temperature, relative humidity, and incoming solar radiation are presented in Fig. 4. At the hourly scale, a positive correlation was observed between the EC evaporation and (i) wind speed (R2=0.50) and (ii) air temperature (R2=0.20), whereas a negative correlation was observed between open evaporation and relative humidity (R2=0.30). There was no correlation between open-water evaporation and incoming solar radiation.
The daily cycles of evaporation and the meteorological parameters allow the variation during an average day to be analysed. The normalisation of the mean values of the meteorological parameters was performed to unify the scale of the parameters. The daily cycle of evaporation and the four normalised meteorological parameters measured at Alqueva-Montante station are presented in Fig. 5. As expected, the air temperature and relative humidity exhibited opposite trends. There was a slight variation in the wind speed during the morning and a considerable increase after 10:00 LT, which induced a variation in evaporation. After 06:00 LT, evaporation increased continuously until 21:00 LT, along with increases in radiation and wind speed but decreasing relative humidity. Incoming solar radiation contributed to evaporation with a delay that could be explained by the variation in the energy stored in the water column. The increase in solar radiation may lead to an increase in the stored energy in the water column (Potes et al., 2017; Nordbo et al., 2011). The air temperature subsequently decreased compared to the water temperature, and the energy was released into the air, thereby increasing evaporation. An evaporation inflexion point occurred at 14:00 LT, when the incoming solar radiation began to decrease. Accordingly, evaporation began to decrease at 21:00 LT, when there was no solar radiation.
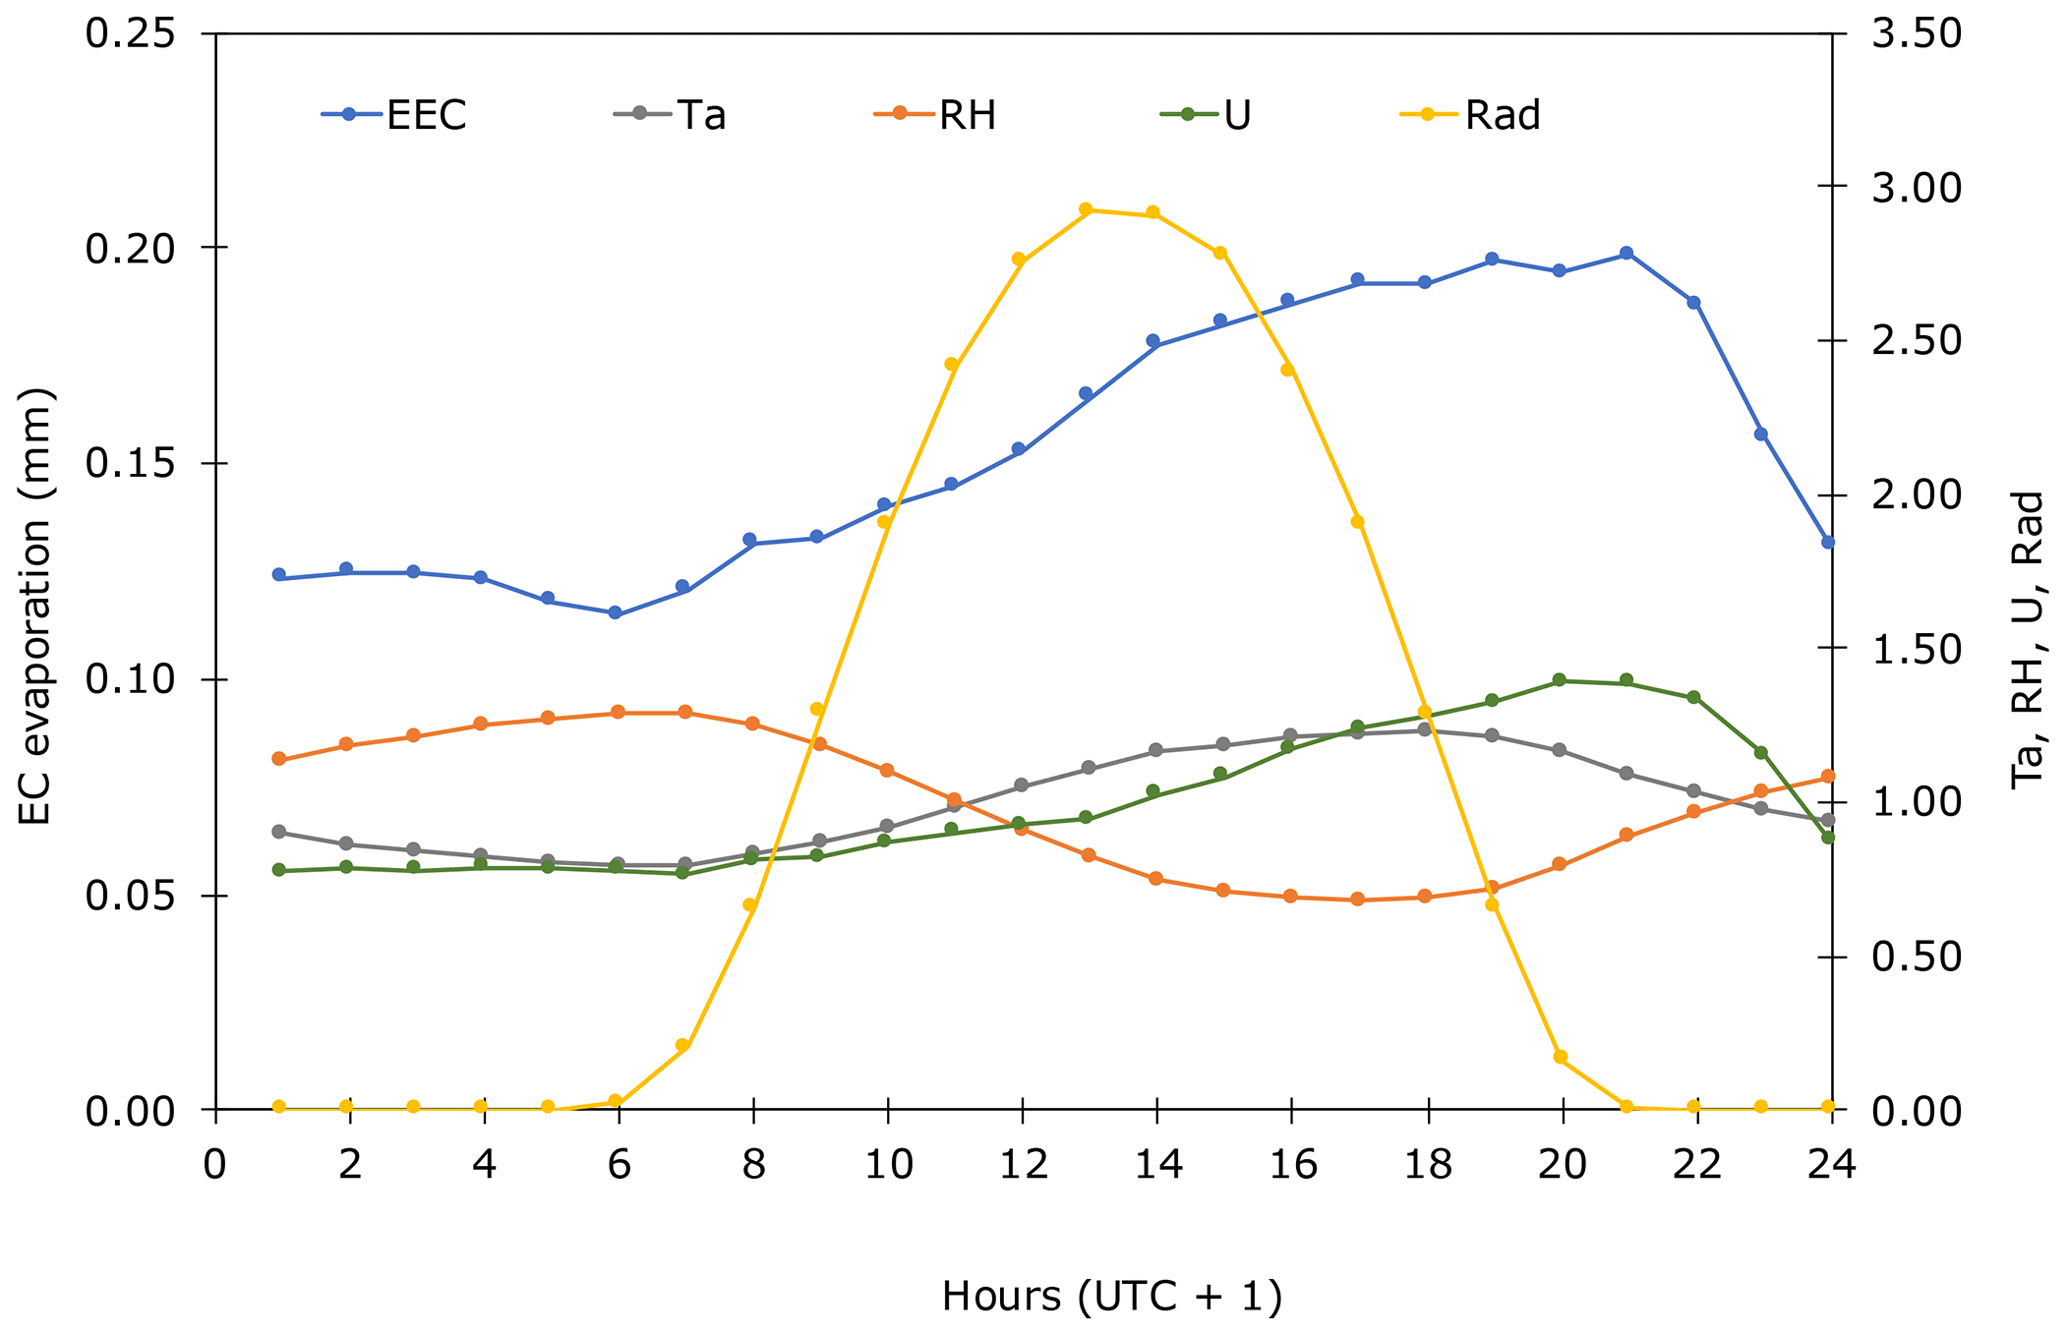
Figure 5Mean daily cycle of the EC evaporation (EEC) (left y axis) and normalised air temperature (Ta), relative humidity (RH) of air, wind speed (U), and solar radiation (Rad) (right y axis) from June to September 2014 at Alqueva-Montante station.
4.2 Class A pan evaporation
The total pan evaporation measured from June to September 2014 was 797.9 mm. The mean daily pan evaporation in June, July, August, and September was 6.9, 7.7, 7.3, and 4.3 mm d−1, respectively.
Such as for the EC evaporation, a positive correlation was observed between the hourly pan evaporation and air temperature (R2=0.55), whereas a negative correlation was found between the hourly pan evaporation and relative humidity (R2=0.53). In contrast, a positive correlation was observed between the hourly pan evaporation and incoming solar radiation (R2=0.35), and a weak positive correlation was evident between the hourly pan evaporation and wind speed (R2=0.05). The daily cycle of evaporation and the four normalised meteorological parameters (wind speed, air temperature, relative humidity, and solar radiation) measured at Alquilha station are presented in Fig. 6. In the morning period, the solar radiation begins at 08:00 LT and with that an increase in air temperature and a decrease in relative humidity. At 11:00 LT wind speed starts to increase, and around 12:00 LT occurs the trigger of the evaporation pan. The trend of the pan evaporation followed the trend of solar radiation but with a delay of about 3 h, whereby the maximum value was at 16:00 LT when the relative humidity was at the minimum. Pan evaporation reduced as the air relative humidity increased.

Figure 6Mean daily cycle of pan evaporation (Epan) (left y axis) and normalised air temperature (Ta), relative humidity (RH) of air, wind speed (U), and solar radiation (Rad) (right y axis) from June to September 2014 at Alquilha station.
4.3 Correlation between EC evaporation and pan evaporation
The correlation between daily eddy covariance evaporation and daily pan evaporation was determined for the study period (June–September) and is shown in Fig. 7. Figure 7a shows a poor linear correlation between the EC evaporation and pan evaporation during the entire study period (R2=0.37). This was also the case when observing the plots for each month: R2=0.1882 in June (Fig. 7b), R2=0.0458 in July (Fig. 7c), R2=0.3345 in August (Fig. 7d), and R2=0.4693 in September (Fig. 7e). These results show that the relationship between both evaporations could not be considered linear and reveal the importance of finding a non-linear function to correlate EC evaporation and pan evaporation. The daily cycles of the normalised pan evaporation and normalised EC evaporation are compared in Fig. 8. The two evaporations exhibited different behaviours: pan evaporation varied widely over the day, with zero evaporation at 09:00 LT and the maximum at 16:00 LT. The maximum mean daily pan evaporation was 2.75-fold that of the mean daily value. In contrast, the daily cycle of the EC evaporation fluctuated comparatively little over the day. During the night and early morning, EC evaporation was ∼80 % of the daily mean value, with the minimum at 06:00 LT. During the late afternoon, the EC evaporation increased due to the increased wind speed (Fig. 5). The maximum daily mean evaporation occurred at 21:00 LT, and it was 125 % of the daily mean value.
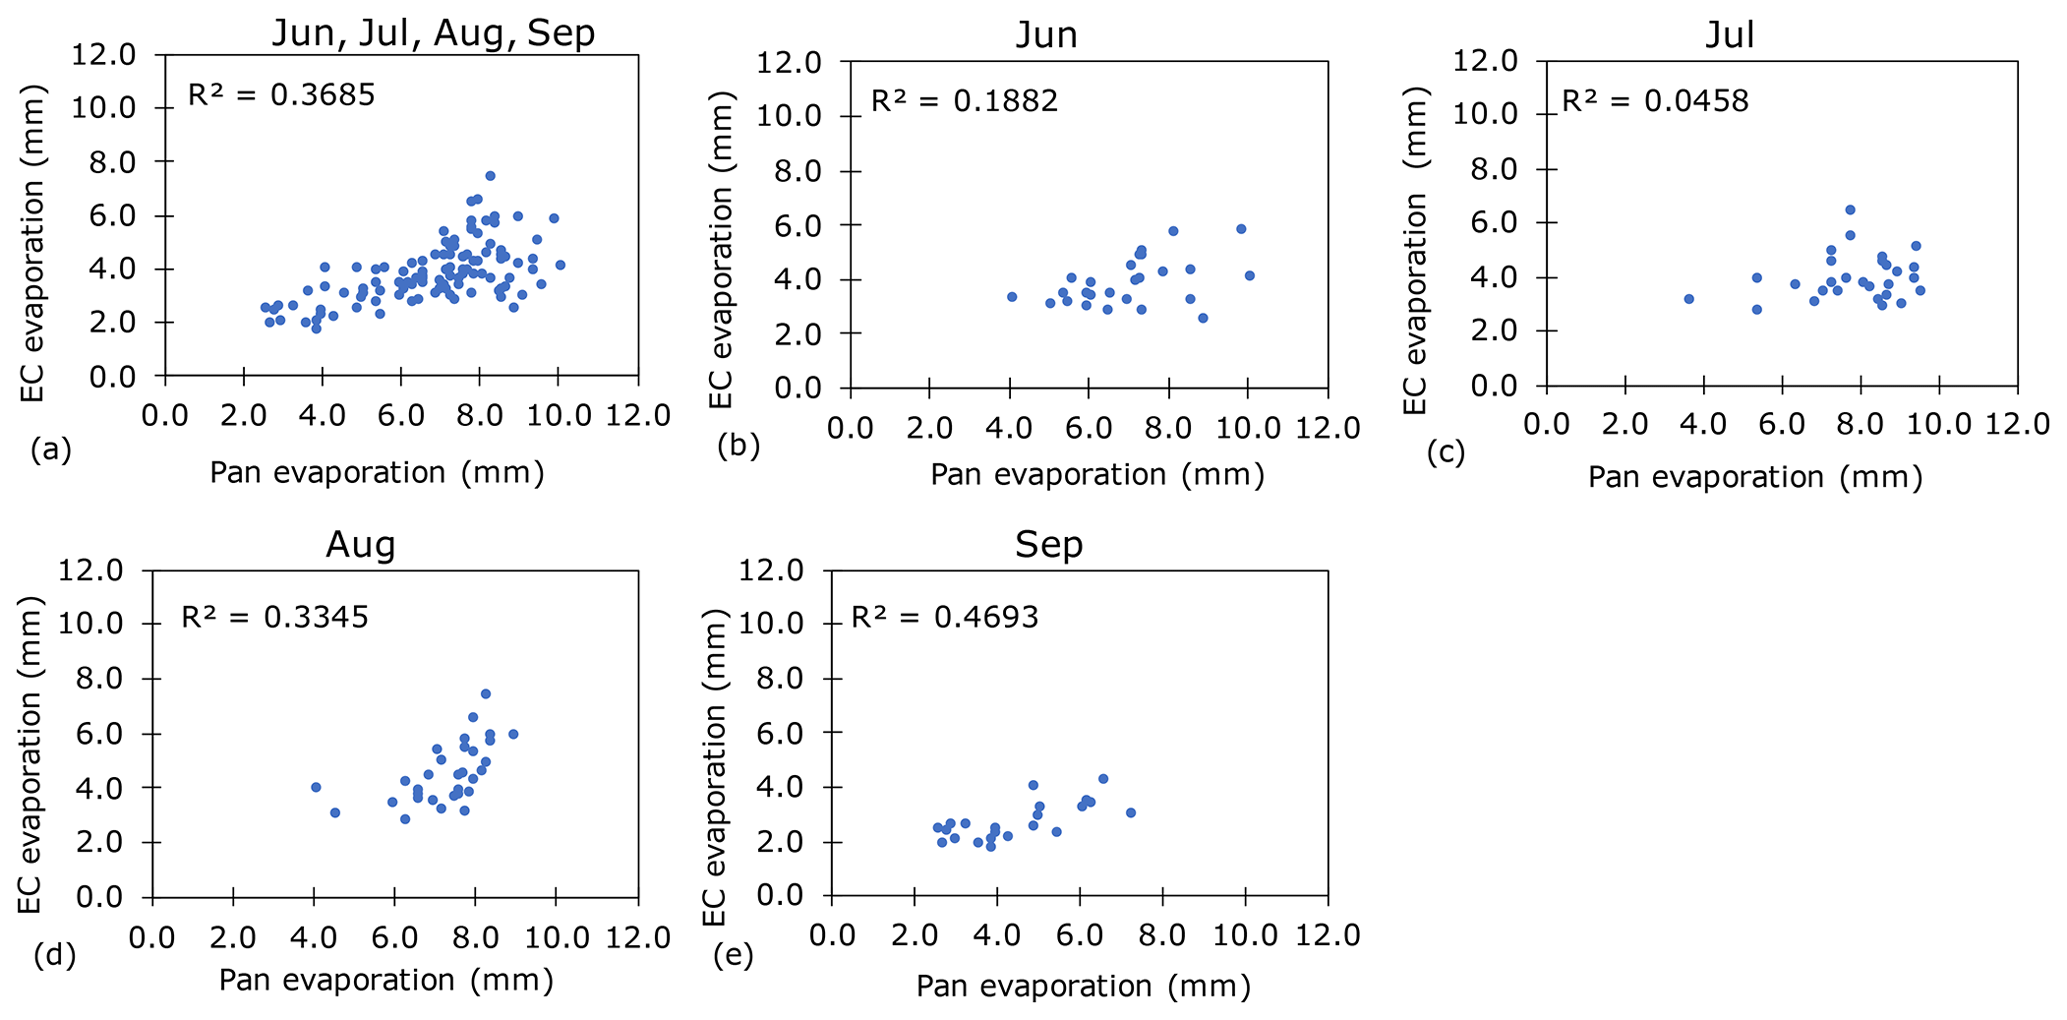
Figure 7Correlation between the daily EC evaporation (EEC) and the daily pan evaporation (Epan): (a) June to September 2014; (b) June 2014; (c) July 2014; (d) August 2014; (e) September 2014.
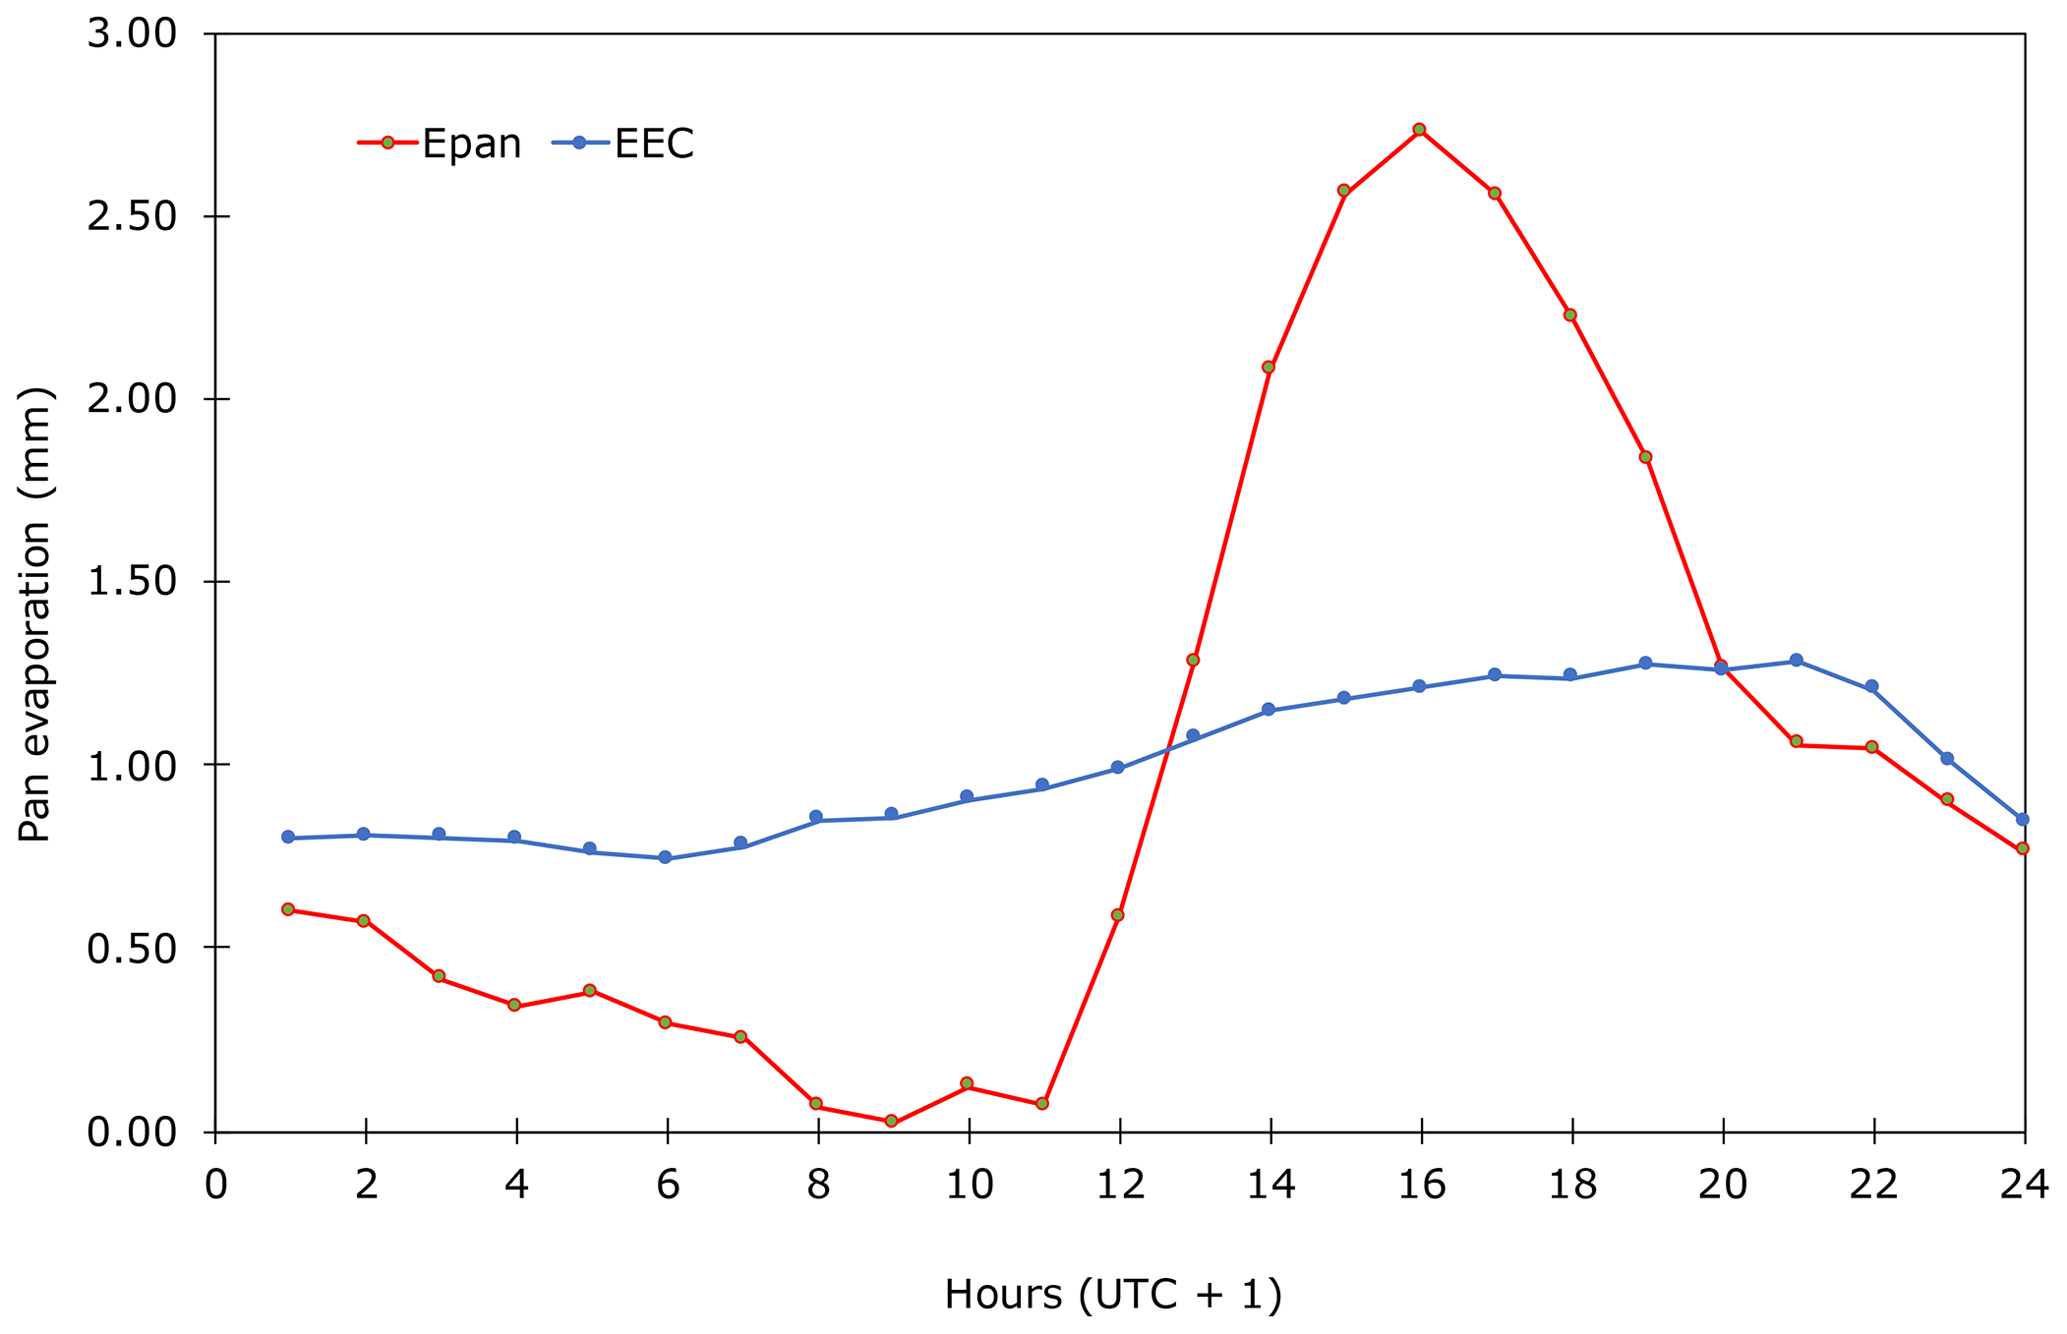
Figure 8Mean daily cycle of the normalised pan evaporation (Epan) and the EC evaporation (EEC).
These results agree with a previous study by Salgado and Le Moigne (2010) for the same reservoir, wherein the authors observed an absolute minimum and maximum at 06:00 and 21:00 LT, respectively. Although both types of evaporation measurements used similar times for calculating the mean daily value (between 12:00 and 13:00 LT), the significant dissimilarities over the day resulted from the large difference between the size of the pan and the size of the reservoir as these may lead to different heat storage capacities. Owing to the reduced water height in the pan, the amount of energy it would have received through radiation and conduction through the walls of the pan is incomparably higher than that received by the reservoir water. Moreover, the reduced area of the pan would have tended to enhance the loss of water through evaporation because it facilitates the removal of air-saturated layers at the water–air interface.
4.4 Sensitivity analysis of pan evaporation and EC evaporation versus meteorological variables
A sensitivity analysis of the daily pan evaporation and daily EC evaporation with air temperature, relative humidity, wind speed, and solar radiation was carried out, and the results are presented in Fig. 9. Figure 9a shows a non-linear correlation between evaporation (EC and pan evaporation) and wind speed. It can be observed that both evaporations have a positive linear correlation with air temperature (Fig. 9b) and radiation (Fig. 9d). Figure 9c shows a negative correlation between evaporation and air relative humidity. The value of R2 of pan evaporation with air temperature, air relative humidity, and radiation is greater than the R2 of the EC evaporation with the same parameters. In contrast, the R2 of EC evaporation with wind speed is greater than the pan evaporation with the wind speed parameter.
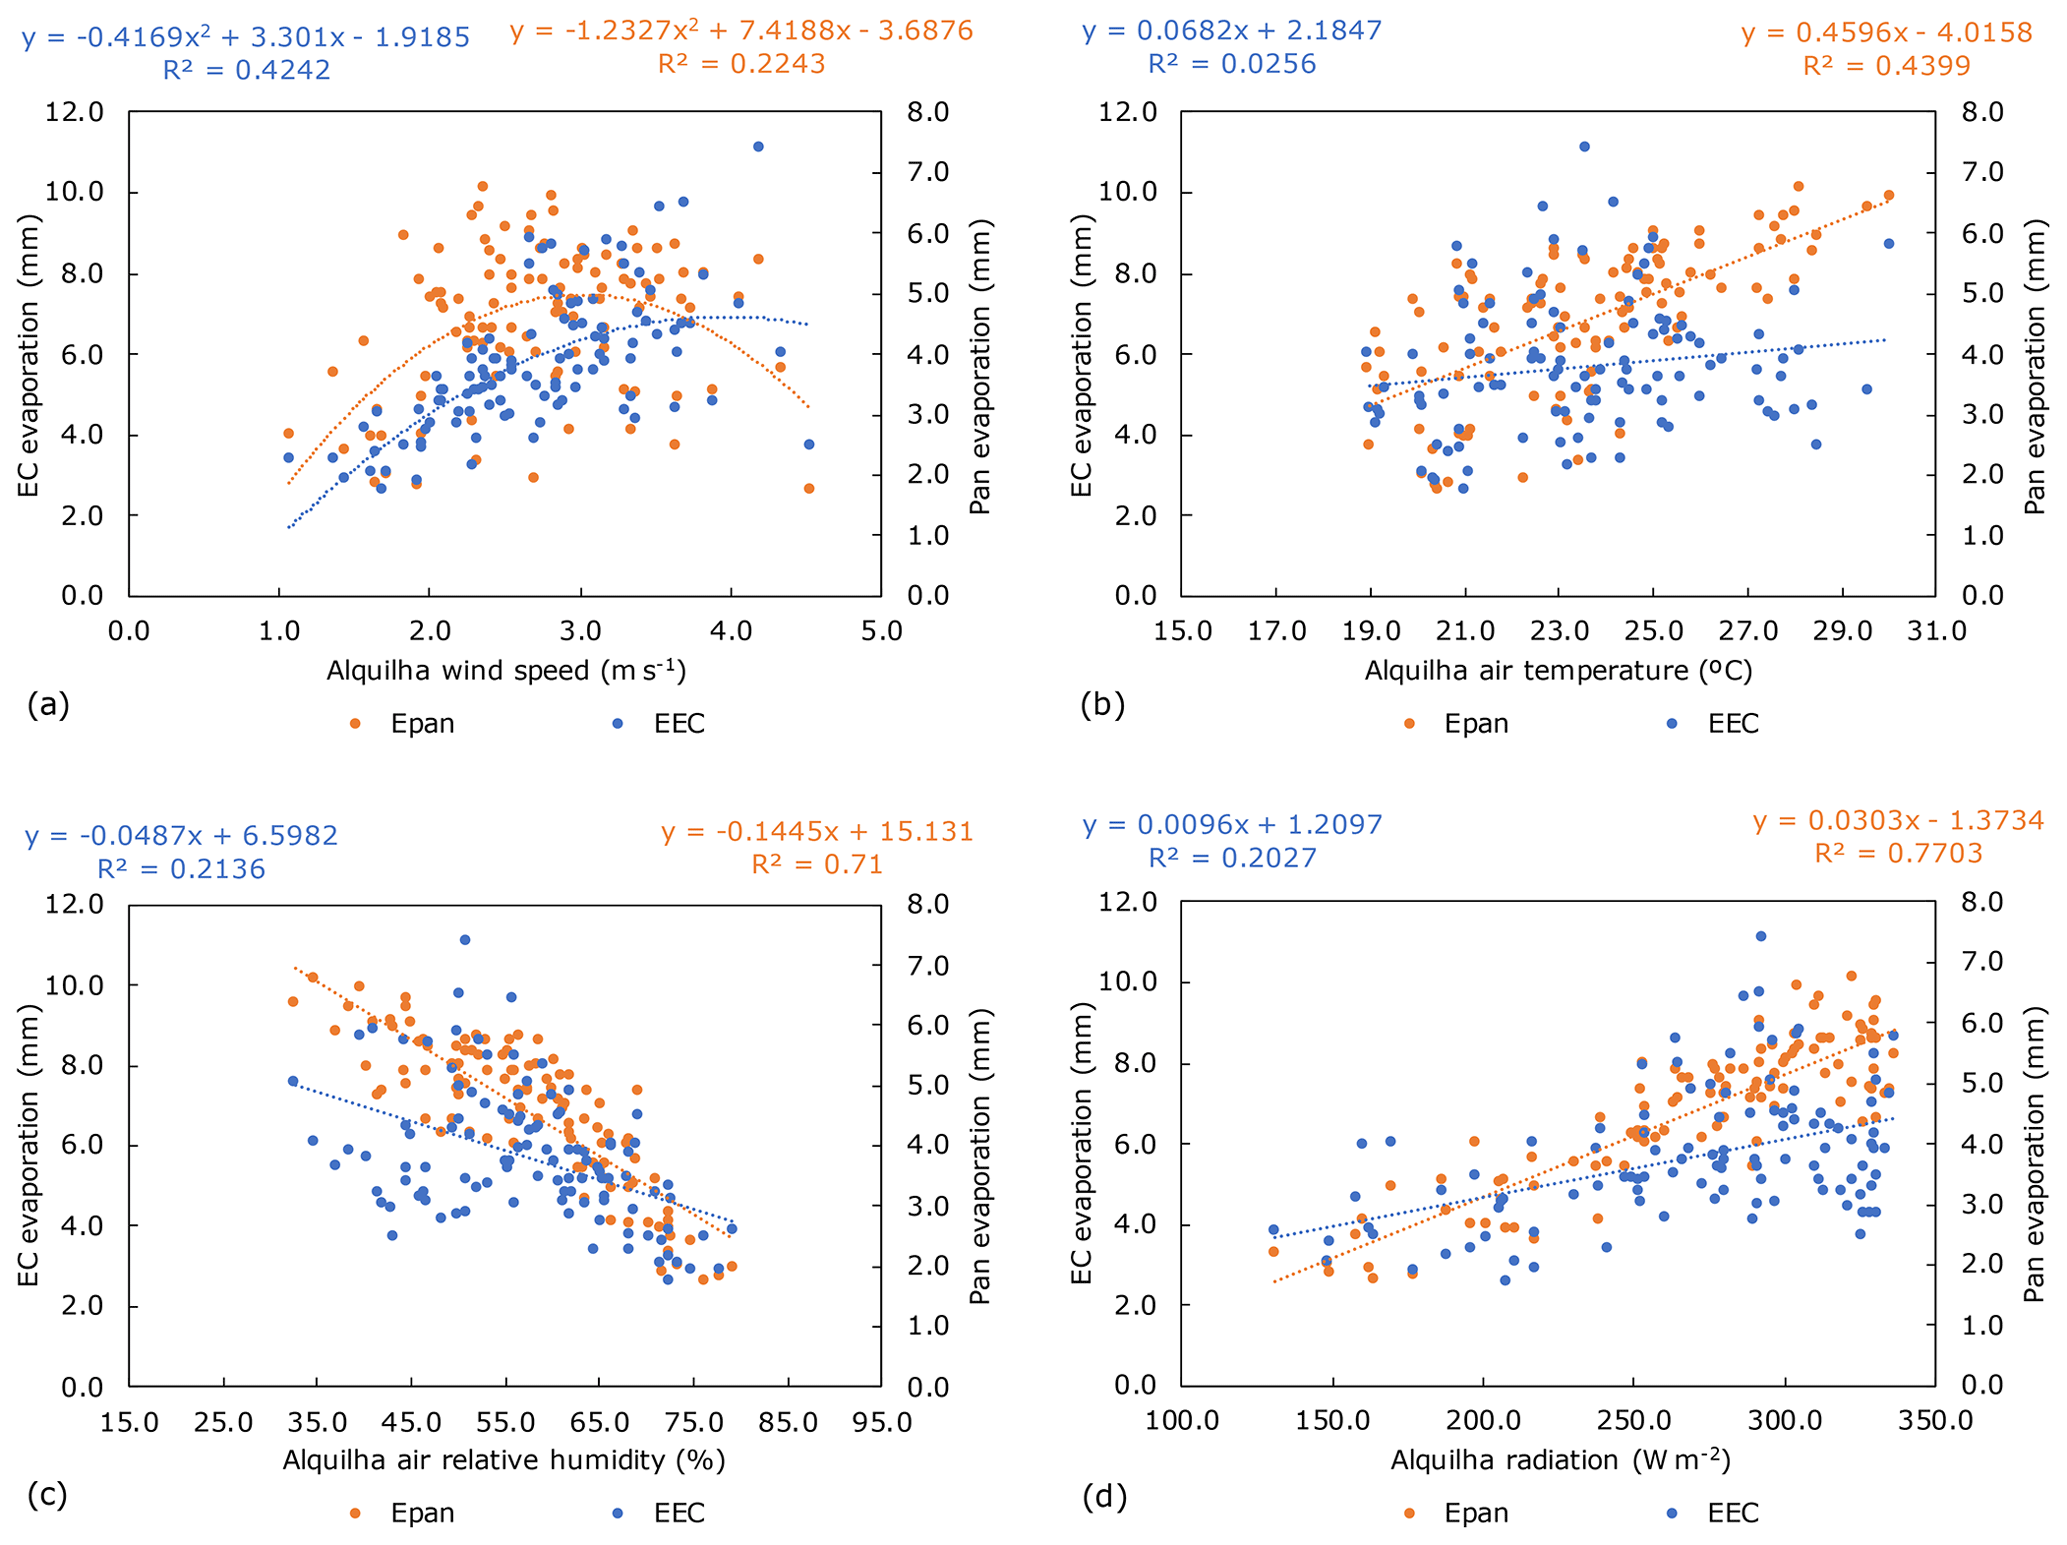
Figure 9Sensitivity analysis of the daily EC evaporation (EEC) and the daily pan evaporation (Epan) from June to September 2014, with (a) wind speed, (b) air temperature, (c) relative humidity of air, and (d) solar radiation.
Based on this sensitivity analysis, it was inferred that the four parameters influence both EC evaporation and pan evaporation and strengthen the ability to establish a relationship between the open EC evaporation and pan evaporation on a daily scale as discussed in Sect. 4.5.
4.5 Pan evaporation coefficient model
The pan evaporation coefficient (Kpan) was calculated as a function of the four meteorological parameters measured at Alquilha station because this station will be used in the future to obtain data to support water management and decision-making. Consequently, the reservoir evaporation (ERes) is estimated by multiplying the Alquilha Class A pan evaporation (Epan) measurement (at Alquilha) by the modelled Kpan.
The pan evaporation coefficient model was expressed by a multivariable function as shown in Eq. (1):
where a–f are specific constants; U is the average daily wind speed at a height of 2 m at Alquilha station (m s−1); Ta is the average daily temperature at Alquilha station (∘C); RH is the average daily relative humidity at Alquilha station (%); and Rad is the total daily radiation at Alquilha station (W m−2).
By using an objective function to minimise the residual sum of squares, the parameterisation of the specific constants was performed by optimisation using the GRG method; thus, Eq. (1) becomes
The daily mean modelled Kpan was 0.59, 0.57, 0.57, and 0.64 for June, July, August, and September, respectively. These values are slightly larger than those obtained directly by the ratio of the EC evaporation to pan evaporation (0.54). Rodrigues (2009) reported monthly Kpan values between 0.70 and 0.90 for the same summer period and reservoir but using a different approach; he estimated Kpan values by relating pan evaporation, measured from a floating pan at the Alqueba-Montante platform, and reservoir evaporation obtained by the energy budget approach.
Figure 10 presents ERes determined from the pan evaporation coefficient model and the measured EC evaporation. The R2 value of 0.74 indicates that this model can estimate the ERes quite well. The total modelled ERes for the period from June to September was 455.8 mm, which corresponds to 101.3 % of the EC evaporation and 76 % of the site reference evapotranspiration calculated by the Penman–Monteith equation (Allen et al., 1998). The modelled daily mean ERes in June, July, August, and September was 3.9, 4.2, 4.5, and 2.7 mm d−1, respectively.
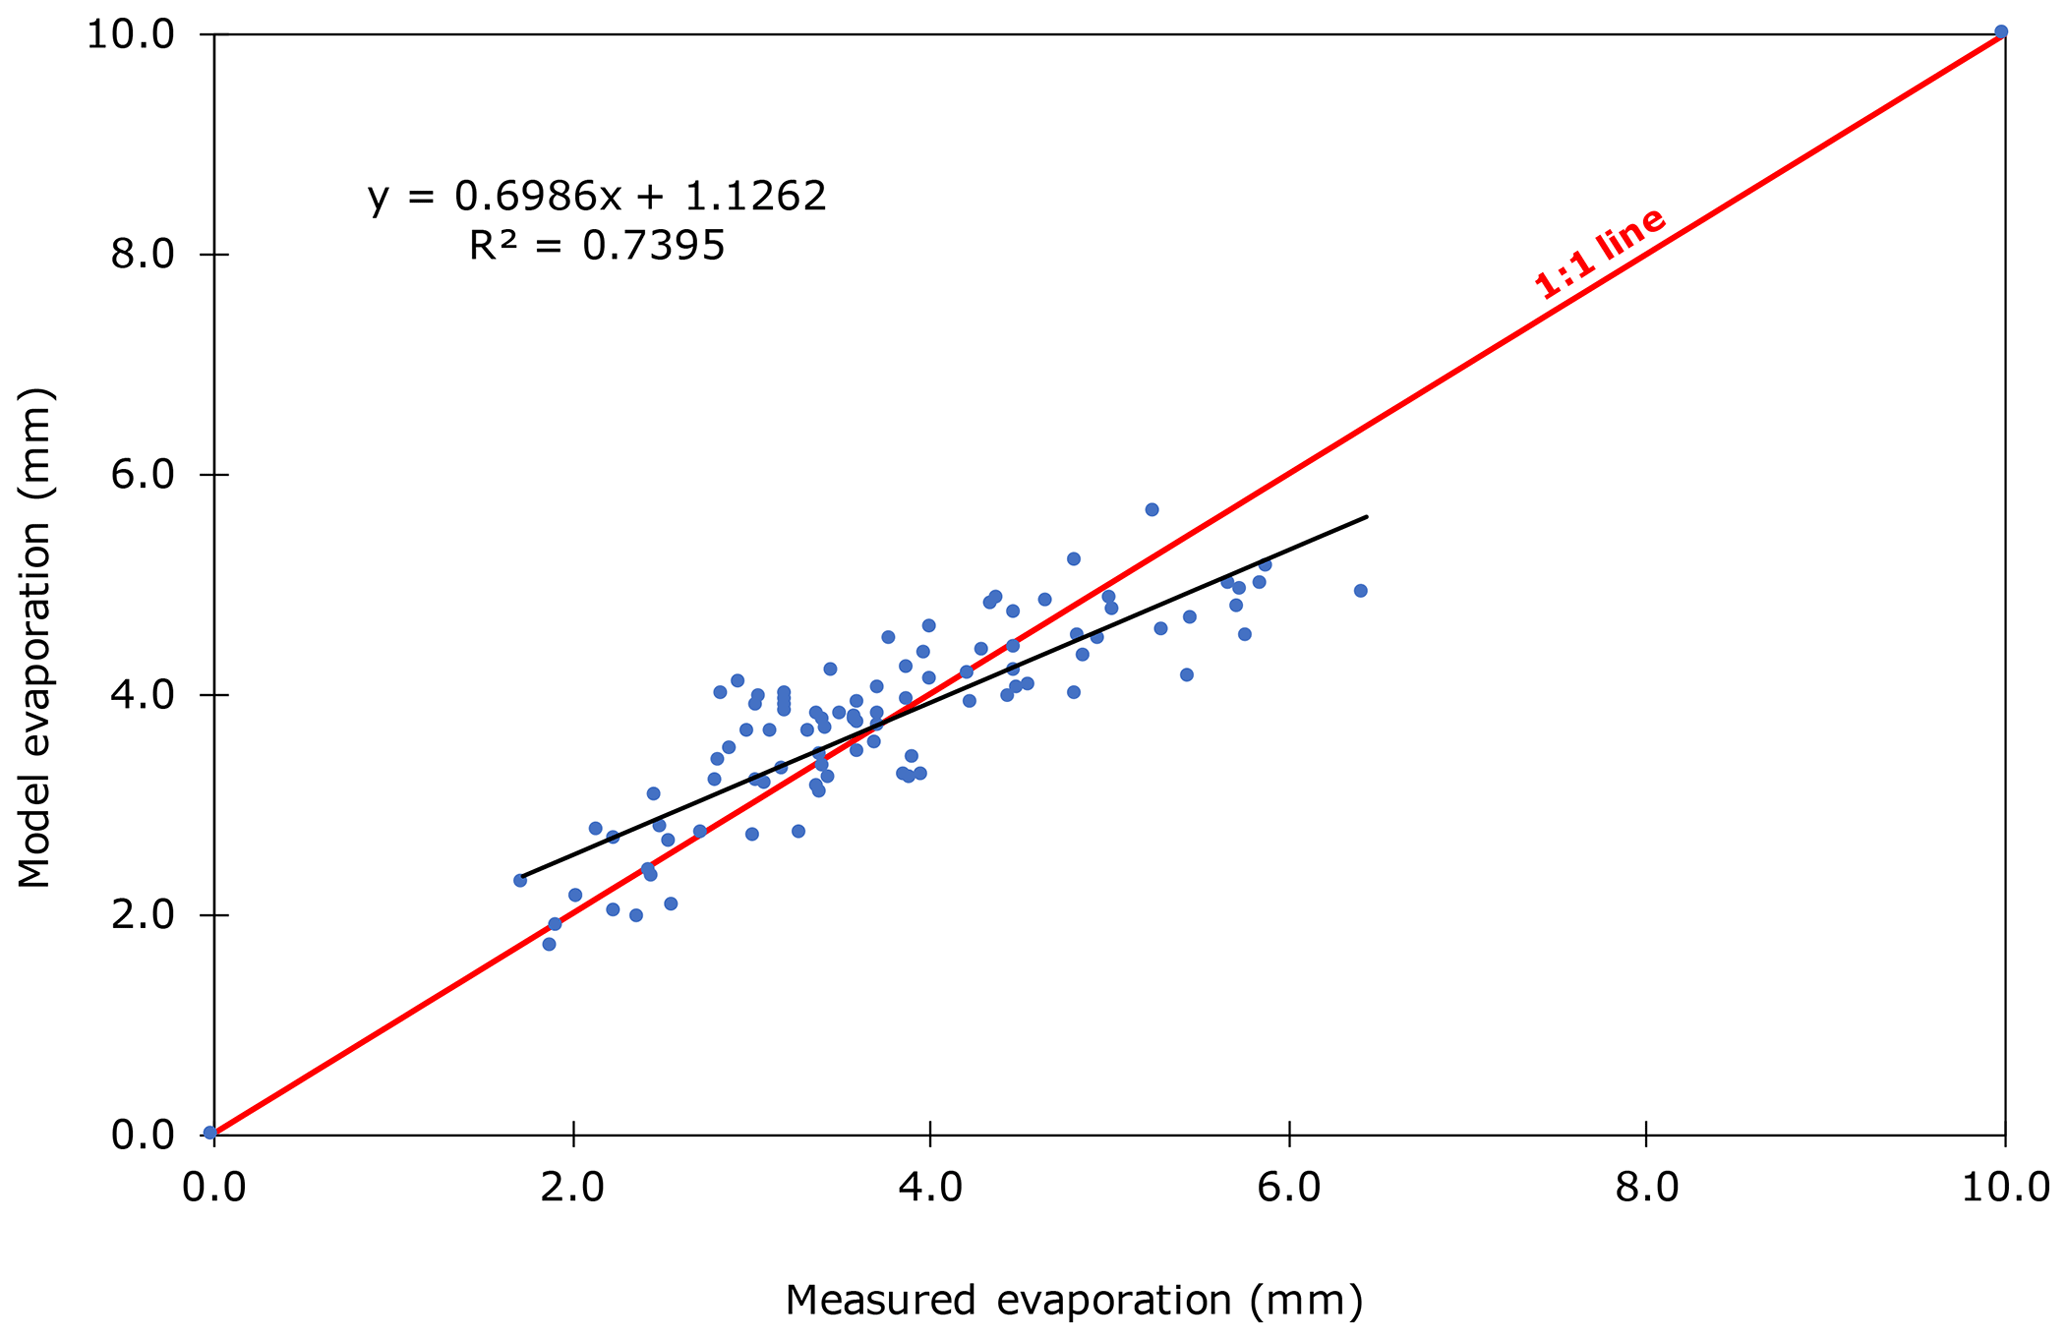
Figure 10Modelled daily evaporation (ERes) versus measured daily evaporation (EEC) from June to September 2014.
The ability of the model was tested for the period from June to September 2017 (Fig. 11; R2=0.68); thus, the model could estimate the ERes despite high measured evaporation rates and a reduced number of available daily pan evaporation measurements.
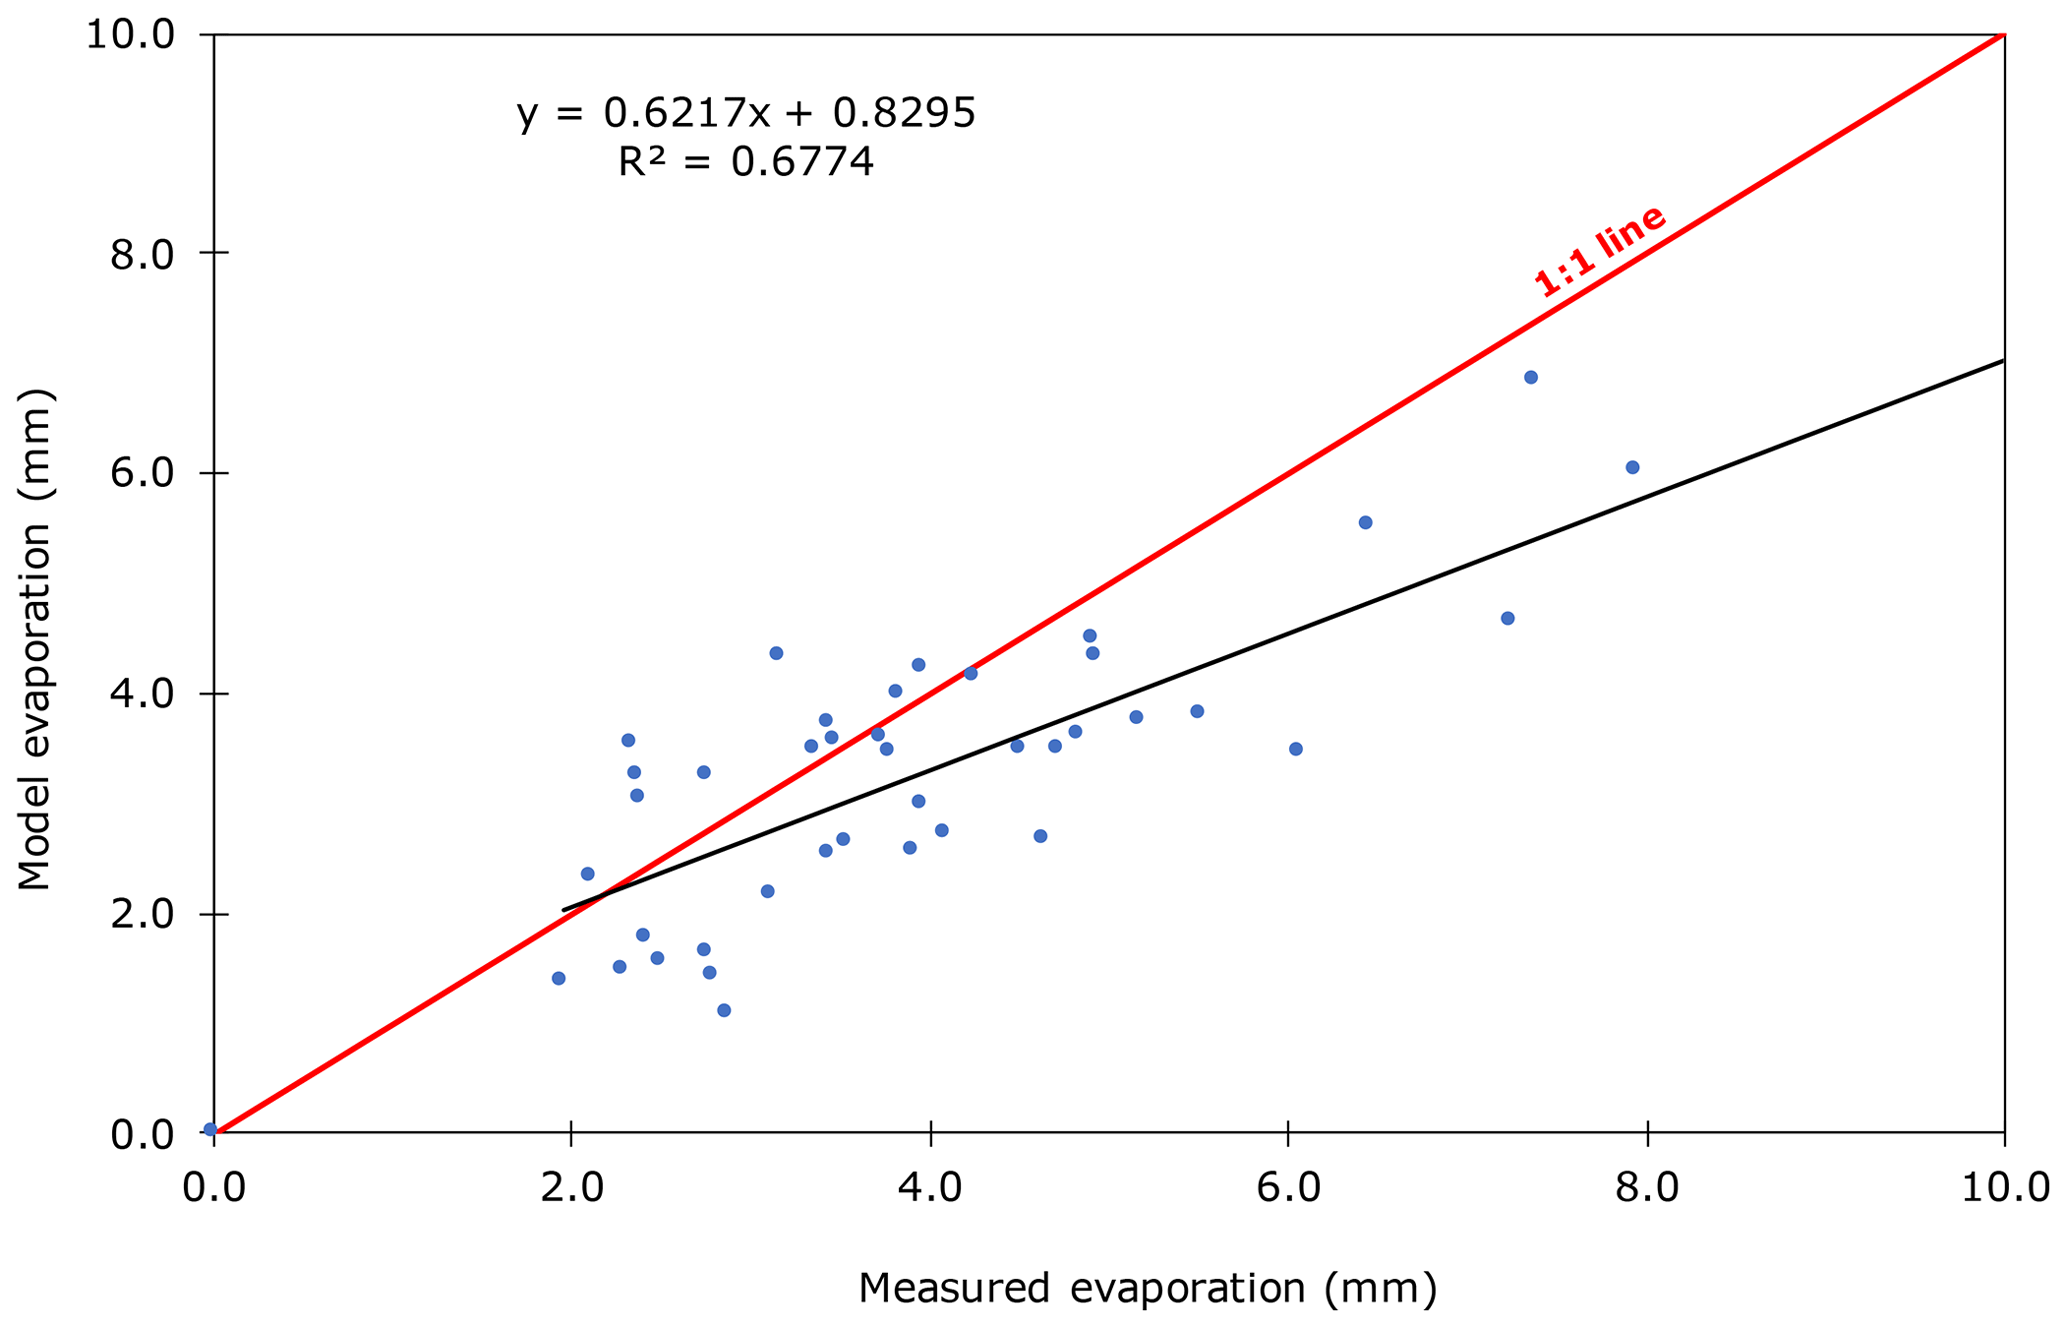
Figure 11Modelled daily evaporation (ERes) versus measured daily evaporation (EEC) from June to September 2017.
The study aimed to develop a method to evaluate the evaporation from Alqueva Reservoir, located in south-eastern Portugal, based on Class A pan measurements, thus providing an evaluation tool for water management within the Multipurpose Alqueva Project (MAP) and for other reservoirs with a Mediterranean climate.
Water fluxes were continuously measured from June to September 2014 using the EC method at Alqueva-Montante station to obtain accurate reservoir evaporation measurements. The total EC reservoir evaporation from June to September 2014 was 450.1 mm, and the mean daily evaporation in June, July, August, and September was 3.7, 4.0, 4.5, and 2.5 mm d−1, respectively. Considering the most important atmospheric factors controlling evaporation, a positive correlation between the EC evaporation, wind speed, and air temperature, a negative correlation for the relative humidity, and no correlation between EC evaporation and solar radiation were observed at an hourly scale.
The Class A pan installed at Alquilha station provided hourly and daily pan evaporation values. The total pan evaporation from June to September 2014 was 797.9 mm, and the mean daily evaporation in June, July, August, and September was 6.9, 7.7, 7.3, and 4.3 mm d−1, respectively. Positive correlations were observed between the hourly pan evaporation and air temperature and solar radiation, whereas a negative correlation was found between the hourly pan evaporation and the relative humidity. A weak correlation existed between the hourly pan evaporation and wind speed.
A sensitivity analysis of the daily pan evaporation and daily EC evaporation with air temperature, relative humidity, wind speed, and solar radiation strengthens the ability to establish a relationship between the open EC evaporation and pan evaporation at the daily scale.
We found that the daily pan evaporation coefficient could be expressed by a multivariable function of wind speed, air temperature, relative humidity, and solar radiation measured at Alquilha station. Further, model validation was performed for the same four summer months in 2017. The modelled pan coefficients (Kpan) were 0.59, 0.57, 0.57, and 0.64 in June, July, August, and September, respectively; the modelled daily mean ERes was 3.9, 4.2, 4.5, and 2.7 mm d−1 for June, July, August, and September, respectively. The total modelled evaporation was 455.8 mm, remarkably similar to the total output from EC measurements, and corresponds to 101.3 % of the measured EC evaporation from the reservoir.
The evaporation model proposed in this study can assist and improve water management in the MAP. Moreover, the methodology could also be applied to other reservoirs, and the equation developed for Alqueva Reservoir could act as a first evaluation for the management of other reservoirs in the region.
Data obtained during the ALEX 2014 observational experiment and used in this study are available via http://www.alex2014.cge.uevora.pt/data/ (last access: 29 May 2020) (Salgado et al., 2020a). Data obtained during the ALOP and used here are available via http://www.alop.ict.uevora.pt/index.php/dados/?lang=en (last access: 29 May 2020) (Salgado et al., 2020b).
The four authors conceptualised the study. CMR and MP designed and carried out the experiments. RCG performed the model simulations. MM wrote the first draft manuscript. All four authors contributed to the analysis, interpretation and writing.
The authors declare that they have no conflict of interest.
The authors gratefully acknowledge the Foundation for Science and Technology (FCT), project ALEX 2014 (EXPL/GEO-MET/5 1422/2013) FCOMP-01-0124-FEDER-041840, project ALOP (ALT20-03-0145-FEDER-000004), and project AGIR (PDR2020-1.0.1-FEADER-031864). The authors would like to thank Martinho Murteira from EDIA (Empresa de Desenvolvimento e Infraestruturas do Alqueva S. A.) for providing direct access to Alquilha meteorological data. Special thanks to Rui Salgado, scientifically responsible for the ALEX 2014 and ALOP projects, for the indispensable support and encouragement.
This research has been supported by the Foundation for Science and Technology (FCT) (grant no. UIDB/05183/2020), ALEX 2014 (grant no. EXPL/GEO-MET/1422/2013), ALOP (grant no. ALT20-03-0145-FEDER-000004), AGIR (grant no. PDR2020-1.0.1-FEADER-031864), and FCT PostDoc (grant no. SFRH/BPD/97408/2013).
This paper was edited by Ryan Teuling and reviewed by Femke Jansen and one anonymous referee.
Alcon, F., García-Bastida, P. A., Soto-García, M., Martinez-Alvarez, V., Martin-Gorriz, B., and Baille, A.: Explaining the performance of irrigation communities in a water-scarce region, Irrig. Sci., 35, 193–203, https://doi.org/10.1007/s00271-016-0531-7, 2017. a
Allen, R. G. and Tasumi, M.: Evaporation from American Falls Reservoir in Idaho via a combination of Bowen ratio and eddy covariance, in: Proceedings of the 2005 World Water & Environmental Resources Congress: Impacts of Global Climate Change, 15–19 May 2005, Anchorage, Alaska, https://doi.org/10.1061/40792(173)527, 2005. a
Allen, R. G., Pereira, L. S., Raes, D., and Smith, M.: Crop evapotranspiration: Guidelines for computing crop water requirements, FAO Irrigation and Drainage Paper 56, FAO, Rome, p. 300, 1998. a, b, c, d, e
Arya, S. P.: Introduction to Micrometeorology, 2nd edition, Academic Press, New York, p. 420, 2001. a
Blanken, P. D., Rouse, W. R., Culf, A. D., Chris, S., Dale, B. L., Jasper, J. N., Bob, K., Schertzer, W. M., Philip, M., and Diana, V.: Eddy covariance measurements of evaporation from Great Slave Lake, Northwest Territories, Canada, Water Resour. Res., 36, 1069–1077, https://doi.org/10.1029/1999WR900338, 2000. a, b
EDIA: Empresa de Desenvolvimento e Infraestruturas do Alqueva, abailable at: https://www.edia.pt/en/alqueva/the-territory, last access: 30 March 2020. a
Ferguson, H. L., Hartog, G., and Louie, P. Y. T.: Estimation of shallow lake evaporation using Class A pan data, in: Casebook on Operational Assessment of Areal Evaporation, Operational Hydrology Reports 22, World Meteorological Organization, Geneva, 3–10, 1985. a
Gangopadhyaya, M.: Measurement and estimation of evaporation and evapotranspiration, World Meteorological Organization, Report of a Working Group on evaporation Measurement of the Commission for Instruments and Methods of Observation, Geneva, Switzerland, p. 143, 1966. a
Hoekstra, A. Y., Mekonnen, M. M., Chapagain, A. K., Mathews, R. E., and Richter, B. D.: Global monthly water scarcity: blue water footprints versus blue water availability, PLoS ONE, 7, e32688, https://doi.org/10.1371/journal.pone.0032688, 2012. a
Jacobs, A., Heusinkveld, B., and Lucassen, D.: Temperature variation in a Class A evaporation pan, J. Hydrol., 206, 75–83, https://doi.org/10.1016/S0022-1694(98)00087-0, 1998. a
Jansen, F. A. and Teuling, A. J.: Evaporation from a large lowland reservoir –(dis)agreement between evaporation models from hourly to decadal timescales, Hydrol. Earth Syst. Sci., 24, 1055–1072, https://doi.org/10.5194/hess-24-1055-2020, 2020. a
Kohler, M. A., Nordenson, T. J., and Fox, W. E.: Evaporation from pans and lakes, Research Paper 38, US Weather Bureau, Washington, p. 21, 1955. a
Kohli, A. and Frenken K.: Evaporation from artificial lakes and reservoirs, FAO – AQUASTAT Reports, FAO, Rome, p. 10, 2015. a
Lasdon, L. S., Fox, R. L., and Ratner, M. W.: Nonlinear optimization using the generalized reduced gradient method, Revue Française d'Automatique, d'Informatique et de Recherche Opérationnelle, Recherche Opérationnelle, 8, 73–103, 1974. a
Lim, W. H., Roderick, M. L., Hobbins, M. T., Wong, S. C., and Farquhar, G. D. The energy balance of a US Class A evaporation pan, Agr. Forest Meteorol., 182, 314–331, https://doi.org/10.1016/j.agrformet.2013.07.001, 2013. a
Linsley, R. K., Kohler, M. A., and Paulhus, J. L. H.: Hydrology for engineers, 3rd Edn., McGraw-Hill, New York, p. 508, 1982. a
Liu, H., Feng, J., Sun, J., Wang, L., and Xu, A.: Eddy covariance measurements of water vapor and CO2 fluxes above the Erhai Lake, Sci. China Earth Sci., 58, 317–328, https://doi.org/10.1007/s11430-014-4828-1, 2015. a
Liu, X., Yu, J., Wang, P., Zhang, Y., and Du, C.: Lake evaporation in a hyper-arid environment, Northwest of China – Measurement and estimation, Water 8, 527, https://doi.org/10.3390/w8110527, 2016. a
Ma, N., Szilagyi, J., Niu, G. Y., Zhang, Y., Zhang, T., Wang, B., and Wu, Y.: Evaporation variability of Nam Co Lake in the Tibetan Plateau and its role in recent rapid lake expansion, J. Hydrol., 537, 27–35, https://doi.org/10.1016/j.jhydrol.2016.03.030, 2016. a
Metzger, J., Nied, M., Corsmeier, U., Kleffmann, J., and Kottmeier, C.: Dead Sea evaporation by eddy covariance measurements vs. aerodynamic, energy budget, Priestley–Taylor, and Penman estimates, Hydrol. Earth Syst. Sci., 22, 1135–1155, https://doi.org/10.5194/hess-22-1135-2018, 2018. a
Ning, M., Zhang, Y., Xu, C. Y., and Jozsef, S.: Modeling actual evapotranspiration with routine meteorological variables in the data-scarce region of the Tibetan Plateau: Comparisons and implications, J. Geophys. Res.-Biogeo., 120, 1638–1657, https://doi.org/10.1002/2015JG003006, 2015. a
Nordbo, A., Launiainen, S., Mammarella, I., Lepparanta, M., Huotari, J., Ojala, A., and Vesala, T.: Long-term energy flux measurements and energy balance over a small boreal lake using eddy covariance technique, J. Geophys. Res.-Atmos., 116, 3–25, https://doi.org/10.1029/2010JD014542, 2011. a, b, c
Pereira, R., Nova, N., Pereira, A., and Barbieri, V.: A model for the class A pan coefficient, Agr. Forest Meteorol., 76, 75–82, https://doi.org/10.1016/0168-1923(94)02224-8, 1995. a
Potes, M., Salgado, R. Costa, M. J., Morais, M., Bortoli, D., Kostadinov, I., and Mammarella, I.: Lake–atmosphere interactions at Alqueva reservoir: a case study in the summer of 2014, Tellus A, 69, 1272787, https://doi.org/10.1080/16000870.2016.1272787, 2017. a, b, c, d
Pradhan, S., Sehgal, B., Das, D., Bandyopadhyay, K. K., and Singh, R.: Evaluation of pan coefficient methods for estimating FAO-56 reference crop evapotranspiration in a semi-arid environment, J. Agrometeorol., 15, 90–93, 2013. a
Richardson, A. D., Aubinet, M., Barr, A. G., Hollinger, D. Y., Ibrom, A., Lasslop, G., and Reichstein, M.: Uncertainty quantification, in: Eddy Covariance: A Practical Guide to Measurement and Data Analysis, edited by: Aubinet, M., Vesala, T., and Papale, D., Springer, Dordrecht, 173–210, 2012. a
Riley, J. J.: The heat balance of Class A evaporation pan, Water Resour. Res., 2, 223–226, https://doi.org/10.1029/WR002i002p00223, 1966. a
Rimmer, A., Samuels, R., and Lechinsky, Y.: A comprehensive study across methods and time scales to estimate surface fluxes from Lake Kinneret, Israel, J. Hydrol., 379, 181–192, https://doi.org/10.1016/j.jhydrol.2009.10.007, 2009. a
Rivas-Tabares, D., Tarquis, A., Willaarts, B., and Miguel, A.: An accurate evaluation of water availability in sub-arid Mediterranean watersheds through SWAT: Cega-Eresma-Adaja, Agr. Water Manage., 212, 211–225, https://doi.org/10.1016/j.agwat.2018.09.012, 2019. a
Rodrigues, C. M.: Cálculo da evaporação de albufeiras de grande regularização do sul de Portugal, PhD Thesis, Universidade de Évora, Évora, Portugal, available at: http://hdl.handle.net/10174/11108 (last access: 29 May 2020), 2009. a, b
Salgado, R. and LeMoigne, P.: Coupling of the FLake model to the Surfex externalized surface model, Agr. Water Manage., 15, 231–244, 2010. a
Salgado, R., Potes, M., Albino, A., Apolinário, J., Barbosa, S., Bárias, S., Beliche, P., Bortoli, D., Canhoto, P., Costa, M. J., Fernandes, R. M., Harrison, G., Ilhéu, A., Le Moigne, P., Lima, R., Lopes, F., Lopes, T., Marques, J., Melgão, M., Miranda, P. M., Morais, M., Murteira, M., Nicoll, K., Novais, M. H., Parrondo, M. C., Pereira, S., Policarpo, C., Prior, V., Rodrigues, C. M., Rosado, J., Sá, A., Serafim, A., Silva, H., Soares, P. M. M., Tlemçani, M., and Zavattieri, A.: The ALEX2014 Alqueva hydro-meteorological database, available at: http://www.alex2014.cge.uevora.pt/data/ (last access: 29 May 2020), 2020a. a
Salgado, R., Morais, M., Palma, P., Potes, M., Penha, A., Novais, M. H., Antunes, C., Aranha, S., Bárias, S., Barrenho, J., Bortoli, D., Canhoto, P., Costa, A., Costa, M. J., Fialho, S., Figueira, J., Galveias, A., Lima, A. F., Lima, M., Lopes, O., Mavioso, I., Mira, M. I., Morales, E., Moreira, M., Nunes, S., Pereira, M., Purificação, C., Reis, A. H., Rodrigues, G., Rosado, A., Rodrigues, C. M., Saúde, A., Silva, A. M., Tomaz, A., and Yakunin, M.: The ALOP Alentejo Observation and Prediction system database, available at: http://www.alop.ict.uevora.pt/index.php/dados/?lang=en (last access: 29 May 2020), 2020b. a
Stull, R. B.: An introduction to boundary layer meteorology, 3rd Edn., Kluwer Academic Publishers, Dordrecht, the Netherlands, p. 670, 2001. a
Tanny, J., Cohen, S., Assouline, S., Lange, F., Grava, A., Berger, D., Teltch, B., and Parlange, M.: Evaporation from a small water reservoir: direct measurements and estimates, J. Hydrol., 351, 218–229, https://doi.org/10.1016/j.jhydrol.2007.12.012, 2008. a, b
Tomas-Burguera, M., Vicente-Serrano, S. M., Grimalt, M., and Beguería, S.: Accuracy of reference evapotranspiration (ET0) estimates under data scarcity scenarios in the Iberian Peninsula, Agr. Water Manage., 182, 103–116, https://doi.org/10.1016/j.agwat.2016.12.013, 2017. a
Vesala, T., Eugster, W., and Ojala, A.: Eddy covariance measurements over lakes, in: Eddy Covariance. A Practical Guide to Measurement and Data Analysis, edited by: Aubinet, M., Vesala, T., and Papale, D., Springer, Dordrecht, 365–376, 2012. a
WMO – World Meteorological Organization: Guide to Instruments and Methods of Observation, WMO No. 8, in: Volume I – Measurement of Meteorological Variables, WMO, Geneva, 2018. a
Yu, T.-F., Si, J.-H., Feng, Q., Xi, H.-Y., Chu, Y.-W., and Li, K.: Simulation of Pan Evaporation and Application to Estimate the Evaporation of Juyan Lake, Northwest China under a Hyper-Arid Climate, Water, 9, 952, https://doi.org/10.3390/w9120952, 2017. a
Zhang, Q. and Liu, H.: Seasonal changes in physical processes controlling evaporation over inland water, J. Geophys. Res.-Atmos., 119, 9779–9792, https://doi.org/10.1002/2014JD021797, 2014. a