the Creative Commons Attribution 4.0 License.
the Creative Commons Attribution 4.0 License.
 | 24 Nov 2020
Rapid reduction in ecosystem productivity caused by flash droughts based on decade-long FLUXNET observations
Miao Zhang
A flash drought is characterized by its rapid onset and arouses widespread concerns due to its devastating impacts on the environment and society without sufficient early warnings. The increasing frequency of soil moisture flash droughts in a warming climate highlights the importance of understanding its impact on terrestrial ecosystems. Previous studies investigated the vegetation dynamics during several extreme cases of flash drought, but there is no quantitative assessment on how fast the carbon fluxes respond to flash droughts based on decade-long records with different climates and vegetation conditions. Here we identify soil moisture flash drought events by considering decline rate of soil moisture and the drought persistency, and we detect the response of ecosystem carbon and water fluxes to a soil moisture flash drought during its onset and recovery stages based on observations at 29 FLUXNET stations from croplands to forests. Corresponding to the sharp decline in soil moisture and higher vapor pressure deficit (VPD), gross primary productivity (GPP) drops below its normal conditions in the first 16 d and decreases to its minimum within 24 d for more than 50 % of the 151 identified flash drought events, and savannas show highest sensitivity to flash drought. Water use efficiency increases for forests but decreases for cropland and savanna during the recovery stage of flash droughts. These results demonstrate the rapid responses of vegetation productivity and resistance of forest ecosystems to flash drought.
- Article
(7967 KB) - Full-text XML
- BibTeX
- EndNote


Terrestrial ecosystems play a key role in the global carbon cycle and absorb about 30 % of anthropogenic carbon dioxide emissions during the past five decades (Le Quéré et al., 2018). With more climate extremes (e.g., droughts, heat waves) in a warming climate, the rate of future land carbon uptake is highly uncertain regardless of the fertilization effect of rising atmospheric carbon dioxide (Green et al., 2019; Reichstein et al., 2013; Xu et al., 2019). Terrestrial ecosystems can even turn to carbon sources during extreme drought events (Ciais et al., 2005). Record-breaking drought events have caused enormous reductions of the ecosystem gross primary productivity (GPP), e.g., the European 2003 drought (Ciais et al., 2005; Reichstein et al., 2007), USA 2012 drought (Wolf et al., 2016), China 2013 drought (Xie et al., 2016; Yuan et al., 2016), southern Africa 2015–2016 drought (Yuan et al., 2017) and Australia millennium drought (Banerjee et al., 2013). The 2012 summertime drought in the USA was classified as a flash drought with rapid intensification and insufficient early warning, which caused a 26 % reduction in crop yield (Hoerling et al., 2014; Otkin et al., 2016). A flash drought may only need several weeks to develop into its maximum intensity, and the rapid onset distinguishes it from traditional drought, which is assumed to be a slowly evolving climate phenomenon taking several months or even years to develop (Otkin et al., 2018a). Several extreme flash droughts would ultimately propagate into long-term droughts due to persistent precipitation deficits, e.g., the 2012 flash drought over the USA Midwestern plain (Basara et al., 2019). Flash droughts have aroused wide concerns for their unusually rapid development and detrimental effects (Basara et al., 2019; Christian et al., 2019; Ford and Labosier, 2017; Nguyen et al., 2019; Otkin et al., 2018a, b; Wang and Yuan, 2018; Yuan et al., 2015, 2017; X. Yuan et al., 2019). Despite the increasing occurrence and clear ecological impacts of flash droughts, our understanding of their impacts on carbon uptake in terrestrial ecosystems remains incomplete.
Previous studies mainly focused on the response of vegetation to long-term droughts and found that the response time ranged from several months to years through correlation analysis (Vicente-Serrano et al., 2013; Xu et al., 2018). The response time of vegetation to flash droughts might be different, which requires further investigation for quantification. Recent studies assessed the impact of flash droughts on vegetation, including the 2012 central USA flash drought and the 2016 and 2017 northern USA flash drought. For instance, Otkin et al. (2016) used the evaporative stress index (ESI) to detect the onset of the 2012 central USA flash drought and found the decline in ESI preceded the drought according to the United States Drought Monitor (Svoboda et al., 2002). He et al. (2019) assessed the impacts of the 2017 northern USA flash drought (which also impacted parts of southern Canada) on vegetation productivity based on GOME-2 solar-induced fluorescence (SIF) and satellite-based evapotranspiration in the US northern plains. Otkin et al. (2019) examined the evolution of vegetation conditions using LAI from MODIS during the 2015 flash drought over the south-central United States and found that the LAI decreased after the decline of soil moisture. As well as this, the 2016 flash drought over US northern plains also decreased agricultural production (Otkin et al., 2018b). However, previous impact studies only focused on a few extreme flash drought cases without explicit definition of flash drought events. As the baseline climate is changing (X. Yuan et al., 2019), it is necessary to systematically investigate the response of terrestrial carbon and water fluxes to flash drought events based on long-term records rather than one or two extreme cases.
In fact, there are numerous studies on the influence of droughts on ecosystem productivity (Ciais et al., 2005; Stocker et al., 2018, 2019). It is found that understanding the coupling of water–carbon fluxes during droughts is the key to revealing the adaptation and response mechanisms of vegetation to water stress (Boese et al., 2019; Nelson et al., 2018). Water use efficiency (WUE) is the metric for understanding the trade-off between carbon assimilation and water loss through transpiration (Beer et al., 2009; Cowan and Farquhar, 1977; Zhou et al., 2014, 2015), and it is influenced by environmental factors including atmospheric dryness and soil moisture limitations (Boese et al., 2019). Although WUE has been widely studied for seasonal to decadal droughts, few studies have investigated WUE during flash droughts that usually occur at a sub-seasonal timescale (Xie et al., 2016; Zhang et al., 2019).
In this paper, we address the ecological impact of soil moisture flash droughts through analyzing FLUXNET decade-long observations of CO2 and water fluxes. Here we consider not only the rapid onset stage of soil moisture flash droughts but also the recovery stage to assess the ecological impacts. The ecological responses to water stress vary under different ecosystems and drought characteristics, and the focus on the soil moisture flash droughts would detect the breakdown of ecosystem functioning of photosynthesis. The specific goals are to (1) examine the response of carbon and water fluxes to soil moisture flash droughts from the onset to the recovery stages and (2) investigate how WUE changes during soil moisture flash droughts for different ecosystems. The methodology proposed by X. Yuan et al. (2019) enables the analysis of the flash droughts with characteristics of duration, frequency and intensity in the historical observations. All the flash drought events that occurred at the FLUXNET stations are selected to investigate the response of carbon fluxes and WUE. Records of more than 10 years of soil moisture, carbon and water fluxes are available (Baldocchi et al., 2002), which makes it possible to assess the response of vegetation to flash droughts by considering different climates and ecosystem conditions.
2.1 Data
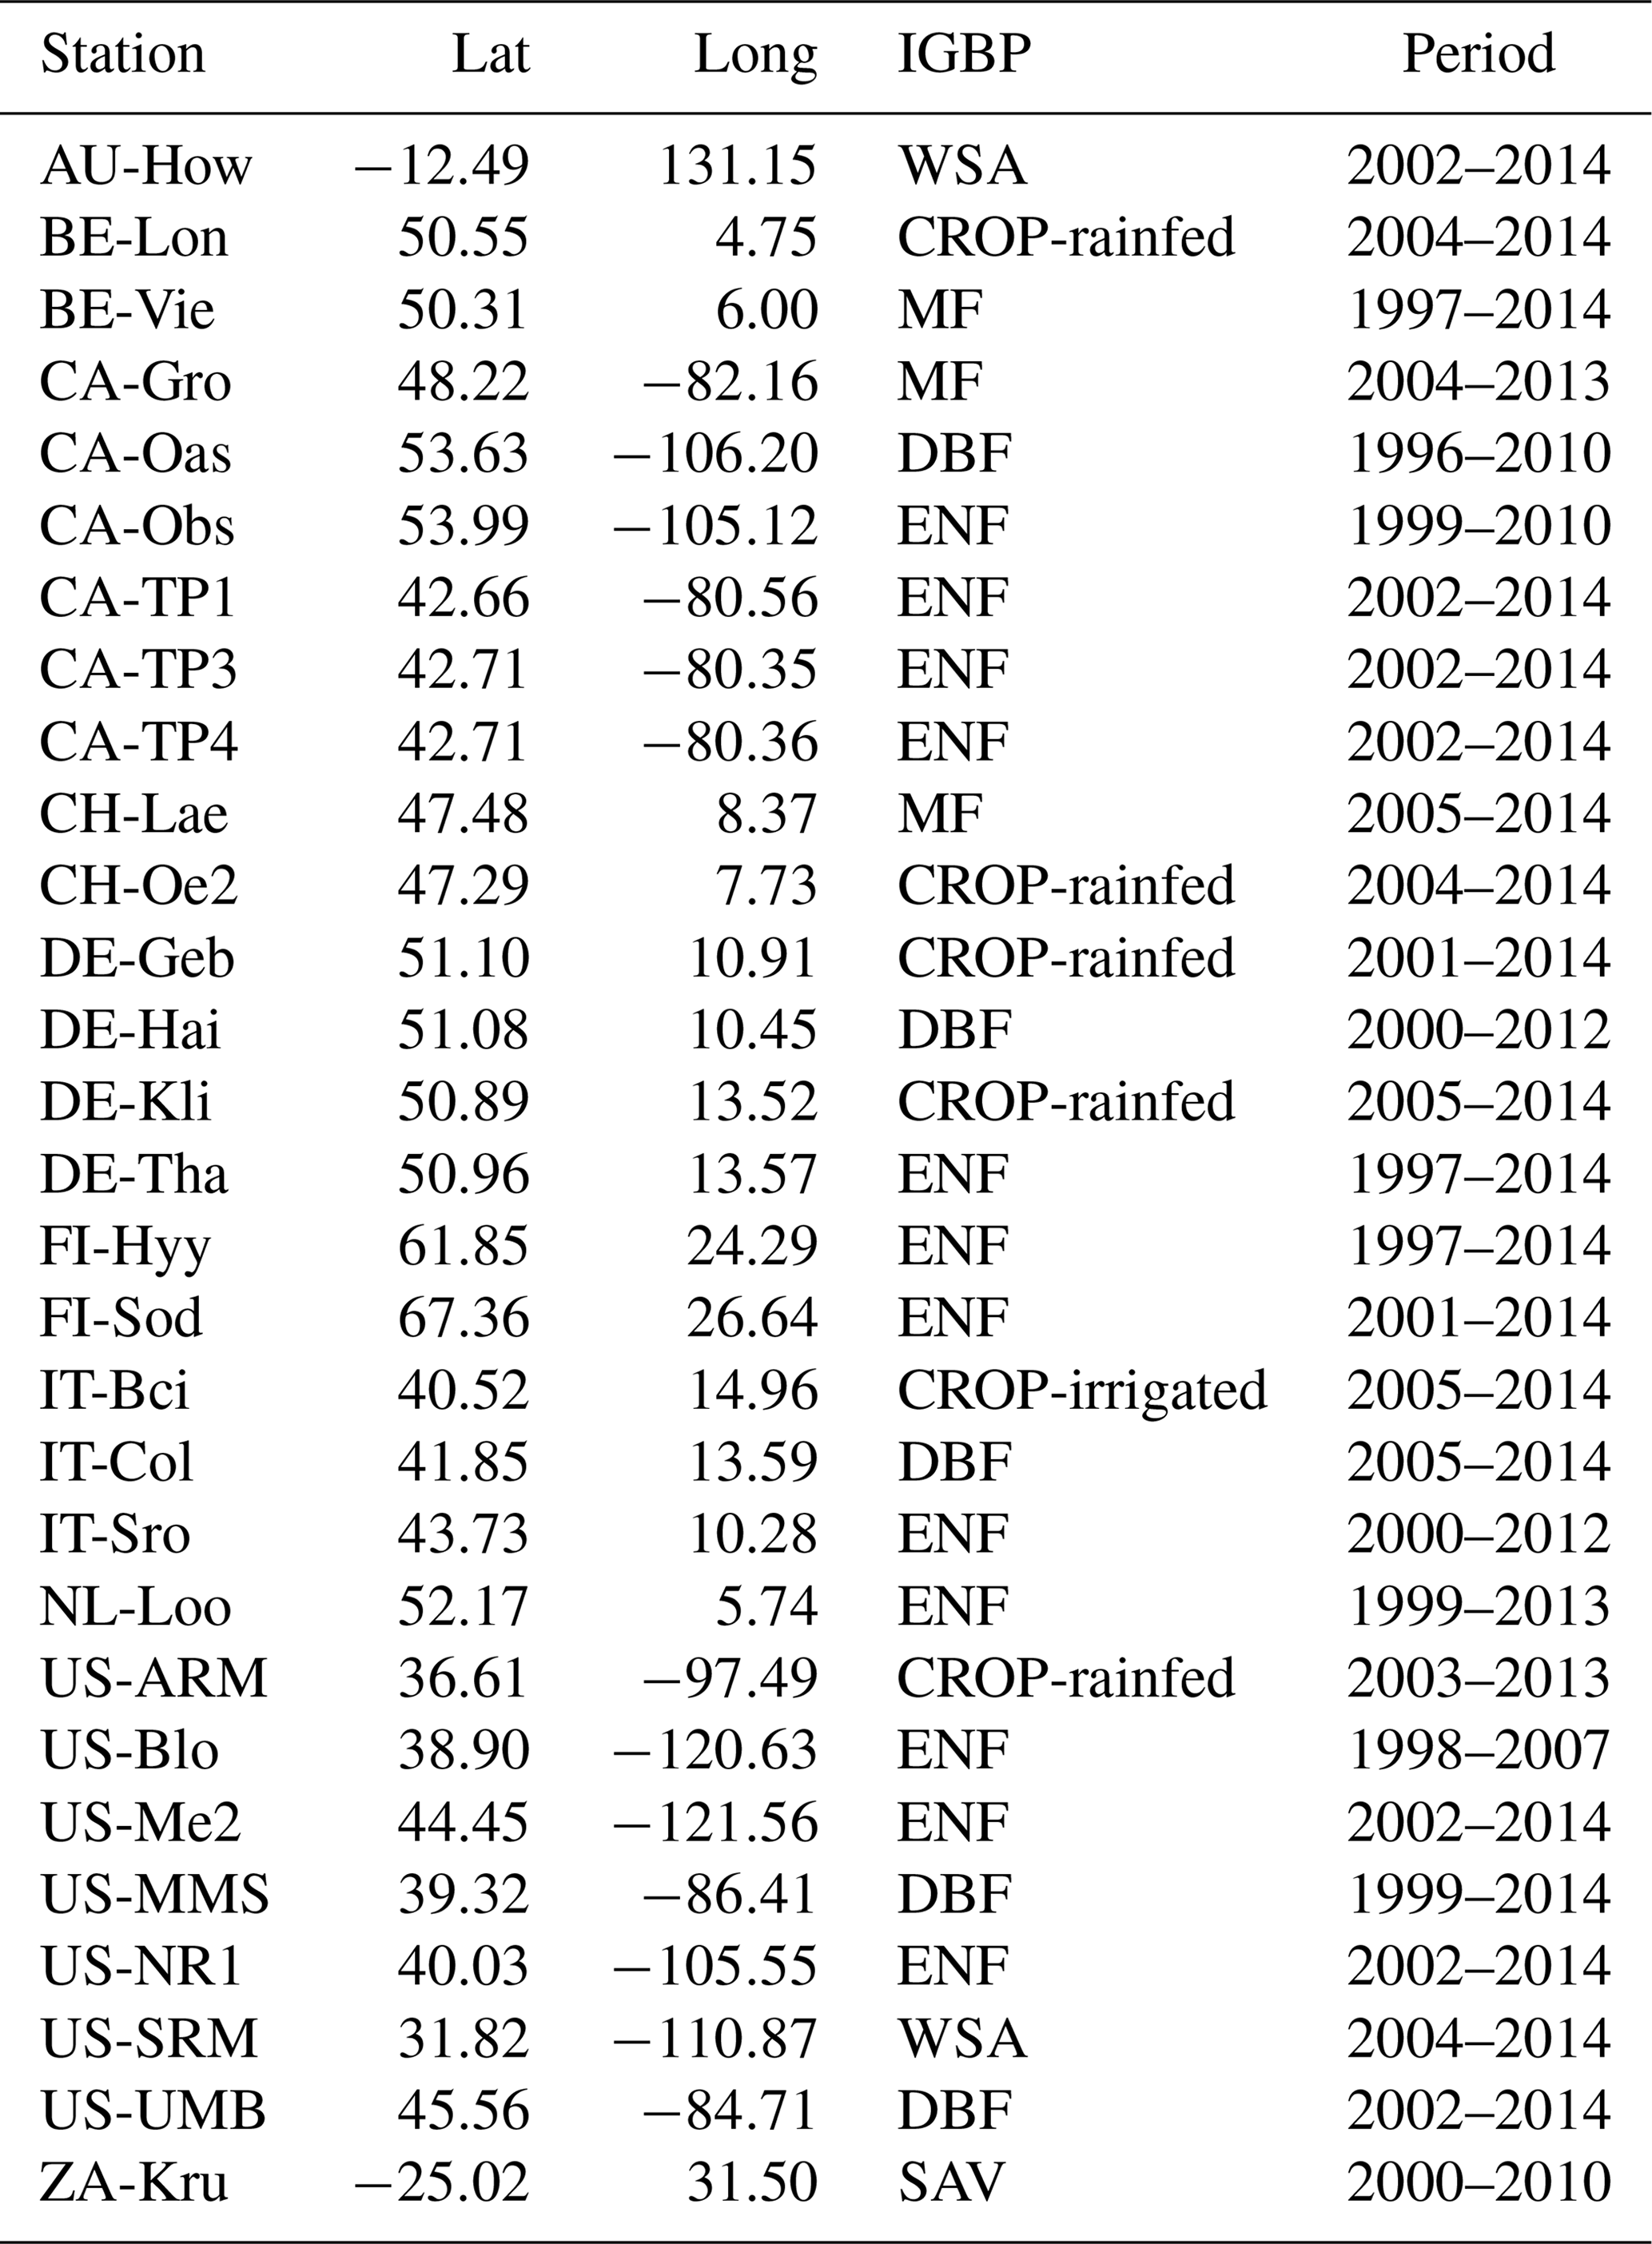
FLUXNET2015 provides daily hydrometeorological variables including precipitation, temperature, saturation vapor pressure deficit (VPD), soil moisture (SM), shortwave radiation (SW), evapotranspiration (ET) inferred from latent heat, and carbon fluxes including GPP and net ecosystem productivity (NEP). We use GPP data based on nighttime partitioning method (GPP_NT_VUT_REF). Considering most sites only measure the surface soil moisture, here we use daily soil moisture measurements mainly at the depth of 5–10 cm averaged from half-hourly data. Soil moisture observations are usually averaged over multiple sensors including time domain reflectometer (TDR), frequency domain reflectometer (FDR) and water content reflectometer etc. However, the older devices may be replaced with newer devices at certain sites, which may decrease the stability of long-term soil moisture observations, and the average observation error of soil moisture is ±2 %. All daily hydrometeorological variables and carbon fluxes are summed to an 8 d timescale to study the flash drought impact. There are 34 sites from the FLUXNET 2015 dataset (Table 1) consisting of 8 vegetation types, where the periods of observations are no less than 10 years ranging from 1996 to 2014, and the rates of missing data are lower than 5 %. Here we only select the FLUXNET observations including 12 evergreen needleleaf forest sites (ENF), 5 deciduous broadleaf forests (DBF), 6 crop sites (CROP; 5 rain-fed sites and 1 irrigated site), 3 mixed forests (MF) and 3 savannas (SAV). The sites for grasslands, evergreen broadleaf forests and shrublands are excluded because there are less than 10 soil moisture flash drought events. The vegetation classification is according to International Geosphere-Biosphere Program (IGBP; Belward et al., 1999), where MF is dominated by neither deciduous nor evergreen tree types with tree cover higher than 60 %, and the land tree cover is 10 %–30 % for SAV. The detailed information is listed in Table 1.
Table 1Locations, vegetation types and data periods of flux tower sites used in this study. WSA: woody savanna; CROP: cropland; EBF: evergreen broadleaf forests; MF: mixed forest; DBF: deciduous broadleaf forest; ENF: evergreen needleleaf forest; GRA: grassland; SAV: savanna.
2.2 Methods
2.2.1 Definition of soil moisture flash drought events
The definition of soil moisture flash drought should account for both its rapid intensification and the drought conditions (Otkin et al., 2018a; X. Yuan et al., 2019). Here we used soil moisture percentiles to identify soil moisture flash droughts according to X. Yuan et al. (2019) and Ford and Labosier (2017). Figure 1 shows the procedure for soil moisture flash drought identification, including five criteria to identify the rapid onset and recovery stages of soil moisture flash drought. (1) The soil moisture flash drought starts at the middle day of the 8 d period when the 8 d mean soil moisture is less than the 40th percentile, and the 8 d mean soil moisture prior to the starting time should be higher than 40th percentile to ensure the transition from a non-drought condition. (2) The mean decreasing rate of the 8 d mean soil moisture percentile should be no less than 5 % per 8 d to address the rapid drought intensification. (3) The 8 d mean soil moisture after the rapid decline should be less than 20 %, and the period from the beginning to the end of the rapid decline is regarded as the onset stage of soil moisture flash drought (those within red dashed line in Fig. 1). (4) If the mean decreasing rate is less than 5 % or the soil moisture percentile starts to increase, the soil moisture flash drought enters into the “recovery” stage, and the soil moisture flash drought event (as well as the recovery stage) ends when soil moisture recovers to above the 20th percentile (those within blue dashed line in Fig. 1). The recovery stage is also crucial to assess the impact of soil moisture flash drought (X. Yuan et al., 2019). (5) The minimum duration of a flash drought event is 24 d to exclude those dry spells that last for too short a period to cause any impacts.
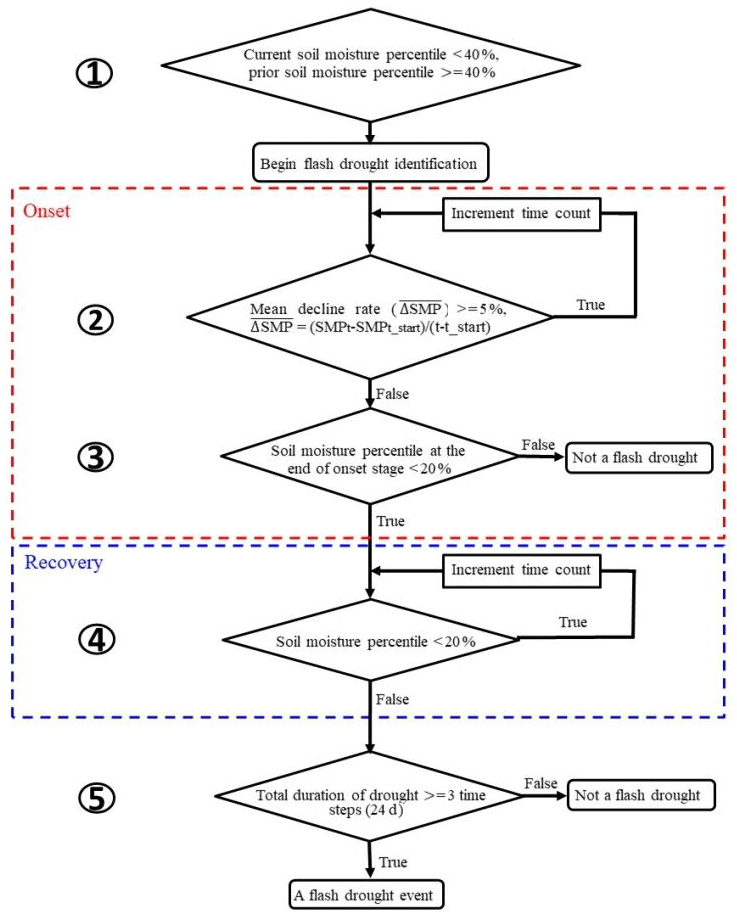
Figure 1A flowchart of flash drought identification by considering soil moisture decline rate and drought persistency.
Observations at least a decade long of 8 d mean soil moisture are used to calculate soil moisture percentile with a moving window of 8 d before and 8 d after the target 8 d, resulting in at least 30 samples for deriving the cumulative distribution function of soil moisture before calculating percentiles. Besides, the target 8 d soil moisture percentiles are only based on the target 8 d soil moisture in the context of the expanded samples. For example, the soil moisture percentile of 22 June 1998 is calculated by firstly ranking 14, 22 and 30 June soil moisture in all historical years (N samples) from lowest to highest, identifying the rank of soil moisture of 22 June 1998 (e.g., M), and obtaining the percentile as . We focus on growing seasons during April–September for sites in the Northern Hemisphere and October–March for sites in the Southern Hemisphere.
2.2.2 Response time of GPP to soil moisture flash drought
Drought has a large influence on ecosystem productivity through altering the plant photosynthesis and ecosystem respiration (Beer et al., 2010; Green et al., 2019; Heimann and Reichstein, 2008; Stocker et al., 2018). GPP dominates the global terrestrial carbon sink and it would decrease due to stomatal closure and non-stomatal limitations like reduced carboxylation rate and reduced active leaf area index (de la Motte et al., 2020) under water stress. The negative anomalies of GPP during soil moisture flash droughts are considered as the onset of ecological response. Here, we use two response time indices to investigate the relationship between soil moisture flash drought and ecological drought (Crausbay et al., 2017; Niu et al., 2018; Song et al., 2018; Vicente-Serrano et al., 2013): (1) the response time of the first occurrence (RT) of negative standardized GPP anomaly (SGPPA = , where μGPP and σGPP are mean and standard deviation of the time series of GPP at the same dates as the target 8 d for all years, which can remove the influence of seasonality. For instance, all 1–8 April periods during 1996–2014 would have a μGPP and a σGPP based on a climatology the same as the soil moisture percentile calculation which consists of 24–31 March, 1–8 and 9–16 April periods in all years, and 9–16 April would have another μGPP and another σGPP, and so on), which is the lag time between the start of flash drought and the time when SGPPA becomes negative during the flash drought period, and (2) the response time of the occurrence of minimum SGPPA (RTmin), which is the lag time between the start of flash drought and the time when SGPPA decreases to its minimum values during the flash drought period. If the response time is 8 d for the first occurrence of negative SGPPA, it means that the response of GPP starts at the beginning of flash drought (the first time step of flash drought). Considering flash drought is identified through surface soil moisture due to the availability of FLUXNET data, vegetation with deeper roots may obtain water in deep soil and remain healthy during flash drought. The roots vary among different vegetation types and forests are assumed to have deeper roots than grasslands, which may influence the response to soil moisture flash droughts.
2.2.3 Water use efficiency
Carbon assimilation and transpiration are coupled by stomates, and plants face a tradeoff between carbon uptake through photosynthesis and water loss through transpiration under the influence of water and energy availability (Boese et al., 2019; Gentine et al., 2019; Huang et al., 2016; Nelson et al., 2018). WUE can be used to quantify the trade-off between carbon and water cycles and is defined as the assimilated amount of carbon per unit of water loss (Peters et al., 2018). At the ecosystem scale, WUE is the ratio of GPP to ET (Cowan and Farquhar, 1977). Drought would cause stomatal closure and non-stomatal adjustments in biochemical functions, thus altering the coupling between GPP and ET. Underlying WUE (uWUE) is calculated as considering the nonlinear relationship between GPP, VPD and ET (Zhou et al., 2014). uWUE is supposed to reflect the relationship of photosynthesis and transpiration via stomatal conductance at the ecosystem level by considering the effect of VPD on WUE (Beer et al., 2009; Boese et al., 2019; Zhou et al., 2014, 2015). WUE varies under the influence of VPD on canopy conductance (Beer et al., 2009; Tang et al., 2006), whereas uWUE is considered to remove this effect and be more directly linked with the relationship between environmental conditions (e.g., soil moisture) and plant conditions (e.g., carboxylation rate; Lu et al., 2018). The standardized anomalies of WUE and uWUE are calculated in the same way as SGPPA, where different sites have different mean values and standard deviations for different target 8 d periods to remove the spatial and temporal inhomogeneity.
2.2.4 The relations between meteorological conditions and GPP
Considering the compound impacts of temperature, radiation, VPD and soil moisture on vegetation photosynthesis, the partial correlation is used to investigate the relationship between GPP and each climate factor, with the other three climate factors as control variables as follows:
where i represents GPP, j represents the target meteorological variables, and m1, m2, … and mn represent the control meteorological variables. is the partial correlation coefficient between i and j, and , and are partial correlation coefficients between i and j, i and mn, and j and mn respectively under control of m1, m2 … and mn−1.
3.1 Identification of flash drought events at FLUXNET stations
Based on FLUXNET data, we have identified 151 soil moisture flash drought events with durations longer than or equal to 24 d using soil moisture observations of 371 site years. Figure 2a shows the distribution of the 29 sites with different vegetation types, which are mainly distributed over North America and Europe. The number of soil moisture flash droughts ranges from 13 to 70 events among different vegetation types. There are 12 ENF sites in this study, and the number of soil moisture flash droughts for ENF (70) is the most among all the vegetation types. The duration for flash drought events ranges from 24 d to several months. In some extreme cases, the flash droughts would develop into long-term droughts without enough rainfall to alleviate drought conditions. Mean durations of soil moisture flash droughts for different vegetation types range from around 30 to 50 d (Fig. 2c).
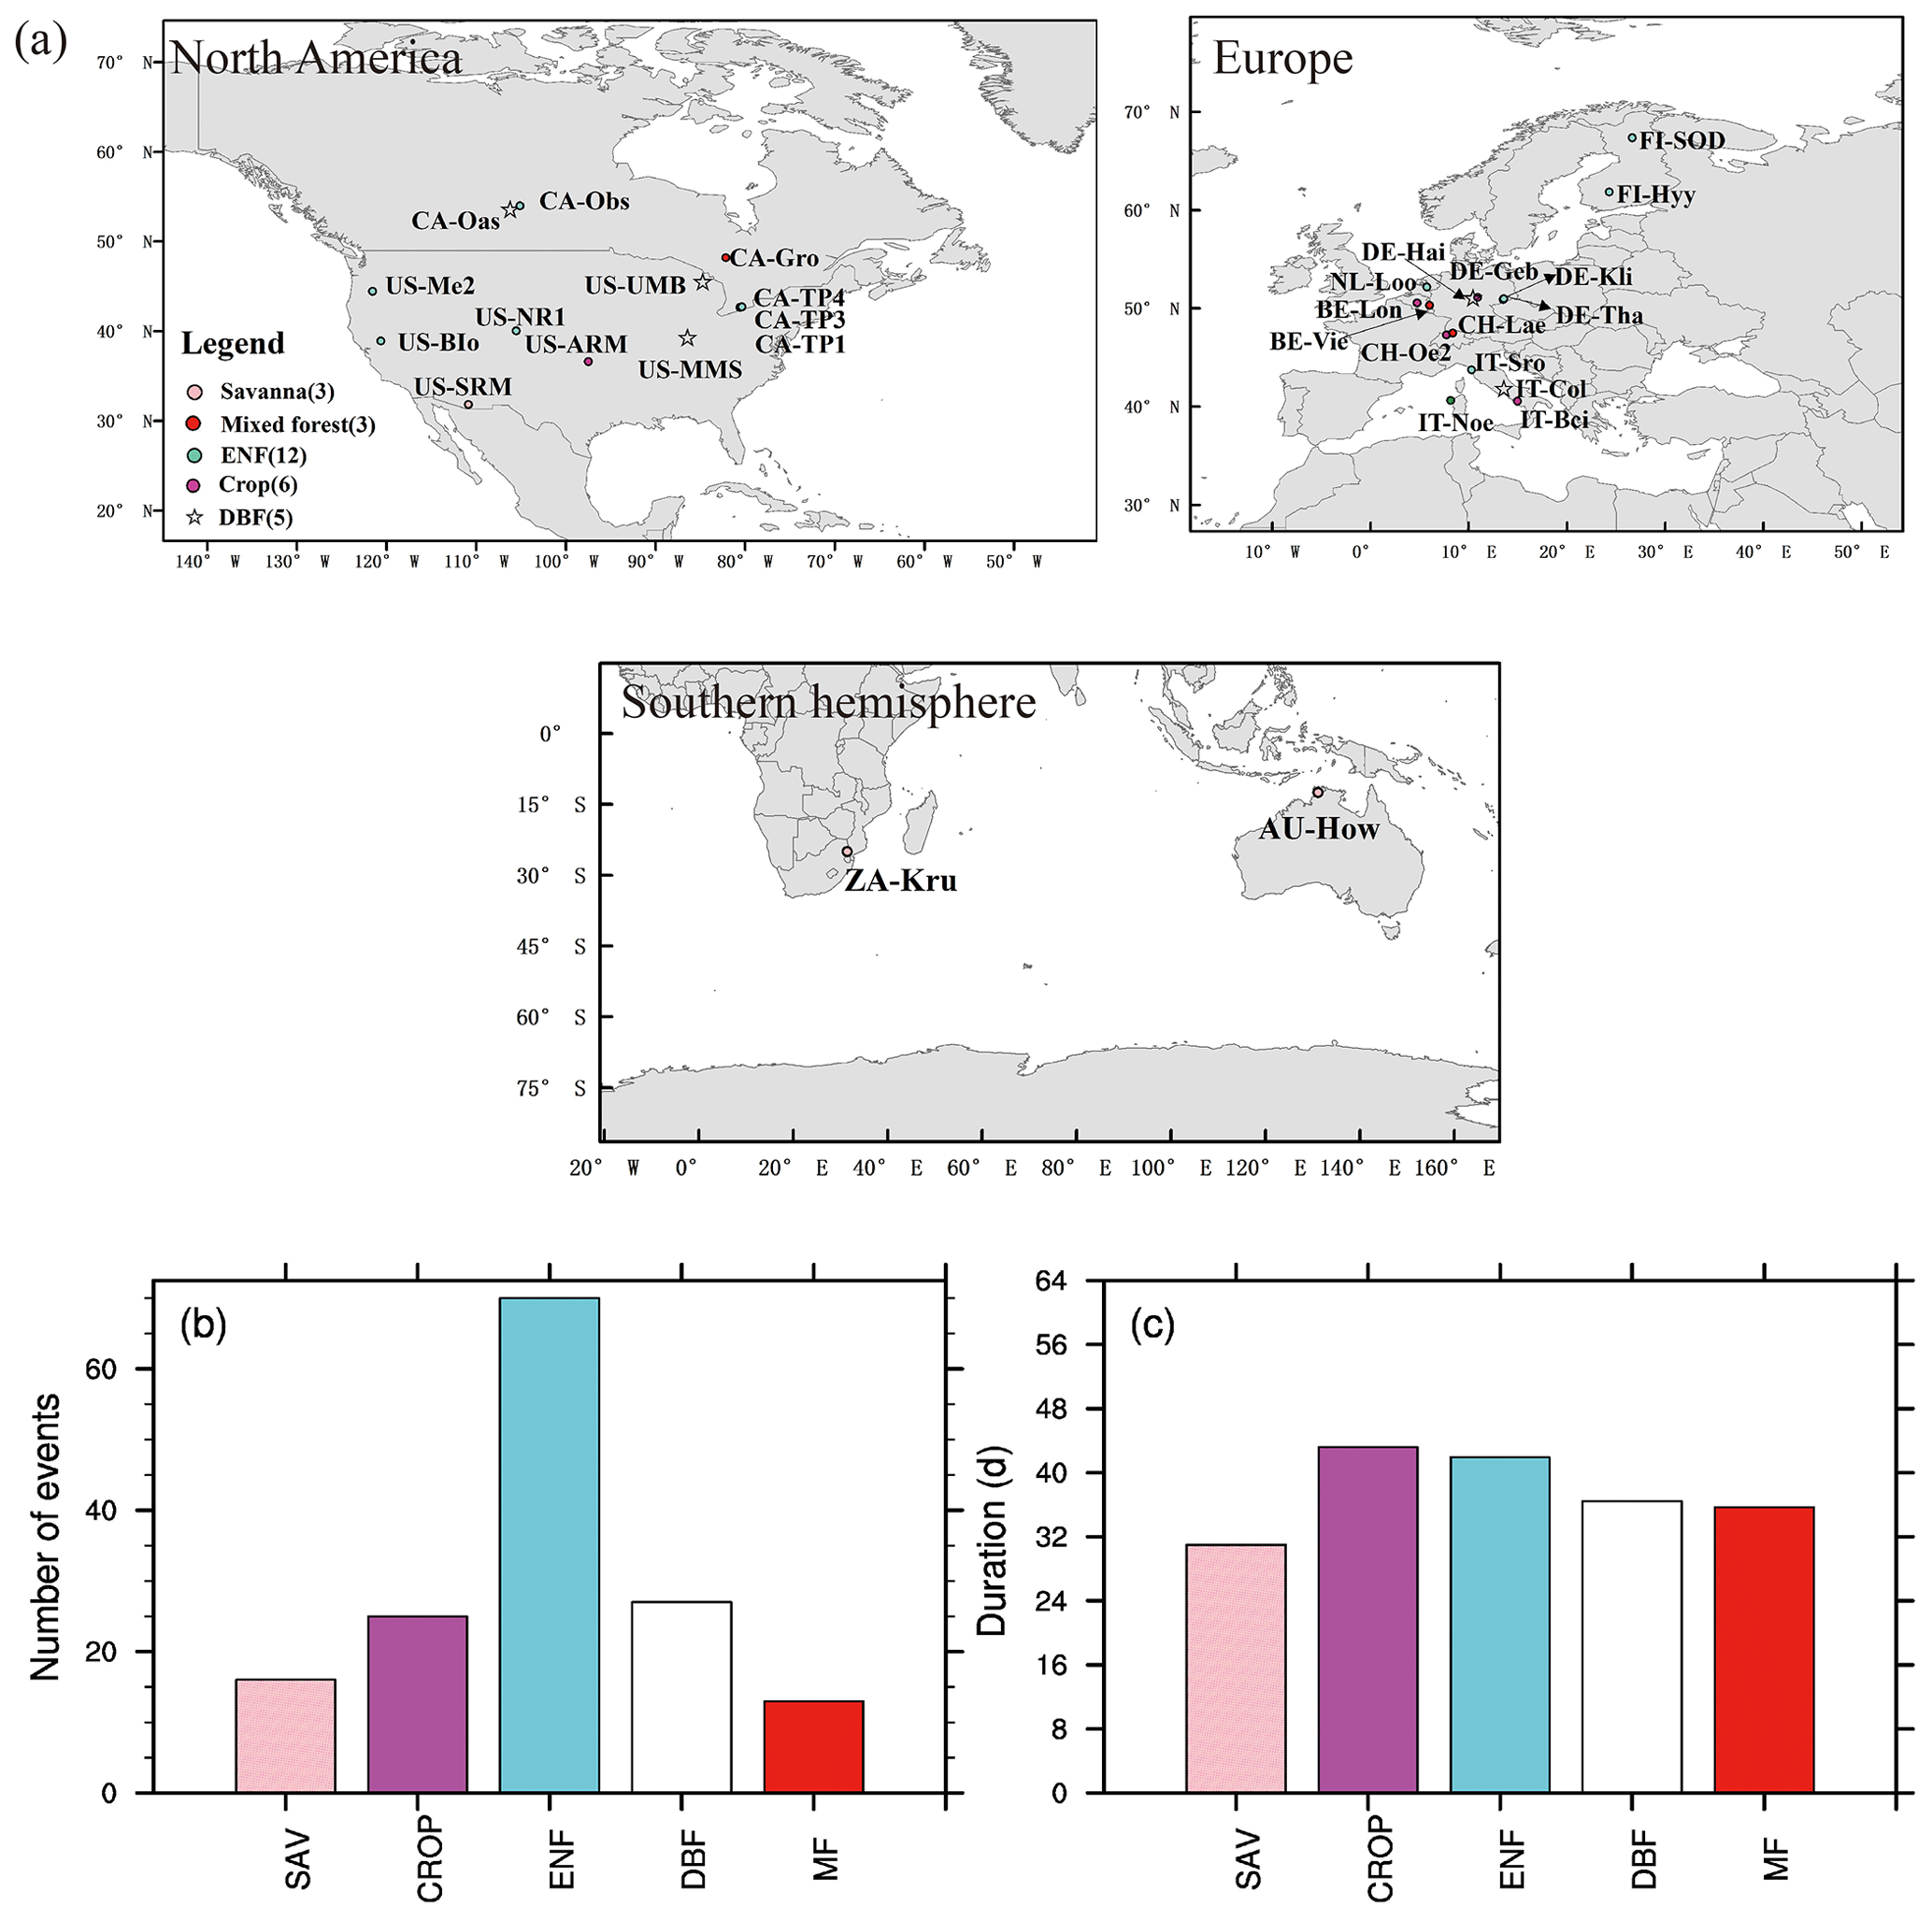
Figure 2Global map of 29 FLUXNET sites used in this study (a) and flash drought characteristics (b, c). (b) Total numbers (events) and (c) mean durations (days) of flash drought events for each vegetation type during their corresponding periods (see Table 1 for details). Different colors represent different vegetation types.
Figure 3 shows the meteorological conditions during different stages of soil moisture flash drought including the standardized anomalies of temperature, precipitation, VPD, and shortwave radiation and soil moisture percentiles. Here the onset and recovery stages of flash droughts refer to certain periods characterized by the soil moisture decline rates. The standardized anomalies of temperature, precipitation, VPD, and shortwave and soil moisture percentiles are composited to show the meteorological conditions during different stages of flash droughts. The onset stage of soil moisture flash droughts mainly refers to the rapid intensification, and the flash droughts may or may not develop into long-term droughts depending on the deficits in precipitation. There is a slight reduction in precipitation during the 8 d prior to soil moisture flash drought (Fig. 3b). During the onset of soil moisture flash drought, soil moisture percentiles decline rapidly from nearly 50 % during the 8 d before flash drought to 18 % during onset stages (Fig. 3e). The rapid drying of soil moisture is always associated with large precipitation deficits, anomalously high temperature and shortwave radiation, and a large VPD indicates increased atmospheric dryness (Ford and Labosier, 2017; Koster et al., 2019; Wang et al., 2016), which all persist until the recovery stage except for shortwave radiation. The soil moisture percentiles are averaged during the onset and recovery stages and the soil moisture percentiles during recovery stages are slightly lower than those during onset stages (Fig. 3e) considering the soil moisture is not quite dry during the early period of onset stages. Sufficient precipitation occurs during the 8 d after soil moisture flash droughts to relieve the drought conditions, and soil moisture percentiles increase from 12 % during recovery stages to 36 % during the 8 d after flash droughts.
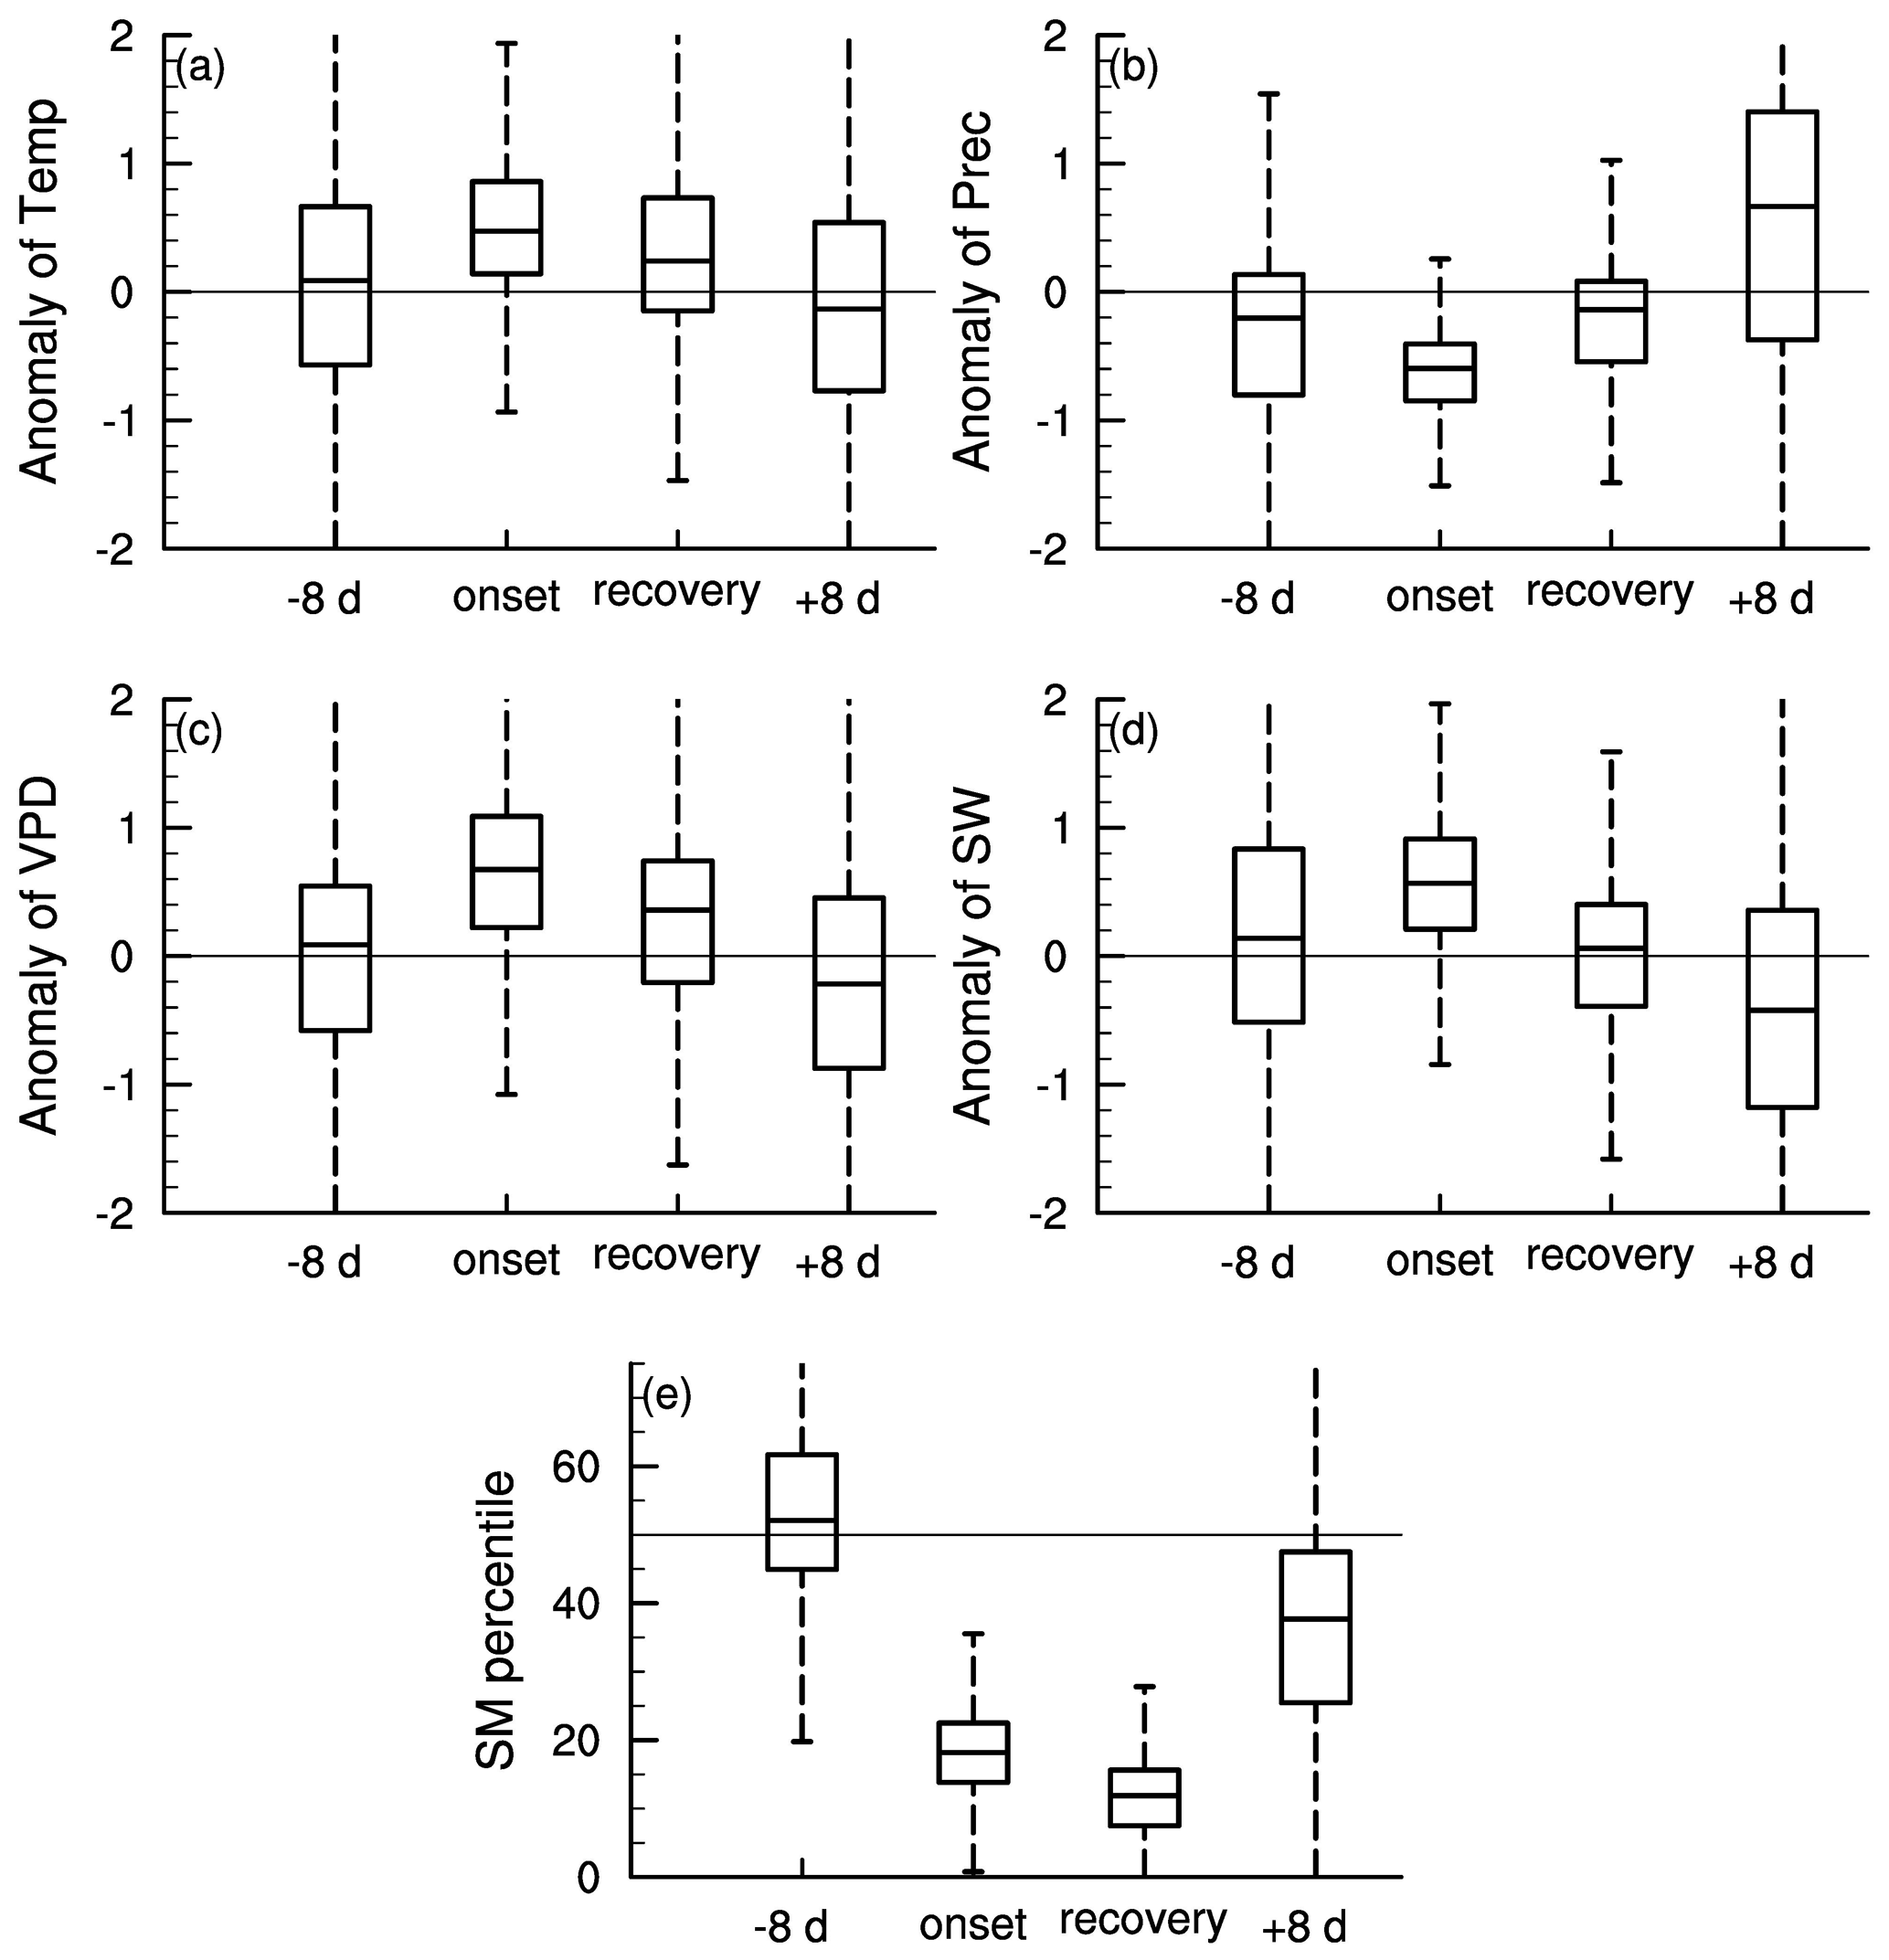
Figure 3Standardized 8 d anomalies of (a) temperature, (b) precipitation, (c) VPD, (d) short wave radiation (SW) and (e) soil moisture (SM) percentiles during the 8 d prior to flash drought onset, onset and recovery stages of flash drought, and the 8 d after flash drought.
3.2 Climatological statistics of the response time of GPP to flash drought
By analyzing all the 151 soil moisture flash drought events across 29 FLUXNET sites, we find that negative GPP anomalies occur during 81 % of the soil moisture flash drought events. Figure 4 shows the probability distributions of the response time of GPP to soil moisture flash drought as determined by soil moisture reductions for the first occurrence of negative SGPPA, the minimum negative value of SGPPA and the minimum soil moisture percentiles for different vegetation types, respectively. To reduce the uncertainty due to small sample sizes, only the results for vegetation types (SAV, CROP, MF, DBF, ENF) with more than 10 flash drought events are shown. For soil moisture flash droughts from all vegetation types, the first occurrences of negative SGPPA are concentrated during the first 24 d, and GPP starts to respond to soil moisture flash drought within 16 d for 57 % of flash droughts (Fig. 4a–e). The occurrences of minimum values of SGPPA rise sharply at the beginning of soil moisture flash droughts, reach the peak during 17–24 d and then slow down (Fig. 4f–j), which is similar to the decline in soil moisture. Although the first occurrences of negative SGPPA mainly occur in the onset stage, GPP would continue to decrease in the recovery stages for 60 % of soil moisture flash drought events. Different types of vegetation including herbaceous plants and woody plants all react to soil moisture flash drought in the early stage (Fig. 4a–e). Among them, SAV shows the fastest reaction to water stress (Fig. 4a and f), and the RT is within 8 d for 63 % events, suggesting that SAV responds concurrently with soil moisture flash drought onset. Ultimately, 88 % of events for SAV show reduced vegetation photosynthesis. The result is consistent with previous studies regarding the strong response of semi-arid ecosystems to water availability (Gerken et al., 2019; Vicente-Serrano et al., 2013; Zeng et al., 2018), and the decline in GPP for SAV is related to isohydric behaviors during soil moisture drought and higher VPD, through closing stomata to decrease water loss as transpiration and carbon assimilation (Novick et al., 2016; Roman et al., 2015). For ENF, only 27 % of soil moisture flash droughts cause the negative SGPPA during the first 8 d. When RT is within 40 d, the cumulative frequencies range from 74 % to 88 % among different vegetation types. The response frequency of RTmin and the response time of minimum soil moisture percentiles are quite similar, although there are discrepancies among the patterns of the response frequency for different vegetation types. The response frequency of RTmin for SAV increases sharply during the 17–24 d period of soil moisture flash droughts (Fig. 4f). GPP is derived from direct eddy covariance observations of NEP and nighttime terrestrial ecosystem respiration, and temperature-fitted terrestrial ecosystem respiration during daytime. The response of NEP to flash droughts shows the compound effects of vegetation photosynthesis and ecosystem respiration. In terms of RT, the response of NEP is slower than GPP for SAV but is quicker for DBF and ENF (Fig. 5). The discrepancies between NEP and SM in terms of RTmin are more obvious than those between GPP and SM, and the RTmin of NEP is much shorter than the RTmin of soil moisture, especially for DBF and ENF, which may be related to the increase in ecosystem respiration (Fig. 5i and j).
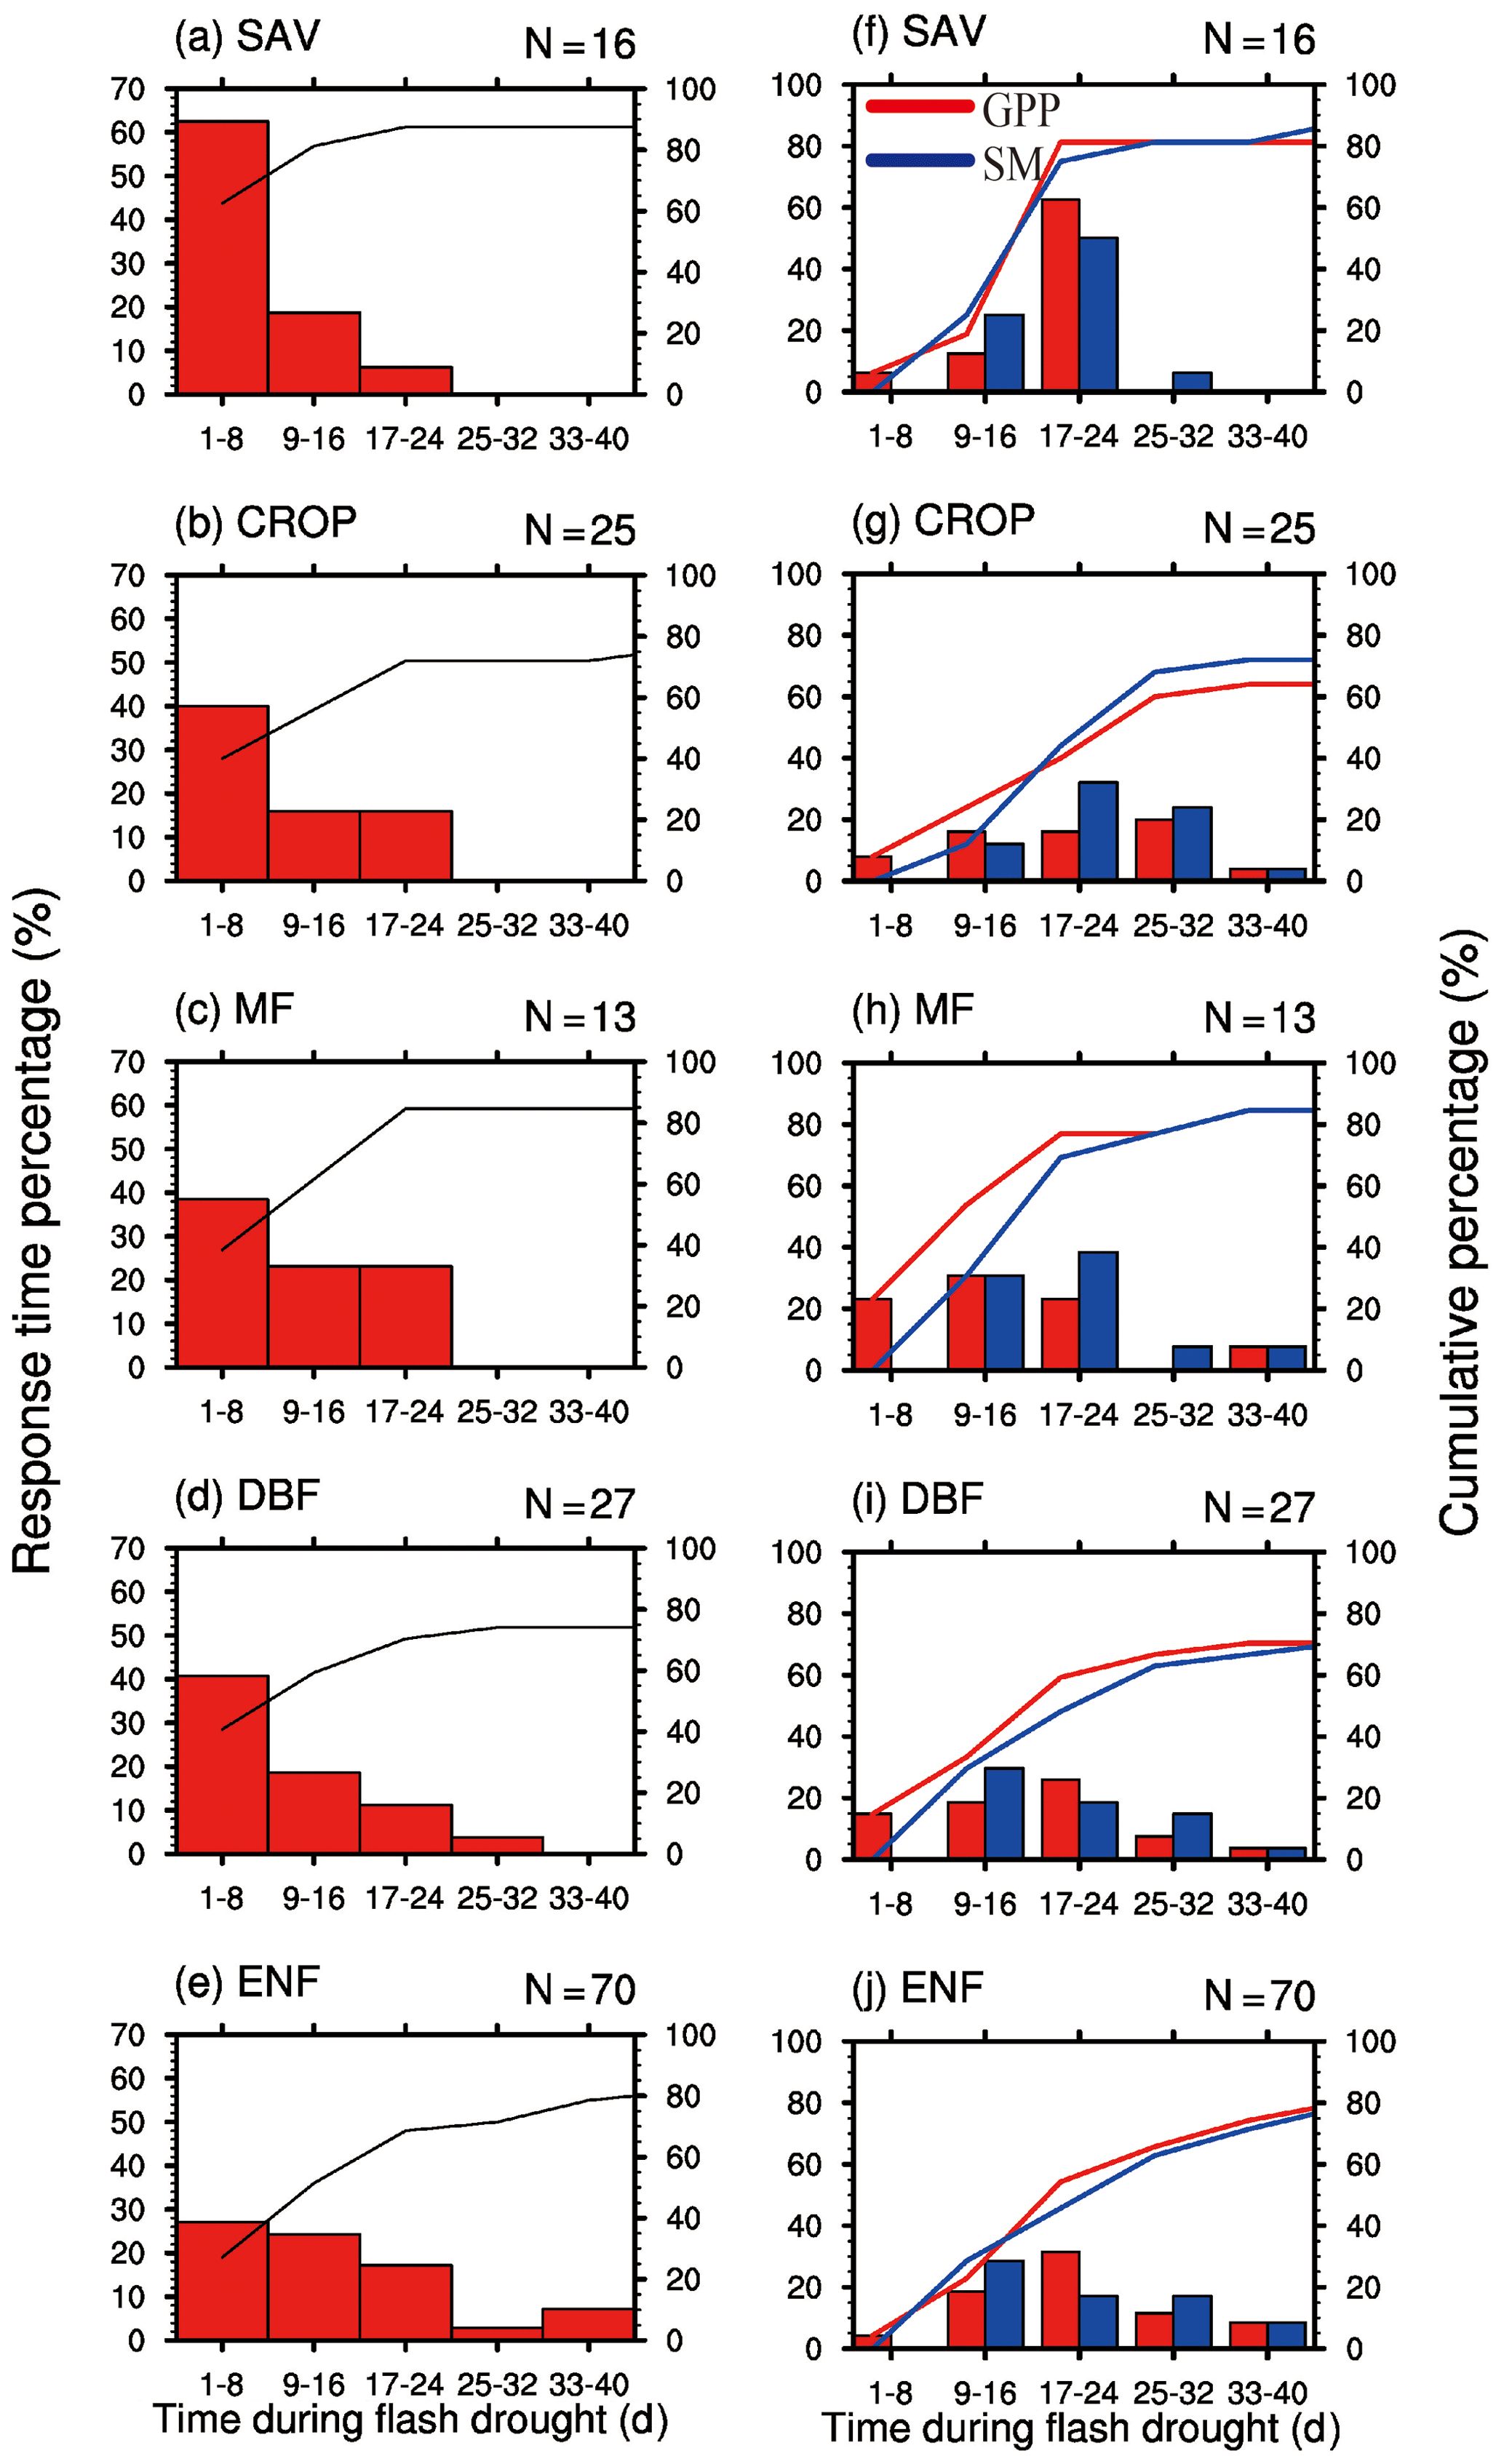
Figure 4Percentage of the response time (days) of the first occurrence of negative GPP anomaly (a–e), minimum GPP anomaly and minimum soil moisture percentile (f–j) during soil moisture flash drought for different vegetation types. SAV: savanna, CROP: rainfed cropland, MF: mixed forest, DBF: deciduous broadleaf forest and ENF: evergreen needleleaf forest.
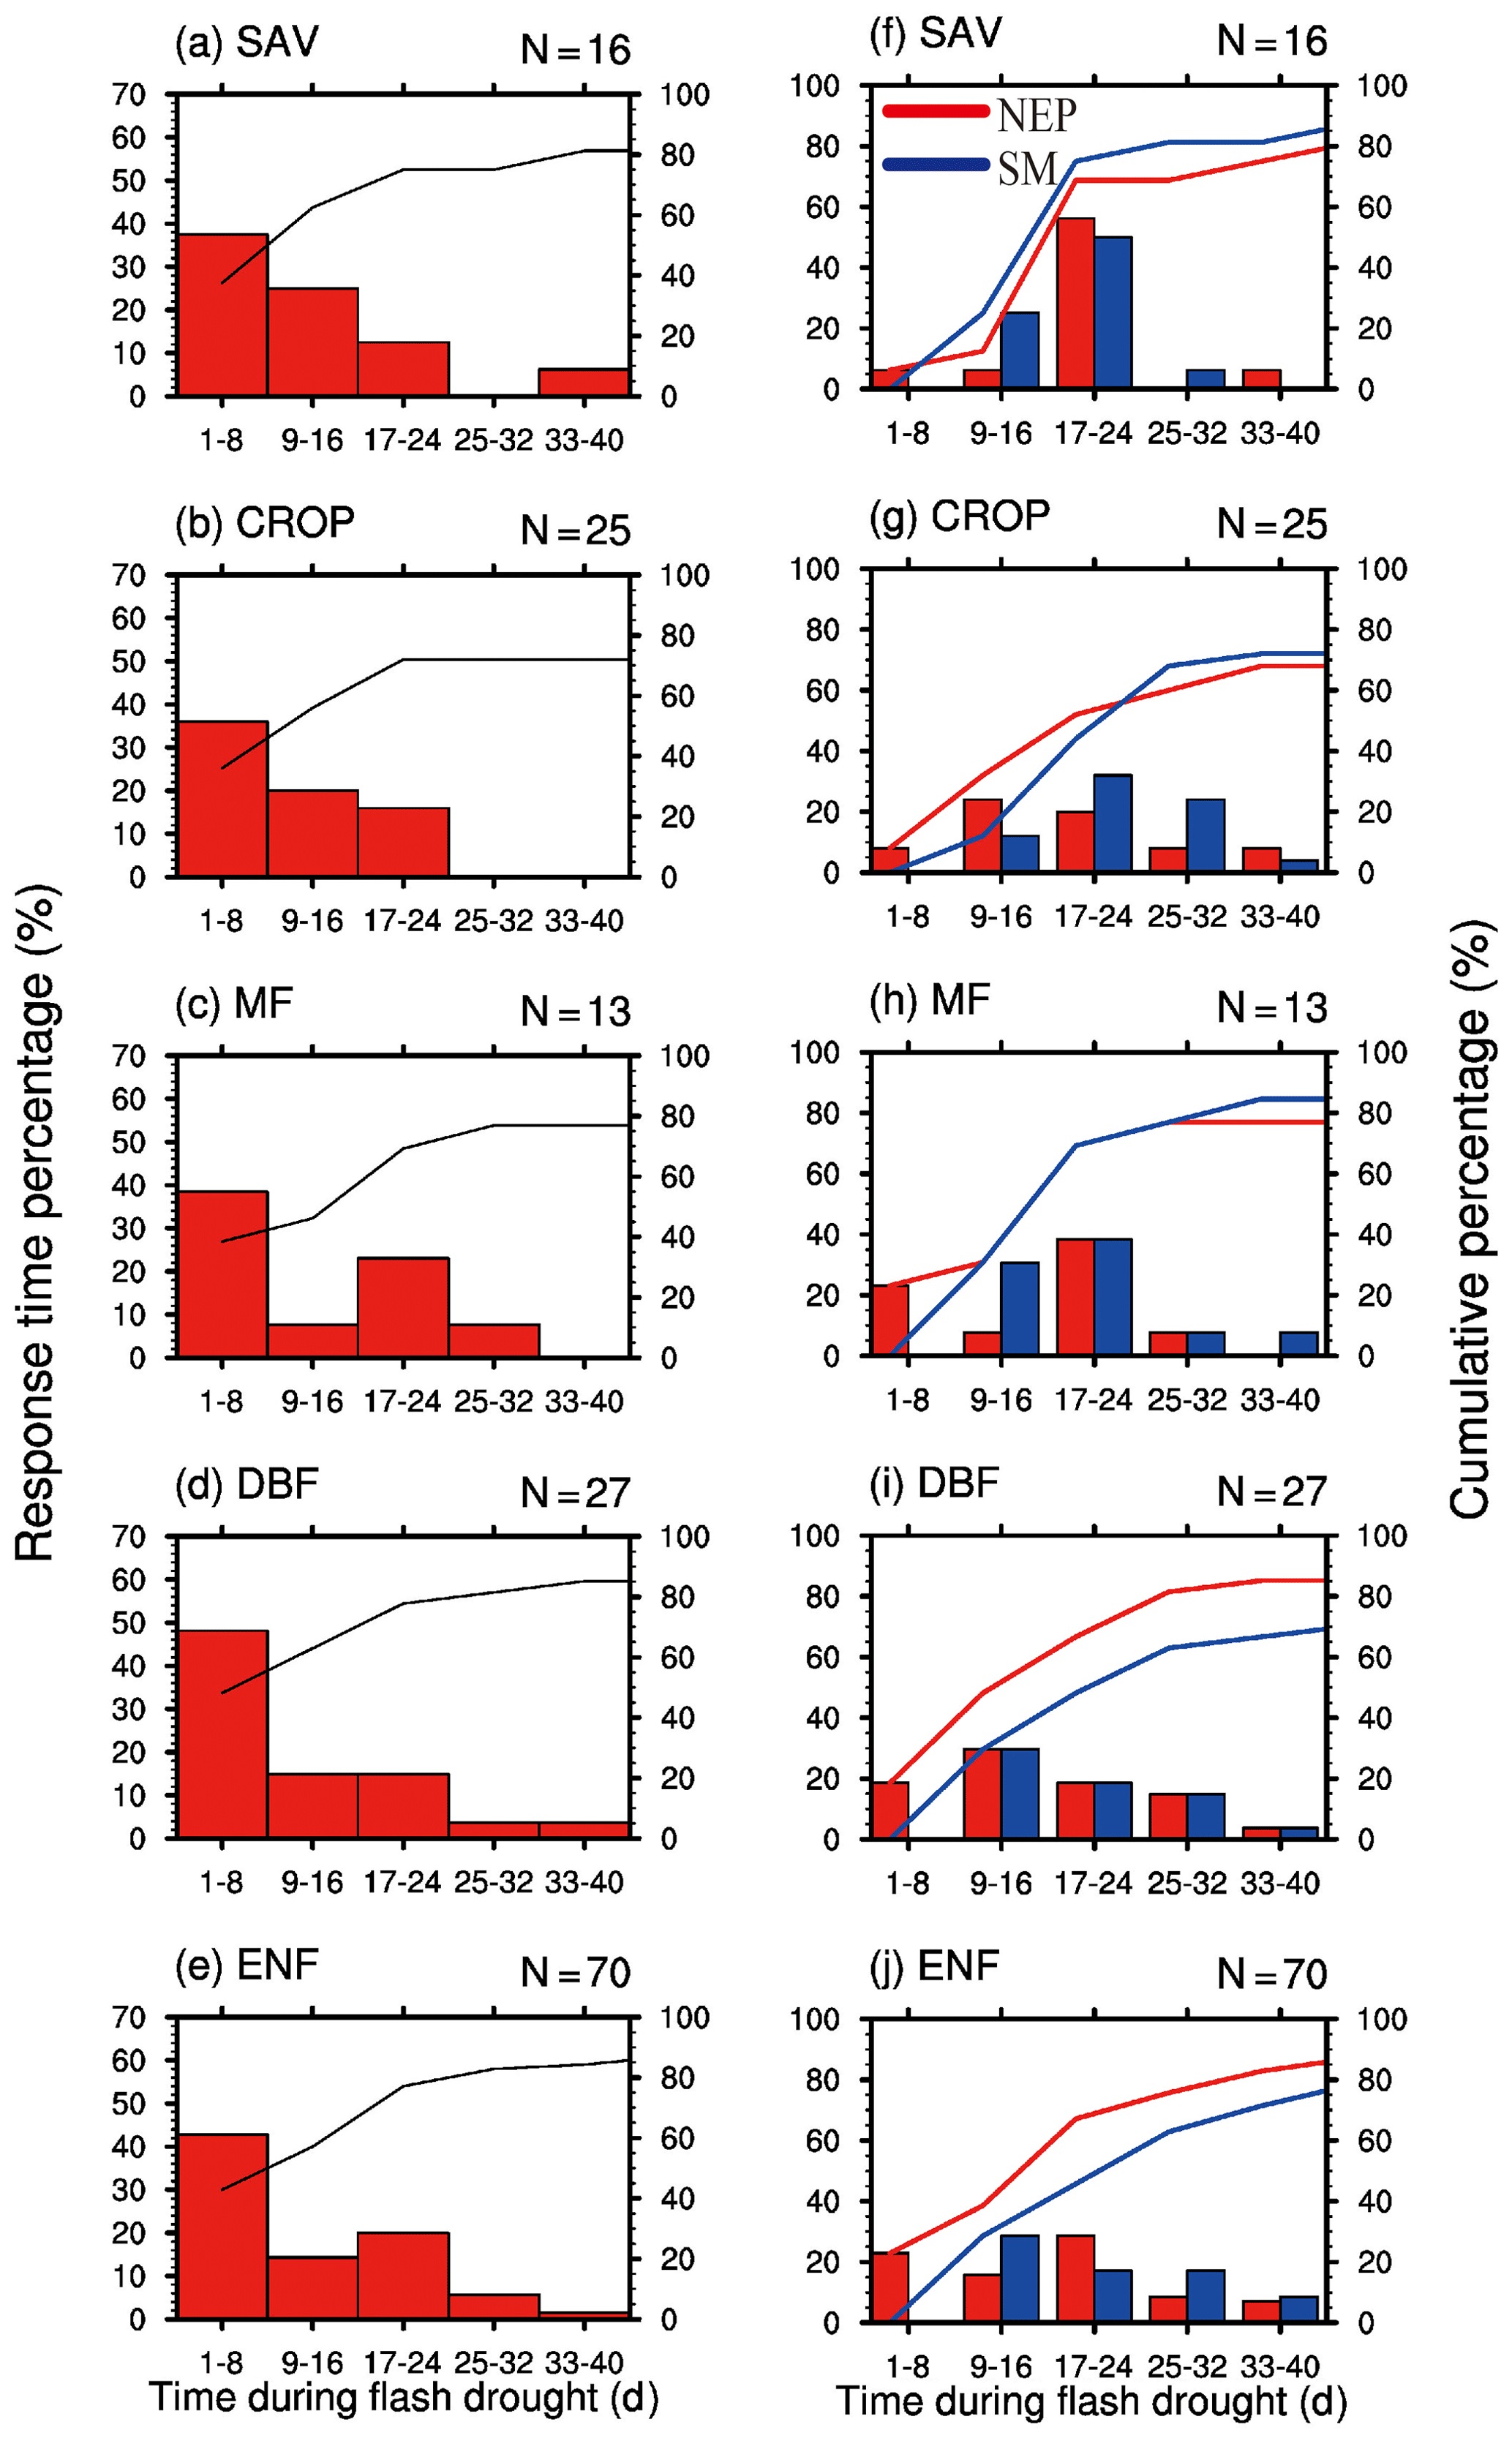
Figure 6 shows the temporal changes of SGPPA and soil moisture percentiles during the 8 d before soil moisture flash droughts and during the first 24 d of the droughts. During the 8 d before flash droughts, there is nearly no obvious decline for SGPPA, while SAV, DBF and ENF show small increases in GPP. The decline in SGPPA is more significant during the first 9–24 d of soil moisture flash droughts for different vegetation types, and SGPPA for SAV and CROP show quicker decline even during the first 8 d of soil moisture flash droughts. The decline rates in soil moisture are mainly concentrated within the first 16 d of flash droughts. There are various lag times for the response of GPP to the decline in soil moisture among different vegetation.
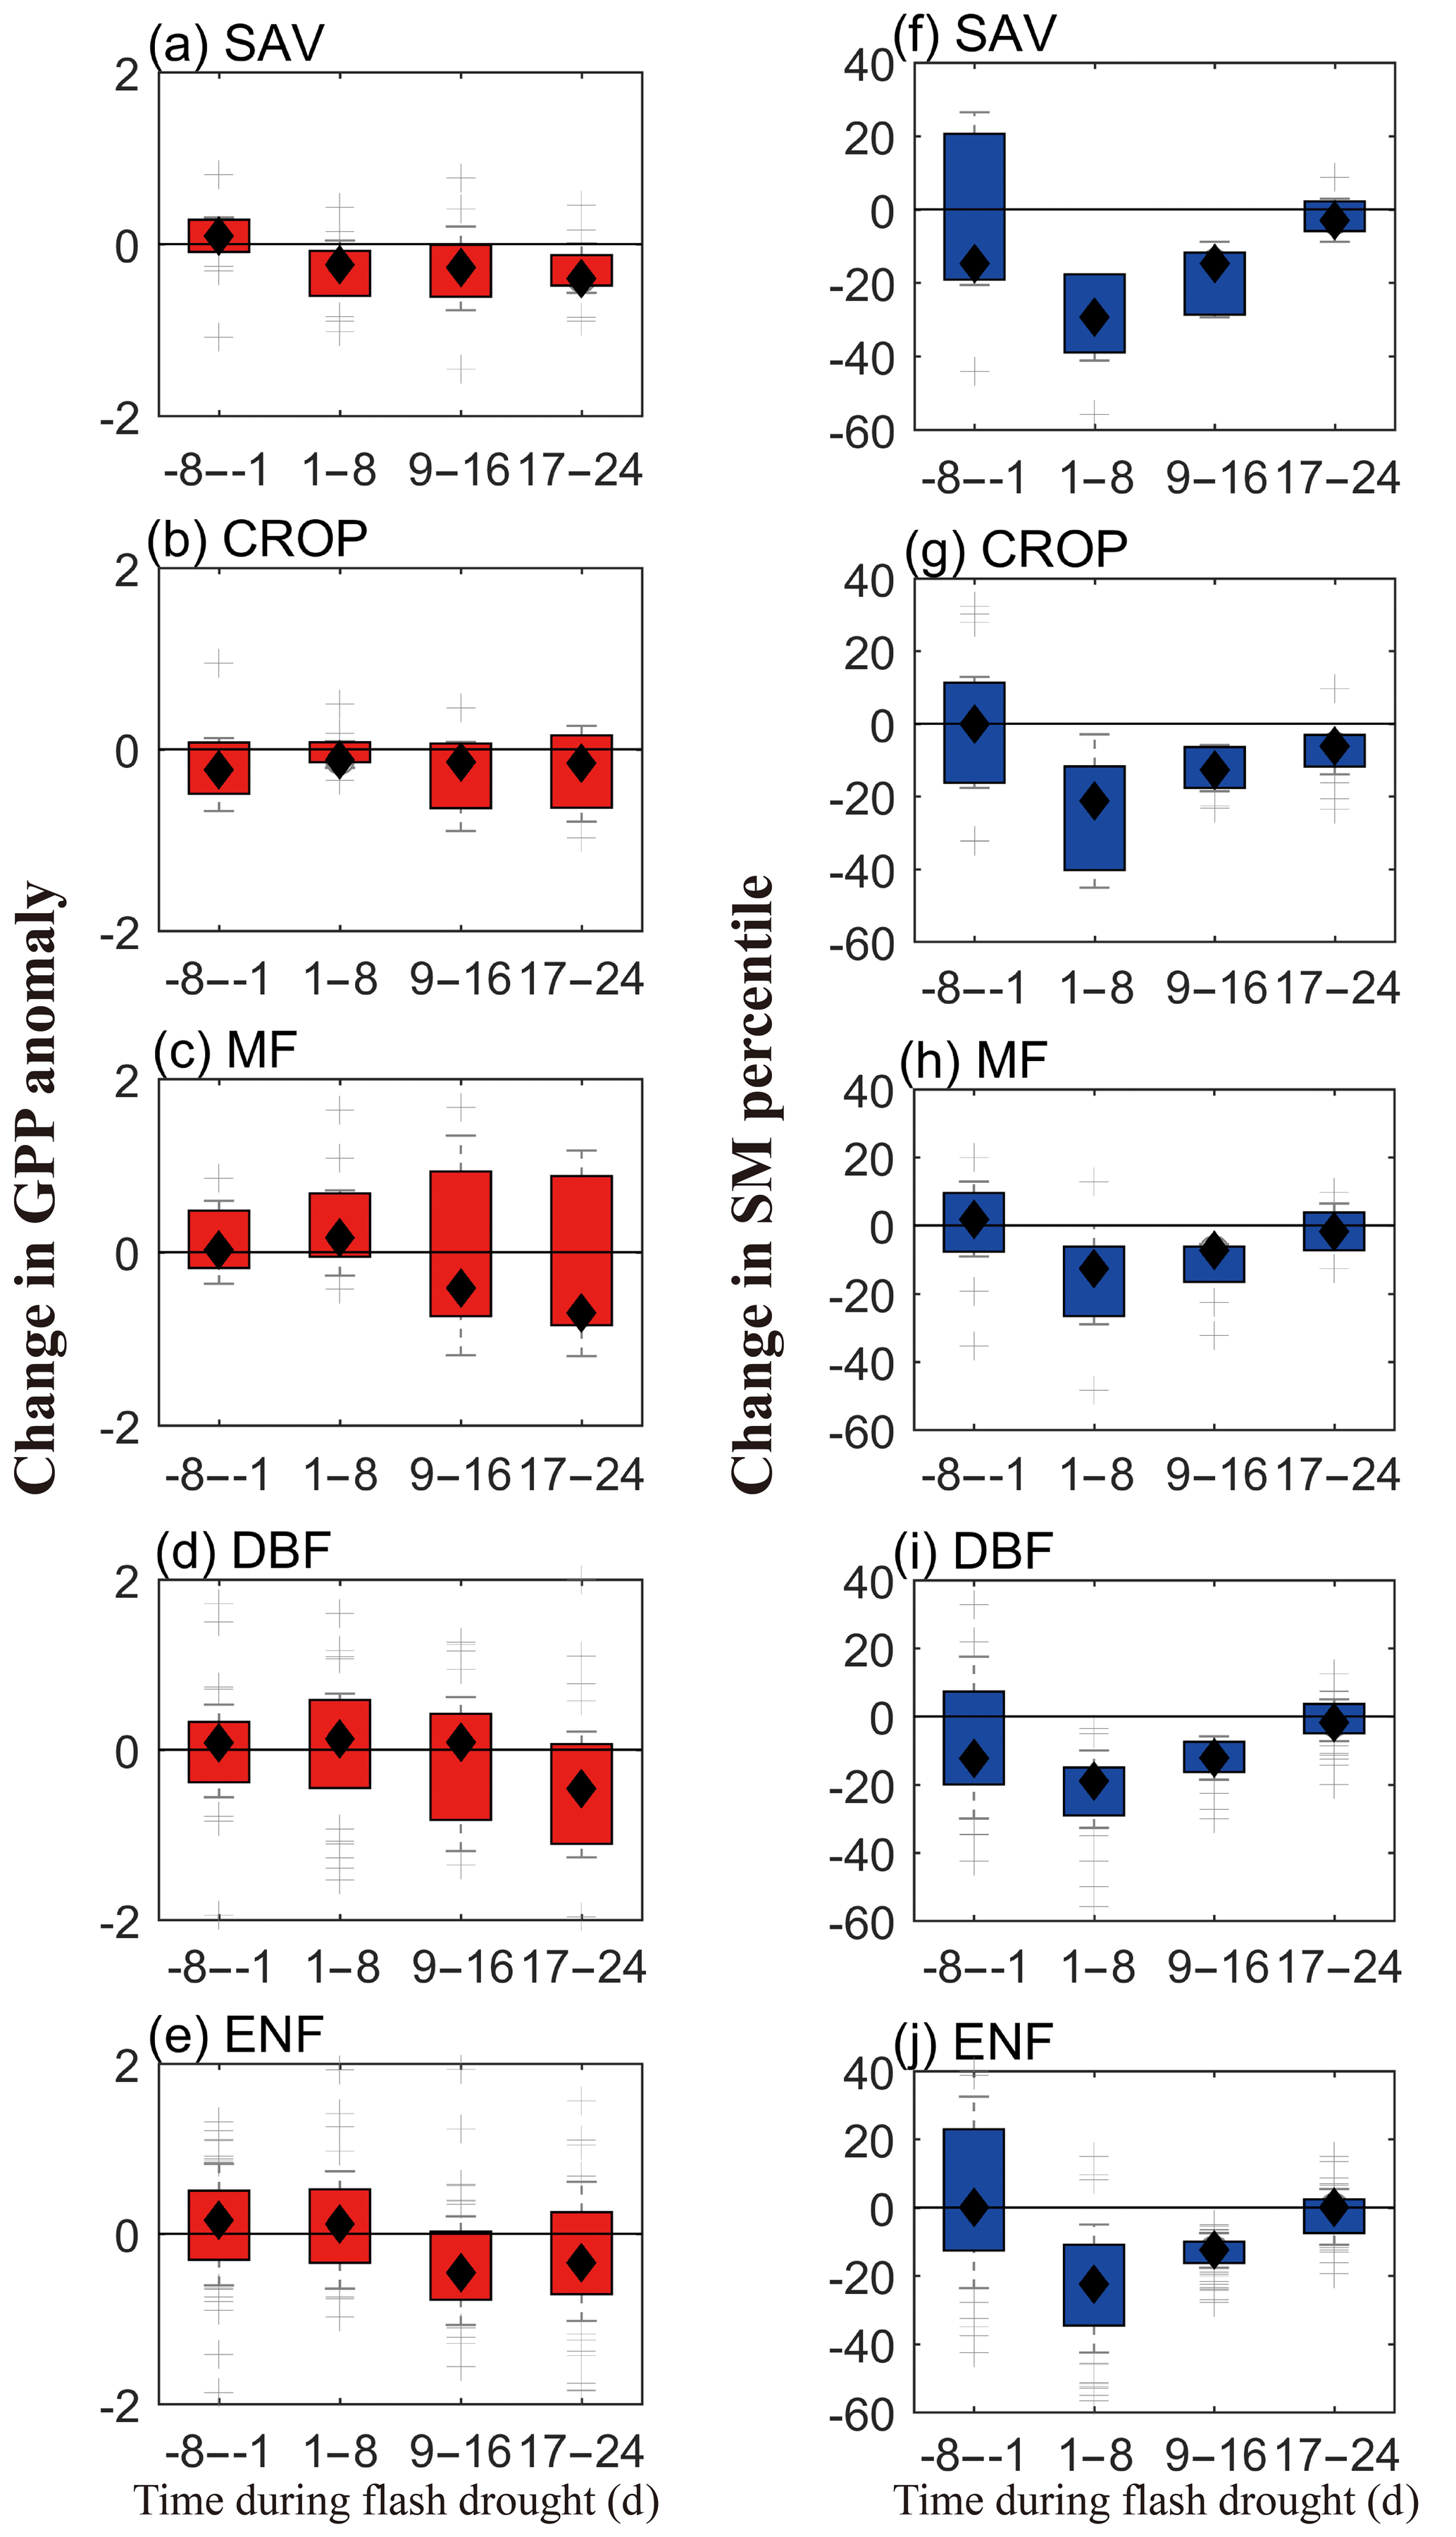
Figure 6The temporal change rates of standardized GPP anomalies (a–e) and soil moisture percentiles (f–j) for different vegetation types. SAV: savanna, CROP: rainfed cropland, MF: mixed forest, DBF: deciduous broadleaf forest and ENF: evergreen needleleaf forest.

Figure 7Standardized anomalies of water use efficiency (WUE), underlying WUE (uWUE), GPP, ET and ET during the 8 d before flash drought onset, the onset and recovery stages of flash drought events, and the 8 d after flash drought.
3.3 The coupling between carbon and water fluxes under soil moisture stress
Figure 7 shows the standardized anomalies of WUE and uWUE and their components for different ecosystems during the 8 d before and after soil moisture flash droughts and the onset and recovery stages. Here, we select 81 % of soil moisture flash drought events with GPP declining down to its normal conditions to analyze the interactions between carbon and water fluxes, while GPP during the remaining 19 % of soil moisture flash drought events may stay stable and is less influenced by drought conditions. During the 8 d before soil moisture flash drought, WUE and uWUE are generally close to the climatology (Fig. 7a) and there are no significant changes in GPP, ET and (Fig. 7e and i). However, the median value of SGPPA for SAV is positive (Fig. 7e). WUE is stable during the onset stage, whereas uWUE increases for all ecosystems except for CROP (Fig. 7b). For CROP, both GPP and ET decrease, and the decline in WUE is related with a greater reduction in GPP relative to ET (Fig. 7f and j). The positive anomalies of uWUE are correlated with a decrease in mainly induced by the high VPD. Increasing VPD and deficits in soil moisture would decrease canopy conductance (Grossiord et al., 2020) but not GPP for MF and ENF. During the onset stage, GPP and ET reduce only for SAV, CROP and DBF, and the magnitudes of GPP and ET reduction are highest for SAV. ET is close to normal conditions for MF, DBF and ENF, thus enhancing the drying rate of soil moisture with less precipitation supply during the onset stage. But during the recovery stage of soil moisture flash drought, GPP and ET show significant reductions except for MF (Fig. 7g and k), and the responses of WUE and uWUE are different between herbaceous plants (SAV and CROP) and forests (MF, DBF and ENF), where WUE and uWUE decrease significantly for SAV and CROP but increase slightly for forests (Fig. 7c). The decrease in uWUE for SAV and CROP during recovery stages indicates that SAV and CROP are likely brown due to carbon starvation caused by the significant decrease in stomatal conductance (McDowell et al., 2008). The decrease in GPP during the recovery stage is not only related to the reduction in canopy conductance, but also the decrease in uWUE under drought for SAV and CROP which is possibly influenced by a suppressed state of enzyme and reduced mesophyll conductance (Flexas et al., 2012). However, the positive anomalies of uWUE for DBF and ENF during the recovery stage imply that the decline in GPP mainly results from the stomata closure. ET starts to decrease during the recovery stage due to the limitation of water availability, and the decreasing ET also reflects the enhanced water stress for vegetation during the recovery stage. The average soil moisture conditions are 12 % for the recovery stage but 18 % for the onset stage. So, drier soil moisture in the recovery stage exacerbates the ecological response. Figure 7c also shows the higher WUE and uWUE for forests, which indicates their higher resistance to flash drought than herbaceous plants during the recovery stage. During the 8 d after flash drought, the standardized anomalies of uWUE are still positive for forests, whereas SGPPA and ET are both lower than the climatology for all ecosystems. The ecological negative effect would persist after the soil moisture flash drought.
3.4 The impact of climate factors on GPP during soil moisture flash drought
Figure 8 shows the partial correlation coefficients between standardized anomalies of GPP and meteorological variables and soil moisture percentiles during different stages of soil moisture flash droughts. The correlation between climate factors and GPP is not statistically significant during the 8 d before soil moisture flash droughts. During onset stages of soil moisture flash droughts, the partial correlation coefficients between SGPPA and soil moisture percentiles are 0.44, 0.49 and 0.29 for SAV, CROP and ENF (p<0.05), respectively. Besides, shortwave radiation is positively correlated with SGPPA for MF, DBF and EBF (Fig. 8b) during onset stages, and the positive anomalies of shortwave radiation could partially offset the loss of vegetation photosynthesis due to the deficits in soil moisture. SGPPA is also positively correlated with temperature during onset stages for SAV and DBF. The partial correlation coefficients between SGPPA and VPD are −0.53 and −0.22 respectively for DBF and ENF, and the higher VPD would further decrease GPP during onset stages. The influence of VPD on GPP is much more significant during recovery stages and the 8 d after. SGPPA is positively correlated with soil moisture and negatively with VPD for SAV both during recovery stages and the 8 d after.
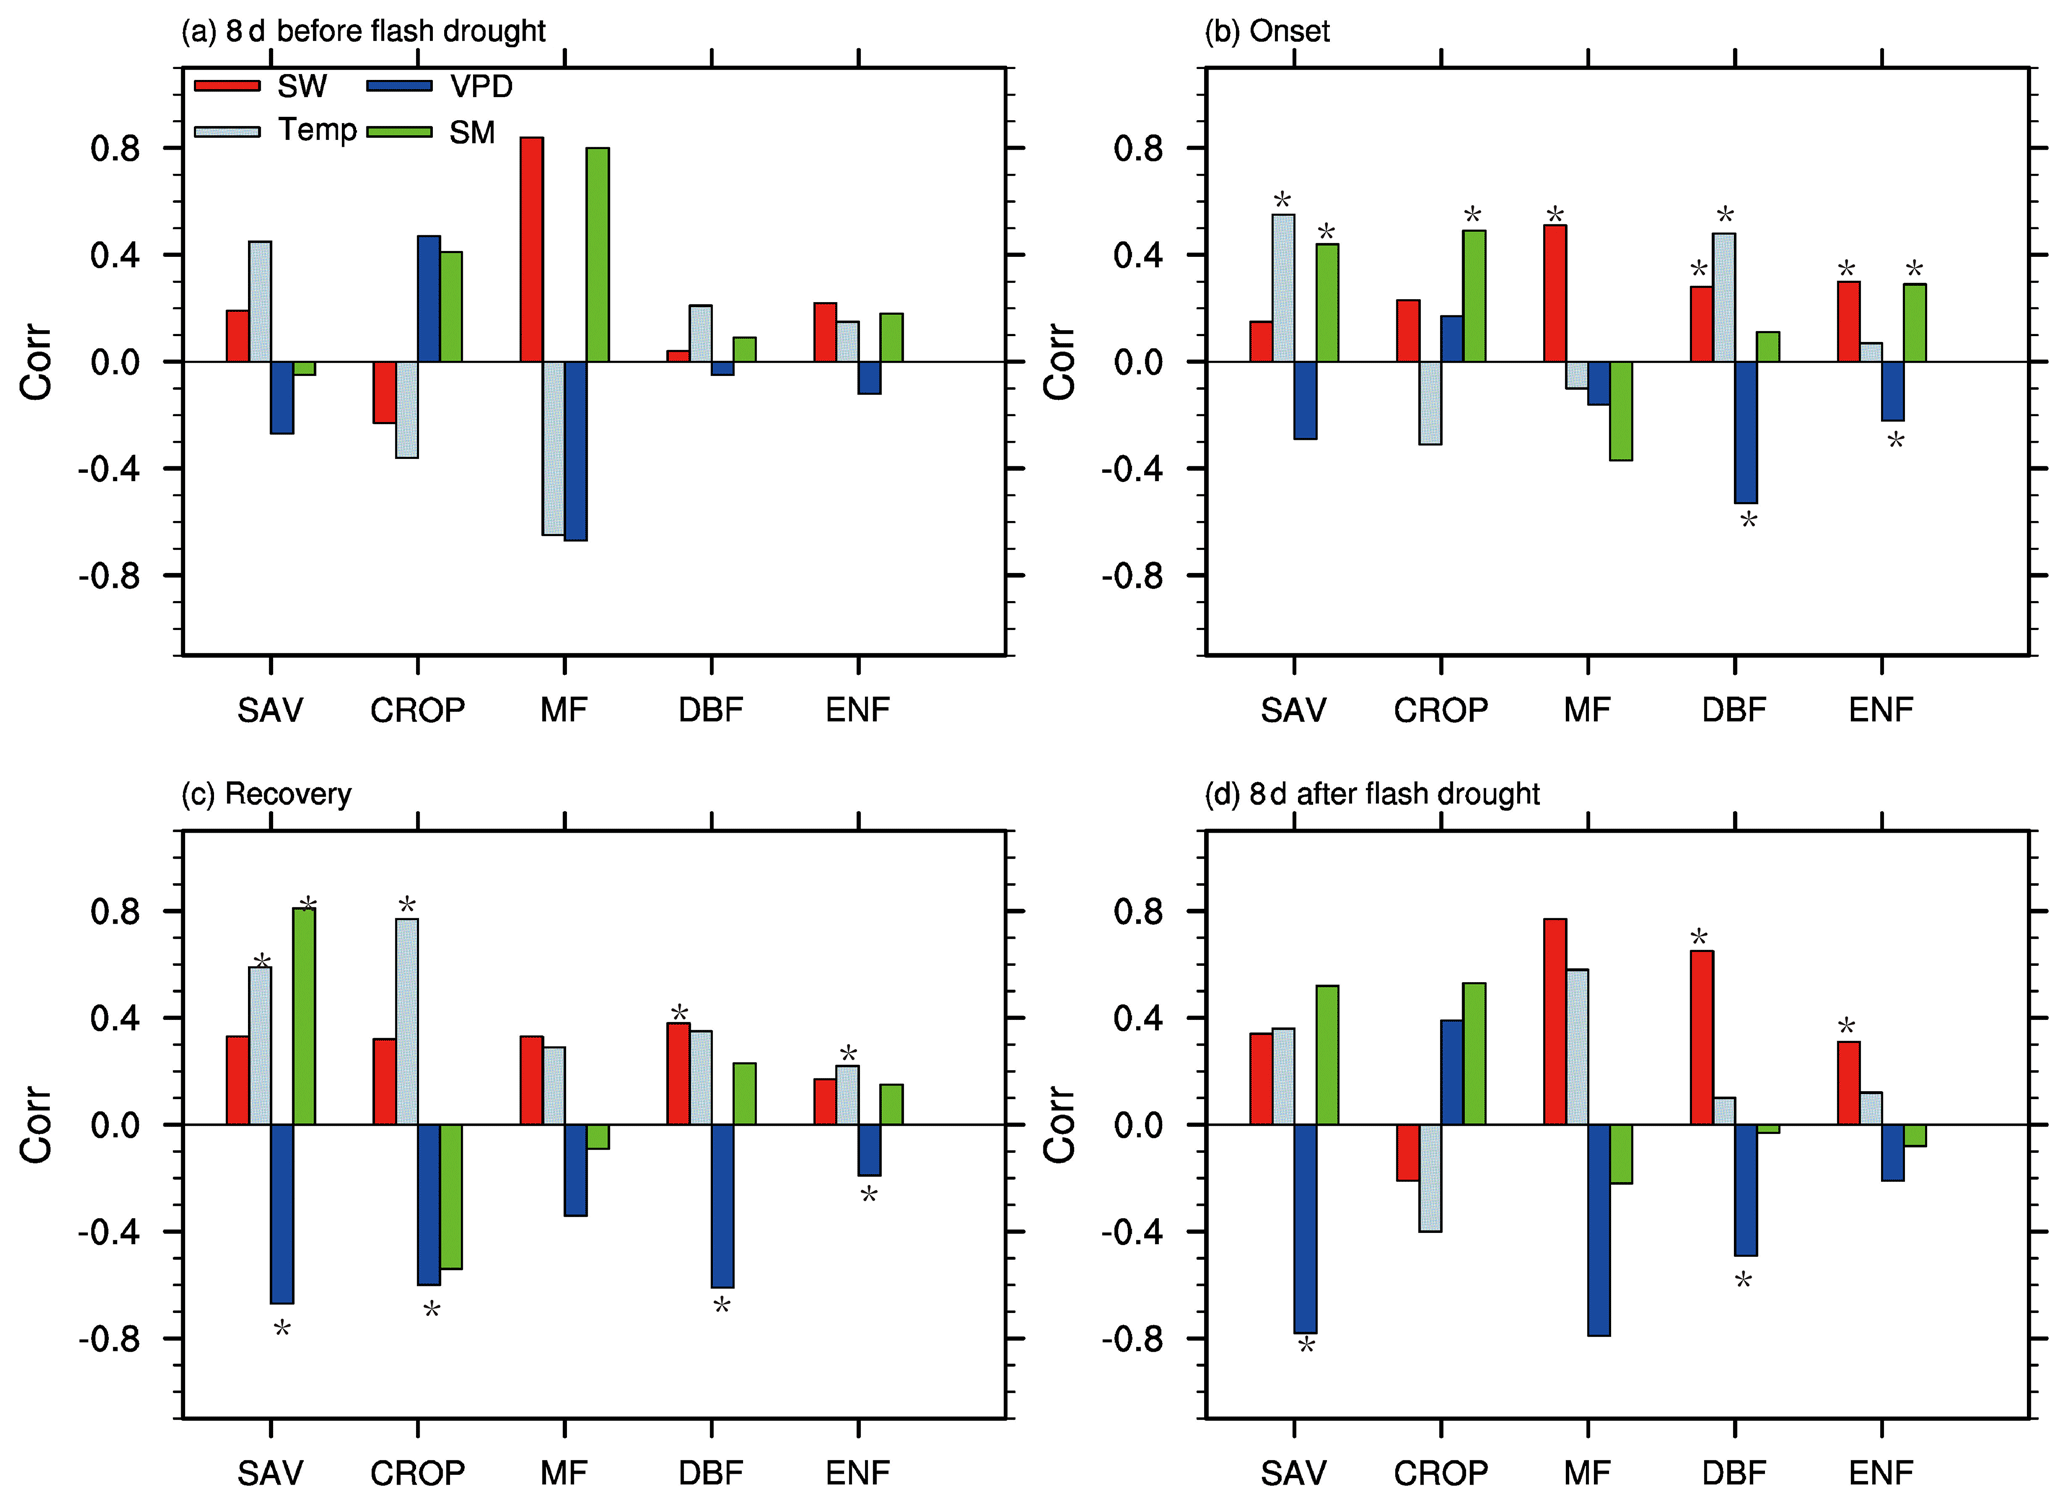
Figure 8The partial correlation coefficients between GPP and soil moisture (SM), shortwave radiation (SW), temperature (Temp), and vapor pressure deficit (VPD) for different vegetation types including savannas (SAV), rain-fed croplands (CROP), mixed forests (MF), deciduous broadleaf forests (DBF) and evergreen needleleaf forests (ENF) during the 8 d before soil moisture flash drought, the onset and recovery stages and the 8 d after soil moisture flash drought. An asterisk (*) indicates the correlation is statistically significant at the 95 % level.
Previous studies detected the vegetation response for a few extreme drought cases without a specific definition of flash drought from a climatological perspective (Otkin et al., 2016; He et al., 2019). Moreover, less attention has been paid to the coupling between carbon and water fluxes during soil moisture flash drought events. This study investigates the response of carbon and water fluxes to soil moisture flash droughts based on decade-long FLUXNET observations during different stages of flash droughts. The responses vary across different phases of flash droughts, and different ecosystems have different responses, which provide implications for eco-hydrological modeling and prediction. Besides, the influence of different climate factors including VPD and soil moisture also differs during different stages of soil moisture flash droughts.
4.1 The responses of carbon and water fluxes to flash droughts
Based on 151 soil moisture flash drought events identified using soil moisture from decade-long FLUXNET observations, the response of GPP to flash droughts is found to be quite rapid. For more than half of the 151 soil moisture flash drought events, the GPP drops below its normal conditions during the first 16 d and reaches its maximum reduction within 24 d. Due to the influence of ecosystem respiration, the responses of NEP for DBF and ENF to flash droughts are much quicker than GPP, implying that the sensitivity of ecosystem respiration is less than that of vegetation photosynthesis (Granier et al., 2007). Eventually, 81 % of soil moisture flash drought events cause declines in GPP. During the drought period, plants would close their stomata to minimize water loss through decreasing canopy conductance, which in turn leads to a reduction in carbon uptake. The soil moisture flash droughts are always accompanied by high temperatures and VPD. The partial correlation analysis shows that the increase in VPD and decrease in soil moisture both decrease the rate of photosynthesis. High VPD further reduces canopy conductance to minimize water loss at the cost of reducing photosynthesis during soil moisture flash droughts (Grossiord et al., 2020; W. Yuan et al., 2019). The suppression of GPP and ET is more obvious for flash drought recovery stage determined by soil moisture than the onset stage. The discrepancy of GPP responses between different phases of soil moisture flash droughts may result from (1) soil moisture conditions which are drier during the recovery stage and (2) the damaged physiological functioning for specific vegetation types. The anomalies of uWUE for ecosystems are always positive or unchanged during soil moisture flash droughts except for croplands and savannas during the recovery stage. The decrease in canopy conductance would limit the photosynthetic rate; however, the increase in uWUE may indicate adaptative regulations of ecosystem physiology, which is consistent with Beer et al. (2009). uWUE is higher than WUE during the onset stage of soil moisture flash droughts, which is due to the decreased conductance under increased VPD. However, there is no obvious difference between WUE and uWUE during the recovery stage, which indicates that photosynthesis is less sensitive to stomatal conductance and may be more correlated with limitations of biochemical capacity (Flexas et al., 2012; Grossiord et al., 2020). During the 8 d after the soil moisture flash drought, the anomalies of GPP and ET are still negative, indicating that the vegetation does not recover immediately after the soil moisture flash drought. The legacy effects of flash droughts may be related to the vegetation and climate conditions (Barnes et al., 2016; Kannenberg et al., 2020).
This study is based on the sites that are mainly distributed over North America and Europe. It is necessary to investigate the impact of flash droughts on vegetation over other regions with different climates and vegetation conditions. In addition, this study used in situ surface soil moisture at FLUXNET stations to detect vegetation response due to the lack of soil moisture observations at deep soil layers. There would be more significant ecological responses to flash drought identified through using root-zone soil moisture because of its close link with vegetation dynamics. Due to the limitation of FLUXNET soil moisture measurements, here we used soil moisture observations mainly at the depths of 5 to 10 cm. We also analyzed the response of GPP to flash droughts identified by 0.25∘ ERA5 soil moisture reanalysis data at the depths of 7 cm and 1 m. The response of GPP to flash droughts identified by FLUXNET surface soil moisture is quite similar to those identified by ERA5 soil moisture at the depth of 1 m (not shown). There are fewer GPP responses to flash droughts identified by ERA5 surface soil moisture. Although we select the ERA5 grid cell that is closest to the FLUXNET site and use the ERA5 soil moisture data over the same period as the FLUXNET data, we should acknowledge that the gridded ERA5 data might not be able to represent the soil moisture conditions as well as flash droughts at in situ scale due to the strong heterogeneity of the land surface. Therefore, the in situ surface soil moisture from FLUXNET is useful to identify flash droughts compared with reanalysis soil moisture, although the in situ root-zone soil moisture would be better.
4.2 Variation in ecological responses across vegetation types
The responses of GPP, ET and WUE to soil moisture flash droughts vary among different vegetation types. The decline in GPP and ET only occurs across croplands and savannas during onset stages. For most forests, the deterioration of photosynthesis and ET appears during the recovery stage with higher WUE and uWUE. For CROP and SAV, both WUE and uWUE decrease during the recovery stage, and they may be brown due to reduced photosynthesis. The positive anomalies of WUE and uWUE for forests suggest that their deeper roots can obtain more water than grasslands during flash drought. Xie et al. (2016) pointed out that WUE and uWUE for a subtropical forest increased during the 2013 summer drought in southern China. The increased WUE in forest sites and unchanged WUE in grasslands were also found in other studies for spring drought (Wolf et al., 2013). In general, herbaceous plants are more sensitive to flash drought than forests, especially for savannas. The correlation between soil moisture and GPP is more significant for SAV, CROP and ENF during the onset stages of flash droughts, which is consistent with the strong response to water availability of SAV and CROP (Gerken et al., 2019). SAV is more isohydric than forests and would reduce stomatal conductance immediately to prohibit the water loss that further exacerbates droughts (Novick et al., 2016; Roman et al., 2015). However, almost all vegetation types show high sensitivity to VPD during the recovery stage of flash droughts.
4.3 Potential implications for ecosystem modeling
The study reveals the profound impact of soil moisture flash droughts on ecosystems through analyzing eddy covariance observations. It is found that the responses of carbon and water exchanges are quite distinguishing for forests and herbaceous plants. For the ecosystem modeling, the response of stomatal conductance under soil moisture stress has been addressed in previous studies (Wilson et al., 2000), but there still exists a deficiency to capture the impacts of water stress on carbon uptake (Keenan et al., 2009), which is partly due to the different responses across species. Incorporating physiological adaptations to drought in ecosystem modeling, especially for forests, would improve the simulation of the impact of drought on the terrestrial ecosystems.
This study presents how carbon and water fluxes respond to soil moisture flash droughts during the 8 d before flash droughts, the onset and recovery stages, and the 8 d after flash droughts through analyzing decade-long observations from FLUXNET. Ecosystems show high sensitivity of GPP to soil moisture flash droughts, especially for savannas, and GPP starts to respond to soil moisture flash droughts within 16 d for more than half of the flash drought events under the influence of the deficit in soil moisture and higher VPD. However, the responses of WUE and uWUE vary across vegetation types. Positive WUE and uWUE anomalies for forests during the recovery stage indicate their resistance to soil moisture flash droughts through non-stomatal regulations, whereas WUE and uWUE decrease for croplands and savannas during the recovery stage. For now, the main concern about the ecological impact of soil moisture flash drought is concentrated on the period of flash drought, and the legacy effects of flash drought are not involved. More efforts are still needed to study the subsequent effects of soil moisture flash droughts which would contribute to assessing the accumulated ecological impacts of flash drought. Nevertheless, this study highlights the rapid response of vegetation productivity to soil moisture dynamics at sub-seasonal timescales, and different responses of water use efficiency across ecosystems during the recovery stage of soil moisture flash droughts, which complements previous studies on the sensitivity of vegetation to extreme drought at longer timescales. Understanding the response of carbon fluxes and the coupling between carbon and water fluxes to drought, especially considering the effects of climate change and human interventions (Yuan et al., 2020), might help in assessing the resistance and resilience of vegetation to drought.
Carbon fluxes and hydrometeorological variables from FLUXNET2015 are available through https://fluxnet.fluxdata.org/data/fluxnet2015-dataset/ (last access: 26 June 2019) (FLUXNET, 2019).
XY conceived and designed the study. MZ performed the analyses. MZ and XY wrote the paper.
The authors declare that they have no conflict of interest.
The authors thank two anonymous reviewers for their helpful comments and thank Zhenzhong Zeng for his constructive suggestions. This work was supported by National Natural Science Foundation of China (41875105), National Key R & D Program of China (2018YFA0606002) and the Startup Foundation for Introducing Talent of NUIST. The data used in this study are all from FLUXNET 2015 (https://fluxnet.fluxdata.org/data/fluxnet2015-dataset/, last access: 26 June 2019).
This research has been supported by the National Natural Science Foundation of China (grant no. 41875105) and the Ministry of Science and Technology of the People's Republic of China (grant no. 2018YFA0606002).
This paper was edited by Anke Hildebrandt and reviewed by two anonymous referees.
Baldocchi, D., Wilson, K., Valentini, R., Law, B., Munger, W., Davis, K., Wofsy, S., Pilegaard, K., Goldstein, A., Falge, E., Vesala, T., Hollinger, D., Running, S., Fuentes, J., Katul, G., Gu, L., Verma, S., Paw, K. T., Malhi, Y., Anthoni, P., Oechel, W., Schmid, H. P., Bernhofer, C., Meyers, T., Evans, R., Olson, R., and Lee, X.: FLUXNET: A New Tool to Study the Temporal and Spatial Variability of Ecosystem–Scale Carbon Dioxide, Water Vapor, and Energy Flux Densities, B. Am. Meteorol. Soc., 82, 2415–2434, https://doi.org/10.1038/s41597-020-0534-3, 2002.
Banerjee, O., Bark, R., Connor, J., and Crossman, N. D.: An ecosystem services approach to estimating economic losses associated with drought, Ecol. Econ., 91, 19–27, https://doi.org/10.1016/j.ecolecon.2013.03.022, 2013.
Barnes, M. L., Moran, M. S., Scott, R. L., Kolb, T. E., Ponce-Campos, G. E., Moore, D. J. P., Ross, M. A., Mitra, B., and Dore, S.: Vegetation productivity responds to sub-annual climate conditions across semiarid biomes, Ecosphere, 7, 1–20, https://doi.org/10.1002/ecs2.1339, 2016.
Basara, J. B., Christian, J. I., Wakefield, R. A., Otkin, J. A., Hunt, E. H. H., and Brown, D. P.: The evolution, propagation, and spread of flash drought in the Central United States during 2012, Environ. Res. Lett., 14, 084025, https://doi.org/10.1088/1748-9326/ab2cc0, 2019.
Beer, C., Ciais, P., Reichstein, M., Baldocchi, D., Law, B. E., Papale, D., Soussana, J. F., Ammann, C., Buchmann, N., Frank, D., Gianelle, D., Janssens, I. A., Knohl, A., Köstner, B., Moors, E., Roupsard, O., Verbeeck, H., Vesala, T., Williams, C. A., and Wohlfahrt, G.: Temporal and among-site variability of inherent water use efficiency at the ecosystem level, Global Biogeochem. Cy., 23, 1–13, https://doi.org/10.1029/2008GB003233, 2009.
Beer, C., Reichstein, M., Tomelleri, E., Ciais, P., Jung, M., Carvalhais, N., Rödenbeck, C., Arain, M. A., Baldocchi, D., Bonan, G. B., Bondeau, A., Cescatti, A., Lasslop, G., Lindroth, A., Lomas, M., Luyssaert, S., Margolis, H., Oleson, K. W., Roupsard, O., Veenendaal, E., Viovy, N., Williams, C., Woodward, F. I., and Papale, D.: Terrestrial gross carbon dioxide uptake: Global distribution and covariation with climate, Science, 329, 834–838, https://doi.org/10.1126/science.1184984, 2010.
Belward, A. S., Estes, J. E., and Kline, K. D.: The igbp-dis global 1-km land-cover data set discover: A project overview, Photogram. Eng. Remote. Sens., 65, 1013–1020, 1999.
Boese, S., Jung, M., Carvalhais, N., Teuling, A. J., and Reichstein, M.: Carbon–water flux coupling under progressive drought, Biogeosciences, 16, 2557–2572, https://doi.org/10.5194/bg-16-2557-2019, 2019.
Christian, J. I., Basara, J. B., Otkin, J. A., Hunt, E. D., Wakefield, R. A., Flanagan, P. X., and Xiao, X.: A methodology for flash drought identification: Application of flash drought frequency across the United States, J. Hydrometeorol., 20, 833–846, https://doi.org/10.1175/JHM-D-18-0198.1, 2019.
Ciais, P., Reichstein, M., Viovy, N., Granier, A., Ogée, J., Allard, V., Aubinet, M., Buchmann, N., Bernhofer, C., Carrara, A., Chevallier, F., De Noblet, N., Friend, A. D., Friedlingstein, P., Grünwald, T., Heinesch, B., Keronen, P., Knohl, A., Krinner, G., Loustau, D., Manca, G., Matteucci, G., Miglietta, F., Ourcival, J. M., Papale, D., Pilegaard, K., Rambal, S., Seufert, G., Soussana, J. F., Sanz, M. J., Schulze, E. D., Vesala, T., and Valentini, R.: Europe-wide reduction in primary productivity caused by the heat and drought in 2003, Nature, 437, 529–533, https://doi.org/10.1038/nature03972, 2005.
Cowan, I. R. and Farquhar, G. D.: Stomatal function in relation to leaf metabolism and environment, in: Integration of Activity in the Higher Plant, edited by: Jennings, D. H., Cambridge University Press, Cambridge, UK, 471–505, 1977.
Crausbay, S. D., Ramirez, A. R., Carter, S. L., Cross, M. S., Hall, K. R., Bathke, D. J., Betancourt, J. L., Colt, S., Cravens, A. E., Dalton, M. S., Dunham, J. B., Hay, L. E., Hayes, M. J., McEvoy, J., McNutt, C. A., Moritz, M. A., Nislow, K. H., Raheem, N., and Sanford, T.: Defining ecological drought for the twenty-first century, B. Am. Meteorol. Soc., 98, 2543–2550, https://doi.org/10.1175/BAMS-D-16-0292.1, 2017.
de la Motte, L. G., Beauclaire, Q., Heinesch, B., Cuntz, M., Foltýnová, L., Šigut, L., Kowalska, N., Manca, G., Ballarin, I. G., Vincke, C., Roland, M., Ibrom, A., Lousteau, D., Siebicke, L., and Longdoz, B.: Non-stomatal processes reduce gross primary productivity in temperate forest ecosystems during severe edaphic drought, Philos. T. Roy. Soc. B, 375, 20190527, https://doi.org/10.1098/rstb.2019.0527, 2020.
Flexas, J., Barbour, M. M., Brendel, O., Cabrera, H. M., Carriquí, M., Díaz-Espejo, A., Douthe, C., Dreyer, E., Ferrio, J. P., Gago, J., Gallé, A., Galmés, J., Kodama, N., Medrano, H., Niinemets, Ü., Peguero-Pina, J. J., Pou, A., Ribas-Carbó, M., Tomás, M., Tosens, T., and Warren, C. R.: Mesophyll diffusion conductance to CO2: An unappreciated central player in photosynthesis, Plant Sci., 193–194, 70–84, https://doi.org/10.1016/j.plantsci.2012.05.009, 2012.
FLUXNET: FLUXNET2015 Dataset, available at: https://fluxnet.fluxdata.org/data/fluxnet2015-dataset/, last access: 26 June 2019.
Ford, T. W. and Labosier, C. F.: Meteorological conditions associated with the onset of flash drought in the Eastern United States, Agr. Forest Meteorol., 247, 414–423, https://doi.org/10.1016/j.agrformet.2017.08.031, 2017.
Gentine, P., Green, J. K., Guérin, M., Humphrey, V., Seneviratne, S. I., Zhang, Y., and Zhou, S.: Coupling between the terrestrial carbon and water cycles – A review, Environ. Res. Lett., 14, 083003, https://doi.org/10.1088/1748-9326/ab22d6, 2019.
Gerken, T., Ruddell, B. L., Yu, R., Stoy, P. C., and Drewry, D. T.: Robust observations of land-to-atmosphere feedbacks using the information flows of FLUXNET, Clim. Atmos. Sci., 2, 37, https://doi.org/10.1038/s41612-019-0094-4, 2019.
Granier, A., Reichstein, M., Bréda, N., Janssens, I. A., Falge, E., Ciais, P., Grünwald, T., Aubinet, M., Berbigier, P., Bernhofer, C., Buchmann, N., Facini, O., Grassi, G., Heinesch, B., Ilvesniemi, H., Keronen, P., Knohl, A., Köstner, B., Lagergren, F., Lindroth, A., Longdoz, B., Loustau, D., Mateus, J., Montagnani, L., Nys, C., Moors, E., Papale, D., Peiffer, M., Pilegaard, K., Pita, G., Pumpanen, J., Rambal, S., Rebmann, C., Rodrigues, A., Seufert, G., Tenhunen, J., Vesala, T., and Wang, Q.: Evidence for soil water control on carbon and water dynamics in European forests during the extremely dry year: 2003, Agr. Forest Meteorol., 143, 123–145, https://doi.org/10.1016/j.agrformet.2006.12.004, 2007.
Green, J. K., Seneviratne, S. I., Berg, A. M., Findell, K. L., Hagemann, S., Lawrence, D. M., and Gentine, P.: Large influence of soil moisture on long-term terrestrial carbon uptake, Nature, 565, 476–479, https://doi.org/10.1038/s41586-018-0848-x, 2019.
Grossiord, C., Buckley, T. N., Cernusak, L. A., Novick, K. A., Poulter, B., Siegwolf, R. T. W., Sperry, J. S., and McDowell, N. G.: Plant responses to rising vapor pressure deficit, New Phytol., 226, 1550–1566, https://doi.org/10.1111/nph.16485, 2020.
He, M., Kimball, J. S., Yi, Y., Running, S., Guan, K., Jensco, K., Maxwell, B., and Maneta, M.: Impacts of the 2017 flash drought in the US Northern plains informed by satellite-based evapotranspiration and solar-induced fluorescence, Environ. Res. Lett., 14, 074019, https://doi.org/10.1088/1748-9326/ab22c3, 2019.
Heimann, M. and Reichstein, M.: Terrestrial ecosystem carbon dynamics and climate feedbacks, Nature, 451, 289–292, https://doi.org/10.1038/nature06591, 2008.
Hoerling, M., Eischeid, J., Kumar, A., Leung, R., Mariotti, A., Mo, K., Schubert, S., and Seager, R.: Causes and predictability of the 2012 great plains drought, B. Am. Meteorol. Soc., 95, 269–282, https://doi.org/10.1175/BAMS-D-13-00055.1, 2014.
Huang, M., Piao, S., Zeng, Z., Peng, S., Ciais, P., Cheng, L., Mao, J., Poulter, B., Shi, X., Yao, Y., Yang, H., and Wang, Y.: Seasonal responses of terrestrial ecosystem water-use efficiency to climate change, Global Change Biol., 22, 2165–2177, https://doi.org/10.1111/gcb.13180, 2016.
Kannenberg, S. A., Schwalm, C. R., and Anderegg, W. R. L.: Ghosts of the past: how drought legacy effects shape forest functioning and carbon cycling, Ecol. Lett., 23, 891–901, https://doi.org/10.1111/ele.13485, 2020.
Keenan, T., García, R., Friend, A. D., Zaehle, S., Gracia, C., and Sabate, S.: Improved understanding of drought controls on seasonal variation in mediterranean forest canopy CO2 and water fluxes through combined in situ measurements and ecosystem modelling, Biogeosciences, 6, 1423–1444, https://doi.org/10.5194/bg-6-1423-2009, 2009.
Koster, R. D., Schubert, S. D., Wang, H., Mahanama, S. P., and DeAngelis, A. M.: Flash Drought as Captured by Reanalysis Data: Disentangling the Contributions of Precipitation Deficit and Excess Evapotranspiration, J. Hydrometeorol., 20, 1241–1258, https://doi.org/10.1175/jhm-d-18-0242.1, 2019.
Le Quéré, C., Andrew, R., Friedlingstein, P., Sitch, S., Hauck, J., Pongratz, J., Pickers, P., Ivar Korsbakken, J., Peters, G., Canadell, J., Arneth, A., Arora, V., Barbero, L., Bastos, A., Bopp, L., Ciais, P., Chini, L., Ciais, P., Doney, S., Gkritzalis, T., Goll, D., Harris, I., Haverd, V., Hoffman, F., Hoppema, M., Houghton, R., Hurtt, G., Ilyina, T., Jain, A., Johannessen, T., Jones, C., Kato, E., Keeling, R., Klein Goldewijk, K., Landschützer, P., Lefèvre, N., Lienert, S., Liu, Z., Lombardozzi, D., Metzl, N., Munro, D., Nabel, J., Nakaoka, S. I., Neill, C., Olsen, A., Ono, T., Patra, P., Peregon, A., Peters, W., Peylin, P., Pfeil, B., Pierrot, D., Poulter, B., Rehder, G., Resplandy, L., Robertson, E., Rocher, M., Rödenbeck, C., Schuster, U., Skjelvan, I., Séférian, R., Skjelvan, I., Steinhoff, T., Sutton, A., Tans, P., Tian, H., Tilbrook, B., Tubiello, F., Van Der Laan-Luijkx, I., Van Der Werf, G., Viovy, N., Walker, A., Wiltshire, A., Wright, R., Zaehle, S., and Zheng, B.: Global Carbon Budget 2018, Earth Syst. Sci. Data, 10, 2141–2194, https://doi.org/10.5194/essd-10-2141-2018, 2018.
Lu, X., Liu, Z., Zhou, Y., Liu, Y., and Tang, J.: Performance of solar-induced chlorophyll fluorescence in estimating water-use efficiency in a temperate forest, Remote Sens., 10, 796, https://doi.org/10.3390/rs10050796, 2018.
McDowell, N., Pockman, W. T., Allen, C. D., Breshears, D. D., Cobb, N., Kolb, T., Plaut, J., Sperry, J., West, A., Williams, D. G., and Yepez, E. A.: Mechanisms of plant survival and mortality during drought: Why do some plants survive while others succumb to drought?, New Phytol., 178, 719–739, https://doi.org/10.1111/j.1469-8137.2008.02436.x, 2008.
Nelson, J. A., Carvalhais, N., Migliavacca, M., Reichstein, M., and Jung, M.: Water-stress-induced breakdown of carbon–water relations: Indicators from diurnal FLUXNET patterns, Biogeosciences, 15, 2433–2447, https://doi.org/10.5194/bg-15-2433-2018, 2018.
Nguyen, H., Wheeler, M. C., Otkin, J. A., Cowan, T., Frost, A., and Stone, R.: Using the evaporative stress index to monitor flash drought in Australia, Environ. Res. Lett., 14, 064016, https://doi.org/10.1088/1748-9326/ab2103, 2019.
Niu, J., Chen, J., Sun, L., and Sivakumar, B.: Time-lag effects of vegetation responses to soil moisture evolution: a case study in the Xijiang basin in South China, Stoch. Environ. Res. Risk A., 32, 2423–2432, https://doi.org/10.1007/s00477-017-1492-y, 2018.
Novick, K. A., Ficklin, D. L., Stoy, P. C., Williams, C. A., Bohrer, G., Oishi, A. C., Papuga, S. A., Blanken, P. D., Noormets, A., Sulman, B. N., Scott, R. L., Wang, L., and Phillips, R. P.: The increasing importance of atmospheric demand for ecosystem water and carbon fluxes, Nat. Clim. Change, 6, 1023–1027, https://doi.org/10.1038/NCLIMATE3114, 2016.
Otkin, J. A., Anderson, M. C., Hain, C., Svoboda, M., Johnson, D., Mueller, R., Tadesse, T., Wardlow, B., and Brown, J.: Assessing the evolution of soil moisture and vegetation conditions during the 2012 United States flash drought, Agr. Forest Meteorol., 218–219, 230–242, https://doi.org/10.1016/j.agrformet.2015.12.065, 2016.
Otkin, J. A., Svoboda, M., Hunt, E. D., Ford, T. W., Anderson, M. C., Hain, C., and Basara, J. B.: Flash droughts: A review and assessment of the challenges imposed by rapid-onset droughts in the United States, B. Am. Meteorol. Soc., 99, 911–919, https://doi.org/10.1175/BAMS-D-17-0149.1, 2018a.
Otkin, J. A., Haigh, T., Mucia, A., Anderson, M. C., and Hain, C.: Comparison of Agricultural Stakeholder Survey Results and Drought Monitoring Datasets during the 2016 U.S. Northern Plains Flash Drought, Weather Clim. Soc., 10, 867–883, https://doi.org/10.1175/wcas-d-18-0051.1, 2018b.
Otkin, J. A., Zhong, Y., Hunt, E. D., Basara, J., Svoboda, M., Anderson, M. C., and Hain, C.: Assessing the Evolution of Soil Moisture and Vegetation Conditions during a Flash Drought–Flash Recovery Sequence over the South-Central United States, J. Hydrometeorol., 20, 549–562, https://doi.org/10.1175/jhm-d-18-0171.1, 2019.
Peters, W., van der Velde, I. R., van Schaik, E., Miller, J. B., Ciais, P., Duarte, H. F., van der Laan-Luijkx, I. T., van der Molen, M. K., Scholze, M., Schaefer, K., Vidale, P. L., Verhoef, A., Wårlind, D., Zhu, D., Tans, P. P., Vaughn, B., and White, J. W. C.: Increased water-use efficiency and reduced CO2 uptake by plants during droughts at a continental scale, Nat. Geosci., 11, 744–748, https://doi.org/10.1038/s41561-018-0212-7, 2018.
Reichstein, M., Ciais, P., Papale, D., Valentini, R., Running, S., Viovy, N., Cramer, W., Granier, A., Ogée, J., Allard, V., Aubinet, M., Bernhofer, C., Buchmann, N., Carrara, A., Grünwald, T., Heimann, M., Heinesch, B., Knohl, A., Kutsch, W., Loustau, D., Manca, G., Matteucci, G., Miglietta, F., Ourcival, J. M., Pilegaard, K., Pumpanen, J., Rambal, S., Schaphoff, S., Seufert, G., Soussana, J. F., Sanz, M. J., Vesala, T., and Zhao, M.: Reduction of ecosystem productivity and respiration during the European summer 2003 climate anomaly: A joint flux tower, remote sensing and modelling analysis, Global Change Biol., 13, 634–651, https://doi.org/10.1111/j.1365-2486.2006.01224.x, 2007.
Reichstein, M., Bahn, M., Ciais, P., Frank, D., Mahecha, M. D., Seneviratne, S. I., Zscheischler, J., Beer, C., Buchmann, N., Frank, D. C., Papale, D., Rammig, A., Smith, P., Thonicke, K., Van Der Velde, M., Vicca, S., Walz, A., and Wattenbach, M.: Climate extremes and the carbon cycle, Nature, 500, 287–295, https://doi.org/10.1038/nature12350, 2013.
Roman, D. T., Novick, K. A., Brzostek, E. R., Dragoni, D., Rahman, F., and Phillips, R. P.: The role of isohydric and anisohydric species in determining ecosystem-scale response to severe drought, Oecologia, 179, 641–654, https://doi.org/10.1007/s00442-015-3380-9, 2015.
Song, L., Luis, G., Guan, K., You, L., Huete, A., Ju, W., and Zhang, Y.: Satellite sun-induced chlorophyll fluorescence detects early response of winter wheat to heat stress in the Indian Indo-Gangetic Plains, Global Change Biol., 24, 4023–4037, https://doi.org/10.1111/gcb.14302, 2018.
Stocker, B. D., Zscheischler, J., Keenan, T. F., Prentice, I. C., Peñuelas, J., and Seneviratne, S. I.: Quantifying soil moisture impacts on light use efficiency across biomes, New Phytol., 218 1430–1449, https://doi.org/10.1111/nph.15123, 2018.
Stocker, B. D., Zscheischler, J., Keenan, T. F., Prentice, I. C., Seneviratne, S. I., and Peñuelas, J.: Drought impacts on terrestrial primary production underestimated by satellite monitoring, Nat. Geosci., 12, 274–270, https://doi.org/10.1038/s41561-019-0318-6, 2019.
Svoboda, M., Lecomte, D., Hayes, M., Heim, R., Gleason, K., Angel, J., Rippey, B., Tinker, R., Palecki, M., Stooksbury, D., Miskus, D., and Stephens, S.: The drought monitor, B. Am. Meteorol. Soc., 83, 1181–1190, https://doi.org/10.1175/1520-0477-83.8.1181, 2002.
Tang, J., Bolstad, P. V., Ewers, B. E., Desai, A. R., Davis, K. J., and Carey, E. V.: Sap flux-upscaled canopy transpiration, stomatal conductance, and water use efficiency in an old growth forest in the Great Lakes region of the United States, J. Geophys. Res.-Biogeo., 111, G02009, https://doi.org/10.1029/2005JG000083, 2006.
Vicente-Serrano, S. M., Gouveia, C., Camarero, J. J., Beguería, S., Trigo, R., López-Moreno, J. I., Azorín-Molina, C., Pasho, E., Lorenzo-Lacruz, J., Revuelto, J., Morán-Tejeda, E., and Sanchez-Lorenzo, A.: Response of vegetation to drought time-scales across global land biomes, P. Natl. Acad. Sci. USA, 110, 52–57, https://doi.org/10.1073/pnas.1207068110, 2013.
Wang, L. and Yuan, X.: Two Types of Flash Drought and Their Connections with Seasonal Drought, Adv. Atmos. Sci., 35, 1478–1490, https://doi.org/10.1007/s00376-018-8047-0, 2018.
Wang, L., Yuan, X., Xie, Z., Wu, P., and Li, Y.: Increasing flash droughts over China during the recent global warming hiatus, Sci. Rep., 6, 30571, https://doi.org/10.1038/srep30571, 2016.
Wilson, K. B., Baldocchi, D. D., and Hanson, P. J.: Quantifying stomatal and non-stomatal limitations to carbon assimilation resulting from leaf aging and drought in mature deciduous tree species, Tree Physiol., 20, 787–797, https://doi.org/10.1093/treephys/20.12.787, 2000.
Wolf, S., Eugster, W., Ammann, C., Häni, M., Zielis, S., Hiller, R., Stieger, J., Imer, D., Merbold, L., and Buchmann, N.: Contrasting response of grassland versus forest carbon and water fluxes to spring drought in Switzerland, Environ. Res. Lett., 8, 035007, https://doi.org/10.1088/1748-9326/9/8/089501, 2013.
Wolf, S., Keenan, T. F., Fisher, J. B., Baldocchi, D. D., Desai, A. R., Richardson, A. D., Scott, R. L., Law, B. E., Litvak, M. E., and Brunsell, N. A.: Warm spring reduced carbon cycle impact of the 2012 US summer drought, 113, 5880–5885, https://doi.org/10.1073/pnas.1519620113, 2016.
Xie, Z., Wang, L., Jia, B., and Yuan, X.: Measuring and modeling the impact of a severe drought on terrestrial ecosystem CO2 and water fluxes in a subtropical forest, J. Geophys. Res.-Biogeo., 121, 2576–2587, https://doi.org/10.1002/2016JG003437, 2016.
Xu, C., McDowell, N. G., Fisher, R. A., Wei, L., Sevanto, S., Christoffersen, B. O., Weng, E., and Middleton, R. S.: Increasing impacts of extreme droughts on vegetation productivity under climate change, Nat. Clim. Change, 9, 948–953, https://doi.org/10.1038/s41558-019-0630-6, 2019.
Xu, H. J., Wang, X. P., Zhao, C. Y., and Yang, X. M.: Diverse responses of vegetation growth to meteorological drought across climate zones and land biomes in northern China from 1981 to 2014, Agr. Forest Meteorol., 262, 1–13, https://doi.org/10.1016/j.agrformet.2018.06.027, 2018.
Yuan, W., Cai, W., Chen, Y., Liu, S., Dong, W., Zhang, H., Yu, G., Chen, Z., He, H., Guo, W., Liu, D., Liu, S., Xiang, W., Xie, Z., Zhao, Z., and Zhou, G.: Severe summer heatwave and drought strongly reduced carbon uptake in Southern China, Sci. Rep., 6, 18813, https://doi.org/10.1038/srep18813, 2016.
Yuan, W., Zheng, Y., Piao, S., Ciais, P., Lombardozzi, D., Wang, Y., Ryu, Y., Chen, G., Dong, W., Hu, Z., Jain, A. K., Jiang, C., Kato, E., Li, S., Lienert, S., Liu, S., Nabel, J. E. M. S., Qin, Z., Quine, T., Sitch, S., Smith, W. K., Wang, F., Wu, C., Xiao, Z., and Yang, S.: Increased atmospheric vapor pressure deficit reduces global vegetation growth, Sci. Adv., 5, eaax1396, https://doi.org/10.1126/sciadv.aax1396, 2019.
Yuan, X., Ma, Z., Pan, M., and Shi, C.: Microwave remote sensing of flash droughts during crop growing seasons, Geophys. Res. Lett., 17, 8196, https://doi.org/10.1002/2015GL064125, 2015.
Yuan, X., Wang, L., and Wood, E. F.: Anthropogenic intensification of southern African flash droughts as exemplified by the 2015/16 season, B. Am. Meteorol. Soc., 1, S86–S90, https://doi.org/10.1175/bams-d-17-0077.1, 2017.
Yuan, X., Wang, L., Wu, P., Ji, P., Sheffield, J., and Zhang, M.: Anthropogenic shift towards higher risk of flash drought over China, Nat. Commun., 10, 4661, https://doi.org/10.1038/s41467-019-12692-7, 2019.
Yuan, X., Ma, F., Li, H., and Chen, S.: A review on multi-scale drought processes and prediction under global change, Trans. Atmos. Sci., 43, 225–237, https://doi.org/10.13878/j.cnki.dqkxxb.20191105005, 2020.
Zeng, Z., Piao, S., Li, L. Z. X., Wang, T., Ciais, P., Lian, X., Yang, Y., Mao, J., Shi, X., and Myneni, R. B.: Impact of Earth greening on the terrestrial water cycle, J. Climate, 31, 2633–2650, https://doi.org/10.1175/JCLI-D-17-0236.1, 2018.
Zhang, Q., Ficklin, D. L., Manzoni, S., Wang, L., Way, D., Phillips, R. P., and Novick, K. A.: Response of ecosystem intrinsic water use efficiency and gross primary productivity to rising vapor pressure deficit, Environ. Res. Lett., 14, 074023, https://doi.org/10.1088/1748-9326/ab2603, 2019.
Zhou, S., Yu, B., Huang, Y., and Wang, G.: The effect of vapor pressure deficit on water use efficiency at the subdaily time scale, Geophys. Res. Lett., 41, 5005–5013, https://doi.org/10.1002/2014GL060741, 2014.
Zhou, S., Bofu, Y., Huang, Y., and Wang, G.: Daily underlying water use efficiency for AmeriFlux sites, J. Geophys. Res.-Biogeo., 120, 887–902, https://doi.org/10.1002/2015JG002947, 2015.