the Creative Commons Attribution 4.0 License.
the Creative Commons Attribution 4.0 License.
 | 30 Oct 2020
Hydrodynamic and environmental characteristics of a tributary bay influenced by backwater jacking and intrusions from a main reservoir
Xintong Li
Bing Liu
Yuanming Wang
Yongan Yang
Ruifeng Liang
Fangjun Peng
Shudan Xue
Zaixiang Zhu
Kefeng Li
The construction of large reservoirs results in the formation of tributary bays, and tributary bays are inevitably influenced by backwater jacking and intrusions from the main reservoir. In this paper, a typical tributary bay (Tangxi River) of the Three Gorges Reservoir (TGR) was selected to study the hydrodynamic and environmental characteristics of a tributary bay influenced by the jacking and intrusions from the main reservoir. The flow field, water temperature, and water quality of Tangxi River were simulated using the hydrodynamic and water quality model CE-QUAL-W2 (thomas and Scott, 2008), and the eutrophication status of the tributary bay was also evaluated. The results showed that the main reservoir had different effects on its tributary bay in each month. The tributary bay was mainly affected by backwater jacking from the main reservoir when the water level of the main reservoir dropped and by intrusions from the main reservoir when the water level of the main reservoir rose. An obvious water quality concentration boundary existed in the tributary bay, which was consistent with the regional boundary in the flow field. The flow field and water quality on both sides of the boundary were quite different. The results of this study can help us figure out how the backwater jacking and intrusions from the main reservoir influence the hydrodynamic and water environment characteristics of the tributary bay and provide guidance for water environment protection in tributary bays.
- Article
(9898 KB) - Full-text XML
- BibTeX
- EndNote


The functions of water conservancy and hydropower projects include power generation, flood control, irrigation, and shipping, which play an important role in human social life (Deng and Bai, 2016; Zhang, 2014; Peng et al., 2014). In recent years, a large number of high dams, with heights of even 300 m, have been planned or completed in the middle and upper reaches of the Yangtze River to meet the increasing energy demand (Zhou et al., 2013). These dams block fish migration routes between upstream and downstream regions (Oldani and Claudio, 2002; Ziv et al., 2012) and change the fish communities (Gao et al., 2010). In the flood season, flood discharge produces water that is supersaturated in dissolved gas in the downstream river channel (Feng et al., 2014; Lu et al., 2011; Wang et al., 2011; McGrath et al., 2006). In the reservoir area, the elevated water level produces a much slower water velocity, which results in sediment deposition, eutrophication, and stratification in terms of water temperature and water quality (Zhu, 2017; Wu, 2013; Zheng et al., 2011).
Backwater extends to some tributaries after the construction of dammed-river reservoirs, which causes the water depth to increase and the water velocity to slow in these tributaries, thus forming water areas similar to lakes known as a tributary bay (Yu et al., 2013). Backwater areas represent the connection between different habitats in the main stream and the tributary and are also an important location for physical, chemical, and biological exchanges between adjacent habitats (Zhang et al., 2010). After the impoundment of a reservoir, the hydrodynamic conditions and the environmental factors (water temperature, water quality, etc.) of the tributaries in the reservoir area are affected by the main stream and exhibit complex distribution characteristics (Xiong et al., 2013). Backwater jacking occurs in tributaries when dams or other obstructions raise the surface of the water upstream from them. Intrusion is the process by which water from the main stream intrudes into the tributary. A tributary bay is always influenced by backwater jacking and intrusions under fluctuations of the water level of the main reservoir, because such changes induce changes in the hydrodynamic conditions in the tributary bay (Ji et al., 2010; Wang et al., 2014). The horizontal flow velocity near the confluence becomes uneven in the tributary bay, and the flow field distribution tends to gradually change with increasing distance from the confluence (Hu et al., 2013; Yin et al., 2013). The water level of a reservoir changes constantly to meet multiple requirements, which results in changes in water temperature and water environment in tributary bays (Fu et al., 2010; Holbach et al., 2014; Yang et al., 2013). Existing studies have shown that water level fluctuation has become a major cause of recent eutrophication and pollution problems in the Three Gorges Reservoir (TGR), particularly within its tributary backwaters (Holbach et al., 2015). After the impoundment of reservoirs, eutrophication and eutrophication-related problems often occur in tributary bays due to changes in nutrient patterns (Yang et al., 2010; Liu et al., 2012; Ran et al., 2019). Therefore, exploring the distribution and evolution of the hydrodynamic and water environment characteristics of tributary bays in response to backwater jacking and intrusions from the main reservoir is key to solving eutrophication problems.
Many recent studies have paid attention to the deterioration of the water environment in tributary bays. In response to the operation of cascade reservoirs, a series of profound geological, morphological, ecological, and biogeochemical responses will appear in the estuary, delta, and coastal sea of the Yangtze River subaqueous delta (Bangqi Hu et al., 2009). Some scholars have found that the water quality of the TGR was relatively stable before and after impoundment, but the water quality of tributary bays deteriorated, resulting in frequent algal blooms (Liu et al., 2016; Zou and Zhai, 2016; Cai and Hu, 2006). Changes in the vertical mixing of layers driven by stratified density currents were the key factor in the formation of algal blooms (Tang et al., 2016). Through isotopic measurements in the Xiangxi River or other tributaries of the TGR, it has been found that the nutrients in tributary bays did not originate solely in the tributary basins but instead were mainly from the main stream of the Yangtze River, and the nutrient levels were affected by constantly changing hydrodynamic conditions across seasons (Holbach et al., 2014; Yang et al., 2018; Zheng et al., 2016). A rise in the water level may lead to a rise or decline in the chlorophyll content, depending on the water cycle mode in the tributary (Ji et al., 2017). Previous studies have paid considerable attention to changes in hydrodynamic characteristics and the deterioration of the water environment in the tributaries but have not considered the influence of the main reservoir (Zhao, 2017; Long et al., 2019). There are few systematic studies on the variation in the hydrodynamic and water environment characteristics of tributary bays influenced by backwater jacking and intrusions from the main reservoir. There are many open questions regarding the functions of these types of systems: how does the operation of the main reservoir affect tributary bays, how do hydrodynamic forces and the water environment of tributary bays respond to backwater jacking and the intrusion of water from the main reservoir, and what controls the water environment of tributary bays. These questions have not yet been resolved.
Tangxi River is a typical tributary bay of the TGR, and it has been severely influenced by backwater jacking and intrusions in recent years. This phenomenon accelerates the deterioration of the water environment of Tangxi River. Thus, Tangxi River was selected as the focus of this study. Based on the collection and analysis of basic data, we simulated the flow field, water temperature, and water quality of Tangxi River using the hydrodynamic and water quality model CE-QUAL-W2 (Thomas and Scott, 2008). This model performs well in computing the velocity, the intrusion layer at the plunge point, and the travel distance of the density-driven current (Long et al., 2019), and many scholars have obtained good results using this model to simulate the hydrodynamics, water temperature, and water quality of reservoirs and lakes (Bowen and Hieronymus, 2003; Lung and Nice, 2007; Berger and Wells, 2008; Debele et al., 2008; Noori et al., 2015; Long et al., 2018). We also evaluated the eutrophication status of the tributary bay and systematically identified the influence of backwater jacking and intrusions from the main reservoir on the tributary bay. The results of this study can help us to figure out how the backwater jacking and intrusions from the main reservoir influenced the hydrodynamic and water environment characteristics of the tributary bay and provide guidance for water environment protection in tributary bays.
2.1 Research area
The main stream of the Yangtze River has a total length of approximately 6300 km and a drainage area of approximately 1.8×10⁶ km2. The reach between Yichang City in Hubei and Yibin City in Sichuan is considered the upper reaches of the Yangtze River, which has a length of 1045 km and a natural drop of 220 m. The drainage area of the upper Yangtze River is 527 000 km2, and the average annual flow at the location of Three Gorges Dam is 14300 m3 s−1 (Fan, 2007).
Tangxi River is a first-order tributary of the upper Yangtze River; it has a total length of 104 km, a drainage area of 1707 km2, and an average annual flow of 57.2 m3 s−1. After the completion of the TGR, Tangxi River became a tributary bay of the TGR. In this paper, the 42.6 km long reach of Tangxi River affected by the backwater jacking and intrusions from the TGR was selected as the study area (Fig. 1).
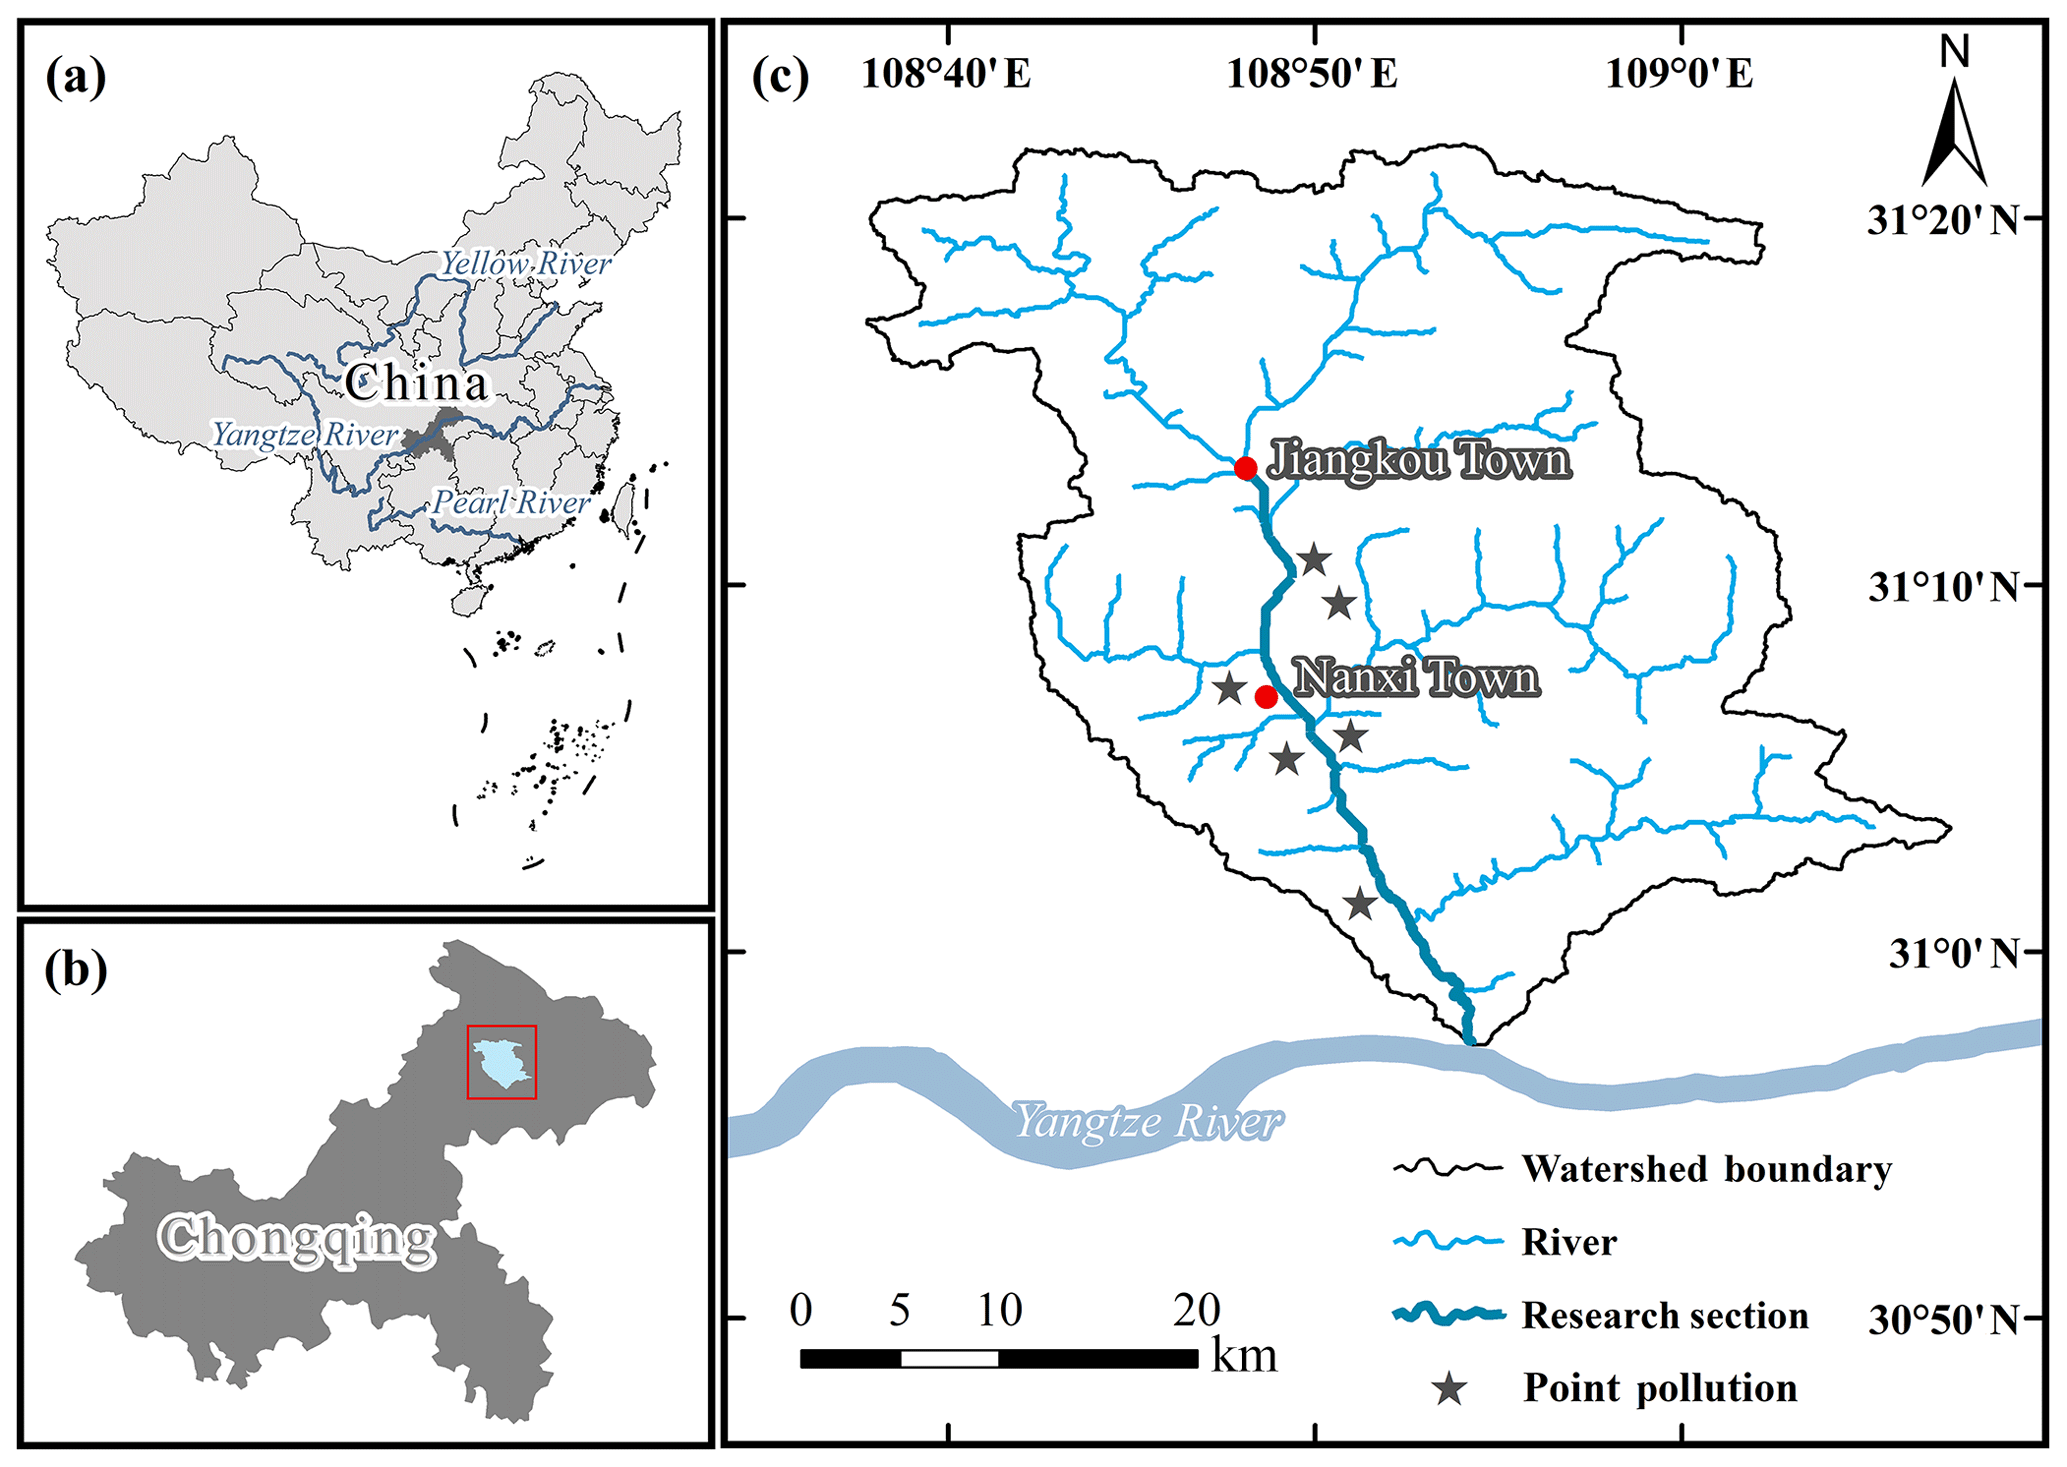
Figure 1Research area and hydrologic system of the Tangxi River basin. (a) Location of the research area relative to the country scale. (b) Location of the research area relative to the city scale. (c) Hydrologic system of the research area.
2.2 Numerical simulation of hydrodynamic and environmental factors in the tributary bay
2.2.1 Mathematical model
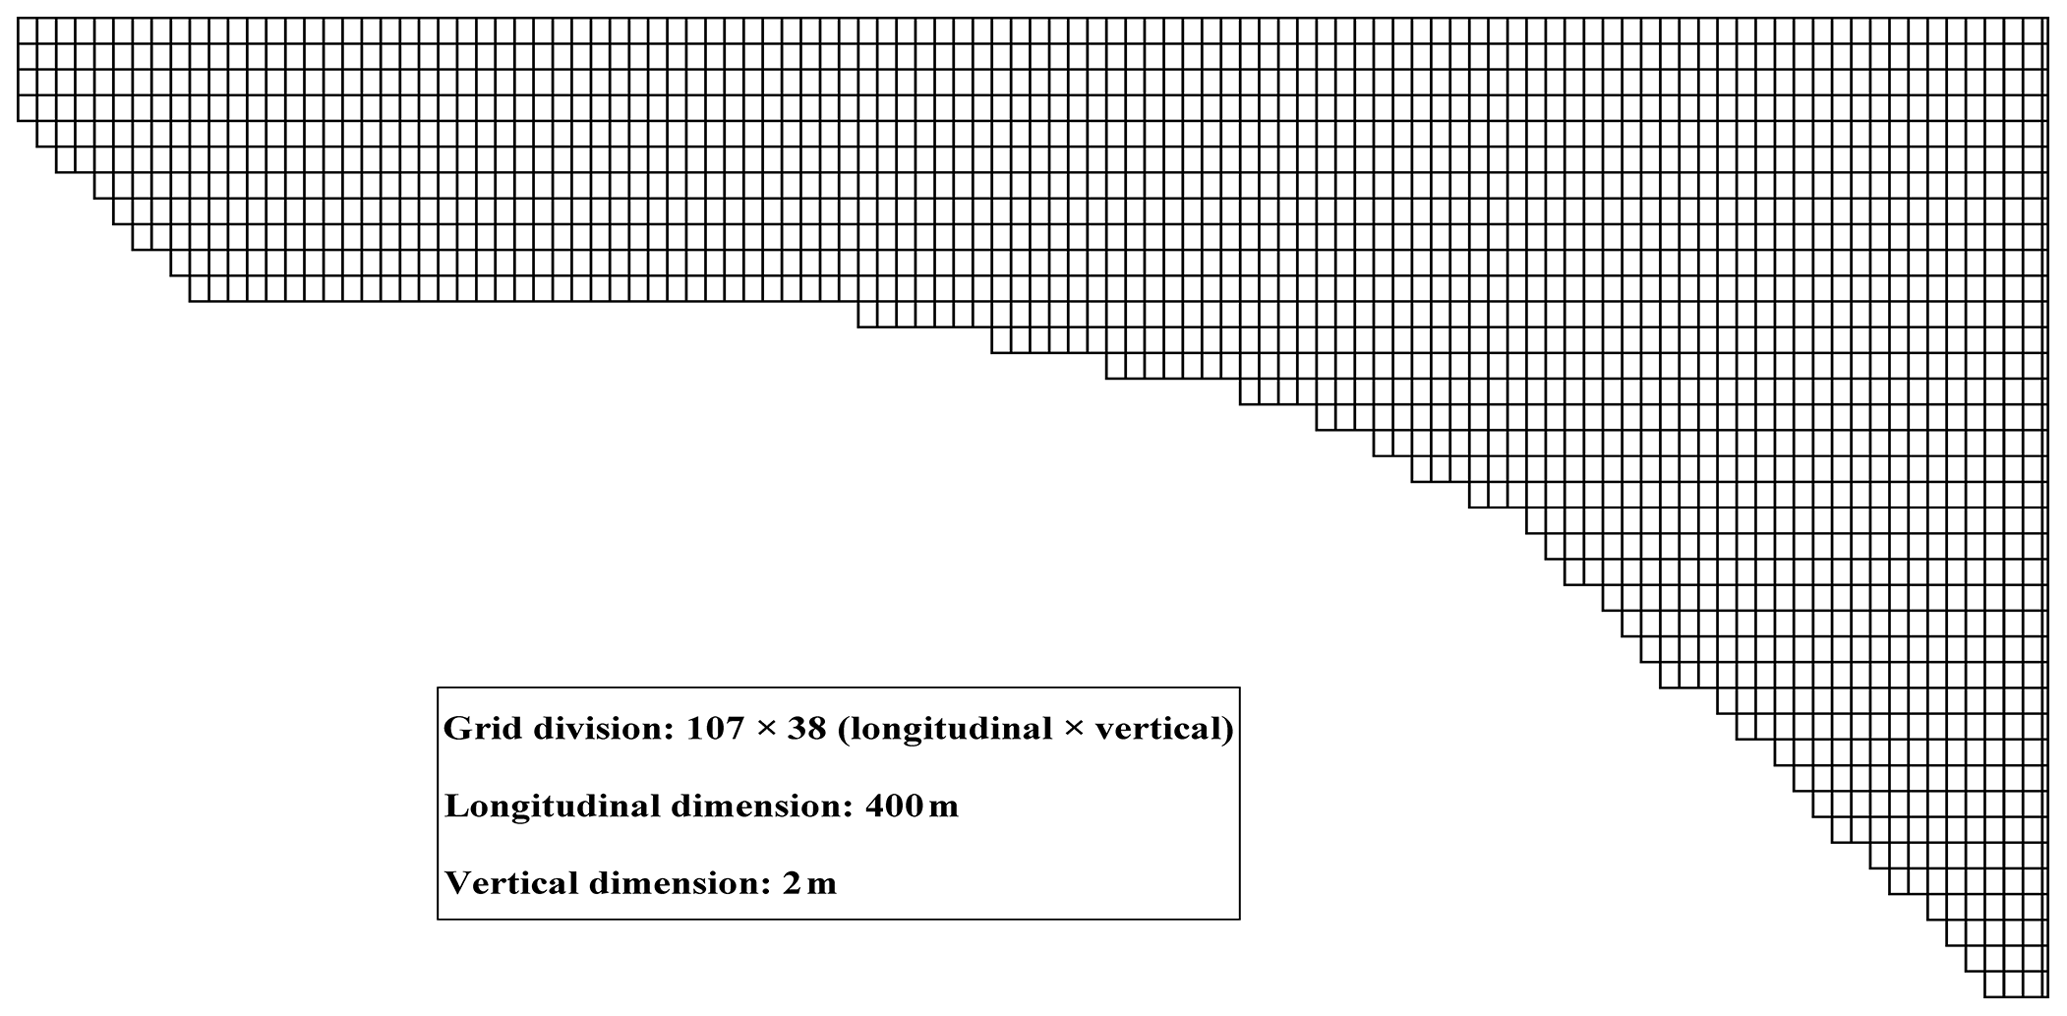
The vertical two-dimensional model CE-QUAL-W2 solves the width-averaged equations and is appropriate for simulating flow in long, narrow water bodies. This model was adopted for the calculation of the hydrodynamic conditions, water temperature, and water quality in the tributary bay (Thomas and Scott, 2008). The model is solved by coupling the governing equations, a transport equation, and a surface heat exchange equation. The computational domain was divided into 107 × 38 (longitudinal × vertical) rectangular cell grids with a longitudinal dimension of 400 m and vertical dimension of 2 m (Fig. 2).
The governing equations of the model are as follows: the continuity equation is
the x-momentum equation is
the z-momentum equation is
the free water surface equation is
and the equation of state is
where x and z represent the horizontal distance and vertical elevation, respectively; U and W are the temporal mean velocity components in the horizontal and vertical directions, respectively; B is the channel width; q is the discharge; t denotes the time; g is the acceleration due to gravity; α is the angle of the riverbed with respect to the x direction; P represents pressure; τxx and τxz are the lateral average shear stress in the x direction and z direction, respectively; ρ represents density; η and h are the water surface and water depth, respectively; and is a density function dependent upon temperature, total dissolved solids or salinity, and inorganic suspended solids.
Accurate hydrodynamic calculations require accurate water densities. The following equation of state relating the density to the water temperature was used in the model:
where ρTw denotes density and TW is the water temperature (∘C).
The universal transport equation for scalar variables, such as temperature and chemical oxygen demand (COD), is as follows:
where Φ is the laterally averaged constituent concentration; Dx and Dz are the temperature and constituent dispersion coefficient in the horizontal and vertical directions, respectively; qΦ represents the lateral inflow or outflow mass flow rate of the constituent per unit volume; and SΦ denotes the laterally averaged source/sink term.
Heat exchange at the water surface includes net solar shortwave radiation, net longwave radiation, evaporation and conduction. The surface heat exchange is computed as follows:
where Hn is the net rate of heat exchange across the water surface; Hs is the incident shortwave solar radiation; Ha represents the incident longwave radiation; Hsr and Har represent the reflected solar radiation of shortwave and longwave radiation, respectively; Hbr is the back radiation from the water surface; He is the evaporative heat loss; and Hc represents the heat conduction.
The shortwave absorption model we used was based on Bears law (Thomas and Scott, 2008). The attenuation coefficients in the model include the fraction absorbed at the water surface and the extinction coefficient, which were 0.45 and 0.45 m−1, respectively. Most of the shortwave radiation was absorbed by the water, and the other small part of shortwave radiation reaching the bottom was considered being reflected back into the water column.
2.2.2 Model validation
The water quality at the Tangxi River bridge was monitored in 2017, and the data were used to verify the model and the degradation coefficient of each water quality parameter. Average simulated values at 0–5 m depth were used to compare with the measured values. The Tangxi River bridge is 18 km from the confluence. Due to the low water level of the main reservoir, the backwater did not reach the Tangxi River bridge from June to August. Therefore, only the data from January to May and from September to December were selected to verify the simulated results of water temperature (T), ammonia nitrogen (NH3-N), total phosphorus (TP), and total nitrogen (TN). COD values were not measured. The degradation coefficients of COD, NH3-N, TP, and TN are 0.0032, 0.0032, 0.0018, and 0.0018 d−1, respectively.
The results showed that the simulated values of T, TP, and TN fit well with the measured values. The difference in T between the simulated value and the measured value was 0.6–4.7 ∘C, and the root-mean-square error was 1.8 ∘C. The difference in TP between the simulated value and the measured value was 0.004–0.03 mg L−1, and the root-mean-square error was 0.01 mg L−1. The difference in TN between the simulated value and the measured value was 0.02–0.26 mg L−1, and root-mean-square error was 0.16 mg L−1. For NH3-N, the difference between the simulated value and the measured value was 0.03–0.08 mg L−1, the root-mean-square error was 0.06 mg L−1, and the relative error was greater than 30 %. The degradation process of NH3-N usually exhibits complex characteristics, and many factors affect the degradation coefficient of NH3-N, such as the water microbial properties, hydrodynamic conditions, water pollution degree, suspended solids, and pH (Bockelmann et al., 2004; Wang et al., 2016; Pan et al., 2020), which resulted in a higher simulation error compared with the other values.
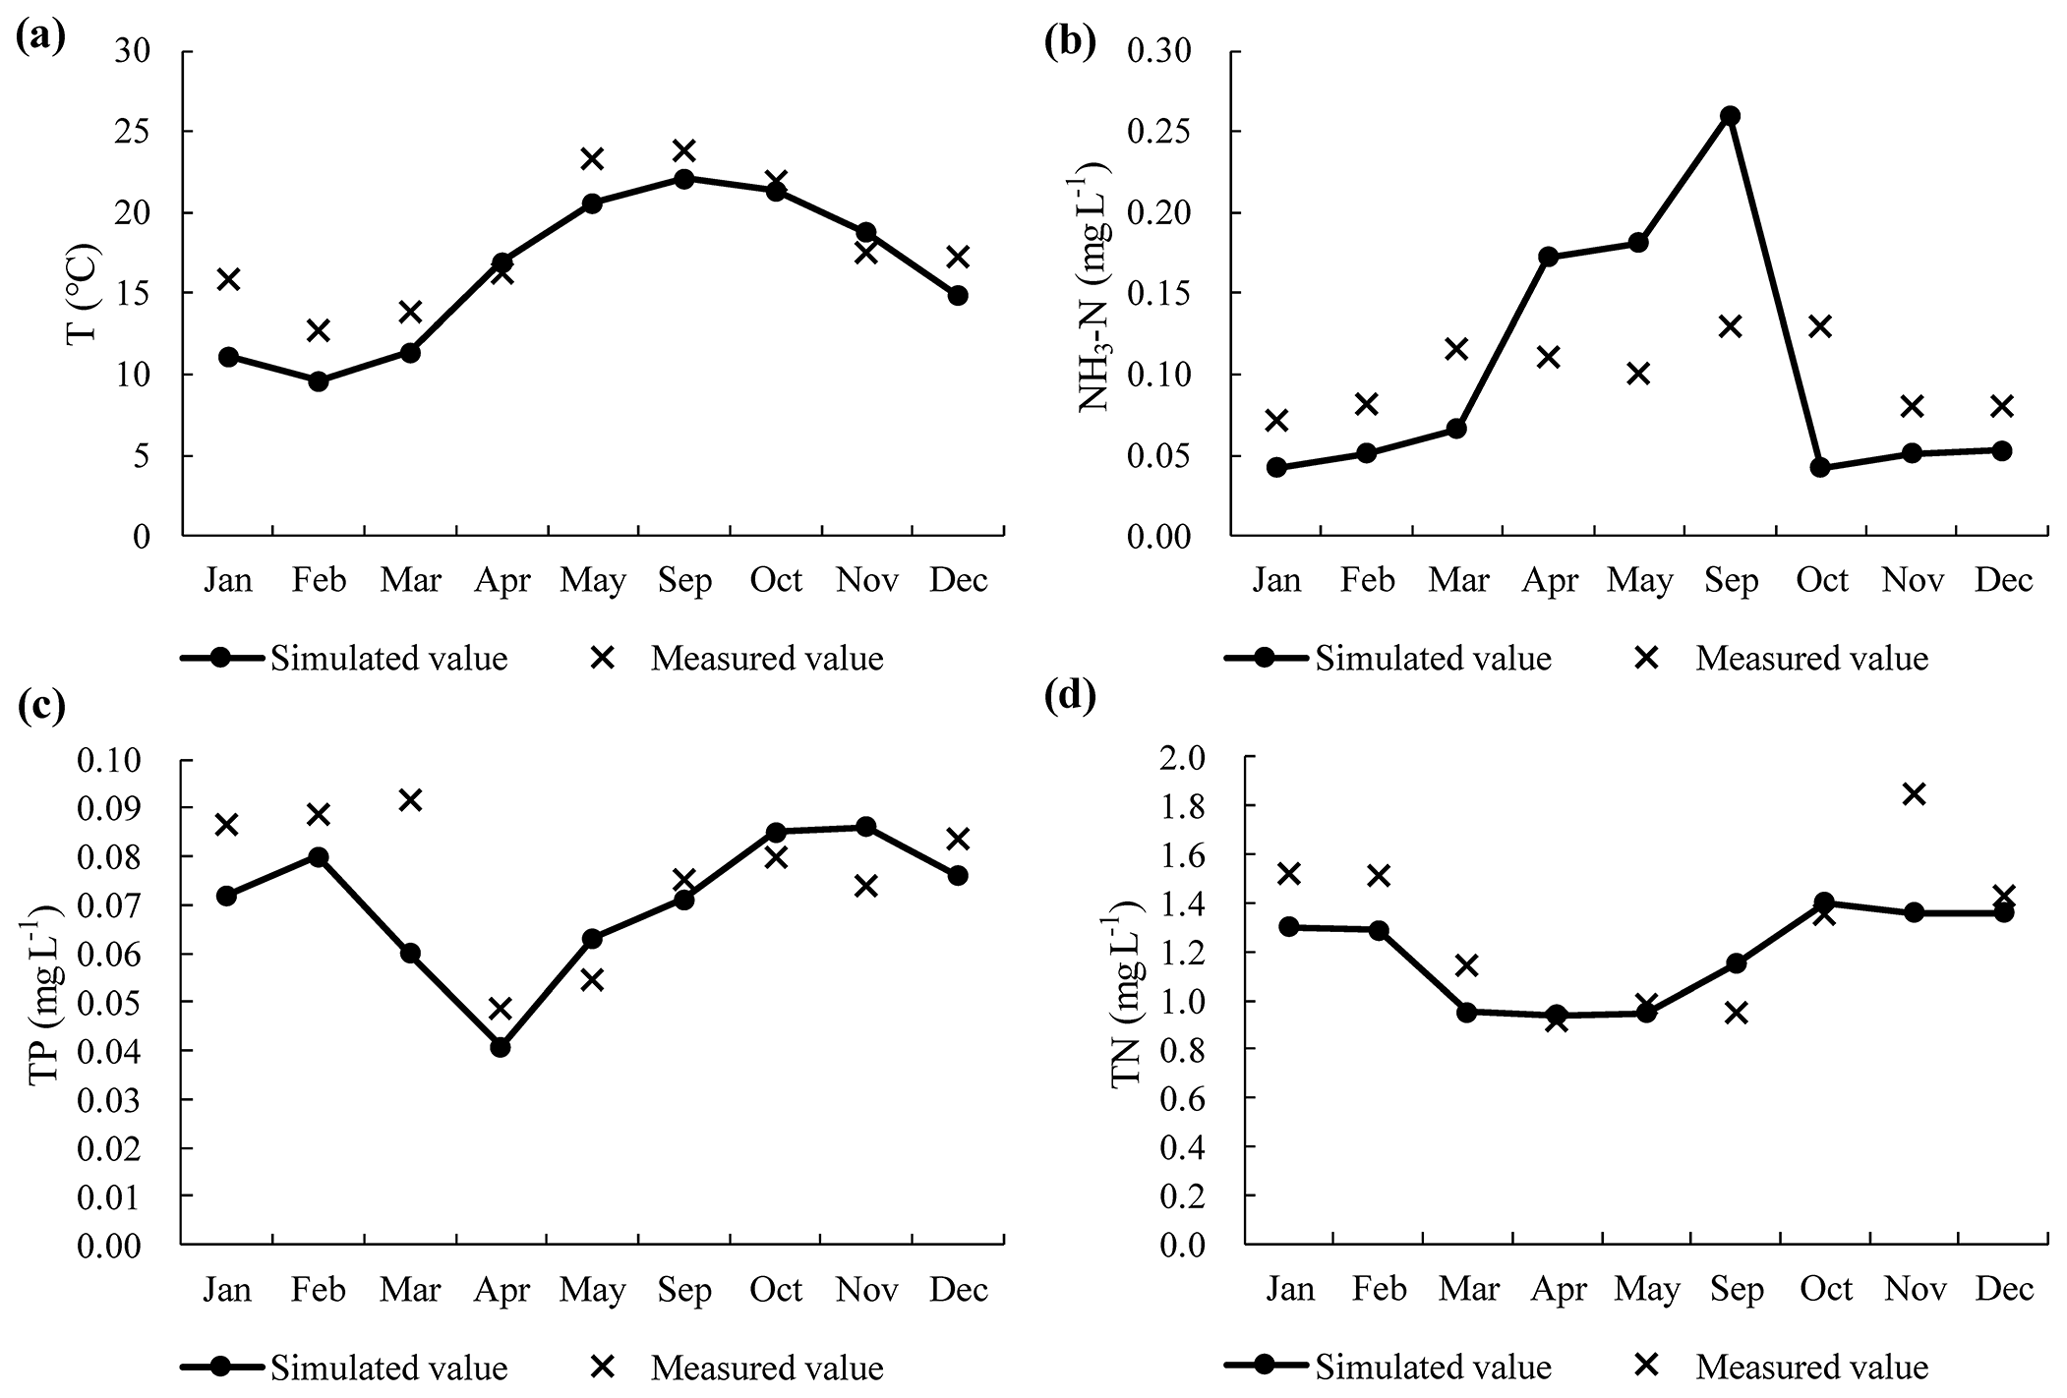
Figure 3Comparison between the average simulated values at 0–5 m depth and measured values at the Tangxi River bridge in each month. (a) Comparison of water temperature; (b) comparison of ammonia nitrogen; (c) comparison of total phosphorus; and (d) comparison of total nitrogen.
2.2.3 Boundary conditions
The boundary conditions of the calculation included the meteorology, water temperature of the inflow, discharge flow, water quality, and water level of the TGR (Fig. 3). The daily average multiyear meteorological data (2011–2018) were obtained from Yunyang County weather station, which is 19.7 km away from the tributary bay (Fig. 4). The pollution loads of point sources and non-point sources were calculated and included as inputs to the numerical simulations (Table 1). The daily average multiyear data on the boundary conditions of flow, water level, water temperature, and water quality were also considered (Fig. 5). The diurnal cycle of the simulation lasted 3 years.
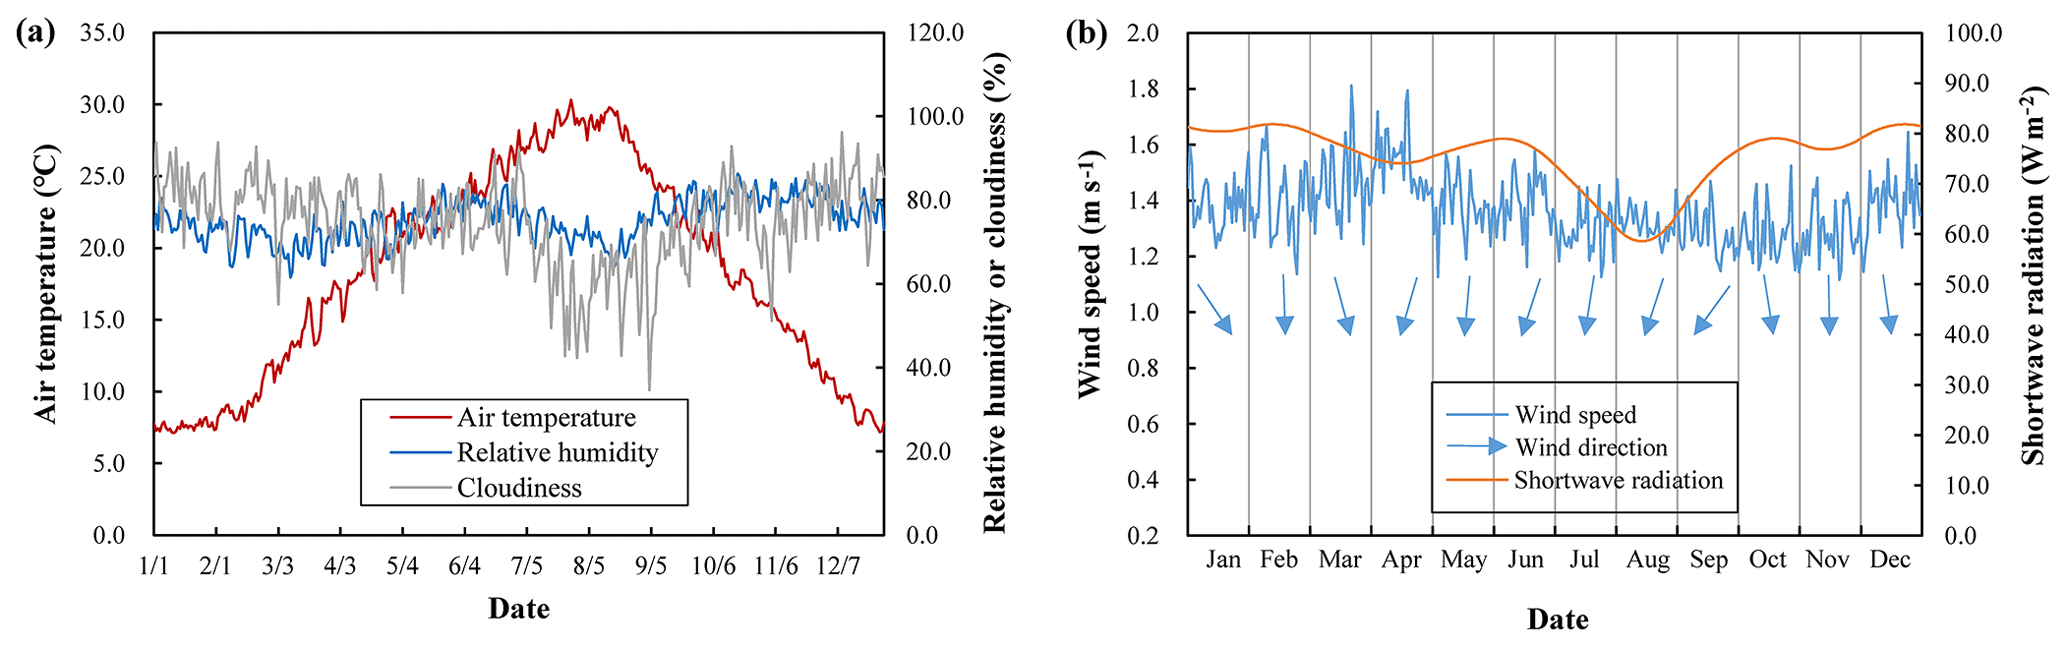
Figure 4Meteorological conditions. (a) Daily average multiyear values of air temperature, humidity and cloudiness and (b) daily average multiyear values of wind conditions and shortwave radiation. Arrows in (b) indicate the wind direction, and the arrow pointing upward is defined as the direction of due north.
Table 1Statistics of pollution load in the Tangxi River research area.
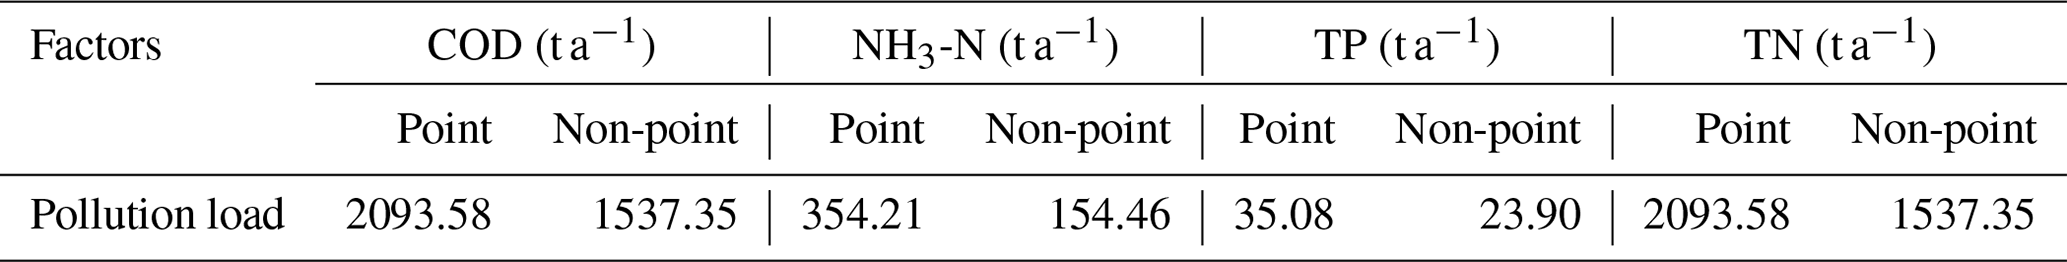
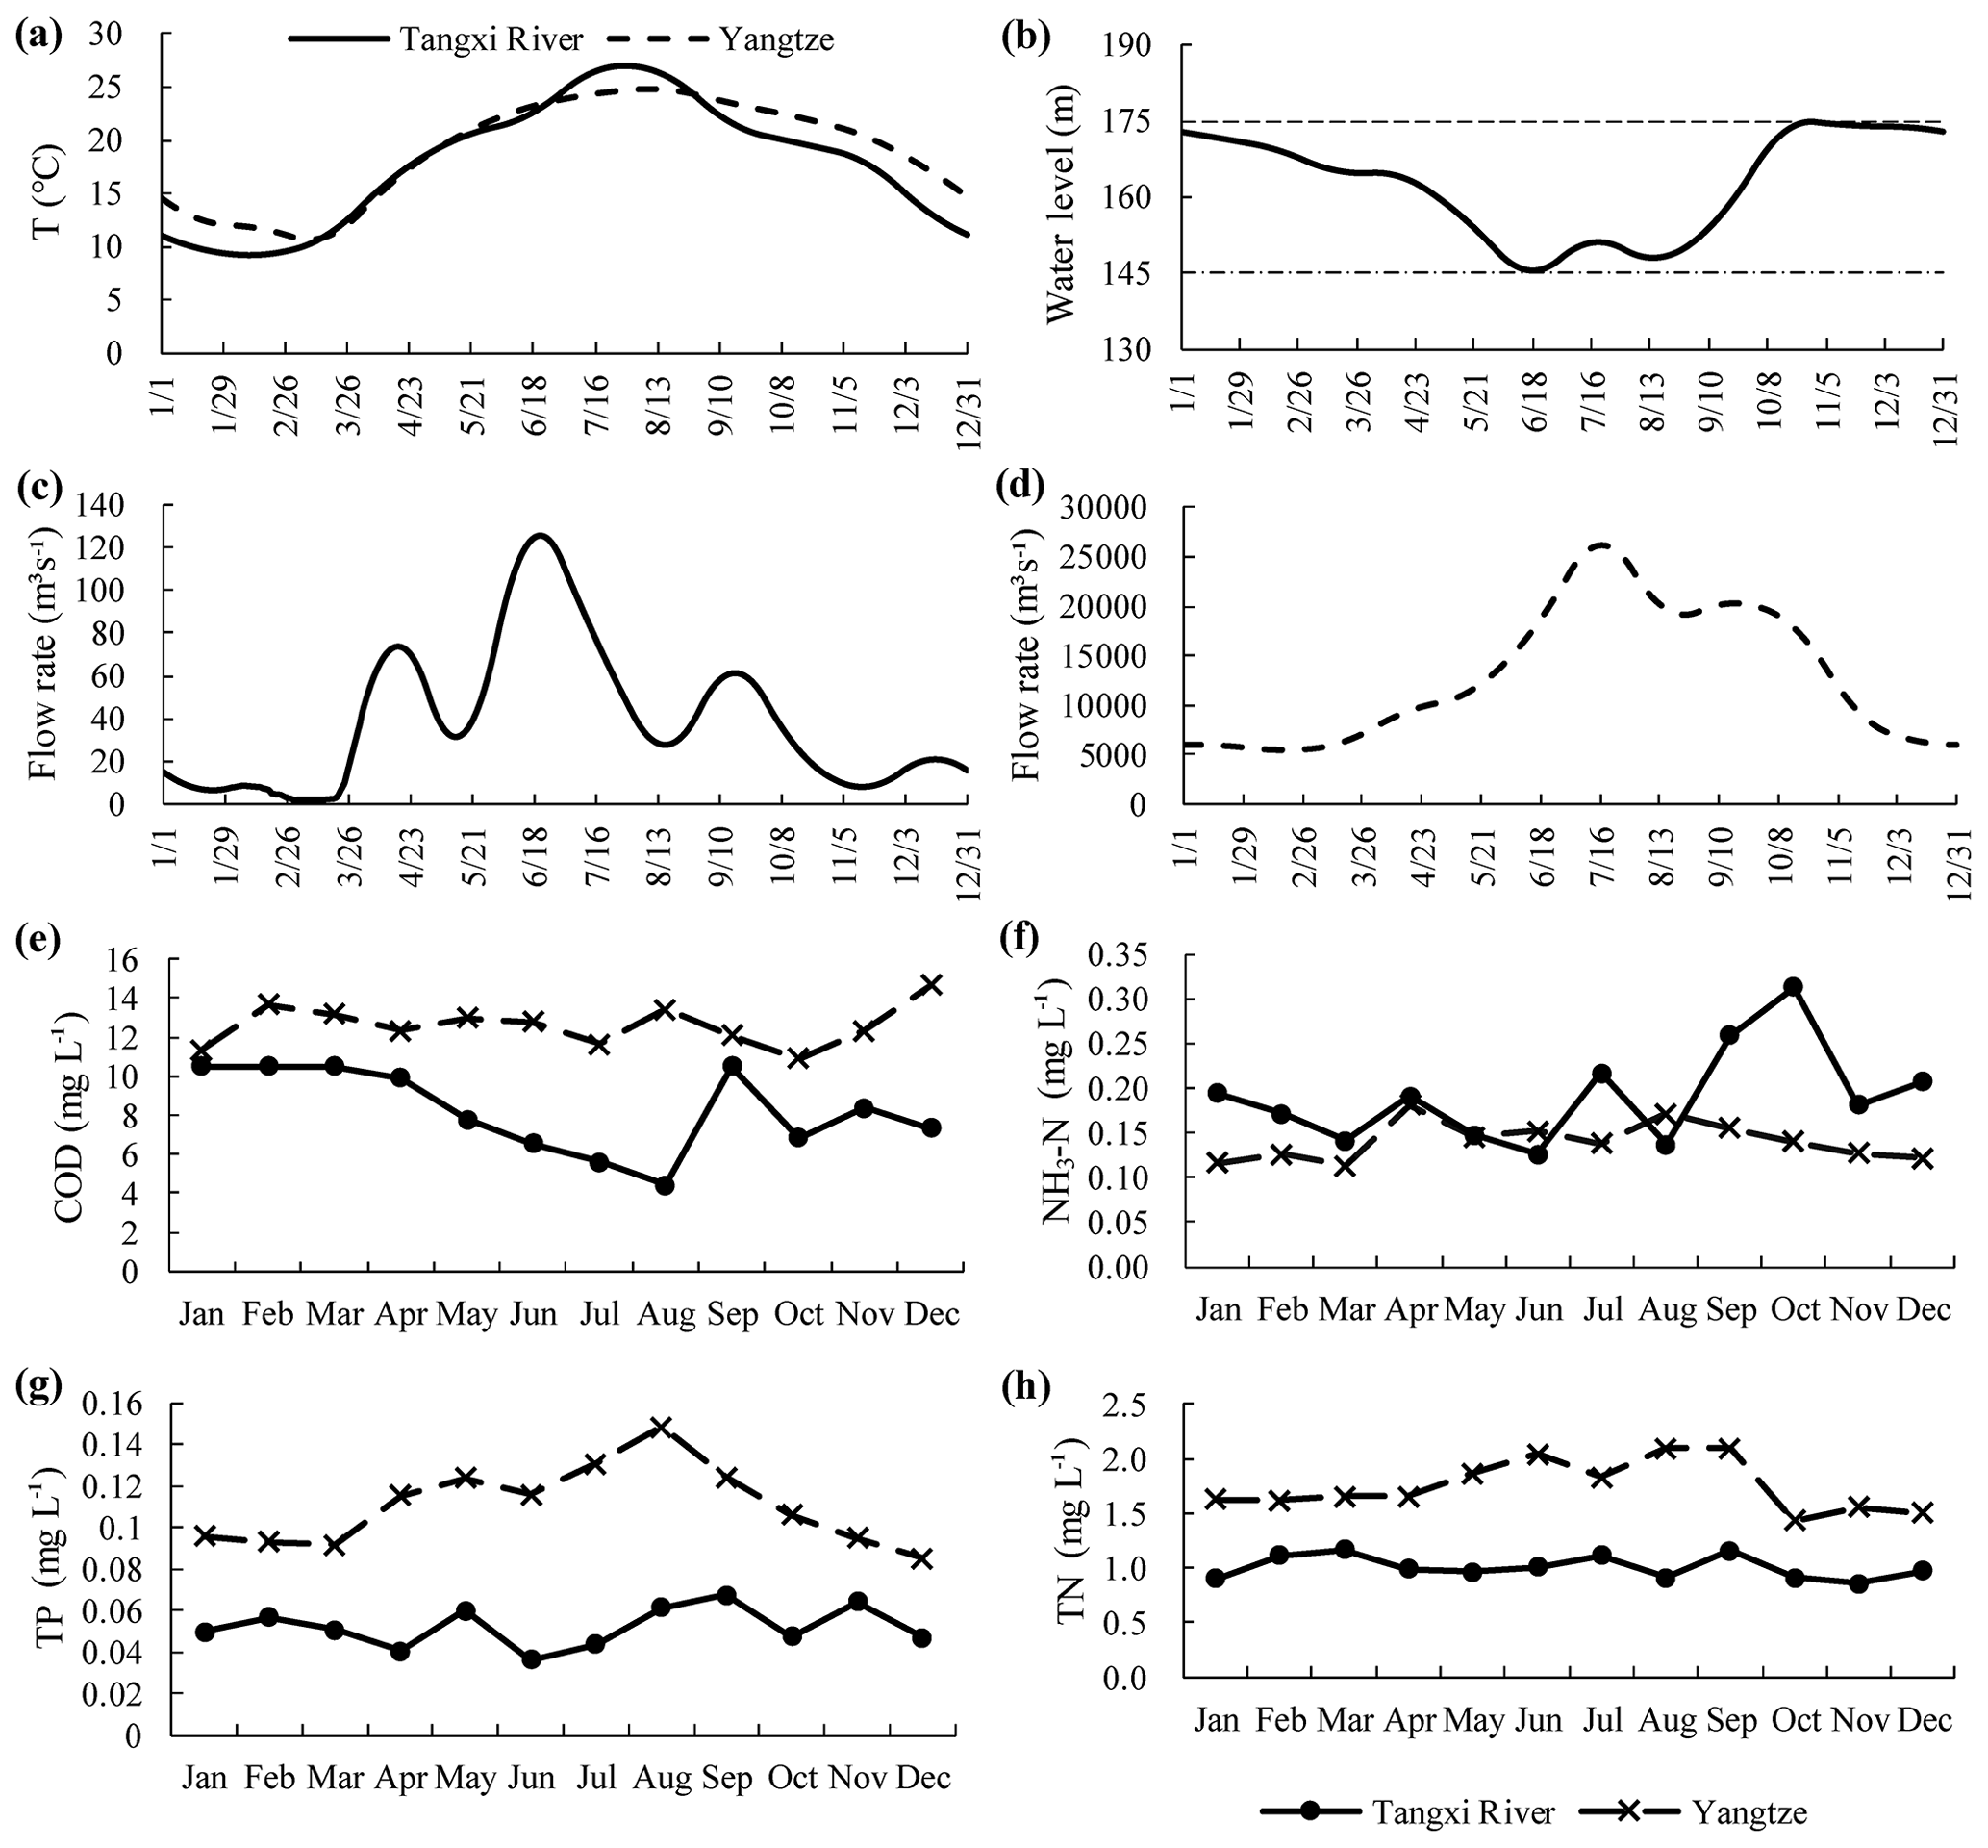
Figure 5Simulation boundary conditions. (a) Daily water temperatures of the main reservoir and tail of the tributary bay; (b) water level of the main reservoir; (c) daily inflow of the tributary bay; (d) daily inflow of the main reservoir; and (e–h) monthly water quality (COD, NH3-N, TP, and TN) of the main reservoir and tributary bay, respectively.
2.3 Simulation of eutrophication
The comprehensive nutrition index (TLI (∑)) method (Carlson, 1977) was used to evaluate the nutritional status of the tributary bay. Lakes and reservoirs can be classified into different nutritional statuses based on their TLI (∑) values:
-
if TLI (∑) < 30, then it is oligotrophic;
-
if 30 ≤ TLI ( 50, then it is mesotrophic;
-
if TLI (∑) > 50, then it is eutrophic;
-
if 50 < TLI ( 60, then it is slightly eutrophic;
-
if 60 < TLI ( 70, then it is moderately eutrophic; and
-
if TLI (∑) > 70, then it is severely eutrophic.
The formula for calculating the TLI (∑) is as follows:
where TLI (∑) is the comprehensive nutrition index; Wj represents the correlation weight of the nutrition state index of the jth parameter; and TLI (j) denotes the nutritional status index of the jth parameter.
Considering chlorophyll a (chl a) as the reference parameter, the normalized correlation weight formula of the jth parameter is as follows:
where rij is the correlation coefficient between the jth parameter and the reference parameter chl a, and m represents the number of evaluation parameters.
The correlation coefficients rij and between chl a and other parameters are shown in Table 2 (Li and Zhang, 1993).
Table 2The correlation coefficients rij and between chl a and other parameters.

The calculation formula of the nutritional status index of each parameter are shown as follows:
where TP is total phosphorus; TN represents the total nitrogen; SD represents the Secchi depth, a measure of transparency; and CODMn is the chemical oxygen demand.
Among the parameters listed above, TP and TN are pivotal, and a limitation of TP or TN can limit algae blooms (Bennett et al., 2017; Morgenstern et al., 2015; Lewis et al., 2011). The nutrient status of the surface water in the Tangxi River tributary bay in different months was evaluated in this study according to the TLI (∑) method. The influence of water temperature was also considered during the nutrient status evaluation.
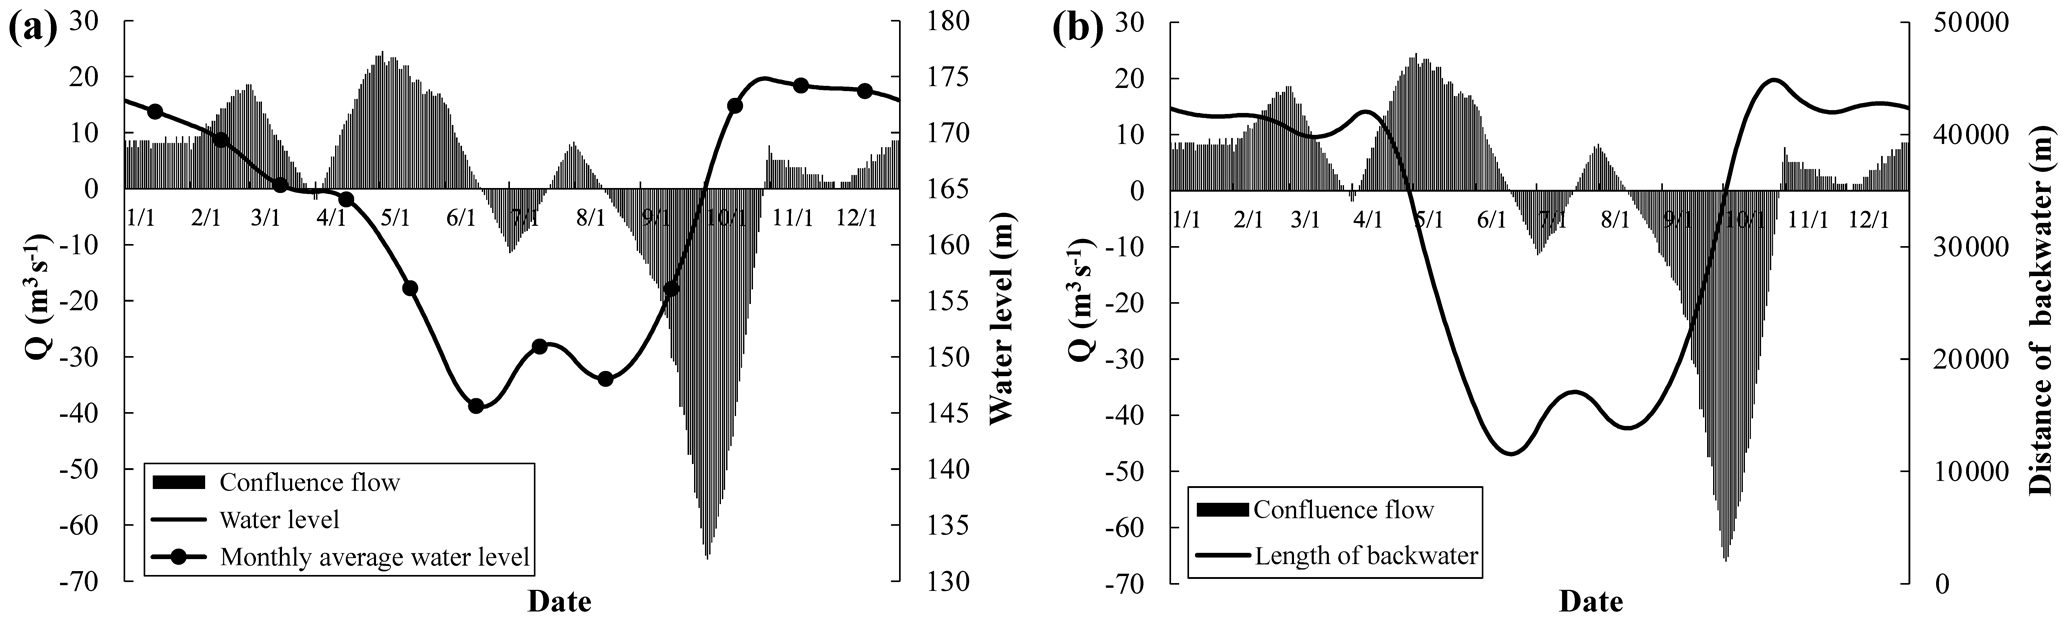
Figure 6Relationships among water level, length of backwater, and confluence flow. (a) Daily variations in confluence flow and water level and (b) daily variations in confluence flow and length of backwater.
3.1 Hydrological situation
The temporal variations in confluence flow and water level are shown in Fig. 6a. During July and from August to October, the flow value at the confluence was negative, which indicated that the tributary bay was mainly affected by backwater intrusions from the main reservoir. In contrast, the tributary bay was mainly affected by backwater jacking from the main reservoir in other months (January–June and November–December). The backwater intrusion weakened when the water level of the main reservoir dropped, and it became obvious when the water level of the main reservoir rose.
Periods of intrusions occurring in other tributaries were investigated in previous studies. Backwater intrusions were mainly concentrated during low-water-level operation and impoundment periods in the Daning River (Zhao, 2017). The water of the main stream of TGR flowed backward into the Xiangxi bay in the density current at different plunging depths during the process of TGR impoundment at the end of the flood season in autumn, and the intrusion was weak when the water level fell (Ji et al., 2010; Yang et al., 2018). The results of this study and previous studies indicated that the backwater intrusions showed obvious seasonal changes and the intrusion time was almost the same.
The temporal variation in confluence flow and the length of backwater are shown in Fig. 6b. With the change in the flow at the confluence, the length of the backwater also changed. During January to April and October to December, the water level of the main reservoir was between 160 and 175 m and the backwater reached distances of 39.8–42.6 km from the confluence simultaneously. During May to September, the water level of the main reservoir remained at 145–160 m, and the backwater reached distances of 12.6–23.8 km from the confluence.
The water level and the length of backwater had a negative correlation with the confluence flow. When the water level dropped, the value of the confluence flow was positive, and the length of backwater decreased. The tributary bay was mainly affected by the jacking of the main reservoir during this period. Conversely, when the water level rose, the water flow at the confluence was negative, and the length of the backwater increased. The tributary bay was mainly affected by backwater intrusions at this time.
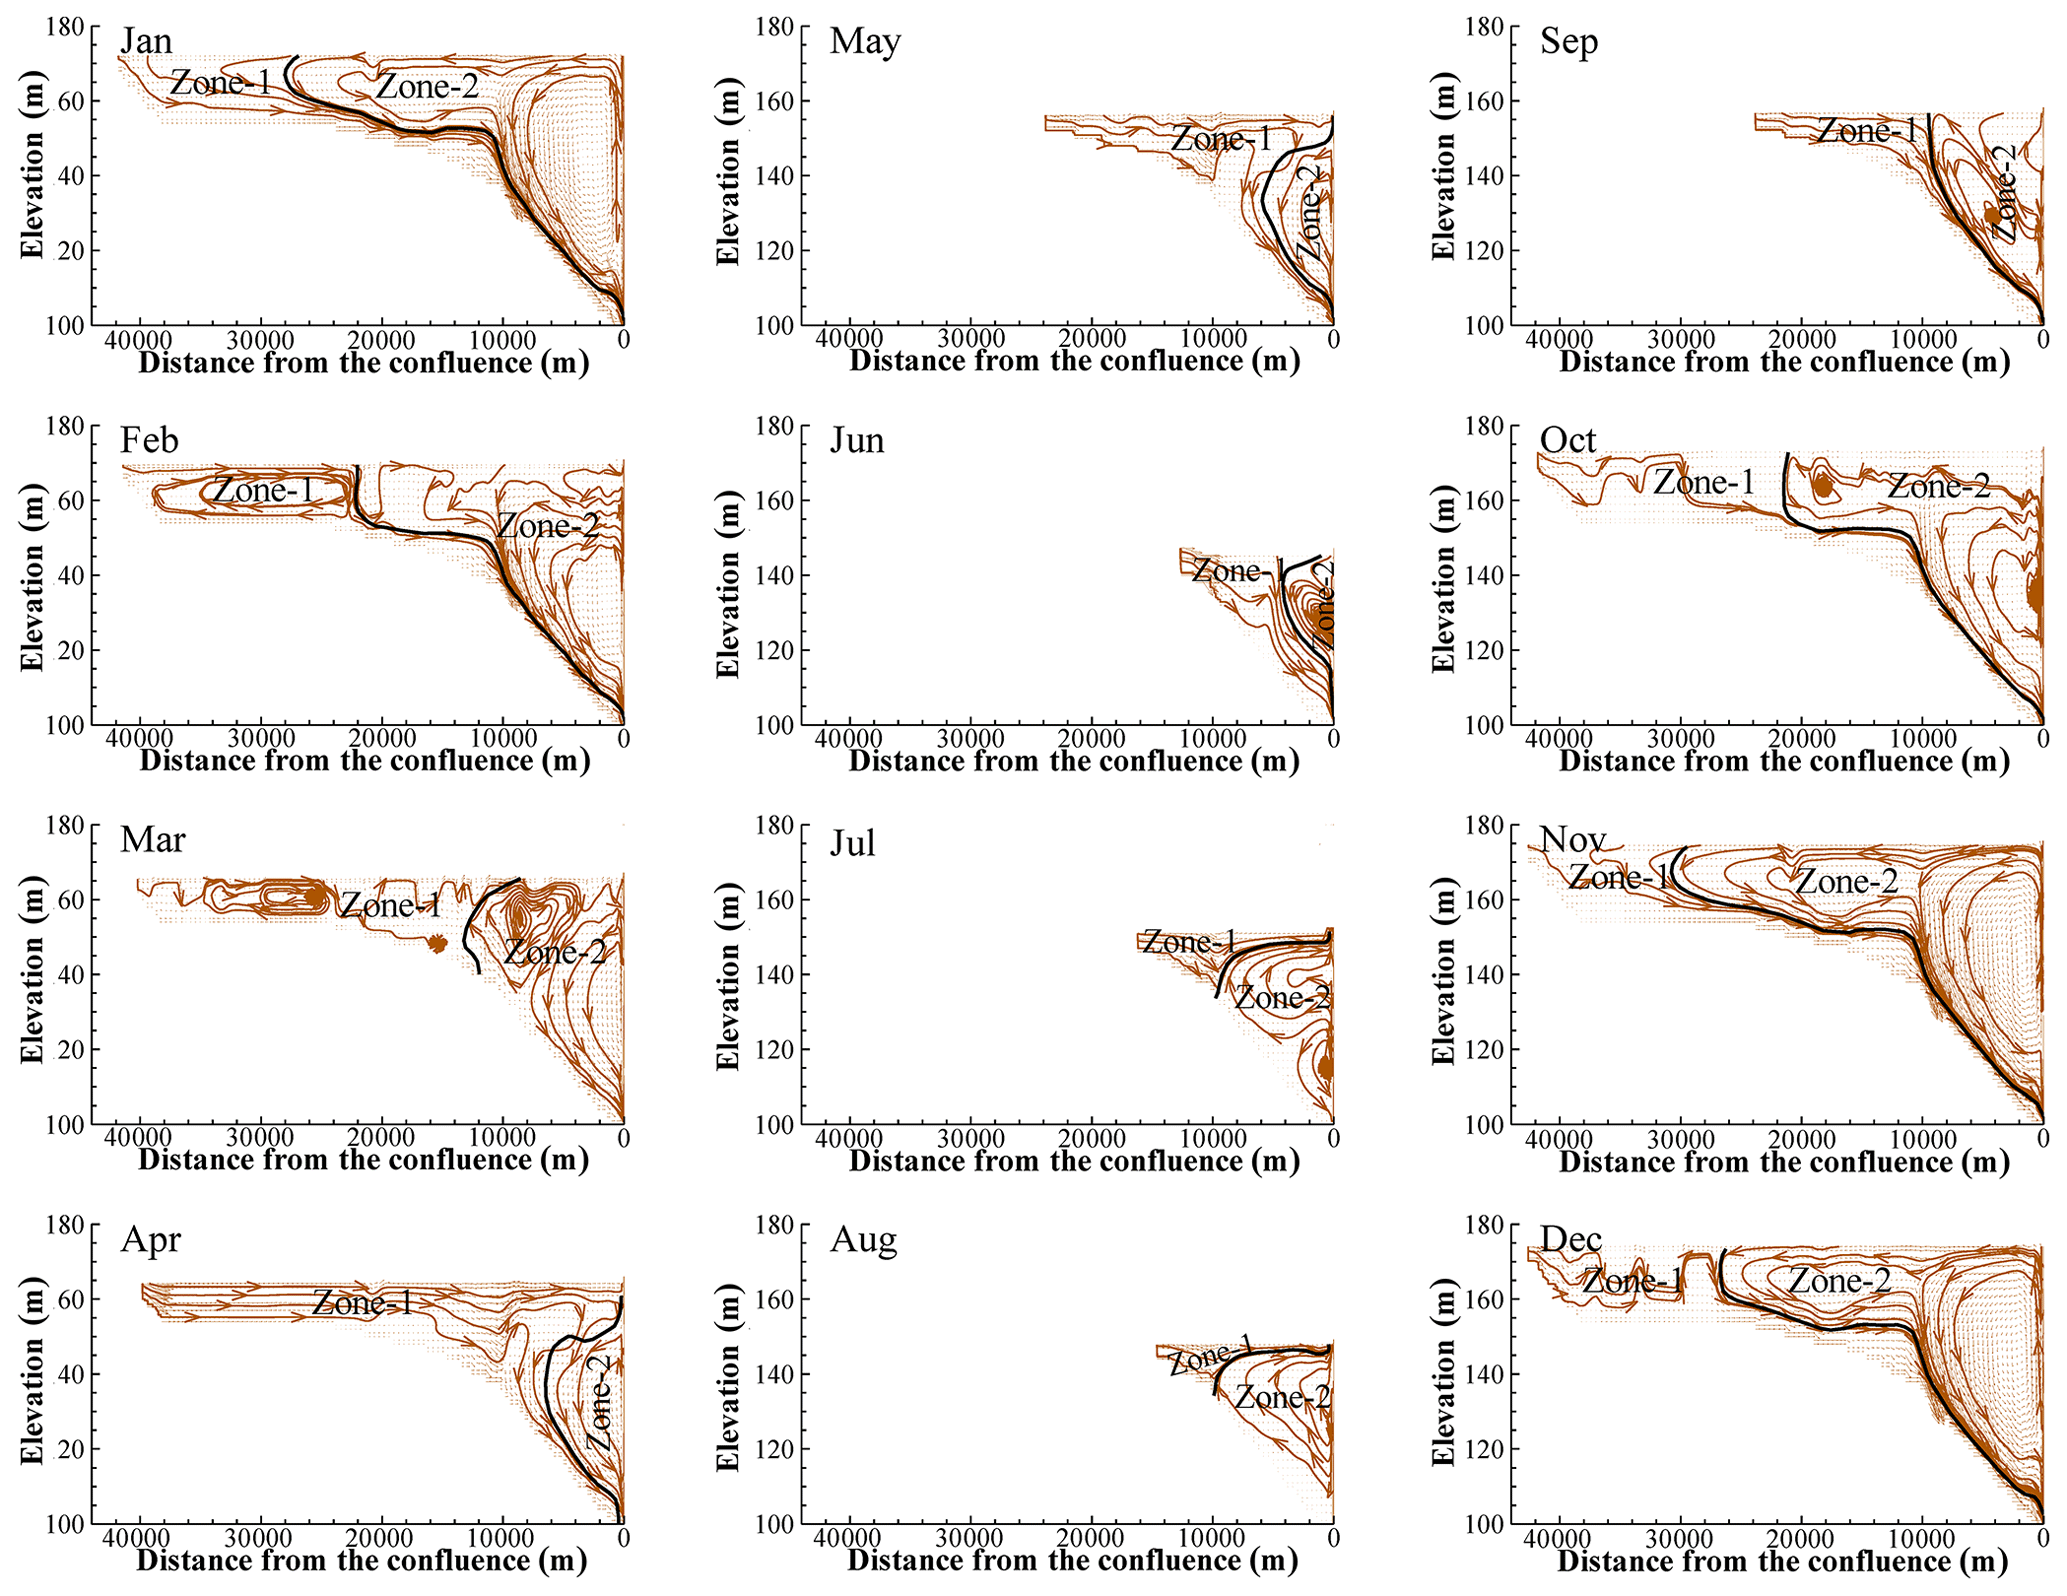
Figure 7Distribution of the flow field in each month. The flow field was divided into two areas (zone 1 and zone 2) according to the flow field characteristics. The black curve in the figure is the boundary between zone 1 and zone 2.
3.2 Hydrodynamics
The distribution of the flow field in each month is shown in Fig. 7. In each month, the upstream water flowed along the surface of the tributary bay or sank to the bottom. The backwater from the main reservoir entered the confluence at different depths simultaneously, forming one or two flow circulations in the tributary bay. A similar flow field distribution occurred in other tributary bays of the TGR (Ji et al., 2017).
In response to the jacking of the main reservoir in January, the water from the tail of the tributary bay first flowed along the surface and then sank to the bottom. Under the influence of geography, the backwater from the main reservoir formed a large counterclockwise circulation in the tributary bay. The water level gradually decreased from February to March, and the backwater effect of the main reservoir also gradually weakened. The water from the tail formed one circulation (February) or two circulations (March) in the tributary bay. From April to June, as the upstream water of the tributary bay joined the surface layer, the circulation zone disappeared. The upstream water gradually sank as it neared the confluence, and at the same time, the backwater from the main reservoir entered the tributary bay in the upper middle layers and formed a small counterclockwise circulation. From July to August, the upstream water of the tributary bay directly flowed to the confluence along the surface layer, and the backwater from the main reservoir entered the tributary bay in the middle and lower layers, forming one circulation in August and two circulations in July. In September, the upstream water first flowed through the surface layer and then sank to the middle of the tributary bay. The backwater from the main reservoir inclined upward from the lower layer and formed two circulations. The upper circulation was a smaller, clockwise circulation, while the lower circulation was a larger, counterclockwise circulation. The water level increased significantly from October to December, and the influence of the backwater increased simultaneously. The upstream water of the tributary bay flowed along the surface layer and then sank to the bottom.
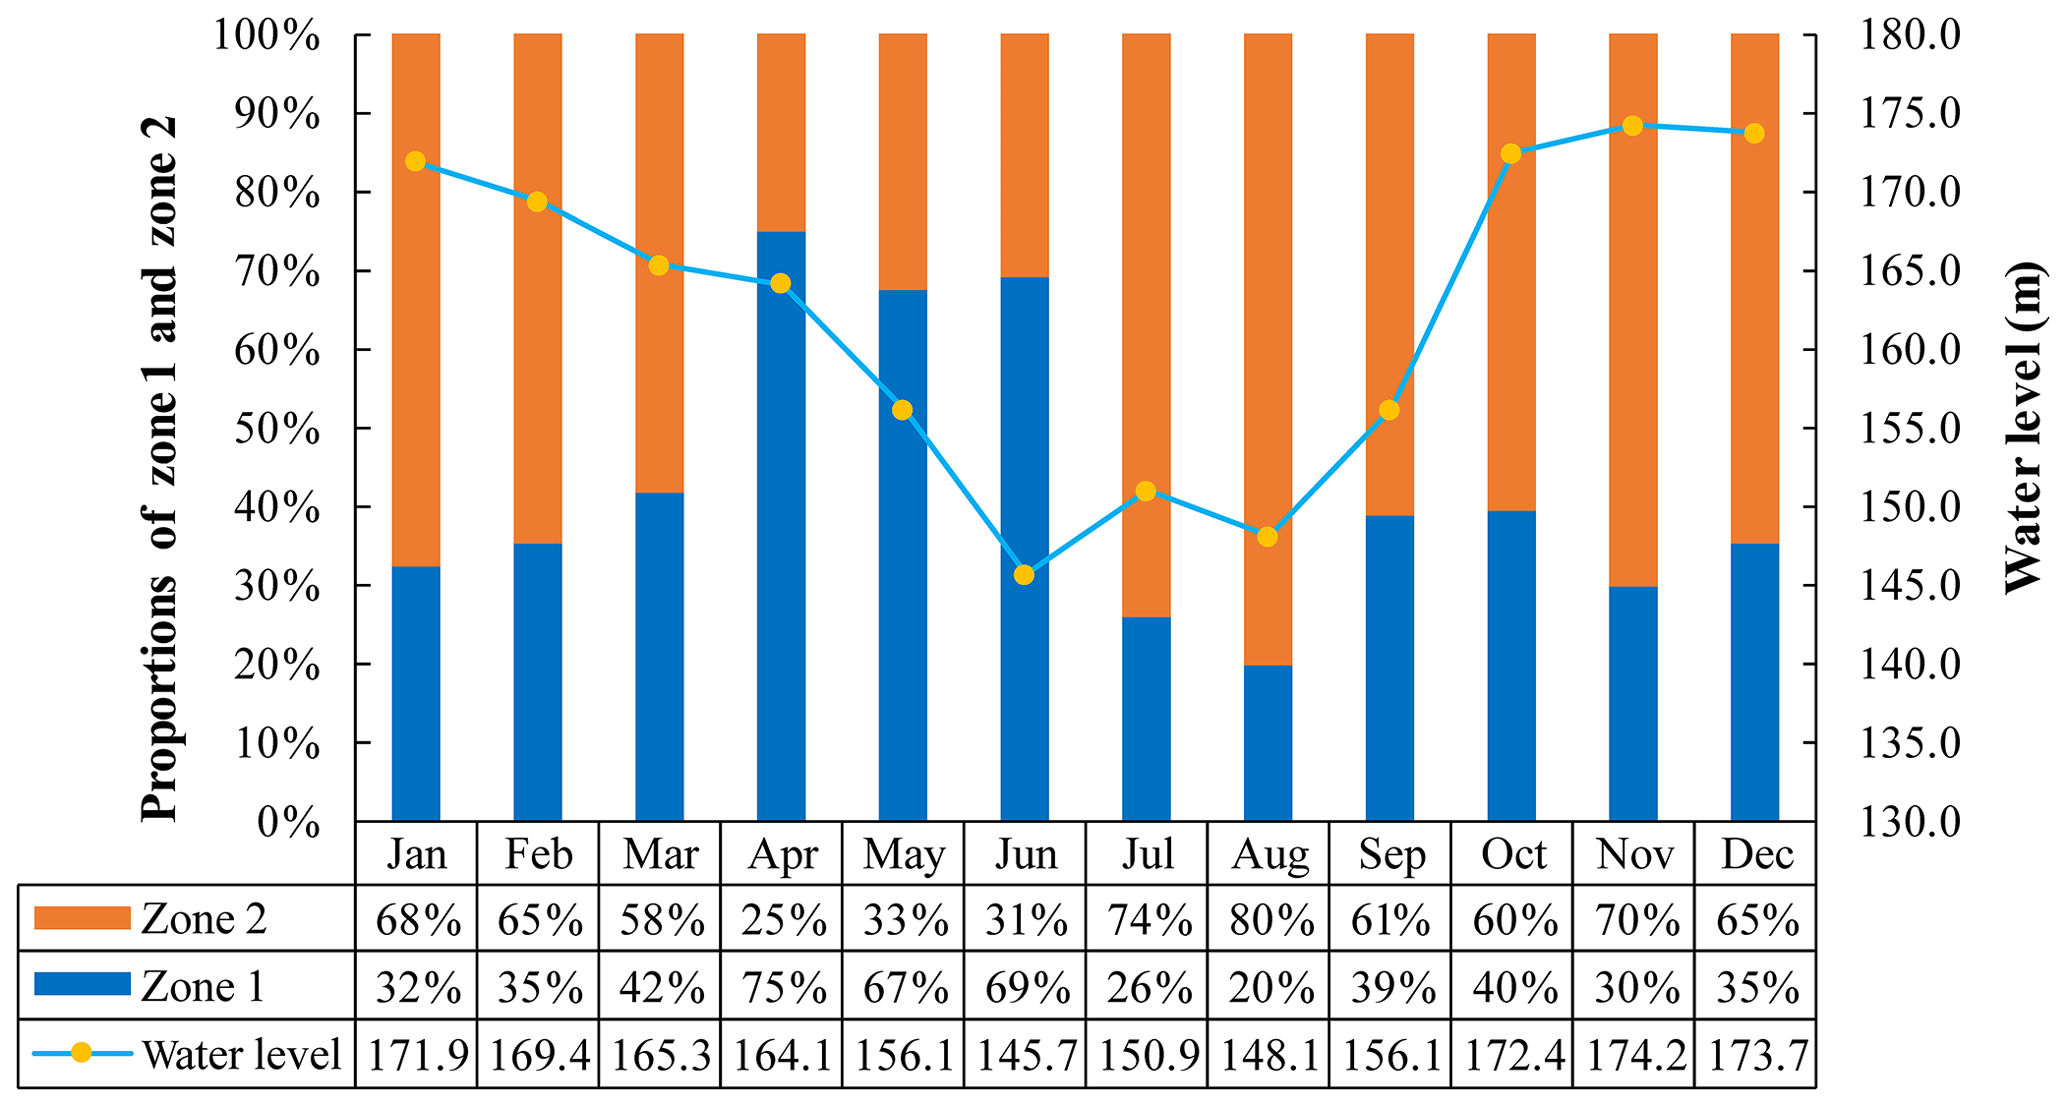
Figure 8Proportions of zone 1 and zone 2 and the variation in water level. The orange bar represents zone 2, and the blue bar represents zone 1. The blue dashed line represents the variation in water level.
According to the distribution of the flow field, the tributary bay was divided into two different areas. Zone 1 represented the area mainly affected by the water from the tail of the tributary bay, and zone 2 was the area mainly affected by the backwater from the main reservoir. Due to the variations in water level and flow value, the ranges of zone 1 and zone 2 differed in each month. The proportions of zone 1 and zone 2 varied with the water level and time (Fig. 8). From January to April, the backwater reach was from the confluence to Jiangkou Town. With the decrease in the water levels, the proportion of zone 1 increased, while the proportion of zone 2 decreased. From May to September, the length of backwater decreased, and it only reached Nanxi Town. With the fluctuation in the water level in these months, the trend of the proportions of zone 1 and zone 2 became irregular. From October to November, with the rise in the water level, the proportion of zone 1 decreased, while the proportion of zone 2 increased. The opposite results were obtained from November to December when the water level gradually decreased. From October to December, the backwater again reached Jiangkou Town. These results suggested that the backwater had a greater impact on the tributary bay when the main reservoir was at a high water level and had a smaller impact when the main reservoir was at a low water level.
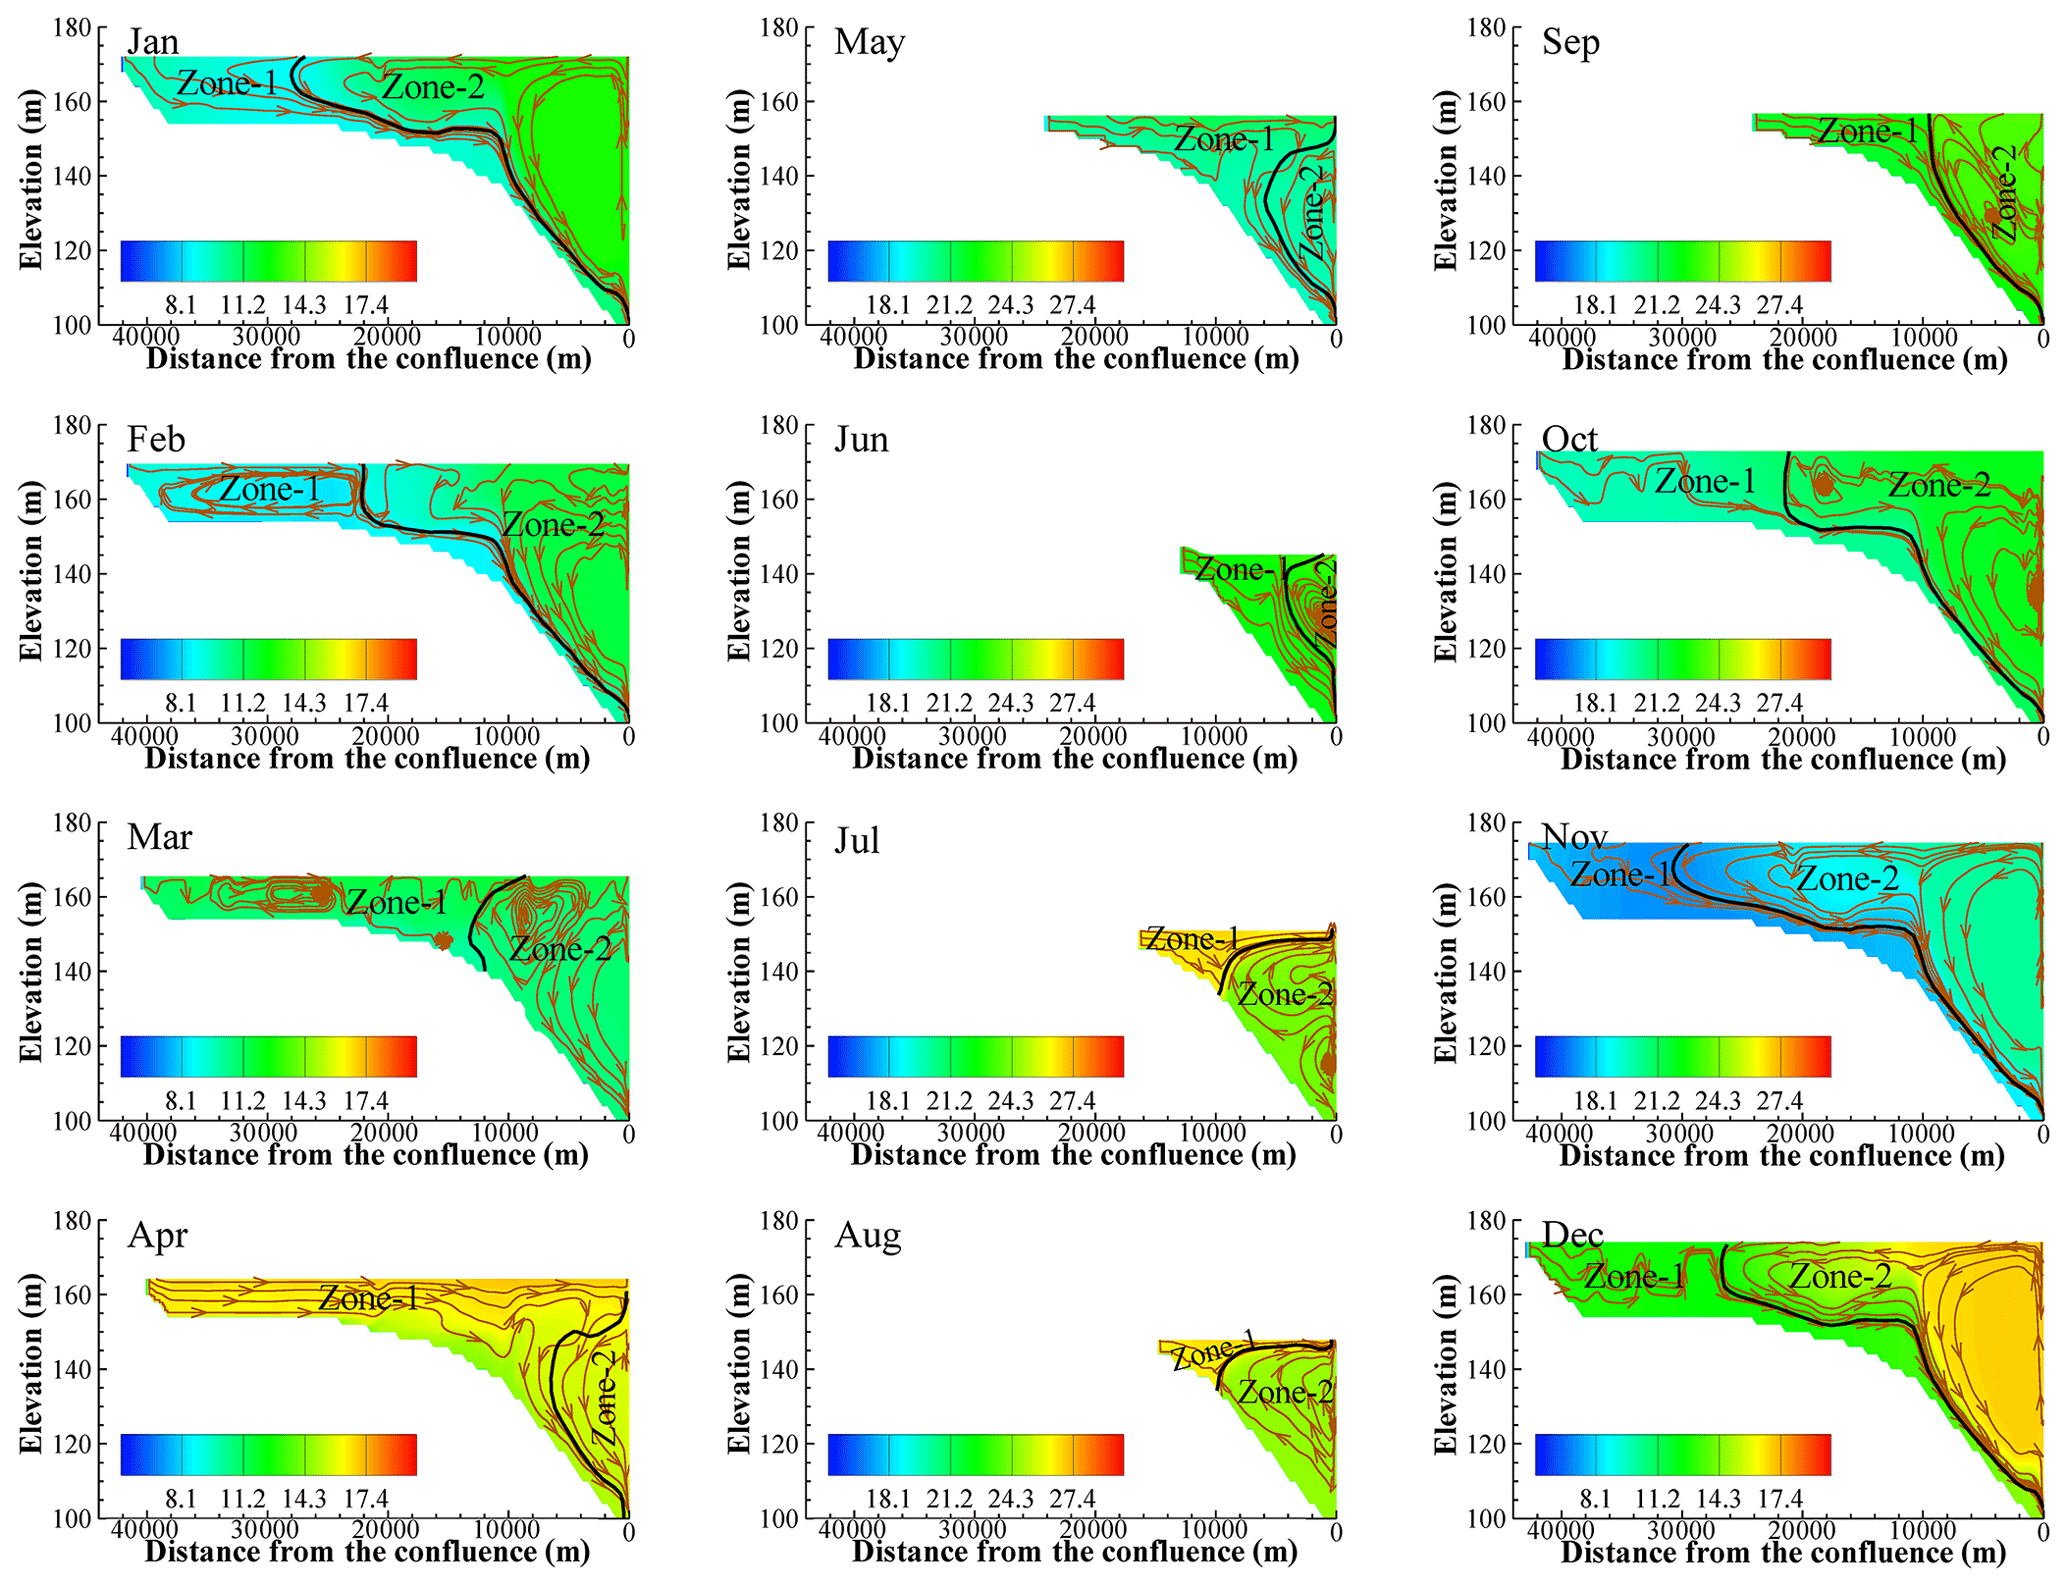
Figure 9Distribution of water temperature in different months. The black curve in the figure is the boundary between zone 1 and zone 2. The brown curves with arrows are streamlines.
3.3 Water temperature
Previous studies showed that the water temperature between the main reservoir and tributary bays were different, which led to the stratification of water temperature in the tributary bays (Ji et al., 2013). The water temperature distribution of the tributary bay in different months is shown in Fig. 9. From January to February, July to August, and October to December, the water temperatures in zone 1 and zone 2 were quite different. There was an obvious temperature boundary, which was mainly affected by the large difference between the upstream water temperature in the tributary bay and the backwater temperature from the main reservoir. From March to June and in September, the water temperature in zone 1 was similar to that of zone 2 due to the small difference between the water temperature at the tail of the tributary bay and the water temperature of the backwater from the main reservoir.
The surface water temperatures of the tributary bay in each month are shown in Fig. 10a. From March to June, due to the small difference between the upstream water temperature of the tributary bay and the backwater temperature of the main reservoir, the surface water temperature changed gently across the bay. The water temperature gradually decreased from the confluence to the tail of the tributary bay from July to August and gradually increased from September to October. The water temperature in the middle reaches was slightly lower than the temperature at the confluence and the tail of the tributary bay from January to February and from November to December.
The vertical water temperature in the confluence is shown in Fig. 10b. Affected by solar radiation and air temperature, the water temperature at the surface was relatively higher than that at the bottom (Zeng et al., 2016; Carey et al., 2012). The temperature in the middle layers changed little. There was a small thermocline in the surface water from May to August, and sinking of cold water occurred in January, February, and September to December.
The average water temperatures of zone 1 and zone 2 in different months are shown in Fig. 10c. The average water temperatures of zone 1 and zone 2 were similar from March to June and in September, while a difference of more than 1.5 ∘C existed in other months. As the water of zone 1 mainly came from upstream of the tributary bay, it was significantly affected by the air temperature (Mohseni and Stefan, 1999). Zone 2 was mainly affected by the backwater from the main reservoir. Therefore, the average water temperature in zone 1 was higher than that in zone 2 in summer, and the average water temperature in zone 1 was lower than that in zone 2 in winter.
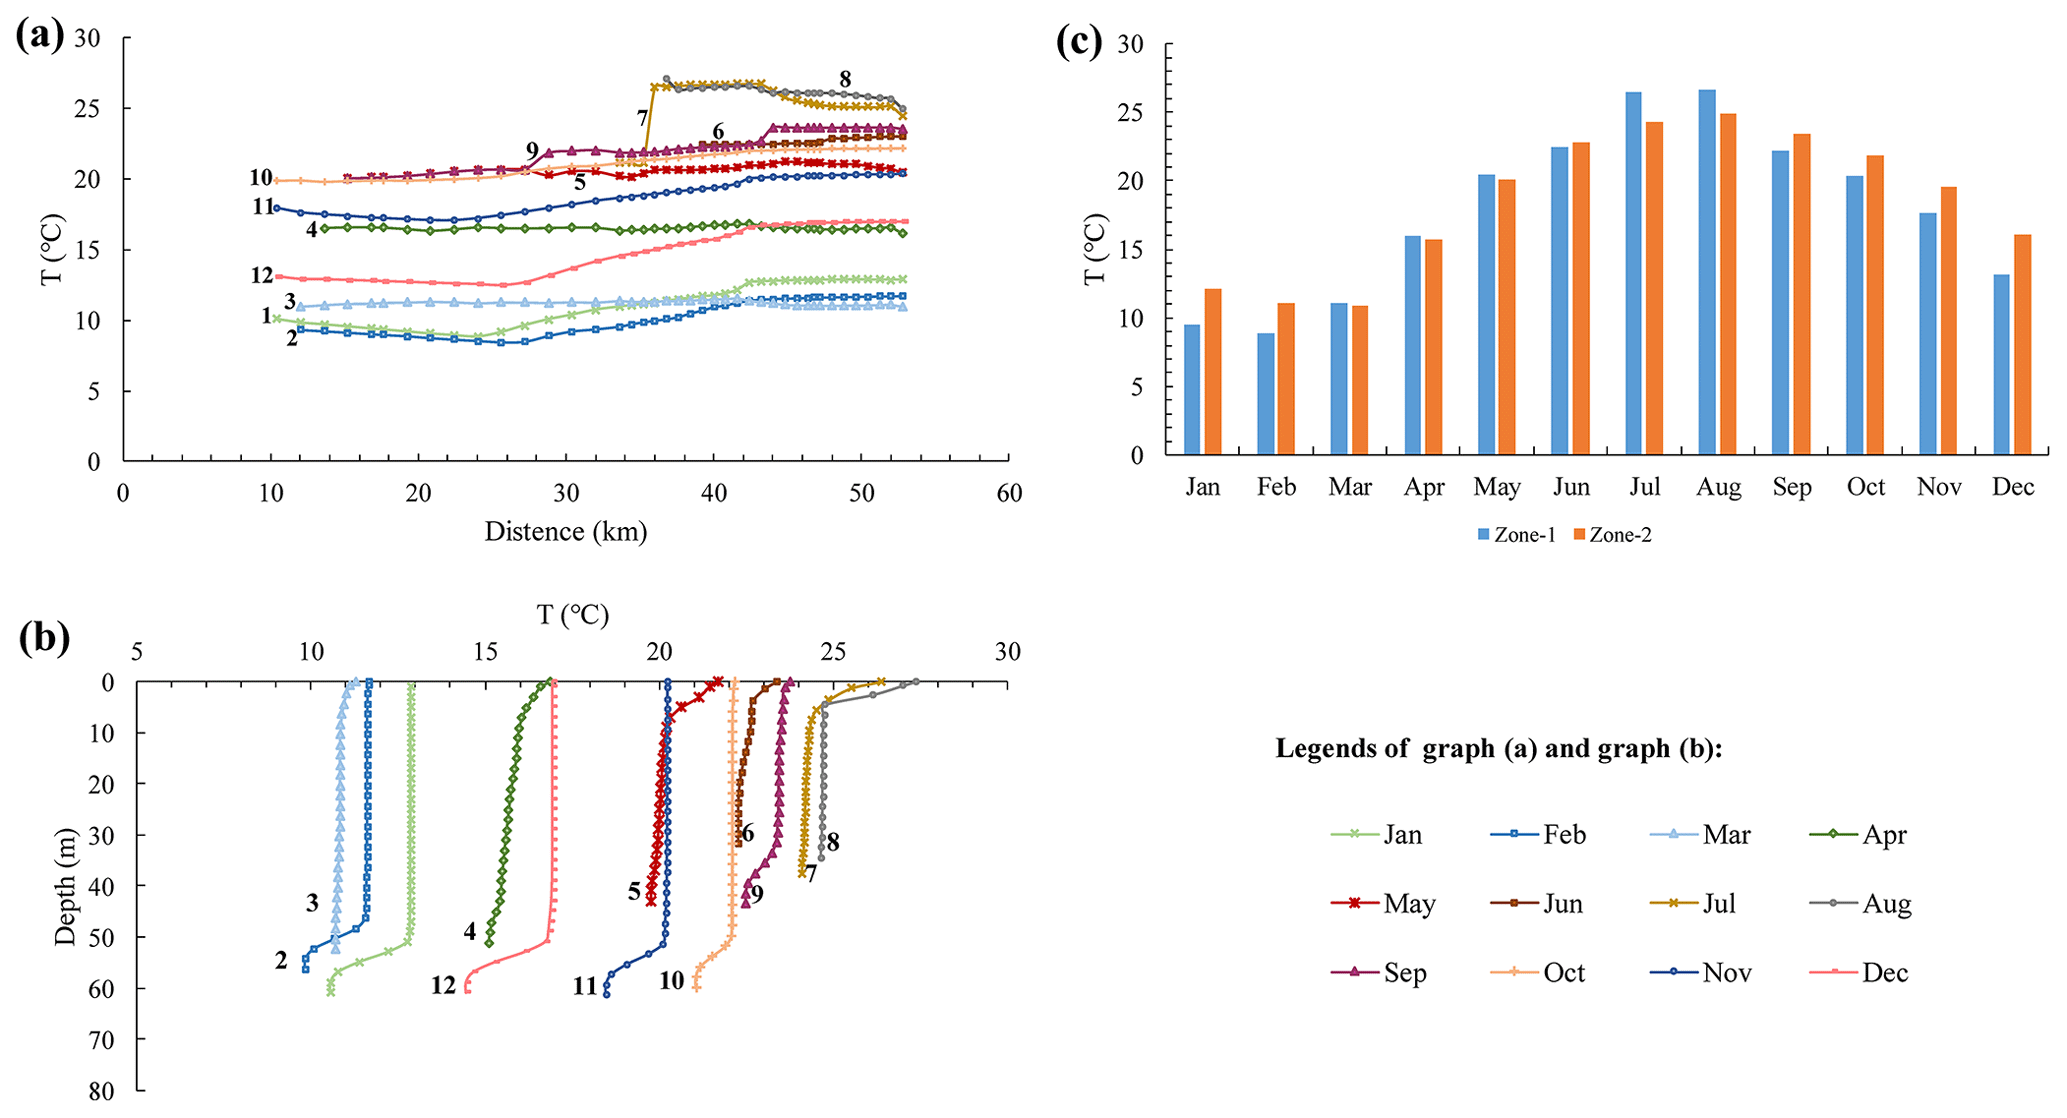
Figure 10Changes in water temperature. (a) Variation in surface water temperature in each month along the tributary bay; (b) variation in the vertical water temperature at the confluence in each month; (c) average water temperatures of zone 1 and zone 2 in each month. The blue bar represents zone 1, and the orange bar represents zone 2 in panel (c).
3.4 Water quality
The water exchange between the main reservoir and tributary bay was an important factor driving the variation of water quality distribution and nutrient structure in the tributary bay (Zhao et al., 2015; Han et al., 2020). As shown in Fig. 11, the COD concentration in the tributary bay ranged from 0 to 13 mg L−1. There was no significant difference in COD concentrations between the tail of the tributary bay and the backwater from the main reservoir, of which both had values between 8 and 11 mg L−1. With a decreasing trend along the bay, the concentration of COD reached a minimum value at the intersection of zone 1 and zone 2.
The NH3-N concentration in the tributary bay was in the range of 0–0.3 mg L−1 (Fig. 12). Since the concentration of NH3-N in the tail of the tributary bay was higher than that of the backwater from the main reservoir, the concentration of NH3-N in zone 1 was higher than that in zone 2 from January to March and July to December. There was no significant difference in NH3-N between the tail of the tributary bay and the backwater from the main reservoir in April to June. Additionally, with a decreasing trend along the bay, the concentration of NH3-N was lower at the intersection of zones 1 and 2 than at the tail of the tributary bay or the confluence.
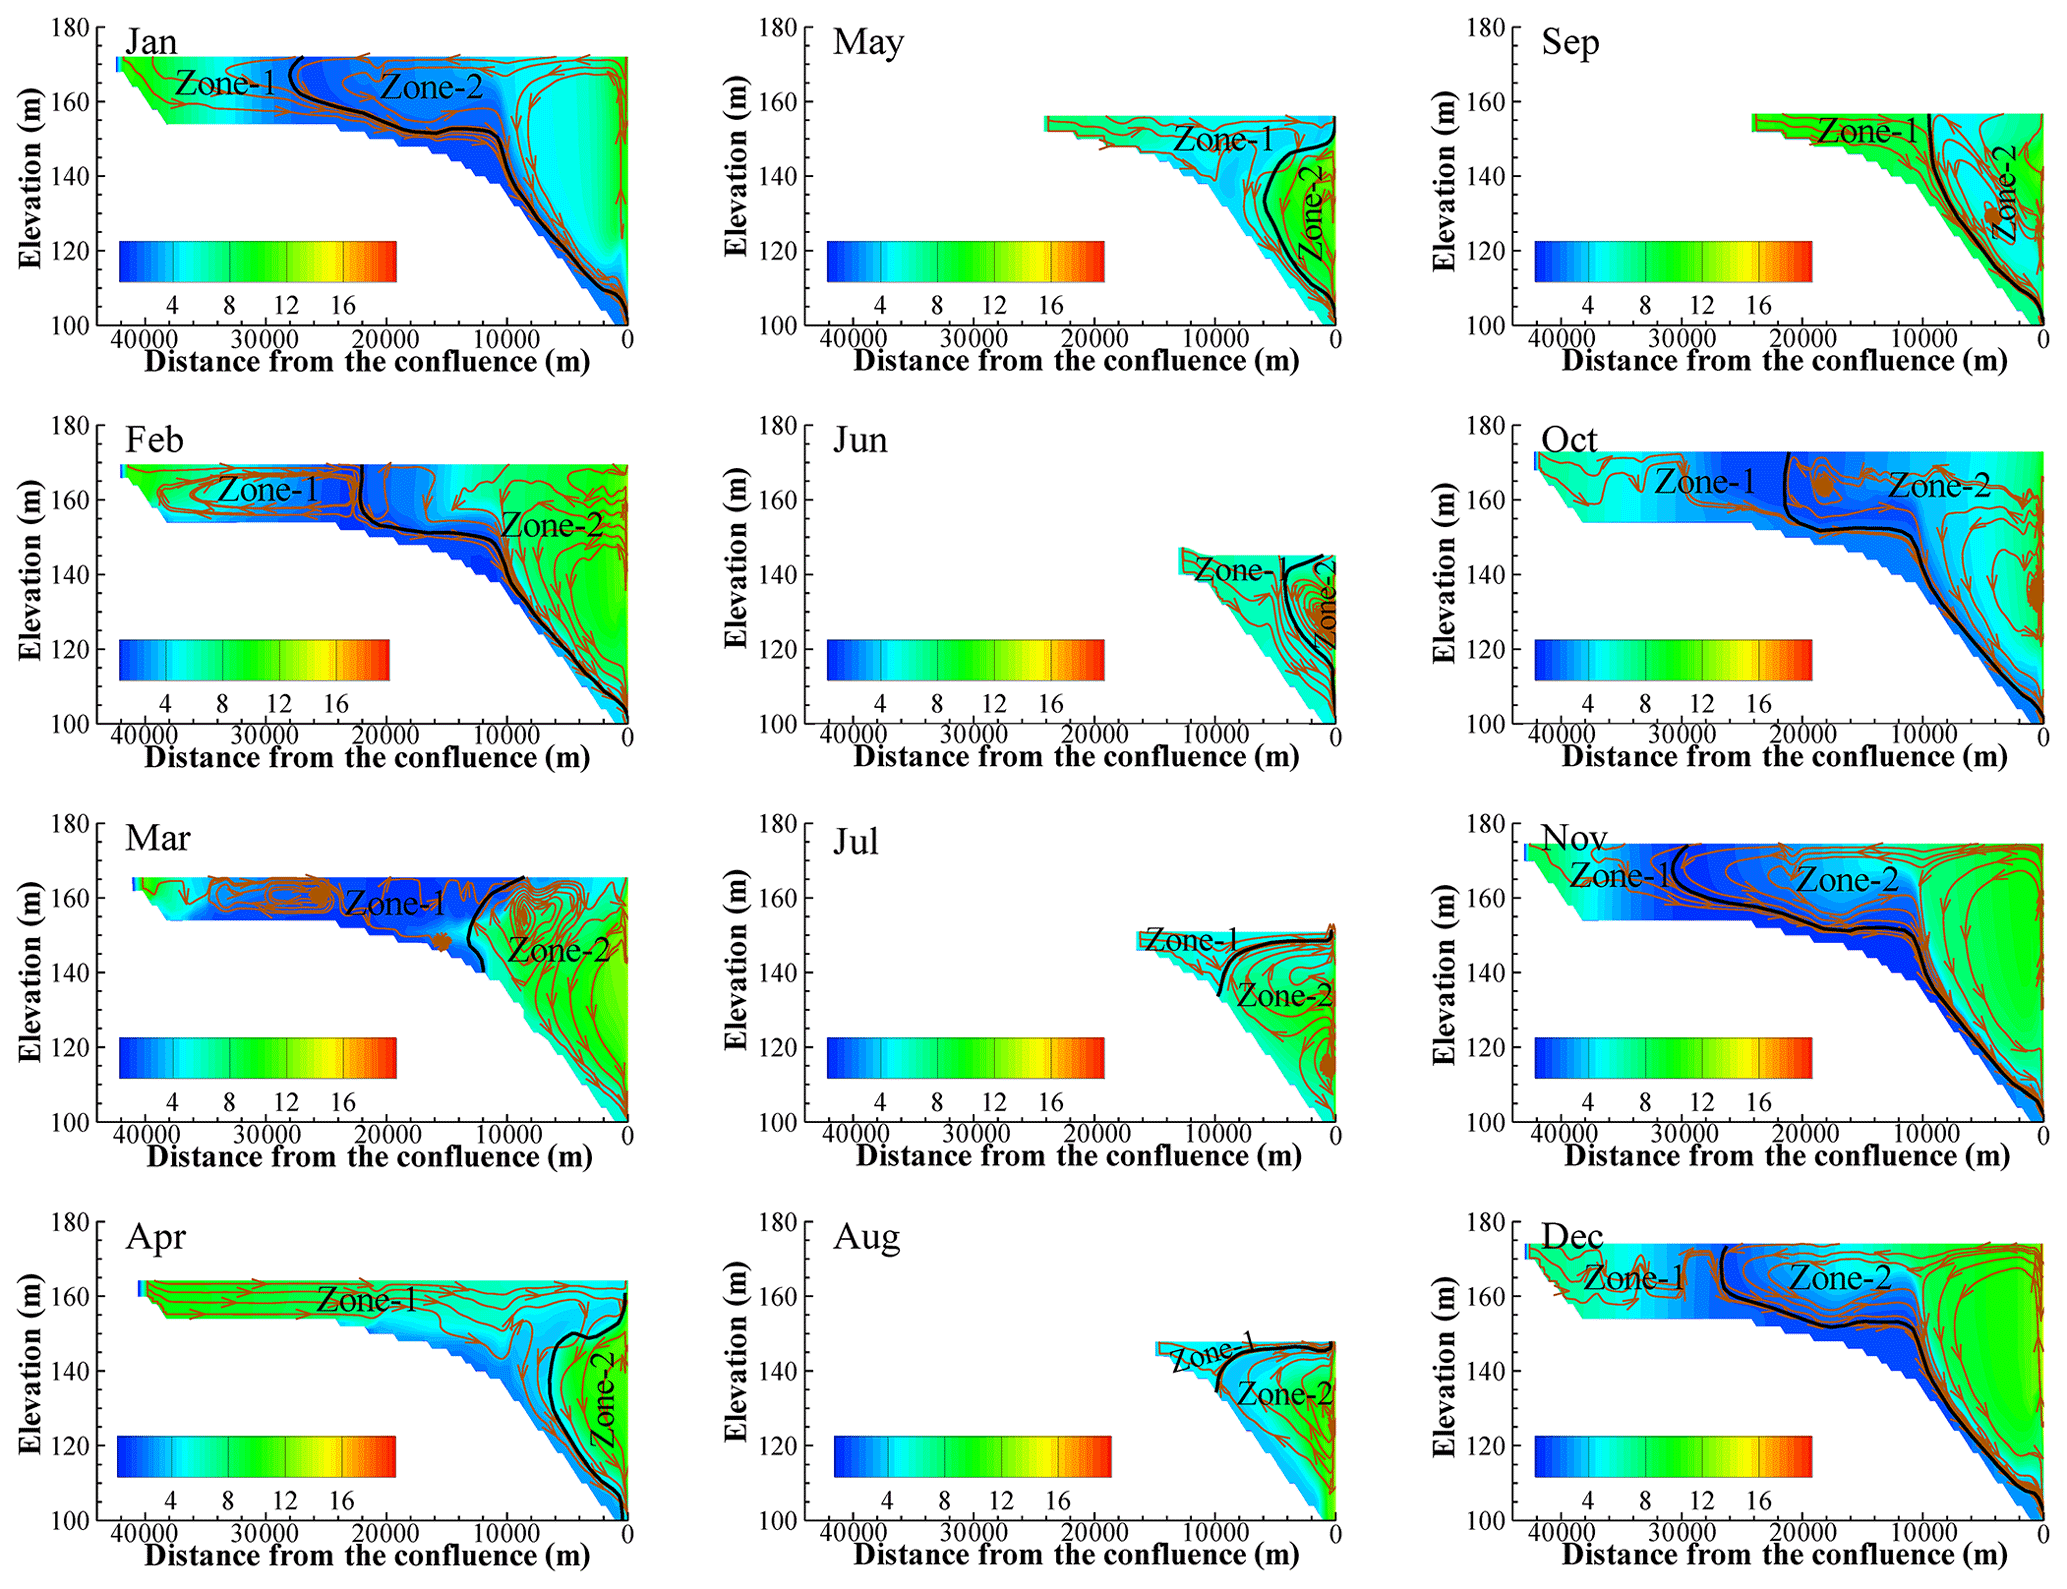
Figure 11Distribution of COD in each month. The black curve in the figure is the boundary between zone 1 and zone 2. The brown curves with arrows are streamlines.
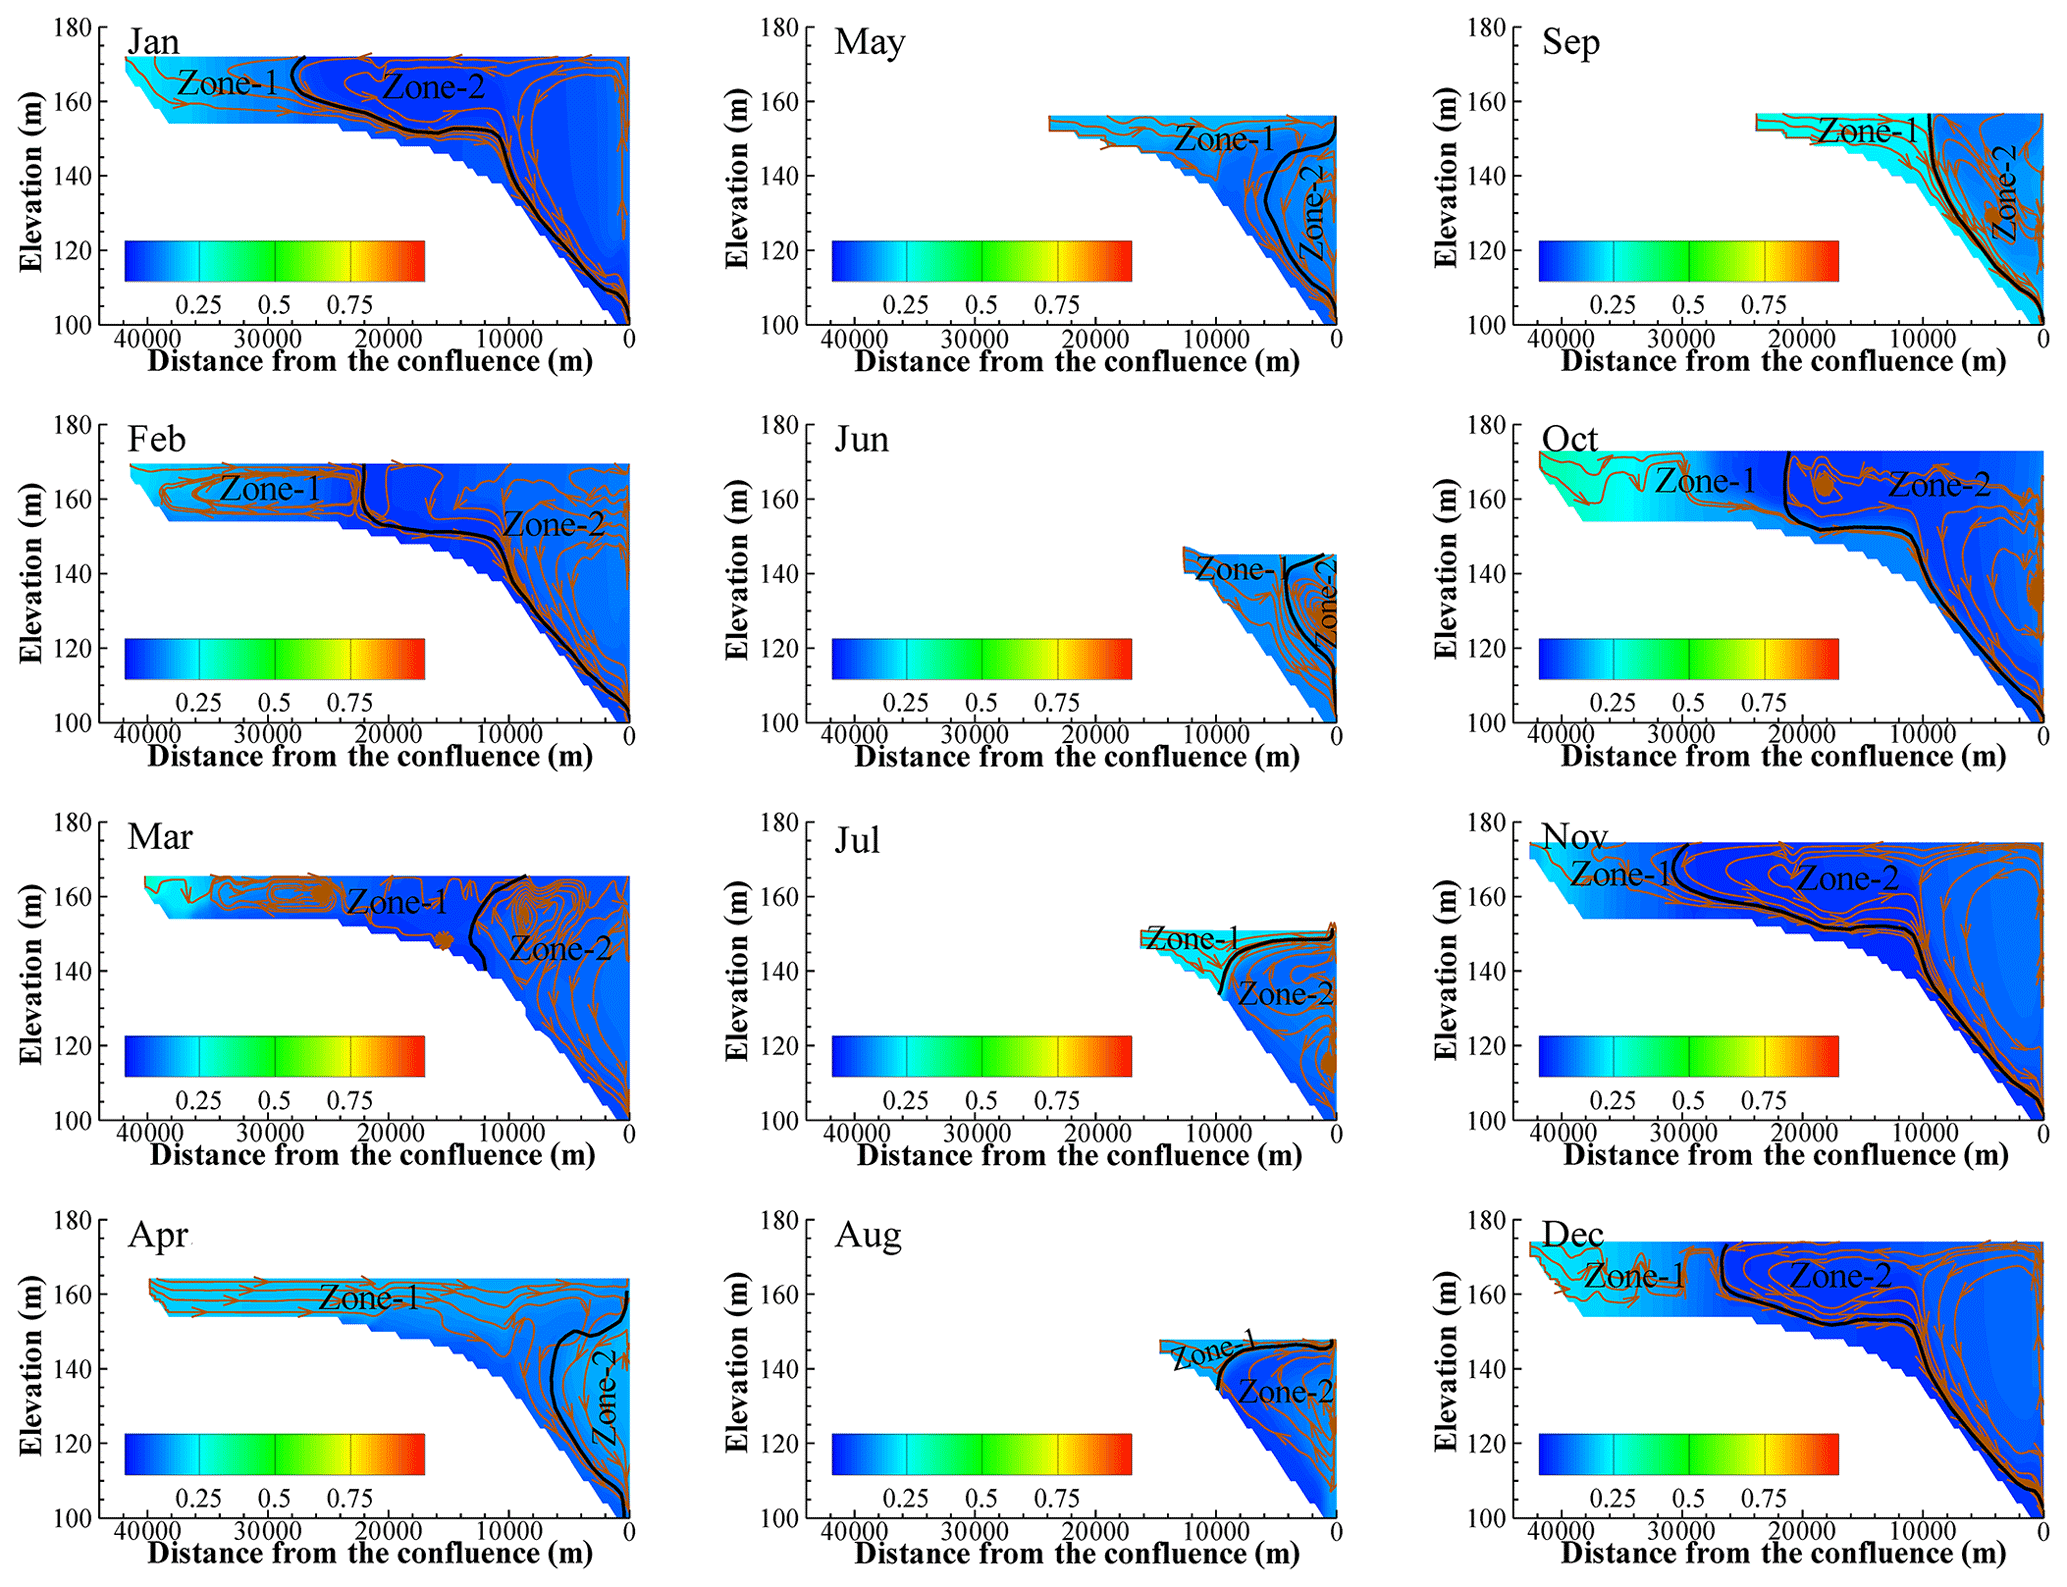
Figure 12Distribution of NH3-N in each month. The black curve in the figure is the boundary between zone 1 and zone 2. The brown curves with arrows are streamlines.
The distributions of TP (Fig. 13) and TN (Fig. 14) proved that the nutrients in tributary bays did not originate solely in the tributary bays but instead were mainly from the main reservoir, and they also showed that the nutrient levels were different across seasons. The distributions of TP and TN in the tributary bay were almost the same. The concentration near the confluence was relatively high. With the mixing of the water from the tail of the tributary bay and the backwater from the main reservoir and with the degradation of water quality, the concentrations of TP and TN gradually decreased. In particular, the concentration of TP was in the range of 0.04–0.12 mg L−1, and the concentration of TN was in the range of 0.8–2.1 mg L−1. The concentrations of TP and TN in zone 2 were higher than those in zone 1. There was an obvious quality concentration boundary in the tributary bay, which was consistent with the regional boundary of the flow field. Furthermore, there was an obvious transition zone near the quality boundary in January to May and September to December, while the transition zone in June to August was very weak.
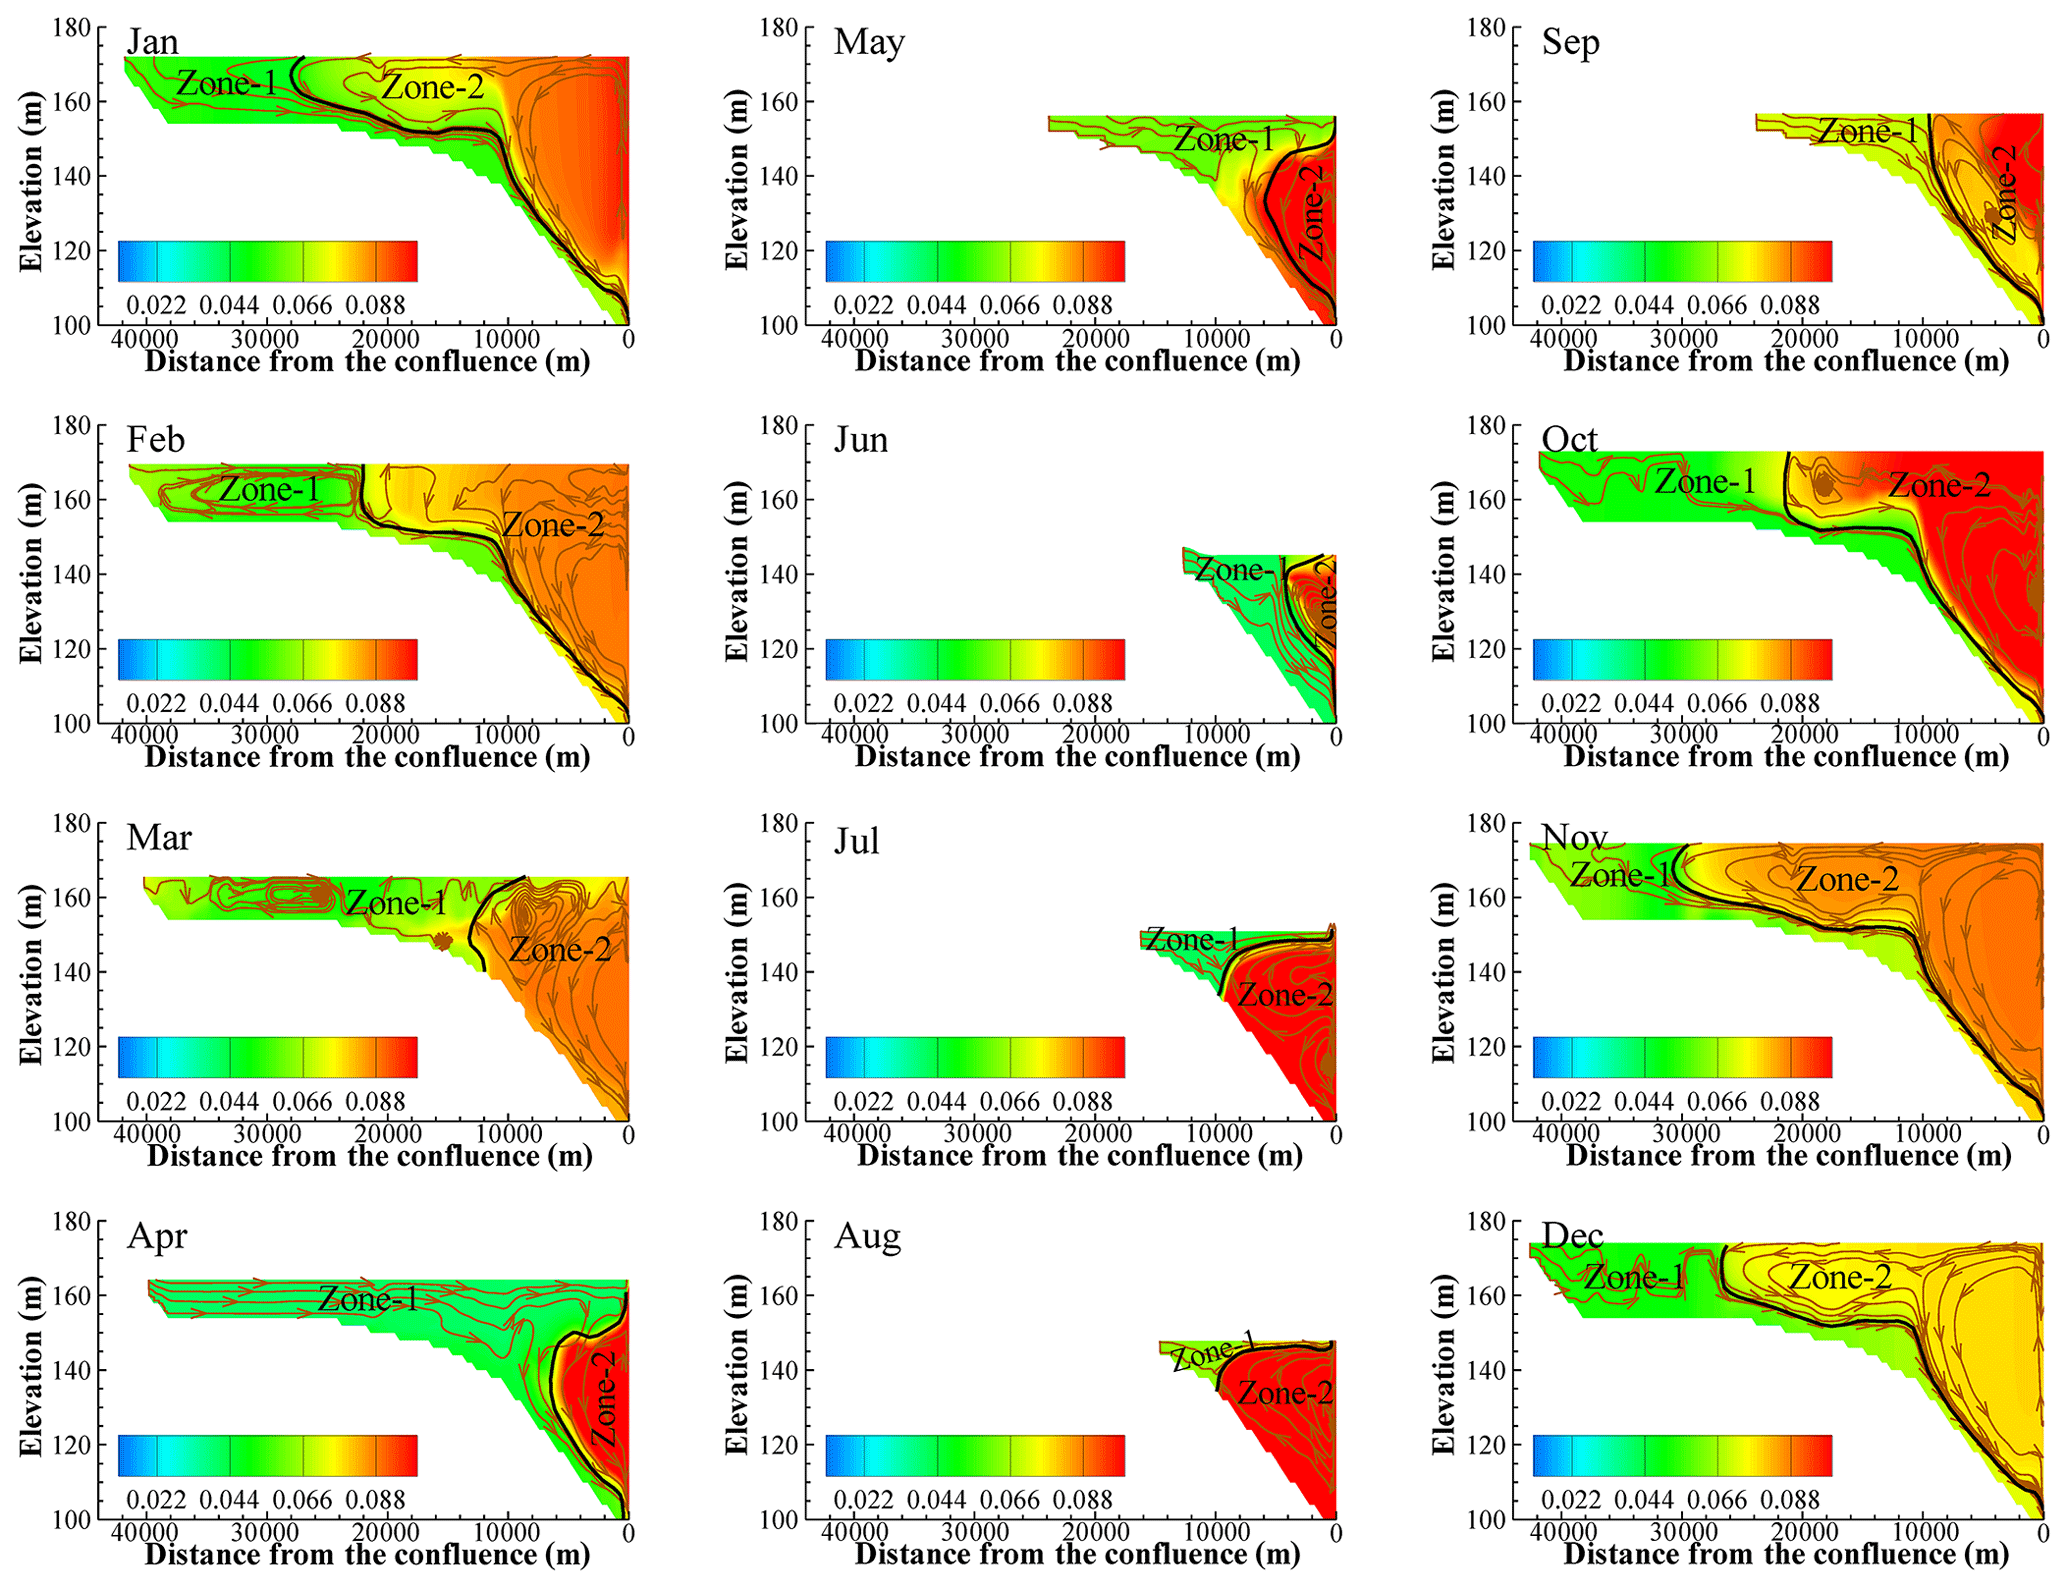
Figure 13Distribution of TP in each month. The black curve in the figure is the boundary between zone 1 and zone 2. The brown curves with arrows are streamlines.
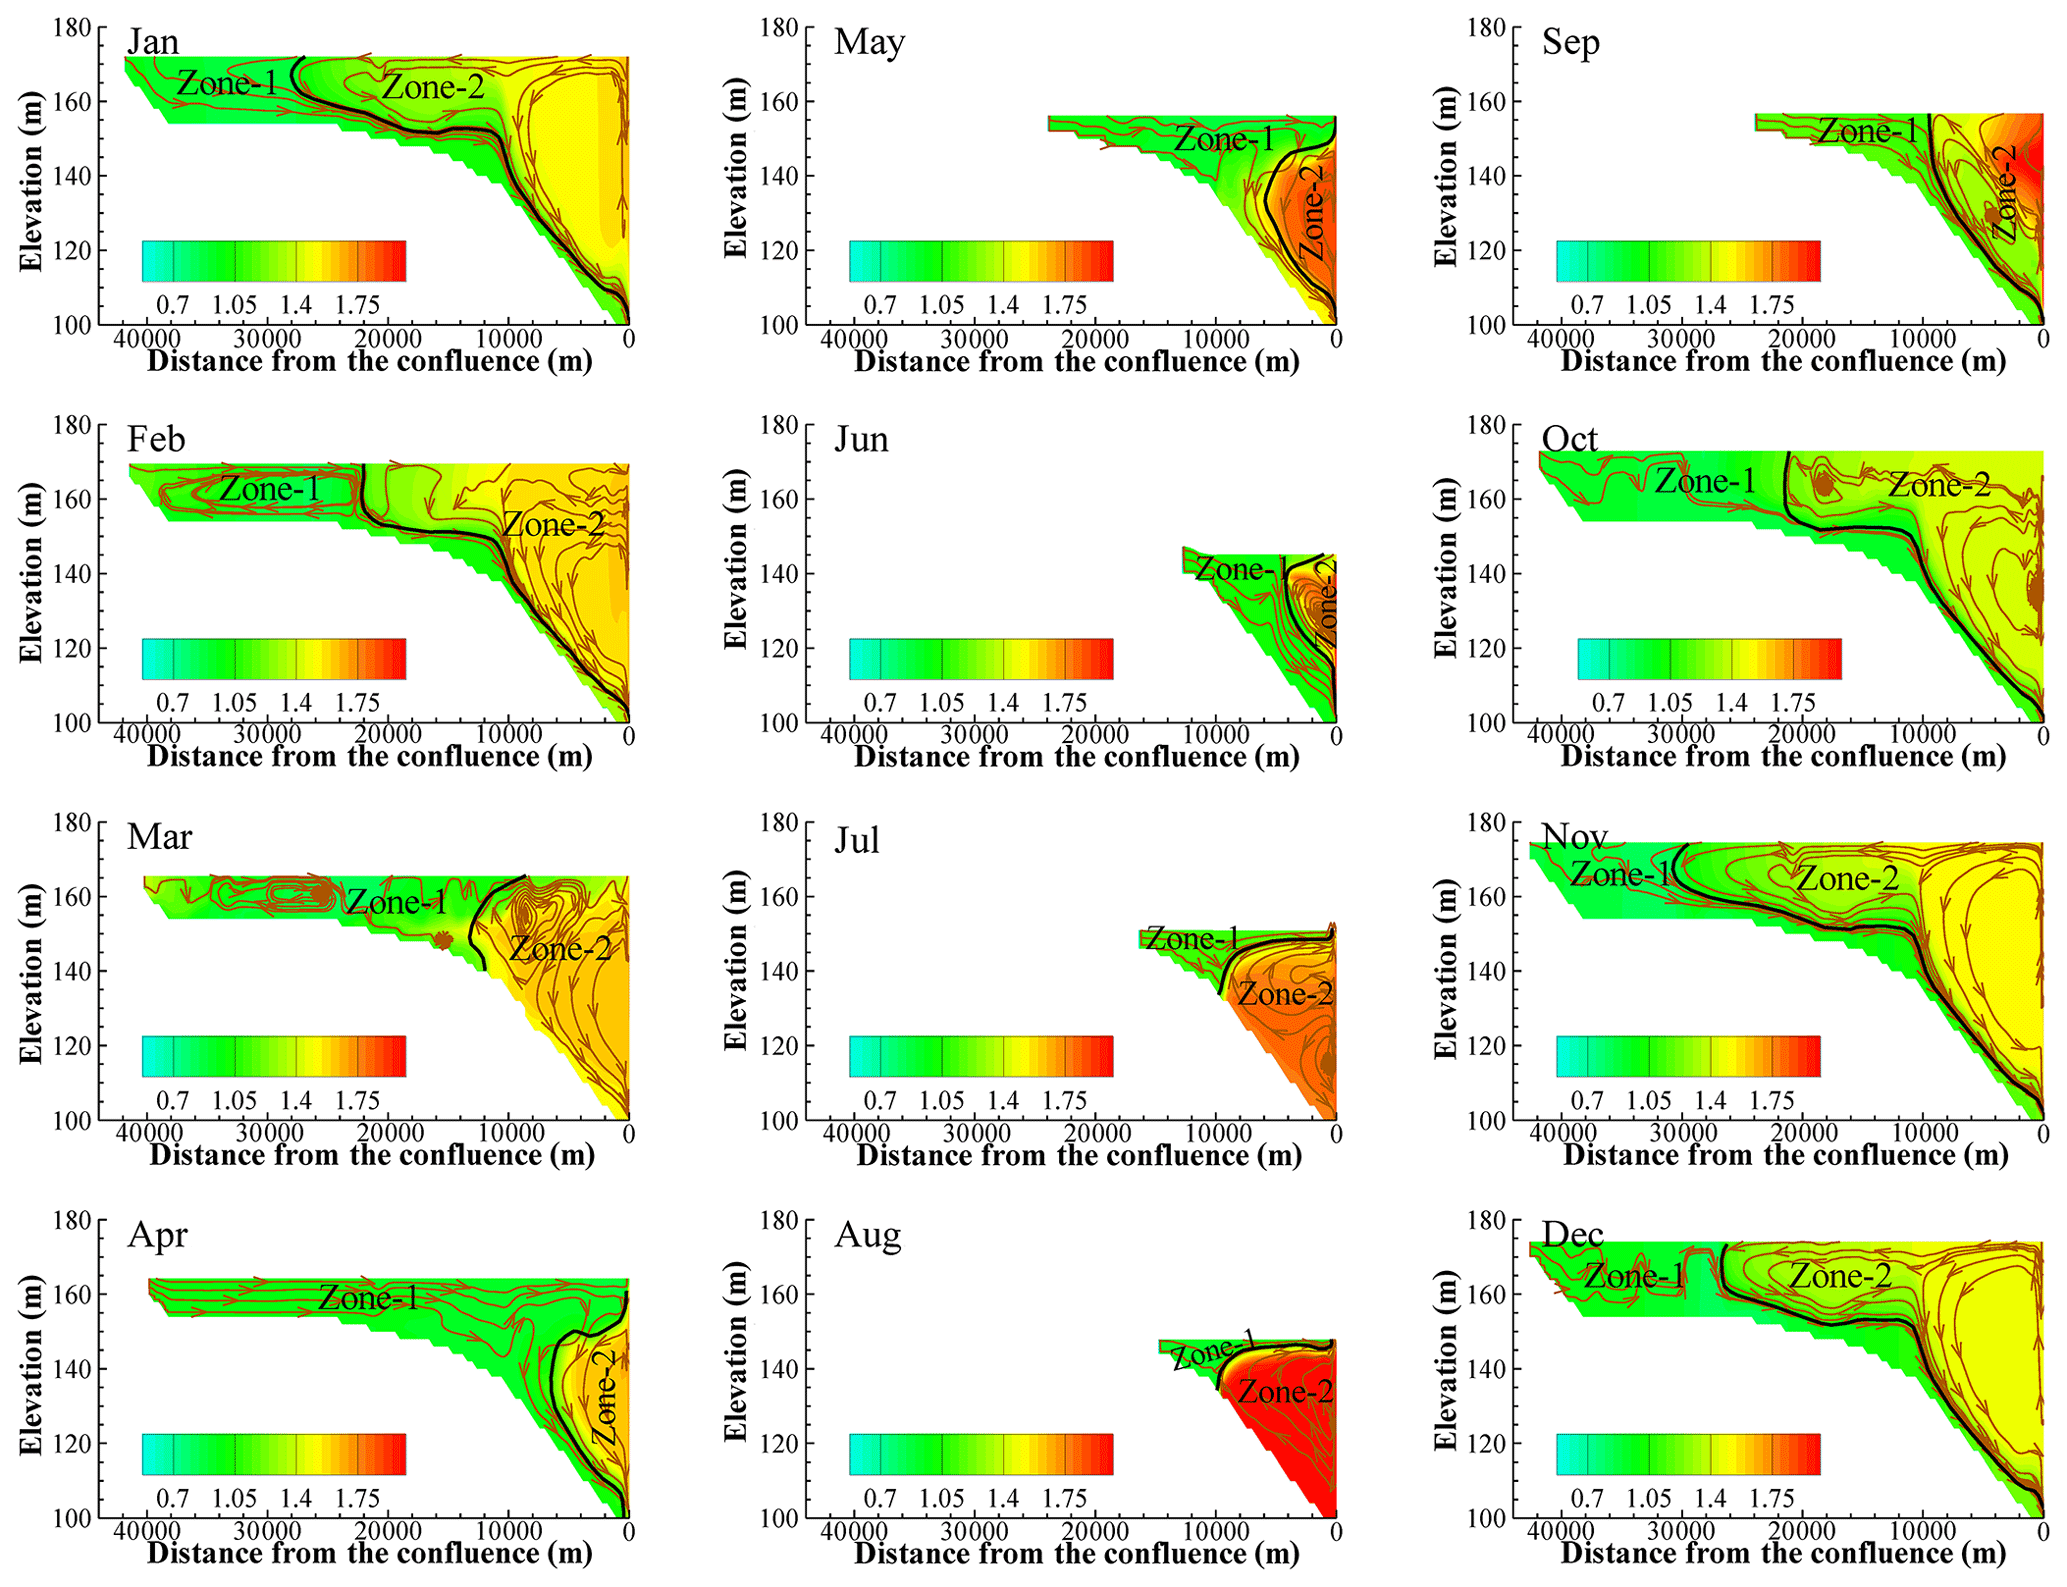
Figure 14Distribution of TN in each month. The black curve in the figure is the boundary between zone 1 and zone 2. The brown curves with arrows are streamlines.
The COD, NH3-N, TP, and TN in the surface water of the tributary bay in different months are shown in Fig. 15. The concentrations of COD and NH3-N were generally higher on the two sides and lower in the middle. The concentrations of TP and TN were higher in the confluence and lower in the tail of the tributary bay.
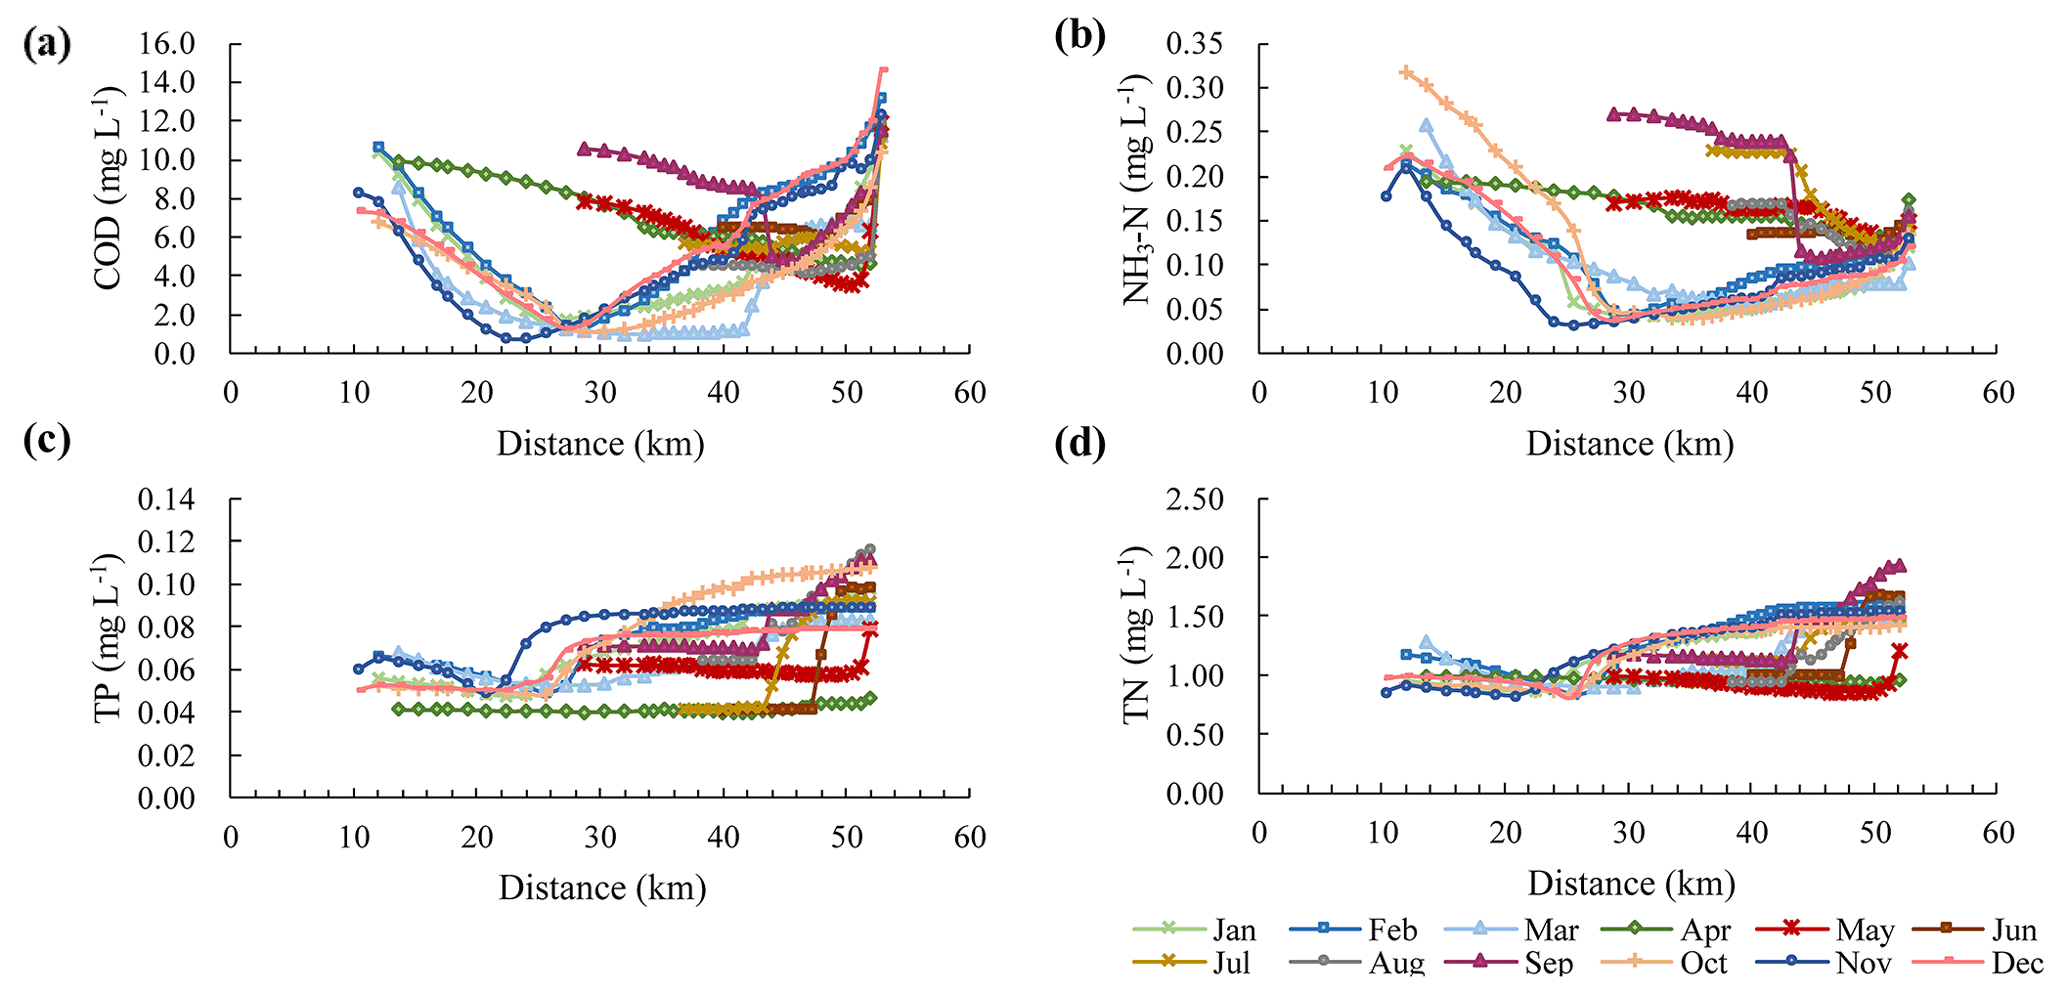
Figure 15Variation in surface water quality in different months along the tributary bay. (a) Variation in chemical oxygen demand; (b) variation in ammonia nitrogen, (c) variation in total phosphorus; and (d) variation in total nitrogen.
The vertical changes in COD, NH3-N, TP, and TN in different months at the confluence are shown in Fig. 16. There was no obvious regularity in the vertical water quality distributions of COD and NH3-N. The average vertical variation in COD was 4.6 mg L−1 over 12 months. The largest change appeared in December, with a value of 7.0 mg L−1, and the smallest change appeared in June, with a value of 1.6 mg L−1. The average vertical variation in NH3-N was 0.06 mg L−1. The largest change appeared in January, with a value of 0.02 mg L−1, and the smallest change appeared in July, with a value of 0.12 mg L−1.
The concentrations of TP and TN were higher in the surface water and lower in the bottom in January to March and September to December, which was contrary to that in July and August. From April to June, the concentrations of TP and TN first increased and then decreased from the surface to the bottom. The concentration gradient in the upper 10 m surface layer was relatively large.
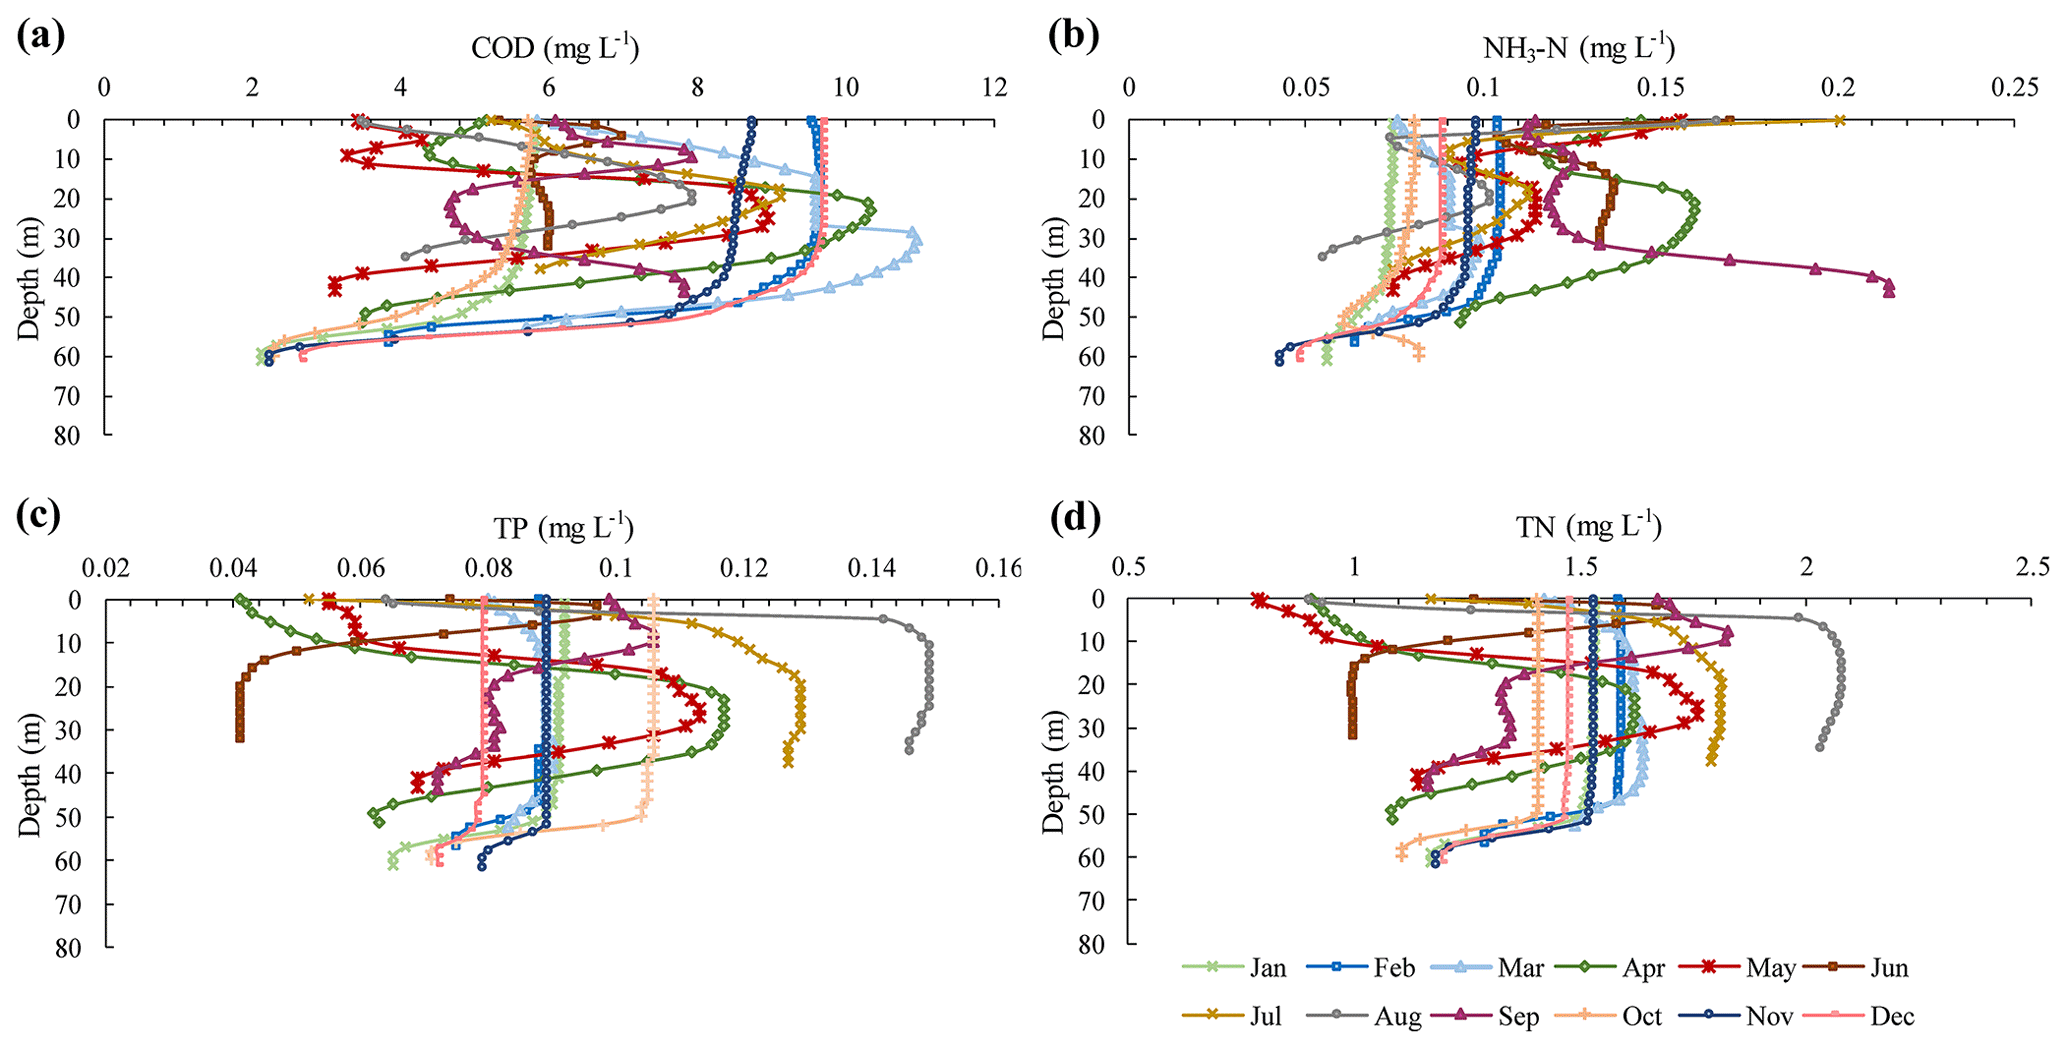
Figure 16Vertical variation in the water quality in different months at the section that was 6 km away from the confluence. (a) Variation in chemical oxygen demand; (b) variation in ammonia nitrogen; (c) variation in total phosphorus; and (d) variation in total nitrogen.
The average concentrations of COD, NH3-N, TP, and TN in zone 1 and zone 2 are shown in Fig. 17. The COD concentration in zone 2 was higher than that in zone 1 in all months except September. The concentration of NH3-N in zone 1 was generally higher than that in zone 2 due to the higher concentration of NH3-N in the water from the tail of the tributary bay. For TP and TN, the concentrations in zone 2 were higher than those in zone 1.
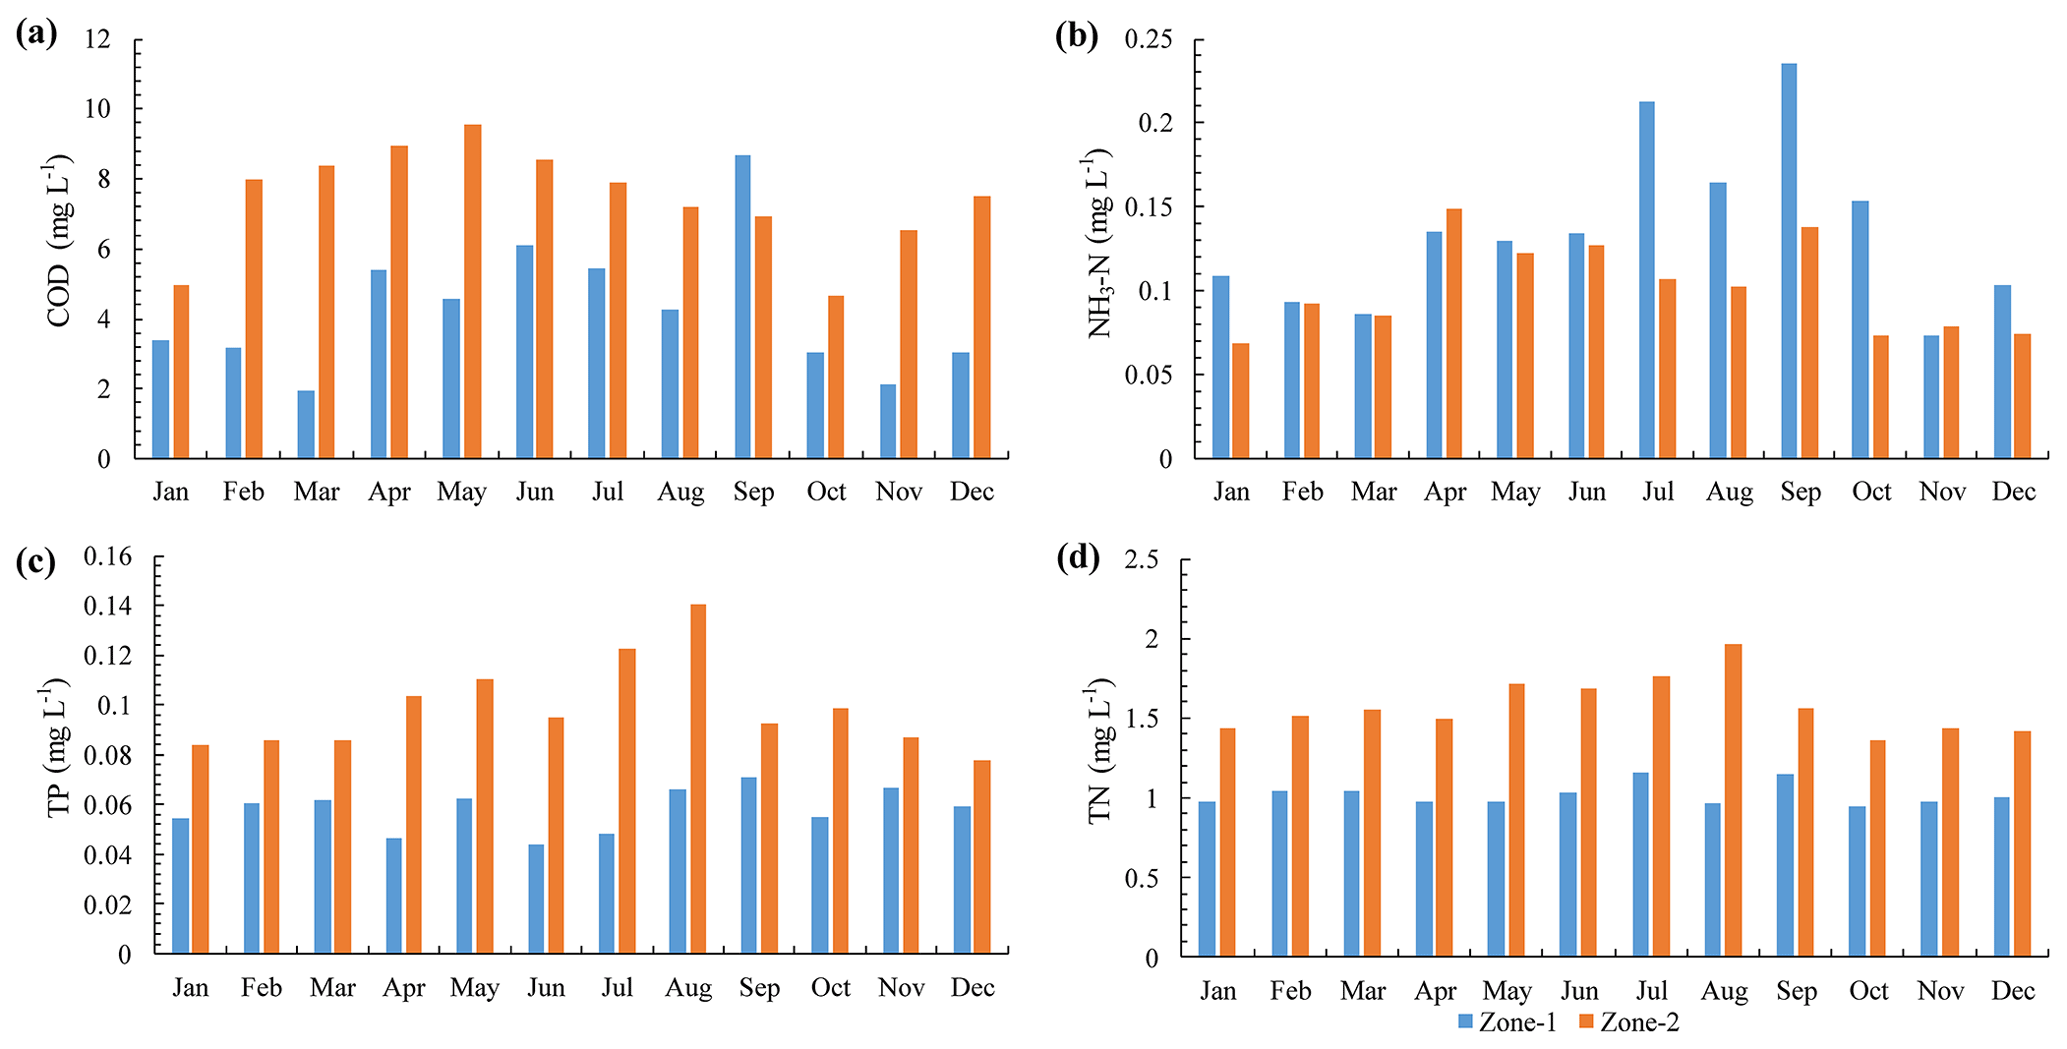
Figure 17Average water quality changes in zone 1 and zone 2. (a) Variation in chemical oxygen demand; (b) variation in ammonia nitrogen; (c) variation in total phosphorus; and (d) variation in total nitrogen. The blue bar represents zone 1, and the orange bar represents zone 2.
3.5 Water eutrophication
The distribution of the TLI (∑) values in the surface water of the tributary bay in different months is shown in Fig. 18. The TLI (∑) within 0.5 km of the confluence was relatively higher than in other areas throughout the year, reaching the level of light eutrophication. Additionally, the reach with high TLI (∑) values in February and in September to December had a long range. From January to March and September to December, the reach approximately 25 km from the confluence had low TLI (∑) values, reaching oligotrophic status. In the rest of the time and area, the TLI (∑) values correspond to a medium nutrient level. Additionally, the water temperature near the confluence was less than 20 ∘C, and the light conditions were poor in January to April and November to December. Temperature and light conditions are important factors in the occurrence of eutrophication, and neither low temperatures nor poor light conditions are conducive to the growth of algae (Singh and Singh, 2015; Romarheim et al., 2015; Paerl et al., 2011; Reynolds, 2006). Physical dynamics play a critical role in estuarine biological production, material transport, and water quality (Kasai et al., 2010). The results of this study showed that the tributary bay was mainly affected by backwater intrusions from the main reservoir in July and from August to October. During this time, the vertical mixing of water near the confluence was severe, which was also not conducive to the growth of algae (Gao et al., 2017; Lindim et al., 2011; Huisman et al., 2006). In conclusion, considering the influence of hydrodynamics, water temperature, and water quality, the risk of eutrophication in the tributary bay was highest in the section within 0.5 km of the confluence from May to June. Wu et al. (2013) constantly monitored the eutrophication of the Daning River, a tributary bay of the TGR, and found that algal blooms frequently occurred in the area close to the confluence from March to June, which was similar to the results of the present study.
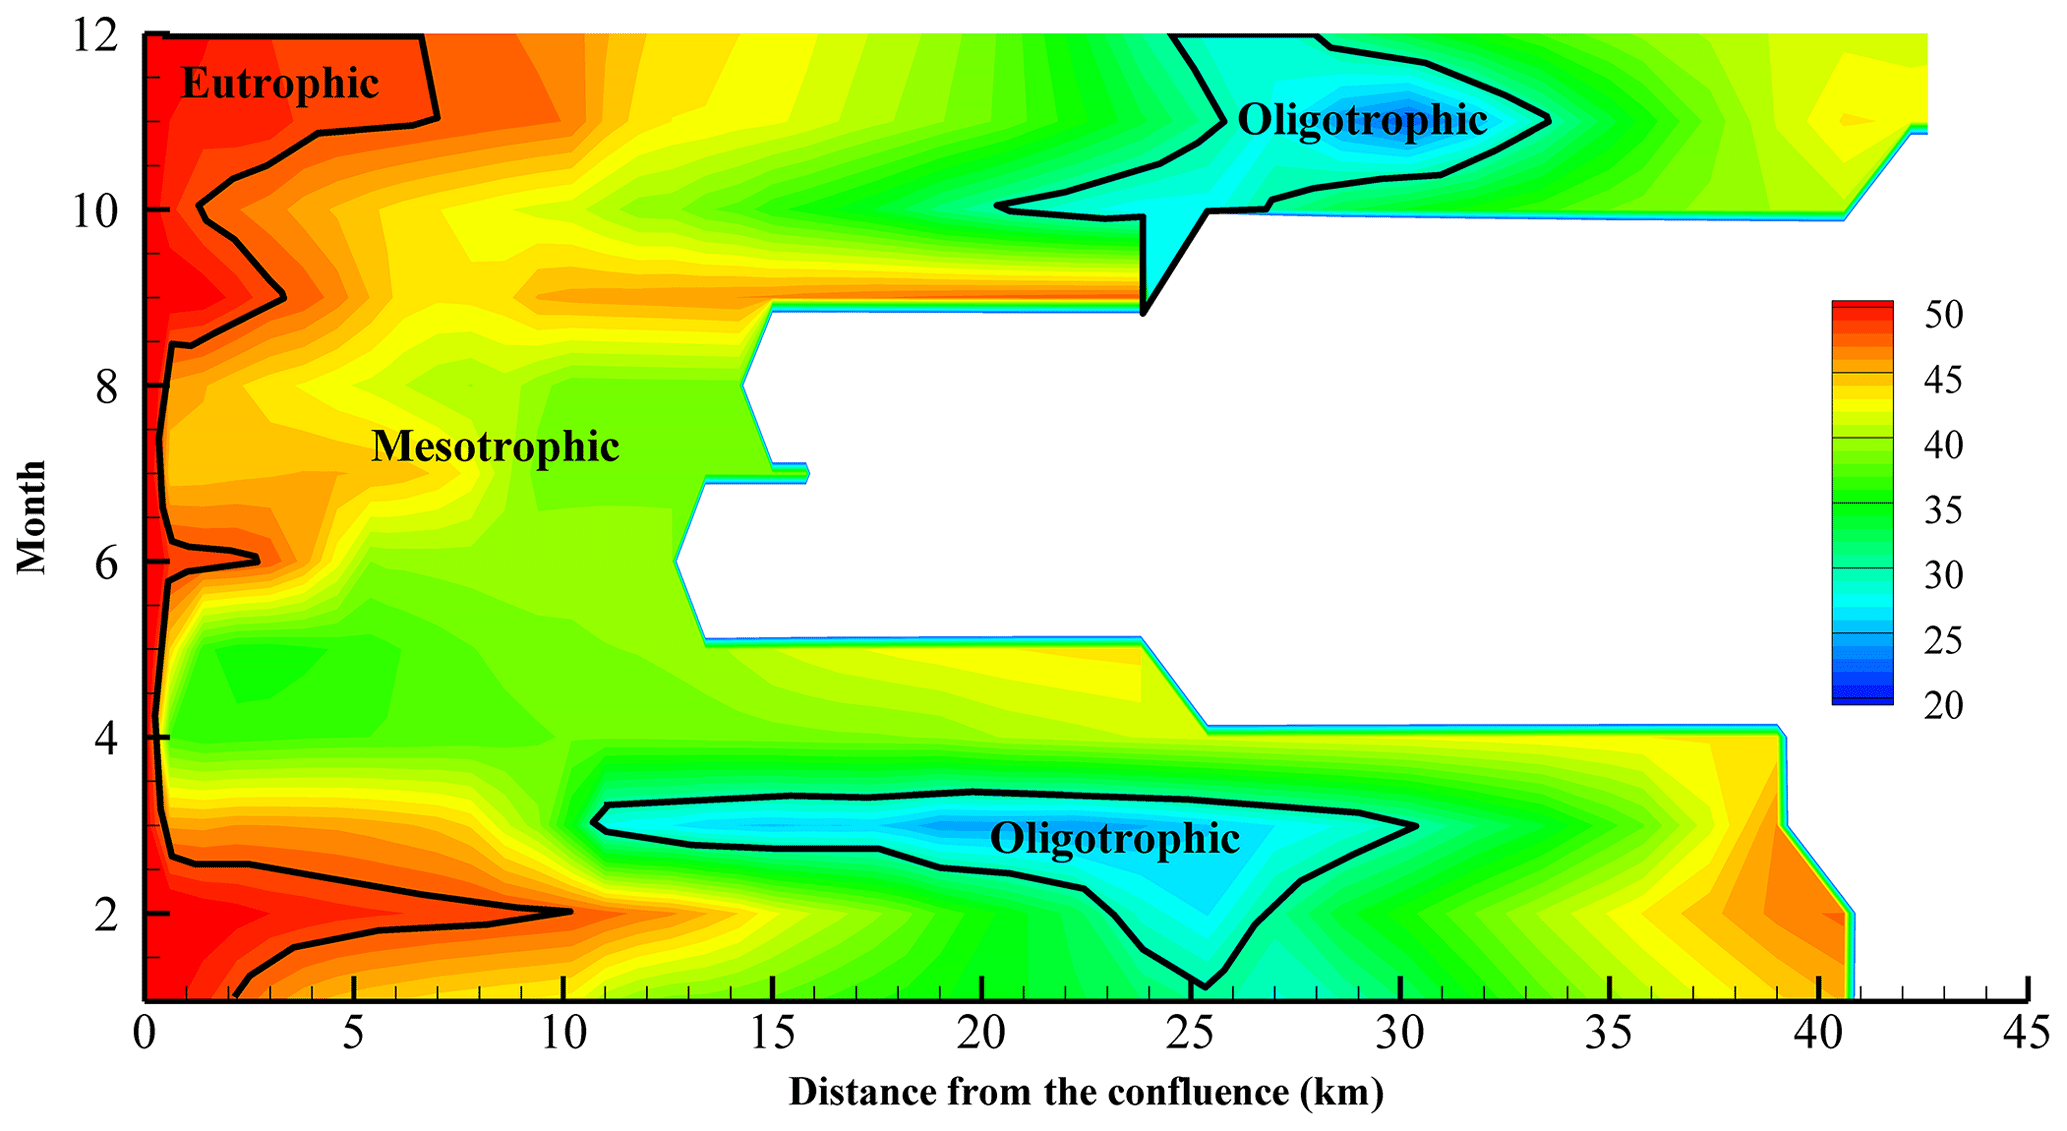
Figure 18Eutrophication results of surface water in the tributary bay. The nutrient status of the tributary bay is divided into three states (oligotrophic, mesotrophic, and eutrophic) according to the comprehensive nutrient index.
3.6 Sensitivity of the results to the model forcing factors
The link between the main reservoir and its tributary bay is the hydrodynamic condition, and it is mostly affected by water level fluctuations (Sha et al., 2015). Thus, in previous sections, we mainly discussed the effect of water level fluctuations in detail. Air temperature and wind conditions were also important factors affecting the results (Yu et al., 2013; Huang et al., 2016). Air temperature can affect the surface water temperature by promoting the formation of thermal stratification (Jin et al., 2019). From July to August, air temperature was a dominant variable and the stratification of water temperature was obvious. A comparison of the distributions of the water temperature and water quality showed that air temperature had almost no effect on the water quality distribution, while the water level fluctuation was a determining factor. The results were not sensitive to wind conditions because the wind varied little throughout the year and the wind speed was low (1–1.8 m s−1) in the study area.
In this paper, the effect of the backwater jacking and intrusions from the main reservoir on the hydrodynamics and water environment of Tangxi River, a tributary bay of the TGR, are studied. The following conclusions were reached as a result of this research:
-
The intrusion was weak when the water level of the main reservoir dropped, and the tributary bay was mainly affected by the backwater jacking of the main reservoir. The periods of intrusions in the tributary bay ranged from July to October. Conversely, when the water level of the main reservoir rose, the tributary bay was mainly affected by backwater intrusions from the main reservoir.
-
The water from the tail flowed along the surface of the tributary bay or sank to the bottom in each month. The backwater from the main reservoir entered the confluence at different depths simultaneously, forming one or two circulations in the tributary bay. The backwater had a greater impact on the tributary bay when the main reservoir was at high water level and had a smaller impact when the main reservoir was at a low water level.
-
The water temperature of the tributary bay was not greatly affected by the backwater from the main reservoir. The concentrations of COD and NH3-N in the tributary bay were generally higher at the two ends of the bay and lower in the middle. For TP and TN, there was an obvious quality concentration boundary in the tributary bay, which was consistent with the regional boundary of the flow field. The concentrations of TP and TN were higher at the side near the confluence.
-
Nutrients in the tributary bay were mainly from the main reservoir, and the nutrient levels were affected by the constantly changing hydrodynamic conditions and environmental factors across seasons. The risk of eutrophication of the tributary bay was high within 0.5 km of the confluence in May and June.
This paper only studied the influence of the main reservoir on the tributary bay in terms of hydrodynamics and water environment. The tributary bay may also influence the main reservoir. The influence of the tributary bay on the main reservoir and the interaction between the main reservoir and the tributary bay are still unclear. In the future, numerical simulation of the main reservoir's hydrodynamics and water environment based on the results of this paper should be carried out to explore the interaction between the main reservoir and the tributary bay.
Future work should also explore control measures to improve the water environment of the tributary bay based on its interaction with the main reservoir. At present, some scholars have proposed that preventing and controlling eutrophication in tributary bays can be achieved by the method of “double nutrient reduction”, which involves the simultaneous control of the nutrient inputs from the main stream and the tributary (Liang et al., 2014). It is also possible to use ecological methods, such as emergent plants, submerged plants, phytoplankton, benthic organisms, and fish, to improve water eutrophication (Srivastava et al., 2017; Li et al., 2013; Soares et al., 2011). In addition, the concept of improving the hydrodynamic conditions of the main stream and controlling the eutrophication of the water body through manually controlled operation has been widely accepted by many experts and scholars (Yao et al., 2012; Zheng et al., 2011; Naselli-Flores and Barone, 2005). It is believed that such work mentioned above could help propose better protection measures for the water environment of tributary bays.
Data are available from the authors on request.
All co-authors participated in the field collection, data analysis, and/or writing of this article. RL was primarily responsible for preparation and processing of this article. XL and YW conceived the study design and data analysis with input from all co-authors.
The authors declare that they have no conflict of interest.
We are grateful to the HESS editor Anas Ghadouani and anonymous reviewers for their constructive comments on this paper.
This research has been supported by a research project of total phosphorus and chemical oxygen demand reduction technology for main pollutants at Guanghui exit section of Qiongjiang River, Sichuan Province. (grant no. 2018SZYZF0001).
This paper was edited by Anas Ghadouani and reviewed by three anonymous referees.
Bangqi Hu, Zuosheng Yang, Houjie Wang, Xiaoxia Sun, Naishuang Bi, and Guogang Li: Sedimentation in the Three Gorges Dam and the future trend of Changjiang (Yangtze River) sediment flux to the sea, Hydrol. Earth Syst. Sci., 13, 2253–2264, https://doi.org/10.5194/hess-13-2253-2009, 2009.
Bennett, M. G., Schofield, K. A., Lee, S. S., and Norton, S. B.: Response of chlorophyll a to total nitrogen and total phosphorus concentrations in lotic ecosystems: a systematic review protocol, Environmental Evidence, 6, 18, https://doi.org/10.1186/s13750-017-0097-8, 2017.
Berger, C. J. and Wells, S. A.: Modeling the effects of macrophytes on hydrodynamics, J. Environ. Eng., 134, 778–788, https://doi.org/10.1061/(ASCE)0733-9372(2008)134:9(778), 2008.
Bockelmann, B. N., Fenrich, E. K., Lin, B., and Falconer, R. A.: Development of an ecohydraulics model for stream and river restoration, Ecol. Eng., 22, 227–235, https://doi.org/10.1016/j.ecoleng.2004.04.003, 2004.
Bowen, J. D. and Hieronymus, J. W.: A CE-QUAL-W2 model of Neuse Estuary for total maximum daily load development, J. Water Res. Pl., 129, 283–294, https://doi.org/10.1061/(ASCE)0733-9496(2003)129:4(283), 2003.
Cai, Q. and Hu, Z.: Studies on eutrophication problem and control strategy in the Three Gorges Reservoir, Acta Hydrobiologica Sinica, 30, 7–11, https://doi.org/10.3321/j.issn:1000-3207.2006.01.002, 2006 (in Chinese).
Carey, C. C., Ibelings, B. W., Hoffmann, E. P., Hamilton, D. P., and Brookes, J. D.: Eco-physiological adaptations that favour freshwater cyanobacteria in a changing climate, Water Res., 46, 1394–1407, https://doi.org/10.1016/j.watres.2011.12.016, 2012.
Carlson, R. E.: A trophic state index for lakes, Limnol. Oceanogr., 22, 361–369, https://doi.org/10.4319/lo.1977.22.2.0361, 1977.
Debele, B., Srinivasan, R., and Parlange, J. Y.: Coupling upland watershed and downstream waterbody hydrodynamic and water quality models (SWAT and CE-QUAL-W2) for better water resources management in complex river basins, Environ. Model. Assess., 13, 135–153, https://doi.org/10.1007/s10666-006-9075-1, 2008.
Deng, S. and Bai, Y.: Analysis on the role of environmental impact assessment in the construction of water conservancy and hydropower projects, Environment and Sustainable Development, 41, 101–102, https://doi.org/10.19758/j.cnki.issn1673-288x.2016.05.030, 2016 (in Chinese).
Fan, J.: The Operating Simulation of Cascade Reservoirs and it's Impacts on River Eco-environment – A Case Study on Upper reaches of the Yangtze River, PhD, Institute of Mountain Hazards and Environment Chinese Academy of Sciences, 2007.
Feng, J., Li, R., Liang, R., and Shen, X.: Eco-environmentally friendly operational regulation: an effective strategy to diminish the TDG supersaturation of reservoirs, Hydrol. Earth Syst. Sci., 18, 1213–1223, https://doi.org/10.5194/hess-18-1213-2014, 2014.
Fu, B., Wu, B., Lu, Y., Xu, Z., Cao, J., Niu, D., Yang, G., and Zhou, Y.: Three gorges project: efforts and challenges for the environment, Prog. Phys. Geogr., 34, 741–754, https://doi.org/10.1177/0309133310370286, 2010.
Gao, Q., He, G., Fang, H., and Huang, L.: Effects of vertical mixing on algal growth in the tributary of Three Gorges Reservoir, J. Hydraul. Eng., 48, 96–103, https://doi.org/10.13243/j.cnki.slxb.20160239, 2017 (in Chinese).
Gao, X., Zeng, Y., Wang, J., and Liu, H.: Immediate impacts of the second impoundment on fish communities in the Three Gorges Reservoir, Environ. Biol. Fish., 87, 163–173, https://doi.org/10.1007/s10641-009-9577-1, 2010.
Han, C., Qin, Y., Ma, Y., Zhao, Y., Liu, Z., Yang, C., and Zhang, L.: Cause of Variation in Water Quality Distribution and Its Ecological Effects in the Daning Bay of the Three Gorges Reservoir, Research of Environmental Sciences, 33, 893–900, https://doi.org/10.13198/j.issn.1001-6929.2019.09.03, 2020 (in Chinese).
Holbach, A., Norra, S., Wang, L. Yuan, Y., Wei, H., and Zheng, B.: Three Gorges Reservoir: Density Pump Amplification of Pollutant Transport into Tributaries, Environ. Sci. Technol., 48, 7798–7806, https://doi.org/10.1021/es501132k, 2014.
Holbach, A., Bi, Y., Yuan, Y., Wang, L., Zheng, B., and Norra, S.: Environmental water body characteristics in a major tributary backwater of the unique and strongly seasonal Three Gorges Reservoir, China, Environmental Science Processes: Processes & Impacts, 17, 1641–1653, https://doi.org/10.1039/C5EM00201J, 2015.
Hu, N., Ji, D., Liu, D., Huang, Y., Yin, W., Xiong, C., and Zhang, Y.: Field monitoring and numerical simulating on three-dimensional thermal density currents in the estuary of xiangxi river, Appl. Mech. Mater., 295–298, 1029–1036, https://doi.org/10.4028/www.scientific.net/AMM.295-298.1029, 2013.
Huang, L., Fang, H., He, G., Jiang, H., and Wang, C.: Effects of internal loading on phosphorus distribution in the Taihu Lake driven by wind waves and lake currents, Environ. Pollut., 219, 760–773, https://doi.org/10.1016/j.envpol.2016.07.049, 2016.
Huisman, J., Pham Thi, N. N., Karl, D. M., and Sommeijer, B.: Reduced mixing generates oscillations and chaos in the oceanic deep chlorophyll maximum, Nature, 439, 322-325, https://doi.org/10.1038/nature04245, 2006.
Ji, D., Liu, D., Yang, Z., and Xiao, S.: Hydrodynamic characteristics of Xiangxi Bay in Three Gorges Reservoir, Science China (Physics, Mechanics & Astronomy), 40, 101–112, 2010 (in Chinese).
Ji, D., Huang, Y., Liu, D., Yin, W., Yang, Z., Ma, J., and Xie, T.: Research progress on the ocean estuary and its enlightenment to the study of the tributary in Three Gorges Reservoir, Appl. Mech. Mater., 295, 2215–2222, https://doi.org/10.4028/www.scientific.net/AMM.295-298.2215, 2013.
Ji, D., Wells, S. A., Yang, Z., Liu, D., Huang, Y., Ma, J., and Chris, J. B.: Impacts of water level rise on algal bloom prevention in the tributary of Three Gorges Reservoir, China, Ecol. Eng., 98, 70–81, https://doi.org/10.1016/j.ecoleng.2016.10.019, 2017.
Jin, J., Wells, S. A., Liu, D., Yang, G., Zhu, S., Ma, J., and Yang, Z.: Effects of water level fluctuation on thermal stratification in a typical tributary bay of Three Gorges Reservoir, China. PeerJ, 7, e6925, https://doi.org/10.7717/peerj.6925, 2019.
Kasai, A., Kurikawa, Y., Ueno, M., Robert, D., and Yamashita, Y.: Salt-wedge intrusion of seawater and its implication for phytoplankton dynamics in the Yura Estuary, Japan, Estuarine, Coast. Shelf Sci., 86, 408–414, https://doi.org/10.1016/j.ecss.2009.06.001, 2010.
Lewis, W. M., Wurtsbaugh, W. A., and Paerl, H. W.: Rationale for control of anthropogenic nitrogen and phosphorus to reduce eutrophication of inland waters, Environ. Sci. Technol., 45, 10300–10305, https://doi.org/10.1021/es202401p, 2011.
Li, K., He, W., Hu, Q., and Gao, S.: Ecological restoration of reclaimed wastewater lakes using submerged plants and zooplankton, Water Environ. J., 28, 323–328, https://doi.org/10.1111/wej.12038, 2013.
Li, Z. and Zhang, H.: Trophic State Index and its Correlation with Lake Parameters in China, Acta Scientiae Circumstantiae, 13, 391–397, https://doi.org/10.13671/j.hjkxxb.1993.04.002, 1993 (in Chinese).
Liang, L., Deng, Y., Zheng, M., and Wei, X.: Predicting of Eutrophication in the Longchuan River Based on CE-QUAL-W2 Model, Resources and Environment in the Yangtze Basin, 23, 103–111, https://doi.org/10.11870/cjlyzyyhj2014Z1015, 2014.
Lindim, C., Pinho, J. L., and Vieira, J. M. P.: Analysis of spatial and temporal patterns in a large reservoir using water quality and hydrodynamic modeling, Ecol. Model., 222, 2485–2494, https://doi.org/10.1016/j.ecolmodel.2010.07.019, 2011.
Liu, D., Yang, Z., Ji, D., Ma, J., and Cui, Y.: A review on the mechanism and its controlling methods of the algal blooms in the tributaries of Three Gorges Reservoir, J. Hydraul. Eng., 47, 443–454, https://doi.org/10.13243/j.cnki.slxb.20151304, 2016 (in Chinese).
Liu, L.: Effects of vertical mixing on phytoplankton blooms in Xiangxi Bay of Three Gorges Reservoir: Implications for management, Water Res., 46, 2121–2130, https://doi.org/10.1016/j.watres.2012.01.029, 2012.
Long, L., Xu, H., Bao, Z., Ji, D., and Liu, D.: Temporal and spatial characteristics of water temperature in Xiluodu Reservoir, Journal of Hydroelectric Engineering, 37, 79–89, https://doi.org/10.11660/slfdxb.20180408, 2018 (in Chinese).
Long, L., Ji, D., Yang, Z., Ma, J., Scott, A. W., Liu, D., and Andreas, L.: Density – driven water circulation in a typical tributary of the Three Gorges Reservoir, China, River Res. Appl., 35, 1–11, https://doi.org/10.1002/rra.3459, 2019.
Lu, Q., Li, R., Li, J., Li, K., and Wang, L.: Experimental study on total dissolved gas supersaturation in water, Water Science and Engineering, 4, 396–404, https://doi.org/10.3882/j.issn.1674-2370.2011.04.004, 2011.
Lung, W. S. and Nice, A. J.: Eutrophication model for the Patuxent estuary: Advances in predictive capabilities, J. Environ. Eng., 133, 917–930, https://doi.org/10.1061/(ASCE)0733-9372(2007)133:9(917), 2007.
McGrath, K. E., Dawley, E. M., and Geist, D. R.: Total Dissolved Gas Effects on Fishes of the Lower Columbia River, PNNL-15525, Pacific Northwest National Laboratory, Richland, Washington, https://doi.org/10.2172/918864, 2006.
Mohseni, O. and Stefan, H. G.: Stream temperature/air temperature relationship: a physical interpretation, J. Hydrol., 218, 128–141, https://doi.org/10.1016/S0022-1694(99)00034-7, 1999.
Morgenstern, U., Daughney, C. J., Leonard, G., Gordon, D., Donath, F. M., and Reeves, R.: Using groundwater age and hydrochemistry to understand sources and dynamics of nutrient contamination through the catchment into Lake Rotorua, New Zealand, Hydrol. Earth Syst. Sci., 19, 803–822, https://doi.org/10.5194/hess-19-803-2015, 2015.
Naselli-Flores, L. and Barone, R.: Water-Level Fluctuations in Mediterranean Reservoirs: Setting a Dewatering Threshold as a Management Tool to Improve Water Quality, Hydrobiologia, 548, 85–99, https://doi.org/10.1007/s10750-005-1149-6, 2005.
Noori, R., Yeh, H. D., Ashrafi, K., Rezazadeh, N., Bateni, S. M., Karbassi, A., Kachoosangi, F. T., and Moazami, S.: A reduced-order based CE-QUAL-W2 model for simulation of nitrate concentration in dam reservoirs, J. Hydrol., 530, 645–656, https://doi.org/10.1016/j.jhydrol.2015.10.022, 2015.
Oldani, N. O. and Claudio, R. M.: Baigún: Performance of a fishway system in a major South American dam on the Parana River (Argentina–Paraguay), River Res. Appl., 18, 171–183, https://doi.org/10.1002/rra.640, 2002.
Paerl, H. W., Hall, N. S., and Calandrino, E. S.: Controlling harmful cyanobacterial blooms in a world experiencing anthropogenic and climatic-induced change, Sci. Total Environ., 409, 1739–1745, https://doi.org/10.1016/j.scitotenv.2011.02.001, 2011.
Pan, X., Tang, L., Feng, J., Liang, R., Pu, X., Li, R., and Li, K.: Experimental Research on the Degradation Coefficient of Ammonia Nitrogen Under Different Hydrodynamic Conditions, B. Environ. Contam. Tox., 104, 288–292, https://doi.org/10.1007/s00128-019-02781-0, 2020.
Peng, C., Chen, L., Bi, Y., Xia, C., Lei, Y., Yang, Y., Jian, T., and Hu, Z.: Effects of flood regulation on phytoplankton community structure in the Xiangxi River, a tributary of the Three Gorges Reservoir, China Environmental Science, 34, 1863–1871, https://doi.org/10.1097/NEN.0000000000000183, 2014.
Ran, X., Alexander, F. B., Yu, Z., and Liu, J.: Implications of eutrophication for biogeochemical processes in the Three Gorges Reservoir, China, Reg. Environ. Chang., 19, 55–63, https://doi.org/10.1007/s10113-018-1382-y, 2019.
Reynolds, C. S.: The ecology of phytoplankton, Cambridge University Press, London, 2006.
Romarheim, A. T., Tominaga, K., Riise, G., and Andersen, T.: The importance of year-to-year variation in meteorological and runoff forcing for water quality of a temperate, dimictic lake, Hydrol. Earth Syst. Sci., 19, 2649–2662, https://doi.org/10.5194/hess-19-2649-2015, 2015.
Sha, Y., Wei, Y., Li, W., Fan, J., and Cheng, C.: Artificial tide generation and its effects on the water environment in the backwater of Three Gorges Reservoir, J. Hydrol., 528, 230–237, https://doi.org/10.1016/j.jhydrol.2015.06.020, 2015.
Singh, S. P. and Singh, P.: Effect of temperature and light on the growth of algae species: A review, Renew. Sust. Energ. Rev., 50, 431–444, https://doi.org/10.1016/j.rser.2015.05.024, 2015.
Soares, M., Vale, M., and Vasconcelos, V.: Effects of nitrate reduction on the eutrophication of an urban man-made lake (Palácio de Cristal, Porto, Portugal), Environ. Technol., 32, 1009–1015, https://doi.org/10.1080/09593330.2010.523437, 2011.
Srivastava, A., Chun, S. J., Ko, S. R., Kim, J., Ahn, C. Y. and Oh, H.-M.: Floating rice-culture system for nutrient remediation and feed production in a eutrophic lake, J. Environ. Manage., 203, 342–348, https://doi.org/10.1016/j.jenvman.2017.08.006, 2017.
Tang, Q., Bao, Y., He, X., Fu, B., Adrian, L. C., and Zhang, X.: Flow regulation manipulates contemporary seasonal sedimentary dynamics in the reservoir fluctuation zone of the Three Gorges Reservoir, China, Sci. Total Environ., 548–549, 410–420, https://doi.org/10.1016/j.jenvman.2017.08.006, 2016.
Thomas, M. C. and Scott, A. W.: CE-QUAL-W2: A two-dimensional laterally averaged hydrodynamic and water quality model, Version 3.6, Department of Civil and Environmental Engineering, Portland State University, Portland, 2008.
Wang, Q.: Influence on fishes of dissolved gas supersaturation caused by high-dam discharging and its countermeasures, Proceedings of 2011 International Symposium on Water Resource and Environmental Protection, Xi'an, https://doi.org/10.1109/ISWREP.2011.5893398, 2011.
Wang, R., Huang, T., and Wu, W.: Different factors on nitrogen and phosphorus self-purification ability from an urban Guandu-Huayuan river, J. Lake Sci., 28, 105–113, https://doi.org/10.18307/2016.0112, 2016.
Wang, Z., Liu, Y., Qin, C., and Zhang, W.: Study on characteristics of hydrodynamic and pollutant transport of the tributary estuary in the three gorges reservoir area, Appl. Mech. Mater., 675–677, 912–917, https://doi.org/10.4028/www.scientific.net/amm.675-677.912, 2014.
Wu, W.: Change of Channel Conditions of the Reach from Wanzhou to Fuling in the Yangtze River at Incipient Stage of Three Gorges Reservoir, Journal of Chongqing Jiaotong University (Natural Science), 32, 475–479, https://doi.org/10.3969/j.issn.1674-0696.2013.03.25, 2013 (in Chinese).
Xiong, C., Liu, D., Zheng, B., Zhang, J., Hu, N., Zhang, Y., and Chen, Y.: The Influence of Hydrodynamic Conditions on Algal Bloom in the Three Gorges Reservoir Tributaries, Appl. Mech. Mater., 295–298, 1981–1990, https://doi.org/10.4028/www.scientific.net/amm.295-298.1981, 2013.
Yang, Z., Liu, D., Ji, D., and Xiao, S.: Influence of the impounding process of the Three Gorges Reservoir up to water level 172.5 m on water eutrophication in the Xiangxi Bay, Science China Technological Sciences, 53, 1114–1125, https://doi.org/10.1007/s11431-009-0387-7, 2010.
Yang, Z., Liu, D., Ji, D., Xiao, S., Huang, Y., and Ma, J.: An eco-environmental friendly operation: an effective method to mitigate the harmful blooms in the tributary bays of Three Gorges Reservoir, Science China (Technological Sciences), 56, 1458–1470, https://doi.org/10.1007/s11431-013-5190-9, 2013.
Yang, Z., Cheng, B., Xu, Y., Liu, D., Ma, J., and Ji, D.: Stable isotopes in water indicate sources of nutrients that drive algal blooms in the tributary bay of a subtropical reservoir, Sci. Total Environ., 634, 205–213, https://doi.org/10.1016/j.scitotenv.2018.03.266, 2018.
Yao, X., Liu, D., Yang, Z., Ji, D., and Fang, X.: Preliminary Studies on the Mechanism of Winer Dinoflagellate Bloom in Xiangxi Bay of the Three Gorges Reservoir, Research of Environmental Sciences, 25, 645–651, https://doi.org/10.13198/j.res.2012.06.40.yaoxj.001, 2012 (in Chinese).
Yin, W., Ji, D., Hu, N., Xie, T., Huang, Y., Li, Y., and Zhou, J.: Three-dimensional Water Temperature and Hydrodynamic Simulation of Xiangxi River Estuary, Adv. Mater. Res., 726–731, 3212–3221, https://doi.org/10.4028/www.scientific.net/AMR.726-731.3212, 2013.
Yu, Z., Wang, L., Zhang, L., Yang, Y., Yan, L., Zhang, J., and Yang, Y.: Hydrodynamic characteristics in a valley type tributary bay during the raising and falling temperature periods, Appl. Mech. Mater., 353–356, 2567–2571, https://doi.org/10.4028/www.scientific.net/AMM.353-356.2567, 2013.
Zeng, M., Huang, T., Qiu, X., Wang, Y., Shim, J., Zhou, S., and Liu, F.: Seasonal Stratification and the Response of Water Quality of a Temperate Reservoir–Zhoucun Reservoir in North of China, Environm. Sci., 37, 1337–1344, https://doi.org/10.13227/j.hjkx.2016.04.019, 2016 (in Chinese).
Zhang, H.: Ways to effectively improve the design level of water conservancy and hydropower projects, China Science and Technology Information, 5, 89–90, https://doi.org/10.3969/j.issn.1001-8972.2014.05.024, 2014 (in Chinese).
Zhang, S., Song, D., Zhang, K., Zeng, F., and Li, D.: Trophic status analysis of the upper stream and backwater area in typical tributaries, Three Gorges Reservoir, Journal of Lake Sciences, 22, 201–207, https://doi.org/10.1017/S0004972710001772, 2010 (in Chinese).
Zhao, Y.: Study on the Influence of Mainstream of the Three Gorges Reservoir on Water Quality of Daning River Backwater Area, PhD, Tsinghua University, Beijing, China, 2017.
Zhao, Y., Zheng, B., Wang, L., Qin, Y., Li, H., and Cao, W.: Characterization of Mixing Processes in the Confluence Zone between the Three Gorges Reservoir Mainstream and the Daning River Using Stable Isotope Analysis, Environ. Sci. Technol., 50, 9907–9914, https://doi.org/10.1021/acs.est.5b01132, 2015.
Zheng, B., Zhao, Y., Qin, Y., Ma, Y., and Han, C.: Input characteristics and sources identification of nitrogen in the three main tributaries of the Three Gorges Reservoir, China, Environ. Earth Sci., 75, 1219.1–1219.10, https://doi.org/10.1007/s12665-016-6028-0, 2016.
Zheng, T.: The Study of Water Environment and Sedimentation Regimes in the Upper Three Gorges Reservoir. Proceedings of 2011 International Symposium on Water Resource and Environmental Protection, Xi'an, https://doi.org/10.1109/ISWREP.2011.5893641, 2011.
Zheng, T., Mao, J., Dai, H., and Liu, D.: Impacts of water release operations on algal blooms in a tributary bay of Three Gorges Reservoir, Science China (Technological Sciences), 54, 1588–1598, https://doi.org/10.1007/s11431-011-4371-7, 2011.
Zhou, J., Zhang, M., and Lu, P.: The effect of dams on phosphorus in the middle and lower Yangtze river, Water Resour. Res., 49, 3659–3669, https://doi.org/10.1002/wrcr.20283, 2013.
Zhu, S.: Preliminary Study on Physical Characteristics of Sediment Deposition in the Three Gorges Reservoir, MS, Changjiang River Scientific Research Institute, Wuhan, China, 2017 (in Chinese).
Ziv, G., Baran, E., Nam, S., Rodriguez-Iturbe, I., and Levin, S. A.: Trading-off fish biodiversity, food security, and hydropower in the Mekong River Basin, P. Natl. Acad. Sci. USA, 109, 5609–5614, https://doi.org/10.1073/pnas.1201423109, 2012.
Zou, J. and Zhai, H.: Impacts of Three Gorges Project on water environment and aquatic ecosystem and protective measures, Water Resources Protection, 32, 136–140, 2016 (in Chinese).