the Creative Commons Attribution 4.0 License.
the Creative Commons Attribution 4.0 License.
 | 13 Oct 2020
Asymmetric impact of groundwater use on groundwater droughts
Anne F. Van Loon
John P. Bloomfield
David M. Hannah
Groundwater use affects groundwater storage continuously as the removal of water changes both short-term and long-term groundwater level variation. This has implications for groundwater droughts, i.e. a below-normal groundwater level. The impact of groundwater use on groundwater droughts, however, remains unknown. Hence, the aim of this study is to investigate the impact of groundwater use on groundwater droughts in the absence of actual abstraction data. We present a methodological framework that consists of two approaches. The first approach compared groundwater droughts at monitoring sites that are potentially influenced by abstraction to groundwater droughts at sites that are known to be near natural. Observed groundwater droughts were compared in terms of drought occurrence, duration, and magnitude. The second approach investigated long-term trends in groundwater levels in all monitoring wells. This framework was applied to a case study of the UK, using four regional water management units in which groundwater levels are monitored and abstractions are licensed. Results show two asymmetric responses in groundwater drought characteristics due to groundwater use. The first response is an increase in shorter drought events and is found in three water management units where long-term annual average groundwater abstractions are smaller than recharge. The second response, observed in one water management unit where groundwater abstractions temporarily exceeded recharge, is a lengthening and intensification of groundwater droughts. Analysis of long-term (1984–2014) trends in groundwater levels shows mixed but generally positive trends, while trends in precipitation and potential evapotranspiration are not significant. The overall rising groundwater levels are consistent with changes in water use regulations and with a general reduction in abstractions during the period of investigation. We summarised our results in a conceptual typology that illustrates the asymmetric impact of groundwater use on groundwater drought occurrence, duration, and magnitude. The long-term balance between groundwater abstraction and recharge plays an important role in this asymmetric impact, which highlights the relation between short-term and long-term sustainable groundwater use.
- Article
(3361 KB) - Full-text XML
-
Supplement
(744 KB) - BibTeX
- EndNote


Groundwater is an essential source of water supply, as it provides almost half of the global population with domestic water (Gun, 2012), 43 % of the irrigation water (Siebert et al., 2010), and 27 % of industrial water use (Döll et al., 2012), as well as sustaining ecologically important rivers and wetlands (de Graaf et al., 2019). Groundwater use and dependency on groundwater resources has grown in the past decades (Famiglietti, 2014), particularly during meteorological droughts, when groundwater is used frequently (Taylor et al., 2013; AghaKouchak, 2015).
Meteorological droughts propagate through the hydrological cycle, ultimately resulting in a groundwater drought (Wilhite, 2000; Van Lanen, 2006), defined as below-normal groundwater levels that are associated with short-term reductions in storage (Chang and Teoh, 1995; Tallaksen and Van Lanen, 2004; Mishra and Singh, 2010). Increased use of groundwater before or during meteorological droughts can also lower groundwater levels and, thereby, aggravate groundwater droughts (Wada et al., 2013; Christian-Smith et al., 2015). Managing groundwater use during droughts is therefore important, as overexploitation of groundwater has disastrous consequences (Custodio, 2002; Famiglietti, 2014; Russo and Lall, 2017; Mustafa et al., 2017). However, to date, groundwater droughts have been studied under primarily near-natural conditions, and there is limited conceptual understanding of the impact of groundwater use on groundwater droughts, despite this being of interest to water regulators and policy makers.
Under near-natural conditions, the propagation of meteorological droughts to groundwater droughts depends on the antecedent condition of the land surface, subsurface controls on recharge, and non-linear response of groundwater systems (Eltahir and Yeh, 1999; Peters et al., 2006; Tallaksen et al., 2009). These processes determine the spatial distribution, duration, magnitude, and recovery of near-natural groundwater droughts (Van Lanen et al., 2013; Van Loon, 2015; Parry et al., 2018). However, in human-modified environments, groundwater droughts are also impacted or driven by water use (Van Loon et al., 2016b). This type of groundwater drought is therefore distinguished from a natural drought and referred to as human-modified or human-induced drought (Van Loon et al., 2016a).
In human-modified environments, understanding the influence of groundwater use on groundwater drought requires information related to the natural propagation of a drought and groundwater use in time. Droughts are influenced by historical and recent abstractions as these change both short-term and long-term groundwater storage (Gleeson and Richter, 2017; Thomas and Famiglietti, 2015; Jackson et al., 2015). Unfortunately, information on groundwater abstraction, if available at all, is often considered commercially confidential. Abstraction records are usually unavailable for research, although often included in groundwater models developed for commercial and regulatory purposes (Shepley et al., 2012). Consequently, in the absence of actual abstraction records, qualitative information about groundwater use and management regulations is invaluable for investigating the influence of groundwater abstraction on groundwater droughts (Döll et al., 2014; Panda et al., 2007). However, the scale at which management regulations are organised is often regional, including multiple catchments that might not cover the entire drought-impacted area (Tallaksen et al., 2009; Shepley et al., 2012). Studying groundwater droughts in human-modified environments would therefore require a regional approach to align the scale of a groundwater drought study with the scale at which management decisions are made.
The aim of this study is to investigate the impact of groundwater use on regional groundwater droughts in the absence of actual abstraction data. To this end, a methodological framework is designed to investigate groundwater droughts in water management units under a broad range of conditions, i.e. from where groundwater use is a small proportion of the long-term annual average recharge to where it is a significant proportion of the long-term annual average recharge. A case study from the United Kingdom (UK) is used, consisting of four water management units in two main aquifers. As is common elsewhere, no data are freely available on actual abstractions in the case study area. However, information indicating the annual maximum licensed abstraction is available, and groundwater level observations are provided for 170 sites in the four water management units. Consequently, inferential approaches are used to assess the impact of abstraction on groundwater droughts. We used two complementary approaches. First, given the typically good correlation between precipitation and groundwater level time series under near-natural conditions (Bloomfield and Marchant, 2013; Bloomfield et al., 2015; Kumar et al., 2016), we used correlations defined by a limited number of near-natural groundwater hydrographs as reference. Deviations from this reference correlation were then used to qualitatively subdivide sites into, on average, uninfluenced and influenced by abstraction. This subdivision was used to characterise the impact of groundwater abstraction on regional groundwater droughts. Second, long-term abstraction influence was investigated through the spatial distribution of trends in groundwater level time series in relation to the distribution of licensed abstractions. Results are discussed in terms of the role groundwater abstraction plays in modifying near-natural groundwater droughts. A conceptual figure is proposed suggesting that long-term groundwater abstraction may modify drought frequency, duration, and magnitude depending on the balance between groundwater abstraction and recharge.
The UK case study consists of four water management units (1 – Lincolnshire, 2 – Chilterns, 3 – Midlands, and 4 – Shropshire) across chalk and Permo–Triassic sandstone aquifers that are the two main aquifers in the UK (Fig. 1). The two aquifers have contrasting hydrogeological characteristics. Regional groundwater flow and storage in the chalk aquifer are dominated by its primary fracture network (Bloomfield, 1996) and secondary solution-enhanced fractures (Downing et al., 1993; Maurice et al., 2006). The response of chalk groundwater hydrographs to driving meteorology is a function of regional variations in the nature of the fracture network, extent of karstification, and nature of overlying superficial deposits, amongst other factors (Allen et al., 1997). In the Permo–Triassic sandstone aquifer, groundwater flow and storage are influenced by variations in the matrix porosity, aquifer thickness, and, to some extent, on fracture characteristics (Shepley et al., 2008; Allen et al., 1997). Faults divide the Permo–Triassic sandstone in separate sections, but their impact on regional groundwater flow varies; some faults act as hydraulic barriers and others enhance permeability, resulting in increased recharge (Allen et al., 1997). Hydrographs in the Permo–Triassic sandstones typically respond more slowly to driving meteorology than those in the chalk (Bloomfield and Marchant, 2013) and are influenced by local variation in aquifer thickness and confinement by superficial deposits.
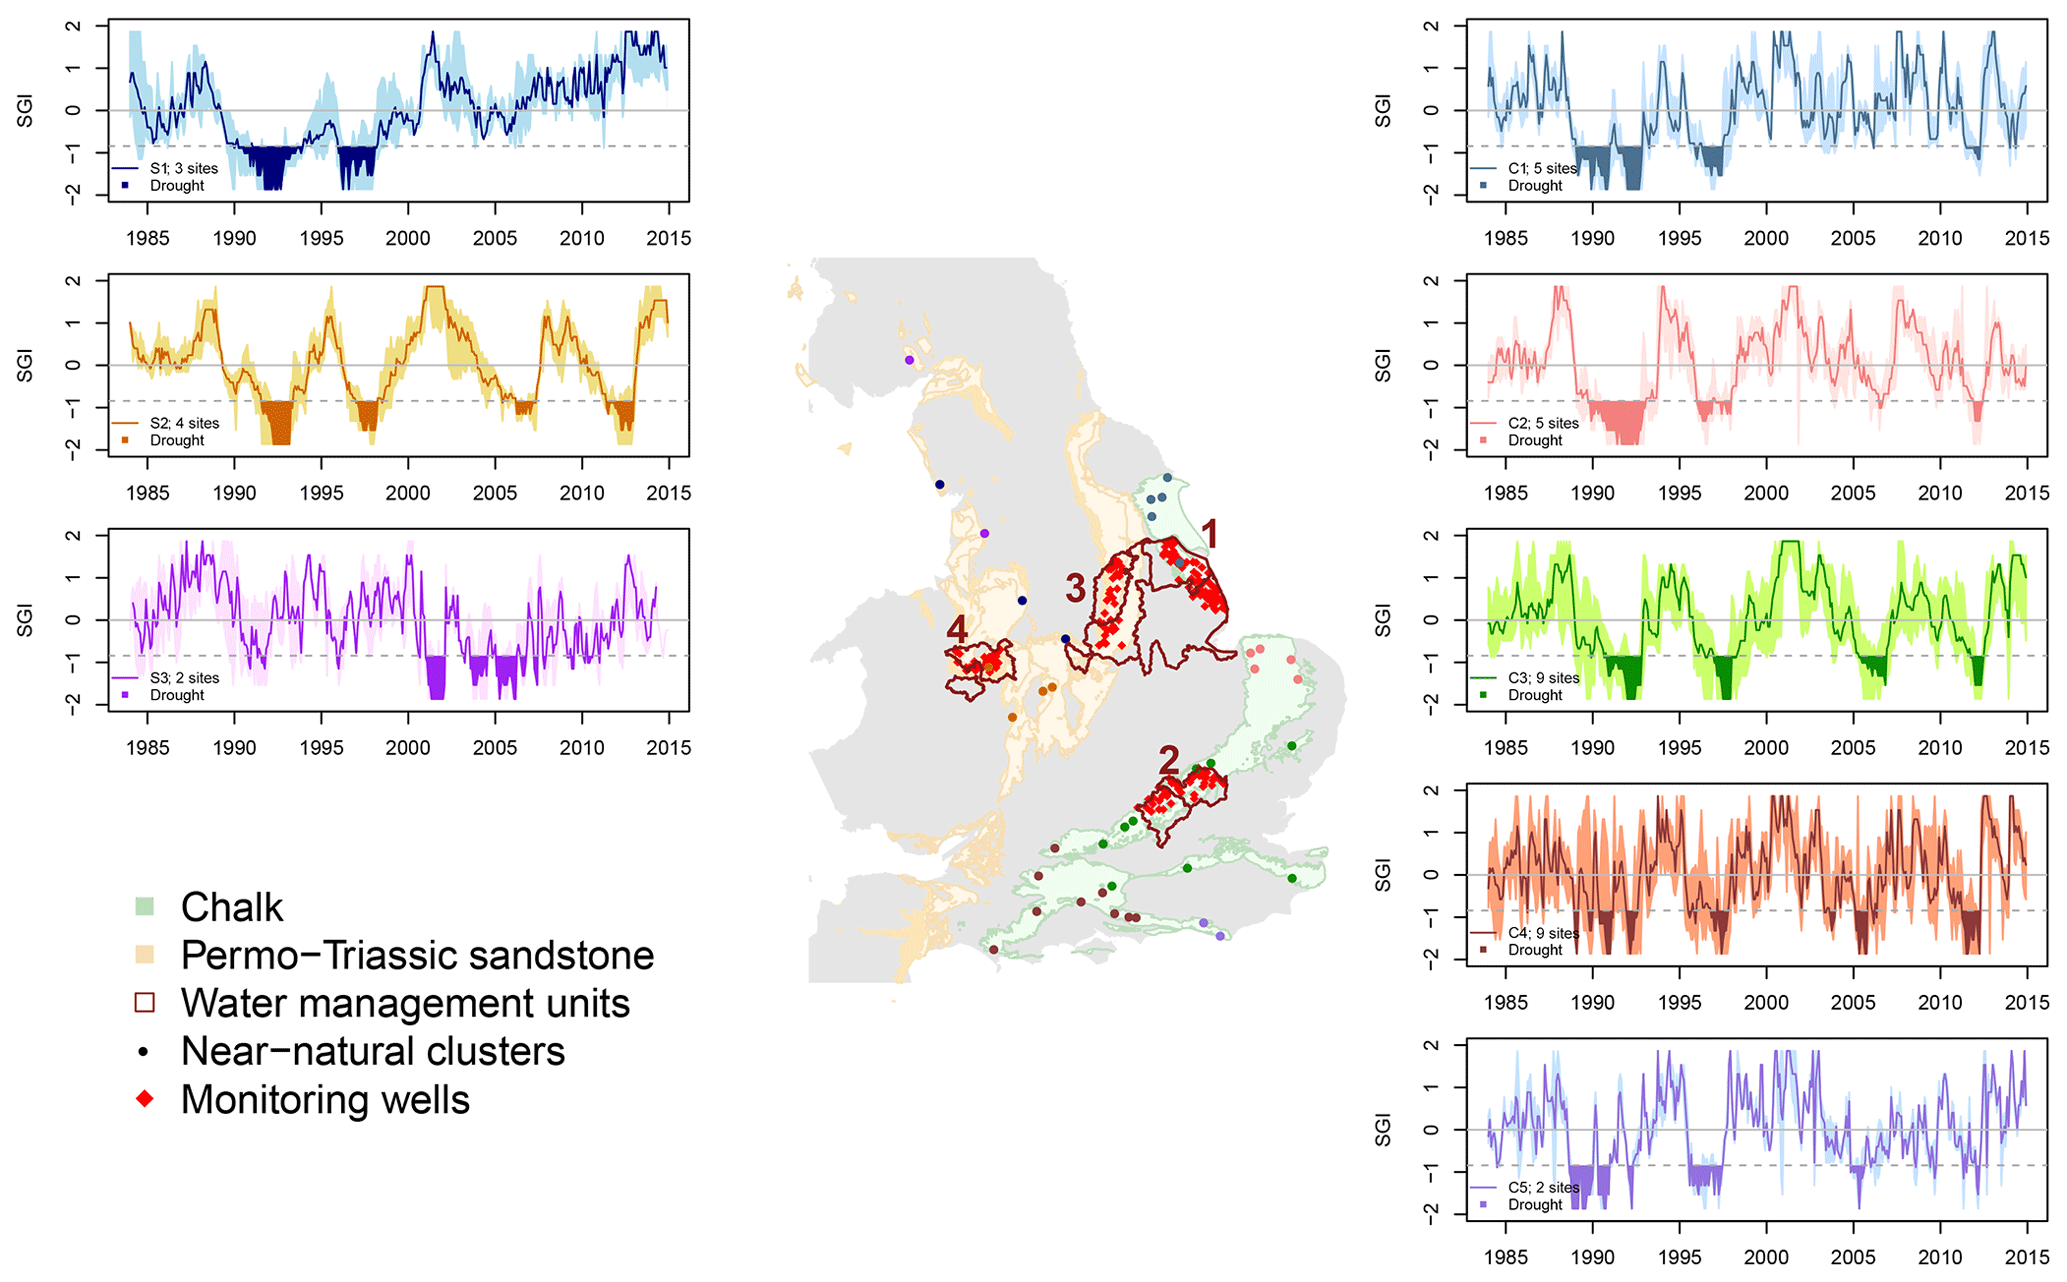
Figure 1A total of eight clusters based on the 39 reference groundwater sites in the Permo–Triassic sandstone and chalk aquifer are shown, representing long-term, near-natural groundwater level variation. All time series are standardised for the 30 year time period (1984–2014). In the centre, locations of the reference wells are shown by the dots in different colours for all eight clusters. The four water management units are indicated in dark red (regular groundwater monitoring sites in red triangles). Three of these units coincide with the following reference clusters: 1 – Lincolnshire (C1), 2 – Chilterns (C3), and 4 – Shropshire (S2). S2 is also used to compare water management unit 3 (Midlands) as this is the nearest reference cluster in the Permo–Triassic sandstone. In the panels on the left (Permo–Triassic sandstone) and right (chalk), Standardised Groundwater level Index (SGI) time series are shown for each cluster, showing the cluster mean (thick line), the range of all reference wells in the cluster (shading), and reference droughts of the cluster mean (filled area).
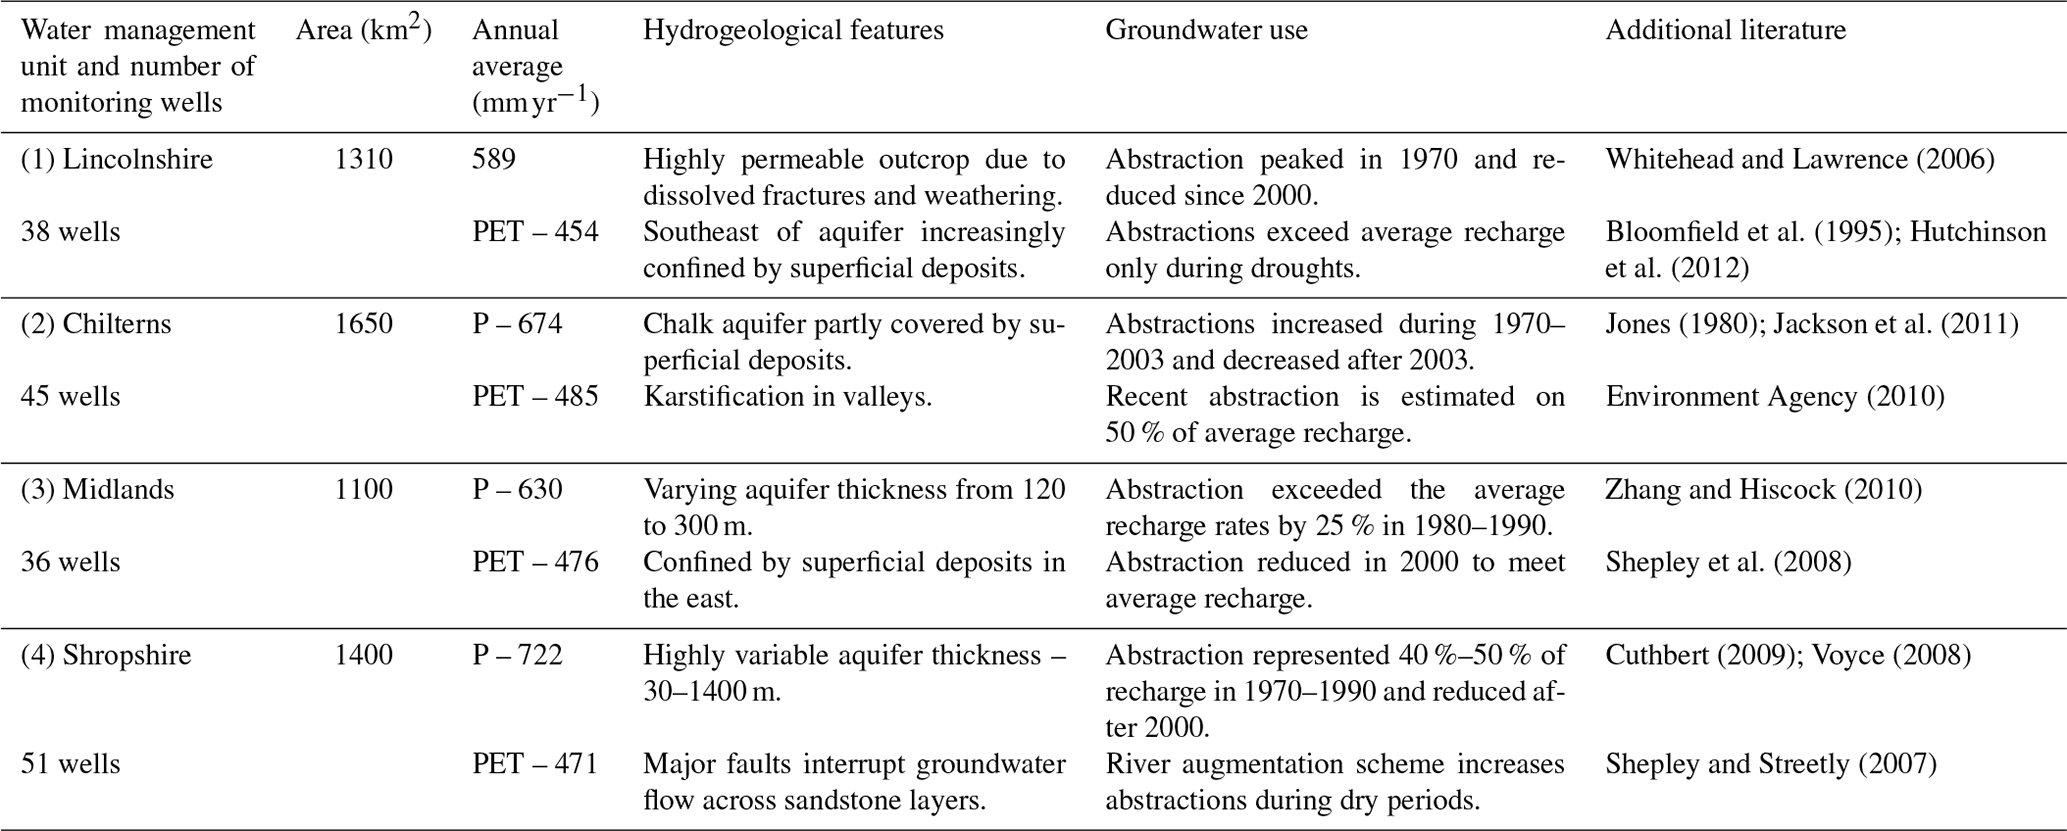
Regional hydrological features of the four studied water management units in the aquifers are summarised in Table 1. Two of these water management units are situated in eastern England (Lincolnshire; unit 1) and central southern England (the Chilterns; unit 2) and are underlain by the chalk aquifer. The other two water management units are situated in central England (East Midlands; unit 3) and northwest England (Shropshire; unit 4) and are underlain by the Permo–Triassic sandstone aquifer. Groundwater is primarily abstracted for public drinking water. Industrial, agricultural, and environmental water use represent a smaller proportion of groundwater use in the UK (Environment Agency, 2020). Abstractions are licensed, which have changed since their introduction in 1963 (Ohdedar, 2017). As a result of the implementation of the Water Framework Directive in 2000, abstraction licenses follow a water balance approach to ensure “good groundwater status”, resulting in an overall reduction in licensed groundwater use (Environment Agency, 2016). Specific information regarding the change in water use in these water management units is presented in Table 1 (see also the additional references in the last column).
Whitehead and Lawrence (2006)Bloomfield et al. (1995)Hutchinson et al. (2012)Jones (1980)Jackson et al. (2011)Environment Agency (2010)Zhang and Hiscock (2010)Shepley et al. (2008)Cuthbert (2009)Voyce (2008)Shepley and Streetly (2007)Table 1Regional features of the four water management units summarising the area size, long-term precipitation (P), and potential evapotranspiration (PET), as calculated by Mansour and Hughes (2018) based on daily data from 1962 to 2016, hydrogeological features, and main groundwater use changes in time. The location of the water management units is shown in Fig. 1. In Fig. S1, the purpose and locations of recent abstraction licenses are shown. Hydrogeological information and groundwater use is based on Allen et al. (1997) and complemented with additional references (see last column).
3.1 Data
The analysis has been undertaken for a 30 year period (1984–2014) using precipitation, evapotranspiration, and groundwater level time series. This time period includes at least four major droughts with national spatial extent, namely 1988–1994, 1995–1997, 2003–2006, and 2010–2012 (Durant, 2015).
Precipitation and potential evapotranspiration data were obtained from the GEAR data set (Tanguy et al., 2016) and the CHESS data set (Robinson et al., 2016). The gridded (1 km2) GEAR data set contains interpolated monthly precipitation estimates derived from the UK rain gauge network. The CHESS data set is also gridded (1 km2) and contains climate data from which potential evapotranspiration estimates are computed using the Penman–Monteith equation. We aggregated daily potential evapotranspiration estimates to monthly sums. For both gridded data sets (GEAR and CHESS), grid cells were extracted corresponding to groundwater well locations. The 1 km2 gridded precipitation and potential evapotranspiration sums were compared to monthly groundwater observations of the same location. This point-scale comparison relies on the assumption that the influence of precipitation is largest surrounding a groundwater monitoring site (Bloomfield and Marchant, 2013; Bloomfield et al., 2015; Li and Rodell, 2015; Kumar et al., 2016).
Precipitation estimates were converted into standardised precipitation indices (SPIs) following the method of McKee et al. (1993). A gamma distribution was fitted to precipitation estimates, but alternative distributions were also tested (normal, Pearson III, and logistic) (Stagge et al., 2015). Considering the use of SPIs to account for delayed recharge, a large range of accumulation periods of precipitation (1 to 100 months) was calculated in order to find the optimal correlations between precipitation and groundwater time series. For this particular use of the SPI, the “best” fitting distribution varies (Svensson et al., 2017). Alternative distributions showed minimal differences from the gamma distribution in the computed correlations between standardised precipitation and groundwater time series; hence, we decided to use the gamma distribution.
Groundwater level time series were obtained from the national groundwater database in the UK, which contains time series for both reference wells and regular monitoring wells. A total of 209 wells (or sites) have been included in the analysis, of which 39 are reference sites and 170 regular monitoring sites. Reference sites were taken to represent near-natural conditions in the 30 year time period. These sites were selected from the index and observation wells listed in the UK Hydrometric Register (Marsh and Hannaford, 2008) and have previously been assessed by the British Geological Survey. Well descriptions indicate near-natural conditions or possible (intermittent) influence of groundwater abstraction. Wells selected for this study are categorised as near natural, reflecting regional variation in groundwater levels with minimal abstraction impacts. This selection of reference wells includes 30 wells in the chalk and nine wells in the Permo–Triassic sandstone. Regular monitoring sites are part of the monitoring network in the four water management units. Initially, 660 monitoring sites were considered for the regional groundwater drought analysis that was truncated to the 30 year analysis period and quality checked. Unrealistic observations were cross-validated with available meta-data and, if unexplained, removed from the data set. Missing data were linearly interpolated from the last observation to the next observation in case of short sequences of missing data (less than 6 months) (Tallaksen and Van Lanen, 2004; Thomas et al., 2016). Sites with records containing longer sequences of missing data were removed from the data set prior to the analysis, leaving a total of 170 (out of the original 660) groundwater level time series that were deemed of good quality, of which 38 were located in Lincolnshire, 45 in Chilterns, 36 in Midlands, and 51 in Shropshire.
All groundwater level time series were standardised into the Standardised Groundwater level Index (SGI) (Bloomfield and Marchant, 2013), which is briefly explained here. Monthly groundwater observations were grouped for each calendar month, and within each group observations were ranked and assigned a SGI value based on an inverse normal cumulative distribution of the data. No distribution was fitted, but SGI values were assigned to monthly observations, accounting for seasonal variation within the calendar year. The resulting SGI time series represent extremely low to below-normal (−3 < SGI < 0) and above normal to extremely high (0 > SGI > 3) monthly groundwater levels in the groundwater time series. Groundwater level observations are physically constrained by the length of the screened interval of the borehole. Therefore, the lowest SGI value might indicate that groundwater levels fell below the borehole screen, and the highest SGI value can indicate that groundwater levels reached the surface.
Qualitative information about groundwater use was provided for each water management unit by the national regulator (Environment Agency (EA) in England). Detailed maps were made available regarding the purpose and recent (dated at 2015) licensed abstraction volumes (see Fig. S1 in the Supplement). In addition, reports describing the EA's regional groundwater resource models and location-specific groundwater studies were used as reference material to indicate changes in groundwater use (Table 1).
3.2 Methods
The developed methodological framework consists of two approaches for investigating the impact of groundwater use on groundwater droughts. The first approach uses a regional near-natural groundwater drought reference based on reference sites. SGI time series of reference sites are clustered to identify common spatial and temporal patterns in near-natural groundwater levels in the two aquifers. Reference sites are thereby taken to represent regional groundwater variation that is primarily driven by climate and hydrogeology. Then, monitoring wells in each of the four water management units were paired to these regionally coincident clusters of reference wells (Fig. 1), and human-influenced sites are identified using the correlation between SPI and SGI. Drought occurrence, duration, and magnitude in monitoring wells were compared with those in paired reference clusters to assess the potential effects of abstraction on groundwater droughts. The second approach consisted of a groundwater trend test that quantified long-term trends as a consequence of the continuous impact of groundwater use. The spatial distribution of identified trends was evaluated according to the location of annual abstraction licenses, changes in water use, and hydrogeological features in the water management units.
3.2.1 Time series clustering
Three hierarchical clustering methods (single linkage, complete linkage, and Ward's minimum) were tested to find the most suitable and least biased approach for clustering SGI time series of the reference sites (Haaf and Barthel, 2018). In each method, Euclidean distance was used as measure of similarity, and cluster compositions that showed the least overlap between clusters were selected (Aghabozorgi et al., 2015). Criteria for selected clusters were set by previous studies (chalk aquifer only) and known hydrogeological differences in the aquifers. For both aquifers, the minimum number of hydrograph clusters was sought that produced spatially coherent clusters.
3.2.2 Correlation between SPIQ–SGI
Under near-natural conditions, the optimum correlation between standardised precipitation and groundwater indices (SPIQ–SGI) is generally high in unconfined aquifers (Bloomfield and Marchant, 2013). Anomalies in precipitation propagate with a relatively constant delay in recharge to the groundwater, which is due to subsurface controls on recharge, the antecedent condition of the land surface, and non-linear response of groundwater systems (Eltahir and Yeh, 1999; Peters et al., 2006; Tallaksen et al., 2009). This constant delay is included in the calculated SPIQ–SGI correlation by the optimal precipitation accumulation period that represents a long-term relationship for a certain site, as both the SPI and SGI were calculated for a continuous 30 year period, including all seasons and both anomalously dry and wet periods.
The SPIQ–SGI correlation can be reduced either when groundwater level response becomes disconnected from driving precipitation under confined conditions (Bloomfield et al., 2015; Kumar et al., 2016; Lee et al., 2018) or when groundwater abstraction changes groundwater storage and levels independent from driving precipitation (Bloomfield et al., 2015; Lorenzo-Lacruz et al., 2017; Haas and Birk, 2017). In this study, the impact of confined conditions on reducing SPIQ–SGI correlations is expected to be minimal, as only a small selection of the chalk sites are located in the semi-confined chalk in south Lincolnshire (Table 1). On the other hand, the impact of dynamic groundwater use on SPIQ–SGI correlations is expected to be significant. Long-term changes in groundwater use in the UK resulted in a spatially heterogeneous pattern of irregular, decreasing, or increasing influence of abstraction on groundwater storage. Groundwater use increased, for example, until the late 1980s and reduced afterwards with a large redistribution of where water is taken from to minimise the impact on low flows (Ohdedar, 2017).
The presence or absence of human influence on groundwater observations in the water management units was determined on the basis of the SPIQ–SGI in each near-natural reference cluster. For each cluster, the lowest SPIQ–SGI correlation was used as a threshold to differentiate long-term influenced from uninfluenced groundwater monitoring sites. Monitoring wells with high or higher SPIQ–SGI correlations than the near-natural reference are regarded as (on average over the 30 year investigation period) uninfluenced, and those with lower correlations as potentially human influenced. An illustrated example is provided in Fig. S2, showing the SGI time series of a near-natural reference site and three groundwater monitoring sites. Statistical differences between the categorised uninfluenced and influenced sites were computed using a non-parametric Wilcox test.
3.2.3 Drought analysis
Groundwater droughts were defined using a threshold approach applied to SGI time series. Groundwater droughts are considered to occur when the SGI value is at or below −0.84, which corresponds to a 80th percentile or a “once every 5 year drought event” (Yevjevich, 1967; Tallaksen and Van Lanen, 2004; Tallaksen et al., 2009). Drought characteristics were compared between near-natural reference clusters and monitoring sites focusing on drought occurrence, frequency, duration, and magnitude.
3.2.4 Trend test
The second approach consisted of a monotonic trend test applied to all monitoring sites, given the previously identified trends in human-modified groundwater systems (Thomas and Famiglietti, 2015; Sadri et al., 2016; Bhanja et al., 2017; Pathak and Dodamani, 2018). This trend test contributes to the first approach as the SGI and SPIQ–SGI correlation analysis do not specifically account for trends in groundwater time series that could result in significant trends going unnoticed. Hence, an additional trend test was introduced to compare trends in annual (averaged for each calendar year) groundwater levels to climate data (precipitation and evapotranspiration) that were extracted for grid cells corresponding to groundwater well locations from the GEAR and CHESS data sets (Tanguy et al., 2016; Robinson et al., 2016).
Trends were quantified by the trend Z value, showing positive or negative deviations from the null hypothesis (no trend). Positive or negative Z values indicated increasing or decreasing trend directions. values over (α = 0.01) were considered significant. Trends in groundwater level time series were tested using a modified Mann–Kendall trend test (Mann, 1945; Kendall, 1948), which includes a modification developed by Yue and Wang (2004) to account for significant auto-correlation in the annual groundwater data (Hamed, 2008). Trends in climate time series were also calculated from annual data using a standard Mann–Kendall trend test.
4.1 Near-natural groundwater reference clusters
The near-natural groundwater reference clusters, based on SGI clusters of the reference wells and the clustering criteria, were defined by Ward's minimum clustering technique, showing the least overlap between clusters of the three tested clustering techniques (Fig. S3). A total of eight clusters are identified, of which five clusters are located in the chalk (C1–5) and three in the Permo–Triassic sandstone (S1–3; Fig. 1). The spatial distribution of chalk clusters (C1, C3, and C4) is consistent with clusters identified by Marchant and Bloomfield (2018). Two additional clusters are identified, of which one is located in East Anglia (five reference wells in C2) and one in southeast England (two wells in C5). The cluster dendrogram shows a small difference in the similarity between C4 and C5, which is located close to the coastline (cluster dendrogram result not shown; difference between C4 and C5 is shown in Fig. S3). C1 and C3 are coincident with water management unit 1 and 2, respectively, and are used as near-natural reference for monitoring sites in those units. In the Permo–Triassic sandstone aquifer, only one spatially coherent cluster (S2) is found when all nine SGI time series are clustered (Fig. 1). The cluster composition of the other two smaller clusters (S1 and S3) is not spatially coherent, and there is no evidence of previous clustering studies available that can confirm these two clusters. Hence, only S2 is used as near-natural reference for monitoring sites in water management units 3 and 4.
The optimal SPIQ–SGI correlations of near-natural wells are high on average (0.79), with a range of 0.66 to 0.89. These correlations are found using the optimal accumulation period, which accounts for a delay in recharge that is different for each reference cluster. High SPIQ–SGI correlations are found for both short and long accumulation periods, and there was no systematic relationship between the SPIQ–SGI correlation and the SPI accumulation period Q or SGI autocorrelation in the near-natural wells. C1 represents a relatively fast-responding section of the chalk and has a short Q of 12.6 ± 5.4 months. The Q of C2 and C3 is higher, respectively 18.2 ± 4.3 and 24 ± 8.6 months. This corresponds to the delay in groundwater recharge due to the Quaternary deposits present in these regions (Allen et al., 1997). In the southeast, the chalk is highly fractured, which is reflected by a short Q of 8 ± 2.2 months for C4 and C5. In the Permo–Triassic sandstone, the Q of S2 is 35 ± 4.5 months, which confirms a slow-responding groundwater system (Allen et al., 1997).
In the monitoring sites, the majority of the SPIQ–SGI correlations are as high as or higher than the minimum correlation of paired reference clusters. Hence, these monitoring sites are considered, on average, uninfluenced by abstraction. The percentage of uninfluenced sites varies between the water management units. The largest percentage is found in the Chilterns (71 %), followed by the Midlands (63 %), Shropshire (53 %), and Lincolnshire (31 %). Monitoring sites with a SPIQ–SGI correlation below the minimum correlation of the paired reference cluster are treated as, on average, influenced by abstraction.
The found optimal precipitation accumulation periods within the management units is variable and appears to be in part a function of aquifer depth and the local nature of aquifer confinement (Fig. S4). For example, shorter accumulation periods are found in shallow sections of the aquifer (east Shropshire and west Chilterns), and in outcrops (east Lincolnshire). Longer accumulation periods are found in deep sections of the Permo–Triassic aquifer (west Shropshire) and semi-confined sections of the Permo–Triassic (Midlands) and chalk aquifer (east Chilterns and southeast Lincolnshire).
4.2 Groundwater droughts
Groundwater droughts observed in the reference clusters reflect both spatial and temporal variation due driving precipitation and hydrogeology setting. In general, the four UK-wide droughts (1988–1993, 1995–1998, 2003–2006, and 2010–2012) are reflected in near-natural groundwater time series. Spatial patterns in driving precipitation, however, result in variable groundwater drought occurrence (Fig. 1). For example, in C1, groundwater levels are low in 2003–2006 but not below the drought threshold. In C2, groundwater levels are slightly lower, and a short drought event is observed in the SGI cluster mean. In C3–C5 and S2, however, the 2003–2006 drought event was a major drought event. Spatial variation in the hydrogeology also results in varying drought duration for the chalk clusters. In central England, longer drought durations are found in clusters C2 and C3. This region is partly covered by Quaternary deposits that delays recharge. Shorter (and more frequent) events are observed in C4 and C5, which are located in highly fractured chalk.
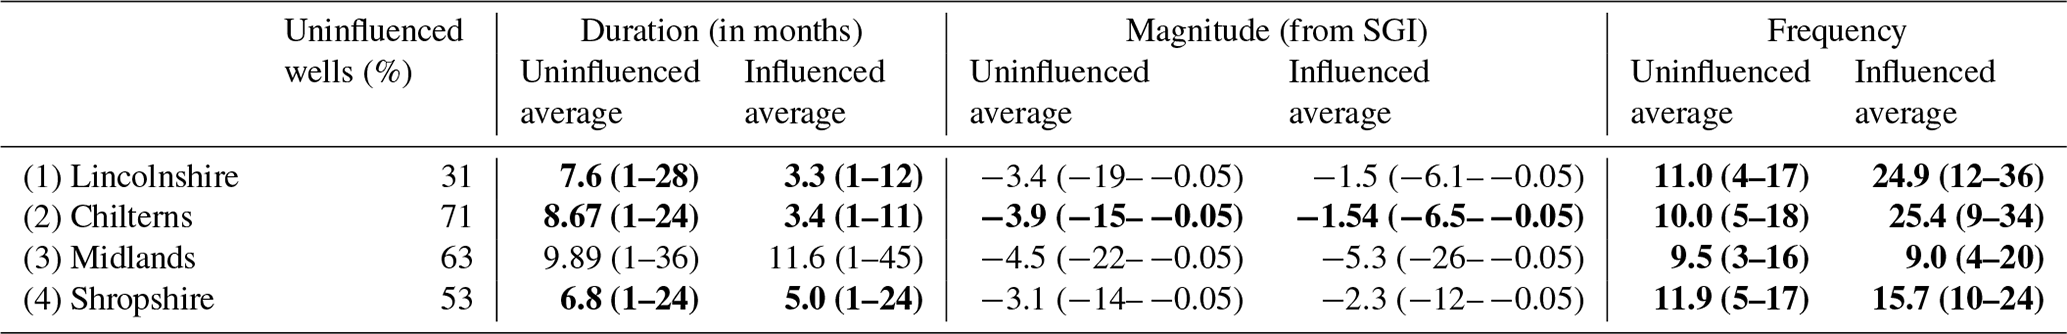
On a smaller scale in the water management units, average drought characteristics (duration in months, magnitude in accumulated SGI over the drought period, and frequency) for monitoring sites show differences due to abstraction influence, which we have classified in, on average, uninfluenced and influenced sites (Table 2). Shorter and less intense, but more frequent, drought events are observed in the influenced sites in Lincolnshire, Chilterns, and Shropshire. In these water management units, the difference in average drought duration and frequency between uninfluenced and influenced sites is significant. Droughts are observed twice as often in influenced compared to uninfluenced sites in Lincolnshire and Chilterns, although a smaller difference is found in Shropshire. The distribution of recorded drought frequency (Fig. S5) shows that the difference between, on average, uninfluenced and influenced sites is actually less pronounced in Lincolnshire and Shropshire. In the Midlands, the average drought duration of influenced sites exceeds the duration in uninfluenced sites. Longer and more intense groundwater droughts occurred less often in influenced sites, which is in contrast with the other water management units. The distribution of recorded drought frequency (Fig. S5) shows a majority of sites recording fewer droughts and some sites that record a higher frequency. On average, this results in a small difference between the influenced and uninfluenced sites.
Table 2Average drought characteristics (duration, magnitude, and frequency) of all monitoring sites in the four water management units. The 5th–95th percentile of the drought characteristics are in parentheses. Distribution plots for all drought characteristics can be found in Figs. S5–S7. The monitoring sites are separated using the lower limit of the cluster SPIQ–SGI into, on average, uninfluenced and influenced. Differences between the two groups are tested for significance using a Wilcox test. Tests for which the p<0.05 are indicated in bold.
Presented drought characteristics in Table 2 suggest that drought events vary significantly within and between water management units. These different drought events are shown in a combined time series plot (Fig. 2) capturing reference droughts and droughts recorded in monitoring sites showing drought occurrence, duration, and magnitude. Monitoring sites are sorted based on their SPIQ–SGI correlation (high to low). The cluster minimum SPIQ–SGI correlation is indicated with a dashed line, i.e. 0.75 for Lincolnshire, 0.71 in the Chilterns, and 0.69 in the Midlands and Shropshire. Below this minimum correlation, drought occurrence in uninfluenced sites aligns mostly with that of droughts in the reference clusters. Observed droughts in influenced sites (i.e. those with SPIQ–SGI correlations lower than the cluster minimum) are typically shorter, but drought events are of a lower magnitude in Lincolnshire, Chilterns, and Shropshire. The distribution of drought duration in Fig. S6 shows that the majority of these additional droughts is recorded in influenced sites compared to uninfluenced sites in Lincolnshire, Chilterns, and Shropshire (drought deficit distribution is shown in Fig. S7). Contrastingly, longer and more intense droughts are observed in all Midland sites in 1990–1995. Droughts observed in influenced sites are also longer in 1984–1986, 1997–2001, and 2005–2006 compared to the reference cluster and fewer droughts are observed in 2010–2012.
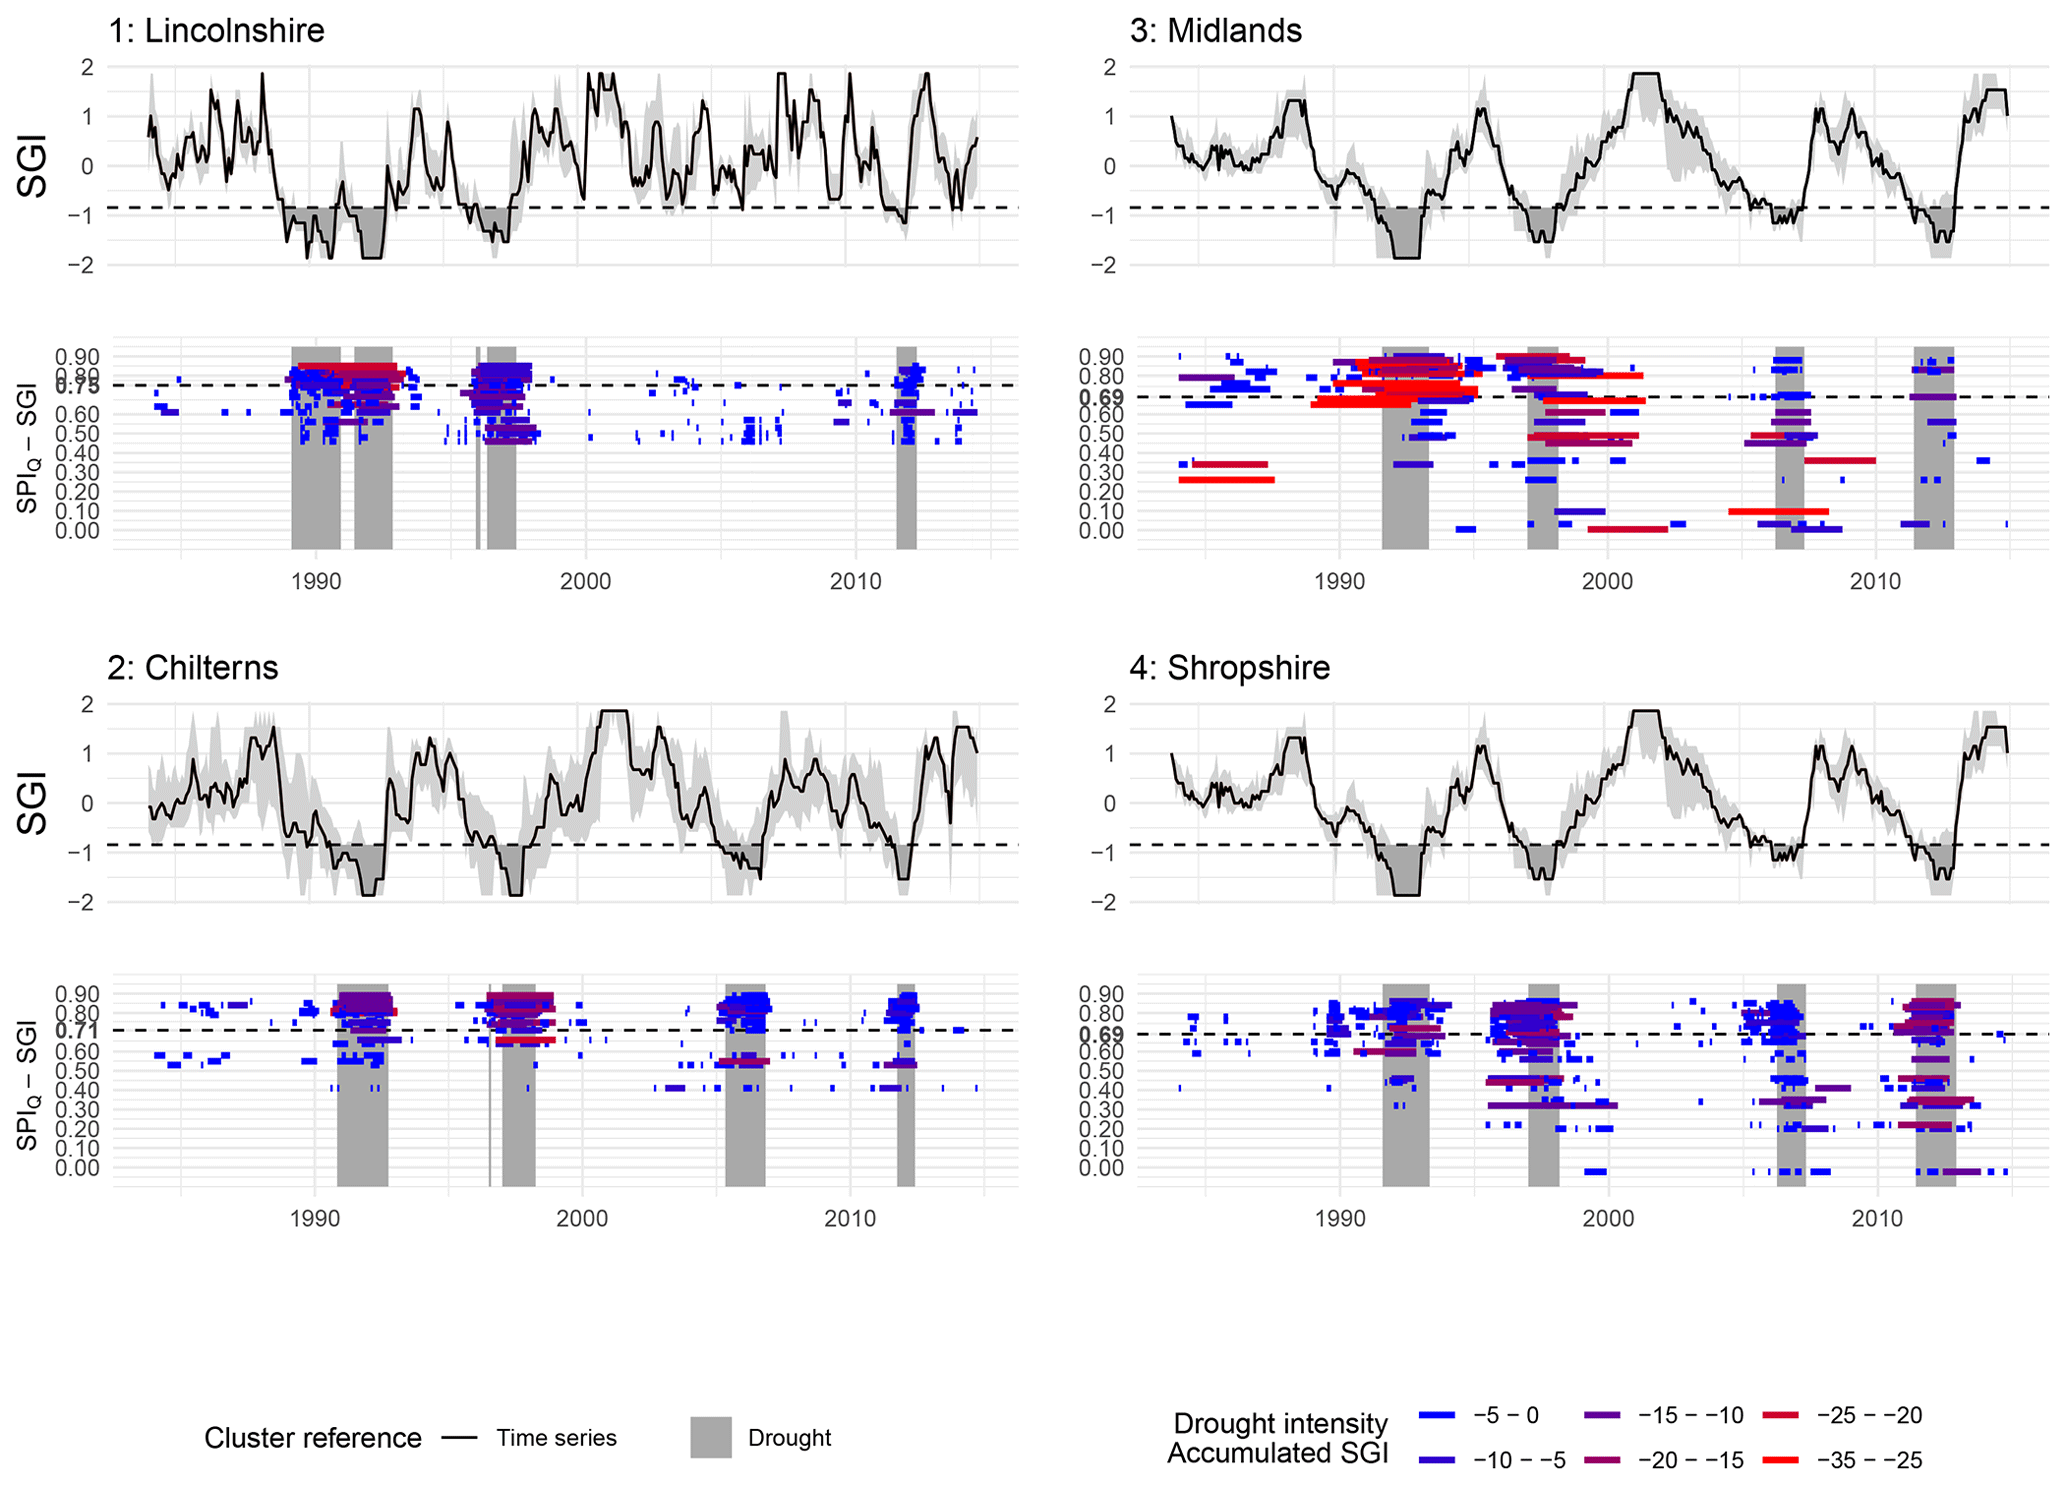
Figure 2Drought occurrence, duration, and magnitude shown for all four water management units: 1 – Lincolnshire, 2 – Chilterns, 3 – Midlands, and 4 – Shropshire. The top panel shows the SGI hydrograph of the reference cluster mean based on reference sites (see Fig. 1 for the locations of these clusters). The range of reference clusters is coloured in grey. The dotted line represents the drought threshold for the cluster mean, with shaded areas for the reference drought events. These reference drought events are also shown in long grey panels in the lower plot that shows the individual droughts as found in monitoring sites in each water management unit. The length of coloured bars indicates the drought duration, and the colour represents drought magnitude of each drought in a blue–red scale for accumulated SGI.
The additional events in influenced sites coincide with low SGI values in the reference wells that sometimes occur prior to a long drought event. For example, additional droughts are observed in 1984, 1995–1996, 2005–2006, and 2014 in Lincolnshire and in 1984–1986, 2004, and 2009–2010 in the Chilterns. In those periods, the reference cluster mean was below 0 but not below the drought threshold. In the case of 1995–1996, 2004, and 2009–2010, these additional drought events occurred prior to a long drought event. However, there was no consistent evidence found among the study areas in relation to the timing of these shorter drought events. In Lincolnshire, minor droughts occur more often during reference droughts compared to Chilterns and Shropshire, where more droughts are detected prior to reference droughts (Table S8). All minor droughts are shorter than the groundwater auto-correlation, suggesting that these minor droughts are less likely to be related to propagated precipitation deficits and more likely to be related to groundwater abstraction.
Drought descriptions in the literature show an increase in water demand during the 1995–1997, 2003–2006, and 2010–2012 drought (Walker and Smithers, 1998; Marsh et al., 2013; Durant, 2015). For example, Durant (2015) found that during the 1988–1993 drought event evapotranspiration was exceptionally high, and groundwater use increased. Impacts were mostly felt in the chalk, particularly in regions where groundwater is the principal source of water supply. An extreme rise in water use was also found during the 1995–1997 drought event, putting strain on the drinking water supply systems in northeast England (Walker and Smithers, 1998). Sections of the Permo–Triassic sandstone were amongst the worst affected, prolonging drought conditions until 1998 (Durant, 2015). During the 2003–2006 and 2010–2012 droughts, a sudden increase in groundwater use was found that was attributed to dry weather and hot summers (Marsh et al., 2007, 2013; Durant, 2015). Rey et al. (2017) reported low SPI3 values in the summer months for 1995, 1996, 2003–2006, and 2010/2011, highlighting exceptionally dry weather that led to surface water use restrictions prior to droughts to maintain low flows. Consequently, reduced surface water abstractions were replaced by groundwater for which use was rarely restricted (Rey et al., 2017), resulting in lowered groundwater levels that could also potentially aggravate groundwater droughts.
Over the whole investigation period, drought magnitude seems to be decreasing since the 1995–1997 drought event. Droughts observed in 2003–2006 and 2010–2012 are shorter and of lower magnitude than the 1995–1997 drought in most sites. This is seen most convincingly in Lincolnshire, Chilterns, and the Midlands, where the magnitude of droughts decreases dramatically over the 30 year time period. In Shropshire, this tendency is less strong, as the 2010–2012 drought was of a similar magnitude as the 1995–1997 drought.
4.3 Trends in groundwater
Significant trends in groundwater level have been detected in 38 % of all monitoring sites in the water management units. Of these 38 %, half of the trends are upward (positive) and the other half is downward (negative) trends (Fig. 3). Overall, upward trends are dominating (61 % of sites including significant and non-significant trends), indicating a sustained rise in the 30 year groundwater level time series. Fewer (39 % including significant and non-significant) downward trends are detected, indicating sustained lowering of groundwater levels. The presence of these significant trends in groundwater is notable given the weak, non-significant, range of trend Z values in the 30 year precipitation and potential evapotranspiration data (P: 0.75–1.53; PET: Z=0–0.65).

Figure 3Trend values for monitoring wells in the four water management units (1 – Lincolnshire, 2 – Chilterns, 3 – Midlands, and 4 – Shropshire). The red and blue diamonds indicate the positive or negative Z values for the modified Mann–Kendall trend test for each monitoring well. Z values over indicate a significant trend in the 30 year (1984–2014) groundwater level time series.
The direction and spatial coherence of trends in groundwater show different patterns within the water management units (Fig. 3). In the chalk water management units, positive trends dominate. In Lincolnshire, five out of the total of 25 positive trends are significant, compared to three out of 32 in Chilterns. There are fewer negative trends detected in both water management units, but more of these are significant with, respectively, seven out of 13 in Lincolnshire and four out of 12 in Chilterns. In Lincolnshire, sites with a negative trend are, for all but one, located in the semi-confined chalk. This is in sharp contrast with the semi-confined chalk in Chilterns, where mainly (significant) positive trends are found. In the Permo–Triassic sandstone water management units, more significant trends are detected compared to the chalk (63 % in the Midlands and 43 % in Shropshire). In the Midlands, more positive than negative trends are detected. In total, 17 out of 25 positive trends are significant, compared to six out of 11 significant negative trends. Negative trends are mainly found in the centre of the water management unit. Positive trends are found north and south of that. In Shropshire, more negative than positive trends are detected. A total of 31 sites have a negative trend, of which 15 are significant. These trends are mainly detected in the west of the water management unit. Positive trends are mainly located in the east in between two fault lines (Ollerton and Childs Ercall fault; Voyce, 2008). A total of seven of these positive trends (from 20 in total) are significant. In Fig. 3, the maximum licensed abstraction volumes are also shown. These licenses show in which aquifer sections groundwater is primarily abstracted. However, without a record of the actual use of these licenses or the change of licensed abstractions over time, it is impossible to directly relate detected trends to these abstraction locations.
Presented results of the UK case study show that groundwater droughts in the chalk and Permo–Triassic sandstone aquifer are primarily driven by precipitation and modified by the hydrogeology setting and groundwater use. The precipitation gradient was the primary driver for regional variation in near-natural groundwater droughts in 1989–1992 and 2003–2006, which is confirmed by the work of Bryant et al. (1994) and Marsh et al. (2007). This explains the absence of a groundwater drought in 2003–2006 in the northern chalk (C1), compared to the southern chalk (C2–C5). Regional variation in near-natural droughts within the different hydrogeological units was linked to the hydrogeological setting as the accumulation period varied in each reference cluster. These accumulation periods align with previous findings of Bloomfield and Marchant (2013). On a smaller scale, accumulation periods varied gradually within the water management units as a function of aquifer depth and confinement of the aquifer, which was also found by Kumar et al. (2016), Van Loon et al. (2017), and Haas and Birk (2017). The relation between the accumulation period and groundwater drought duration, as observed in the reference clusters, corresponds to that of groundwater memory and drought duration for near-natural observations (Bloomfield and Marchant, 2013).
The impact of groundwater use on groundwater droughts is detected in a subset of monitoring sites in all four water management units. This subset often represents a minority of monitoring sites. Two patterns are found that illustrate an asymmetric impact of water use on groundwater droughts. The first pattern (found in three water management units) is that of more, but shorter and less intense, droughts that are primarily observed in the, on average, influenced sites compared to uninfluenced sites. The second pattern (found in one water management unit) shows the opposite impact with fewer, but longer, groundwater droughts in, on average, influenced compared to uninfluenced sites. Both patterns are inferred as a direct consequence of groundwater use in the water management units.
The first pattern, apparent in Lincolnshire, Chilterns, and Shropshire, shows an increase in short drought events in influenced sites that sometimes occurs before a major drought event or during an unusually dry period that results in a rapid increase in both surface water and groundwater use (Walker and Smithers, 1998; Marsh et al., 2013; Durant, 2015) and/or complementary groundwater use due to surface water use restrictions (Rey et al., 2017; Rio et al., 2018). We see the effect of this local increase in water use in our data in the temporarily lowered groundwater levels resulting in additional drought events. The majority of these events occur in influenced sites, but some of the (on average) uninfluenced sites also show minor droughts. Given the high correlation in these uninfluenced sites, the minor droughts seem not to disturb the long-term average correlation. The short duration and low intensity of these additional droughts suggests that local groundwater levels recover quickly. Whether groundwater was removed from groundwater storage or capture (impacting environmental flows) remains unknown (Konikow and Leake, 2014), although the short duration and rapid recovery suggest that an equilibrium was established soon after the abstractions. Regional groundwater model studies show that the annual average actual abstractions are smaller than modelled recharge for Lincolnshire, Chilterns, and Shropshire. The long-term ratio of abstraction to recharge is 0.67 (Hutchinson et al., 2012), 0.5 (Environment Agency, 2010), and 0.5 (Shepley and Streetly, 2007) for the three water management units, respectively. Even though these ratios are calculated using data from different regional groundwater models, the long-term balance between groundwater use and recharge is positive, which might be related to the overall reduced drought duration and magnitude observed in influenced sites.
The second pattern, apparent in the Midlands, shows intensified groundwater droughts that occur less often. Most of the intensified drought events are observed prior to 2001, with lengthened droughts in 1984–1986, 1990–1995, and 1997–2001. Lengthening of droughts is a common phenomenon in overused groundwater systems (Custodio, 2002). In the Midlands, prior to 2000, groundwater abstraction exceeded modelled recharge by 25 % (Shepley et al., 2008). The over-abstraction resulted in lower stream flow in the area (Shepley et al., 2008), suggesting that water is removed from capture (Konikow and Leake, 2014). Reforms of water allocations in 2000 have reduced groundwater abstractions to meet the long-term water balance. These long-term changes in groundwater abstractions match with the majority of significant positive groundwater trends in the Midlands.
Long-term influence of groundwater use was inferred from identified trends in the groundwater level time series. Large spatial differences are found in the direction of groundwater trends in both aquifers, while trends in precipitation and potential evapotranspiration are negligible. Positive groundwater trends dominate in the water management units, which may be a result of the reduction in groundwater use since 1984 (start of the investigation period of this study). A gradual or immediate reduction in water use can restore the balance between groundwater use and recharge (Gleeson et al., 2010; Konikow, 2011), although it can take decades before an equilibrium is reached (Gleeson et al., 2012). This slow rise or recovery to pre-development groundwater levels is not specifically included in the classification of influenced and uninfluenced monitoring sites, as a (slow) rise in groundwater level might not disturb the propagation of precipitation anomalies. SGI and SPI anomalies could, in this case, synchronise well, resulting in a high linear correlation, while a long-term positive trend is observed as groundwater levels slowly recover. Over longer time periods, these rising groundwater levels could also buffer precipitation anomalies. In our results, groundwater droughts show an overall reduction in magnitude and duration from 1984 to 2014. Most intense droughts are found during in the first two decades (1984–2004) of the time period. Even though this coincides with a reduction in groundwater use, more research is required to distinguish climate-driven droughts from human-modified droughts.
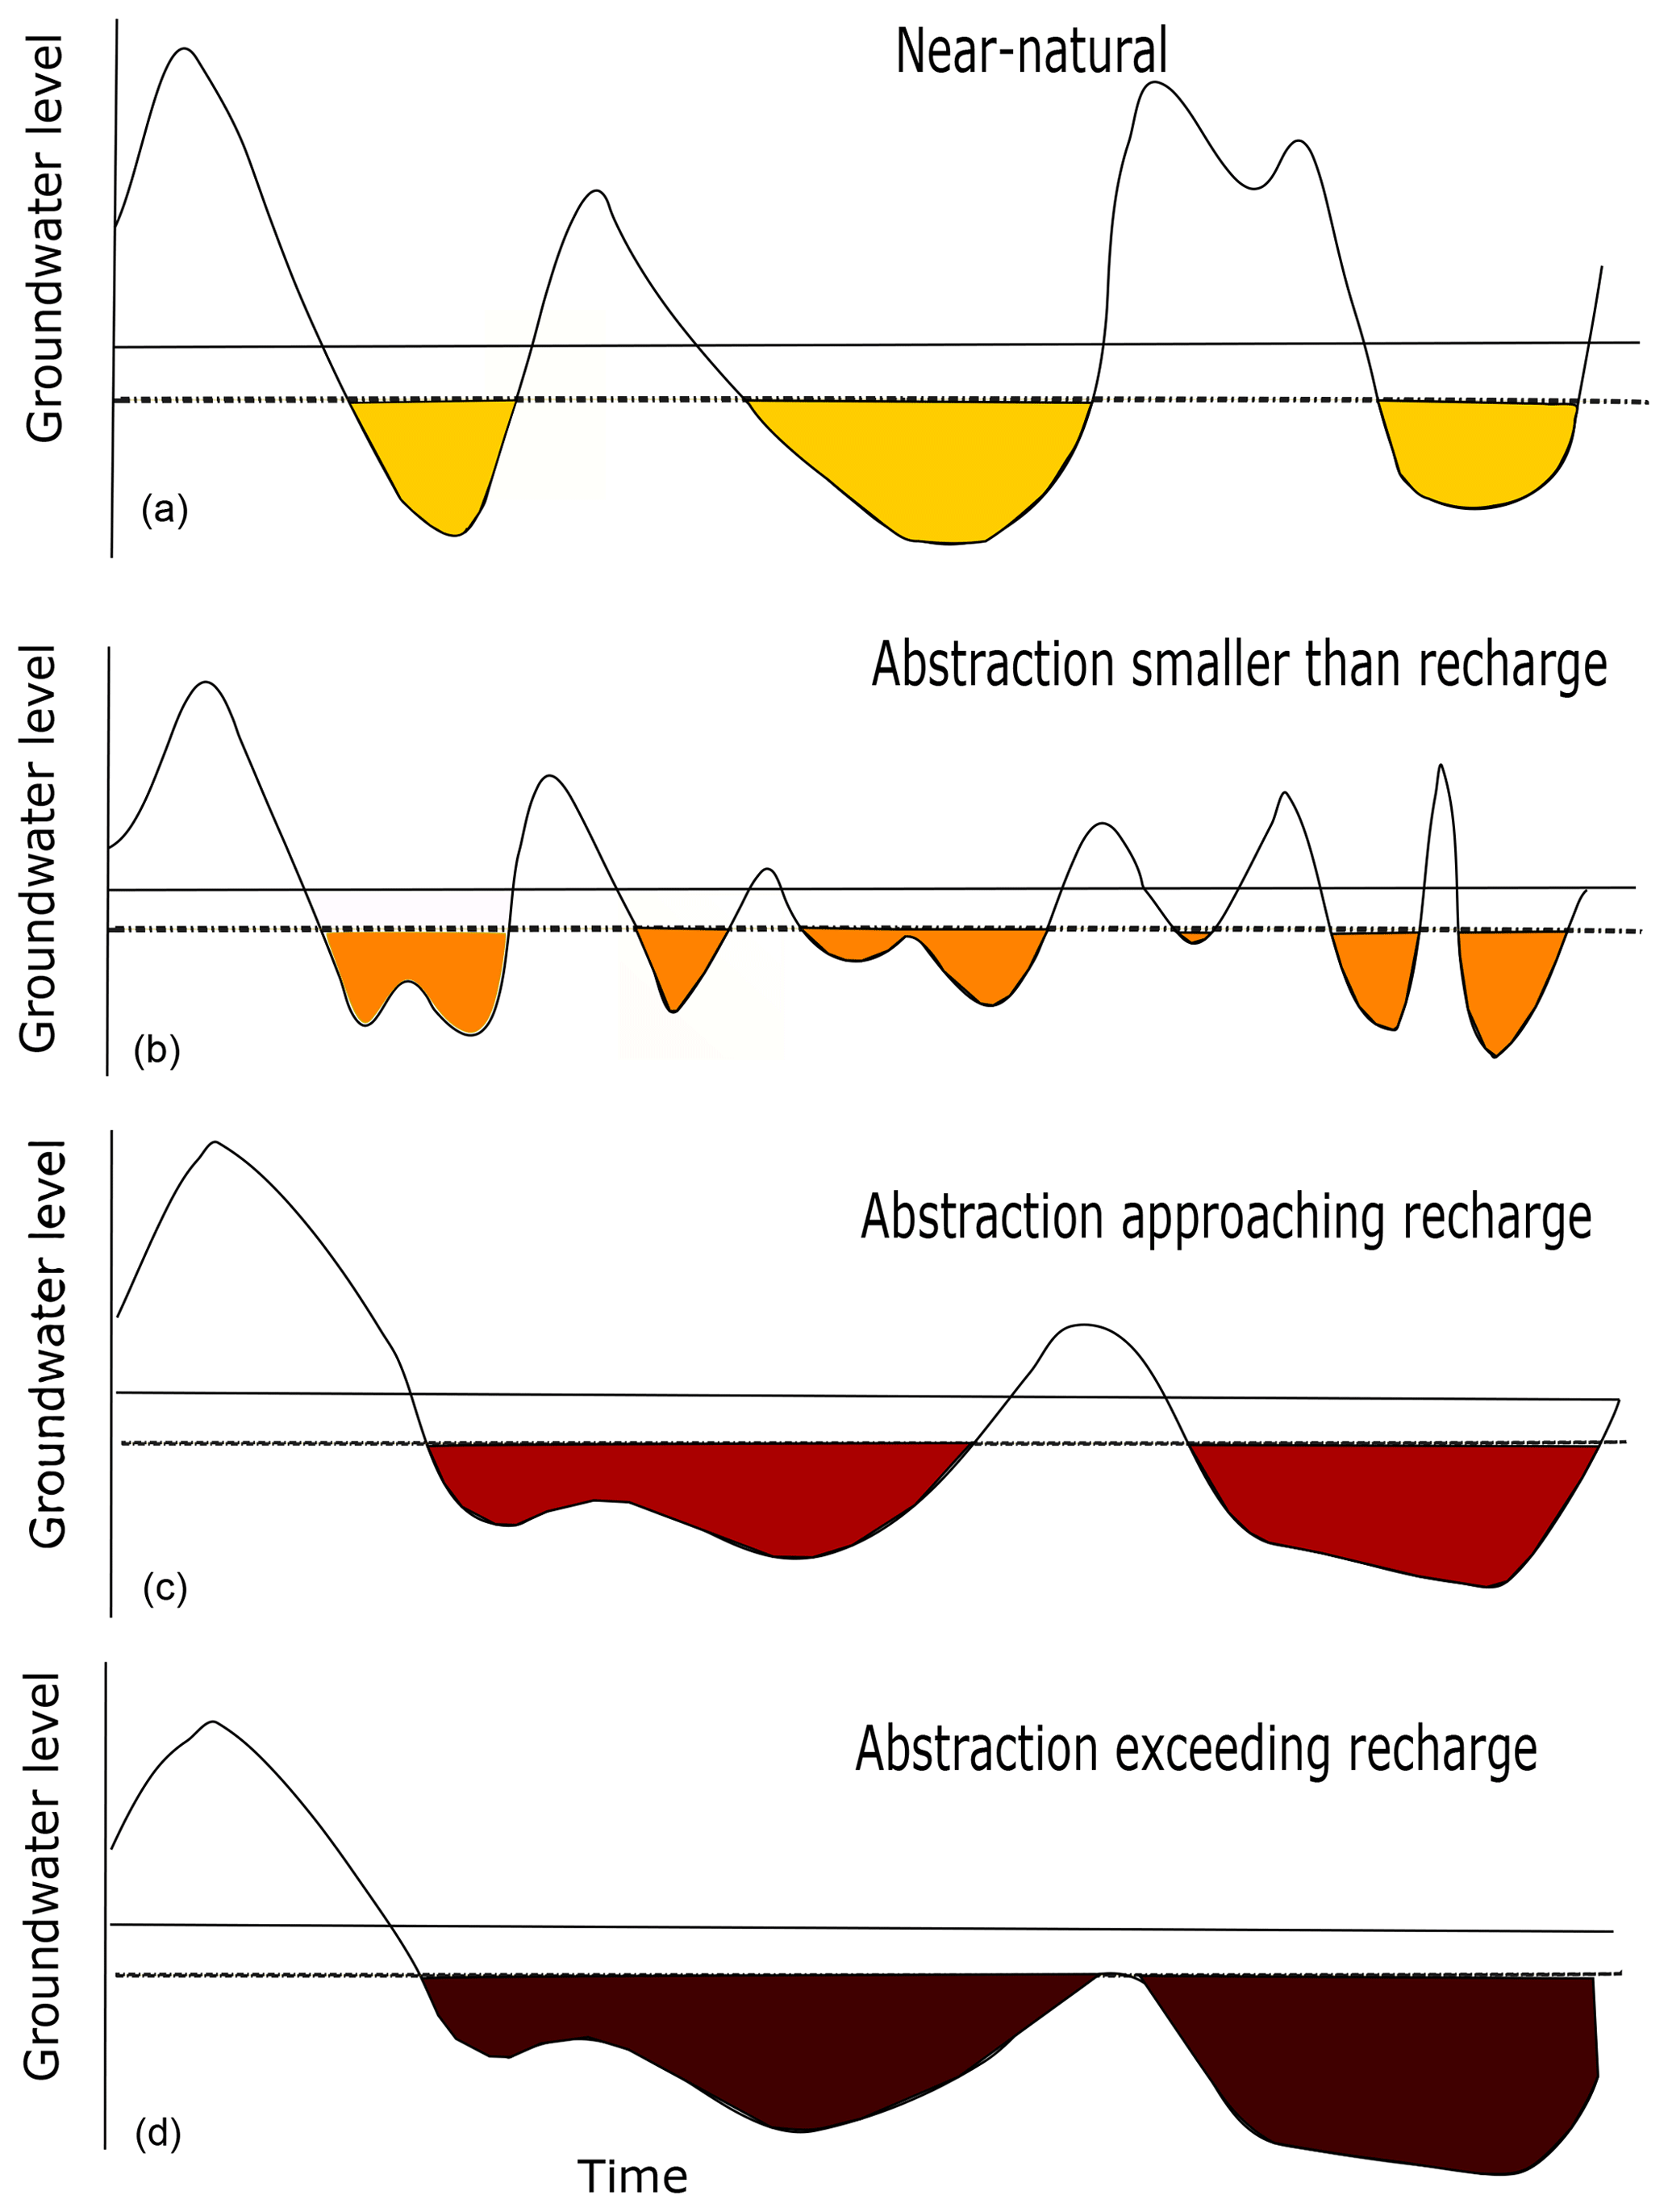
Figure 4Conceptual figure summarising near-natural groundwater droughts (a) and three human-modified groundwater droughts with an increasing intensity of the impact of groundwater use. Panel (a) shows an example of near-natural groundwater droughts, followed by human-modified droughts when annual average abstractions are smaller than the annual average groundwater recharge in (b). This has been identified in the three water management units in the UK. Panel (c) illustrates modified groundwater droughts when annual average abstractions approach recharge (identified in one water management unit in the UK), and (d) shows extreme groundwater drought conditions when average annual abstractions exceed recharge.
A conceptual typology is presented in Fig. 4, summarising near-natural drought, two types of human-modified droughts as found in the water management units, and an extreme condition of human-modified drought. Under near-natural conditions, groundwater droughts occur, given the climate forcing and hydrogeological setting (see Fig. 4a). In human-modified environments, the impact of groundwater use on groundwater droughts is asymmetric. In regions where the annual average groundwater use is smaller than the annual average recharge, the frequency of groundwater droughts increases, resulting in shorter events of a lower magnitude (see Fig. 4b). This corresponds to the “dynamic sustainable range” as presented in the conceptual model of Gleeson et al. (2020). In regions where the annual average groundwater use approaches annual average recharge, the opposite is found with less, but prolonged droughts of higher magnitude and duration (see Fig. 4c), corresponding to strategic aquifer depletion when meeting the dynamic sustainable range over a long timescale (Gleeson et al., 2020). Figure 4d shows the extreme conditions of groundwater depletion, in which groundwater droughts are not recovering by the average annual recharge, and groundwater levels tend to fall consistently. These extreme conditions are not identified in the UK, but the heavily intensified and lengthened droughts are found in California (He et al., 2017), Australia (Leblanc et al., 2009), Spain (Van Loon and Van Lanen, 2013), Bangladesh (Mustafa et al., 2017), and India (Asoka et al., 2017).
Further research is required to analyse the modifying effects on droughts of a change in water use over time. In this study, we have investigated the overall long-term impact of groundwater use using monotonic trends in groundwater. However, a different methodology is required to evaluate the impact of new water regulations on groundwater droughts (Bhanja et al., 2017). For example, an observation-modelling or conceptual-modelling approach can be used to differentiate pre- and post-regulation groundwater droughts (Van Loon et al., 2016b; Kakaei et al., 2019; Liu et al., 2016). This future modelling work could also provide context for long-term water management effects, natural variability, and non-stationary effects of anthropogenic climate change (specifically warming) on changes in groundwater drought characteristics (Bloomfield et al., 2019).
Further applications of this study could be beneficial for water regulators and scientists alike as the presented conceptual typology can be used to investigate the impact of groundwater use without having to obtain time series of actual groundwater abstractions. The developed methodology shows how qualitative information on groundwater use and annual long-term averages aid in obtaining a better understanding of the asymmetric impact of groundwater use on groundwater droughts. Considering the large-scale modification of the hydrological cycle and the consequences for droughts (Van Loon et al., 2016a), it is important to further this approach and investigate the sustainable use of groundwater resources (Gleeson et al., 2020).
The impact of groundwater use on groundwater droughts is investigated based on a comparison of potentially influenced groundwater monitoring sites and near-natural reference sites in the UK. Results show that long-term groundwater use has an asymmetric impact on groundwater droughts for a subset of influenced groundwater monitoring sites in water management units in the UK. A conceptual typology summarises these different patterns in groundwater drought occurrence, duration, and magnitude. The first type (identified in three water management units) shows an increase in groundwater droughts with a low magnitude, of which the timing sometimes coincides with periods of a high water demand. This is found in three water management units where the long-term water balance is positive and annual average groundwater abstractions are less than groundwater recharge. The second type is marked by lengthened, more intense groundwater droughts. This is found in one water management unit where annual average groundwater abstractions temporarily exceeded recharge. The balance between long-term groundwater use and recharge seems to explain the asymmetric impact of groundwater use on groundwater droughts. However, more research is required to investigate the impact of changes in water use. During the period of investigation, regulated groundwater abstractions have reduced, and our results show a majority of rising groundwater trends based on 30 years of data. Further research could potentially indicate how droughts are affected by these changes in water use.
In conclusion, this study presents a conceptual typology for analysing groundwater droughts under human-modified conditions. We found that human-modified droughts differ in frequency, duration, and magnitude, depending on the long-term balance between groundwater use and recharge. This highlights the relation between short-term and long-term groundwater sustainability.
The code for the two presented approaches is available upon request.
The raw groundwater time series and abstraction locations can be obtained via the Environment Agency. Standardised groundwater level time series are available upon request from the associated Environment Agency office.
The supplement related to this article is available online at: https://doi.org/10.5194/hess-24-4853-2020-supplement.
DW, AVL, BP, and DH conceived and designed the study. DW performed the analysis and wrote the paper, supervised by AVL, BP, DH. All authors contributed to the paper.
The authors declare that they have no conflict of interest.
We would like to thank Richard Morgan and Catriona Finch for providing data and offering their valuable feedback in the initial stages of this study, and Michael Kehinde, Vicky Fry, Alex Chambers, and Kevin Voyce for providing the groundwater monitoring data and background material. The study has benefited from valuable discussions during meetings and workshops with the “Drought in the Anthropocene” working group of the International Association of Hydrological Sciences (IAHS) Panta Rhei network, and we would like to thank Henny Van Lanen in particular. We also thank the editor and two anonymous reviewers for their constructive comments. Doctoral training and financial support was provided by CENTA NERC as well as BGS. John P. Bloomfield publishes with the permission of the director of the British Geological Survey (NERC; UKRI).
This research has been supported by the NERC Environmental Research Centre as part of CENTA NERC and BGS CASE studentship (grant nos. NE/lL002493/1 and GA/16S/023).
This paper was edited by Xing Yuan and reviewed by two anonymous referees.
Aghabozorgi, S., Shirkhorshidi, A. S., and Wah, T. Y.: Time-series clustering – A decade review, Inform. Syst., 53, 16–38, 2015. a
AghaKouchak, A.: Recognize anthropogenic drought, Nature, 524, 409–411, 2015. a
Allen, D., Brewerton, L., Coleby, L., Gibbs, B., Lewis, M., MacDonald, A., Wagstaff, S., and Williams, A.: The physical properties of major aquifers in England and Wales, British Geological Survey, Keyworth, Nottingham, 1997. a, b, c, d, e, f
Asoka, A., Gleeson, T., Wada, Y., and Mishra, V.: Relative contribution of monsoon precipitation and pumping to changes in groundwater storage in India, Nat. Geosci., 10, 109–117, 2017. a
Bhanja, S. N., Mukherjee, A., Rodell, M., Wada, Y., Chattopadhyay, S., Velicogna, I., Pangaluru, K., and Famiglietti, J. S.: Groundwater rejuvenation in parts of India influenced by water-policy change implementation, Sci. Rep.-UK, 7, 7453, https://doi.org/10.1038/s41598-017-07058-2, 2017. a, b
Bloomfield, J.: Characterisation of hydrogeologically significant fracture distributions in the Chalk: an example from the Upper Chalk of southern England, J. Hydrol., 184, 355–379, https://doi.org/10.1016/0022-1694(95)02954-0, 1996. a
Bloomfield, J. P., Brewerton, L. J., and Allen, D. J.: Regional trends in matrix porosity and dry density of the Chalk of England, Q. J. Eng. Geol. Hydroge., 28, S131–S142, https://doi.org/10.1144/GSL.QJEGH.1995.028.S2.04, 1995. a
Bloomfield, J. P. and Marchant, B. P.: Analysis of groundwater drought building on the standardised precipitation index approach, Hydrol. Earth Syst. Sci., 17, 4769–4787, https://doi.org/10.5194/hess-17-4769-2013, 2013. a, b, c, d, e, f, g
Bloomfield, J. P., Marchant, B. P., Bricker, S. H., and Morgan, R. B.: Regional analysis of groundwater droughts using hydrograph classification, Hydrol. Earth Syst. Sci., 19, 4327–4344, https://doi.org/10.5194/hess-19-4327-2015, 2015. a, b, c, d
Bloomfield, J. P., Marchant, B. P., and McKenzie, A. A.: Changes in groundwater drought associated with anthropogenic warming, Hydrol. Earth Syst. Sci., 23, 1393–1408, https://doi.org/10.5194/hess-23-1393-2019, 2019. a
Bryant, S., Arnell, N., and Law, F.: The 1988–92 drought in its historical perspective, Water Environ. J., 8, 39–51, 1994. a
Chang, T. and Teoh, C.: Use of the kriging method for studying characteristics of ground water droughts, Water Resour. Bull., 31, 1001–1007, 1995. a
Christian-Smith, J., Levy, M. C., and Gleick, P. H.: Maladaptation to drought: a case report from California, USA, Sustain. Sci., 10, 491–501, https://doi.org/10.1007/s11625-014-0269-1, 2015. a
Custodio, E.: Aquifer overexploitation: what does it mean?, Hydrogeol. J., 10, 254–277, https://doi.org/10.1007/s10040-002-0188-6, 2002. a, b
Cuthbert, M. O.: An improved time series approach for estimating groundwater recharge from groundwater level fluctuations, Water Resour. Res., 46, W09515, https://doi.org/10.1029/2009WR008572, 2009. a
de Graaf, I. E., Gleeson, T., van Beek, L. R., Sutanudjaja, E. H., and Bierkens, M. F.: Environmental flow limits to global groundwater pumping, Nature, 574, 90–94, 2019. a
Döll, P., Hoffmann-Dobrev, H., Portmann, F., Siebert, S., Eicker, A., Rodell, M., Strassberg, G., and Scanlon, B.: Impact of water withdrawals from groundwater and surface water on continental water storage variations, J. Geodyn., 59, 143–156, https://doi.org/10.1016/j.jog.2011.05.001, 2012. a
Döll, P., Müller Schmied, H., Schuh, C., Portmann, F. T., and Eicker, A.: Global-scale assessment of groundwater depletion and related groundwater abstractions: Combining hydrological modeling with information from well observations and GRACE satellites, Water Resour. Res., 50, 5698–5720, https://doi.org/10.1002/2014WR015595, 2014. a
Downing, R. A., Price, M., and Jones, G.: The hydrogeology of the Chalk of north-west Europe, Clarendon Press, Oxford, 1993. a
Durant, M.: Description of groundwater droughts in the UK: 1890 to 2015, British Geological Survey, Nottingham, UK, OR/15/007, 1–52, 2015. a, b, c, d, e, f
Eltahir, E. A. B. and Yeh, P. J. F.: On the asymmetric response of aquifer water level to floods and droughts in Illinois, Water Resour. Res., 35, 1199–1217, https://doi.org/10.1029/1998WR900071, 1999. a, b
Environment Agency: Vale of St. Albans Numerical Groundwater Model Final Report, Tech. rep., Hatfield, 2010. a, b
Environment Agency: Managing water abstraction, Tech. Rep. May, EA, Bristol, 2016. a
Environment Agency: Revised Draft Water Resources Management Plan 2019 Supply-Demand Data at Company Level 2020/21 to 2044/45, available at: https://data.gov.uk/dataset/fb38a40c-ebc1-4e6e-912c-bb47a76f6149/revised-draft-water-resources-management-plan-2019-supply- (last access: 5 October 2020), 2019. a
Famiglietti, J. S.: The global groundwater crisis, Nat. Clim. Change, 4, 945–948, https://doi.org/10.1038/nclimate2425, 2014. a, b
Gleeson, T., VanderSteen, J., Sophocleous, M. A., Taniguchi, M., Alley, W. M., Allen, D. M., and Zhou, Y.: Groundwater sustainability strategies, Nat. Geosci., 3, 378–379, https://doi.org/10.1038/ngeo881, 2010. a
Gleeson, T., Alley, W. M., Allen, D. M., Sophocleous, M. A., Zhou, Y., Taniguchi, M., and VanderSteen, J.: Towards sustainable groundwater use: setting long-term goals, backcasting, and managing adaptively, Groundwater, 50, 19–26, 2012. a
Gleeson, T. and Richter, B.: How much groundwater can we pump and protect environmental flows through time? Presumptive standards for conjunctive management of aquifers and rivers, River Res. Appl., 34, 83–92, 2017. a
Gleeson, T., Cuthbert, M., Ferguson, G., and Perrone, D.: Global Groundwater Sustainability, Resources, and Systems in the Anthropocene, Annu. Rev. Earth Planet. Sc., 48, 431–463, https://doi.org/10.1146/annurev-earth-071719-055251, 2020. a, b, c
Gun, J.: Groundwater and global change: trends, opportunities and challenges. United Nations World Water Assessment Programme, SIDE Publications Series, UNESCO, Paris, France, 1, 1–38, 2012. a
Haaf, E. and Barthel, R.: An inter-comparison of similarity-based methods for organisation and classification of groundwater hydrographs, J. Hydrol., 559, 222–237, 2018. a
Haas, J. C. and Birk, S.: Characterizing the spatiotemporal variability of groundwater levels of alluvial aquifers in different settings using drought indices, Hydrol. Earth Syst. Sci., 21, 2421–2448, https://doi.org/10.5194/hess-21-2421-2017, 2017. a, b
Hamed, K. H.: Trend detection in hydrologic data: The Mann–Kendall trend test under the scaling hypothesis, J. Hydrol., 349, 350–363, https://doi.org/10.1016/j.jhydrol.2007.11.009, 2008. a
He, X., Wada, Y., Wanders, N., and Sheffield, J.: Intensification of hydrological drought in California by human water management, Geophys. Res. Lett., 44, 1777–1785, 2017. a
Hutchinson, M., Ingram, R., Grout, M., and Hayes, P.: A successful model: 30 years of the Lincolnshire Chalk model, Special Publications 364, Geological Society, London, 173–191, 2012. a, b
Jackson, C. R., Meister, R., and Prudhomme, C.: Modelling the effects of climate change and its uncertainty on UK Chalk groundwater resources from an ensemble of global climate model projections, J. Hydrol., 399, 12–28, https://doi.org/10.1016/j.jhydrol.2010.12.028, 2011. a
Jackson, C. R., Bloomfield, J. P., and Mackay, J. D.: Evidence for changes in historic and future groundwater levels in the UK, Prog. Phys. Geogr., 39, 49–67, https://doi.org/10.1177/0309133314550668, 2015. a
Jones, D.: The Tertiary evolution of south-east England with particular reference to the Weald, in: The shaping of southern England, vol. 11, edited by: Jones, D. K. C., Academic Press, London, 13–47, 1980. a
Kakaei, E., Moradi, H. R., Moghaddam Nia, A., and Van Lanen, H. A.: Quantifying Positive and Negative Human-Modified Droughts in the Anthropocene: Illustration with Two Iranian Catchments, Water, 11, 885, https://doi.org/10.3390/w11050884, 2019. a
Kendall, M. G.: Rank correlation methods, Charles Griffin, London, p. 160, 1948. a
Konikow, L. F.: Contribution of global groundwater depletion since 1900 to sea-level rise, Geophys. Res. Lett., 38, L17401, https://doi.org/10.1029/2011GL048604, 2011. a
Konikow, L. F. and Leake, S. A.: Depletion and capture: revisiting “the source of water derived from wells”, Ground Water, 52, 100–111, https://doi.org/10.1111/gwat.12204, 2014. a, b
Kumar, R., Musuuza, J. L., Van Loon, A. F., Teuling, A. J., Barthel, R., Ten Broek, J., Mai, J., Samaniego, L., and Attinger, S.: Multiscale evaluation of the Standardized Precipitation Index as a groundwater drought indicator, Hydrol. Earth Syst. Sci., 20, 1117–1131, https://doi.org/10.5194/hess-20-1117-2016, 2016. a, b, c, d
Leblanc, M. J., Tregoning, P., Ramillien, G., Tweed, S. O., and Fakes, A.: Basin-scale, integrated observations of the early 21st century multiyear drought in southeast Australia, Water Resour. Res., 45, W04408, https://doi.org/10.1029/2008WR007333, 2009. a
Lee, J. M., Park, J. H., Chung, E., and Woo, N. C.: Assessment of Groundwater Drought in the Mangyeong River Basin, Korea, Sustainability, 10, 831, 2018. a
Li, B. and Rodell, M.: Evaluation of a model-based groundwater drought indicator in the conterminous US, J. Hydrol., 526, 78–88, 2015. a
Liu, Y., Ren, L., Zhu, Y., Yang, X., Yuan, F., Jiang, S., and Ma, M.: Evolution of hydrological drought in human disturbed areas: a case study in the laohahe catchment, Northern China, Adv. Meteorol., 2016, 5102568, https://doi.org/10.1155/2016/5102568, 2016. a
Lorenzo-Lacruz, J., Garcia, C., and Morán-Tejeda, E.: Groundwater level responses to precipitation variability in Mediterranean insular aquifers, J. Hydrol., 552, 516–531, https://doi.org/10.1016/j.jhydrol.2017.07.011, 2017. a
Mann, H. B.: Nonparametric Test Against Trend, Econometrica, 13, 245–259, https://doi.org/10.2307/1907187, 1945. a
Mansour, M. and Hughes, A.: Summary of results for national scale recharge modelling under conditions of predicted climate change, British Geological Survey, 136 pp., (OR/17/026) (Unpublished), available at: http://nora.nerc.ac.uk/id/eprint/521605/ (last access: 5 October 2020), 2018. a
Marchant, B. and Bloomfield, J.: Spatio-temporal modelling of the status of groundwater droughts, J. Hydrol., 564, 397–413, https://doi.org/10.1016/j.jhydrol.2018.07.009, 2018. a
Marsh, T., Cole, G., and Wilby, R.: Major droughts in England and Wales, 1800–2006, Weather, 62, 87–93, https://doi.org/10.1002/wea.67, 2007. a, b
Marsh, T. and Hannaford, J. (Eds.): UK hydrometric register. A catalogue of river flow gauging stations and observation wells and boreholes in the United Kingdom together with summary hydrometric and spatial statistics, Hydrological Data UK, Centre for Ecology & Hydrology, available at: http://nora.nerc.ac.uk/id/eprint/3093/ (last access: last access: 5 October 2020), 2008. a
Marsh, T., Parry, S., Kendon, M., and Hannaford, J.: The 2010–12 drought and subsequent extensive flooding: a remarkable hydrological transformation, Tech. rep., Centre of Ecology and Hydrology, Wallingford, 2013. a, b, c
Maurice, L., Atkinson, T., Barker, J., Bloomfield, J., Farrant, A., and Williams, A.: Karstic behaviour of groundwater in the English Chalk, J. Hydrol., 330, 63–70, https://doi.org/10.1016/j.jhydrol.2006.04.012, 2006. a
McKee, T. B., Doesken, N. J., and Kleist, J.: The relationship of drought frequency and duration to time scales, in: AMS 8th Conference on Applied Climatology, 179–184, 1993. a
Mishra, A. K. and Singh, V. P.: A review of drought concepts, J. Hydrol., 391, 202–216, https://doi.org/10.1016/j.jhydrol.2010.07.012, 2010. a
Mustafa, S. M. T., Abdollahi, K., Verbeiren, B., and Huysmans, M.: Identification of the influencing factors on groundwater drought and depletion in north-western Bangladesh, Hydrogeol. J., 25, 1357–1375, https://doi.org/10.1007/s10040-017-1547-7, 2017. a, b
Ohdedar, B.: Groundwater law, abstraction, and responding to climate change: assessing recent law reforms in British Columbia and England, Water Int., 42, 691–708, https://doi.org/10.1080/02508060.2017.1351059, 2017. a, b
Panda, D. K., Mishra, A., Jena, S., James, B., and Kumar, A.: The influence of drought and anthropogenic effects on groundwater levels in Orissa, India, J. Hydrol., 343, 140–153, https://doi.org/10.1016/j.jhydrol.2007.06.007, 2007. a
Parry, S., Wilby, R., Prudhomme, C., Wood, P., and McKenzie, A.: Demonstrating the utility of a drought termination framework: prospects for groundwater level recovery in England and Wales in 2018 or beyond, Environ. Res. Lett., 13, 064040, https://doi.org/10.1088/1748-9326/aac78c, 2018. a
Pathak, A. A. and Dodamani, B. M.: Trend Analysis of Groundwater Levels and Assessment of Regional Groundwater Drought: Ghataprabha River Basin, India, Nat. Resour. Res., 28, 631–643, https://doi.org/10.1007/s11053-018-9417-0, 2018. a
Peters, E., Bier, G., Van Lanen, H. A. J., and Torfs, P. J. J. F.: Propagation and spatial distribution of drought in a groundwater catchment, J. Hydrol., 321, 257–275, https://doi.org/10.1016/j.jhydrol.2005.08.004, 2006. a, b
Rey, D., Holman, I. P., and Knox, J. W.: Developing drought resilience in irrigated agriculture in the face of increasing water scarcity, Reg. Environ. Change, 17, 1527–1540, 2017. a, b, c
Rio, M., Rey, D., Prudhomme, C., and Holman, I. P.: Evaluation of changing surface water abstraction reliability for supplemental irrigation under climate change, Agr. Water Manage., 206, 200–208, https://doi.org/10.1016/j.agwat.2018.05.005, 2018. a
Robinson, E., Blyth, E., Clark, D., Comyn-Platt, E., Finch, J., and Rudd, A.: Climate hydrology and ecology research support system potential evapotranspiration dataset for Great Britain (1961–2015), NERC Environmental Information Data Centre, https://doi.org/10.5285/8baf805d-39ce-4dac-b224-c926ada353b7, 2016. a, b
Russo, T. A. and Lall, U.: Depletion and response of deep groundwater to climate-induced pumping variability, Nat. Geosci., 10, 105–108, 2017. a
Sadri, S., Kam, J., and Sheffield, J.: Nonstationarity of low flows and their timing in the eastern United States, Hydrol. Earth Syst. Sci., 20, 633–649, https://doi.org/10.5194/hess-20-633-2016, 2016. a
Shepley, M. and Streetly, M.: The estimation of `natural' summer outflows from the Permo-Triassic Sandstone aquifer, UK, Q. J. Eng. Geol. Hydroge., 40, 213–227, 2007. a, b
Shepley, M., Pearson, A., Smith, G., and Banton, C.: The impacts of coal mining subsidence on groundwater resources management of the East Midlands Permo–Triassic Sandstone aquifer, England, Q. J. Eng. Geol. Hydroge., 41, 425–438, https://doi.org/10.1144/1470-9236/07-210, 2008. a, b, c, d
Shepley, M. G., Whiteman, M., Hulme, P., and Grout, M.: Introduction: groundwater resources modelling: a case study from the UK, Special Publications 364, Geological Society, London, 1–6, 2012. a, b
Siebert, S., Burke, J., Faures, J. M., Frenken, K., Hoogeveen, J., Döll, P., and Portmann, F. T.: Groundwater use for irrigation – a global inventory, Hydrol. Earth Syst. Sci., 14, 1863–1880, https://doi.org/10.5194/hess-14-1863-2010, 2010. a
Stagge, J. H., Tallaksen, L. M., Gudmundsson, L., Van Loon, A. F., and Stahl, K.: Candidate Distributions for Climatological Drought Indices (SPI and SPEI), Int. J. Climatol., 35, 4027–4040, https://doi.org/10.1002/joc.4267, 2015. a
Svensson, C., Hannaford, J., and Prosdocimi, I.: Statistical distributions for monthly aggregations of precipitation and streamflow in drought indicator applications, Water Resour. Res., 53, 999–1018, https://doi.org/10.1002/2016WR019276, 2017. a
Tallaksen, L. M. and Van Lanen, H. A. J.: Hydrological drought: processes and estimation methods for streamflow and groundwater, in: vol. 48, Elsevier, Amsterdam, the Netherlands, 2004. a, b, c
Tallaksen, L. M., Hisdal, H., and Lanen, H. A. V.: Space–time modelling of catchment scale drought characteristics, J. Hydrol., 375, 363–372, https://doi.org/10.1016/j.jhydrol.2009.06.032, 2009. a, b, c, d
Tanguy, M., Dixon, H., Prosdocimi, I., Morris, D. G., and Keller, V. D. J.: Gridded estimates of daily and monthly areal rainfall for the United Kingdom (1890–2015), NERC Environmental Information Data Centre, https://doi.org/10.5285/33604ea0-c238-4488-813d-0ad9ab7c51ca, 2016. a, b
Taylor, R. G., Scanlon, B., Doell, P., Rodell, M., van Beek, R., Wada, Y., Longuevergne, L., Leblanc, M., Famiglietti, J. S., Edmunds, M., Konikow, L., Green, T. R., Chen, J., Taniguchi, M., Bierkens, M. F. P., MacDonald, A., Fan, Y., Maxwell, R. M., Yechieli, Y., Gurdak, J. J., Allen, D. M., Shamsudduha, M., Hiscock, K., Yeh, P. J. F., Holman, I., and Treidel, H.: Ground water and climate change, Nat. Clim. Change, 3, 322–329, https://doi.org/10.1038/NCLIMATE1744, 2013. a
Thomas, B. F. and Famiglietti, J. S.: Sustainable Groundwater Management in the Arid Southwestern US: Coachella Valley, California, Water Resour. Manage., 29, 4411–4426, https://doi.org/10.1007/s11269-015-1067-y, 2015. a, b
Thomas, B., Landerer, F., Wiese, D., and Famiglietti, J.: A comparison of watershed storage trends over the eastern and upper Midwestern regions of the United States, 2003–2015, Water Resour. Res., 52, 6335–6347, https://doi.org/10.1002/2016WR018617, 2016. a
Van Lanen, H. A.: Drought propagation through the hydrological cycle, IAHS publication, Havana, Cuba, 308, 122, 2006. a
Van Lanen, H. A. J., Wanders, N., Tallaksen, L. M., and Van Loon, A. F.: Hydrological drought across the world: impact of climate and physical catchment structure, Hydrol. Earth Syst. Sci., 17, 1715–1732, https://doi.org/10.5194/hess-17-1715-2013, 2013. a
Van Loon, A. F. and Van Lanen, H. A. J.: Making the distinction between water scarcity and drought using an observation-modeling framework, Water Resour. Res., 49, 1483–1502, https://doi.org/10.1002/wrcr.20147, 2013. a
Van Loon, A. F.: Hydrological drought explained, Wiley Interdisciplin. Rev.: Water, 2, 359–392, https://doi.org/10.1002/wat2.1085, 2015. a
Van Loon, A. F., Gleeson, T., Clark, J., Van Dijk, A. I. J. M., Stahl, K., Hannaford, J., Di Baldassarre, G., Teuling, A. J., Tallaksen, L. M., Uijlenhoet, R., Hannah, D. M., Sheffield, J., Svoboda, M., Verbeiren, B., Wagener, T., Rangecroft, S., Wanders, N., and Van Lanen, H. A. J.: Drought in the Anthropocene, Nat. Geosci., 9, 89–91, https://doi.org/10.1038/ngeo2646, 2016a. a, b
Van Loon, A. F., Stahl, K., Di Baldassarre, G., Clark, J., Rangecroft, S., Wanders, N., Gleeson, T., Van Dijk, A. I. J. M., Tallaksen, L. M., Hannaford, J., Uijlenhoet, R., Teuling, A. J., Hannah, D. M., Sheffield, J., Svoboda, M., Verbeiren, B., Wagener, T., and Van Lanen, H. A. J.: Drought in a human-modified world: reframing drought definitions, understanding, and analysis approaches, Hydrol. Earth Syst. Sci., 20, 3631–3650, https://doi.org/10.5194/hess-20-3631-2016, 2016b. a, b
Van Loon, A. F., Kumar, R., and Mishra, V.: Testing the use of standardised indices and GRACE satellite data to estimate the European 2015 groundwater drought in near-real time, Hydrol. Earth Syst. Sci., 21, 1947–1971, https://doi.org/10.5194/hess-21-1947-2017, 2017. a
Voyce, K.: Groundwater Management: the Shropshire Groundwater Scheme, Proc. Shropsh. Geol. Soc., 14, 20–29, 2008. a, b
Wada, Y., van Beek, L. P. H., Wanders, N., and Bierkens, M. F. P.: Human water consumption intensifies hydrological drought worldwide, Environ. Res. Lett., 8, 034036, https://doi.org/10.1088/1748-9326/8/3/034036, 2013. a
Walker, S. and Smithers, H.: A review of the 1995–96 drought in the North West, Water Environ. J., 12, 273–279, 1998. a, b, c
Whitehead, E. and Lawrence, A.: The Chalk aquifer system of Lincolnshire, Tech. rep., contributors: Bloomfield, J. P., McConvey, P. J., Cunningham, J. E., Sumbler, M. G., Watling, D., and Hutchinson, M., British Geological Survey, Keyworth, Nottingham, 2006. a
Wilhite, D. A. (Ed.): Droughts: A Global Assesment, Routledge, London, 2000. a
Yevjevich, V. M.: An objective approach to definitions and investigations of continental hydrologic droughts, Hydrology papers, no. 23, Colorado State University, Fort Collins, Colorado, 1967. a
Yue, S. and Wang, C.: The Mann–Kendall Test Modified by Effective Sample Size to Detect Trend in Serially Correlated Hydrological Series, Water Resour. Manage., 18, 201–218, https://doi.org/10.1023/B:WARM.0000043140.61082.60, 2004. a
Zhang, H. and Hiscock, K.: Modelling the impact of forest cover on groundwater resources: A case study of the Sherwood Sandstone aquifer in the East Midlands, UK, J. Hydrol., 392, 136–149, https://doi.org/10.1016/j.jhydrol.2010.08.002, 2010. a