the Creative Commons Attribution 4.0 License.
the Creative Commons Attribution 4.0 License.
 | 05 Oct 2020
Frequency and magnitude variability of Yalu River flooding: numerical analyses for the last 1000 years
Hui Sheng
Xiaomei Xu
Jian Hua Gao
Albert J. Kettner
Yong Shi
Chengfeng Xue
Ya Ping Wang
Shu Gao
Accurate determination of past flooding characteristics is necessary to effectively predict the future flood disaster risk and dominant controls. However, understanding the effects of environmental forcing on past flooding frequency and magnitude is difficult owing to the deficiency of observations (data available for less than 10 % of the world's rivers) and extremely short measurement time series (<100 years). In this study, a numerical model, HYDROTREND, which generates synthetic time series of daily water discharge at a river outlet, was applied to the Yalu River to (1) reconstruct annual peak discharges over the past 1000 years and estimate flood annual exceedance probabilities and (2) identify and quantify the impacts of climate change and human activity (runoff yield induced by deforestation and dam retention) on the flooding frequency and magnitude. Climate data obtained from meteorological stations and ECHO-G climate model output, morphological characteristics (hypsometry, drainage area, river length, slope, and lapse rate), and hydrological properties (groundwater properties, canopy interception effects, cascade reservoir retention effect, and saturated hydraulic conductivity) form significant reliable model inputs. Monitored for decades, some proxies on ancient floods allow for accurate calibration and validation of numerical modeling.
Simulations match well the present-day monitored data (1958–2012) and the literature records of historical flood events (1000–1958). They indicate that flood frequencies of the Yalu River increased during 1000–1940, followed by a decrease until the present day. Frequency trends were strongly modulated by climate variability, particularly by the intensity and frequency of rainfall events. The magnitudes of larger floods, events with a return period of 50 to 100 years, increased by 19.1 % and 13.9 %, respectively, due to climate variability over the last millennium. Anthropogenic processes were found to either enhance or reduce flooding, depending on the type of human activities. Deforestation increased the magnitude of larger floods (100- and 50-year floods) by 19.2 %–20.3 %, but the construction of cascade reservoirs in 1940 significantly reduced their magnitude by 36.7 % to 41.7 %. We conclude that under intensified climate change and human activities in the future, effective river engineering should be considered, particularly for small- and medium-sized mountainous river systems, which are at a higher risk of flood disasters owing to their relatively poor hydrological regulation capacity.
- Article
(9872 KB) - Full-text XML
- BibTeX
- EndNote


Extreme climate events have increased over the last century, threatening human life and property (Cai et al., 2014; UNISDR, 2015; Winsemius et al., 2015). River floods are the most common and damaging of all natural disasters globally, particularly in intensely developed river basins, deltas, and coastal regions (Field et al., 2012; Jian et al., 2014). Globally, flood damage has led to an average annual loss of USD 104 billion, which is expected to increase in response to population growth and development of flood-prone regions (Jongman et al., 2012; UNISDR, 2015).
Predominantly, research has been focused on the physical and statistical characteristics of flood events, estimating flood probability and flooding frequency variability in response to urbanization, climate change, and other factors (Sambrook Smith et al., 2010; Munoz et al., 2015, 2018; Kettner et al., 2018; Zhang et al., 2018). However, only short-term (<100-year) fluvial gauge data exist for most rivers globally, and the existing observational data are largely affected by human activities (Milliman and Farnsworth, 2013). These relatively short records lead to large uncertainties in the predictions of future flood disasters and are problematic in discerning whether changes in flood frequency and magnitude are in response to climate change or human activities (Holmes and Dinicola, 2010; Yang and Yin, 2018). Determining the magnitude and frequency of historical floods can help predict future trends in flood disasters. To date, studies have used riverine sedimentological records to identify the frequency and magnitude of historical floods (Gomez et al., 1995; Paola, 2003; Munoz et al., 2018). Large floods can leave distinctive imprints in sedimentary deposits under relatively stable sedimentary environments (Sadler, 1981; Paola, 2003). However, sedimentary records are influenced by a range of flooding magnitudes as well as both frequent and rare flooding events (Magilligan et al., 1998; Sambrook Smith et al., 2010). Therefore, it is difficult to accurately discriminate between flood events of different scales and to quantify the frequency and magnitude of past floods using the sedimentary record (Sambrook Smith et al., 2010). Numerical modeling provides an alternative to observational or sedimentary record studies and can successfully reproduce basin hydrology over the long term with high accuracy (Syvitski and Morehead, 1999). Consequently, to improve the understanding of the main controlling factors of the flooding frequency and magnitude under the impact of climate change and human activities, the forward hydrological model HYDROTREND is applied here.
HYDROTREND is a climate-driven hydrological water balance and transport model that simulates the daily time series of water and sediment discharge as a function of climate trends and drainage basin characteristics (Syvitski et al., 1998; Kettner and Syvitski, 2008). The model creates daily water discharge at a river mouth based on a classic water balance model that includes five runoff processes: rain, snowmelt, glacial melt, groundwater discharge, and evaporation. Meteorological station data or global circulation model output (statistics of temperature, precipitation, and evaporation) and basin characteristics (basin elevation, lapse rate, equilibrium line altitude – ELA, and freeze line altitude – FLA) form the input data that determine whether precipitation at a certain location will fall as rain or snow on a daily basis. The model has proven to be capable of capturing the range of magnitude and return intervals of peak discharge events on decadal, centennial, or longer climatic scales for small- to medium-sized river basins (102–105 km2) (Syvitski et al., 1998; Syvitski and Morehead, 1999).
The Yalu River is a typical mountainous river that flows into a macro-tide estuary. Under the impacts of large peak discharges and tidal jacking, cities of China and North Korea in the lower reaches of the Yalu River severely suffer from flood disasters (Zhai et al., 2015). Compared with other river systems, the potential for flash flooding in mountainous rivers is susceptible to both climatic events and human activities (Yang and Yin, 2018). Over the past 1000 years, the Yalu River witnessed a drier and cooler climatic transition during the Little Ice Age (LIA). In addition, land reclamation, warfare, reservoir construction, and rapid urbanization have influenced the hydrological characteristics of the river (Sheng et al., 2019). Frequent flood disasters, drastic changes in the catchment environment, and insufficient research into flooding make the Yalu River an appropriate study area for simulating, reconstructing, and identifying how flood magnitude and frequency have responded to climate change and human activities over the past 1000 years.
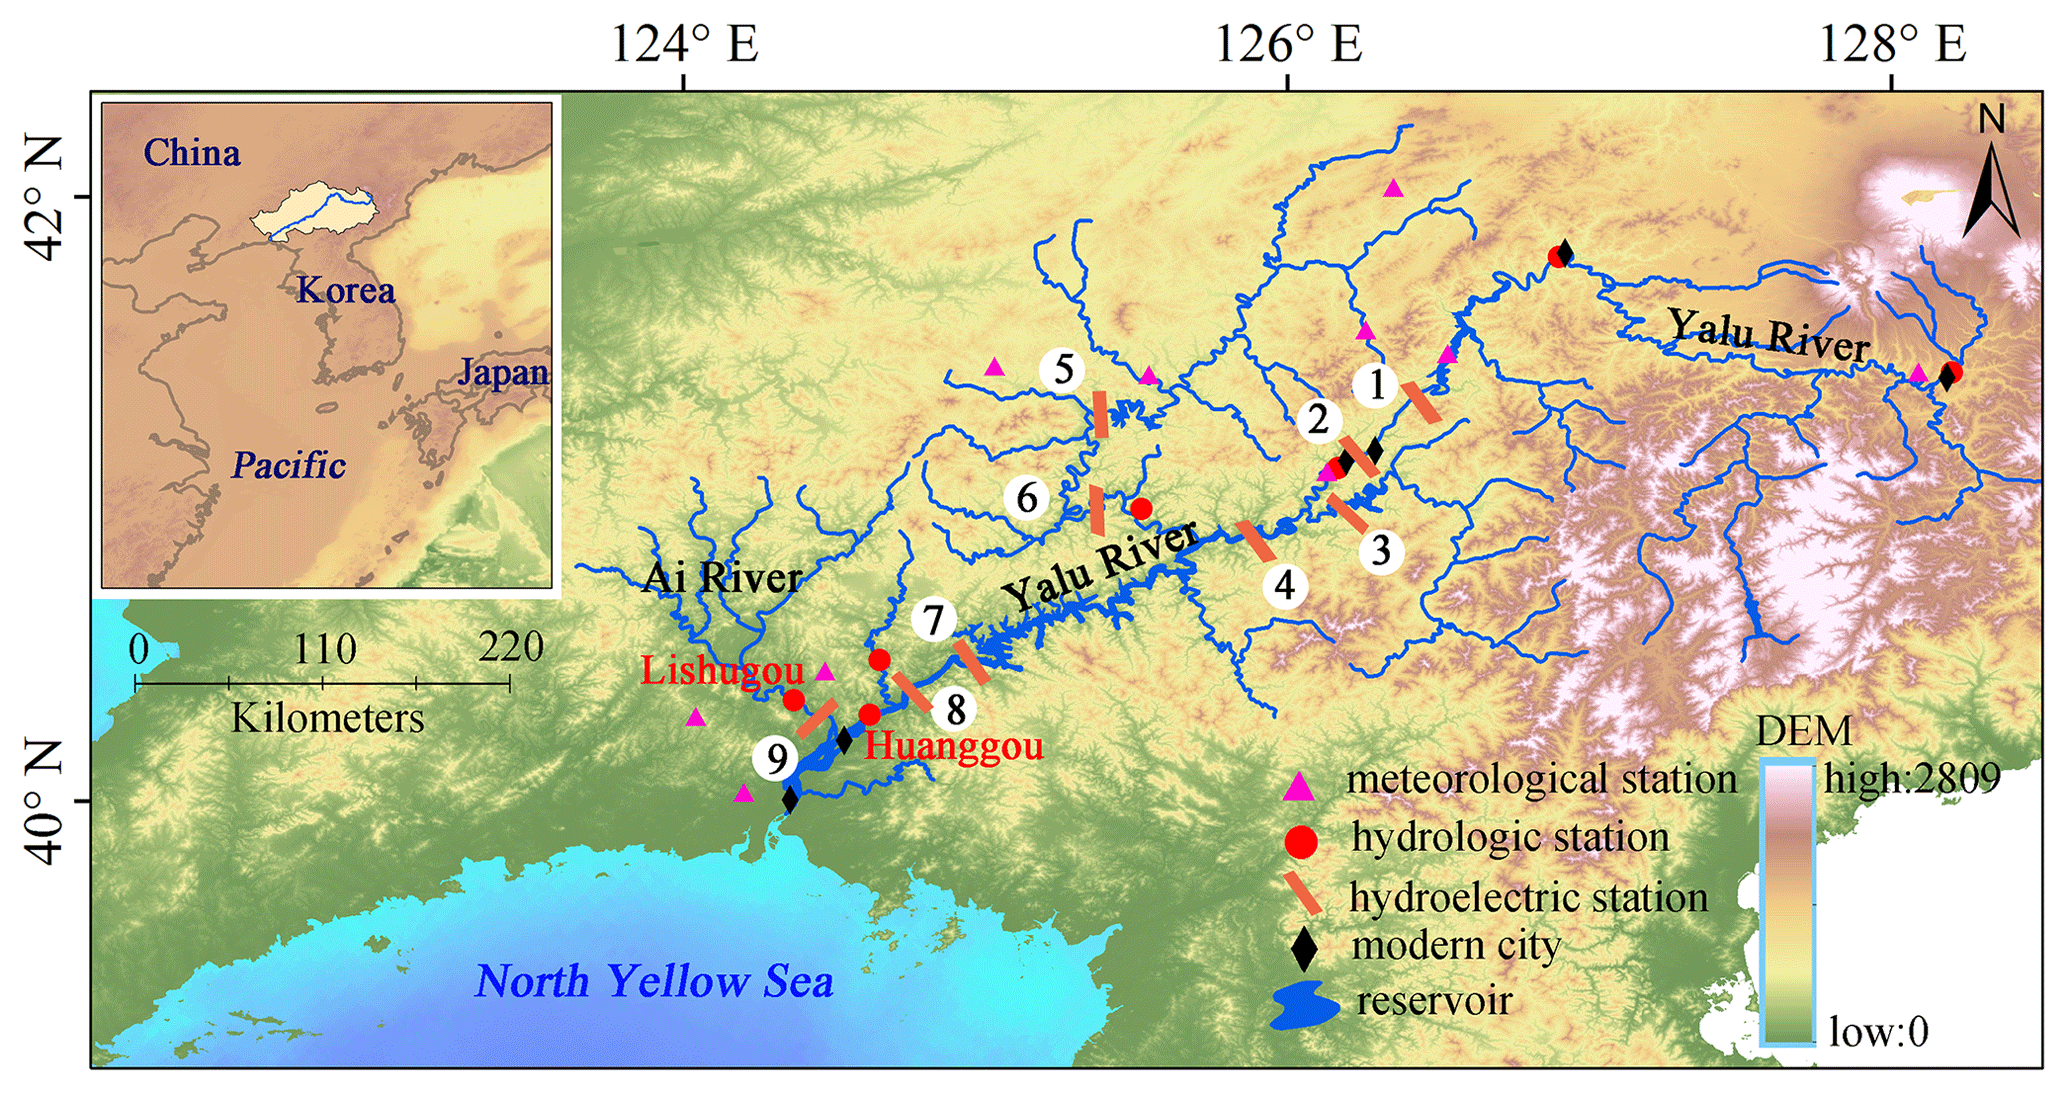
Figure 1Map of the Yalu River basin. The total water discharge of the Yalu River is the sum of the discharge data recorded in Huanggou and Lishuggou hydrological stations. Numbers 1 to 9 on the map indicate the locations of the reservoirs. Digital elevation model (DEM) data are derived from the ETOPO1 Global Relief Model (https://www.ngdc.noaa.gov/mgg/global/etopo1sources.html, last access: 22 March 2019).
In this study, HYDROTREND is applied to numerically reconstruct and investigate the impacts of climate change and human activities (deforestation and dam retention) on the flooding frequency and magnitude for the Yalu River over the past 1000 years. Present-day (1958–2012) and long-term (1000–1990) climate input data of the Yalu basin were obtained from meteorological stations (https://data.cma.cn/, last access: 20 May 2019) and the ECHO-G climate model. The climate model ECHO-G that coupled the spectral atmospheric model ECHAM4 and the Hamburg Ocean Primitive Equation global model (HOPE-G) generates monthly precipitation and temperature data of the Yalu River over the last millennium (Liu et al., 2009, 2011). Monthly climate outputs from the ECHO-G model are downscaled by the degree-day module and rainfall event module in HYDROTREND, and these can be applied to create normally distributed random daily temperatures and synthetic daily rainfall distributions within the month using the Monte Carlo technique (Syvitski et al., 1998). Morphological characteristics (hypsometry, drainage area, slope, and latitude) and hydrological properties (lapse rate, groundwater properties, canopy interception effects, and saturated hydraulic conductivity) are collected and processed based on the guidebook of the HYDROTREND (CSDMS) and previous studies (Table A1). The model also accepted the Yalu River's length, velocity, and cascade reservoir retention effect obtained from Wang et al. (2010) as inputs to smoothen the peak discharge at the river mouth. Except for reliable input data, the model is calibrated by measured peak discharge during 1958–2012 at gauging stations. The simulations of flood peak discharge of the Yalu River over the last 1000 years from this calibration are then validated by historical flood events obtained from literature records, including estimated flood peak flow data during 1888–1958, the number of flood disasters in different time periods, and dated flood events in the past millennium (Luo, 2006). The simulated results supported by reliable input and validation data are thus significant tools for quantifying the role of environmental forcing in flood magnitude and frequency.
Following a brief introduction to our study site in Sect. 2, the research methods, including model description, source of model input data, model set-up, and extreme statistical method for calculating return period of flood, are depicted in Sect. 3. In Sect. 4, we first validate the model simulations on present-day and long-term timescales based on monitored measurements and long-term flood events (date and number of floods in different dynasties) recorded by the historical flood literature of China and then discuss the model limitations and uncertainties in Sect. 4.2. In Sect. 4.3, the flood frequency and values of different return intervals are analyzed under the impacts of climate change and human activities over the last 1000 years. In Sect. 4.4, we qualitatively and quantitatively discuss the impacts of climate change and human activities (deforestation and dam retention) on flooding based on the wavelet analysis method and model scenario analysis, respectively. Finally, we conclude and highlight the implications for future flooding in Sect. 5.
The Yalu River is located at the border between China and North Korea and originates from the Changbai (Baekdu) Mountains. It extends 795 km southwest through steep hill slopes to flow into the northern Yellow Sea (Chen, 1998) (Fig. 1). The river contributed 90 % of the total freshwater input (25.13 km3 yr−1) and 88 % of the total sediment load (5.18 Mt yr−1) of the total amounts that the regional rivers contributed over the past millennium, greatly influencing the geomorphic evolution and ecosystem of the estuarine and adjacent coastal region (Sheng et al., 2019). The Yalu River experiences a typical temperate monsoonal climate with intense summer precipitation due to a large inland transport of oceanic moisture during the summer monsoon (accounting for 70 % of the annual rainfall). The annual mean precipitation and temperature are 863 mm and 6.2 ∘C, respectively. Disturbances in the upper trough of the intertropical convergence zone (ITCZ) associated with subtropical highs (typhoons and cyclones) cause intensive rainfall and flood events for the Yalu River region from July to August (Sun et al., 2011). During the 1879–2002 period alone, the Yalu River flooded 51 times, including 5 large floods (affecting most of the basin), 20 local floods, and 26 general floods depending on the flood distribution and disaster level (Luo, 2006). Most of these floods were characterized by large single-peak discharges ranging from 20 800 to 38 038 m3 s−1, typically lasting 3 d (data from Huanggou and Lishugou stations in the Yalu River). Huanggou is the main hydrological station located in the lower reaches of the Yalu River, and Lishugou is located downstream of the Ai River (the last, larger tributary of the Yalu River before it flows into the estuarine waters, in the region which experiences the highest precipitation of the basin) (Fig. 1).

Figure 2Model input data for the Yalu River for the period 1000–2012, including (a) population density (Sheng et al., 2019); (b) percentage forest coverage of the basin (Sheng et al., 2019); (c) total reservoir storage capacity index (RSCI: reservoir storage capacity/annual average water discharge); (d) annual average rainfall anomalies; and (e) annual average temperature anomalies (Liu et al., 2009, 2011).
Due to mass migration and rapid urbanization, the Yalu River region has experienced significant population growth over the last millennium, from a population density of 5.2 person per km2 in 1000, to 10.4 person per km2 in 1840, and to 119.5 person per km2 in 2012 (Fig. 2a). Rapid population growth has altered the regional environment due to intensified anthropogenic activities. During 1840–1985, forested areas decreased from 57.2 % to 23.1 % due to mass reclamation, war, and rapid urbanization. The forest cover was recently restored to 42.6 % by 2012 as a consequence of water and soil conservation measures (Fig. 2b). Numerous dams have been constructed since the 1940s to minimize the threat of floods and increase the supply of electricity. As of 2012, nine reservoirs have been constructed, resulting in a total reservoir storage capacity index (RSCI) of 93.2 % (Figs. 1 and 2c). Shuifeng Reservoir – constructed in 1940 – is the largest reservoir of the Yalu basin and has a storage capacity of 11.6 km3, contributing 44.9 % to the average annual runoff (Sheng et al., 2019). The lithology and soil type are straightforward for the Yalu River (Sheng et al., 2019). The mountains surrounding the Yalu basin are predominantly characterized by early Precambrian metamorphic rock and granites, including a small section of basalts and alluvial deposits in the estuary. Brown soils dominate in the region, with the addition of muddy dark-brown soils in the upper and middle reaches of the Yalu River.
3.1 Model description
The HYDROTREND hydrological model simulates daily water and sediment discharge at the river mouth and accurately predicts flood frequency and distribution (Syvitski et al., 1998). The model can simulate past (100–105 years) behavior of small- and medium-sized rivers (102–105 km2) by incorporating historical data on climate (meteorological data and high-resolution modeled climate data), basin properties (river networks, topography, and glacier equilibrium line), and human activities (reservoirs and deforestation) (Syvitski et al., 1998; Kettner and Syvitski, 2008). The model has successfully estimated the long-term flux of freshwater and sediment to the coastal ocean in drainage basins across the world, including the Danube, Rhône, and Po basins in Europe (Kettner, 2009; McCarney-Castle, 2012), Poyang Lake (Mainland China) and the Lanyang River (Taiwan) in Asia (Syvitski et al., 2005; Gao et al., 2015), as well as several Greenland river systems (Overeem and Syvitski, 2010). Model performance on flood magnitude and frequency has also been successfully tested in the flood-dominated Eel River in northern California (Syvitski and Morehead, 1999). HYDROTREND has been described in detail by Kettner and Syvitski (2008) and Syvitski et al. (1998). In this study, we specifically refer to the daily water discharge methodology.
HYDROTREND simulates daily water discharge based on the classic water balance equation (Eq. 1), which includes precipitation (P) per unit area (A) reduced by evaporation (Ev) and modified by water storage and release (Sr). For a year's total precipitation and average temperature, HYDROTREND first uses the basin elevation distribution characteristics, starting glacier ELA, and temperature lapse rate to allocate monthly volumetric components, including rainfall (Qr), snowfall (Qn), ice (Qice), groundwater (Qg), and evaporation (Qeva), thus ensuring mass balance. Then, the daily streamflow is created by incorporating the random degree-day module and rainfall event module.
Here, “ne” is the number of simulated epochs and i is the daily time step.
In this model, precipitation is presumed to be equally distributed over the entire river basin. Total basin area (t) is allocated to the area of rainfall (Ai), glaciers (g), and snow base on monthly position of freezing-line altitude (hfl), drainage basin elevation (hela), lapse rate, and temperature. The monthly rainfall component is defined as the monthly precipitation per unit area (Pi) multiplied by the area of rainfall (Ai). The evaporation for the rainfall component (Ew), including groundwater evapotranspiration (egw) and canopy interception (ec), is expressed by Eq. (4). For the monthly snowfall () and ice (Qice) components, the discharges are simply the monthly precipitation per unit area (Pi) multiplied by the area of the basin covered by snow and glacier, respectively, and values are decreased by factors accounting for groundwater (x) and evaporation (Ed).
Monthly snowfall component ():
Monthly snowfall component (Qice):
The rainfall component (Qr) appears as discharge essentially when it falls, while the ice (Qice) and snow components (Qn) and snowmelt recharge to the river only when the appropriate temperature conditions (generated by the degree-day module) are met (Syvitski and Alcott, 1995).
The degree-day module in this model generates normally distributed random temperatures for each day of the month (Syvitski et al., 1998). The distribution mean and standard deviation for a normally distributed random temperature function are specified in Appendix A1, calculated using climate data from meteorological stations and ECHO-G outputs. Random daily temperatures from the degree-day module are used to create ice-melt and snowmelt events contributing to daily total river discharge. The rainfall event module of HYDROTREND creates a number of rain days for each month (Pd) through the Monte Carlo technique (Syvitski et al., 1998). A random normal distribution attempting to reshape daily rainfall distribution in a month is generated by taking the natural exponent of the random normal distribution and raising it to a distribution exponent, limited by the top boundary of the total monthly rainfall obtained from meteorological stations and ECHO-G outputs. The distribution exponent is estimated by successive approximation, which is captured by model-calibrating experiments under different rainfall conditions in this study. The monthly precipitation and standard deviation of the daily precipitation within the month generally obtained from meteorological stations are specified in Appendix A1. The amount of rainfall that reaches the ground (Pg) is calculated by removing canopy evaporation from the total daily rainfall (Pd).
The daily surface runoff (qs) is mainly determined by saturation excess (qse), infiltration excess (qie), and subsurface storm flow qss (from groundwater to the river system), of which the infiltration excess (qie) is a function of the rainfall rate (reaching the ground) (Pg), saturation excess (qse), and infiltration rate (fs).
The infiltration rate (fs) is calculated based on the rainfall intensity (Pg), the level of the groundwater storage pool (GW), saturated hydraulic conductivity (K0), minimum (Pcr) and maximum (Pmax) infiltration rates, and a conversion constant (C1).
Human land use can also influence daily runoff at river outlets by influencing the hydraulic properties of surficial soil, such as the saturated hydraulic conductivity (K0), which can impact the pathway and transmission rates of precipitation to river systems (Price et al., 2010). In this study, the K0 (mm h−1) influenced by human land use can be expressed as follows:
where a1 (22 mm h−1 in the study region) and a2 (3 mm h−1 in the study region) are the saturated hydraulic conductivities under forest and non-forest cover (Price et al., 2010), and “Veg” is the forest coverage in the basin.
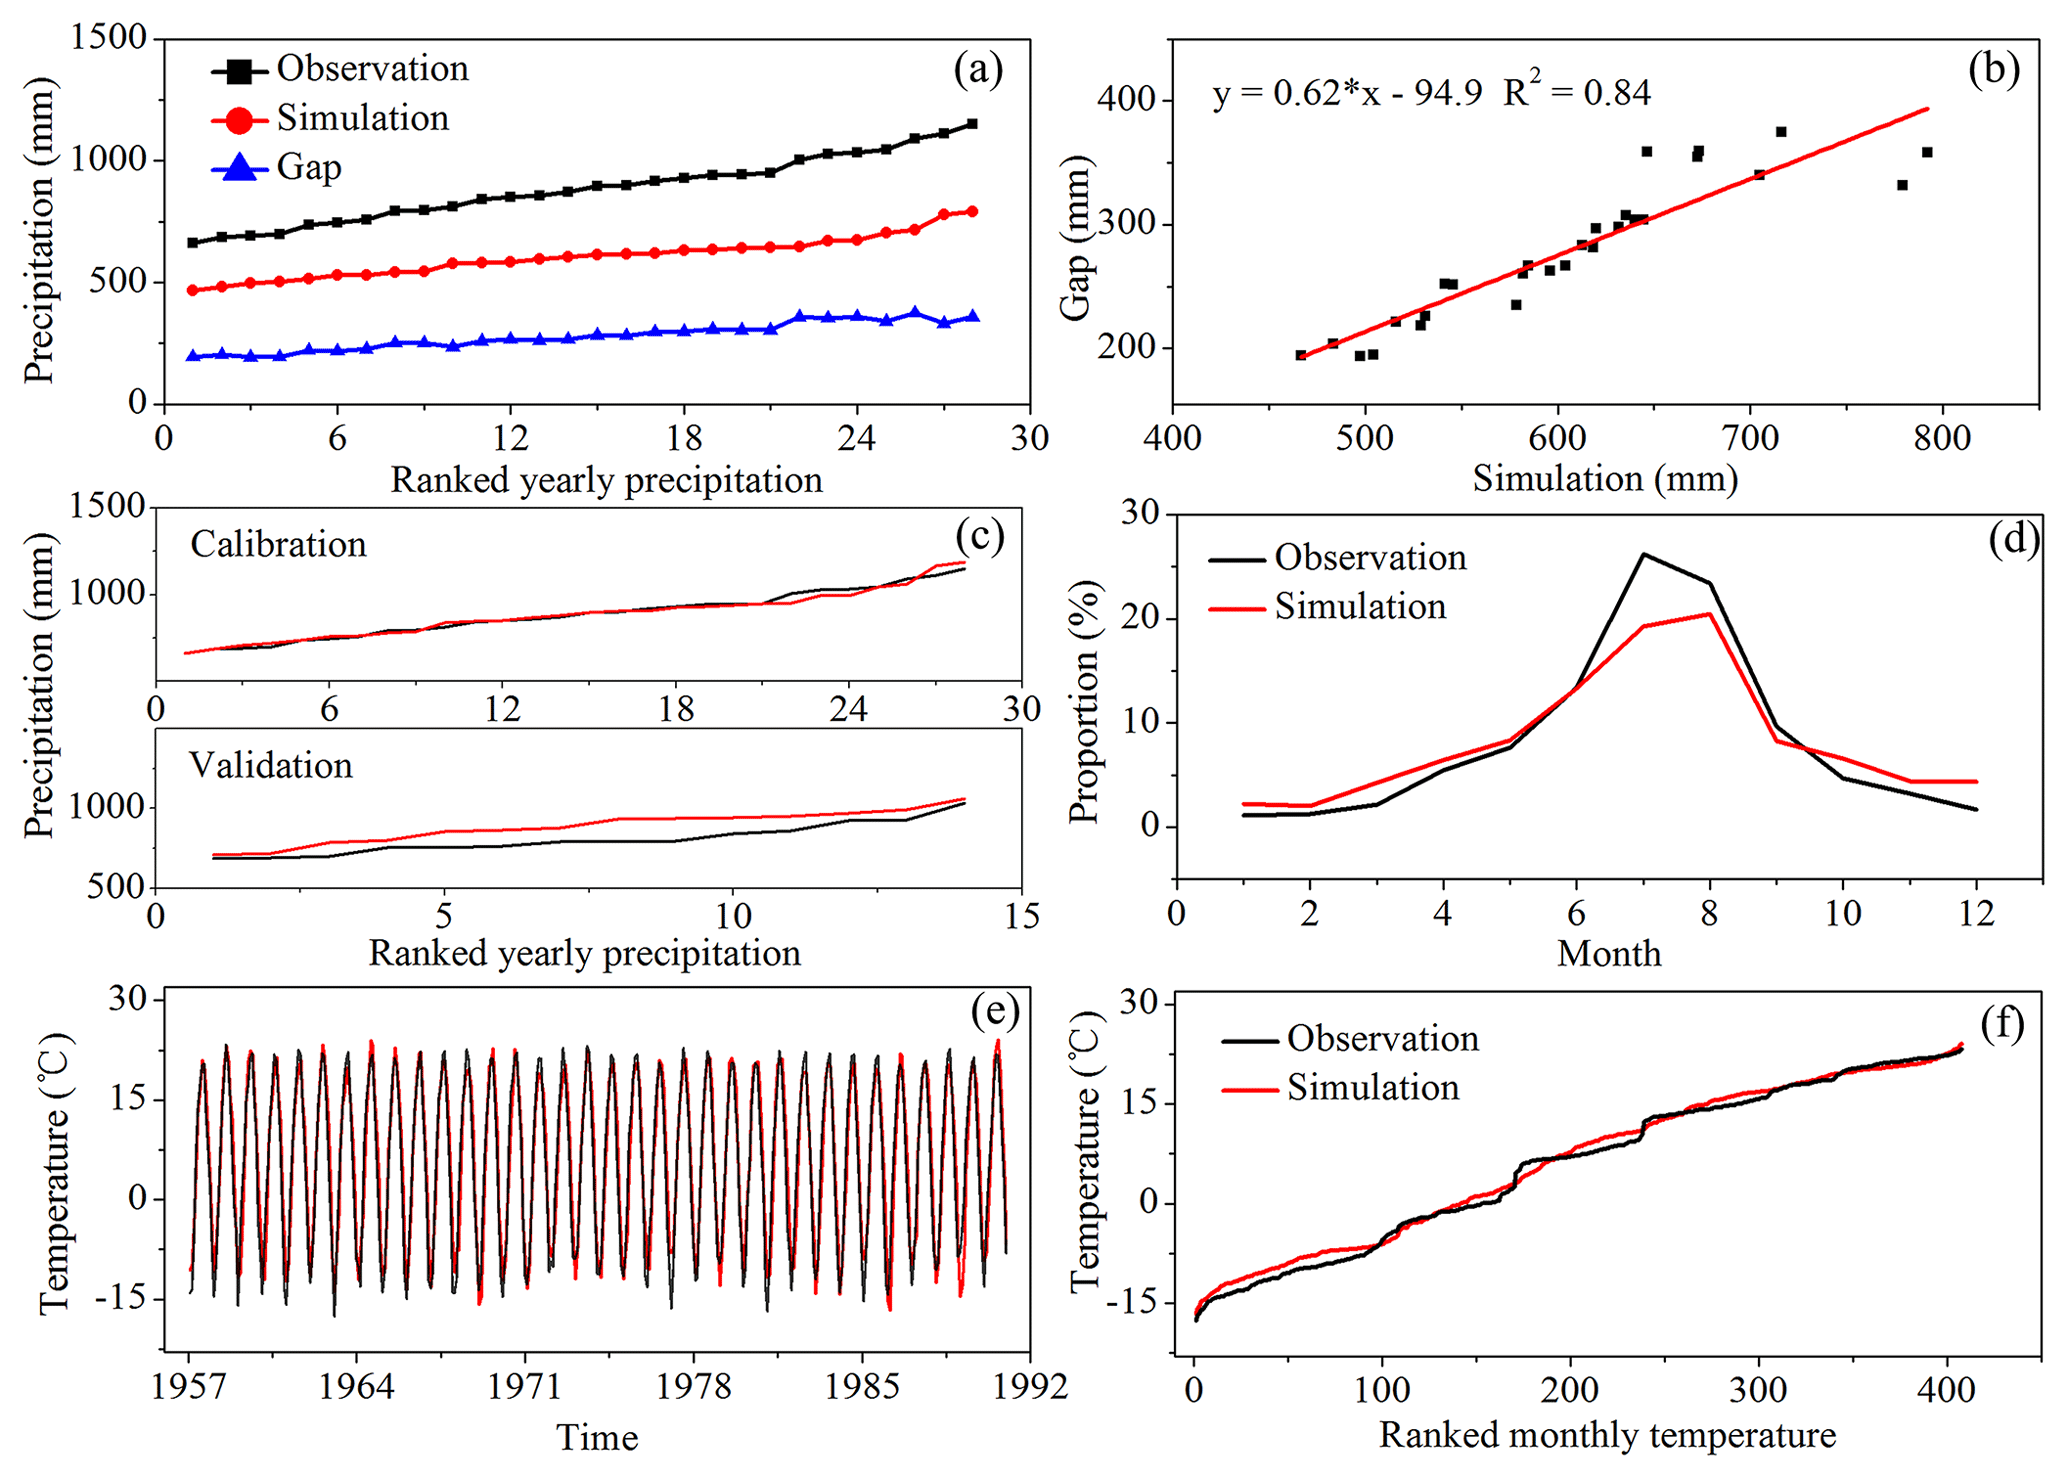
Figure 3Correction of the simulated climate data from the ECHO-G model based on observations during 1957–1990: (a) annual ranked precipitation distribution of observations, simulations, and the gap; (b) the relationship between simulations and the gap during 1957–1970 and 1977–1990; (c) calibration (1957–1970 and 1977–1990) and validation results (1967–1980); (d) monthly measured and simulated rainfall percentage; (e, f) comparison of the simulated and observed temperatures during 1957–1990.
3.2 Model input data
For model input, we used present-day and long-term climate data of the Yalu basin (monthly averages and standard deviations) obtained from meteorological stations during 1958–2012 (https://data.cma.cn/, last access: 20 May 2019) and the ECHO-G climate model output during the period 1000–1990 (Fig. 2d and e). The ECHO-G climate model consists of the spectral atmospheric model ECHAM4 coupled to the HOPE-G model, both developed at the Max Planck Institute for Meteorology in Hamburg (Legutke and Voss, 1999). ECHO-G simulates the climate variations from 1000 to 1990 as a response to natural and anthropogenic forcing with 20 vertical levels in the ocean, 19 in the atmosphere, and horizontal resolutions of approximately 2.8∘ (ocean) and 3.75∘ (atmosphere). In this study, monthly precipitation and temperature of the Yalu River over the last millennium derived from Liu et al. (2009, 2011) along with a bias correction were used, and simulations and observations were compared for the period 1957–1990 (Fig. 3). As shown in Fig. 3, ECHO-G can accurately predict the actual variations in temperatures of the Yalu River, and additionally, it can accurately capture the inter-annual seasonal precipitation distribution. However, there was a certain bias in the observed and simulated annual precipitation when comparing the ranked multi-year precipitations, where data were significantly dominated by the simulated precipitation. The calibrated and validated relationship between simulations and bias of precipitation during 1957–1990 was applied to modify the annual simulated precipitation over the last millennium, where amplitudes of simulated precipitation during 1957–1990 covered the entire simulated period (Fig. 3). The climate data for the Ai River over the past millennium were also modified through the monthly relationship of the Yalu's and Ai's temperature and precipitation during 1957–2012.
Annual daily peak discharge data of the Yalu (Huanggou station) and Ai rivers (Lishugou station) were obtained from the China Hydrological Statistical Yearbook (Figs. 4 and 5). We accessed soil and lithology data from the Ministry of Natural Resources of the People's Republic of China (http://data.mlr.gov.cn/, last access: 10 May 2019). Elevation (ASTER GDEM) and reservoir data were derived from NASA and the National Inventory of Dams Database, respectively (Figs. 1 and 2c). As shown in Fig. 2a and b, we used the millennial population and forest coverage data of the Yalu basin from a recent study which analyzed the fluvial discharge variability of the Yalu River for the last 1000 years (Sheng et al., 2019). Other input parameters and their sources are provided in Table A1.

Figure 4Comparisons of simulated and observed peak discharge of the Ai River (Yalu River tributary): (a–c) show ranked peak flows for model simulations and observations for wet, average, and dry years during the calibration period, respectively; (e–g) show ranked peak flows between the model simulations and observations for wet, average, and dry years during the validation period, respectively; and (d) is the time-series comparison of simulated and observed daily peak flow during 1958–2012.

Figure 5Comparisons of simulated and observed peak discharge of the Yalu River: (a–c) show ranked peak flows between the model simulations and observations for wet, average, and dry years during the calibration period, respectively; (e–g) show ranked peak flows between the model simulations and observations for wet, average, and dry years during the validation period, respectively; and (d) is the time-series comparison of simulated and observed daily peak flow during 1958–2012.
3.3 Model set-up
Changes in monthly and daily rainfall events due to inter-annual precipitation variability strongly correlate with fluvial flood disaster occurrences (Holmes and Dinicola, 2010). Initial soil conditions have varied saturation and infiltration-excess capacities depending on the moisture content from previous rainfall occurrences, which determines the amount of runoff entering a river system (Sivapalan et al., 1996). For this study, we identified the periodic wet years, average years, and dry years based on multi-year precipitation data from the Yalu and Ai rivers (Fig. A1). Therefore, infiltration and saturation excess (groundwater storage pool) were more accurately assessed based on the three different rainfall conditions. Each of the three periods (wet, average, and dry years) was further divided into strong, moderate, and weak rainfall (SMW) (Table A2) to better simulate daily precipitation intensity and distribution. We used ∼14 years as the period of wet and dry years for the Yalu River basin (of similar saturation excess) to simulate flooding for the past 1000 years (Yi et al., 2014). Thus, simulated daily rainfall was divided into nine categories (wet year SMW, average year SMW, and dry year SMW) to reconstruct the annual maximum water discharge over the last 1000 years (Table A2). The model inputs for the rainfall event distribution coefficients and exponents were strongly correlated with the simulated daily rainfall (Syvitski et al., 1998). However, we conducted a calibration analysis using partial measurements of peak water discharges (calibration period) for the Yalu and Ai rivers as it is difficult to obtain direct measurements of these parameters in the field. Subsequently, the calibrated parameters were compared with another observed peak flow (validation period) to validate the accuracy of the simulation (Figs. 4 and 5).
Three simulation scenarios were chosen to investigate the impacts of climate change and human activities on the frequency and magnitude of flooding. The first scenario is only driven by climate change (climate Case 1) over the past 1000 years (so parameters that describe the human impact were kept the same). Changes in the input parameters include annual and monthly precipitation and temperature variability, the rainfall event distribution coefficient, and exponent correlation with simulated daily rainfall values. A constant saturated hydraulic conductivity (15 mm h−1) was applied for natural conditions, and the influence of dam flood retention was excluded (Table A1). The second scenario reflects climate change and some human impact by combining changes in climate and forest cover induced by human land use (climate + forest − Case 2). Inputs include climate data and saturated hydraulic conductivity (K0) caused by changes in the forested area. The influence of dam interception was excluded. The third scenario combines climate change, forest change, and dam emplacement for flood retention, thus combining all key human impact factors as well as climate change effects (climate + forest + dam − Case 3).
3.4 Flood frequency analysis method
The generalized extreme-value (GEV) distribution and Pearson type three (P-III) distribution, combined with the L-moment method, have been widely used to investigate flood characteristics, of which P-III has been widely adopted for the frequency analysis of floods in many Chinese rivers (Xu et al., 2016). For the study region, the GEV based on the block maxima method and P-III showed significant differences for flood estimations on return periods larger than the observed time periods (1958–2012 for 55 years) (Fig. A2a and b). However, the difference between the two methods is minor when investigating the impacts of climate change and human activities on 100-, 50-, 20-, and 10-year floods when samples increased to 1000 years generated by the model (Fig. A2c). In addition, the block maxima method in GEV, which divides the estimation period into non-overlapping periods of equal size and restricts attention to the maximum estimations in each period, can reduce the uncertainties of simulations (Ferreira and Laurens, 2015). Therefore, in this study, the L-moment method for parameter estimation of the GEV was applied to study the flood frequency in the Yalu River based on simulated annual peak discharges in the river; the method was combined with the block maxima method.
GEV is commonly used to estimate the highest and lowest values among a large group of independent, identically distributed random values representing observations or simulations (Goel and De, 1993; Kim et al., 2012). The GEV combines three extreme value distribution functions (Type I – Gumbel, Type II – Fréchet, and Type III – Weibull distribution) into a single form and allows the data to decide the most appropriate distribution. The probability density function is defined by
where H is the GEV distribution, and μ, σ, and k are the parameters for location, scale, and shape, respectively. The type of extreme value distribution is determined by the shape parameter (ξ) of a set of random data as follows.
-
ξ=0, H(x; μ, σ, ξ) corresponds to Type I (Gumbel distribution), in which x∈R and the tails of the distribution function decrease exponentially.
-
ξ>0, H(x; μ, σ, ξ) corresponds to Type II (Fréchet distribution), in which , +∞) and the tail of the distribution function decrease as a polynomial.
-
ξ<0, H(x; μ, σ, ξ) corresponds to Type III (Weibull distribution), whose , ), and the tails of the distribution function are finite.
The GEV has been widely applied in hydrological analyses, climate statistics, and disaster reduction studies (Martins and Stedinger, 2000; Kharin and Zwiers, 2005). In this paper, we used the L-moment method for parameter estimation of GEV combined with the block maxima method to calculate the flood return periods and confidence intervals for investigating the frequency and magnitude of flood variability of the Yalu River under the impact of climate change and human activity.
4.1 Model validation
4.1.1 Present-day flood validation
To validate the model and calibrate its input parameters, we used the annual maximum peak flows at two gauging stations for 1958–2012 (the Yalu River data consist of data from the Yalu–Huanggou main river and its downstream tributary the Ai–Lishugou; Fig. 1) accessed from the Hydrological Statistical Yearbook of the Heilongjiang basin. As shown in Figs. 4d and 5d, the climate-driven model adequately captures the variability in peak discharge measured at the gauging stations. Although the model is not captured to correspond specifically to the observed annual peak discharges limited by the uncertainties of input climate data generated by the Monte Carlo technique, the yearly peak flow ranking data between model output and observations show similar trends, inferring adequate model performance. HYDROTREND closely simulates the observed peak flow distribution as well as the maximum and minimum discharge during wet, average, and dry years (Figs. 4e–g and 5e–g). For this study, different return interval flood values were calculated using the GEV and P-III statistical methods based on the gauged and simulated daily maximum runoff data of the Yalu River basin from 1958 to 2012. Results show that simulations can represent observations for flood frequency analysis in the Yalu and Ai rivers (Fig. A2). Although the simulation results of the Ai River are slightly inferior to those of the Yalu River based on the GEV, the difference between the two methods is not significant when investigating the impacts of climate change and human activities on flood frequencies (100-, 50-, 20-year, etc.) (Fig. A2). We therefore confirm that the model can accurately capture flood magnitudes and recurrence intervals for the Yalu River.
4.1.2 Validation of long-term flood events
We used historical flood records of the Yalu River over the past 1000 years to further verify model performance. Estimates of peak flow data of the Yalu River during 1888–1958 and historical data of flooding disasters during 1000–1888 were obtained from the “Compilation of historical flood survey data in China” (Luo, 2006). The peak discharges observed in 1923 (32 000 m3 s−1) and 1907 (20 800 m3 s−1) were used to define the Yalu River's “devastating floods” and “immense floods”, respectively, based on historical flood records (these include whole-basin large flooding and local large flooding of the Yalu River) and estimated peak flow data during 1888–1948 (Fig. 6). Records of historical floods for the Yalu River are relatively scarce for 1000–1234, and flood events that have been adequately dated are predominantly “devastating floods” occurring during 1235–1888. However, historical records also identify the number of lower-magnitude “immense floods” that occurred during 1251–1368 (the Yuan Dynasty in China), 1369–1638 (the Ming Dynasty in China), and 1791–1910 (Late Qing Dynasty in China).
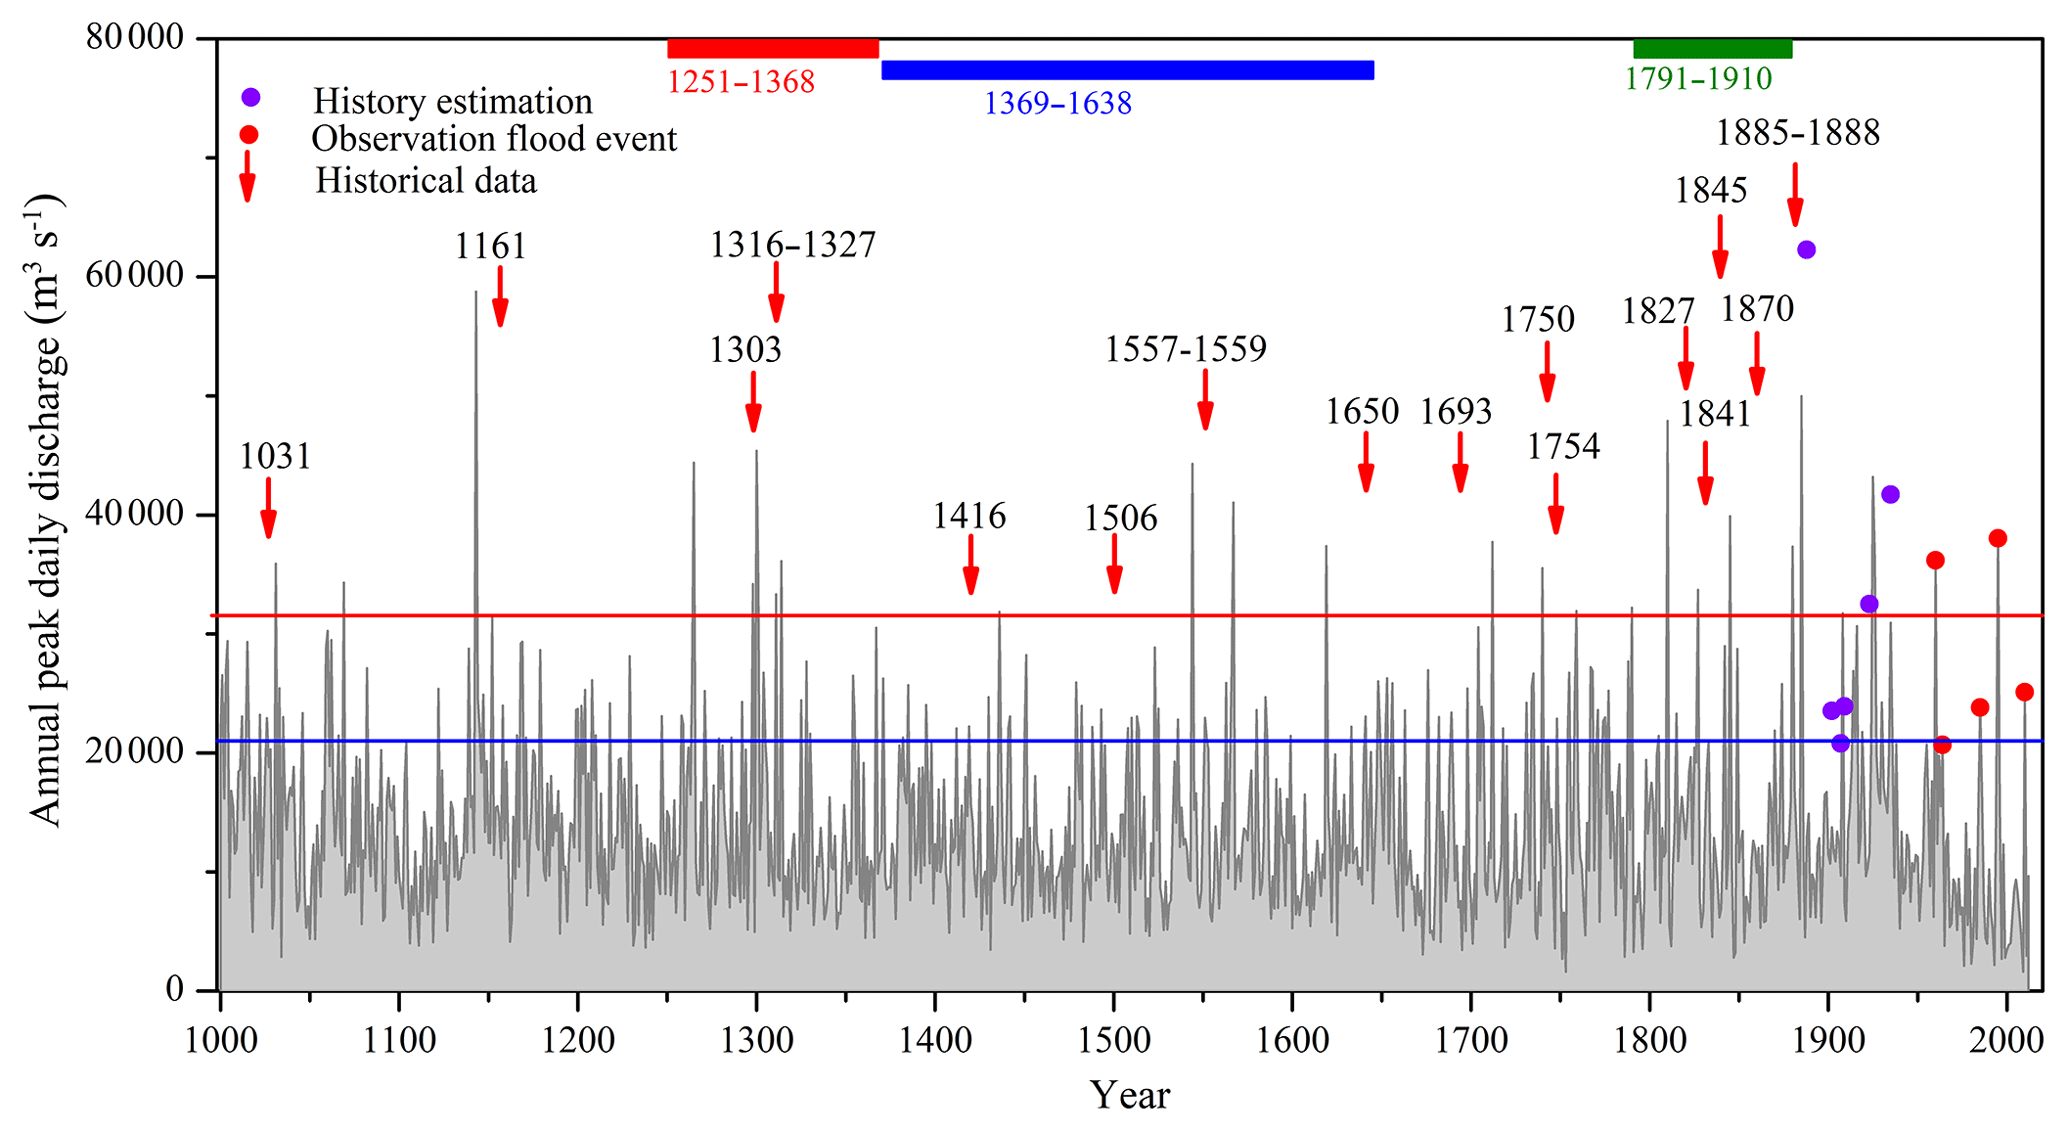
Figure 6Historical flood records and model-simulated annual peak daily discharges for the Yalu River over the past 1000 years. Red arrows indicate adequately dated historical records of devastating floods; the red and blue lines indicate the minimum peak discharge threshold to define devastating and immense floods, respectively; the red, blue, and green columns indicate the time periods in which sufficient data of the number of immense floods were available.
Validated results indicate that the occurrence frequency of devastating floods estimated by using the simulated peak flows matched the historical records; we identified high frequencies of devastating floods during 1250–1350 and 1840–1950 and a lower frequency of devastating floods during 1400–1800 (Fig. 6). Meanwhile, the number of immense floods recorded in the literature was similar to simulations for all time periods. There were 22 and 20.8 recorded immense floods per 100 years during 1251–1368 and 1911–1958, respectively, whereas the simulated immense floods were 21.2 and 18.4, respectively, in periods of higher rainfall intensity (Table 1). In contrast, due to lower precipitation intensities during the periods 1369–1638 and 1791–1910, the numbers of recorded immense floods per 100 years were reduced to 11.9 and 10.8, respectively, relative to 13.0 and 10.0 based on the model simulations (Table 1). These results confirm accurate model simulations of long-term flooding variability for the Yalu River basin.
Table 1The number of flood disasters for different time periods based on historical data and model simulations.
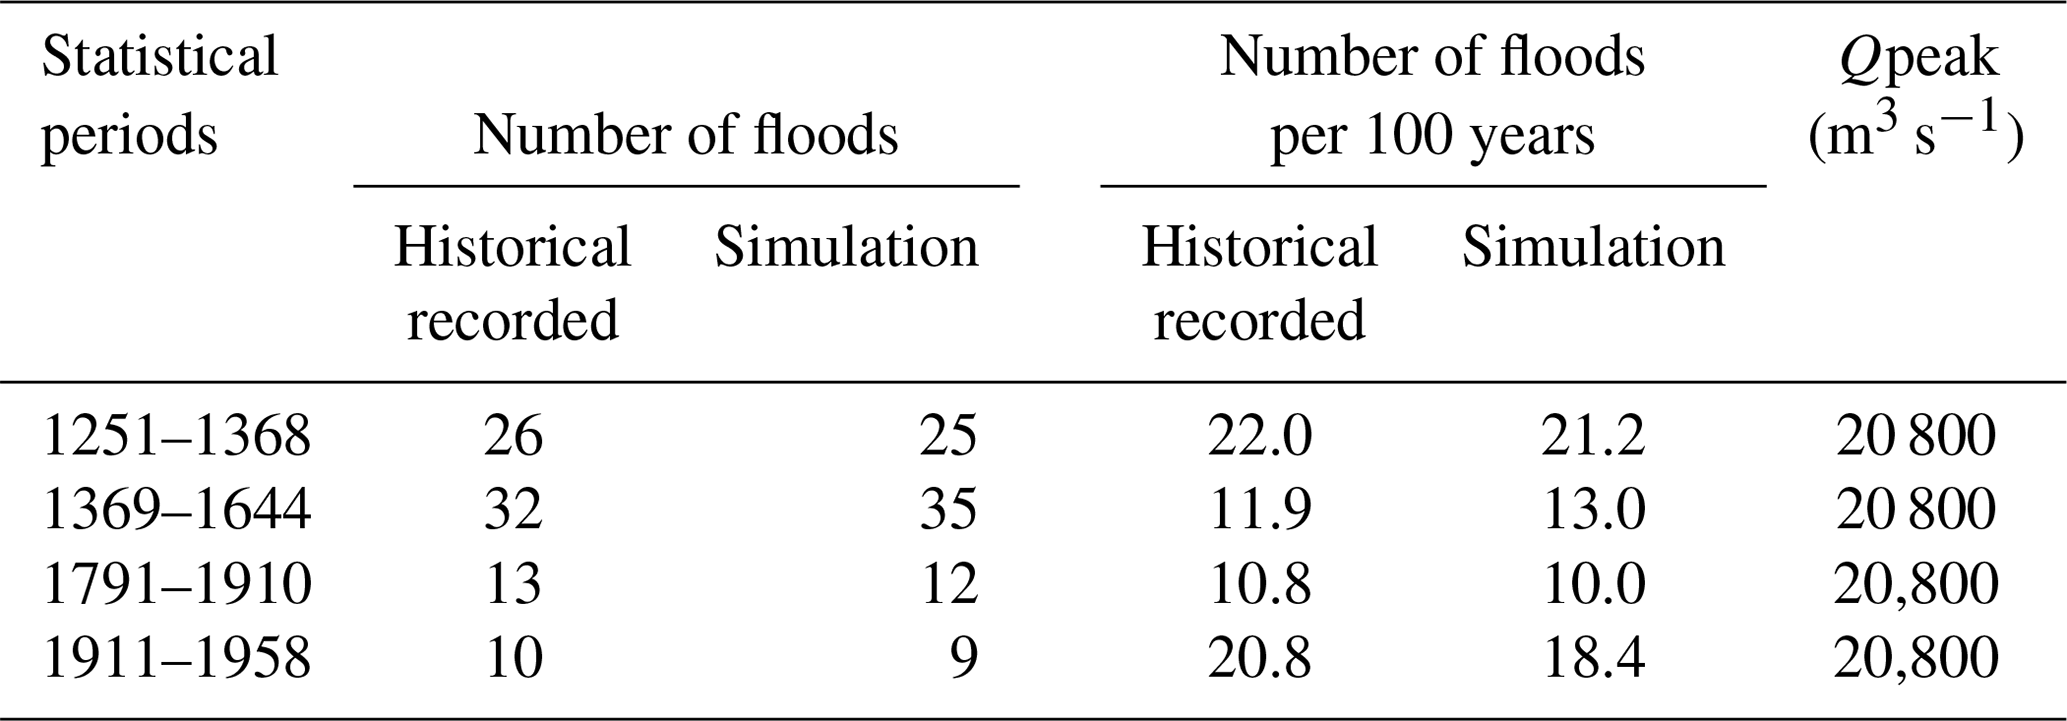
Qpeak: the minimal flood value to determine the occurrence of a flood event.
4.2 Model limitations and uncertainties
HYDROTREND showed a few limitations for simulating annual peak flows over the last 1000 years due to the uncertainties of input boundary conditions and model assumptions. The model can only simulate daily water discharge at the river outlet, which does not capture the riverine flow path and is not suitable for large rivers (unlike small rivers, large rivers have more complicated climatic characteristics) as there is equally spatial distributed rainfall for five runoff processes over the entire river basin. As shown in Figs. 4 and 5, although the model can accurately simulate the ranked yearly peak flow distribution for many years, such data were not captured to specifically correspond to the observed years because of the uncertainties of input climate data generated by the Monte Carlo technique. Meanwhile, the complex process of the impact of human activities on flood peak flow in this model was simplified to the effects of dam interception and changes in saturated hydraulic conductivity caused by man-made deforestation. To reduce the uncertainty of simulation results, multi-rainfall patterns generated by the Monte Carlo technique combined with climate data were applied in this study, and the GEV combined with the block maxima method was adopted to reduce the uncertainty of simulations by improving the quality of reconstructed samples. In this study, the bulk of the analysis for flood characteristics in special periods with different climate and human activities was conducted to mitigate the impacts of simplified boundary conditions.
4.3 Flood frequency analysis over the past millennium
4.3.1 Flood value estimates of different return intervals
River flood return intervals are estimated based on annual peak discharges. The accuracy of flood frequency estimations improves with longer timescales of peak flow data (Holmes and Dinicola, 2010). Currently, most rivers globally have <100 years of fluvial gauged data, which can be used to accurately estimate at least 100-year flood return intervals (Milliman and Farnsworth, 2013). However, one has to be cautious when applying these relatively short datasets to estimate longer-term flood return periods of >500 years as uncertainties rapidly increase by extrapolating return periods beyond the time period of observations. For this study, we were able to estimate higher return interval floods by combining the past 1000-year model simulated annual peak discharges of the Yalu River basin with the GEV statistical analysis (Fig. 7). The statistical analysis shows that the peak flows for the 10 000-year return flood event for the Yalu River are 88 321 m3 s−1. Peak discharges for the 1000- and 100-year return interval floods are 61 388 and 40 080 m3 s−1, respectively (Fig. 7).
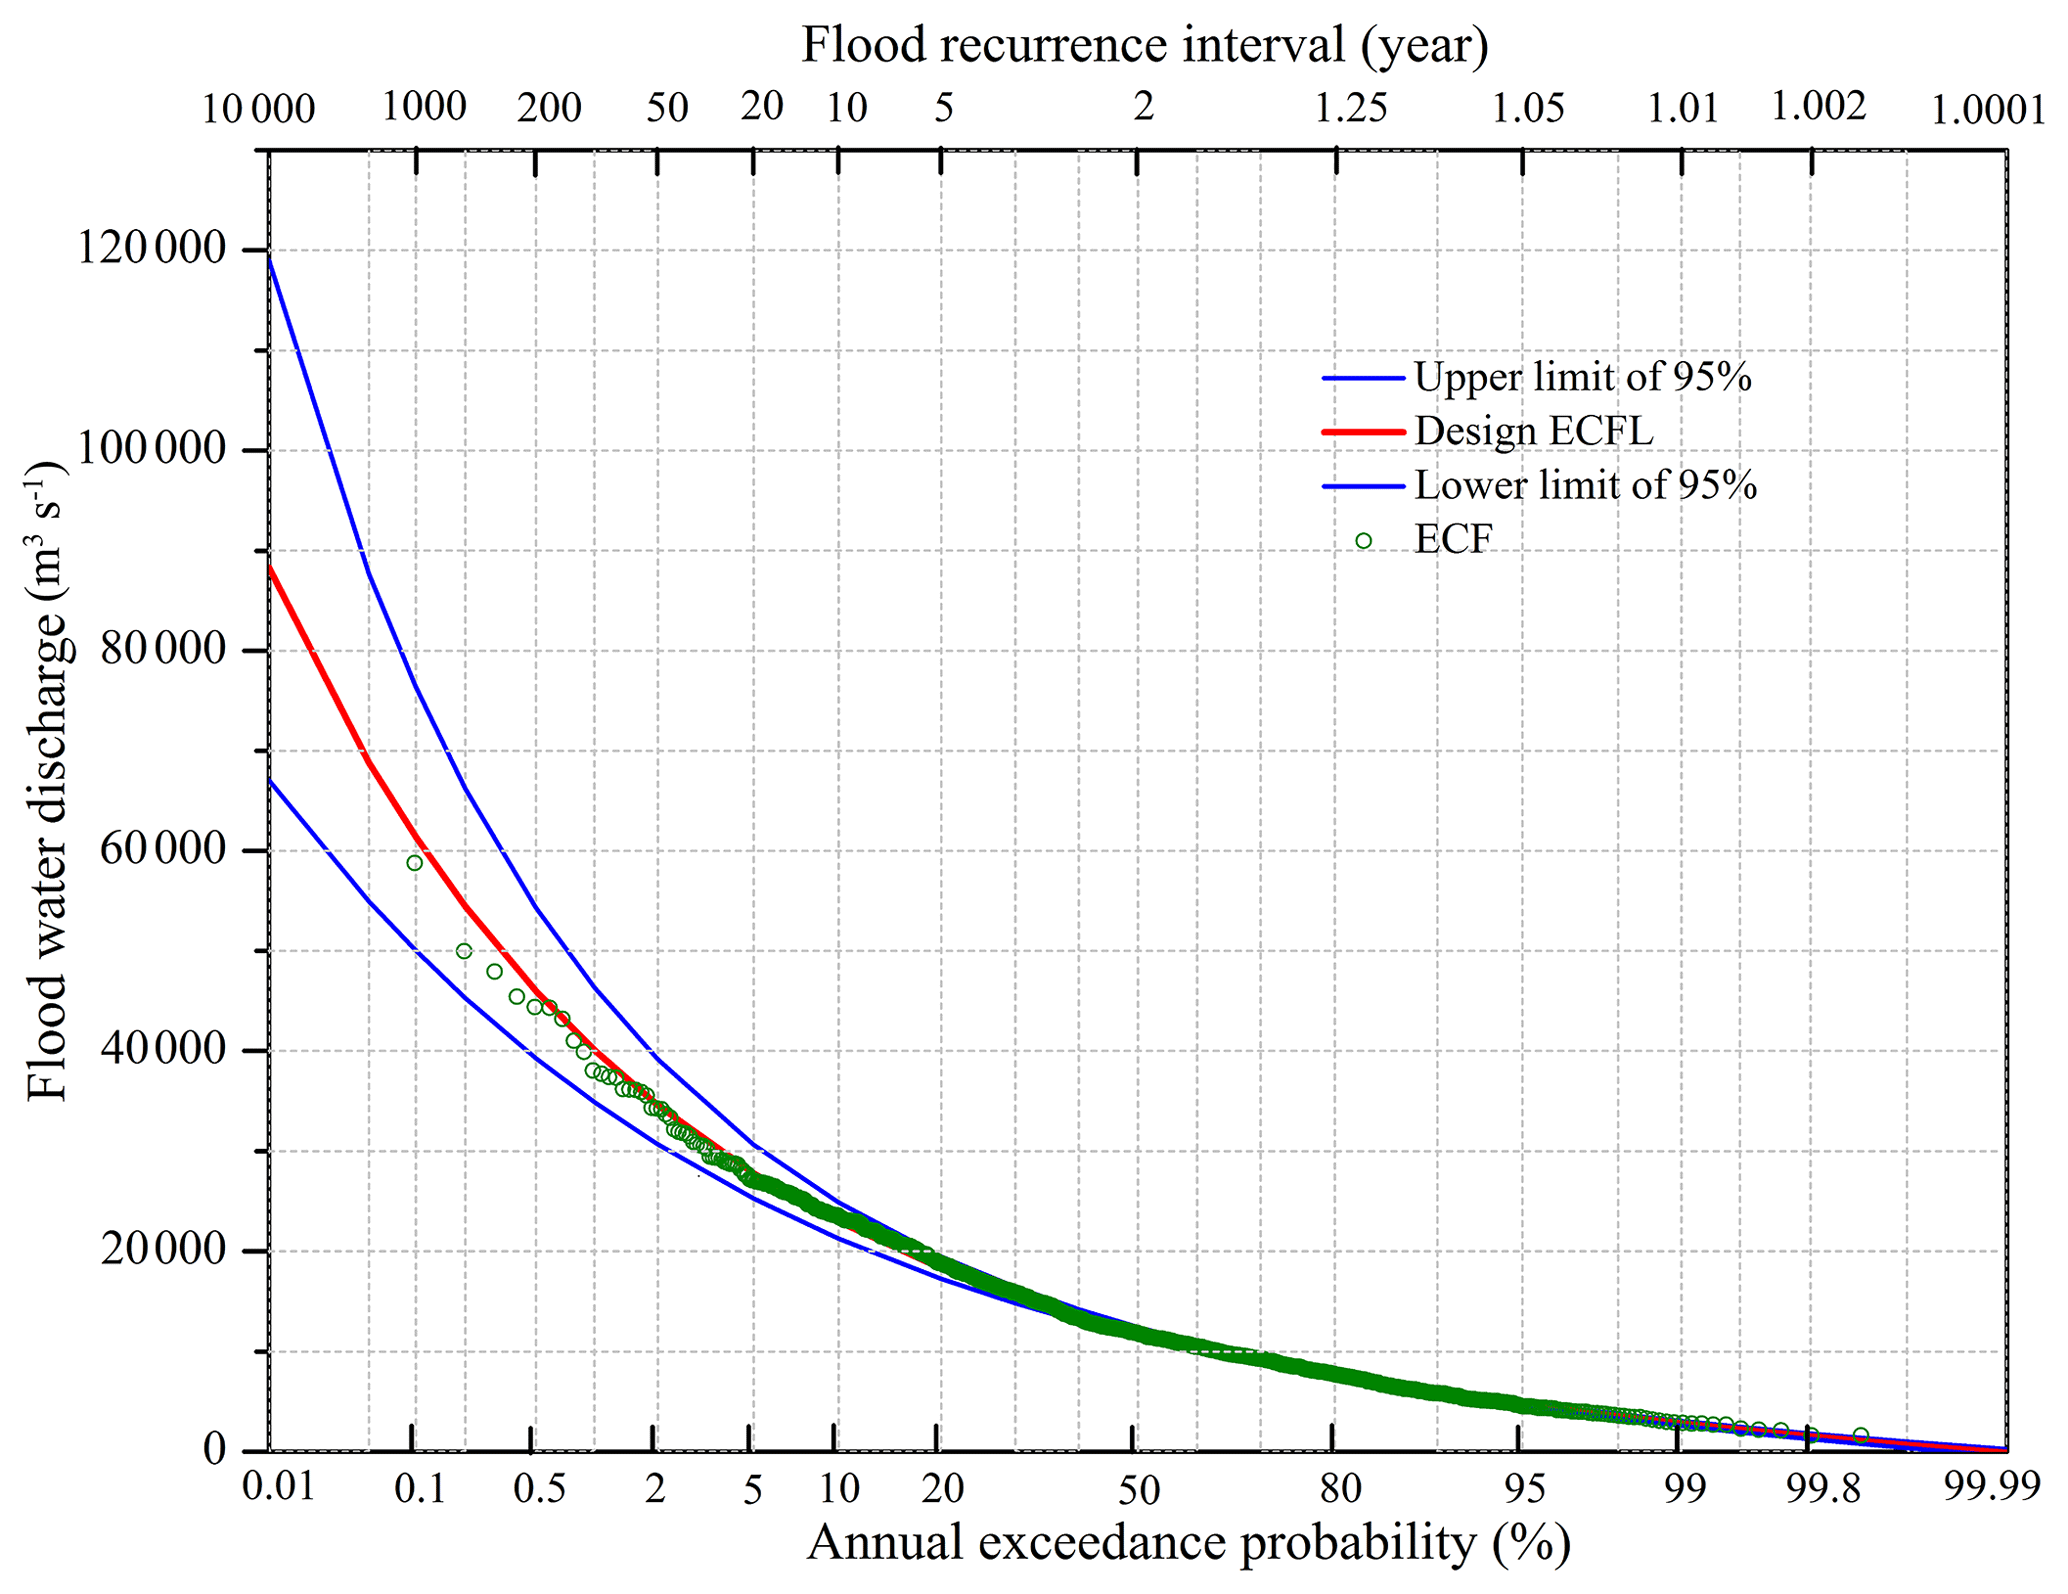
Figure 7Fitted frequency curves of annual maximum daily discharge for the Yalu River based on the GEV statistical method and simulated annual peak flows of the past 1000 years. The blue lines indicate the upper and lower limits of the 95 % confidence level, the red line indicates the design empirical cumulative frequency line (ECFL), and the green dots are the empirical cumulative frequency (ECF) for annual peak water discharges over the past millennium.
4.3.2 Changes in the flooding return intervals over the past millennium
Studies have indicated that the return intervals of river flooding adjust in response to climate change and human activities (Milly et al., 2002, 2005). Altered rainfall patterns (frequency, intensity, and spatial distribution) caused by climate variability and the influence of human activities (land use, impoundment, or diversion) on river runoff have significantly altered flood return periods (Holmes and Dinicola, 2010; Price et al., 2010). Both the climate and human activities for the Yalu River basin have changed dramatically over the past 1000 years. The climate of the Yalu River basin was colder and drier during 1451–1840: a period known as the LIA (Paulsen et al., 2003). During the LIA, the annual average rainfall and temperature in the region were 793 mm and 4.85 ∘C, respectively; the annual average precipitation reduced by 18 and 21 mm, and the annual average temperature decreased by 0.55 and 1.0 ∘C relative to the periods 1000–1450 and 1841–2012, respectively (Fig. 2d and e). Discharge of the Yalu River fluctuated between 6.4 % and 11.4 % under the influence of climate change (Sheng et al., 2019). In contrast to multi-year annual average precipitation, the frequency of extreme precipitation events for the Yalu River showed little difference between 1451–1850 and 1000–1450, 5.90 % and 6.67 %, respectively. However, the frequency of extreme rainfall events sharply increased to 10.47 % during 1840–2012 in response to changes in climate and human activities (Fig. 2). During 1000–1840, the basin had a population density of only 5.27 persons per km2, and ∼60 % of the basin was covered by forest (Fig. 2a and b). However, immigration, land reclamation, war, and rapid urbanization reduced forest coverage from 55 % in 1840 to 30 % in 1940 (Fig. 2b). Further, the construction of the dam in 1940 significantly influenced the hydrological characteristics of the Yalu River (Fig. 2c).
Flood return intervals of the Yalu River over the past 1000 years first show an increasing trend during 1000–1941 followed by a decrease in response to climate change and human activities till today (Fig. 8). Higher precipitation was estimated during 1000–1450 (816.5 mm yr−1) relative to 1450–1840 (793 mm yr−1; LIA), but the intensity and frequency of extreme rainfall events were similar between the two periods. Climate change led to a 5.4 % decrease in flood magnitude for the different flood return intervals during the LIA relative to the period 1000–1450. The average annual rainfall for the basin during 1841–1940 was similar to the LIA (1450–1840), but the intensity and frequency of extreme rainfall were significantly higher during 1841–1940 (8.0 %) relative to the LIA (5.90 %) (Liu et al., 2009, 2011). The estimated peak discharge of the different flood return events significantly increased during 1841–1940, and climate change had a greater impact on the 100- and 50-year floods relative to the shorter-term return events (Fig. 8). The estimated peak discharge of the 100- and 50-year return floods during 1841–1940 increased by 16.4 %–18.0 % compared with the LIA, and the 20-, 10-, and 5-year recurrence events increased by 11.7 %–14.4 % due to the increase in the frequency of extreme rainfall events.
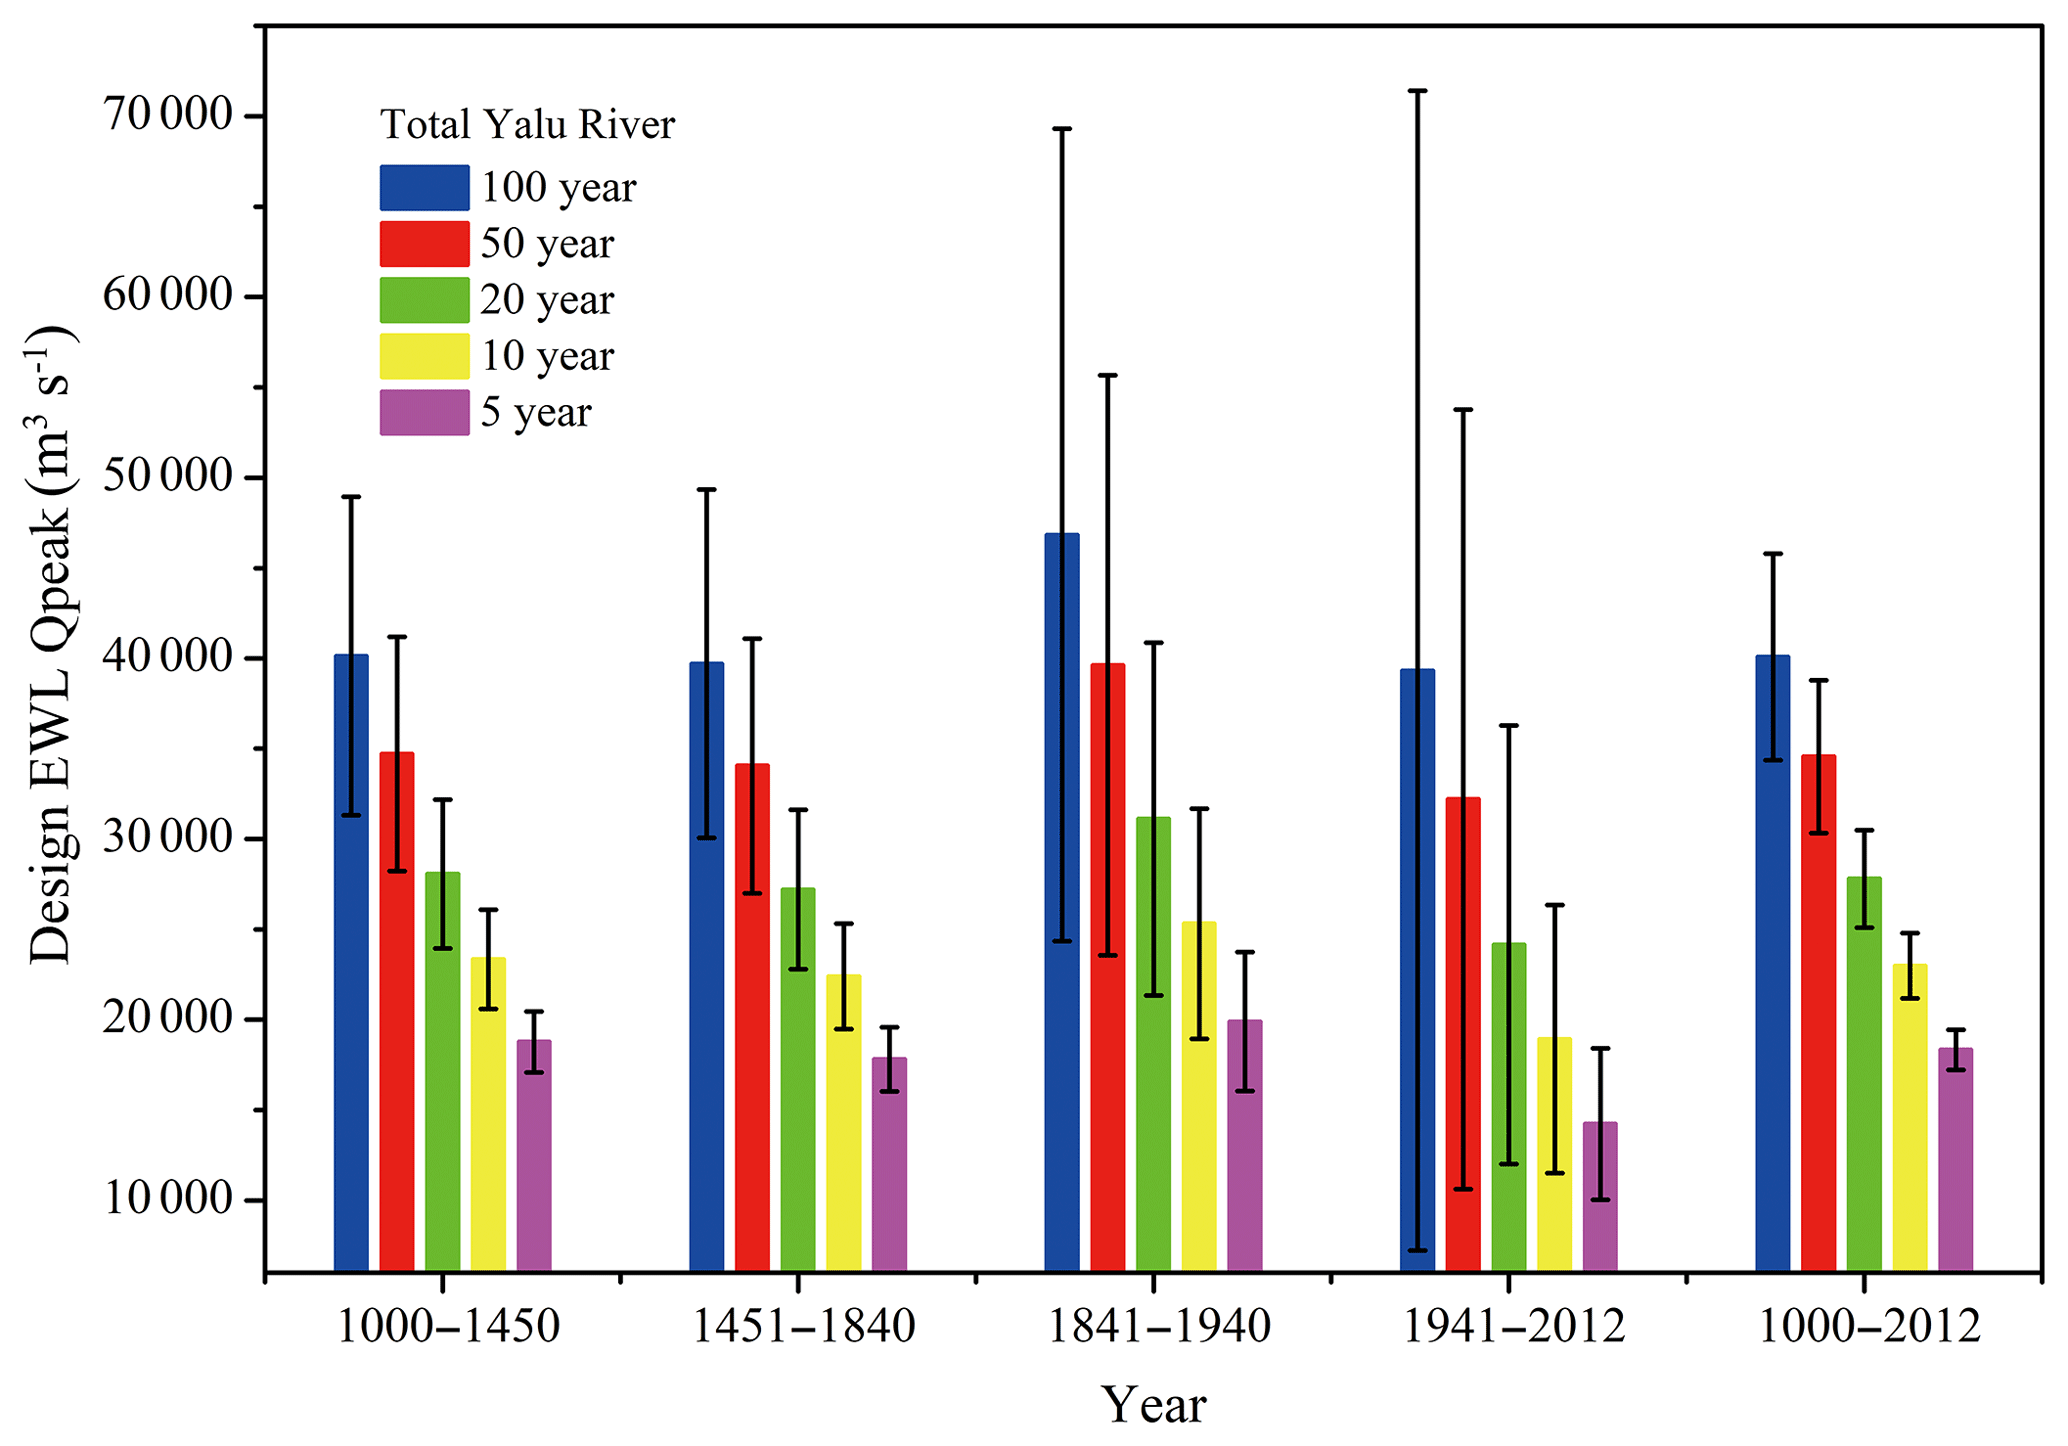
Figure 8Estimated peak discharges of the different flood recurrence intervals for the Yalu River based on simulated peak discharges during five periods combined with the GEV statistical method.
Higher peak discharges of the different flood recurrence events during 1841–1940 can be predominantly attributed to the increase in intensity and frequency of extreme rainfall events. However, deforestation induced by anthropogenic influences in the basin also contributed to the observed increase in the peak discharges. The Yalu River basin experienced higher rainfall intensity and increased human land-use coverage during 1941–2012 relative to 1841–1940, but the flood peak discharge had significantly reduced due to the construction of cascading reservoirs. Following the construction of the dam in 1940, estimated peak flows for the 20-, 10-, and 5-year return events decreased by 16.8 %–23.6 %, and the 100- and 50-year recurrence intervals decreased by 9.9 %–12.8 %.

Figure 9Wavelet analysis for new time-series datasets generated by the thresholding process for estimated annual rainfall and peak discharge over the past 1000 years in the Yalu River based on the level of extreme rainfall events and design floods.
4.4 Factors controlling flood frequency variability
4.4.1 Qualitative flooding frequency analysis in response to basin changes
Simulated annual peak discharge, including impacts of climate change and human activities, was thresholding processed (over threshold for 1 and otherwise 0) based on design flood levels of different flood return intervals over the past 1000 years, and the same process was adopted for annual rainfall based on the standard of extreme rainfall events (strong rainfall in wet years > 942 mm yr−1) in the Yalu River, as shown in Table A2. Time-series datasets were generated using a wavelet analysis to qualitatively investigate the dominant controls on flood frequency variability for the Yalu River over the past 1000 years (Fig. 9). The wavelet results showed that during 1130–1190, 1280–1340, 1520–1580, and 1880–1940, the occurrence frequencies of floods exceeding the 50-year return period standard were much higher than those of other periods, and related extreme rainfall events also showed similar trends (Fig. 9). The occurrence frequency of floods over the 50-year standard during 1000–1450 was close to the LIA (1450–1840), similar to the intensity and frequency of extreme rainfall events. In contrast, occurrence frequencies of floods over the 20- and 10-year standards during 1000–1450 were much higher than that of the LIA, which was more related to the variations of multi-year average precipitation (Fig. 9). Compared with the LIA, occurrence frequencies of floods over 50 years during 1841–1940 rapidly increased, and occurrence frequencies of floods over the 10-year standard were basically at the same level in response to the significant increasing intensity and frequency of extreme rainfall events and similar average annual rainfall for both periods (Fig. 9). Our results demonstrate that the frequency and intensity of extreme precipitation caused by climate change have a dominant control on the frequencies of large floods (100-year, 50-year). However, medium- and small-magnitude floods (20-, 10-, and 5-year) are more closely linked to long-term climatic trends of warming and humidity (Figs. 2 and 9).
As shown in Fig. 9, the occurrence frequencies of floods over different return interval standards rapidly decreased after 1940 due to the construction of cascading reservoirs, despite the increasing frequency and intensity of extreme precipitation events in response to climate change and human activities. The results demonstrate that the construction of reservoirs can effectively reduce flood disasters for the Yalu River basin despite having little effect on the long-term runoff to the sea (Sheng et al., 2019); additionally, the declines of occurrence frequencies for medium- and small-magnitude floods (20-, 10-year) predominated over those of large floods (50-year) due to the construction of flood retention dams.
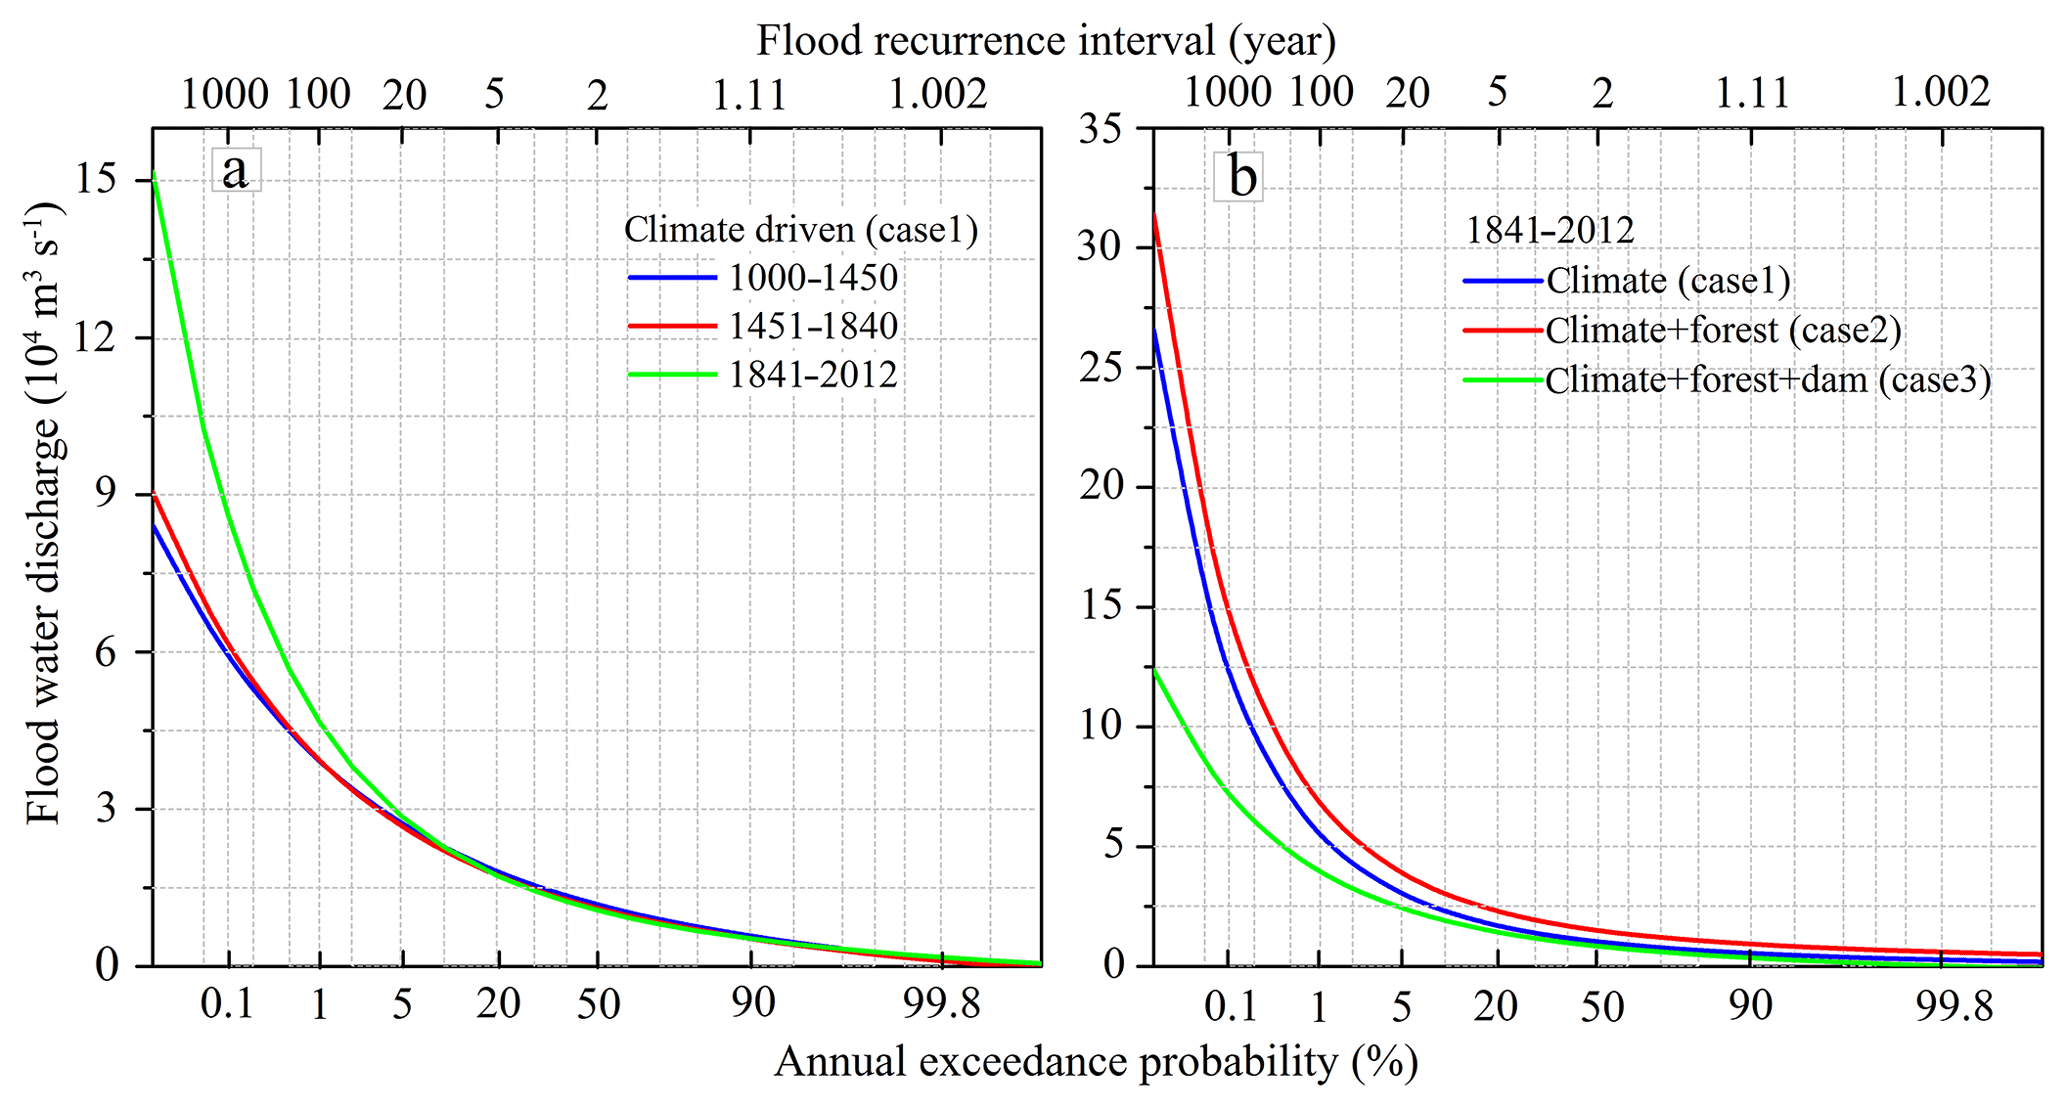
Figure 10Frequency curves of annual maximum daily discharge for the Yalu River under different scenarios: (a) design floods estimated by three periods with different climatic characteristics, and the different effects of human activities in three periods were eliminated; (b) design floods estimated by dataset during 1841–2012 by setting three scenarios (climate, climate + forest cover, and climate + forest cover + dam).
4.4.2 Quantitative flood frequency predictions under climate change and human activity scenarios
To quantify the impact of climate change and human activities on basin floods, we set up three different scenarios: Case 1, climate change alone; Case 2, climate change + forest cover change; and Case 3, climate change + forest cover change + emplacement of dams for flood retention. Although the climate during 1000–1450 was warmer and wetter than that of the LIA, the fitted flood frequency curves of the two periods were similar when driven only by climate change (Case 1) (Fig. 10a). However, the flood frequency curves of 1841–2012 are significantly higher than the other two periods (1000–1450 and 1451–1840) due to the higher frequency of extreme rainfall events (Fig. 10a). These results further confirm that flood frequency for the Yalu River is controlled by the frequency and intensity of extreme rainfall. The frequency of the 100-year flood recurrence interval for the Yalu River basin during 1000–1840 increased to a 50-year recurrence interval during 1841–2012 under the influence of climate change (Fig. 10a). Further, the estimated flood magnitude of the 100-, 50-, and 20-year floods for 1841–2012 increased by 19.1 %, 13.9 %, and 7.77 %, respectively, compared to 1451–1840 (Fig. 10a and Table 2).
Table 2Increase in the magnitude of design floods induced by climate change in the Yalu River were estimated by comparing results during 1841–2012 and the LIA (1451–1840) for changes driven only by the climate change scenario (Case 1); the increase in design floods induced by human land use and the decrease caused by dams were estimated based on the results of three scenarios (Cases 1–3) during 1841–2012.
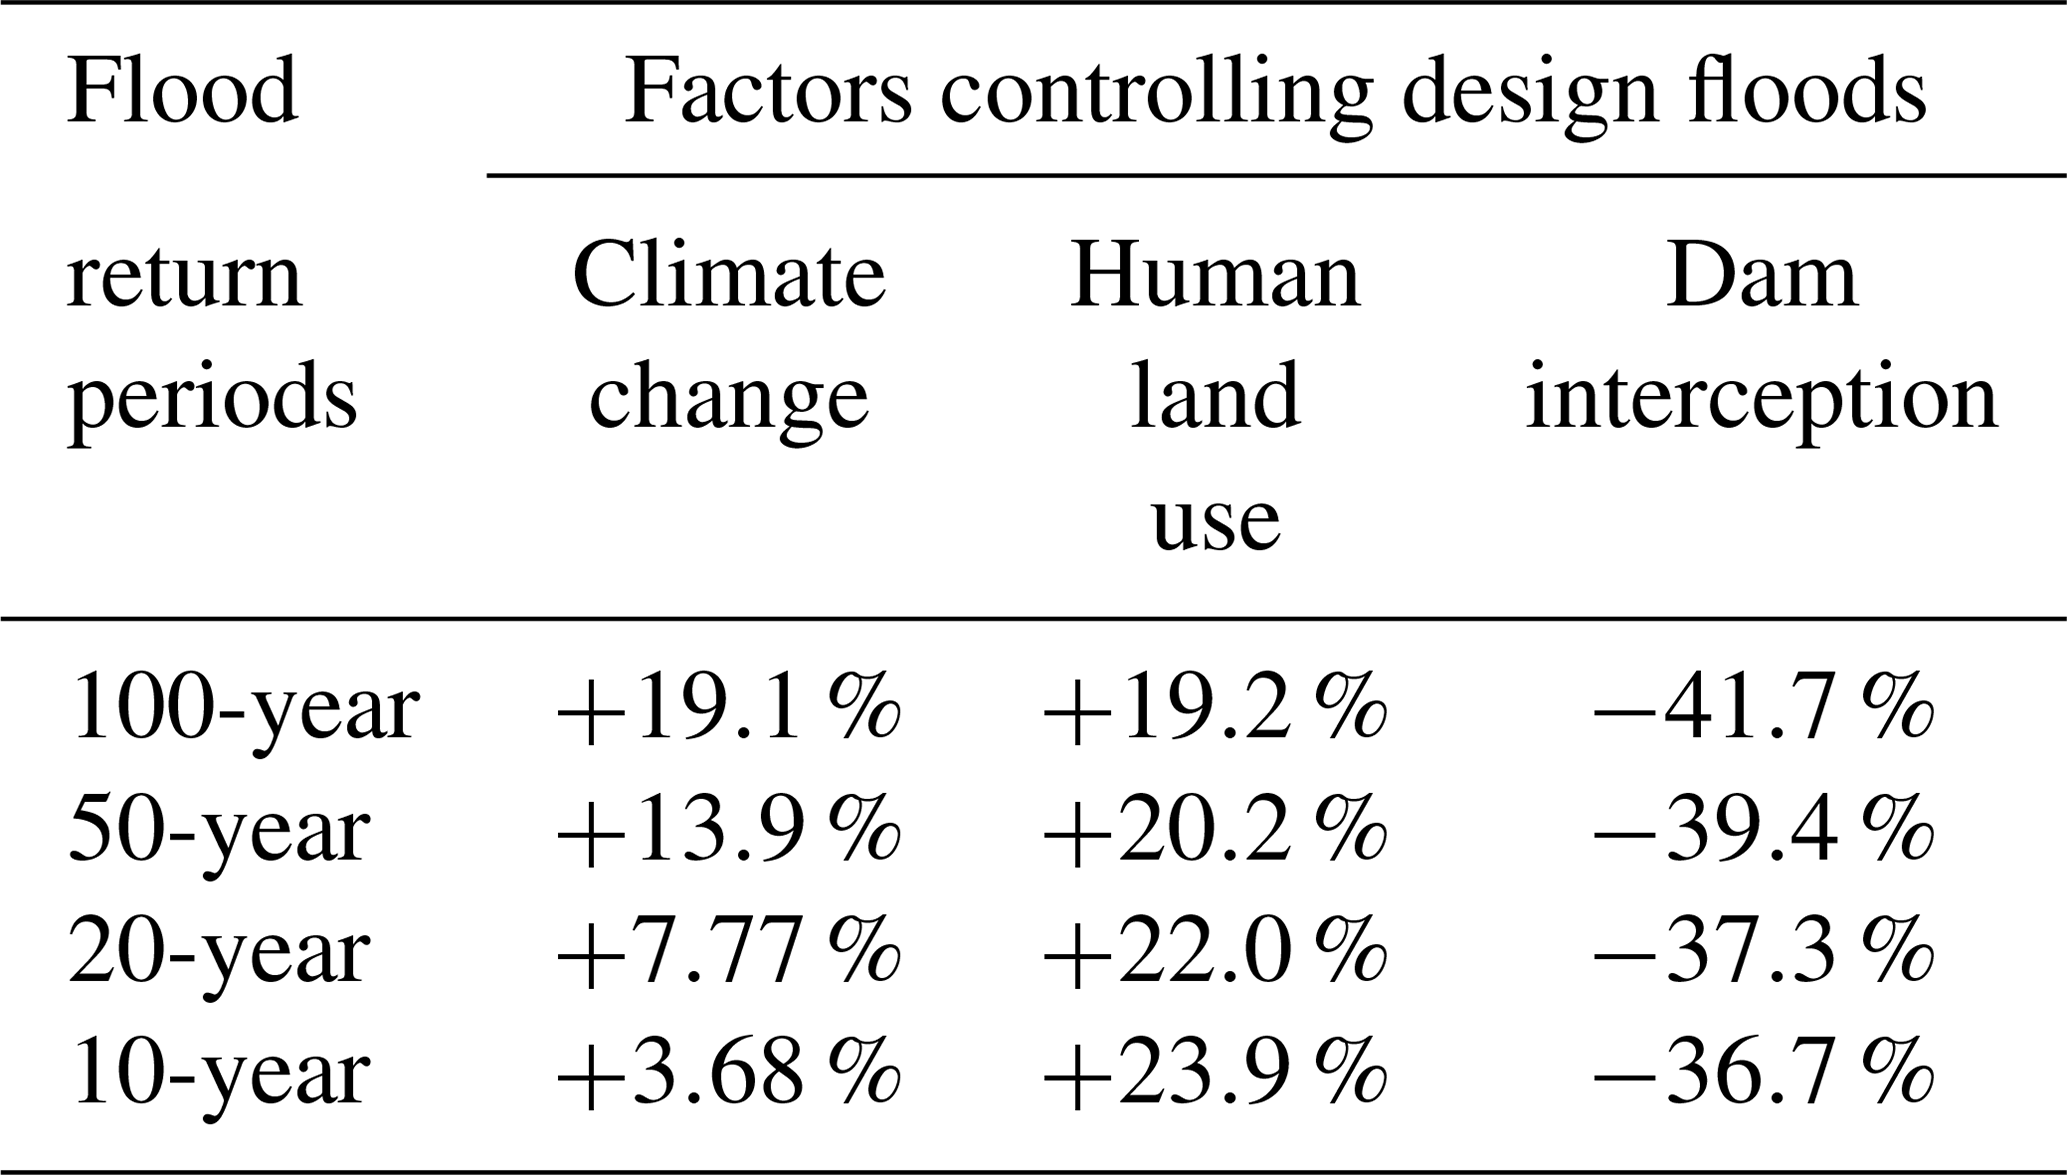
Human activities only started to significantly influence the Yalu River basin from 1840, and thus we only compared the flood return intervals of the three scenarios (Cases 1–3) for 1841–2012 (Fig. 10b). When comparing the fitted flood frequency curves of Case 2 with Case 1, we found that the reduction of forested area (conversion of forested area to agricultural land) for the Yalu basin increased the likelihood of floods (Fig. 10b). Under the impact of human land use, the flood magnitude of the 100- and 50-year events increased by 19.2 %–20.3 %, while the 20-, 10-, and 5-year events increased by 22.0 %–26.3 % (Table 2). Human land use increased the frequency of the 20- and 10-year floods to 10- and 5-year floods, respectively, which significantly increased the occurrence likelihood of small- and medium-sized floods in the Yalu basin (Fig. 10b).
The simulated scenarios for Case 2 and Case 3 infer the significant reduction in the frequency of flood occurrence due to the construction of the cascading reservoirs: the return frequency of the 20-year flood increased to a return period around 50 or 100 years; the return frequency of the 10-year flood increased to a 20- to 50-year return period; and the flood magnitude of the 100-, 50-, 20-, and 10-year events rapidly decreased by 36.7 %–41.7 % (Fig. 10b and Table 2). Although the dams, built for flood retention, have significantly reduced the magnitude of floods for the Yalu basin, the flood magnitudes of the different recurrence intervals during 1841–2012 were still higher compared to those during the period 1000–1840 owing to the increase in extreme climate events. Therefore, flooding of the Yalu River basin could further increase in the future.
4.5 Future flooding implications
Both observational data and model projections point toward increasing intensity and frequency of extreme precipitation events worldwide with some regional variability (Jian et al., 2014). In general, the impacts of global warming on the distribution of energy and the water–atmosphere cycle are increasing the frequency of extreme precipitation events. Coupled climate and hydrological models have also projected an increase in extreme floods in the future (Dankers and Feyen, 2008; Hirabayashi et al., 2013; Alfieri et al., 2015). In addition to climate change, human activities such as river engineering (flood diversion, dam construction, and water storage) and land-use change (agricultural and urbanization) will directly or indirectly affect the intensity and frequency of fluvial flooding (Willett et al., 2007; Price et al., 2010; Jian et al., 2014). River basin conditions will determine the discharge characteristics and percentage of rainfall that will be routed as (sub)surface runoff, which will be amplified by deforestation, increasing the magnitude and frequency of flood events. In contrast, river engineering, including flood diversions, dam construction, and water storage, will reduce the chance of flooding.
Increasing forest coverage can minimize the magnitude and frequency of future extreme floods to a certain extent. However, without the implementation of adequate water conservancy measures, the risk of flood disasters will increase in response to increasing intensity and frequency of extreme rainfall events. Furthermore, the risk of flood disasters in small- to medium-sized river basins is more significant compared to larger rivers, as larger rivers with abundant tributaries and lakes have a larger buffering capacity to temporarily store access water and therefore prevent flooding under high-intensity rainfall events. In contrast, small- and medium-sized rivers are more sensitive to extreme rainfall events, and localized extreme precipitation events caused by tropical storms and cyclones are more likely to cause extreme flooding.
The hydrological model HYDROTREND accepted the high-resolution climate model ECHO-G output successfully and captured the magnitude and frequency of flood events for the Yalu River over the last 1000 years. Over this period, flood frequencies initially increased during 1000–1940, followed by a decrease to the present day. The magnitudes of the 100- and 50-year return floods significantly decreased for the Yalu River over the last century but remained higher than those during 1000–1840. Furthermore, the design flood magnitudes for 20, 10, and 5 years were the lowest over the last century. The larger-magnitude floods are predominantly controlled by the intensity and frequency of extreme rainfall events, whereas the medium- and small-magnitude floods are predominantly linked to long-term cycles in temperature and humidity.
The frequencies of the 100-year flood events for the Yalu River increased to the return period of 50 years under the impact of climate change since 1840. Unlike climate change, we found human activities to either enhance or reduce flood disasters in the region depending on the type of activity. Estimated flood magnitudes for the Yalu River increased by 19.2 %–20.3 % due to an increase in human land use during 1840–2012, while the construction of cascading reservoirs effectively reduced flooding after 1940. Dam interception significantly reduced estimated peak flows for different return periods of floods by 36.7 %–41.7 %. The case of the Yalu River indicates that, compared with larger basins, mountainous rivers are more prone to flood disasters due to their relatively poor capacity for hydrological regulation when responding to extreme climatic events. Therefore, the implementation of effective river-engineering measures (such as flood diversions and dam construction) is necessary to minimize flood risks. Furthermore, the current flood prevention standard should also be revised owing to the increasing frequency and magnitude of flooding in the region. Although the use of HYDROTREND with climate model predictions to quantify flood magnitudes and frequencies is essential, further studies are required to address the uncertainty in data for climate change predictions and to better understand various complex influencing factors in flood simulation.
Table A1Most significant input parameters of HYDROTREND: an example for the Yalu River.
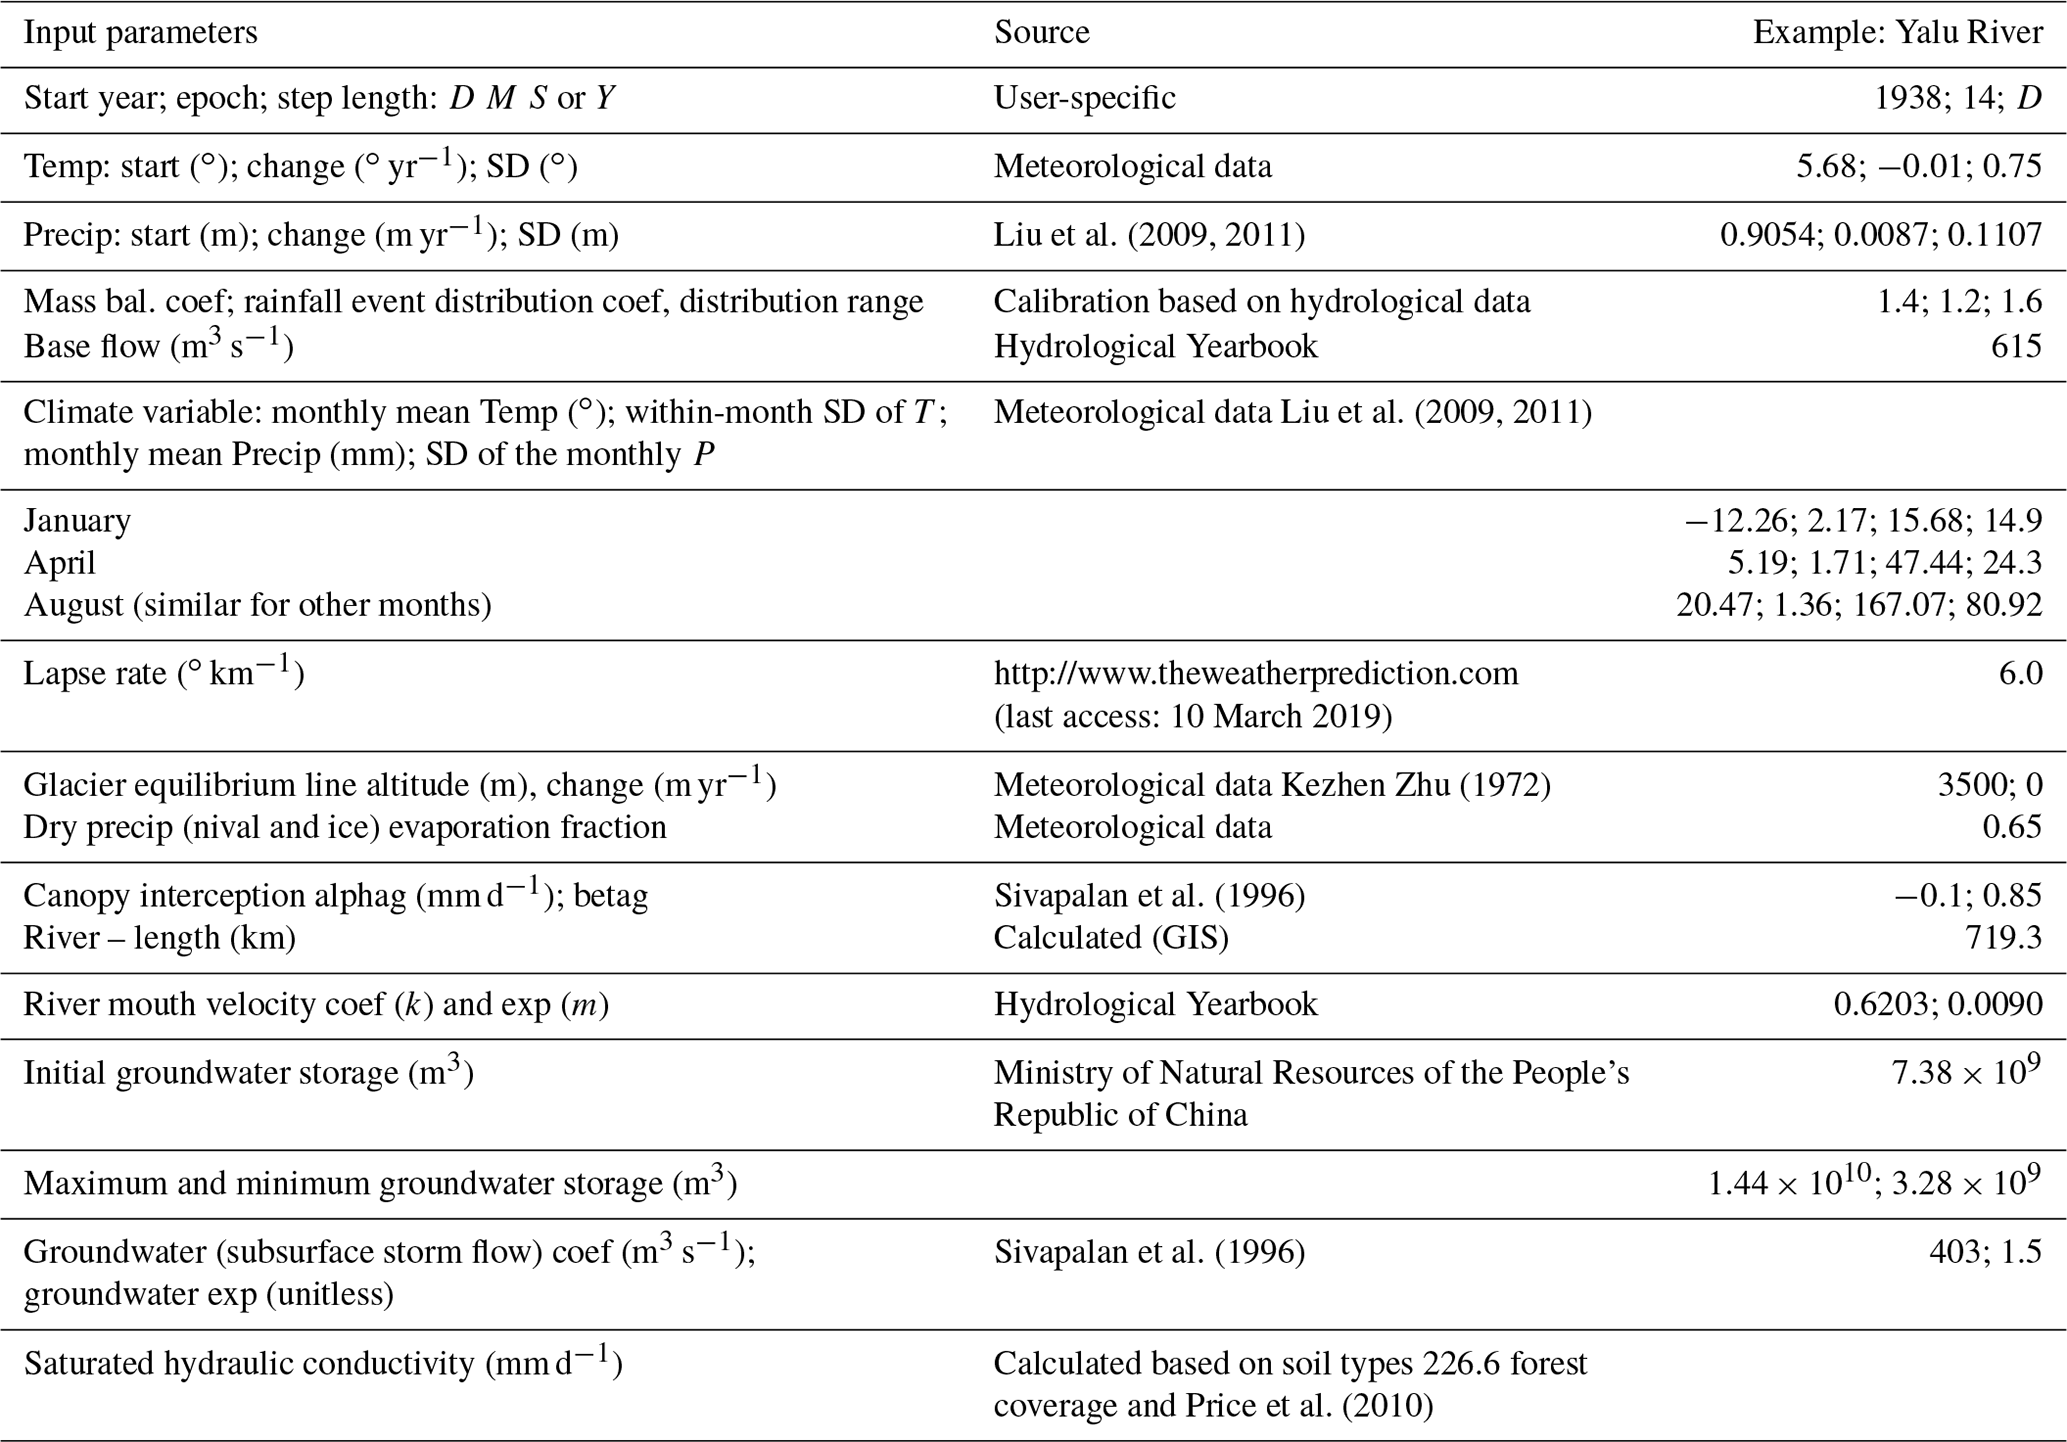
Table A2Different rainfall conditions (wet, average, and dry years) and rainfall forms (strong, moderate, and weak) for the Yalu and Ai rivers.
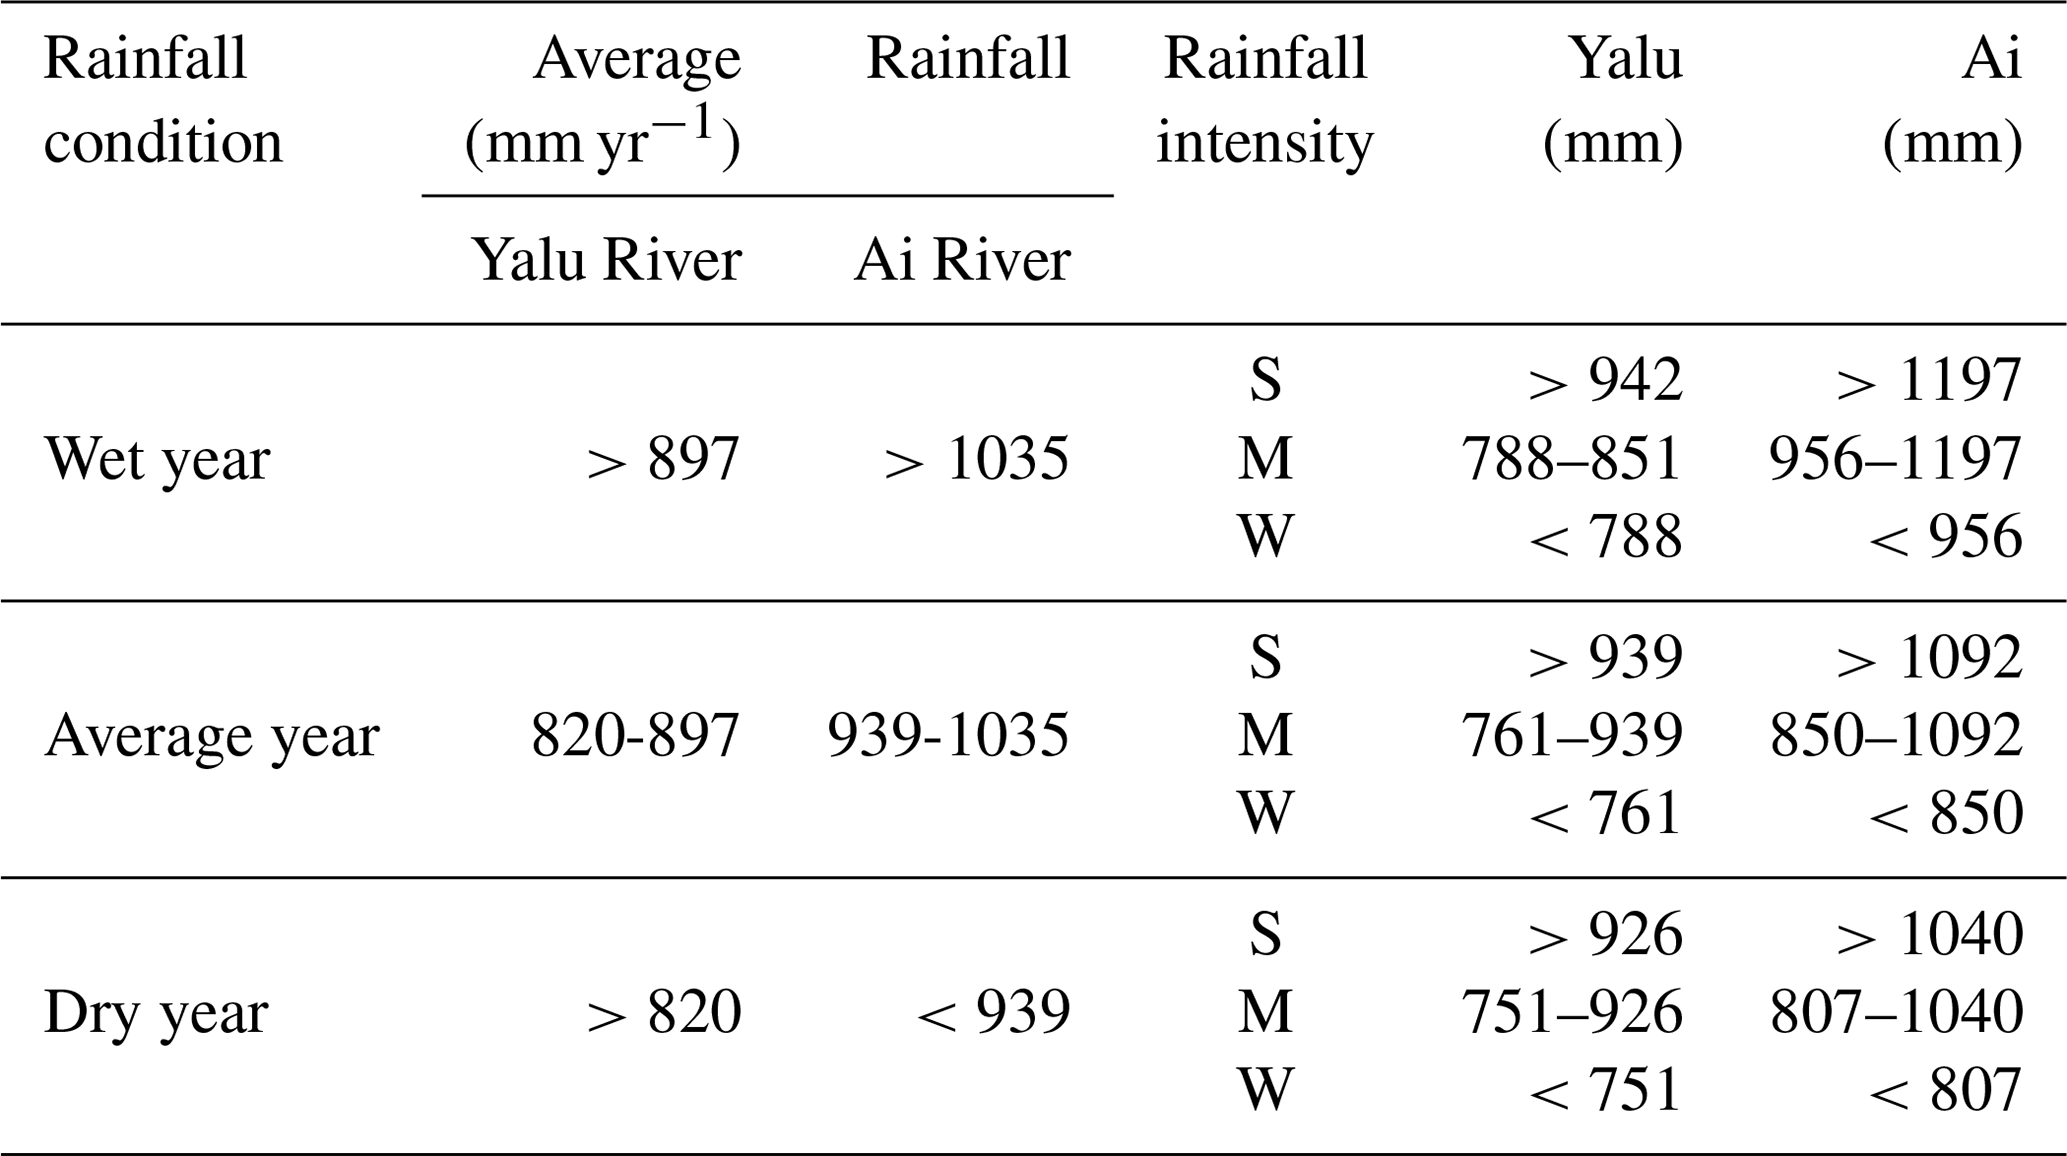
S, M, and W are defined as strong, moderate, and weak rainfall (SMW) forms in different rainfall conditions (wet, average, and dry years).

Figure A1The classification method for different rainfall conditions (wet, average, and dry years) in the Yalu and Ai rivers.

Figure A2Comparison between the observed and simulated return interval peak discharges in the Ai River and Yalu River based on the GEV and P-III methods. The design floods for the period 1958–2012 in the Ai River (a) and Yalu River (b) and (c) the design floods for the period 1000–2012 in the total Yalu River.
The modeling code is available from CSDMS (https://csdms.colorado.edu /wiki/Model:HydroTrend, last access: 20 July 2018) (Kettner, 2018); the code for the block maxima method of GEV is available on CodeForge, which is a website for the free sharing of open-source codes (http://www.codeforge.com, last access: 1 June 2019) (CodeForge, 2019). The data are available upon request.
HS, JHG, and YPW designed the study. AJK and HS carried out the calculations. HS drafted the manuscript. XXM, XCF, YS, and GS contributed to results discussion and modified the text.
The authors declare that they have no conflict of interest.
We thank Liu Jian for her suggestions on the ECHO-G climate model. We also grateful to the HESS editor Elena Toth and anonymous reviewers for their constructive comments on this paper.
This research was supported by the Natural Science Foundation of China (grant nos. 41576043, 41625021, and 41530962), the Fundamental Research Funds for the Central Universities, and the Innovation Program of the Shanghai Municipal Education Commission (grant no. 2019-01-07-00-05-E00027). Albert J. Kettner was supported through the US National Science Foundation (grant no. 0621695).
This paper was edited by Elena Toth and reviewed by two anonymous referees.
Alfieri, L., Burek, P., Feyen, L., and Forzieri, G.: Global warming increases the frequency of river floods in Europe, Hydrol. Earth Syst. Sci., 19, 2247–2260, https://doi.org/10.5194/hess-19-2247-2015, 2015.
Cai, W., Borlace, S., Lengaigne, M., Van Rensch, P., Collins, M., Vecchi, G., Timmermann, A., Santoso, A., McPhaden, M. J., and Wu, L.: Increasing frequency of extreme El Niño events due to greenhouse warming, Nat. Clim. Change, 4, 111–116, https://doi.org/10.1038/nclimate2100, 2014.
Chen, Z.: China Gulf Chronicle, Ocean Press, Beijing, China, 1998.
CodeForge: Extreme Value Theory in a variety of functions and process images, matlab achieve, available at: http://www.codeforge.com, last access: 1 June 2019.
Dankers, R. and Feyen, L.: Climate change impact on flood hazard in Europe: An assessment based on high-resolution climate simulations, J. Geophys. Res.-Atmos., 113, 1–17, https://doi.org/10.1029/2007jd009719, 2008.
Ferreira, A. and De Haan, L.: On the block maxima method in extreme value theory: PWM estimators, Ann. Stat., 43, 276–298, https://doi.org/10.1214/14-AOS1280, 2015.
Field, C. B., Barros, V., Stocker, T., Qin, D., Dokken, D., Ebi, K., Mastrandrea, M., Mach, K., Plattner, G., and Allen, S.: IPCC 2012, Managing the risks of extreme events and disasters to advance climate change adaptation, in: A special report of the Intergovernmental Panel on Climate Change, Cambridge University Press, Cambridge, UK, 582 pp., 2012.
Gao, J. H., Xu, X., Jia, J., Kettner, A. J., Xing, F., Wang, Y. P., Yang, Y., Qi, S., Liao, F., and Li, J.: A numerical investigation of freshwater and sediment discharge variations of Poyang Lake catchment, China over the last 1000 years, Holocene, 25, 1470–1482, https://doi.org/10.1177/0959683615585843, 2015.
Goel, N. and De, M.: Development of unbiased plotting position formula for General Extreme Value distributions, Stoch. Hydrol. Hydraul., 7, 1–13, https://doi.org/10.1007/BF01581563, 1993.
Gomez, B., Mertes, L. A., Phillips, J., Magilligan, F., and James, L.: Sediment characteristics of an extreme flood: 1993 upper Mississippi River valley, Geology, 23, 963–966, https://doi.org/10.1130/0091-7613(1995)023<0963:SCOAEF>2.3.CO;2, 1995.
Hirabayashi, Y., Mahendran, R., Koirala, S., Konoshima, L., Yamazaki, D., Watanabe, S., Kim, H., and Kanae, S.: Global flood risk under climate change, Nat. Clim. Change, 3, 816–821, https://doi.org/10.1038/nclimate1911, 2013.
Holmes Jr., R. R. and Dinicola, K.: 100-Year flood–it's all about chance, US Geological Survey General Information Product, US Geological Survey, Virginia, USA, 106, p. 1, 2010.
Jian, F., Du, J., Wei, X., Shi, P., and Feng, K.: Advances in the Study of Climate Change Impacts on Flood Disaster, Adv. Earth Sci., 29, 1085–1093, https://doi.org/10.11867/j.issn.1001-8166.2014.09.1085, 2014.
Jongman, B., Ward, P. J., and Aerts, J. C.: Global exposure to river and coastal flooding: Long term trends and changes, Global Environ. Change, 22, 823–835, 2012.
Kettner, A. and Syvitski, J. Fluvial responses to environmental perturbations in the Northern Mediterranean since the Last Glacial Maximum, Quaternary Sci. Rev., 28, 2386–2397, https://doi.org/10.1016/j.quascirev.2009.05.003, 2009.
Kettner, A. J.: Hydro Trend, version 3.0, available at: https://csdms.colorado.edu/wiki/Model:HydroTrend, last access: 20 July 2018.
Kettner, A. J. and Syvitski, J. P. M.: HYDROTREND v.3.0: A climate-driven hydrological transport model that simulates discharge and sediment load leaving a river system, Comput. Geosci., 34, 1170–1183, https://doi.org/10.1016/j.cageo.2008.02.008, 2008.
Kettner, A. J., Cohen, S., Overeem, I., Fekete, B. M., Brakenridge, G. R., and Syvitski, J. P.: Estimating Change in Flooding for the 21st Century Under a Conservative RCP Forcing: A Global Hydrological Modeling Assessment, in: Global Flood Hazard: Applications in Modeling, Mapping, and Forecasting, edited by: Schumann, G. J.-P., Bates, P. D., Apel, H., and Aronica, G. T., John Wiley & Sons, Hoboken, USA, 157–167, https://doi.org/10.1002/9781119217886.ch9, 2018.
Kharin, V. V. and Zwiers, F. W.: Estimating extremes in transient climate change simulations, J. Climate, 18, 1156–1173, https://doi.org/10.1175/JCLI3320.1, 2005.
Kim, S., Shin, H., Joo, K., and Heo, J.-H.: Development of plotting position for the general extreme value distribution, J. Hydrol., 475, 259–269, https://doi.org/10.1016/j.jhydrol.2012.09.055, 2012.
Kundzewicz, Z. W. and Robson, A. J.: Change detection in hydrological records—a review of the methodology, Hydrolog. Sci. J., 49, 7–19, https://doi.org/10.1623/hysj.49.1.7.53993, 2004.
Legutke, S. and Voss, R.: ECHO-G, the Hamburg atmosphere-ocean coupled circulation model, DKRZ technical report 18, DKRZ, Hamburg, 1999.
Liu, J., Wang, B., Ding, Q., Kuang, X., Soon, W., and Zorita, E.: Centennial variations of the global monsoon precipitation in the last millennium: results from ECHO-G model, J. Climate, 22, 2356–2371, https://doi.org/10.1175/2008JCLI2353.1, 2009.
Liu, J., Wang, B., Wang, H., Kuang, X., and Ti, R.: Forced response of the East Asian summer rainfall over the past millennium: Results from a coupled model simulation, Clim. Dynam., 36, 323–336, https://doi.org/10.1007/s00382-009-0693-6, 2011.
Luo, C. Z.: Compilation of historical flood survey data in China, Cathay Bookstore, Beijing, China, 2006.
Magilligan, F. J., Phillips, J. D., James, L. A., and Gomez, B.: Geomorphic and sedimentological controls on the effectiveness of an extreme flood, J. Geol., 106, 87–96, https://doi.org/10.1086/516009, 1998.
Martins, E. S. and Stedinger, J. R.: Generalized maximum-likelihood generalized extreme-value quantile estimators for hydrologic data, Water Resour. Res., 36, 737–744, https://doi.org/10.1029/1999WR900330, 2000.
Mccarney-Castle, K., Voulgaris, G., Kettner, A. J., and Giosan, L.: Simulating fluvial fluxes in the Danube watershed: the 'Little Ice Age' versus modern day, Holocene, 22, 91–105, https://doi.org/10.1177/0959683611409778, 2012.
Milliman, J. D. and Farnsworth, K. L.: River discharge to the coastal ocean: a global synthesis, Cambridge University Press, Cambridge, 2013.
Milly, P. C., Dunne, K. A., and Vecchia, A. V.: Global pattern of trends in streamflow and water availability in a changing climate, Nature, 438, 347–350, https://doi.org/10.1038/nature04312, 2005.
Milly, P. C. D., Wetherald, R. T., Dunne, K., and Delworth, T. L.: Increasing risk of great floods in a changing climate, Nature, 415, 514–517, https://doi.org/10.1038/415514a, 2002.
Munoz, S. E., Gruley, K. E., Massie, A., Fike, D. A., Schroeder, S., and Williams, J. W.: Cahokia's emergence and decline coincided with shifts of flood frequency on the Mississippi River, P. Natl. Acad. Sci. USA, 112, 6319–6324, https://doi.org/10.1073/pnas.1501904112, 2015.
Munoz, S. E., Giosan, L., Therrell, M. D., Remo, J. W., Shen, Z., Sullivan, R. M., Wiman, C., O'Donnell, M., and Donnelly, J. P.: Climatic control of Mississippi River flood hazard amplified by river engineering, Nature, 556, 95–98, https://doi.org/10.1038/nature26145, 2018.
Overeem, I. and Syvitski, J. P.: Shifting discharge peaks in Arctic rivers, 1977–2007, Geogr. Ann. A, 92, 285–296, https://doi.org/10.1111/j.1468-0459.2010.00395.x, 2010.
Paola, C.: Sedimentology: Floods of record, Nature, 425, 459, https://doi.org/10.1038/425459a, 2003.
Paulsen, D. E., Li, H.-C., and Ku, T.-L.: Climate variability in central China over the last 1270 years revealed by high-resolution stalagmite records, Quaternary Sci. Rev., 22, 691–701, https://doi.org/10.1016/S0277-3791(02)00240-8, 2003.
Price, K., Jackson, C. R., and Parker, A. J.: Variation of surficial soil hydraulic properties across land uses in the southern Blue Ridge Mountains, North Carolina, USA, J. Hydrol., 383, 256–268, https://doi.org/10.1016/j.jhydrol.2009.12.041, 2010.
Sadler, P. M.: Sediment accumulation rates and the completeness of stratigraphic sections, J. Geol., 89, 569–584, https://doi.org/10.1086/628623, 1981.
Sambrook Smith, G. H., Best, J. L., Ashworth, P. J., Lane, S. N., Parker, N. O., Lunt, I. A., Thomas, R. E., and Simpson, C. J.: Can we distinguish flood frequency and magnitude in the sedimentological record of rivers?, Geology, 38, 579–582, https://doi.org/10.1130/G30861.1, 2010.
Sheng, H., Gao, J. H., Kettner, A. J., Shi, Y., Wang, Y. P., and Chen, Y.: Variations in fluvial discharge of rivers over the last millennium along the eastern coast of the Liaodong Peninsula, China, J. Asian Earth Sci., 2019, 103993, https://doi.org/10.1016/j.jseaes.2019.103993, 2019.
Sivapalan, M., Ruprecht, J. K., and Viney, N. R.: Water and salt balance modelling to predict the effects of land-use changes in forested catchments. 1. Small catchment water balance model, Hydrol. Process., 10, 393–411, https://doi.org/10.1002/(SICI)1099-1085, 1996.
Sun, P., Xigang, Z., and Wang, C.: Rainstorm and flood analysis in Yalun River, Technol. Soil Water Conserv., 2011, 41–42, https://doi.org/10.3969/j.issn.1673-5366.2011.02.15, 2011.
Syvitski, J. P. and Alcott, J. M.: RIVER3: Simulation of water and sediment river discharge from climate and drainage basin variables, Comput. Geosci., 21, 89–151, https://doi.org/10.1016/0098-3004(94)00062-Y, 1995.
Syvitski, J. P. and Morehead, M. D.: Estimating river-sediment discharge to the ocean: application to the Eel margin, northern California, Mar. Geol., 154, 13–28, https://doi.org/10.1016/S0025-3227(98)00100-5, 1999.
Syvitski, J. P., Morehead, M. D., and Nicholson, M.: HYDROTREND: a climate-driven hydrologic-transport model for predicting discharge and sediment load to lakes or oceans, Comput. Geosci., 24, 51–68, https://doi.org/10.1016/S0098-3004(97)00083-6, 1998.
Syvitski, J. P., Kettner, A. J., Peckham, S. D., and Kao, S.-J.: Predicting the flux of sediment to the coastal zone: application to the Lanyang watershed, Northern Taiwan, J. Coast. Res., 21, 580–587, https://doi.org/10.2112/04-702A.1, 2005.
UNISDR, U.: Sendai framework for disaster risk reduction 2015–2030, Sendai, Japan, 14–18 March 2015.
Wang, T. F., Hong, Y., and Xuemei, M.: Analysis of flood control capacity of cascade reservoirs in Yalu River, Water Resour. Hydropow. NE China, 12, 51–52, https://doi.org/10.3969/j.issn.1002-0624.2010.12.026, 2010.
Willett, K. M., Gillett, N. P., Jones, P. D., and Thorne, P. W.: Attribution of observed surface humidity changes to human influence, Nature, 449, 710–712, https://doi.org/10.1038/nature06207, 2007.
Winsemius, H. C., Jongman, B., Veldkamp, T. I., Hallegatte, S., Bangalore, M., and Ward, P. J.: Disaster risk, climate change, and poverty: assessing the global exposure of poor people to floods and droughts, Environ. Dev. Econ., 23, 328–348, https://doi.org/10.1017/S1355770X17000444, 2015.
Xu, C. J., Guo, S. L., Yin, J. B., and Liu, Z. J.: Comparative Study of Different Design Flood Estimation Methods, J. Water Resour. Res., 5, 127–135, https://doi.org/10.12677/JWRR.2016.52016, 2016.
Yang, S. Y. and Yin, P.: Sediment source-to-sink processes of small mountainous rivers under the impacts of natural environmental changes and human activities, Mar. Geol. Quatern. Geol., 2018, 1–10, https://doi.org/10.16562/j.cnki.0256-1492.2018.01.001, 2018.
Yi, X. J., Hu, Z. Y., Xia, Y. X., and Li, S. M.: Investigation and Evaluation of Water Resources and Their Development and Utilization in China – Liao River, China Water Power Press, Beijing, China, 2014.
Zhai, W.-D., Zang, K.-P., Huo, C., Zheng, N., and Xu, X.-M.: Occurrence of aragonite corrosive water in the North Yellow Sea, near the Yalu River estuary, during a summer flood, Estuar. Coast. Shelf S., 166, 199–208, https://doi.org/10.1016/j.ecss.2015.02.010, 2015.
Zhang, R., Li, T., Russell, J., Zhou, Y., Zhang, F., Liu, Z., Guan, M., and Han, Q.: High-resolution reconstruction of historical flood events in the Changjiang River catchment based on geochemical and biomarker records, Chem. Geol., 499, 58–70, https://doi.org/10.1016/j.chemgeo.2018.09.003, 2018.