the Creative Commons Attribution 4.0 License.
the Creative Commons Attribution 4.0 License.
 | 05 Oct 2020
A Water-Energy-Food Nexus approach for conducting trade-off analysis: Morocco's phosphate industry in the Khouribga region
Sang-Hyun Lee
Amjad T. Assi
Bassel Daher
Fatima E. Mengoub
Rabi H. Mohtar
The study objective was to develop and use the Water-Energy-Food Nexus Phosphate (WEF-P) Tool to evaluate the impact of Morocco's phosphate industry on water, energy, and food sectors of Khouribga, which is the representative phosphate mining region of Morocco. The developed WEF-P Tool enabled a trade-off analysis based on integrating supply-chain processes, transportation, and water–energy footprints of the region. Field data from the mining to transportation processes were collected and applied to possible supply-chain scenarios in accordance with the type of product (phosphate rock and slurry). The potential impacts of the scenarios were considered in terms of the water supply in the agricultural areas. The analysis of the positive impacts of dynamic management suggests that seasonal management of phosphate production (less during the irrigated season, more during wetter or rainier seasons) is more effective. Additionally, while the transport of raw phosphate slurry through a pipeline increased the total water required to 34.6×10⁶ m3, which is an increase of 76 % over the “business as usual” (BAU) scenario, it also resulted in an energy savings of nearly 80 % over BAU: slurry transport requires only 40.5×10⁶ L of fossil fuel instead of the 204×106 L required to transport rocks. During the dry or “water-scarce” irrigation season (May to July), total groundwater use decreased from 5.8×10⁶ to 5.2×10⁶ m3. Dynamic management of the phosphate industry can also save 143 MWh (megawatt-hour) of electricity annually and can bring a reduction of 117 t of CO2 emissions. Making water available at the correct season and location requires analysis of complex scientific, technical, socioeconomic, regulatory, and political issues. The WEF-P Tool can assist by assessing user-created scenarios; thus, it is an effective management-decision aid for ensuring more sustainable use of limited resources and increased reliability of water resources for both agricultural and industrial use. This study on the applications of WEF Nexus to the phosphate industry offers a roadmap for other industrial application for which trade-offs between the primary resources must be considered.
- Article
(615 KB) - Full-text XML
- BibTeX
- EndNote


Nexus thinking emerged from the understanding that natural resource availability can limit and is limited by economic growth and other goals associated with human wellbeing (Hoff, 2011; Keulertz et al., 2016). The innovative aspect of nexus thinking is its more balanced view of the issues linking resources (Al-Saidi and Elagib, 2017). Thus, nexus frameworks identify key issues in food, water, and energy securities through a lens of sustainability and seek to predict and protect against future risks and resource insecurities (Biggs et al., 2015). The 2015 World Economic Forum identified water, food, and energy shocks as primary future risks, calling for increased efficiency in water use across all sectors and the implementation of integrated water resources management. Various conceptual frameworks relating to the nexus approach were developed: the Dubois et al. (2014) emphasized the role of the nexus in food security, and the International Renewable Energy Association (Ferroukhi et al., 2014) applied the nexus approach in transforming conventional energy systems to renewable systems.
The demand for water, energy, and food is expected to increase due to drivers such as population growth, economic development, urbanization, and changing consumer habits (Terrapon-Pfaff et al., 2018). The interlinkages across key natural resource sectors and improving their production efficiency offer a win-win strategy for environmental sustainability for current and/or future generations (Ringler et al., 2013). Accordingly, application of the Water-Energy-Food (WEF) Nexus concept or approach is expected to make implementation of the Sustainable Development Goals (SDGs) more efficient and robust (Brandi et al., 2014; Yumkella and Yillia, 2015). The SDGs are classic examples of the necessity to acknowledge multidimensional nexus interlinkages and trade-offs, particularly as governments are challenged to maximize benefits and invest limited resources. Infrastructure and capital are needed to achieve national SDG targets, and the nexus concept is now used to highlight interdependencies between resources and the need for integrated, sustainable governance and management of those resources (Pahl-Wostl, 2019).
The debate surrounding effectively addressing water and food security challenges stems from questions about whether the water–food crisis is due to a poor understanding of the resources or to their improper management (Mohtar et al., 2015; Keulertz and Mohtar, 2019). One long-standing challenge to water management lies in the lack of integration among the multiple sectors that interact with the water sectors across geographical areas or within large, transboundary, basins (Mohtar and Lawford, 2016). Projections about availability and quality of water, food, energy, or soil resources are often alarming. A fundamental shift is needed away from traditional “silo” approaches and toward more integrative systems approaches (Daher and Mohtar, 2015). Energy and water are crucial for economic growth, especially in industrialized areas (Flörke et al., 2013; Cai et al., 2016), making the rapid increase in demand for these resources a serious issue for both economics and the environment. While technology to reduce industrial demand for water and energy is important, we must also understand the relationship between economic growth, water–energy consumption, and the impact of industrial activity on agriculture at the local level. Increase in industrial products can cause steep increases in demand for water and energy, which in turn leads to issues of downscaling water or energy securities.
The nexus framework is dependent on the stakeholders, system boundary, and analytical tools. In considering the application of the nexus as a platform, an integrated modeling approach is essential. These issues manifest in very different ways across each sector, but their impacts are often closely related in terms of trade-offs. In particular, the sub-nexus needs to be effectively conceptualized and a theoretical sub-nexus developed. Private-sector water, energy, and food-supply-chain players are the key stakeholders to address current contradictions arising as a consequence of attempts to develop a grand nexus approach (Allan et al., 2015). Accordingly, we must consider the “specialized” nexus of multi-stakeholders, such as agriculture, industry, and urban areas, for which water, energy, and food are treated as subsystems. Current nexus frameworks often focus on macrolevel drivers of resource consumption patterns (Biggs et al., 2015), but major nexus challenges are faced at local levels (Terrapon-Pfaff et al., 2018). Thus, “larger-scale” extraction and consumption of natural resources may lead to depletion of natural capital stocks and increased climate risk with no equitable share of the benefits (Hoff, 2011; Rockström et al., 2009). Al-Saidi and Elagib (2017) showed the importance of exploring driving forces and interactions at different scales in the conceptual development of the nexus, emphasizing more case-study-based recommendations in the reality of institutions, bureaucracies, and environmental stakeholders.
Morocco's phosphate and agriculture industries offer an example of increasing resource pressures attributable to near- and medium-term growth across these sectors (Taleb, 2006). A holistic approach that considers the needs of all stakeholders is necessary to resolve resource allocation pressures. Between 1990 and 2016, Morocco's population grew from 25 million to 35 million people (World Bank, 2019a). Both crop production and total cultivated land significantly increased since 1971; half of Morocco's arable land receives less than 350 mm of rainfall annually, and nearly 87.3 % of Morocco's total water withdrawals are used for agriculture (FAO, 2015). Per capita consumption of electric power increased from 358 kWh (1990) to 901 kWh (2014); energy use by oil equivalent per capita increased from 306 to 553 kg during the same period (World Bank, 2019b). Proper management of water, energy, and food resources is critical to economic, social, and environmental wellbeing.
Globally, phosphates lie at the heart of agriculture and soil enhancement. More than 75 % of global phosphate reserves, representing 30 % of the global market share, are found in Morocco, positioning that country at a leading role in global food security (OCP, 2013). Phosphate mining and its chemical processing require considerable water, energy, land, and other resource inputs. Morocco uses recycling and reverse osmosis desalination to relieve some of the pressure on its fresh water resources and help secure the water necessary for phosphate production processes (OCP, 2016b). Each water source carries a distinct energy tag that must be accounted for, especially in a country that imports nearly 90 % of its consumed energy (World Bank, 2019c). Water, energy, land, and financial resources are frequently shared between multiple sectors, especially agriculture (food production) and municipal (growing urbanization) sectors, and Morocco is no exception. It is critical that potential sectoral competition be understood, quantified, and accounted for when planning for the sustainable progress of all sectors. An integrated approach to resource allocation is needed to minimize inevitable competition for resources, i.e., one that quantifies the trade-offs associated with the possible pathways. As Morocco heads toward achieving its phosphate production goals, the ability to account for the resources associated with that achievement should be balanced with the associated (and increasing) agriculture and municipal demand projections; this is key to sustainable resource allocation (OCP, 2013).
This study adapted the WEF Nexus Tool linking industry and agriculture to integrate the supply chain for industrial products. Using the tool, the authors evaluated the impact of Morocco's phosphate production on the water, energy, and food resource systems of its mining region and then addressed the resource elements in the supply-chain management of phosphate production. Specifically, they assessed the impact of phosphate mining and transportation by slurry pipeline on potential water and energy savings in the mining area. The results suggest the need for dynamic management of phosphate production, i.e., one that adjusts monthly phosphate production in consideration of its potential impacts on water and energy management in agricultural areas. The specific objectives of the study are to quantify the water, food, and energy used by the phosphate industry in the Khouribga region of Morocco and to assess the trade-offs of resource allocations between agriculture and industry.
2.1 Site description
We contacted the managers and engineers working in the Office Chérifien des Phosphates (OCP) group (officially OCP Group), which is the leading phosphate producer in Morocco, and we had a lot of discussion about the site, data, policy, and goals. OCP Group accounts for 3 % of the country's gross domestic product and about 20 % of national exports in value over the course of the 20th century (Croset, 2012). The OCP Group ran three mining fields: one in central Morocco, near the city of Khouribga, and two on the Gantour site. Khouribga, the largest mining area, includes three main sites from which raw phosphate is excavated and transported for chemical processing and fertilizer production: Sidi Chennane (SC), Merah Lahrach (MEA), and Bani Amir (BA) (Fig. 1).
The output in Khouribga is raw phosphate produced as either rock or slurry, which is the main component of manufactured phosphorous fertilizers. The transport of the phosphate (rocks and slurries) from Khouribga (mining area) to Jorf Lasfar (industrial production area) is a primary project in Morocco (OCP, 2016a). The demand for raw phosphate and the production and export of fertilizer and its products from Jorf Lasfar drive the upstream mining activity of Khouribga. In 2015, approximately 20.1×10⁶ t of raw phosphate was excavated, which was 58 % of total raw phosphate excavated in Morocco in 2018 (OCP, 2020), and transported to Jorf Lasfar; about 40 % of this product was transported via pipeline as slurry and the rest via train as rock.
The pipeline from Khouribga to Jorf Lasfar is 187 km and ensures the continuous transport of phosphate from the Khouribga to Jorf Lasfar (Fig. 1). As the plan was to increase phosphate production and phase out transport by train, tracks were replaced by pipeline that ensures the continuous flow of raw phosphate from the mining to the industrial area (OCP, 2016a). The plans impact regional water, energy, and food management: in particular, shifting from train to pipeline requires additional water to convert dry rock into liquid slurry. Shifting from train to pipeline changes the demand for water and energy resources at both the mining and the production locations.
In accordance with the Green Morocco Plan (“Plan Maroc Vert”) (Stührenberg, 2016) and the National Water Plan for Morocco, the use of surface water as a substitute for groundwater is encouraged: water withdrawals from regional aquifers are being phased out since 2010, which are to be replaced entirely by surface water from the nearby Aït Messaoud Dam, which has a capacity of 13.20×10⁶ m3. The plan is to allocate 4.5×10⁶ m3 yr−1 of water from the dam to the mining site. Additionally, OCP launched a plan to complete treatment plants for urban wastewater (capacity 5×10⁶ m3 yr−1) to be used for washing phosphate and industrial reuse in the mining area (OCP, 2016b). The phosphate mining area is encircled by cropland, whose water is also supplied from the dam. In this study, the authors consider the allocation of treated water to both the phosphate industry and agricultural irrigation (Tian et al., 2018). Both the mining and the agricultural activities of the region represent growing enterprises that place added pressure on available water resources, making the sustainable management of the water supply a hotspot to be considered in trade-off analyses.
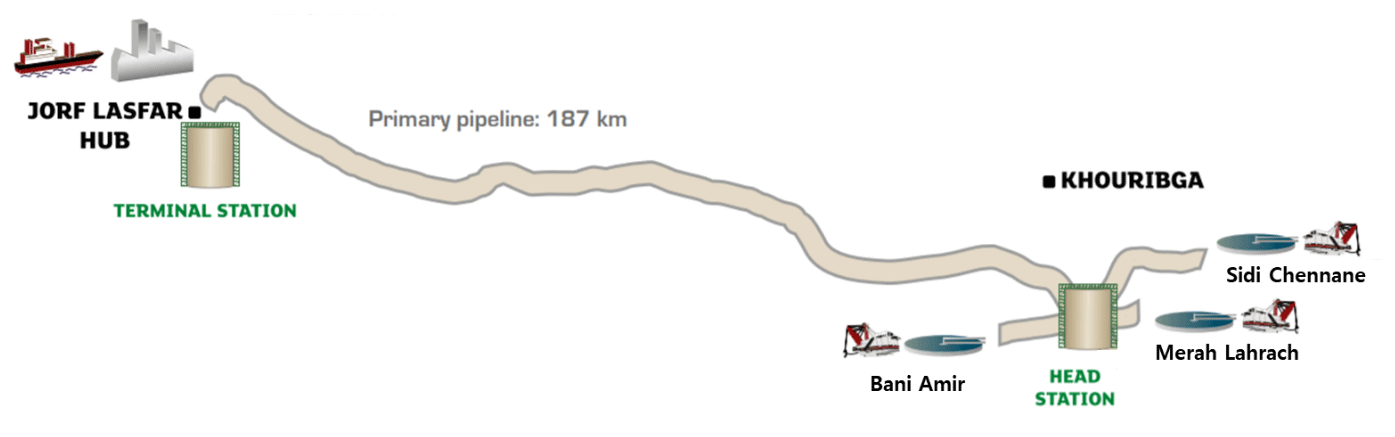
Figure 1Study areas: phosphate mining area (Khouribga), fertilizer manufacturing area (Jorf), and transportation system (slurry pipeline) (http://www.ocpgroup.ma/ocpslurrypipeline/slurry-pipeline, last access: 10 September 2019).
2.2 Development of Water-Energy-Food Nexus Phosphate (WEF-P) Tool
2.2.1 Overall framework of WEF-P Tool
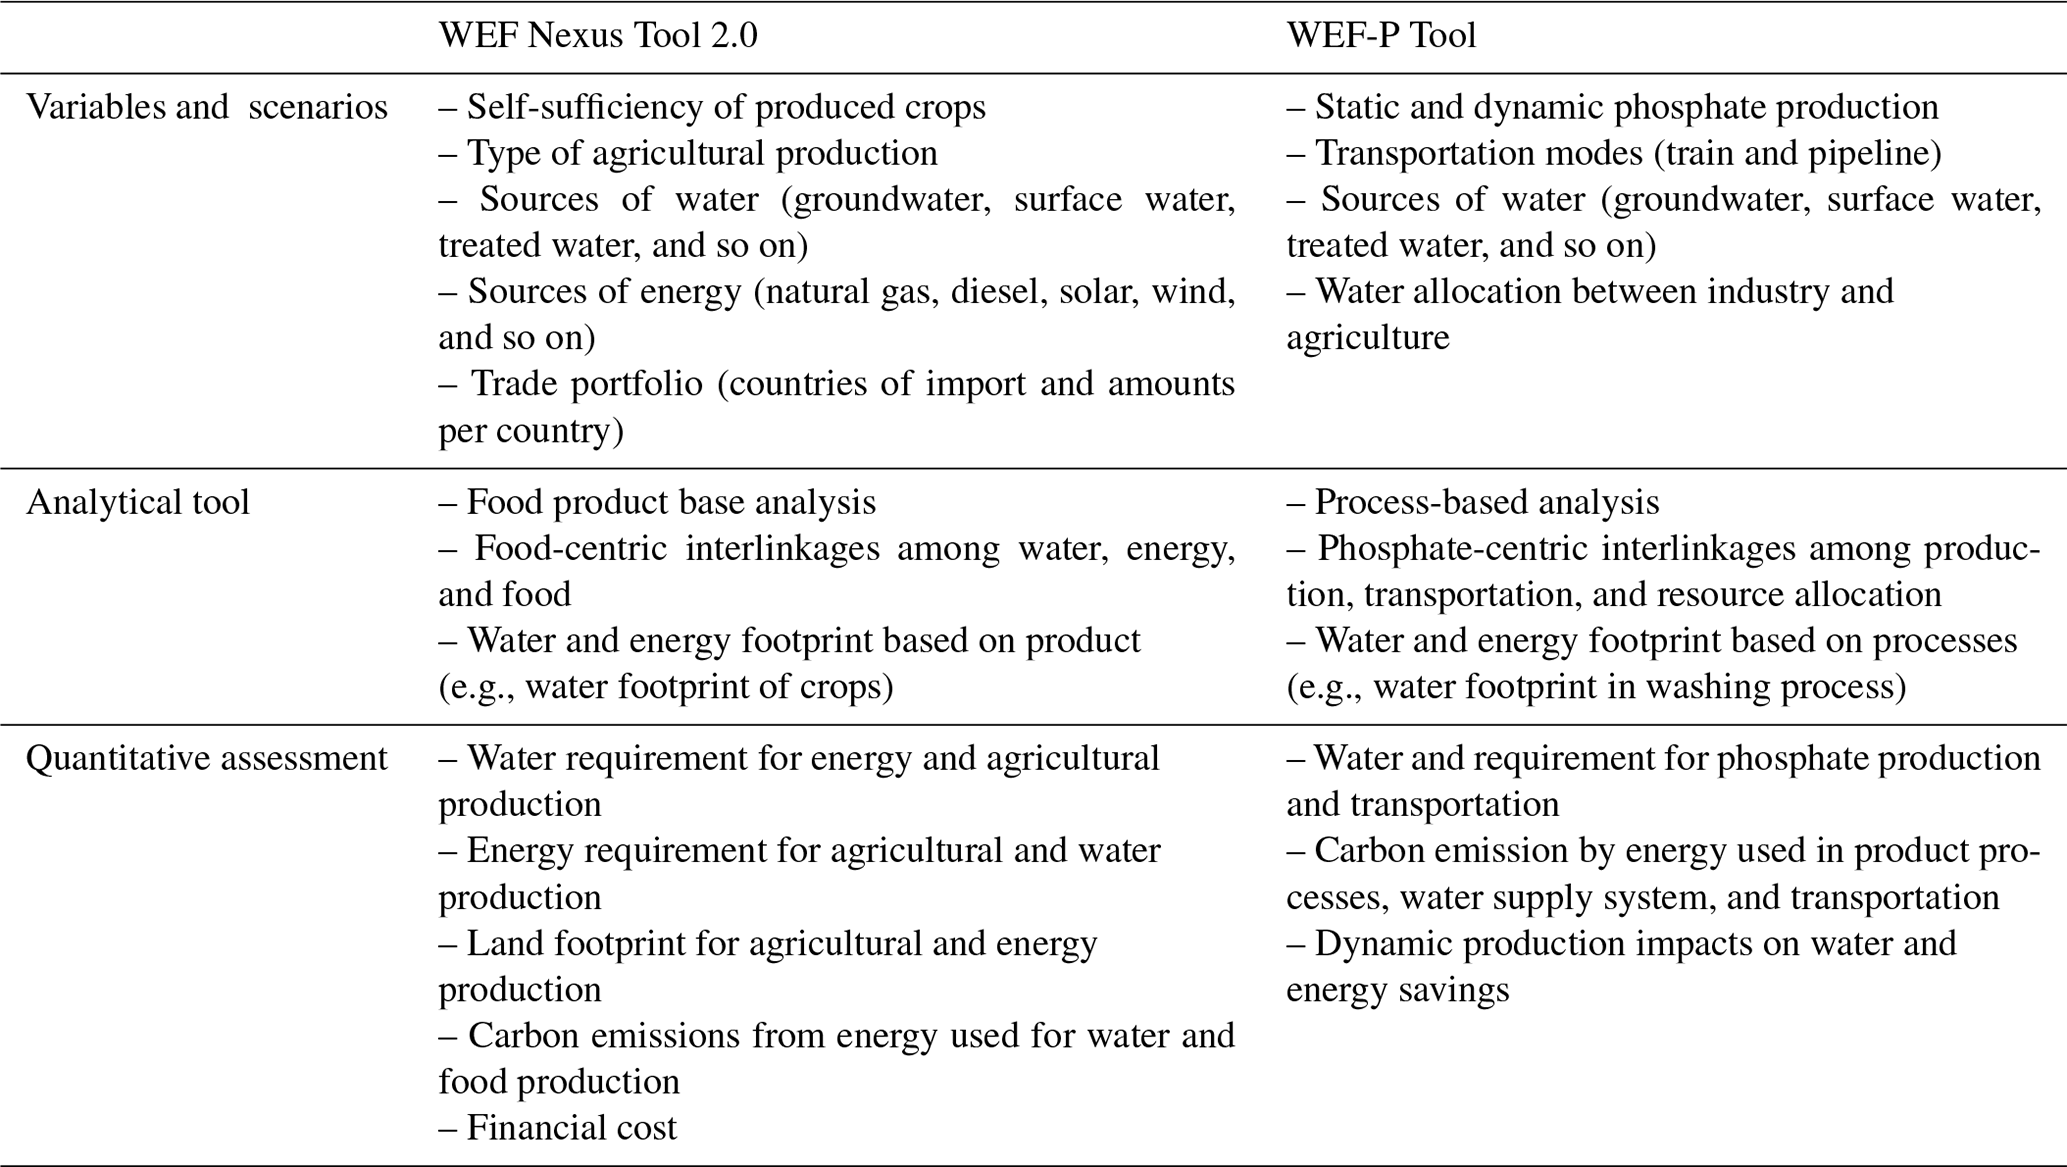
The developed WEF-P Tool, adapted from the WEF Nexus Tool 2.0 (Daher and Mohtar, 2015), considers the supply chain of final product in terms of its resource consumption, including the set of processes that pass materials forward (Mentzer et al., 2001) and various organizations or individuals directly involved in the flow of products (Mentzer et al., 2001). It assesses the impact of various scenarios and possible responses to regional resource management needs. Table 1 shows the differences between WEF Nexus Tool 2.0 and WEF-P Tool in the context of variables, scenarios, analytical tools, and quantitative assessments.
Both tools offer a platform for development of the analytics necessary to understand the trade-offs and catalyze a stakeholder dialogue (Mohtar and Daher, 2016, 2014). The core of the WEF Nexus is that production, consumption, and distribution of water, energy, and food are inextricably interlinked: decisions made in one sector impact the other sectors (Hoff, 2011; Mohtar and Daher, 2014). The WEF Nexus Tool 2.0 allows for holistic quantification of the impact of resource allocation strategies to support informed and inclusive stakeholder dialogue between policy makers, private-sector firms, and civil society (Daher and Mohtar, 2015). Each stakeholder becomes involved at different stages and scales in the decision-making process. In the WEF-P Tool (Fig. 2), water resources are shared between the phosphate industry and agricultural interests in the region of study. Sustainable water management must holistically consider the allocation of water resources for both industrial production and agricultural irrigation. New water (treated urban wastewater) has the potential to contribute significantly to bridging water and food gaps (Mohtar et al., 2015). However, it carries an energy footprint that must be considered when increasing local food production. Potentially, agricultural demand for water competes with those of a growing industry. The tool quantifies the use of water and energy and the amount of CO2 emitted for each scenario. It also quantifies the water and energy savings resulting from choices made regarding transportation scenarios. The tool assesses the effects of decisions of dynamic management of phosphate production as these impact water and energy securities. The WEF-P Tool can assess various scenarios and help account for interdependencies between food and industrial production and between water and energy consumption, thus allowing the trade-offs associated with potential resource allocation pathways to be quantified.
Throughout the tool development process, the supply chain was verified with OCP and the OCP Policy Center in various ways: (i) during the data collection phase, through meetings with the OCP steering committee, financial managers, technical managers, and engineers; and (ii) through follow-ups with the OCP Policy Center team (conference calls and email). The OCP Policy Center team shared their main concerns regarding the tool structure with the WEF Nexus team , based on input from the OCP technical team. The WEF Nexus team used these shared concerns in their considerations of revisions to the tool structure and associated Excel spreadsheets of the model. Specifically, the major aggregated processes and lines of production were revised and identified in a functional supply chain to maximize the abilities and flexibilities of the model and ensure efficacy of the available database for processes and production lines.
However, the WEF-P Tool has limitations in assessing economic impacts such as cost and benefit analysis. This is because cost must include the price of water, which is still under discussion, and the price of products when analyzing their benefits. Raw phosphate is transported to the manufacturing area and used in the production of various fertilizers that have different prices: this makes it difficult to set the price of excavating raw phosphate in the mining area. Sustainability assessment also has qualitative aspects in terms of environmental impact. The WEF Nexus Tool 2.0 applied the sustainability index based on resource capacity and availability; however, it is still a quantitative aspect. We should consider the meaning and definition of sustainability, both quantitatively and qualitatively, and then assess the index using the stakeholder weights for the variables related to sustainability. Additionally, spatial and temporal scales should be included in a sustainability index. For example, the pipeline transportation system requires water, which is transported with products: the pipeline causes greater water use at the origin but also provides additional water to the destination area. Also, the water requirement differs with temporal season, such as the water-intensive agricultural production season. Thus, more research is needed for a sustainability assessment based on economic and environmental impacts. However, the quantitative analysis is an essential factor for assessing sustainability; therefore, the WEF-P Tool focuses on quantification of (1) water and requirements for phosphate production and transportation, (2) carbon emissions by energy used in product processes, (3) water supply system and transportation, and (4) dynamic production impacts on water and energy savings.

Figure 2Assessment of holistic impacts of various scenarios relating to the phosphate industry, agriculture, and resource management using WEF-P Tool.
2.2.2 Analysis of integrated supply chains linking subprocesses and transportation modes
The WEF-P Tool used the WEF Nexus approach to assess the life cycle of the final products supply chain. The water and energy used to produce subproducts and final products were calculated by adding the water and energy requirements from the subprocesses through the production supply chain. In Khouribga, raw phosphate products pass through a sequence of functional processes for SC and MEA (Fig. 3): mining and screening (S), washing (WW), grinding (WG), flotation (WF), adaptation including powdering (WA), and drying. The mining and screening processes include extraction from the ground, tone removal, and screening to produce pieces of phosphate rock. Here, the supply chain is determined by the quality and size of the phosphate rock, which in turn depends on the phosphate content at extraction, which ranges from very low to high. High-quality phosphate rock is transported to a drying process from which it will either be marketed or chemically transformed into fertilizer at the manufacturing site. Low- to medium-quality phosphate rock is washed, dried, ground, and subjected to flotation, which intended to increase the phosphate content.
The change in transportation system can affect the supply lines (Fig. 3). In the mining area, the products are phosphate rocks and slurry, both of which are transported to the manufacturing area, each with its own resource requirements. Slurry requires flotation and adaptation and thus is more water intensive; phosphate rock is dried in an energy-intensive process that consumes most of the energy produced in the mining area. Slurries are transported via pipeline and rock by train; each mode has distinct resource needs at different stages. The two transportation systems are also distinct, i.e., the pipeline supply chain includes washing (water) and adaptation to produce slurry; the train supply chain includes a fuel-intensive drying process. It is possible to quantify the flow of products according to the transportation system used. When transport changes from train to pipeline, supply lines also change: the drying process is replaced by the adaptation process. If the phosphate is transported by pipeline, it must first be transformed into slurry, adding the adaptation process to the supply chain. Changes in the supply chain impact the water and energy consumed and, consequently, the CO2 emitted. The mining and screening processes include extraction from the ground, tone removal, and screening to produce pieces of phosphate rock.
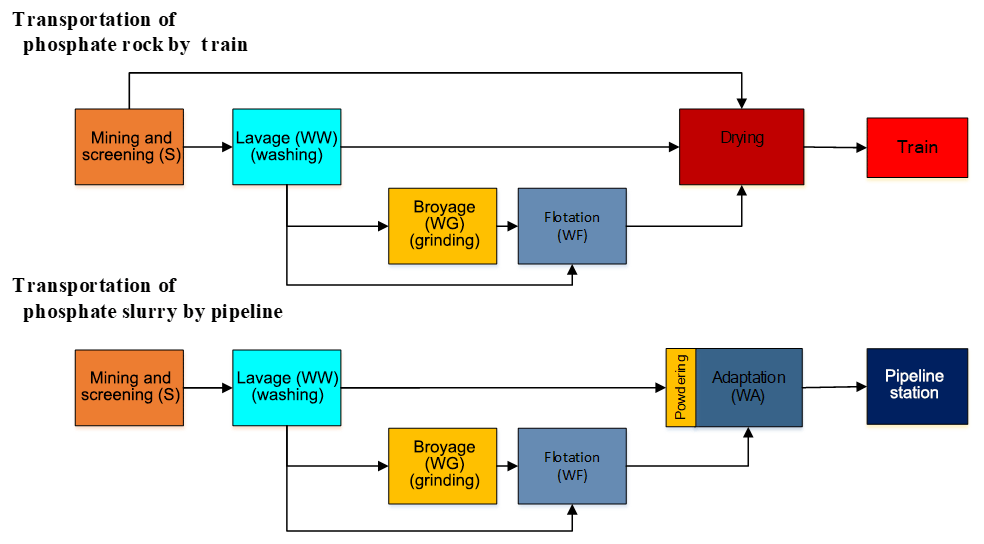
Figure 3The functional processes and flows of products in Khouribga (mining area) by transportation method.
2.2.3 Adaptation of process-based water, energy, and CO2 footprints
The main functions of the WEF-P Tool are the identification of the relationship between resources and production and the quantification of the resources consumed in phosphate production. The methodology is based on life-cycle assessment. The water and energy footprints were analyzed, indicating the quantity of water or energy consumed in various subprocesses in the supply chain's integration of production and transportation. The technical details of each process are specific and aggregated into functional processes. The main component is the footprint, which indicates the water and energy requirements for phosphate products, as well as the CO2 emitted through energy consumption. Each process has a specific footprint based on field data and fed into the tool monthly or when a significant change in capacity of the functional processes has occurred. For all footprint processes in Khouribga, the amount of raw phosphate is measured in commercial metric tonnes embedded in slurries and rock. Even if the phosphate rock changes to slurry through several processes, the amount of raw phosphate embedded in products is not changed. Thus, the amount (in tonnes) of phosphate in water and energy footprints indicates the raw phosphate embedded in the products in each process and is constant through the entire supply chain.
Table 2CO2 emission by burning fuels and generating electricity.

a U.S. Energy Information Administration (USEIA). b International Energy Agency (IEA).
From the technical (engineering) perspective, footprints are calculated using a regression function or average value based on survey data; technical experts in each process can modify this relation function as needed. The WEF-P Tool uses historical data (from 2015) to estimate the average value of the footprint and the relationship between water or energy consumption and phosphate production. First, the relationship between outputs of each process and water (or energy) consumption was analyzed. Second, WEF-P Tool considered transportation of water and consumption of energy by train and pipeline. Transportation by train was only related to fuel, i.e., diesel, consumption. However, the pipeline station consumes electricity for operating the pipeline and freshwater is transported with slurry. The pipeline should be full, but as it is impossible to fill the pipeline with slurry, it alternately carries slurry and freshwater. Therefore, total water (or energy) consumption in the mining area includes not only water (or energy) used in processes but also that used in transportation systems and the water consumed at the pipeline station in the mining area, which basically indicates the transported water used in the manufacturing area. WEF-P Tool could quantify water and energy consumption of the various processes and at the pipeline station, as shown in Eqs. (1–5).
where WCmining area (m3) is total water consumption in mining area, ECmining area (MWh or L) is total energy consumption in mining area, and Pi (tonne) is production from each process (i) in mining area such as mining, screening, washing, flotation, and drying. WFPi (m3 t−1) and EFPi (MWh t−1 or L t−1) are water and energy footprints in each process (i). WCpipeline station (m3) is water consumption in pipeline station, ECpipeline station (MWh or L) is energy consumption in pipeline station, and ECtrain (MWh or L) is energy consumption by train to transport phosphate rock to the manufacturing area. Pslurry and Pphosphate rock (t) are production of slurry and phosphate rock. WFPpipeline station (m3 t−1) is water footprint at pipeline station in mining area. EFPpipeline station and EFPtrain (MWh t−1 or L t−1) are energy footprints in pipeline station and of transportation by train. It is worth mentioning that the tool distinguishes between two types of water: water transported from mining to manufacturing area by pipeline and the embedded water in slurry.
CO2 emissions are relevant when assessing the environmental impact of phosphate production. Although real emission in each process in the supply chain should be measured, this study is limited to measuring CO2 emission in the mining area. In addition, CO2 emission in crop area is related to soil and crops, and this is another level of research. Thus, we limited CO2 emission to that emitted by fuel energy use by machinery (direct emission) and electricity generation in power plants (indirect emission), and the reference CO2 footprints were applied (Table 2). Fossil fuels (gasoline, diesel, coal, etc.), when burned, produce direct CO2 emission. Indirect CO2 emission is also related to the source fuel used in generating electricity: indirect emission occurs in the generation of electricity from other (non-fossil) sources, such as hydroelectric, wind power, or solar. According to USEIA (2019), 1 L of gasoline used by machinery or a facility produces 2.6 kg of direct CO2 emission; a power plant burning only coal emits 1026 t of CO2 kWh−1. Renewable (non-fossil) electricity emits only 15.8 t of CO2 kWh−1. A survey of sources of electricity generation in Morocco indicates that coal is the main fuel for power generation (43.4 % of the national production). Oil and natural gas account for 25.3 % and 22.7 %, respectively; fossil fuels account for 90 % of the electricity produced in Morocco (IEA, 2014). Based on reference data, direct and indirect CO2 emissions are calculated as shown in Eqs. (6)–(7).
where DCO2 (t) is direct CO2 emission and InDCO2 (t) is indirect CO2 emission. CFF_Fi (t L−1) is CO2 footprint by burning fuel, FCi (t L−1) is fuel consumption by machine excluding fuel use for electricity generation, and i is the type of fuel such as diesel or gasoline. CFP_Ej (t MWh−1) is CO2 footprint by generating electricity, ELCj (MWh) is electricity consumption, and j is the source of electricity generation such as coal, petroleum, natural gas, solar, wind, or hydropower.
Table 4Crop planting and harvesting seasons, stage length, and crop coefficients.
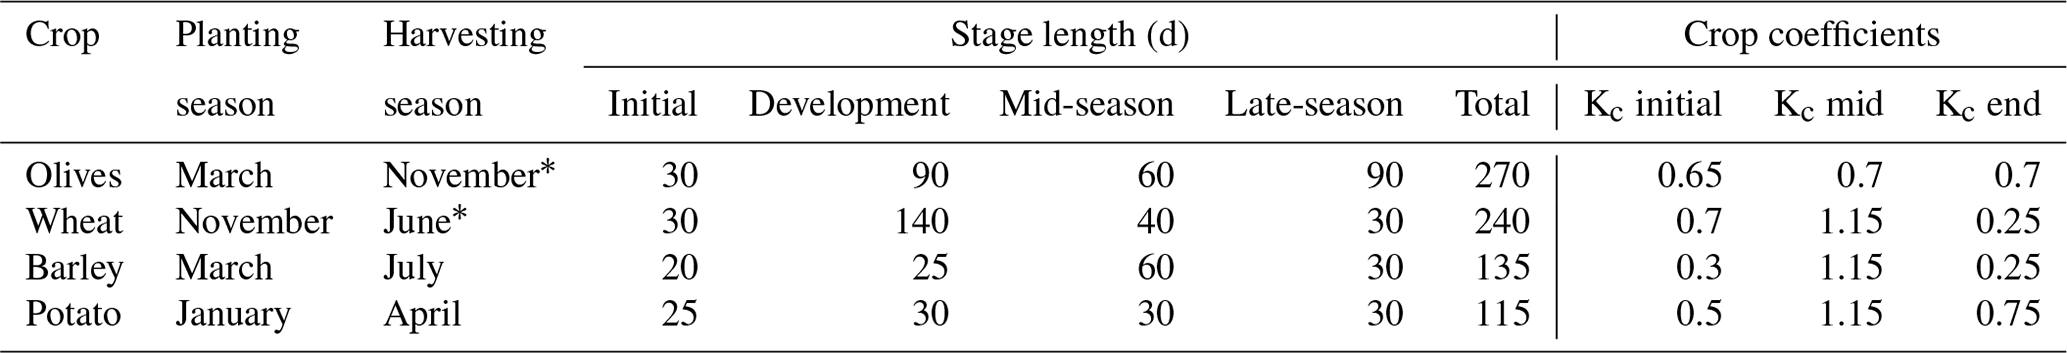
∗ Next year.
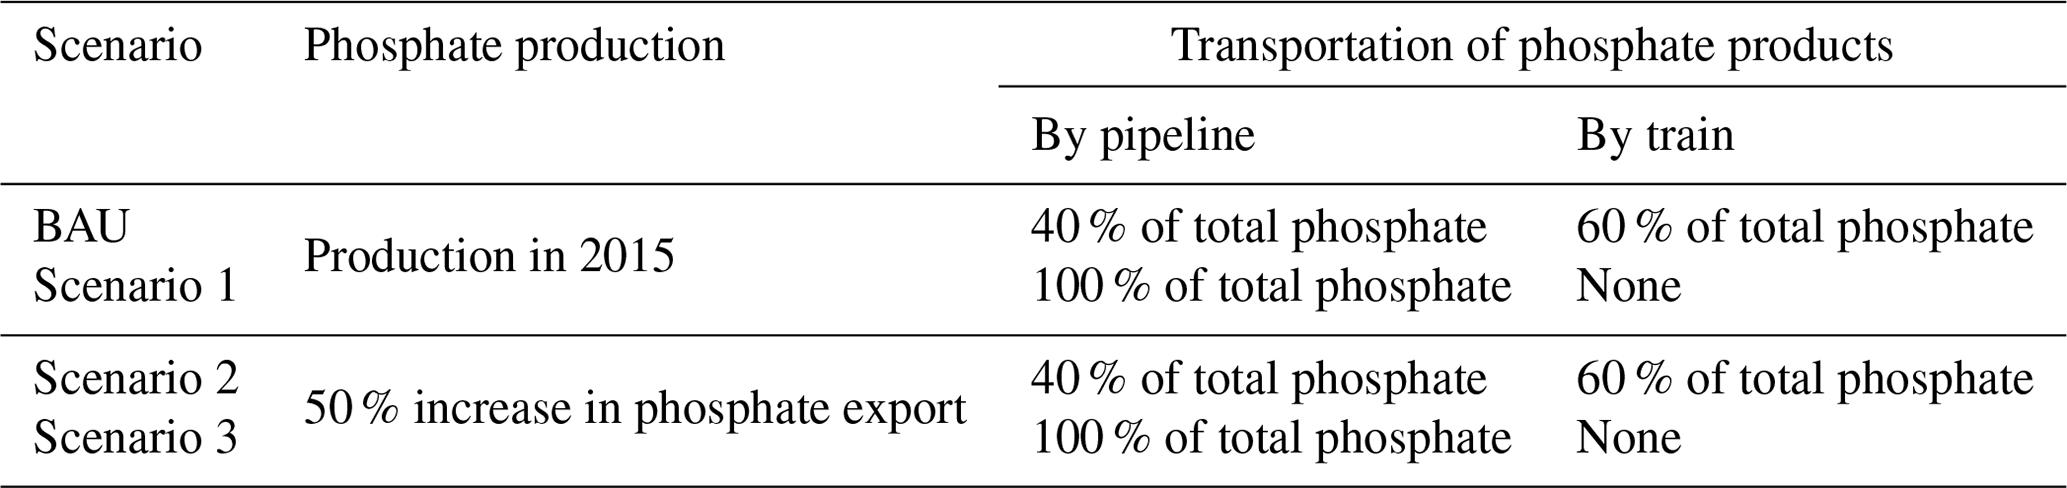
Table 5Scenarios through combination of production and transportation system.
2.3 Agricultural water requirement for food production
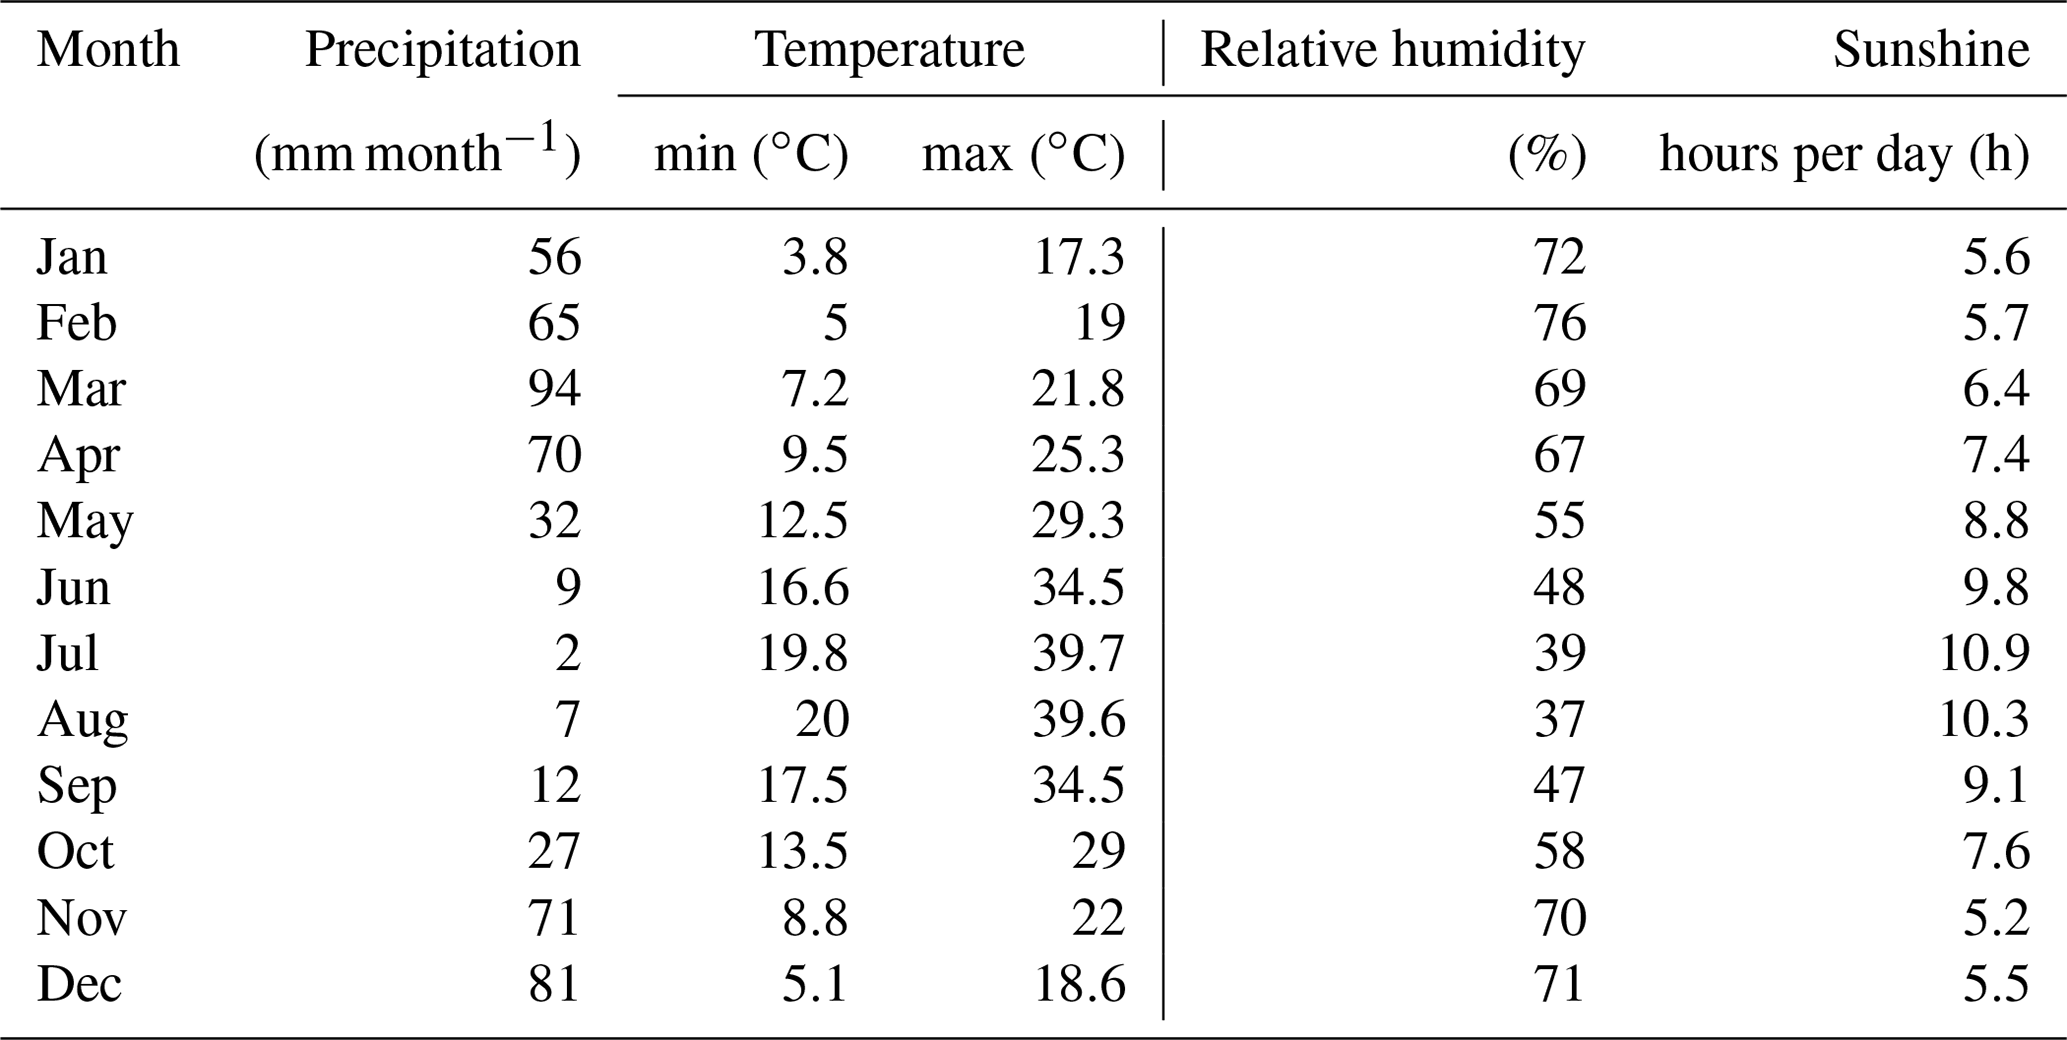
In this study, “water for food” indicates water withdrawn for crop production (generally irrigation). CROPWAT 8.0 is a decision support tool developed by the Land and Water Development Division of FAO (Smith, 1992) and used to calculate the evapotranspiration, crop water requirements, and irrigation requirements of four crops grown in the region. The climate data (temperature, precipitation, humidity, wind speed, as well as hours of sunshine) were taken from the climatic database CLIMWAT 2.0, which offers observed agro-climatic data from 5000 stations worldwide and provides long-term monthly-mean values of climatic parameters. The compiled data of CLIMWAT 2.0 generally include the period 1971–2000 (when these data were not available, series ending after 1975 that include at least 15 years of data were used). Table 3 shows the average climate data in the Khouribga area provided from CLIMWAT 2.0.
CROPWAT 8.0 was used to calculate crop water and irrigation requirements based on soil, climate, and crop data. The calculation procedures used in CROPWAT 8.0 are based on the FAO publication: irrigation and drainage series nos. 44 and 56 “Crop Evapotranspiration (guidelines for computing crop water requirements)” (Allen et al., 1998; Smith, 1992). Irrigation water requirements were calculated by estimating crop evapotranspiration (ETc), determined by multiplying the crop coefficient (Kc) by the reference crop evapotranspiration (ET0); see Eq. (8). ET0 is calculated using the FAO Penman–Monteith method, as recommended by FAO and described in Eq. (9) (Allen et al., 1998).
where ET0 is the reference crop evapotranspiration (mm d−1); ETc is the crop evapotranspiration (mm d−1); Kc is the crop coefficient; Δ is the slope of the saturated vapor pressure–temperature curve (kPa ∘C−1); γ is the psychrometric constant (kPa ∘C−1); u2 the wind speed at 2 m height (m s−1); Rn is the total net radiation at crop surface (MJ m−2 d−1); G is the soil heat flux density (MJ m−2 d−1); T is the mean daily air temperature at 2 m height (∘C); es is the saturation vapor pressure (kPa); and ea is the actual vapor pressure (kPa). Crop coefficients are influenced by cultivation, local climatic conditions, and seasonal differences in crop growth patterns (Kuo et al., 2006). FAO provides crop coefficients for each stage. The values for Mediterranean countries were applied, as shown in Table 4 (Allen et al., 1998). Irrigation water requirement was calculated by ETc and effective precipitation, as shown in Eq. (10). The effective precipitation indicated the precipitation except for runoff, and it was calculated using the USDA Soil Conservation Service method (Eq. 11) (Smith, 1992).
where IRReq is irrigation water requirement, ETc is the crop evapotranspiration, Peff is effective precipitation, and Ptot is total precipitation.
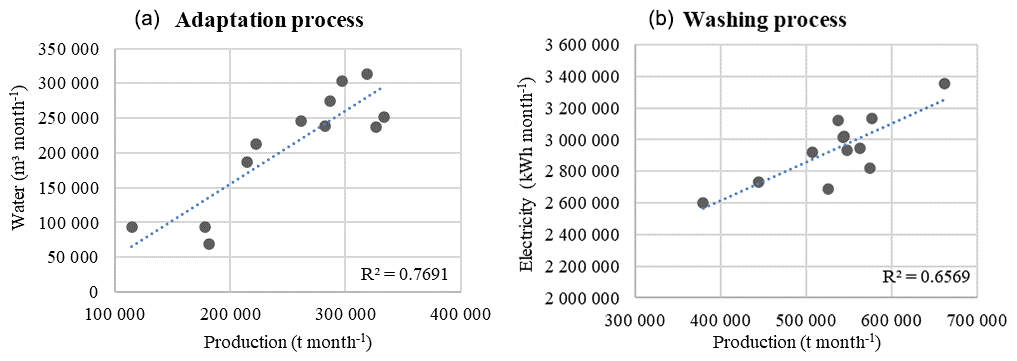
Table 6Water and energy use as well as CO2 emission by scenario of phosphate production and transport.

3.1 Application of scenarios
Increasing the exportable phosphate products and changing the transportation system from train to pipeline are considered top priorities for OCP Group. Therefore, we assessed the impact of increased production by applying the scenarios (Table 5). Until recently, dried phosphate was transported by train from the mining to the manufacturing site, but in the near future, OCP Group will use only pipeline transport. The change from train to pipeline can affect not only direct energy or water consumption by transportation system but also that of the total supply chain in the mining site. Consequently, the production processes for slurry and for rock consume different quantities of water and energy, so the mode of transport also becomes a scenario to allow for quantification of their respective water and energy requirements.
Therefore, we applied the scenario for the transportation system which only indicates the usage of pipeline. Table 4 shows the scenarios combining production and transportation. The first two scenarios are related to the “business as usual” (BAU) scenario for production in 2015 but changing the transportation system from Khouribga to the terminal station at Jorf Lasfar. The other scenarios are related to the increase in the production.
Table 7Water use for crop production under Moroccan condition.
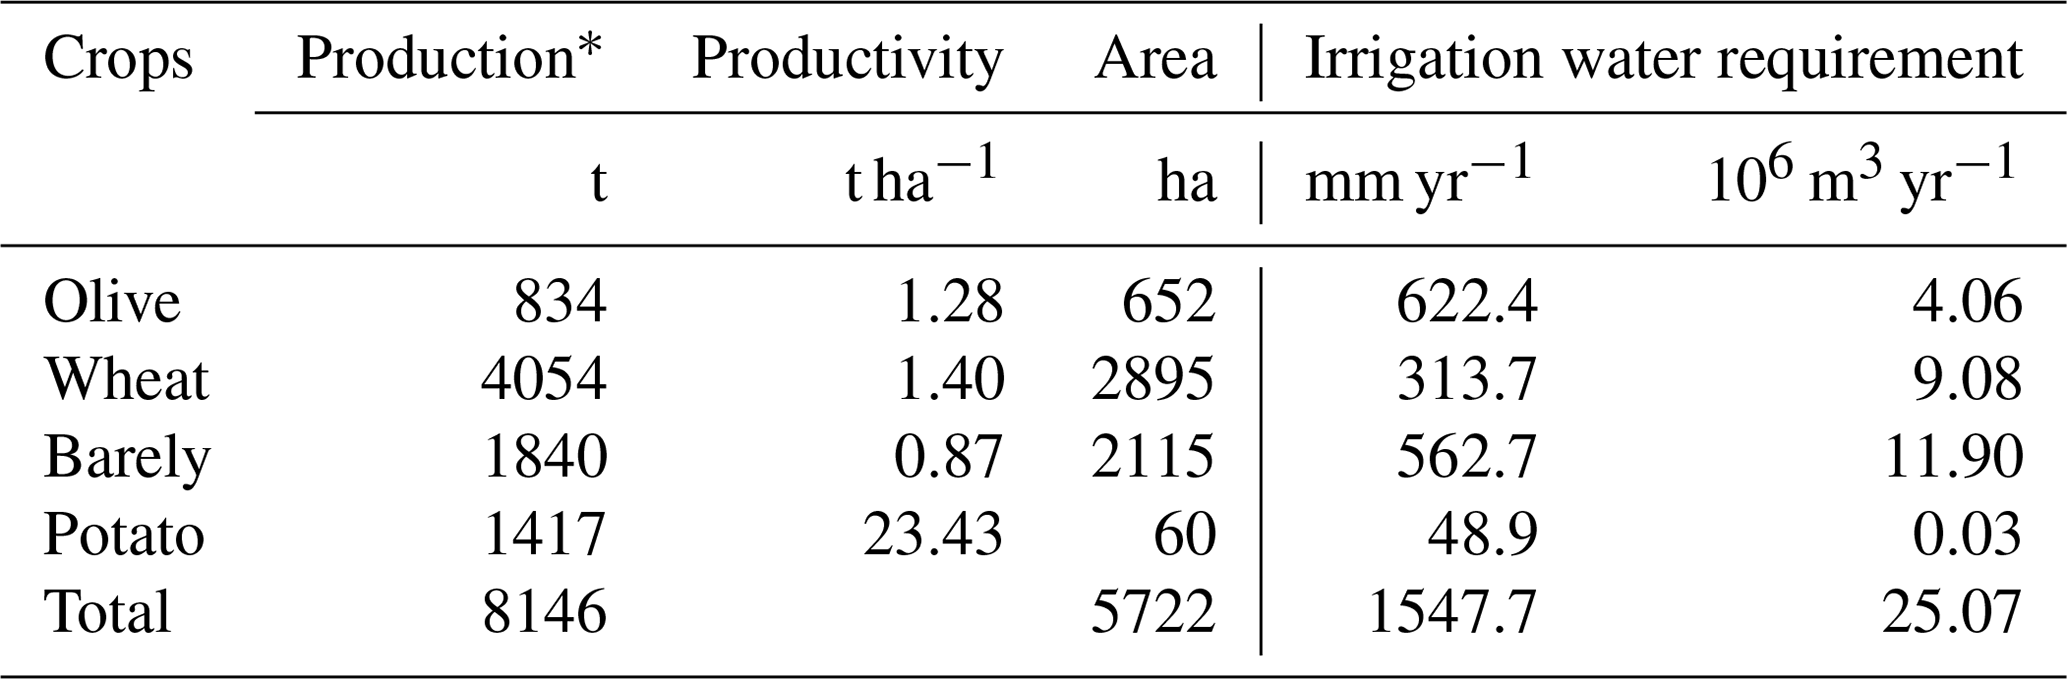
∗ Crop production is 0.1 % of the amount of national production in Morocco.
3.2 Quantification of water and energy consumption as well as CO2 emission by production and transport of phosphate
To quantify the water, energy, and CO2 emission, water and energy footprints of each process in each mining site were analyzed based on survey data. For example, the adaptation process is essential for pipeline transportation and large amounts of water are needed in comparison to other processes; thus, the relationship between the amounts of phosphate and water used in adaptation process were analyzed (Fig. 4a). In addition, the energy footprint includes electricity and fuel consumption, which are analyzed through the linear relationship (Fig. 4b).
Production and transport scenarios were applied and quantified for water, energy, and CO2 emission in each scenario (Table 6). In the mining area, 20.1×10⁶ t of raw phosphate were produced in 2015 with the “business as usual” (BAU) scenario. And 40 % of production was in the form of slurry and transported by pipeline; 60 % was in the form of rock and transported by train. Scenario BAU indicates that 15.84×10⁶ m3 of water was used in all processing (both rock and slurry). Additional fresh water was transported through the pipeline to maintain slurry consistency in the system. For the BAU scenario, 3.85×10⁶ m3 of fresh water were transported by pipeline to the industrial area. Scenario 1 (all raw phosphate transported by pipeline) increases the total water used to 32.14×10⁶ m3 (103 % increase over BAU). Fresh water is also used to maintain good operation of the pipeline, but with the increase in slurry transported by pipeline, the quantity of “maintenance” fresh water decreased from 3.85×10⁶ to 2.47×10⁶ m3, leading to a smaller total consumption of fresh water, i.e., a 76 % increase was shown for total water consumption (for both processing and transport by pipeline).
Using only the pipeline for transport requires an additional 131 832 MWh of electricity for the flotation and adaptation processes used to produce slurry (31 % increase in comparison to BAU). However, the consumption of fuel significantly decreases as there is no need to dry phosphate rock. This results in a nearly 86 % decrease in fuel consumption over the BAU scenario and a fuels savings of 176.4×10⁶ L, which translates into a 40 % decrease in CO2 emission in scenario 1. In scenario 2, there was a 50 % increase in raw phosphate export over the BAU scenario, with transport the same as in BAU. Total water consumed, including fresh water transported through the pipeline, increased by 16 % over BAU, energy consumption increased by 46 %, and CO2 emission increased by 39 %. Scenarios 3 and 4 represent a 50 % increase in phosphate exports; thus, target production was set at 2.45×10⁶ t month−1 for raw phosphate (in total 29.3×10⁶ t yr−1). Scenario 3 indicates a total water consumption increase to 46.6×10⁶ m3 (137 % over BAU) and electricity consumption increase of 75 %. However, transport by pipeline also led to an 80 % decrease in fuel consumption (compared to BAU) and consequent 18 % decrease in CO2 emissions.
Table 9Additional water and energy for solving water shortage by scenarios of phosphate production.
In summary, the comparison between BAU and scenario 1 shows the trade-off between water and energy by the change in transportation method. Pipeline transportation can save energy use and reduce CO2 emission, but more water is required due to additional processes, such as adaptation and water used to operate the pipeline. However, since the water used to operate the pipeline is actually transported to Jorf Lasfar and reused in fertilizer factories, it could be considered nonconsumptive water in terms of the supply chain integrating Khouribga and Jorf Lasfar, even though it is still real water withdrawn from Khouribga.

3.3 Assessment of the impacts of water allocation and treated water use in the industrial and agricultural areas
The main challenge of the mining area is sustainable water allocation for both the phosphate industry and irrigated agricultural areas. Thus, production targets were established for both phosphates and crops, and scenarios evaluated using the WEF-P Tool. Target crop production rates for Morocco's primary food crops (wheat, olive, barley, and potato) were set as 0.1 % of national production. Table 7 shows that 25.07×10⁶ m3 yr−1 of irrigation water is required to produce 5722 ha of crops. In the case of wheat, irrigation requirements were calculated at 313.7 mm yr−1, equivalent to 9.08×10⁶ m3 to produce 0.1 % of national production annually.
The main water resource for the mining area is the Aït Messaoud Dam. Water allocations from this source affect both phosphate and agricultural areas. Water used for phosphate production increases when the pipeline is used to transport slurry (versus dry rocks transported by train). The impact of water allocation under only the pipeline is calculated using various scenarios for water allocation (Table 8), and the treated wastewater from urban area was considered a water resource for both the phosphate industry and agriculture.
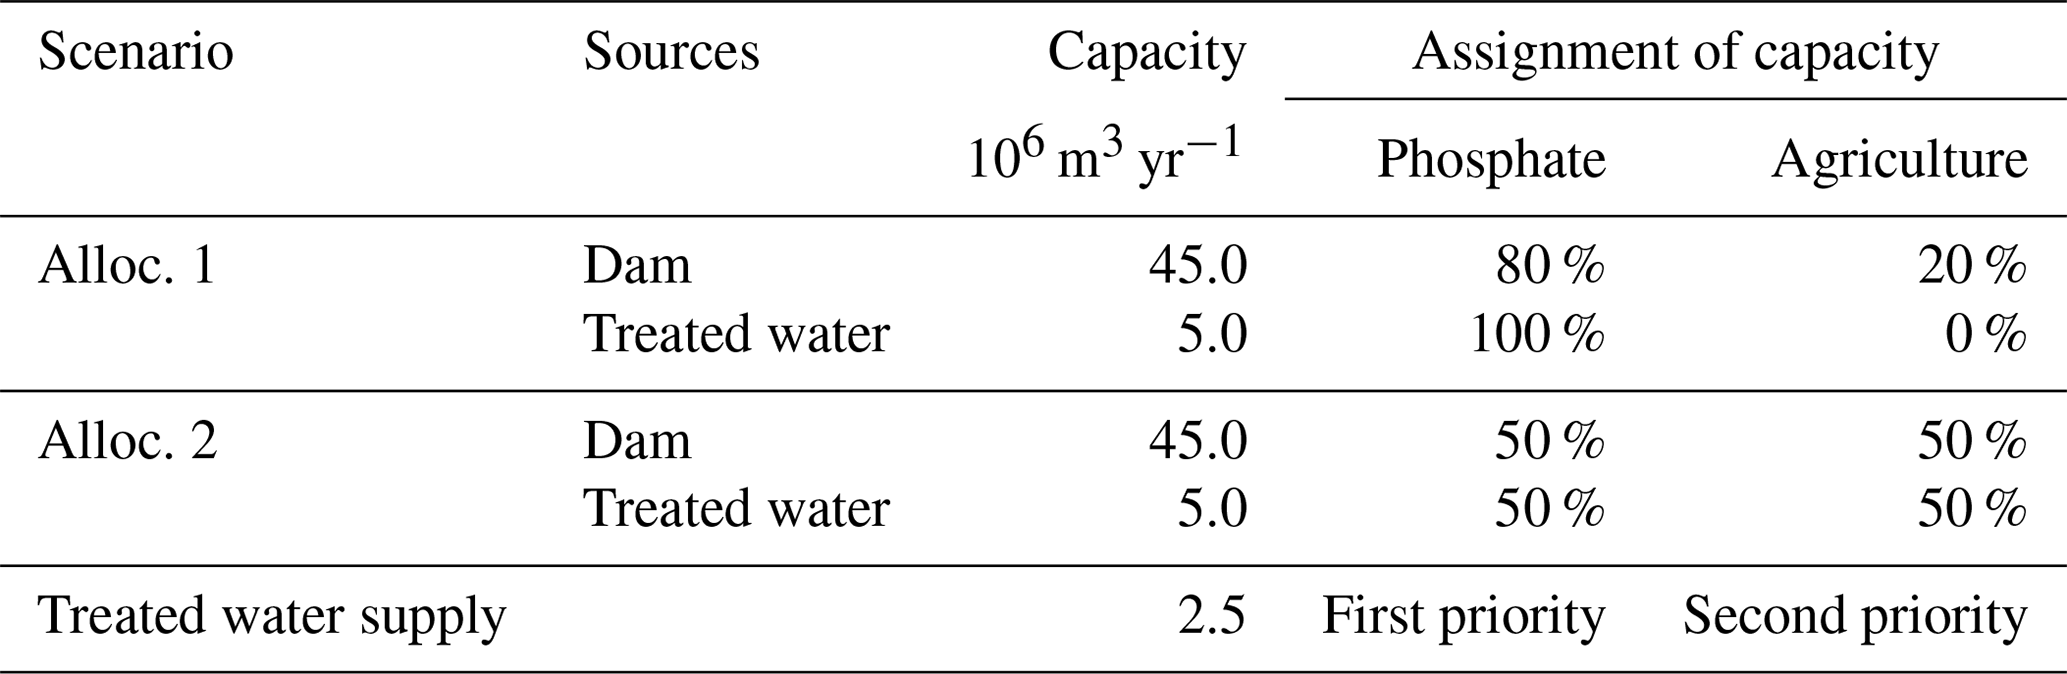
In the “Alloc. 1” scenario, supply capacity from the dam was set at 80 % for the phosphate industry and 20 % for the agricultural area. The wastewater treatment plant operates in the mining area. For scenario Alloc. 1, all treated water was assigned to the phosphate industry. The “Alloc. 2” scenario focuses on the importance of water for agriculture and assigns the water equally between the phosphate and agricultural areas. Water supplied from the dam plus treated water from the plant may be insufficient for both industries. To address this issue, treated water and groundwater were considered supplementary water sources and a treated water quantity of 2.5×10⁶ m3 yr−1 (50 % of current operation) was assigned to the two industries.
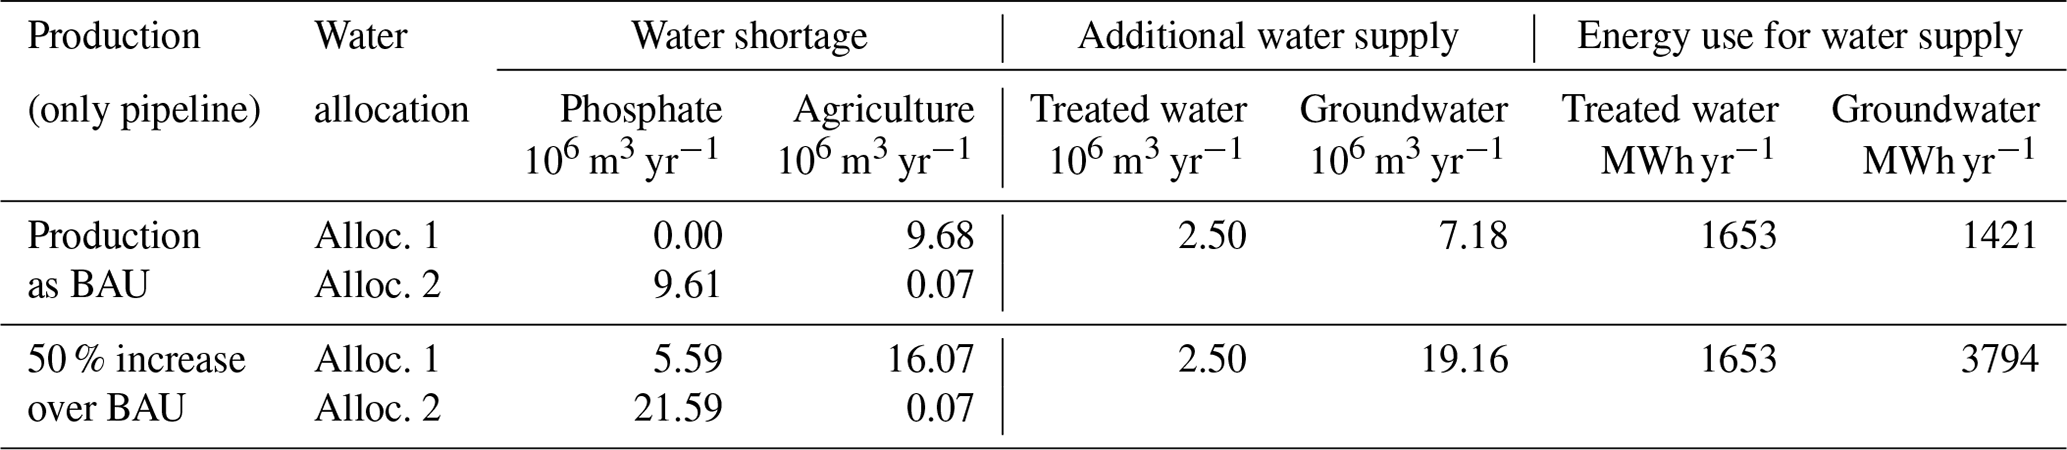
When water resources were allocated according to the Alloc. 1 scenario (80 % of surface water and 100 % of treated water allocated to the phosphate mining area), 9.68×10⁶ m3 additional water was required for agriculture (Table 9). When water is allocated equally between the two industries (Alloc. 2 scenario), there is a shortfall of 9.61×10⁶ m3 in the phosphate industry but of only 70 000 m3 for agricultural irrigation. In the case of a 50 % increase in phosphate production over BAU and using the pipeline as the only mode of transport, the Alloc. 1 scenario indicates intensive water supply to the phosphate mining area rather than to agricultural area and causes an annual shortage of 5.59×10⁶ and 16.07×10⁶ m3 water in the phosphate mining and the agricultural area, respectively. To address this shortage, 2.5×10⁶ m3 of treated water could be supplied in addition to 19.16×10⁶ m3 of groundwater.
Additionally, electricity is required to pump groundwater and treat wastewater. Thus, the source of water may also affect electricity consumption. Goldstein and Smith (2002) noted that 0.198 kWh is required to supply 1 m3 of groundwater, and the least electricity required to supply surface water is 0.079 kWh m−3. Therefore, a 50 % increase over BAU is accompanied by 3794 MWh yr−1 electrical consumption for pumping groundwater (Table 9). Increasing the use of treated water releases the demand for groundwater use, but the costs of building and operating the infrastructure and treatment facility must be considered. In this study, the capacity of treated water was set at 2.5×10⁶ m3 yr−1, and groundwater requirements were changeable only as scenarios of water allocation.
3.4 Assessment of the impact of dynamic management of phosphate production on groundwater and energy savings
Water resource availability and water requirements for crop production are seasonal. Rainfall in June and July is less than 10 mm month−1 and irrigation water requirements exceed 80 mm month−1 (Fig. 5). Thus, there is water scarcity in the agricultural area during June and July. Given that water resources are shared between the phosphate industry and the agriculture industry, static production of phosphate could accelerate water shortage for agriculture. Dynamic production of phosphate is a scenario with greater agricultural production during non-irrigation seasons and less production during irrigation seasons. Using the dynamic phosphate production scenario, the monthly production of phosphate decreases from 1.68×10⁶ to 0.91×10⁶ t month−1 between May and October, representing a 50 % decrease in raw phosphate export compared to the BAU scenario. Between November and April, phosphate production increases to 2.45×10⁶ t month−1, representing a 50 % increase in raw phosphate export compared to the BAU scenario.
Water availability and irrigation water requirements differ seasonally; dynamic monthly production of phosphate can contribute to sustainable water management. The effect of dynamic phosphate production on water supply becomes obvious when the pipeline is the only mode of transport: slurries are more water intensive than rock. Under static phosphate production, the monthly demand for water from the dam in January and February was about 2.5×10⁶ m3 month−1 and increasing to 7.0×10⁶ m3 month−1 in June (Fig. 6). Nevertheless, dynamic phosphate production decreases the water demanded during the water-scarce season. Moreover, the lack of water supply is covered by groundwater; dynamic production uses less groundwater than static production (Fig. 7). During the water-scarce season (May to July), total groundwater used is 5.77×10⁶ m3 in static phosphate production. This decreases by 10 % in dynamic production, potentially saving 0.58×10⁶ m3 of groundwater during the water-scarce season. Groundwater resources constitute an important aspect of the national hydraulic heritage and represent the only water resource in this hyperarid climate (Tale, 2006). Thus, dynamic phosphate production carries positive impacts on sustainable water management and water conservation.
Dynamic phosphate production also contributes to electricity savings because supplying water from the dam, ground, or wastewater treatment require electricity for pumping, transporting, and treating (Fig. 8). Total electricity consumed in supplying water to the phosphate and agriculture industries was 9971 MWh yr−1 under the static production scenario (phosphate slurries, no rocks). This number decreased to 9828 MWh yr−1 when phosphate slurries were produced dynamically. About 143 MWh of electricity can be saved annually, which is accompanied by a reduction of 117 t of CO2 emission.
As Morocco continues to work toward meeting its projected phosphate production goals, it is important to assess and quantify the potential resource competition between the growing municipal and agricultural sectors. Sustainable resource management strives for symbiosis between the phosphate industry and other sectors and endeavors to create synergy through multiple strategies. The WEF-P Tool integrates water–energy–food management and supply-chain management for phosphate production, considering the trade-offs between water, energy, and food, as well as a systematic analysis based on the total supply-chain management of phosphate production. In other words, the WEF-P Tool offers a decision support system to provide quantifiable trade-off analyses for management decisions such as increasing production, transportation systems, and water allocation. The developed WEF-P Tool enables users to do the following:
-
understand and identify the associated footprints of the primary functional production processes and existing flows in production lines,
-
identify the main sources of data to be gathered and fed into the model on a specific temporal basis,
-
identify the techniques employed to conserve or produce water and energy and minimize the impacts of phosphate production,
-
form a translational platform between sectors and stakeholders to evaluate proposed scenarios and their associated resource requirements.
As phosphate mining increases, options that contribute to reducing water and energy stress include increased reliance on transport by pipeline and dynamic management of phosphate production. This tool assesses the impacts of various production pathways, including specific process decisions throughout the phosphate supply chain, such as the choices for transport by pipeline or train and the impacts on regional water and energy use. For example, transport by pipeline instead of train can contribute to energy savings due to the elimination of the phosphate drying process (a main consumer of fuels). At the same time, the slurry adaptation processes are the main consumers of water; although, because the pipeline also transfers fresh water to Jorf Lasfar where the fertilizers are produced, the water embedded in slurry is a main water resource for Jorf Lasfar. Previously, the main water resource in Jorf Lasfar was desalinated water, which consumes energy in desalination. Transport by pipeline contributes to a savings of desalinated water and energy for desalinating. The dynamic management scenario is assessed for its impacts on regional water and energy savings: dynamic management of phosphate production indicates different production quantities during irrigated and non-irrigation seasons. Less phosphate production during irrigation season can contribute more surface water for agricultural use and is accompanied by a savings of groundwater and the energy required to pump groundwater.
Further consideration of the economics of the phosphate operation is needed: static production may bring stability to operations (meeting local and export demand), but there are benefits from dynamic production that can be attributed to reduced competition with other water-consuming sectors. Additional variables, such as facility operation, labor, economic cost-benefit analysis of static and dynamic production, etc., should be quantified and included for additional trade-off assessments. Quantification of water and energy for phosphate production is strongly dependent on the relationship between production and resource consumption: this can change in future scenarios. Proper water availability for the right place and time in a changing climate requires analysis of complex scientific, technical, socioeconomic, regulatory, and political issues.
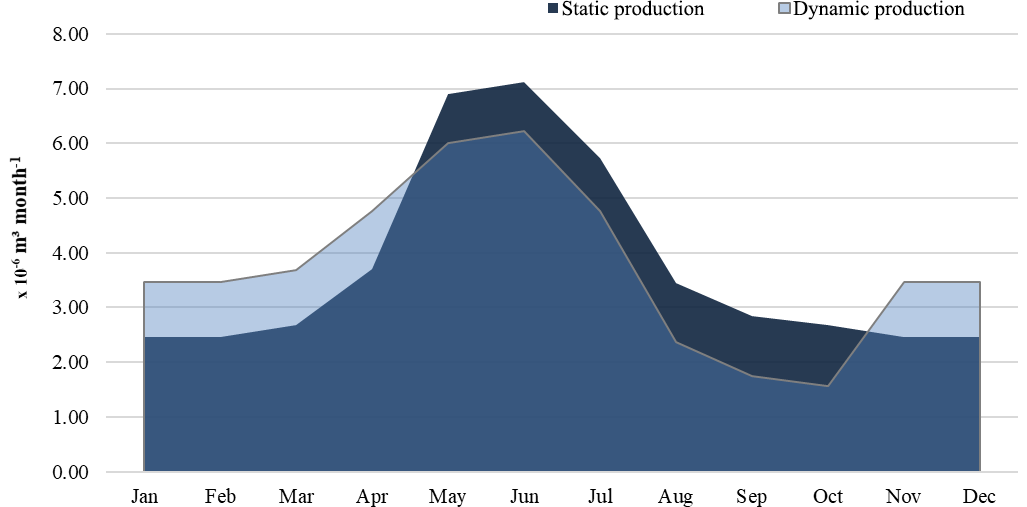
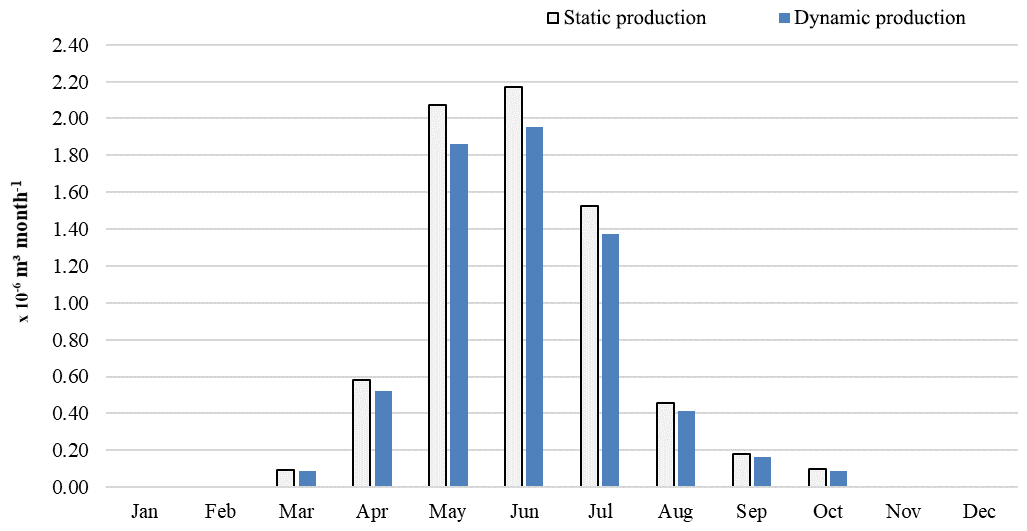
Figure 7Monthly groundwater use by static and dynamic production of phosphate slurries transported by pipeline.
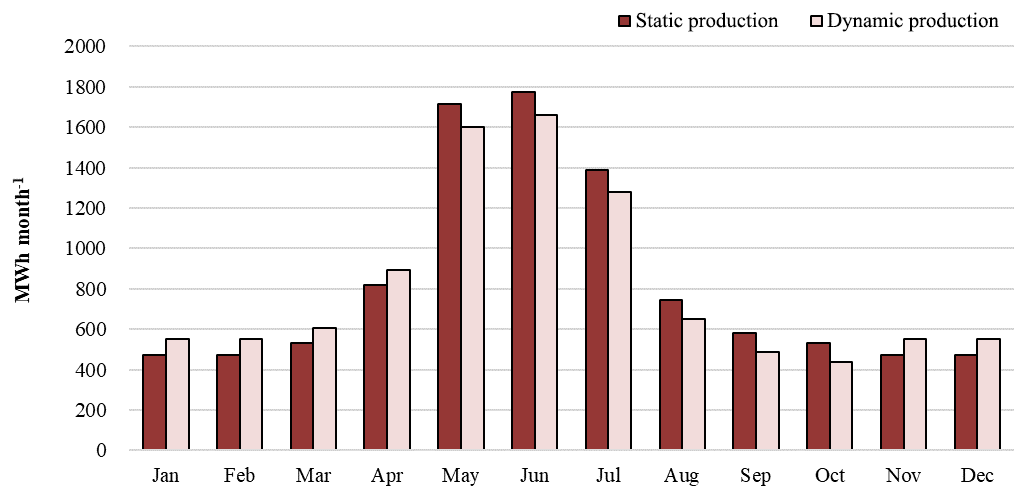
Figure 8Monthly electricity consumption for supplying water by static and dynamic production of phosphate slurries transported by pipeline.
Beyond the limitations, the deliverables from this study include a conceptual and analytical model of the phosphate supply chain in Morocco: the WEF-P Tool. The tool can assess the various scenarios to offer an effective means of ensuring the sustainable management of limited resources to both agricultural area and the phosphate industry. It quantifies the products (phosphate) and resource footprints (water, energy) across the supply chain, identifies the interlinkages between water and energy in phosphate production and transport, and establishes reference values for comparison of outcomes and performance. The WEF-P Tool enables the user to evaluate trade-offs between water resource allocations and the impact of the Moroccan phosphate industry with agricultural water use.
The resulting data for this study are freely available by contacting the corresponding author.
S-HL, ATA, and RHM conceived and designed the research; S-HL and ATA analyzed the data; S-HL, BTD, and FEM contributed analysis tools; and S-HL and ATA wrote the paper.
The authors declare that they have no conflict of interest.
The authors thank the OCP Policy Center for arranging meetings with their engineers and managers in the mining and production areas for data collection. The authors also express their appreciation to Mary Schweitzer of the WEF Nexus Research Group at Texas A&M University for her editorial assistance and contributions.
This research was funded by the OCP Policy Center as well as the OCP foundation, and it was also supported by the Japan Science and Technology Agency as part of the Belmont Forum.
This paper was edited by Gerrit H. de Rooij and reviewed by two anonymous referees.
Allan, T., Keulertz, M., and Woertz, E.: The water–food–energy nexus: an introduction to nexus concepts and some conceptual and operational problems, Int. J. Water Resour. Dev., 31, 301–311, 2015.
Allen, R. G., Pereira, L. S., Raes, D., and Smith, M.: Crop evapotranspiration: Guidelines for computing crop water requirements, FAO irrigation and drainage paper 56, Food and Agriculture Organization of the United Nations, Rome, Italy, 300, D05109, 1998.
Al-Saidi, M. and Elagib, N. A.: Towards understanding the integrative approach of the water, energy and food nexus, Sci. Total Environ., 574, 1131–1139, 2017.
Biggs, E. M., Bruce, E., Boruff, B., Duncan, J. M., Horsley, J., Pauli, N., McNeill, K., Neef, A., Van Ogtrop, F., Curnow, J., and Haworth, B.: Sustainable development and the water–energy–food nexus: A perspective on livelihoods, Environ. Sci. Policy, 54, 389–397, 2015.
Brandi, C. A., Richerzhagen, C., and Stepping, K. M.: Post 2015: why is the water-energy-land nexus important for the future development agenda? United Nations Post-2015 Agenda for global development: perspectives from China and Europe, German Development Institute/Deutsches Institut für Entwicklungspolitik (DIE), Bonn, 297–310, 2014.
Cai J., Yin H., and Varis O.: Impacts of industrial transition on water use intensity and energy-related carbon intensity in China: A spatio-temporal analysis during 2003–2012, Appl. Energ., 183, 1112–1122, 2016.
Daher, B. T. and Mohtar, R. H.: Water–energy–food (WEF) Nexus Tool 2.0: guiding integrative resource planning and decision-making, Water Int., 40, 748–771, 2015.
Croset, P.: Ambition at the Heart of Change, Dunod, Paris, France. ISBN 978-2-10-071443-8, 2012.
Dubois, O., Faurès, J. M., Felix, E., Flammini, A., Hoogeveen, J., Pluschke, L., Puri, M., and Ünver, M.: The Water-Energy-Food Nexus: A New Approach in Support of Food Security and Sustainable Agriculture, in: Food and Agriculture Organization (FAO), Food and Agriculture Organization, Rome, 2014.
FAO: AQUASTAT, Online Database, Statistics Division, Food and Agriculture Organization of the United Nations (FAO), Rome, Italy, http://www.fao.org/nr/water/aquastat/main/index.stm/ (last access: 4 September 2019), 2015.
Ferroukhi, R, Nagpal, D., Lopez-Peña A., Hodges, T., Mohtar, R. H., Daher, B., Mohtar, S., and Keulertz, M.: Renewable Energy in the Water, Energy & Food Nexus, International Renewable Energy Agency, Abu Dhabi, UAE, 2014.
Flörke M., Kynast E., Bärlund I., Eisner S., Wimmer F., and Alcamo J.: Domestic and industrial water uses of the past 60 years as a mirror of socio-economic development: A global simulation study, Global. Environ. Chang., 23, 144–156, 2013.
Goldstein, R. and Smith, W.: Water & sustainability (volume 4): US electricity consumption for water supply & treatment - the next half century, technical report, Electric Power Research Institute, 2002.
Hoff, H.: Understanding the nexus: Background paper for the Bonn 2011 Nexus Conference, Stockholm Environment Institute, Stockholm, Sweden, 2011.
IEA, International Energy Agency: Energy Policies Beyond IEA Countries: Morocco 2014, OECD/IEA, France, ISBN 9789264211483, 2014.
Keulertz, M., Sowers, J., Woertz, E., and Mohtar, R.: The Water-Energy-Food Nexus in Arid Regions: The Politics of Problemsheds, Oxford Handbooks Online, Oxford, England, 2016.
Keulertz, M. and Mohtar, R.: Governance and Cooperation over Food and SDG 2 in the Arab Region, EDA Insight Research and Analysis, Emirates Diplomatic Academy, Abu Dhabi, UAE, 2019.
Kuo S. F., Ho, S. S. and Liu, C. W.: Estimation irrigation water requirements with derived crop coefficients for upland and paddy crops in ChiaNan Irrigation Association, Taiwan, Agr. Water Manage., 82, 433–451, 2006.
Mentzer, J. T., DeWitt, W., Keebler, J. S., Min, S., Nix, N. W., Smith, C. D., and Zacharia, Z. G.: Defining supply chain management, J. Bus. Logist., 22, 1–25, 2001.
Mohtar, R. H., Assi, A. T. and Daher, B. T.: Bridging the Water and Food Gap: the Role of the Water-energy-food Nexus, United Nations University, Institute for Integrated Management of Material Fluxes and of Resources (UNU-FLORES), Dresden, Germany, 2015.
Mohtar, R. H. and Daher, B.: A platform for trade-off analysis and resource allocation: the water-energy-food nexus tool and its application to Qatar's food security, in: Valuing Vital Resources in the Gulf, Chatham House, London, UK, 2014.
Mohtar, R. H. and Daher, B.: Water-Energy-Food Nexus Framework for Facilitating Multi-stakeholder Dialogue, Water Int., 41, 655–661, 2016.
Mohtar, R.H. and Lawford, R.: Present and future of the water-energy-food nexus and the role of the community of practice, J. Environ. Stud. Sci., 6, 192–199, 2016.
OCP, Office Cherifien des Phosphates (OCP): Activity report, OCP Group, Casablanca, Morocco, 2013.
OCP, Office Cherifien des Phosphates (OCP): Slurry Pipeline, OCP Group, Casablanca, Morocco, 2016a.
OCP, Office Cherifien des Phosphates (OCP): Water program, OCP Group, Casablanca, Morocco, 2016b.
OCP, Office Cherifien des Phosphates (OCP): Annual reports, OCP Group, Casablanca, Morocco, 2020.
Pahl-Wostl, C.: Governance of the water-energy-food security nexus: A multi-level coordination challenge, Environ. Sci. Policy, 92, 356–367, 2019.
Ringler, C., Bhaduri, A., and Lawford, R.: The nexus across water, energy, land and food (WELF): potential for improved resource use efficiency, Curr. Opin. Env. Sust., 5, 617–624, 2013.
Rockström, J., Steffen, W., Noone, K., Persson, Å., Chapin III, F. S., Lambin, E. F., Lenton, T. M., Scheffer, M., Folke, C., Schellnhuber, H. J., Nykvist, B., de Wit, C. A., Hughes, T., van der Leeuw, S., Rodhe, H., Sörlin, S., Snyder, P. K., Costanza, R., Svedin, U., Falkenmark, M., Karlberg, L., Corell, R. W., Fabry, V. J., Hansen, J., Walker, B., Liverman, D., Richardson, K., Crutzen, P., and Foley, J. A.: A safe operating space for humanity, Nature, 461, 472–475, 2009.
Smith, M.: CROPWAT-A computer program for irrigation planning and management, FAO Irrigation and Drainage Paper No. 46, Food and Agriculture Organization, Rome, 1992.
Stührenberg, L.: Plan Maroc Vert: les grands principes et avancées de la stratégie agricole marocaine, Bulletins de synthèse souveraineté alimentaire, 20, 2016.
Taleb, H.: Water management in Morocco, in: Management of Intentional and Accidental Water Pollution, Springer, Dordrecht, the Netherlands, 177–180, 2006.
Terrapon-Pfaff, J., Ortiz, W., Dienst, C., and Gröne, M. C.: Energising the WEF nexus to enhance sustainable development at local level, J. Environ. Manage., 223, 409–416, 2018.
USEIA: CO2 emission by burning fuels and generating electricity. U.S. Energy Information Administration, https://www.eia.gov, last access: 4 September 2019.
World Bank: Population in Morocco. The World Bank Group, https://data.worldbank.org (last access: 10 September 2019), 2019a.
World Bank: Energy use by oil equivalent per capita and electric power consumption per capita. The World Bank Group, https://data.worldbank.org (last access: 10 September 2019), 2019b.
World Bank: World Bank development indicators. The World Bank Group, https://data.worldbank.org (last access: 10 September 2019), 2019c.
Yumkella, K. K. and Yillia, P. T.: Framing the water-energy nexus for the post-2015 development agenda, Aquat. Pr., 5, 8–12, 2015.