the Creative Commons Attribution 4.0 License.
the Creative Commons Attribution 4.0 License.
 | 28 Sep 2020
Throughfall isotopic composition in relation to drop size at the intra-event scale in a Mediterranean Scots pine stand
Juan Pinos
Jérôme Latron
Kazuki Nanko
Delphis F. Levia
Pilar Llorens
The major fraction of water reaching the forest floor is throughfall, which consists of free throughfall, splash throughfall and canopy drip. Research has shown that forest canopies modify the isotopic composition of throughfall by means of evaporation, isotopic exchange, canopy selection and mixing of rainfall waters. However, the effects of these factors in relation to throughfall isotopic composition and the throughfall drop size reaching the soil surface are unclear. Based on research in a mountainous Scots pine stand in northeastern Spain, this study sought to fill this knowledge gap by examining the isotopic composition of throughfall in relation to throughfall drop size. In the experimental stand, throughfall consisted on average of 65 % canopy drip, 19 % free throughfall and 16 % splash throughfall. The dynamics of the isotopic composition of throughfall and rainfall showed complex behaviour throughout events. The isotopic shift showed no direct relationship with meteorological variables, number of drops, drop velocities, throughfall and rainfall amount, or raindrop kinetic energy. However, the experiment did reveal that the isotopic shift was higher at the beginning of an event, decreasing as cumulative rainfall increased, and that it also increased when the median volume drop size of throughfall (D50_TF) approached or was lower than the median volume drop size of rainfall (D50_RF). This finding indicates that the major contribution of splash throughfall at the initial phase of rain events matched the highest vapour pressure deficit (VPD) and, at the same time, corresponded to higher isotopic enrichment, which implies that splash droplet evaporation occurred. Future applications of our approach will improve understanding of how throughfall isotopic composition may vary with drop type and size during rainfall events across a range of forest types.
- Article
(5132 KB) - Full-text XML
-
Supplement
(441 KB) - BibTeX
- EndNote


Forests play an important role in the water balance of catchments by redistributing rainfall in throughfall, stemflow and interception loss. To study the rainfall partitioning process, the classical hydrometric approach of measuring rainfall partitioning has been recently complemented and expanded by natural tracing with water stable isotopes (δ18O and δ2H). It has been shown that the forest canopy modifies the isotopic composition of throughfall and stemflow in relation to open rainfall (Allen et al., 2017; Cayuela et al., 2018a). Isotopic fractionation can occur in both directions (enrichment and depletion), with enrichment being more frequent (Saxena, 1986). Throughfall isotopic shifts are mainly caused by four factors: evaporation, isotopic exchange, canopy selection and mixing of waters (Allen et al., 2017), although subcanopy water recycling i.e. evapotranspiration and recondensation (Green et al., 2015), may also exert an influence. However, it is important to note that the effect of each factor and the magnitude of the isotopic shift remain unclear. Isotopic fractionation by evaporation occurs when rain water molecules achieve enough energy to change from liquid to the gas phase, resulting in an enrichment of heavy isotopes. Isotopic exchange is the exchange between liquid and environmental vapour when these pools are not in an isotopic steady state. Canopy selection is the result of selective water retention in the canopy of different lapses within rainfall events that temporally vary its isotopic composition. Mixing of water relates to the storage of the residual water of previous rainfall in the canopy that is eventually mixed with new rain water. Exchange, canopy selection and mixing of water can cause either isotopic enrichment or depletion.
Because throughfall represents the main water input to the soil (Levia and Frost, 2006), understanding the spatiotemporal variability of throughfall isotopic composition is of paramount importance to use it as an input value in isotope-based hydrological studies. Spatial variability of the throughfall isotopic composition between collectors seems to be related to canopy cover (Cayuela et al., 2018a) but not to throughfall amount (Allen et al., 2015). However, all isotopic fractionation factors could very well occur during the same rainfall event, which complicates the understanding of the mechanisms that influence the intra-event isotopic differences between rainfall and throughfall. Although a small number of studies have focused on understanding the spatiotemporal variability of throughfall isotopic composition at the intra-event scale (e.g. Kubota and Tsuboyama, 2003; Ikawa et al., 2011; Cayuela et al., 2018a), the factors controlling this variability remain largely unclear.
Laboratory experiments demonstrated that falling water droplets experience isotopic fractionation due to evaporation and isotopic exchange with the environment and that the degree of evaporation is related to drop characteristics (size, velocity, number, temperature), air conditions, and exposure time or falling distance (Friedman et al., 1962; Stewart, 1975). More recently, Murakami (2006) and Dunkerley (2009) analysed the concept of splash droplet evaporation, showing that numerous small droplets are produced when a raindrop hits the canopy, enhancing the evaporation of the droplets. However, the influence that splash generation and subsequent evaporation or ionic exchange exerts on the isotopic composition of throughfall remains unexplored (Allen et al., 2017).
An increasing number of studies of throughfall drop characteristics, such as drop size, velocity and kinetic energy, have shed light on the partitioning of throughfall by trees. Some recent studies have shown that the way in which water reaches the forest floor is affected by throughfall drop characteristics and, therefore, affects soil erosion and probably soil moisture (Levia et al., 2017; Nanko et al., 2020). Moreover, several studies have shown that biotic and abiotic factors affect throughfall drop characteristics. These diverse factors have been related to whether trees are coniferous or broadleaved deciduous (Levia et al., 2019), the presence or absence of foliage (Nanko et al., 2016), canopy species and meteorological factors (wind and rainfall intensity) (Nanko et al., 2006; Lüpke et al., 2019), physical leaf characteristics (Nanko et al., 2013), the thickness and saturation of the canopy (Nanko et al., 2008a), and the spatial variation between crown positions under a single tree (Nanko et al., 2011) or within tree stands (Nanko et al., 2020).
For a given rainfall event with simultaneous measurements of drop size distributions (DSDs) measured both inside and outside the forest, throughfall can be divided into three types: (1) free throughfall (FR), which is the proportion of throughfall that does not contact the canopy surface and, thus, maintains the same DSD as open rainfall; (2) splash throughfall (SP), corresponding to the drops that hit the canopy and split into smaller drops; and (3) canopy drip (DR), which is the proportion of throughfall that is initially retained and routed by vegetative surfaces but eventually detaches from the vegetation (Levia et al., 2017, 2019). Canopy drip has the largest drop diameter and splash throughfall has the smallest (Levia et al., 2017).
Despite the important progress made in investigating throughfall dynamics using drop size data from disdrometers, the interrelationships between throughfall isotopic composition and throughfall drop size need to be investigated at the intra-event scale to yield insights into evaporative demand (Allen et al., 2017; Cayuela et al., 2018a; Levia et al., 2011, 2017). To our knowledge, no existing studies have analysed the details of the interplay between fine-scale rainfall and throughfall drop characteristics in terms of isotopic composition. Accordingly, the specific objectives of this study were as follows: (i) the quantification and analysis of the isotopic composition and drop sizes of both rainfall and throughfall at the intra-event scale; (ii) the calculation of the proportion of each throughfall type (free throughfall, splash and drip); and (iii) the analysis of the interrelationships of the observed isotopic shift and drop size between open rainfall and throughfall.

Figure 1Location of the monitoring sites within the Can Vila catchment, Spain.
2.1 Site description
The study was conducted in the Can Vila catchment (Fig. 1), one of the Vallcebre research catchments (northeastern Spain; 42∘12′ N, 1∘49′ E) in the eastern Pyrenees. These catchments have been monitored for 30 years for hydrological and ecohydrological purposes (see Latron et al., 2009; Llorens et al., 2018). Nowadays, most of the catchment is covered by Scots pine forests (Pinus sylvestris L.), which arose through afforestation of old agricultural terraces and small original fragmented oak forests (Quercus pubescens Willd.; Poyatos et al., 2003). The climate is sub-Mediterranean with a mean annual precipitation, reference evapotranspiration and air temperature of 867±223 mm, 856±69 mm and 9.2 ∘C respectively (mean for the period from 1999 to 2018; Llorens et al., 2018). Precipitation is seasonal throughout the year, with spring and autumn being the wettest seasons and summer and winter being the driest. Evapotranspiration shows a seasonal pattern with maximum values in summer of up to 6.9 mm d−1. Our study is based on data obtained within the Scots pine stand of Cal Rotes, located in the central part of the Can Vila catchment. The stand has an area of 900 m2 and is located at an elevation of 1200 m with a northeastern aspect. The stand has a mean diameter at breast height (DBH, 1.3 m) of 19.9±9.2 cm, a stand density of 1189 trees ha−1, a stand basal area of 45.1 m2 ha−1, a mean tree height of 17.0±4.4 m and a mean canopy cover of 69.3±17.7 % (Molina et al., 2019).
2.2 Monitoring design and data collection
The experimental work involved the continuous measurement, characterisation and sampling of open rainfall and throughfall. The rainfall monitoring site was located in an open area approximately 100 m from the Scots pine stand where throughfall was monitored (Fig. 1). The study tree is representative of the forest plot and has a canopy projected area large enough to locate the throughfall instruments. Throughfall was monitored at two randomly selected distances (0.8 and 1.2 m) from the bole of the study tree (Table 1). Other nearby trees that might have affected the throughfall monitoring location were located at an average distance of 4.4±1.1 m.
Table 1Biometric characteristics of the monitored tree (adapted from Cayuela et al., 2018b).
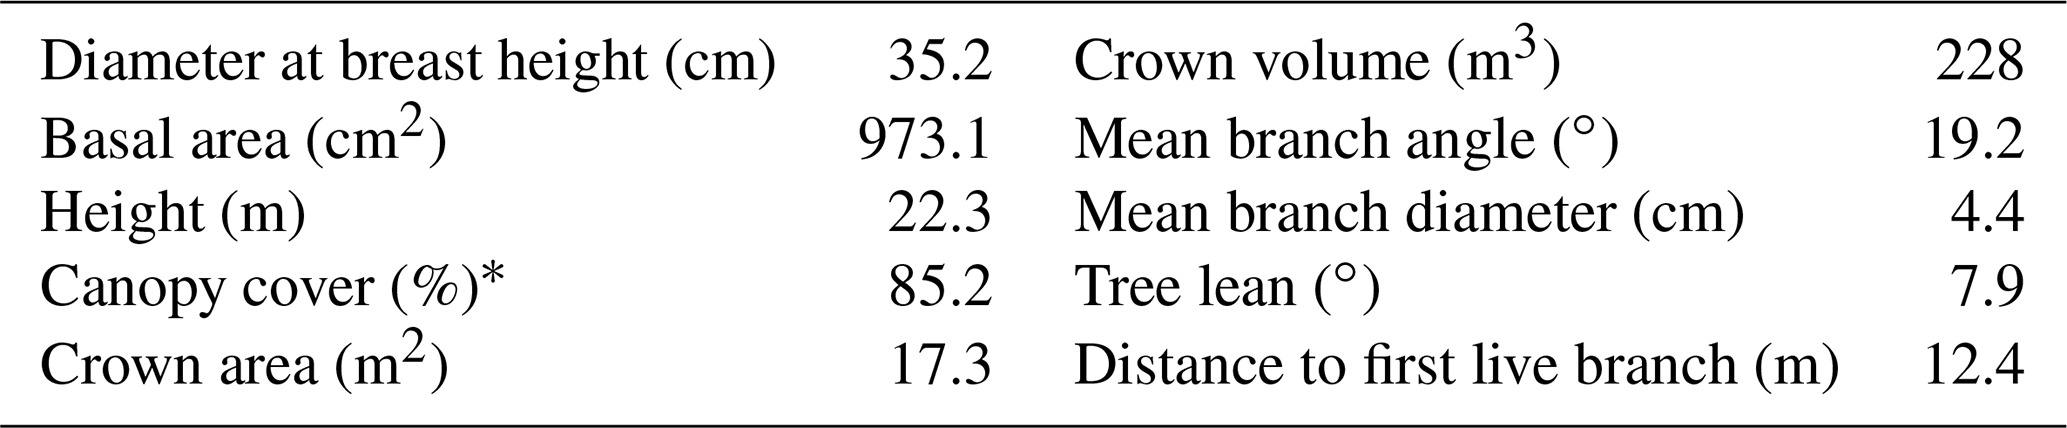
* Canopy cover was measured over the throughfall tipping-bucket collection area.
The monitoring design used ground-based laser disdrometers developed by Nanko et al. (2006, 2008b; also see Sect. 2.2.1 in this paper), one for open rainfall and two for throughfall, each placed just above a tipping-bucket rain gauge (model AW-P, Institut Analític, Barcelona, Spain) with a 0.2 mm resolution. Cumulative rainfall and throughfall amounts measured by the tipping buckets were recorded every 5 min with a datalogger (Data Taker DT85, Thermo Fisher Scientific Inc., Sunbury, Victoria, Australia). According to Iida et al. (2020), dynamic calibration of the tipping buckets was performed to ensure the quality of data. The rainfall and throughfall passing through the laser disdrometers and the tipping buckets were sequentially collected at 5 mm rainfall intervals (i.e. both samplers switched to the next bottle simultaneously) by means of automatic samplers (ISCO 3700, Teledyne ISCO Inc., Lincoln, NE, USA) buried in the ground to prevent evaporation from the water samples (Fig. 2). All samples were collected a maximum of 1 week after each storm. Unfortunately, the disdrometer located furthest from the tree lost a substantial amount of throughfall data due to technical problems and was therefore discarded from the analysis.
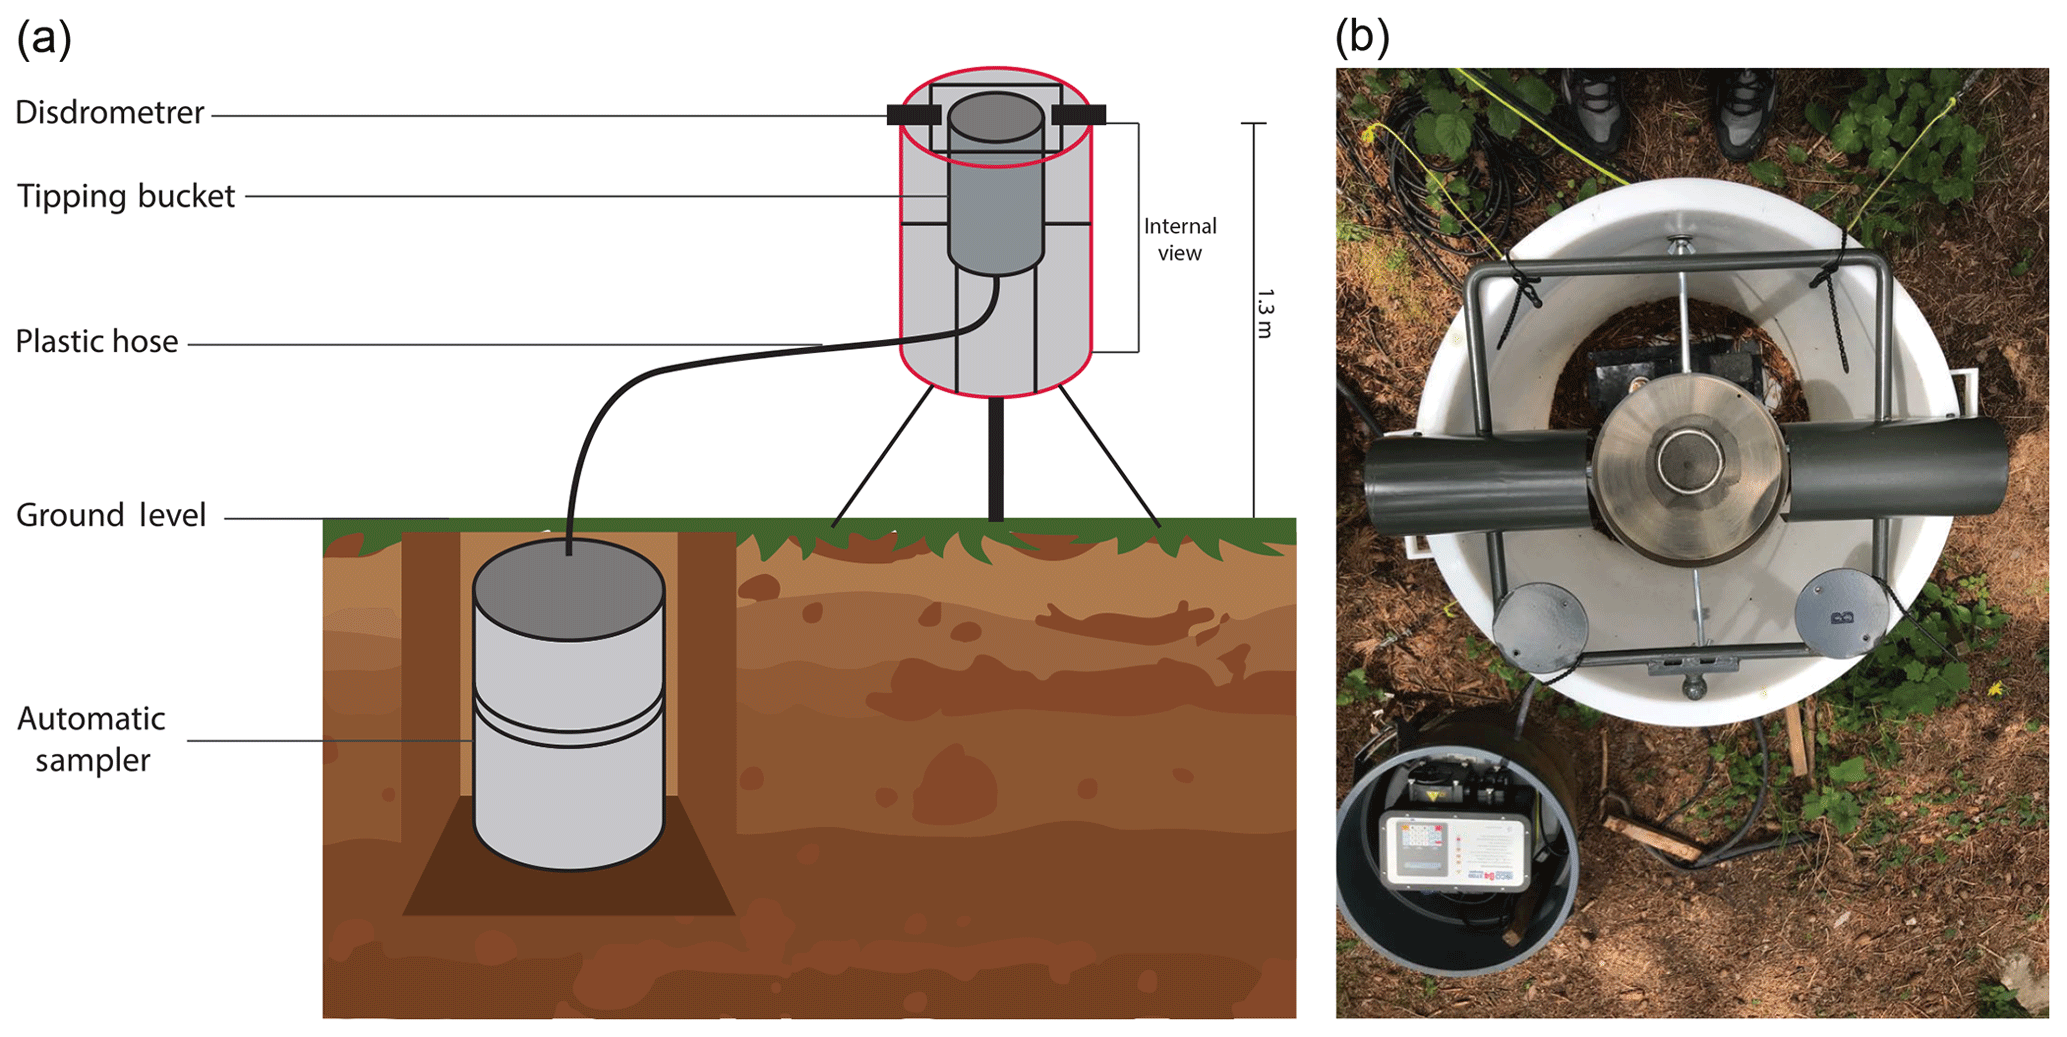
Figure 2Set-up for continuous measurement and sampling of open rainfall and throughfall. Diagram of the experimental equipment (a) and top view of the equipment installed in the forest stand (b).
2.2.1 Laser disdrometer characteristics
The laser disdrometers continuously measured the number of drops, as well as individual drop size and velocity. The instruments were built using a laser transmitter and a receiver (IB-30, KEYENCE Corporation, Osaka, Japan) with an amplifier (IB-1000, KEYENCE Corporation, Osaka, Japan) covered by two protection screens, following the design by Nanko et al. (2006). The sensors were attached to an iron frame. The light source of the laser sensor was a visible semiconductor 660 nm laser. Drops were measured within a 4500 mm2 sampling area (30 mm wide and 150 mm long) of 1 mm thickness. When a drop passed through the laser beam, the receiving laser beam decreased and the output voltage from the amplifier fell in proportion to the intercepted area of the laser beam. The output voltage was collected by an Arduino UNO every 50 µs (equivalent to 20 kHz). The output voltage data were converted into drop diameter and velocity data. The detailed calculation protocol is shown in Nanko et al. (2020). The shape of raindrops was assumed to be an oblate spheroid, whose axis ratio was determined by Andsager et al. (1999). The recorded drop data were collected weekly (emptying the Arduino SD memory card) and later post-processed at 5 min intervals, arranged into 0.1 mm drop size classes, and their respective numbers of drops and drop velocities were computed. The Arduino datalogging system used in this study had some limitations, as it could not record all of the drops passing simultaneously through the laser beam (see Appendix A for further details).
2.2.2 Meteorological data
Meteorological data were obtained from an automatic weather station located 2 m above the canopy of the forest stand. The station was equipped with the following sensors: an air temperature and relative humidity probe (HMP45C, Vaisala, Vantaa, Finland), an anemometer and wind vane (A100R, Vector Instruments, Rhyl, North Wales, UK) and a net radiometer (NR Lite, Kipp & Zonen, Delft, the Netherlands). Data were measured every 30 s and averaged at 5 min intervals by the datalogger (Data Taker DT85, Thermo Fisher Scientific Inc., Sunbury, Victoria, Australia).
2.2.3 Event classification
This study was carried out on an event basis. A rain-free period of 6 h (day) and 12 h (night), allowing for the drying of the canopy, was considered necessary to define separate events (Llorens et al., 2014). All event data were evaluated (i.e. quality controlled) for potential errors, and events with missing or erratic data were discarded. The definition of rainfall event classes was based on the duration and intensity of the event according to the following criteria: (a) a rainfall duration of 7 h was used to distinguish between short and long rainfall events, and (b) a maximum 30 min rainfall intensity threshold of 10 mm h−1 was used to separate low- and high-intensity events. By using both thresholds, rainfall was classified as follows: (1) short duration–low intensity (S–L; ≤7 h and ≤10 mm h−1); (2) short duration–high intensity (S–H; ≤7 h and >10 mm h−1); (3) long duration–low intensity (L–L; >7 h and ≤10 mm h−1); and (4) long duration–high intensity (L–H; >7 h and >10 mm h−1).
2.3 Estimation of throughfall types
The simultaneous measured open rainfall and throughfall DSD data were used for the separation of throughfall types by applying the protocol described by Levia et al. (2019). The separation, based on the DSD of throughfall and rainfall, consists of the calculation of the accumulated volume for each 0.1 mm drop diameter class. For each class i the volume of throughfall (TFi) is partitioned in the corresponding class i of free throughfall (FRi), splash throughfall (SPi) and canopy drip (DRi).
FRi is calculated as
where OPi is the class i of open rainfall, and p is the free throughfall fraction (dimensionless, from 0 to 1), which is related to canopy openness. Raindrop impact on the canopy and/or wind and turbulence can cause the canopy to sway during rainfall events, triggering dynamic variation in the degree of canopy openness. Because it is difficult (or impossible) to determine actual p, an approximation of p was assigned as the maximum value under the condition , utilising the same protocol as Nakaya et al. (2011); this protocol might overestimate p.
Splash throughfall is smaller than canopy drip. We set the maximum splash throughfall diameter (DMAX_SP) at 2.0 mm and the minimum canopy drip diameter at 1.0 mm. This indicated that throughfall drops with a diameter (di) from 1.0 to 2.0 mm were generated from the mixture of FR, SP and DR. The drop size distribution of SPi was determined by a Weibull cumulative distribution function (Eq. 3). In this study, the minimum splash drop diameter was set at 0.5 mm (rather than the 0.4 mm used by Levia et al., 2019), as the datalogging systems were different: Arduino in this study and a laptop in Levia et al. (2019). Therefore, in the Weibull function this value was set at 0.5 instead of 0.4.
Equation (4) was used for the calculation of the estimated splash throughfall distribution (SP).
SPi is determined by the minimum value between SP and (TFi−FRi). Finally, DRi was calculated using Eq. (5) when di>DMAX_SP or using Eq. (6) when splash was present.
For a detailed explanation of the formulas, calculations and assumptions employed, the reader is referred to Levia et al. (2017, 2019).
2.4 Isotopic analysis
Rainfall and throughfall samples collected by the automatic samplers every 5 mm rainfall were analysed for water stable isotopes (δ18O and δ2H) by the Scientific and Technical Services of the University of Lleida using the cavity ring-down spectroscopy technique with a Picarro L2120-i analyser (Picarro Inc., Santa Clara, CA, USA). The equipment had an accuracy of <0.1 ‰ for δ18O and <0.4 ‰ for δ2H, based on the repetition of four reference samples provided by the International Atomic Energy Agency (IAEA).
All isotopic data were expressed in terms of δ values and calculated as follows:
where VSMOW is the Vienna Standard Mean Ocean Water, and R is the isotope ratio (18O∕16O or 2H∕1H). The isotopic shift between throughfall and open rainfall (Δδ18OTF–RF) corresponds to the direct difference between the values of δ18O throughfall and δ18O open rainfall:
Deuterium excess (d-excess) was later determined to describe the deviation from the global meteoric water line (GMWL) and to indicate kinetic fractionation effects caused by evaporation, as in Gat (1996):
2.5 Statistical analysis
IBM SPSS Statistics 25 software (IBM Corporation, Armonk, NY, USA) was employed for the statistical analyses. As the correlation between variables of our dataset was not necessarily linear, the Spearman's rank correlation coefficient (Rs) was computed. Data not normally distributed were analysed by the nonparametric rank-based Kruskal–Wallis H test, which examines the significance of the differences among throughfall type percentages or drop diameters with respect to the grouping of the four rainfall classes (based on duration and intensity). Statistical significance was set at p<0.05. If the H value from the Kruskal–Wallis test was significant, the Mann–Whitney–Wilcoxon test was applied as a post hoc evaluation for the pairwise comparisons to determine which groups were significantly different.
3.1 Open rainfall, throughfall and drop characteristics
A total of 21 rainfall events were selected for analysis during the observation period (May 2018 to July 2019; Table S1 in the Supplement), amounting to a total rainfall of 482 mm. The rainfall depth per event ranged from 6.0 to 52.5 mm, and the maximum 30 min intensities varied between 2.7 and 38.2 mm h−1. The total amount of throughfall for the selected events was 428 mm (equivalent to 89 % of total incident rainfall), and the maximum throughfall was 48.3 mm (equivalent to 92 % of event incident rainfall). The total amount of rainfall–throughfall collected during the 21 events was distributed in 98 pairs of samples collected at 5 mm rainfall intervals. For 33 of the 98 pairs of samples, throughfall was higher than rainfall; one-third of these samples corresponded to the end of the rainfall event, after rainfall stopped, whereas the remaining two-thirds were distributed without any specific pattern at different time intervals during the rainfall events.
The total number of drops in the dataset (i.e. the 98 samples) was 529 750 for open rainfall and 271 963 for throughfall, which means that the number of throughfall drops was 48 % lower than that of rainfall. Altogether, 88 % of the samples had fewer throughfall drops than rainfall (Fig. S1a in the Supplement). The median volume drop diameter (D50), calculated for the 98 pairs of samples, ranged between 1.20 and 4.44 mm for open rainfall and between 1.47 and 4.17 mm for throughfall. The maximum diameter (DMAX) ranged between 2.51 and 7.87 mm for open rainfall and between 3.25 and 7.92 mm for throughfall. At the event scale, the median volume drop diameter (D50) ranged between 1.36 and 3.24 mm for open rainfall and between 2.83 and 3.90 mm for throughfall. Overall, the mean throughfall D50 found in this study (3.36 mm) was larger than values reported in other DSD studies. For example, Nanko et al. (2006) found that the throughfall D50 ranged from 1.77 to 2.93 mm for two coniferous species (Japanese cypress and Japanese cedar) under different meteorological conditions; moreover, Lüpke et al. (2019) reported throughfall D50 values of 2.7 and 0.80 for a European beech and Norway spruce tree respectively. The throughfall D50 was on average 1.3 mm larger than the rainfall D50. However, in moments with very large rainfall drops, generally during the first two rainfall intervals (i.e. ≤10 mm), rainfall (8 % of the total samples) had on average a diameter 0.37 mm larger than that of throughfall (Fig. S1b). The mean drop velocity was 4.34±0.62 m s−1 for rainfall and 3.97±0.29 m s−1 for throughfall. As expected, the mean velocity of throughfall drops was on average slower (0.4 m s−1) than rainfall (Fig. S1c), due to the differences in drop falling distance caused by the canopy.
3.2 Partitioning throughfall types
Canopy drip, free throughfall and splash throughfall represented 65 %, 19 % and 16 % of the total throughfall volume collected respectively (Fig. 3). In comparison with our results, Levia et al. (2019) found less canopy drip (51 %) but higher free throughfall (31 %) and a similar splash percentage (18 %) for other types of coniferous species. Tree height and canopy architecture differences between the coniferous species investigated by Levia et al. (2019) and the trees in our study may explain the differences in throughfall type percentages. In our study plot, higher tree canopy density and more woody surfaces (branches that may be dying or shed) from the lower part of the crown towards the stem base probably reduced the contribution of free throughfall but raised canopy drip, in comparison with the shorter coniferous trees considered by Levia et al. (2019).
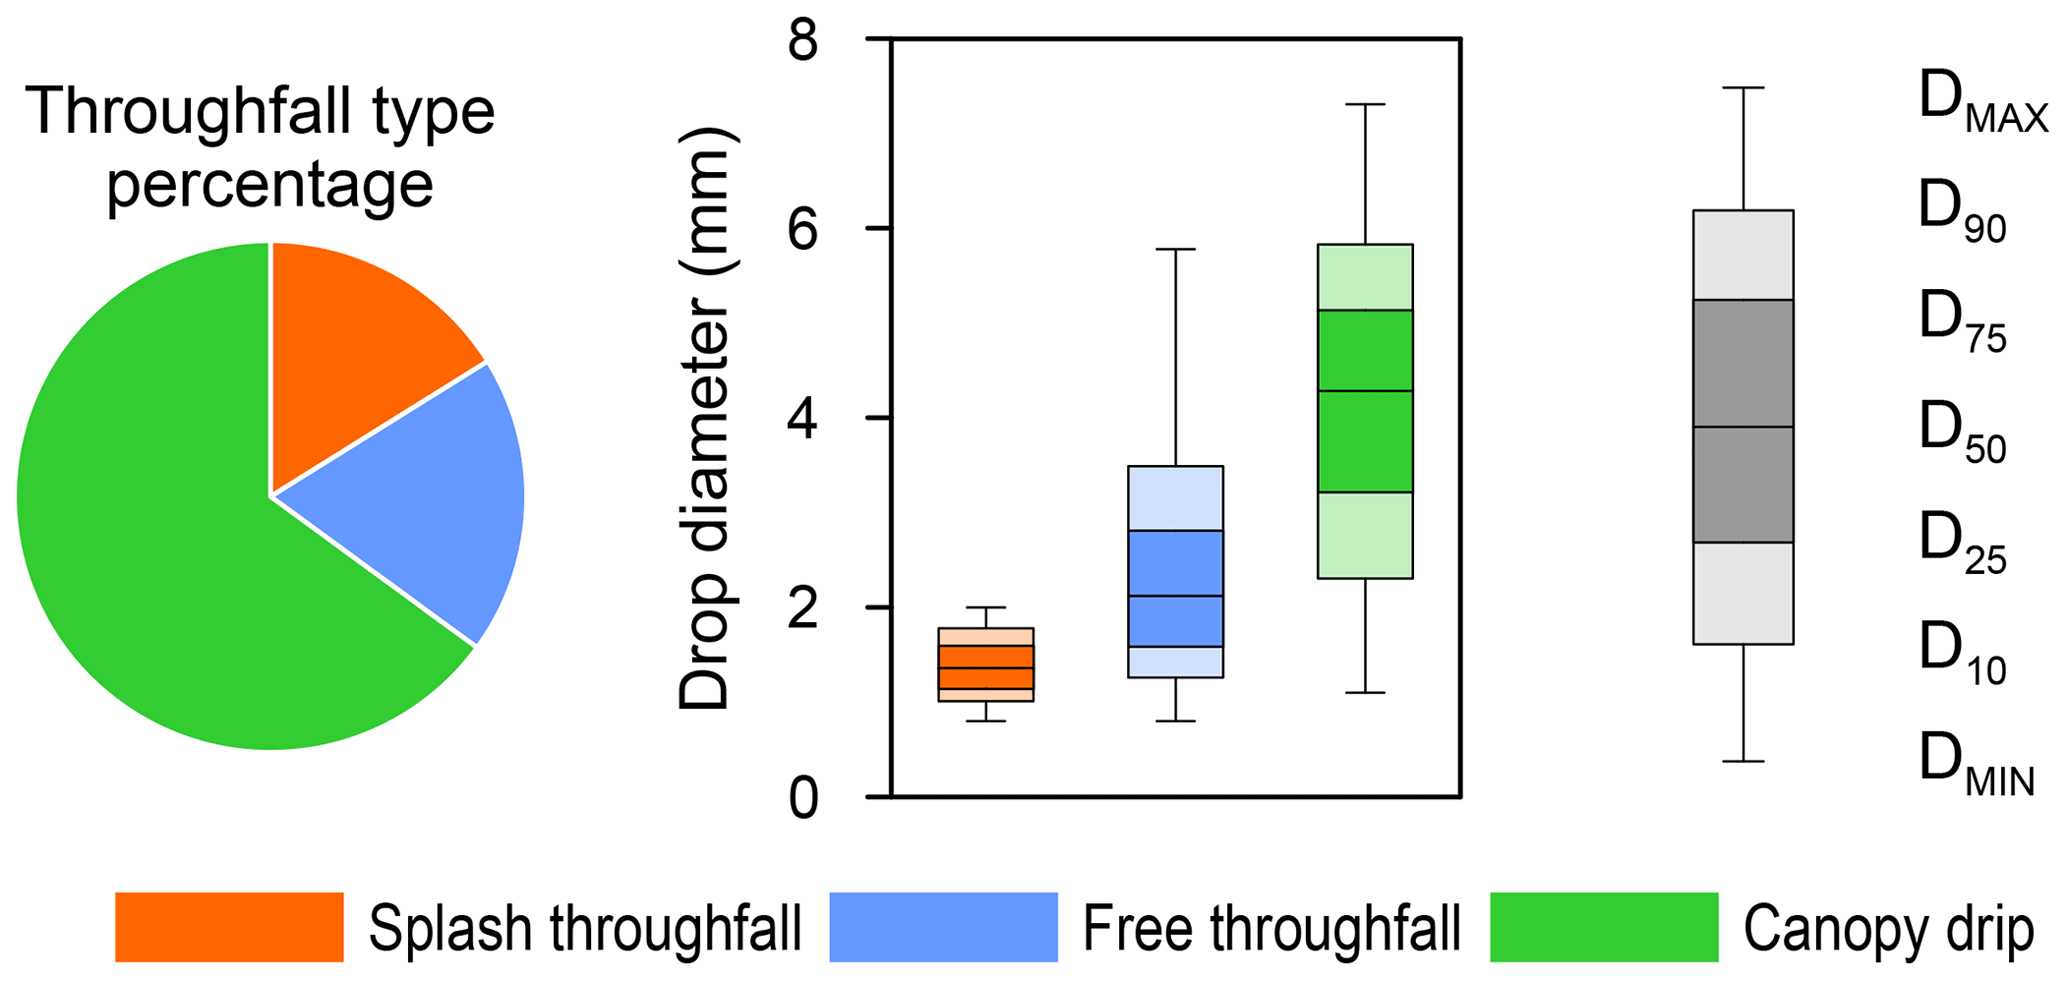
Figure 3Throughfall type percentages (pie chart) and drop diameters for the three throughfall types (boxplots) for the 21 events studied. The drop diameters are based on the mean of examined events.
When separating events by rainfall classes (depending on rainfall duration and intensity), the Kruskal–Wallis test indicated that the percentages of splash throughfall were not significantly different between classes (H=3.34, p=0.342). In contrast, the percentages between classes for free throughfall (H=12.22, p=0.007) and canopy drip (H=15.16, p=0.002) were significantly different. The Mann–Whitney–Wilcoxon post hoc pairwise comparisons indicated that long-duration–low-intensity rainfall events had a significantly lower percentage of free throughfall and a higher percentage of canopy drip than long-duration–high-intensity events (p=0.009 for both) and short-duration–high-intensity events (p=0.004 and 0.002 respectively). Furthermore, short-duration–low-intensity events had a significantly higher percentage of canopy drip than short-duration–high-intensity events (p=0.004). The percentages of throughfall types per rainfall classes are shown in Table S2.
The median volume drop diameters of the canopy drip, free throughfall and splash throughfall averaged for the 21 studied events were 4.28, 2.12 and 1.36 mm respectively (Fig. 3). When analysing drop diameters in cumulative drop volume percentiles, the Kruskal–Wallis test showed that drop diameters in the four rainfall classes were not significantly different for splash throughfall (H ranging from 1.12 to 2.44 and p ranging from 0.478 to 0.772) and canopy drip (H ranging from 1.12 to 7.46 and p ranging from 0.059 to 0.773), with the exception of the 75th percentile which was significantly different for canopy drip (H=9.36, p=0.025). The Mann–Whitney–Wilcoxon post hoc pairwise comparisons indicated that short-duration–low-intensity rainfall events had significantly smaller canopy drip than short-duration–high-intensity events (p=0.017). As expected, the Kruskal–Wallis test revealed that the free throughfall diameter was significantly different in the four rainfall classes (H ranging from 13.22 to 14.52 and p ranging from 0.002 to 0.004).
In summary, throughfall during low-intensity events gave higher canopy drip percentages (69 % and 72 % for S–L and L–L events respectively) and lower free throughfall (16 % and 13 % respectively) than events with high intensities (56 % and 62 % of canopy drip and 25 % and 21 % of free throughfall for S–H and L–H respectively). Short-duration–low-intensity events generated smaller canopy drip diameters (D50_DR=4.03 mm), and long-duration–low-intensity events generated smaller free throughfall drop diameters (D50_FR=1.52 mm). Based on volume, our results show that low rainfall intensities increased canopy drip in both short and long events. On the other hand, rainfall duration increased canopy drip for both low- and high-intensity events. Therefore, long rainfall events with low rainfall intensity yielded the highest percentage of drip, whereas short rainfall events with high rainfall intensities yielded the lowest (difference of 16 %).
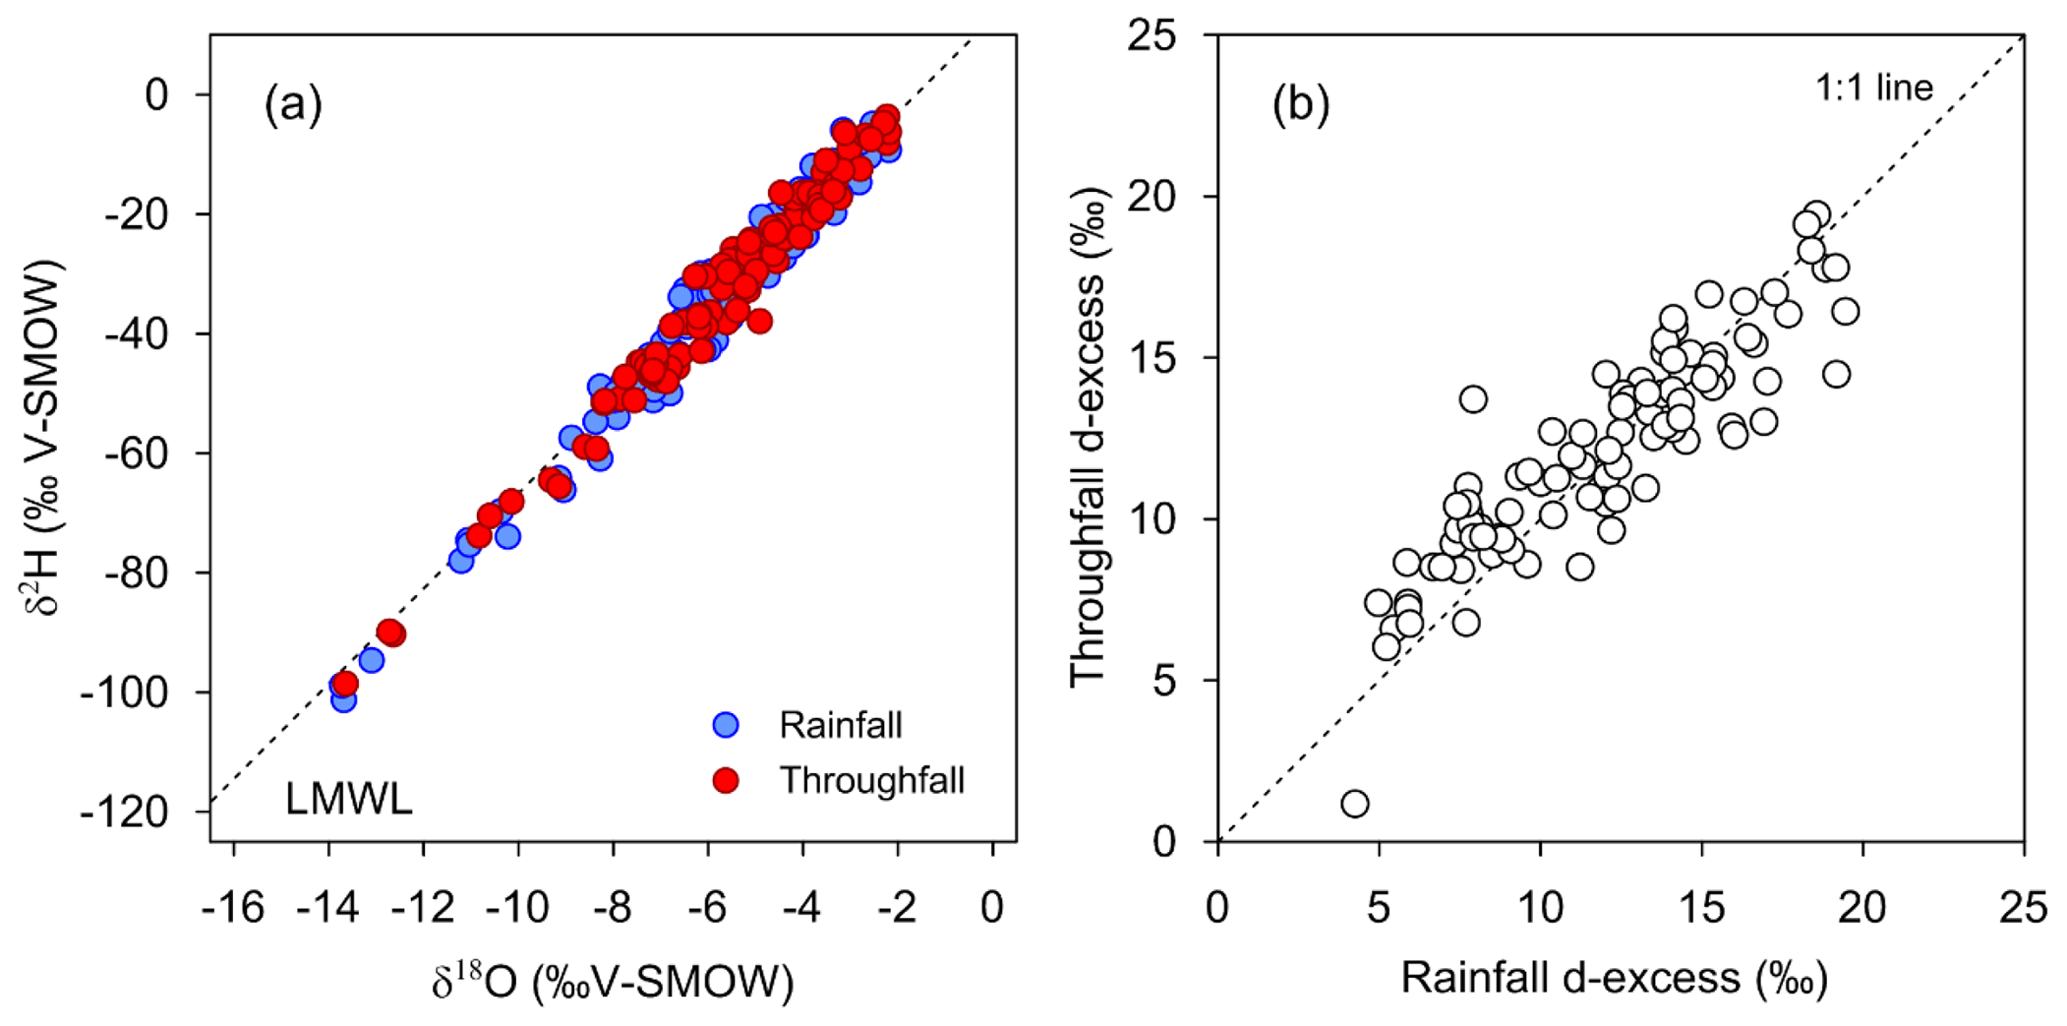
Figure 4(a) δ18O and δ2H values of open rainfall and throughfall. The dashed line shows the local meteoric water line (LMWL). (b) The relationship between the deuterium excess (d-excess) of open rainfall and throughfall.
3.3 Isotopic composition of open rainfall and throughfall
The δ18O isotopic composition of the 98 pair samples (21 studied events) ranged from −13.72 ‰ to −2.18 ‰ for open rainfall and from −13.65 ‰ to −2.20 ‰ for throughfall. For δ2H, values ranged from −101.25 ‰ to −4.84 ‰ for open rainfall and from −98.54 ‰ to −3.61 ‰ for throughfall. As shown in Fig. 4a, open rainfall and throughfall samples fell on the local meteoric water line (LMWL) defined for the Vallcebre catchments (; Casellas et al., 2019). Most of the throughfall samples (83 %) were more enriched (δ18O and δ2H) than the open rainfall samples, showing predominant enrichment rather than depletion, which corroborates the results of several previous studies (Saxena, 1986; Dewalle and Swistock, 1994; Kubota and Tsuboyama, 2003; Cayuela et al., 2018a). The isotopic shift between throughfall and open rainfall (Δδ18OTF–RF) ranged from −1.48 ‰ to 2.17 ‰. These differences are slightly higher than those reported by Cayuela et al. (2018a) for the same stand, probably due to the difference in the number of throughfall collectors in the two studies (10 vs. 1 in our study). Our results indicated preferential throughfall enrichment at the event scale, based on the volume-weighted mean of δ18O (Table S1); this is contrary to the results of Xu et al. (2014), who reported preferential throughfall depletion for a Pinus radiata forest in a Mediterranean climate. However, the values reported by these authors were bulked over multiple events. This highlights the paramount importance of using finer-scale sampling resolutions. Figure 4b indicates the presence of nonequilibrium fractionation processes, as not all of the enriched samples corresponded to a decrease in d-excess, and not all of the depleted samples corresponded to an increase. In fact, 50 % of the δ18O-enriched samples of throughfall had negative d-excess difference. Similarly, Herbstritt et al. (2019) observed that enrichment does not always lead to negative d-excess values and argued that such a phenomenon is usually attributed to mixing processes. For the case of pre-event water mixing (Allen et al., 2014), we ensured that all measured events started with an initially dry canopy, preventing the mixing of event water with water previously stored in the canopy. Consequently, the extent to which the differences in isotopic composition between rainfall and throughfall can be attributed to mixing processes remains unclear.
3.4 Drop sizes, throughfall types, and isotopic composition in rainfall events of different durations and intensities
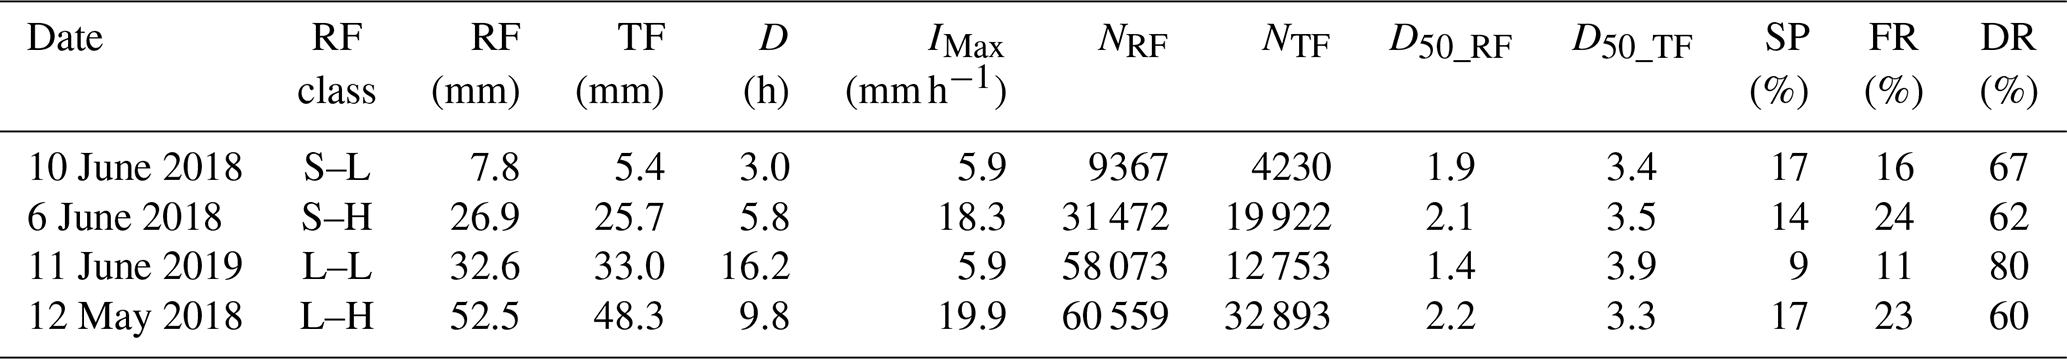
To improve understanding of the temporal dynamics of throughfall types, the drop diameter of canopy drip and the isotopic composition of rainfall and throughfall, four events representative of each rainfall class were investigated in detail (i.e. at 5 min intervals, Fig. 5). The main characteristics of these events, which occurred in spring 2018 and 2019, are shown in Table 2. Rainfall classes grouped by intensities showed similar intensity values (i.e. S–L with L–L and S–H with L–H), whereas when grouped by duration the time values were almost double (i.e. S–L with S–H and L–L with L–H). The throughfall amount was lower than the incident rainfall except for the event on 11 June 2019 (Fig. 5c), in which it was slightly higher.
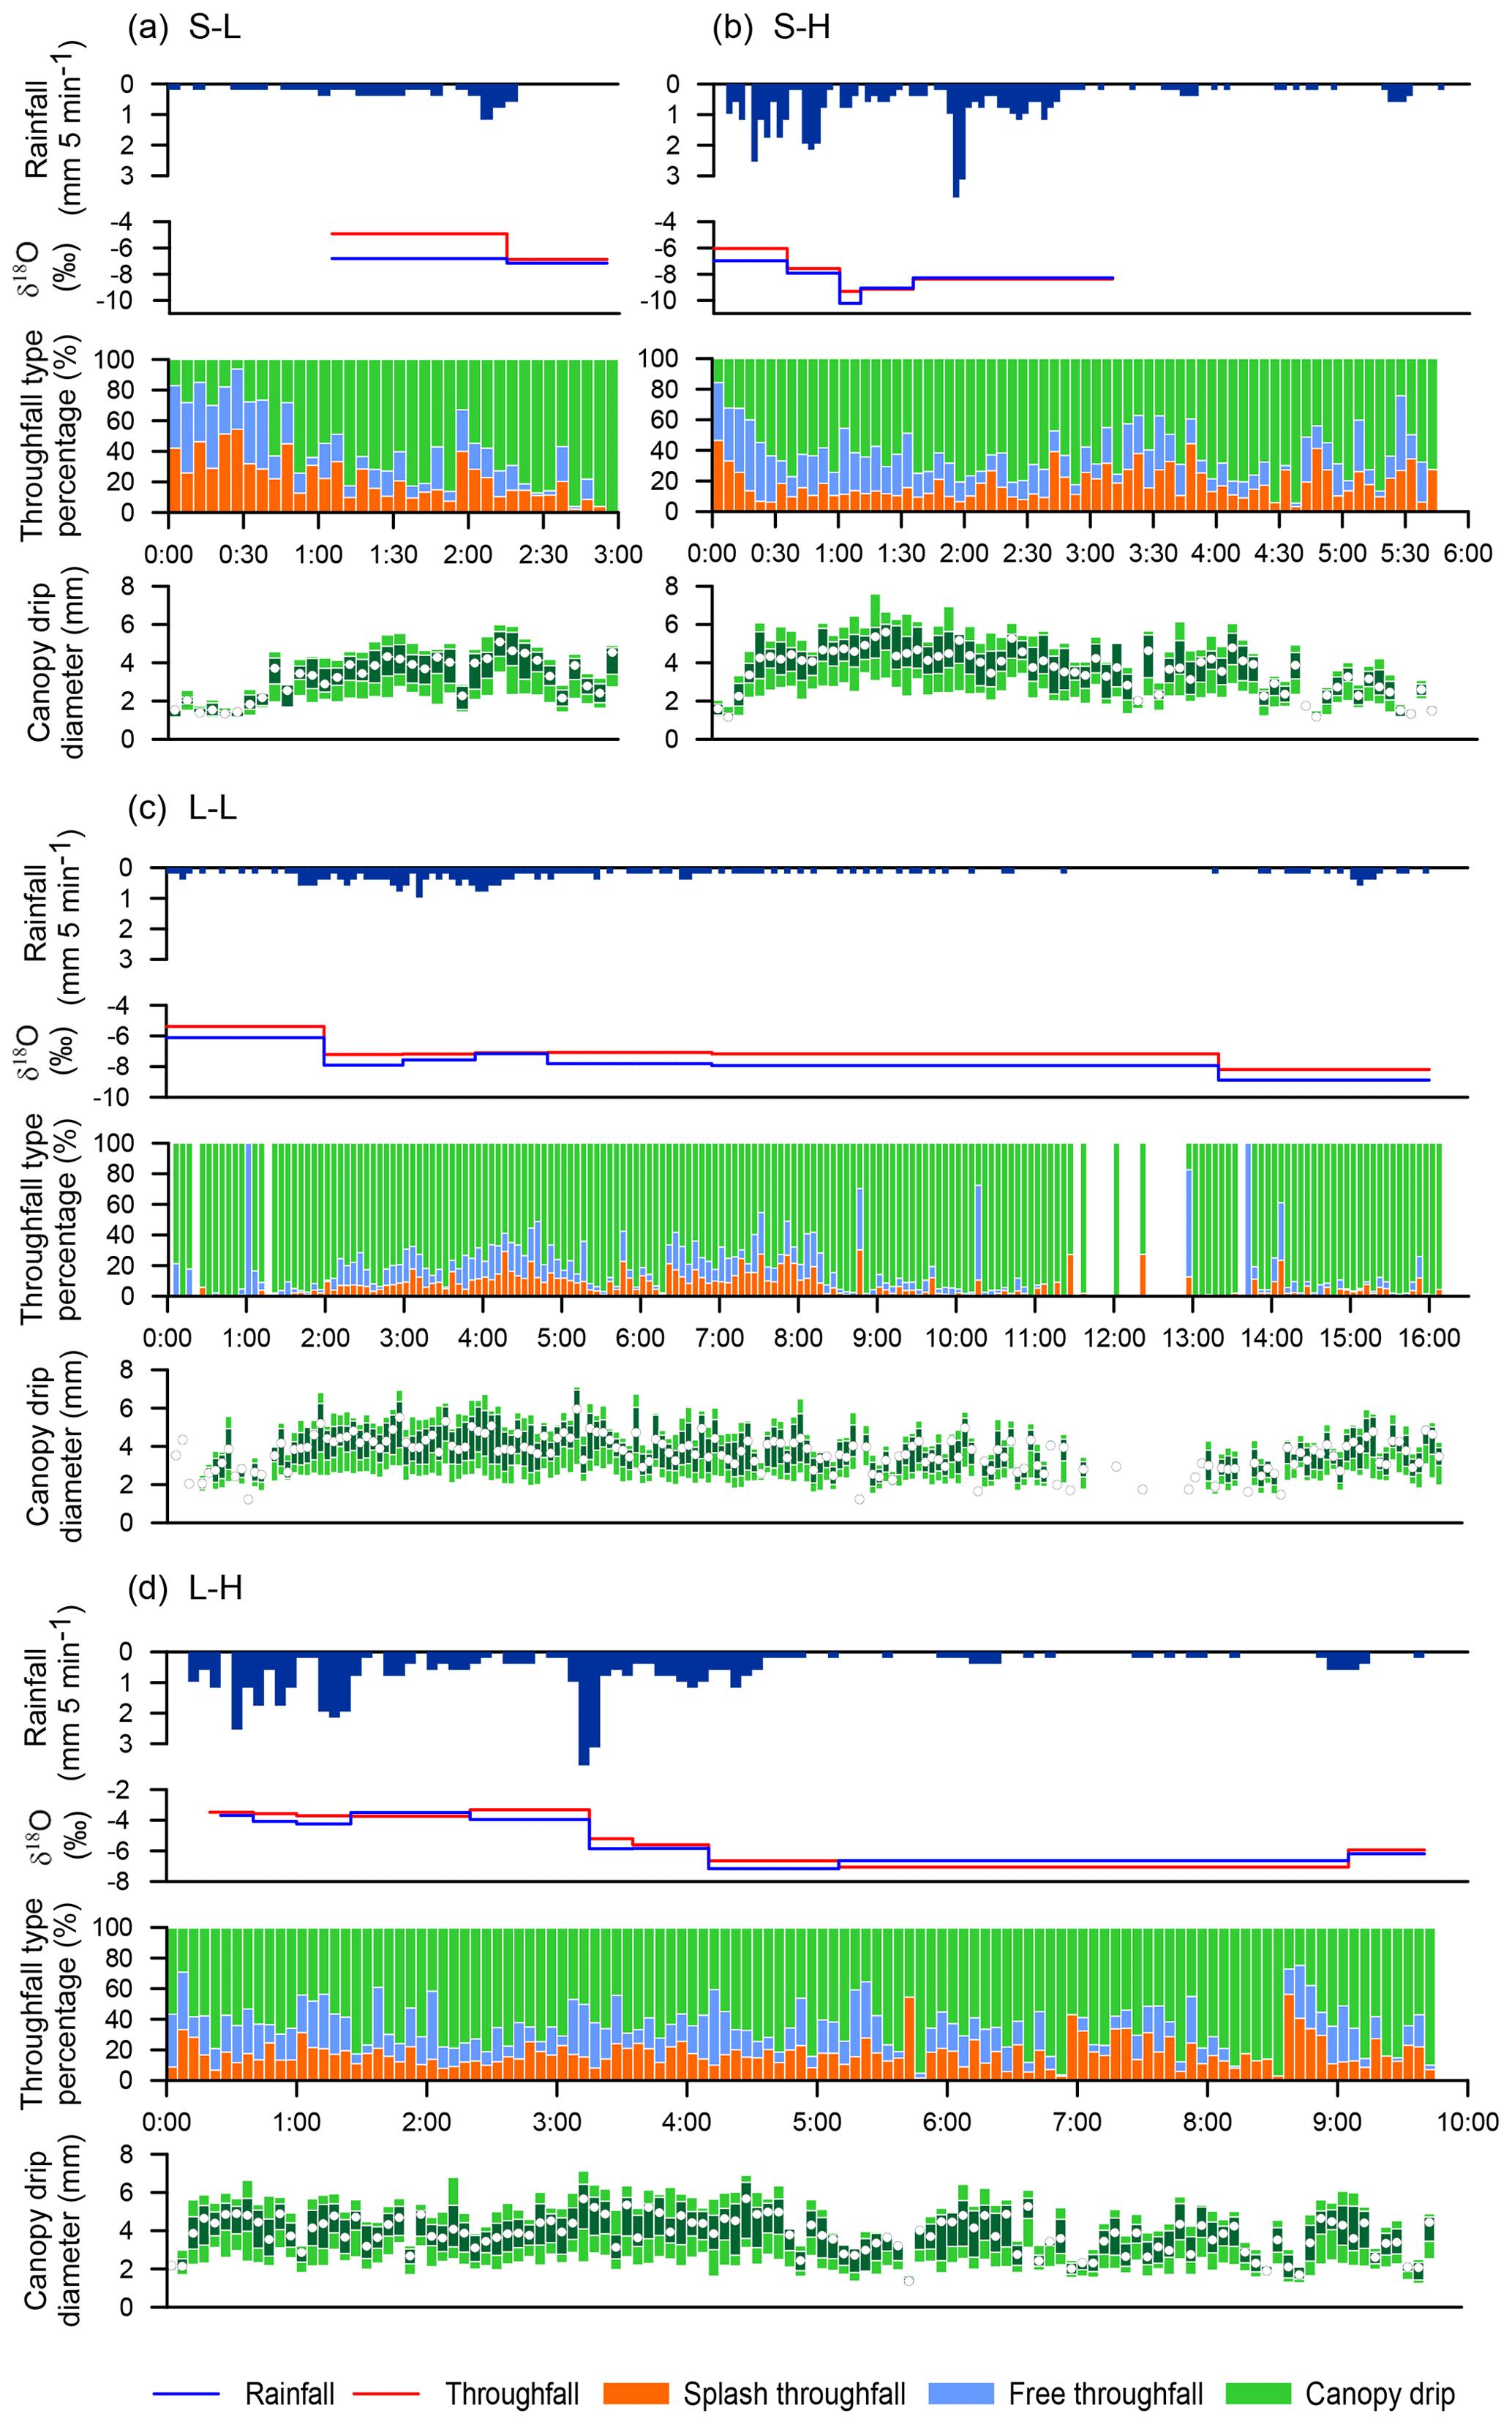
Figure 5Temporal evolution (time since the start of the event) of rainfall dynamics (5 min time step), δ18O in rainfall and in throughfall (collected by the sequential samplers every 5 mm of rainfall), the throughfall type percentages based on volume, and the drop diameter of canopy drip (5 min time step). (a) Short-duration–low-intensity event (S–L), (b) short-duration–high-intensity event (S–H), (c) long-duration–low-intensity event (L–L) and (d) long-duration–high-intensity event (L–H). The drop diameter is shown in the boxplots with the respective cumulative drop volume percentiles (light green denotes 10 % and 90 %, dark green denotes 25 % and 75 %, and the white dot denotes 50 %).
Table 2Measured variables for the four selected events: S–L denotes short duration–low intensity, S–H denotes short duration–high intensity, L–L denotes long duration–low intensity and L–H denotes long duration–high intensity. RF is rainfall, TF is throughfall, D is rainfall duration, IMax is the maximum 30 min rainfall intensity, N is the number of drops, D50 is the median volume drop diameter, SP is splash throughfall, FR is free throughfall and DR is canopy drip.
For the short-duration–low-intensity event (S–L, Fig. 5a), throughfall was mainly composed of free throughfall and splash throughfall during the first 30 min (<0.6 mm of rain), and the canopy drip diameter (D50_DR) was almost constant with a mean of 1.54 mm. After 30 min, the percentage of canopy drip gradually increased for 2 h, as did the drop diameter that reached an average D50_DR of 3.65 mm, with a maximum canopy drip diameter (DMAX_DR) of 4.70 mm. Canopy drip is clearly the main throughfall type during the last 30 min of the event, but the average D50_DR decreased to 3.17 mm. Levia et al. (2019) observed a similar trend for the proportionate contribution of throughfall types for coniferous trees in a simulated steady short-duration event. As the water corresponding to the first ∼1.9 mm of rainfall (1 h from the beginning of the event) was mixed with pre-event water in the sampling bottle, it was discarded from the analysis. The throughfall isotopic composition of the first sample (t= 01:00 to 02:15 h) was enriched (1.89 ‰) compared with open rainfall when splash throughfall reached 16.6 %, which may be related to increased evaporation. For the second sample (t= 02:15 h to the end of the event), with a high contribution of canopy drip (75.8 %), the isotopic shift was almost zero, indicating a strong reduction in evaporation fractionation.
During the first 30 min (<3.2 mm of rain) of the short-duration–high-intensity event (S–H, Fig. 5b) there was a gradual decrease in splash throughfall, balanced by an increase in canopy drip, whereas free throughfall remained relatively stable. During this time interval the D50_DR increased from 1.60 to 4.33 mm. After 30 min, the contribution of various throughfall types was highly variable between successive time steps. Overall, canopy drip remained the main throughfall type during the event, but free throughfall tended to increase with rainfall intensity (from t= 01:00 to 01:30 h), whereas splash throughfall increased from 13 % (t= 00:30 to 02:40 h) to 21 % (t= 02:40 h to the end of the event) as rainfall intensity decreased. During the central part of the event (t= 00:30 to 04:30 h), the mean D50_DR and DMAX were 4.04 and 5.48 mm respectively; when rainfall almost stopped (t= 04:30 h), D50_DR decreased to 2.33 mm. Similar to the previous event, the isotopic composition of the first throughfall sample was more enriched (0.93 ‰) than open rainfall, with a splash contribution of around 11.8 %. The throughfall isotopic composition of the second sample was slightly enriched (0.35 ‰), which was probably as a consequence of the canopy drip increase (from 56 % to 65 %), even if the splash throughfall type also increased to 14.5 %. Enrichment of the third sample was similar to that of the first sample (0.92 ‰), with a splash contribution of 12.6 % and a canopy drip contribution of 55 %. The isotopic shift for the last two samples was almost zero. For these two samples, higher rainfall intensities may have reduced the lag time between throughfall and rainfall. Therefore, the evaporation impact may have led to periods of null or minimum isotopic shift, as suggested by Ikawa et al. (2011).
For the long-duration–low-intensity event (L–L, Fig. 5c), canopy drip was clearly the main throughfall type during the entire event with an average contribution of 80 % (Table 2). For this very light rain during a long time period, the canopy probably intercepted almost all of the raindrops, triggering canopy drip after the water storage capacity of the vegetative surfaces was exceeded. Data showed that the drop diameter broadly stabilised after 80 min with an average D50_DR of 3.87 mm and DMAX_DR of 5.10 mm until rainfall stopped for the first time (t= 11:30 h). This intra-storm gap without rain was probably too short (<90 min) to document any drying effect of the canopy on DSD, but a reduction in the canopy drop diameter at the beginning of the second burst of rainfall (t= 13:00 h) was observed (D50_DR of 2.58 mm). The throughfall isotopic composition was enriched for all of the samples from the event. As the splash throughfall type was small, splash droplet evaporation did not exert any significant influence. As mentioned, most of the rainwater was intercepted by the canopy and was retained on the vegetative surfaces for large periods of time (between ∼1 and ∼6.5 h). Partial evaporation probably took place during these periods, which explains the isotopic enrichment of the throughfall samples (Xu et al., 2014).
Finally, intermittent rain showers in the long-duration–high-intensity event (L–H, Fig. 5d) produced a heterogeneous contribution of throughfall types during the entire rainfall event. Canopy drip was evidently the main type, the free throughfall percentage increased with rainfall intensity and splash increased during low-intensity intervals. During a 20 min long period (t= 08:10 to 08:35 h) without rainfall, throughfall was formed by canopy drip and splash throughfall alone. This suggests that, in the absence of rainfall, dripping from the upper canopy may have impacted the lower canopy layers, which subsequently produced splash droplets, as also observed by Nanko et al. (2011). During this event, canopy drip increased after 10 min of rainfall, with mean D50_DR rising from 2.16 to 4.28 mm and DMAX_DR rising from 2.79 to 5.83 mm, until the end of the period with more intense rainfall ( h). Subsequently, the average D50_DR decreased to 3.39 mm and DMAX_DR decreased to 4.38 mm. An unclear pattern in the isotopic shift between rainfall and throughfall was observed throughout the event, even if the throughfall isotopic composition was only slightly enriched for most of the samples. This heterogeneous distribution of throughfall types and the absence of a clear pattern of isotopic shift suggest that, during this type of large event, a combination of evaporation, isotopic exchange and canopy selection processes probably occurred, which was similar to the findings of Cayuela et al. (2018a).
In general terms, the dynamics of throughfall partitioning were different for each rainfall type, which caused changes in the proportions of throughfall type (data at 5 min intervals) as well as in the isotopic composition (samples at 5 mm intervals) at the finer scale within individual rain events. It seems that the increase or decrease in the canopy drip diameter was related to rainfall event evolution and was lower at the beginning and the end of all events. Similar to Lüpke et al. (2019), splash throughfall for a coniferous species was important at the beginning of the analysed events.
3.5 Relationship between isotopic shift and rainfall–throughfall characteristics
For the complete sample dataset (98 pairs of rainfall–throughfall samples), Spearman's rank-order correlation revealed no direct relationship between the δ18O isotopic shift (Δδ18OTF–RF) and meteorological variables, such as the vapour pressure deficit (VPD; , p=0.464) or wind velocity (, p=0.795) (Fig. S2a, b). This confirms the results of Herbstritt et al. (2019), who found that meteorological variables did not provide consistent evidence to explain the observed isotopic shift. The most likely scenario is that a combination of rainfall characteristics, meteorological variables and isotopic fractionation factors exerted influence on the isotopic fractionation observed in the canopy. Moreover, Spearman's test showed no relationship between Δδ18OTF–RF and the difference in the number of drops between rainfall and throughfall (, p=0.642), in drop velocities (Rs=0.114, p=0.262), or in amounts per sample (, p=0.057) (Fig. S2c, d, e). However, some trends were observed. The isotopic shift (δ18O) between throughfall and rainfall increased when the D50_TF got closer to or lower than the D50_RF (i.e. with smaller throughfall drops; Fig. 6a). The isotopic shift also slightly decreased and become less variable with increasing cumulative rainfall (average values shifted from 0.44 ‰ to 0.14 ‰ for rainfall between 5 and more than 40 mm; Fig. 6b). This pattern is consistent with results found by Allen et al. (2017) in their meta-analysis, which showed larger isotopic shift differences for events with lower rainfall amounts. On the contrary, no relationship was found between the isotopic shift and the sampling time, the time each 5 mm sample took to be filled (Fig. 6c), as shown by the relatively stable isotopic shift (on average 0.40 ‰) observed for sampling times ranging from fewer than 30 min to more than 8 h. Finally, no clear relationship was found between the δ18O isotopic shift and the kinetic energy of the rainfall drops (Fig. 6d). Similar results were obtained for the δ2H isotopic shift (data not shown). The variability observed in the isotopic shift was found to decrease with increasing cumulative rainfall and sampling times (Fig. S3a, b).
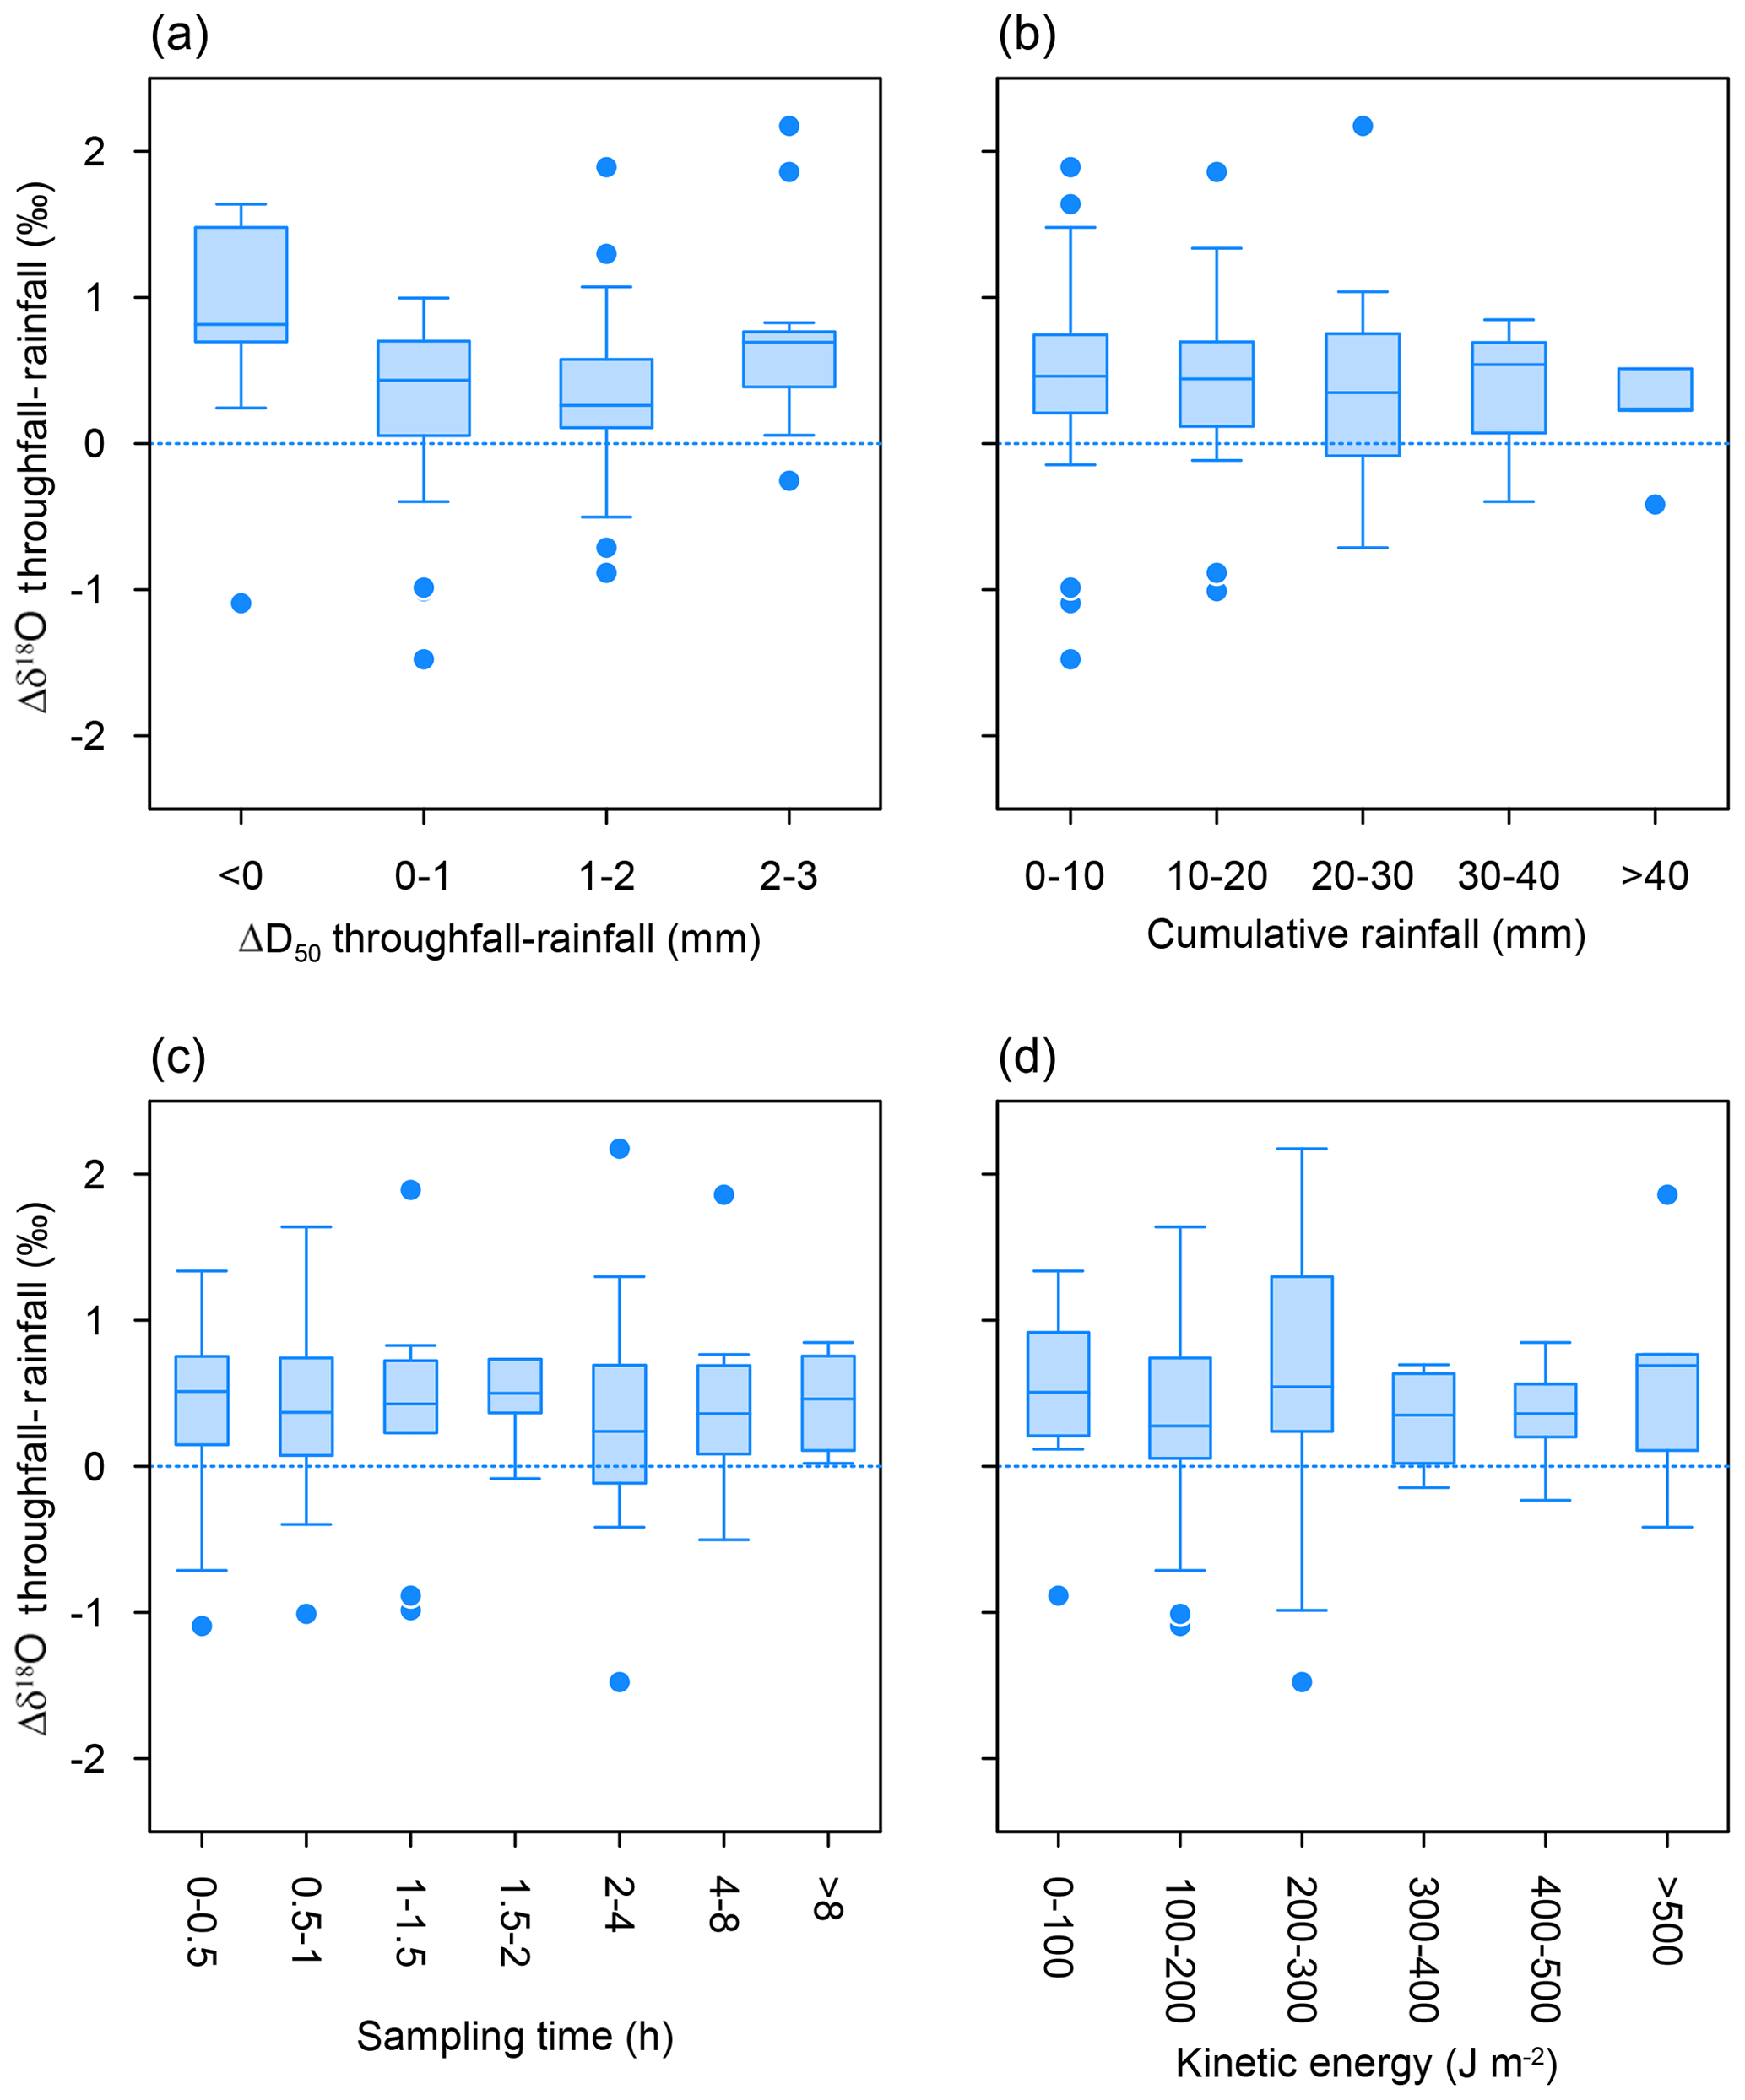
Figure 6Boxplot of the isotopic shift (δ18OTF–RF) versus classes of (a) differences in median volume drop diameter (D50_TF–RF), (b) cumulative rainfall throughout the rainfall event, (c) sampling time (i.e. time each 5 mm sample took to be filled) and (d) rainfall kinetic energy per sample. The light blue dots represent outliers.
The intra-event dynamics of the isotopic shift between rainfall and throughfall were analysed for events with a rainfall depth larger than 10 mm (i.e. for events giving more than two water samples). A total of 88 water samples corresponding to 16 events, with a rainfall depth ranging from 12.5 to 52.5 mm, were selected. Following Cayuela et al. (2018a), the selected events were split according to initial, middle and final stages. The initial stage corresponded to the first 5 mm of the event, the middle stage consisted of all samples between the first and the last sample, and the final stage coincided with the sample collected during the last 5 mm of the event.
The higher shift (Δδ18OTF–RF) between throughfall and rainfall coincided with a higher VPD at the initial phase, and the lower Δδ18OTF–RF coincided with a lower VPD during the final phase of the events (Fig. 7). The first samples presented a median difference of 0.49 ‰ and, except for one outlier, all samples had positive Δδ18OTF–RF, indicating throughfall enrichment. This isotopic enrichment at the beginning of the events was congruent with the higher VPD observed, with a mean value of 0.12 kPa, indicating higher atmospheric demand, which could increase evaporation in the canopy. Ikawa et al. (2011) and Cayuela et al. (2018a) observed the same fractionation pattern and suggested a greater impact of evaporation at the beginning of the event. Congruent with the isotopic shift and VPD dynamics during the events, the higher contribution of splash throughfall (17 %) also corresponded to the initial phase of events, and the lower splash contribution (14 %) corresponded to the final phase of events (Fig. 7). Although the difference between the initial and final phases seems small (3 %), calculated percentages are based on volume: to achieve this difference, a huge amount of splash droplets is required. Because splash droplets are prone to a high degree of evaporation during their fall towards the ground (Dunin et al., 1988; Murakami, 2006; Xie et al., 2007), it is inferred that the net contribution of splash throughfall based on volume is linked to the splash evaporation mechanism that exerts influence at the initial stage of events, leading to greater isotopic enrichment of throughfall than of open rainfall.
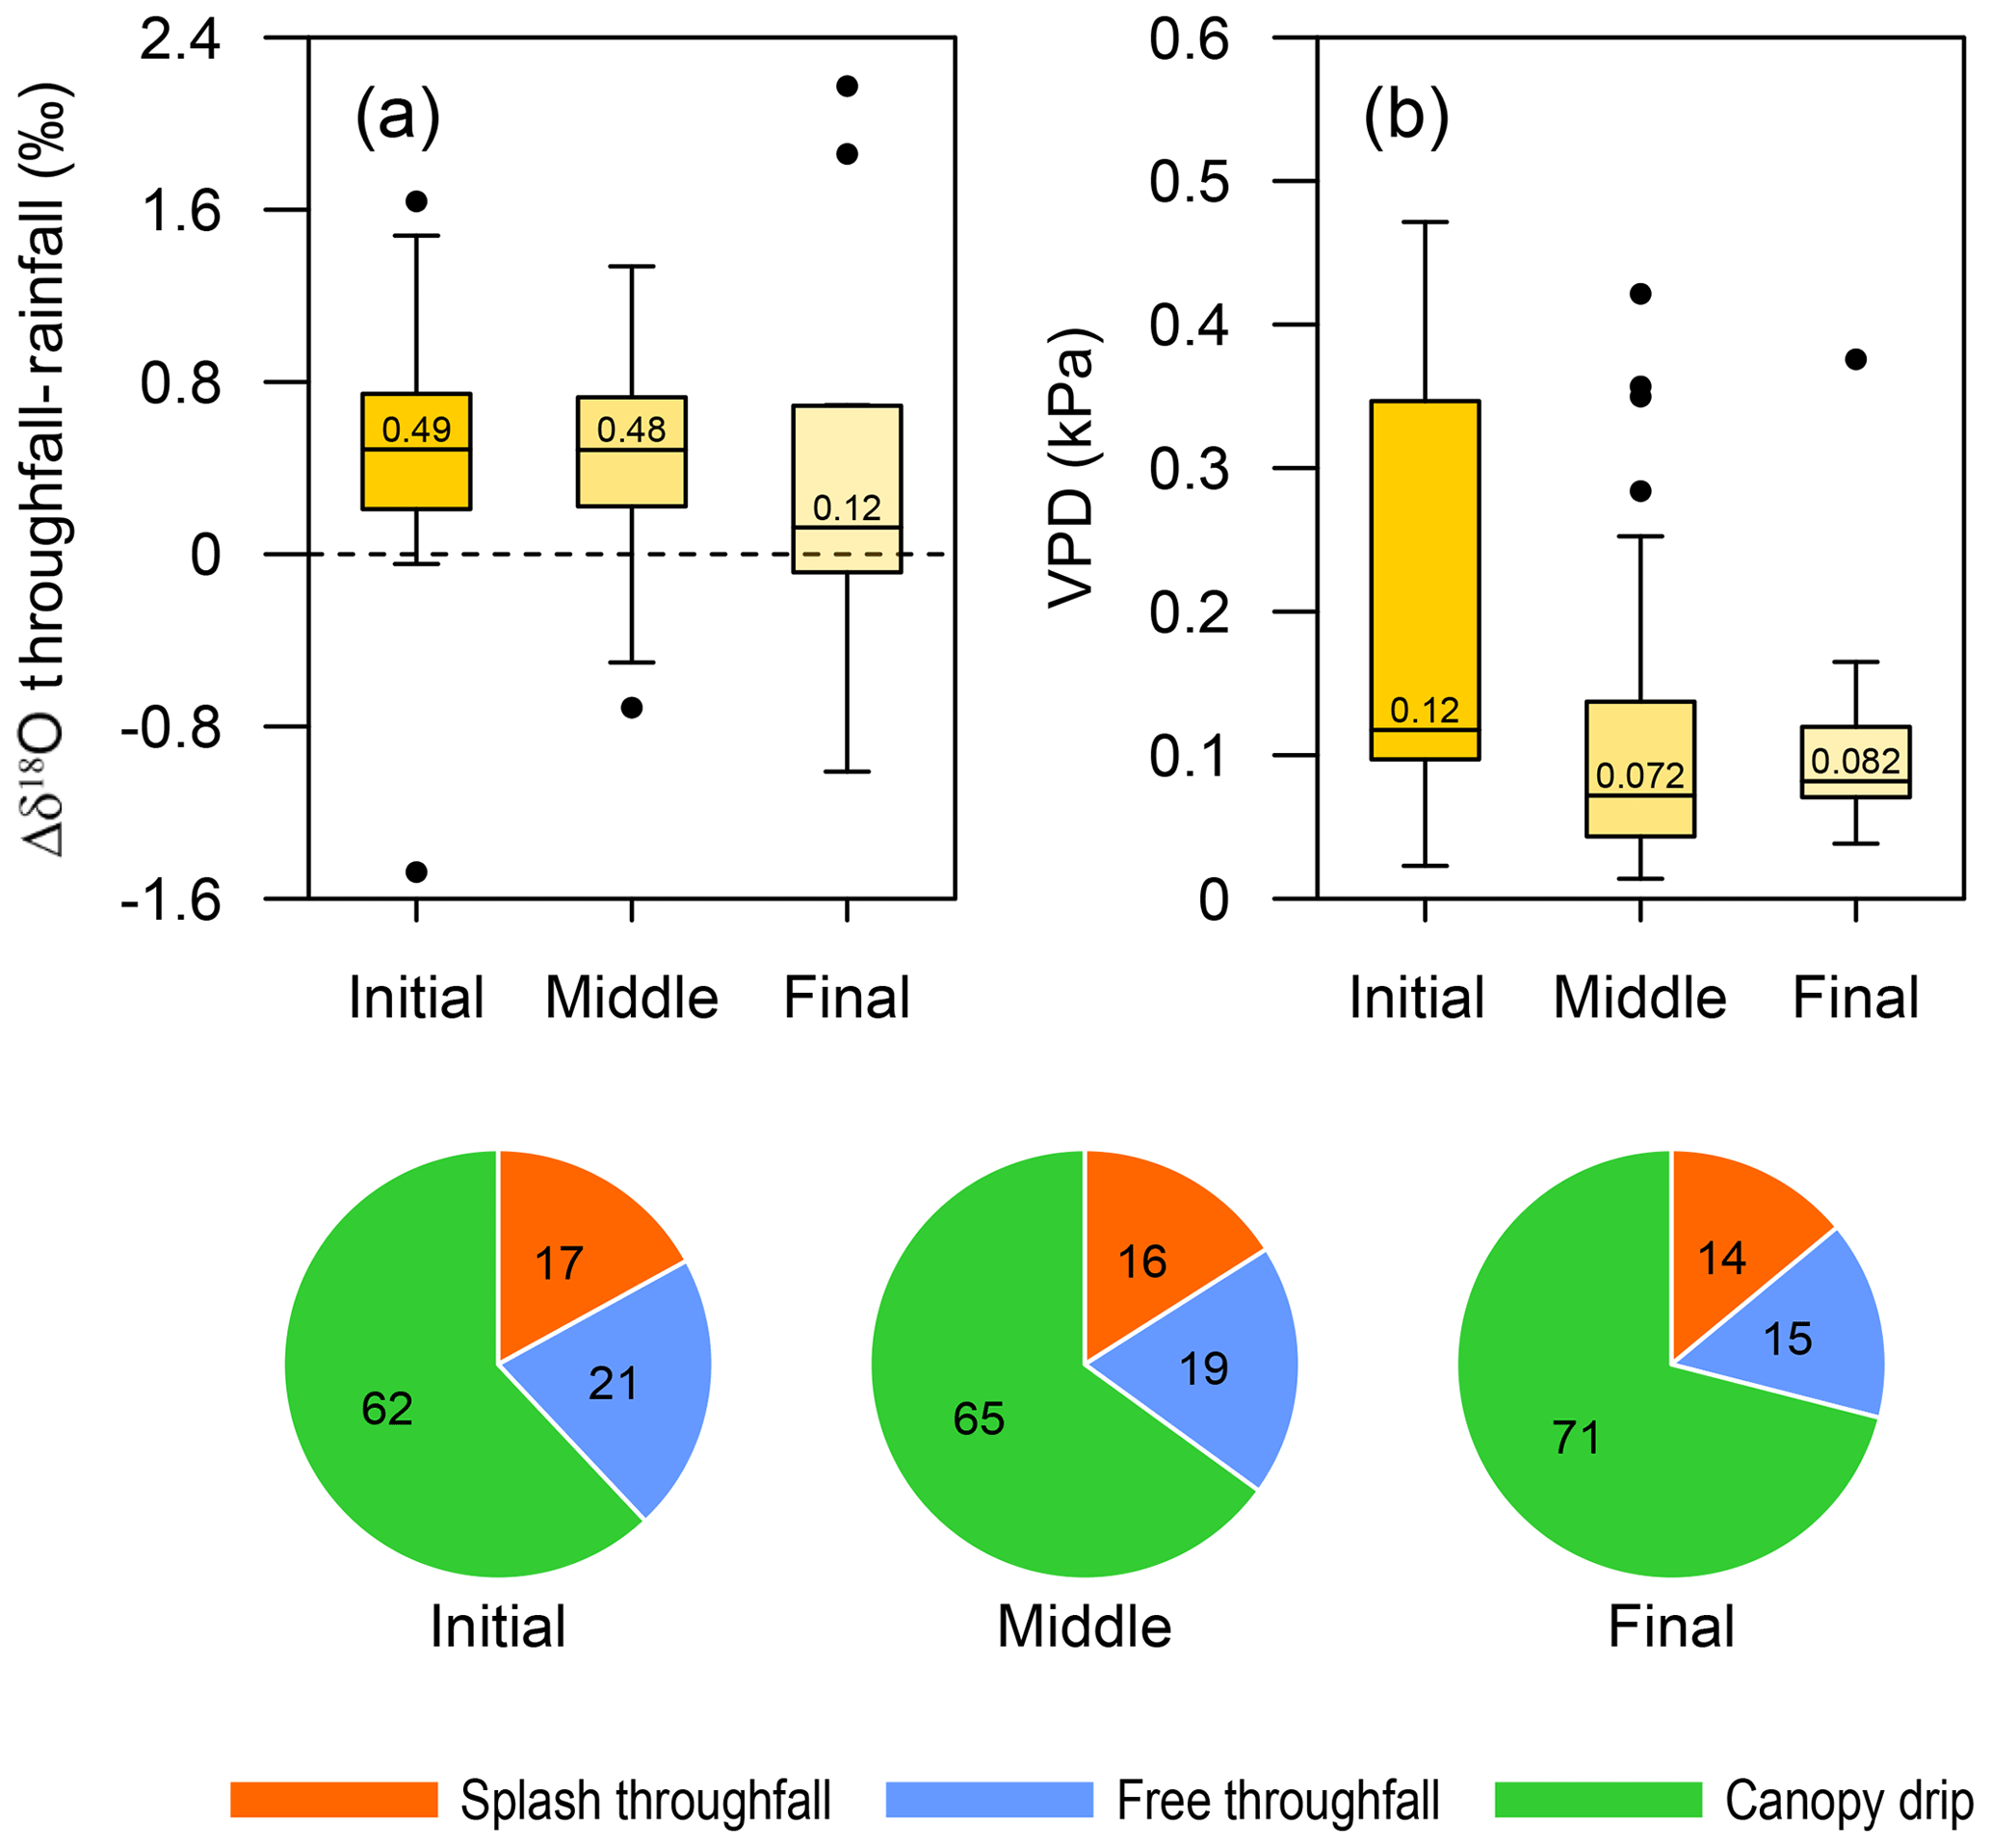
Figure 7Boxplot of the intra-event dynamic observed in the initial, middle and final stages of 16 rainfall events (>10 mm) for (a) isotopic shift differences (δ18OTF–RF) and (b) VPD. Black dots represent outliers. Pie charts shows the proportion of throughfall types (%) for the different stages of rainfall events.
On the other hand, the lower contribution of canopy drip (62 %) corresponded to the initial phase of events, and higher drip contribution (71 %) corresponded to the final phase of events. As larger drop sizes reduce droplet evaporation rates, as demonstrated several decades ago (e.g. Best, 1952; Brain and Butler, 1985), an increase in the canopy drip contribution should reduce the isotopic shift due to fractionation by evaporation. However, canopy drip may also be the result of water accumulation originating from different flow paths (e.g. branch flow diverted from stemflow or drip recapture by lower canopy layers), representing a mixing process over canopy surfaces (e.g. the vertical redistribution of water can trigger the mixing of water from various small reservoirs formed by bark microrelief or cones in pine species), which may cause ambiguity in the isotopic shift between throughfall and open rainfall. In addition, as mentioned by Herbstritt et al. (2019), the mechanistic understanding of the variability of mixing between leaves (i.e. the water drip from leaf to leaf being able or not to cause subsequent splashing) could also be a key element in water mixing and evaporation in the rainfall interception processes.
This study sought to measure the isotopic compositions and drop characteristics of both rainfall and throughfall at the intra-event scale and to examine if there is any correspondence between the rainfall–throughfall isotopic shift and their drop size distribution differences. Results indicated that throughfall showed a lower number of drops, slower drop velocity and larger drop diameter than open rainfall did. Canopy drip accounts for most throughfall based on volume and corresponds to the largest drop diameter (average D50_DR of 4.28 mm). Furthermore, our results showed that rainfall characteristics are an important abiotic factor that affects the throughfall DSD and, consequently, the proportion of throughfall types. Throughfall samples were almost always more enriched (δ2H and δ18O) than rainfall. No correlation was found for the isotopic shift (Δδ18OTF–RF and Δδ2HTF–RF) between throughfall and open rainfall in relation to meteorological variables, number of drops, drop velocities, throughfall and rainfall amount, or raindrop kinetic energy. However, the experiment's findings suggest that the isotopic shift decreased during the progression of discrete rainfall events and increased with a larger proportion of splash droplets. Our key finding indicates that higher contribution of splash throughfall and higher VPD at the initial stage of the rainfall events correspond to a greater isotopic shift (Δδ18OTF–RF). This provides evidence for the net contribution of splash droplets to isotopic enrichment by means of the greater evaporation of throughfall than of open rainfall.
Future research should aim to assess the intra-canopy mixing of waters during intra-event wetting–drying cycles of a rainfall event in order to distinguish the isotopic fractionation factors. Additionally, using more throughfall tipping buckets with disdrometers in different locations below the canopy would help to further evaluate the spatial variability of DSD and its relationship with isotopic composition. Thus, future research should focus on the use of the fine spatiotemporal resolution of the isotopic composition of open rainfall and throughfall, in combination with meteorological variables and the various proportions of the different types of throughfall, to enable better understanding of the physical processes controlling differences in the isotopic shift in different tree species. Such an improvement in our understanding of the fine-scale mechanism of the isotopic composition of throughfall in relation to throughfall drop size would strengthen assumptions regarding forest–water interactions.
Unlike the logging system using a laptop with an A/D convertor (Nanko et al., 2006; Levia et al., 2019), the Arduino system could not record all of the temporal variations in output voltage due to the time required to record the data onto the SD card and an insufficient memory (compared with the random access memory, RAM, used in common devices). When a drop passed through the laser beam, output voltage was collected as shown in Fig. A1. When more than three continuous data values of output voltage were less than the threshold voltage (which was equal to the base voltage × 0.98, here), the Arduino system recorded five values, i.e. the base voltage, the minimum output voltage, the first output voltage, the last output voltage, and the number of data between the first and last output voltage, using a signal of drop data and a time stamp.
The Arduino threshold voltage setting means that drops with a diameter < 0.8 mm could not be measured by this system. The Arduino system also has the disadvantage of failing to account for all drops when rainfall or throughfall continuously passes through the laser beam, due to its limited sampling speed. Finally, when several drops simultaneously pass in parallel in the same direction with respect to the laser beam, only the nearest drop to the transmitter is recorded. Consequently, due to the limitations of the Arduino datalogging system, on average 39 % less incident rainfall and 45 % less throughfall were observed between the tipping bucket and the disdrometer. Fortunately, these differences followed a consistent linear fit. Two assumptions were made for throughfall drop calculations to remedy the deficiencies of the Arduino system: (1) the percentage of throughfall drops < 0.8 mm is a marginal volume, and (2) the throughfall drops not measured by the disdrometers due to the other constraints of the Arduino system were distributed equally among the throughfall types.
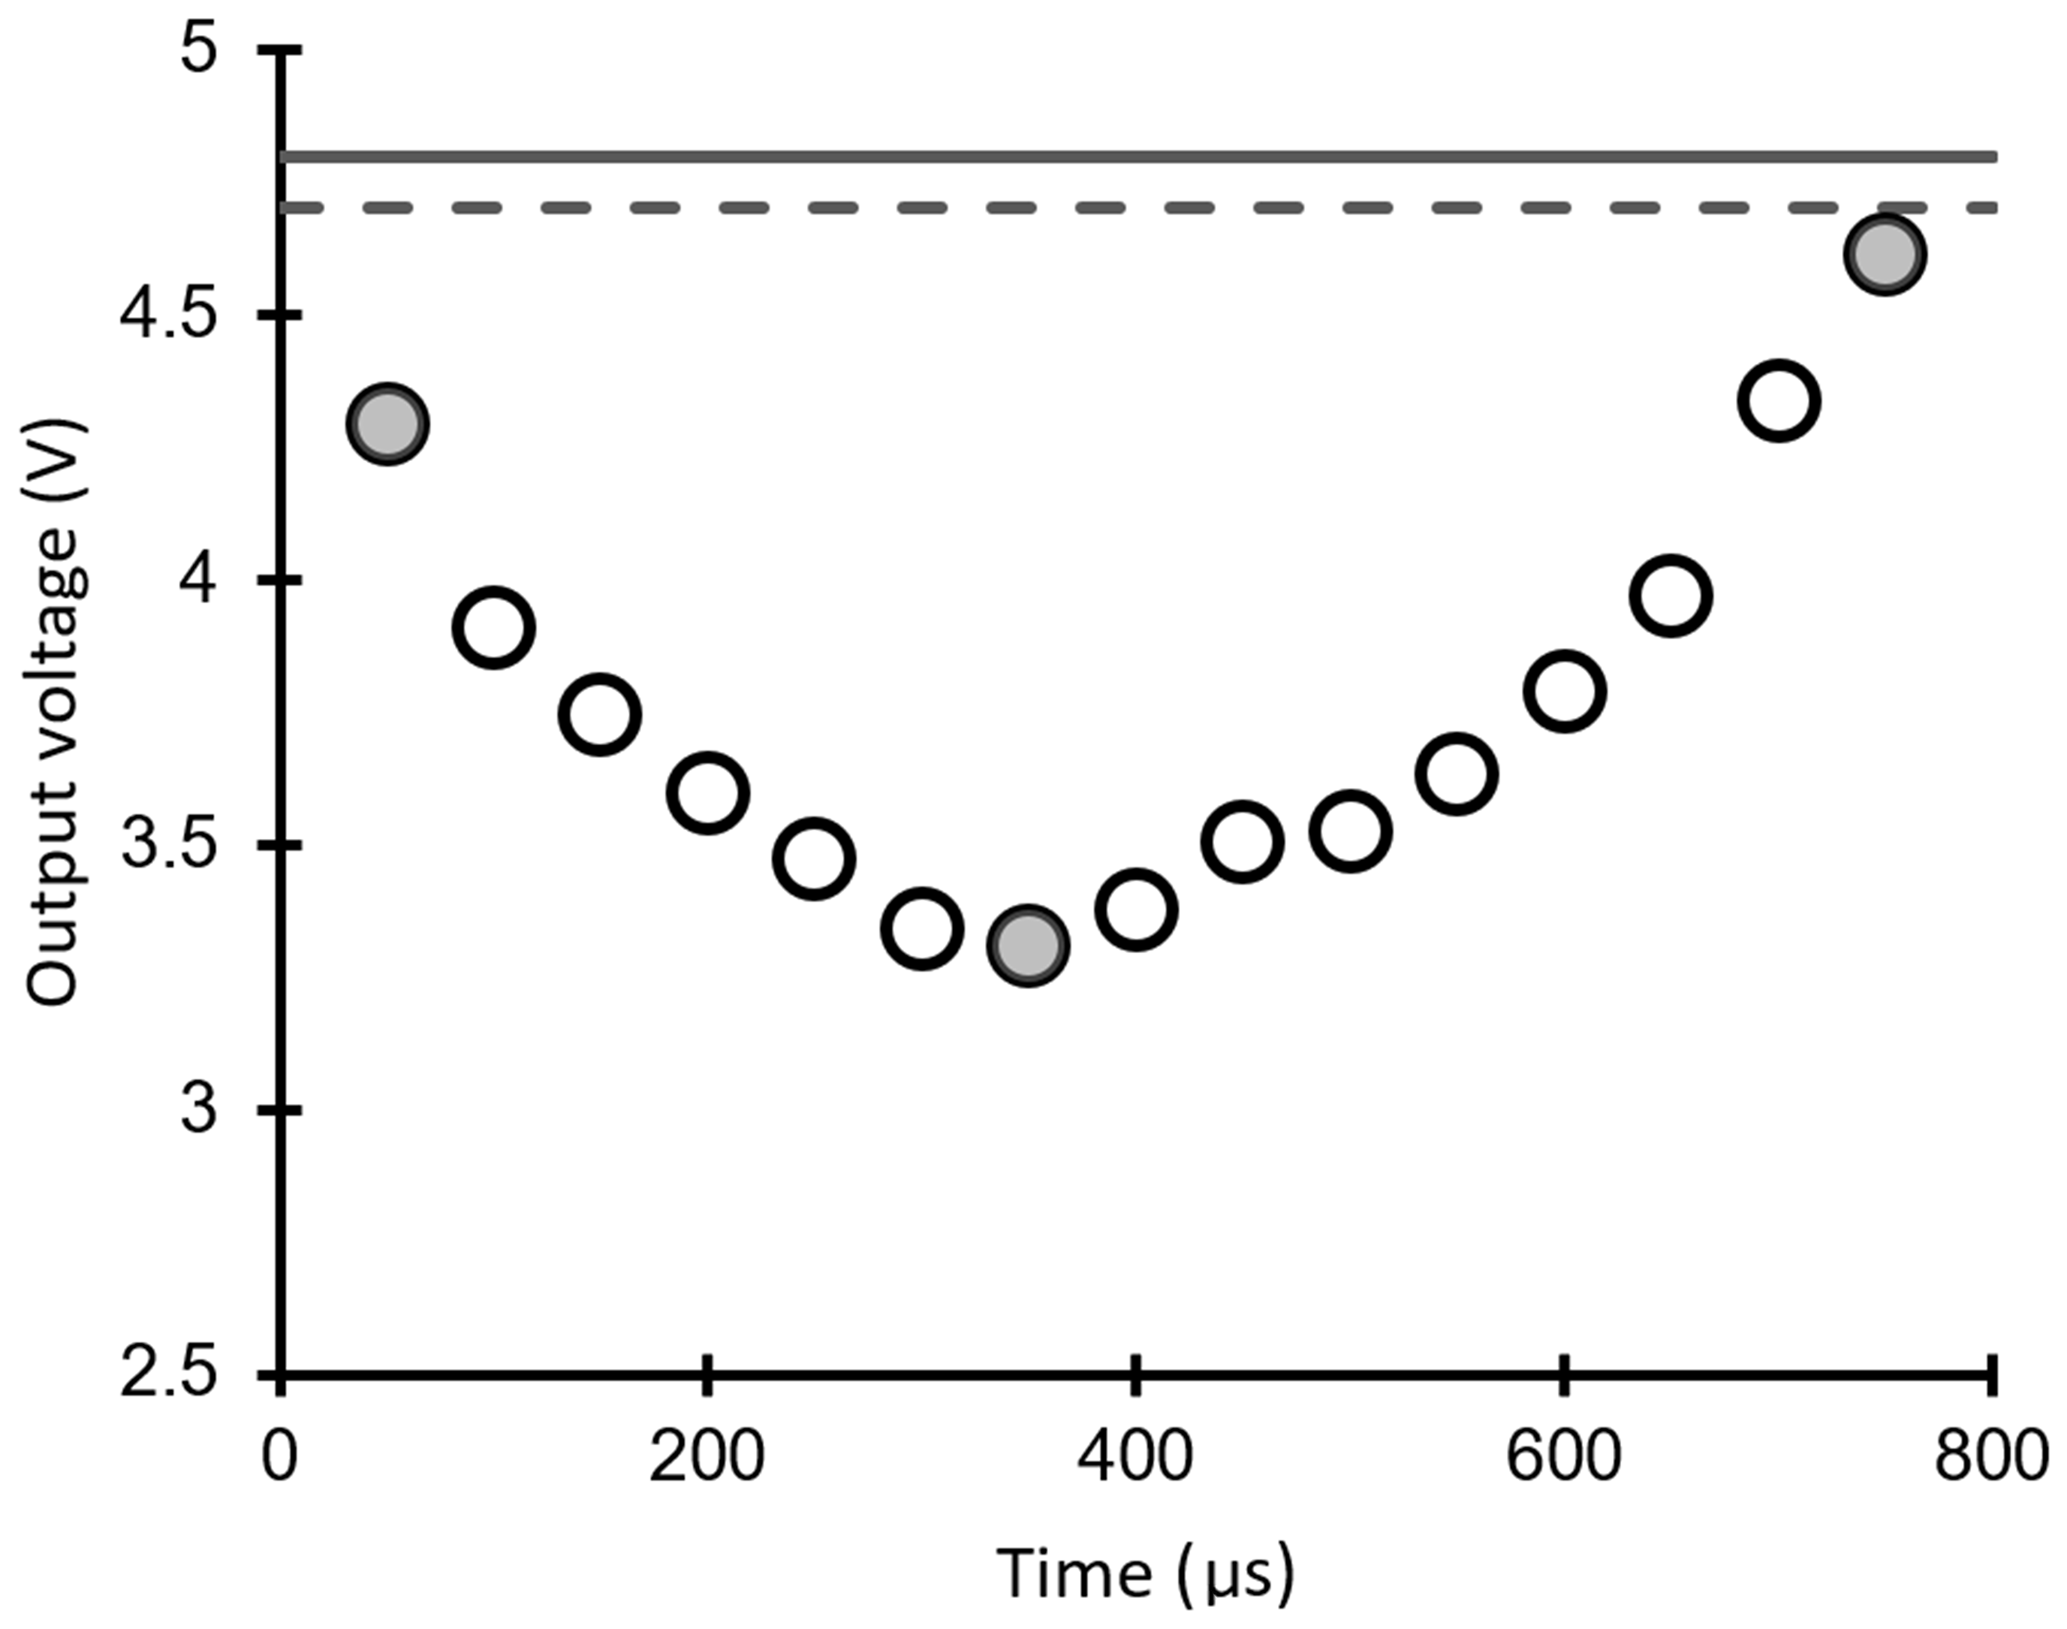
Figure A1An example of temporal variation of output voltage due to a drop that passed through the laser beam. The solid line denotes the base voltage, the dashed line denotes the threshold voltage, the open circle denotes the output voltage every 50 µs and the closed circle denotes the data recording onto the Arduino.
The dataset used in this study is available from the DIGITAL.CSIC repository at http://hdl.handle.net/10261/218057 (last access: August 2020) (Pinos et al., 2020).
The supplement related to this article is available online at: https://doi.org/10.5194/hess-24-4675-2020-supplement.
PL, JL, KN and DL conceived the idea and designed the experiment. PL obtained funding. JP and JL collected the data. JP carried out the data analysis and wrote the initial draft of the paper. All authors discussed the results and edited the paper.
The authors declare that they have no conflict of interest.
This article is part of the special issue “Water, isotope and solute fluxes in the soil–plant–atmosphere interface: investigations from the canopy to the root zone”. It is a result of the EGU General Assembly 2019, Vienna, Austria, 7–12 April 2019.
We thank Berta Singla for her relevant contribution to the preliminary phase of this study. We are also grateful to Elisenda Sánchez, Gisel Bertran, Carles Cayuela, Antonio Molina and Francesc Gallart for their support during the field work. The authors wish to thank the CSIC Open Access Publication Support Initiative for covering the publication fee for this article.
This research has been supported by the Spanish Ministry of Science and Innovation (grant nos. CGL2016-75957-R AEI/FEDER UE, PID2019-106583RB-I00 and BES-2017-082234) and the Japan Society for the Promotion of Science (grant no. JP15H05626).
The publication fee for this article was covered by the CSIC Open Access Publication Support Initiative through its Unit of Information Resources for Research (URICI).
This paper was edited by Miriam Coenders-Gerrits and reviewed by two anonymous referees.
Allen, S. T., Brooks, J. R., Keim, R. F., Bond, B. J., and McDonnell, J. J.: The role of pre-event canopy storage in throughfall and stemflow by using isotopic tracers, Ecohydrology, 7, 858–868, https://doi.org/10.1002/eco.1408, 2014.
Allen, S. T., Keim, R. F., and McDonnell, J. J.: Spatial patterns of throughfall isotopic composition at the event and seasonal timescales, J. Hydrol., 522, 58–66, https://doi.org/10.1016/j.jhydrol.2014.12.029, 2015.
Allen, S. T., Keim, R. F., Barnard, H. R., McDonnell, J. J., and Renée Brooks, J.: The role of stable isotopes in understanding rainfall interception processes: a review, WIREs Water, 4, e1187, https://doi.org/10.1002/wat2.1187, 2017.
Andsager, K., Beard, K. V., and Laird, N. F.: Laboratory measurements of axis ratios for large raindrops, J. Atmos. Sci., 56, 2673–2683, https://doi.org/10.1175/1520-0469(1999)056<2673:LMOARF>2.0.CO;2, 1999.
Best, A. C.: The evaporation of raindrops, Q. J. Roy. Meteorol. Soc., 78, 200–225, https://doi.org/10.1002/qj.49707833608, 1952.
Brain, P. and Butler, D. R.: A model of drop size distribution for a system with evaporation, Plant Cell Environ., 8, 247–252, https://doi.org/10.1111/1365-3040.ep11604646, 1985.
Casellas, E., Latron, J., Cayuela, C., Bech, J., Udina, M., Sola, Y., Lee, K.-O., and Llorens, P.: Moisture origin and characteristics of the isotopic signature of rainfall in a Mediterranean mountain catchment (Vallcebre, eastern Pyrenees), J. Hydrol., 575, 767–779, https://doi.org/10.1016/j.jhydrol.2019.05.060, 2019.
Cayuela, C., Llorens, P., Sánchez-Costa, E., and Latron, J.: Modification of the isotopic composition of rainfall by throughfall and stemflow: the case of Scots pine and Downy oak forests under Mediterranean conditions, Ecohydrology, 11, e2025, https://doi.org/10.1002/eco.2025, 2018a.
Cayuela, C., Llorens, P., Sánchez-Costa, E., Levia, D. F., and Latron, J.: Effect of biotic and abiotic factors on inter-and intra-event variability in stemflow rates in oak and pine stands in a Mediterranean mountain area, J. Hydrol., 560, 396–406, https://doi.org/10.1016/j.jhydrol.2018.03.050, 2018b.
Dewalle, D. R. and Swistock, B. R.: Differences in oxygen-18 content of throughfall and rainfall in hardwood and coniferous forests, Hydrol. Process., 8, 75–82, https://doi.org/10.1002/hyp.3360080106, 1994.
Dunin, F. X., O'loughlin, E. M., and Reyenga, W.: Interception loss from eucalypt forest: lysimeter determination of hourly rates for long term evaluation, Hydrol. Process., 2, 315–329, https://doi.org/10.1002/hyp.3360020403, 1988.
Dunkerley, D. L.: Evaporation of impact water droplets in interception processes: historical precedence of the hypothesis and a brief literature overview, J. Hydrol., 376, 599-604, https://doi.org/10.1016/j.jhydrol.2009.08.004, 2009.
Friedman, I., Machta, L., and Soller, R.: Water-vapor exchange between a water droplet and its environment, J. Geophys. Res., 67, 2761–2766, https://doi.org/10.1029/JZ067i007p02761, 1962.
Gat, J. R.: Oxygen and hydrogen isotopes in the hydrologic cycle, Annu. Rev. Earth Planet. Sci., 24, 225–262, https://doi.org/10.1146/annurev.earth.24.1.225, 1996.
Green, M. B., Laursen, B. K., Campbell, J. L., McGuire, K. J., and Kelsey, E. P.: Stable water isotopes suggest sub-canopy water recycling in a northern forested catchment, Hydrol. Process., 29, 5193–5202, https://doi.org/10.1002/hyp.10706, 2015.
Herbstritt, B., Gralher, B., and Weiler, M.: Continuous, near-real-time observations of water stable isotope ratios during rainfall and throughfall events, Hydrol. Earth Syst. Sci., 23, 3007–3019, https://doi.org/10.5194/hess-23-3007-2019, 2019.
Iida, S., Shimizu, T., Shinohara, Y., Takeuchi, S. and Kumagai, T.: The Necessity of Sensor Calibration for the Precise Measurement of Water Fluxes in Forest Ecosystems, in: Forest-Water Interactions, edited by: Levia, D. F., Carlyle-Moses, D. E., Iida, S., Michalzik, B., Nanko, K., and Tischer, A., Springer, Cham, Switzerland, 29–54, https://doi.org/10.1007/978-3-030-26086-6_2, 2020
Ikawa, R., Yamamoto, T., Shimada, J., and Shimizu, T.: Temporal variations of isotopic compositions in gross rainfall, throughfall, and stemflow under a Japanese cedar forest during a typhoon event, Hydrol. Res. Lett., 5, 32–36, https://doi.org/10.3178/hrl.5.32, 2011.
Kubota, T. and Tsuboyama, Y.: Intra-and inter-storm oxygen-18 and deuterium variations of rain, throughfall, and stemflow, and two-component hydrograph separation in a small forested catchment in Japan, J. Forest. Res., 8, 179–190, https://doi.org/10.1007/s10310-002-0024-9, 2003.
Latron, J., Llorens, P., and Gallart, F.: The hydrology of Mediterranean mountain areas, Geogr. Compass, 3, 2045–2064, https://doi.org/10.1111/j.1749-8198.2009.00287.x, 2009.
Levia, D. F. and Frost, E. E.: Variability of throughfall volume and solute inputs in wooded ecosystems, Prog. Phys. Geogr., 30, 605–632, https://doi.org/10.1177/0309133306071145, 2006.
Levia, D. F., Hudson, S. A., Llorens, P., and Nanko, K.: Throughfall drop size distributions: a review and prospectus for future research, WIREs Water, 4, e1225, https://doi.org/10.1002/wat2.1225, 2017.
Levia, D. F., Keim, R. F., Carlyle-Moses, D. E., and Frost, E. E.: Throughfall and stemflow in wooded ecosystems, in: Forest Hydrology and Biogeochemistry, edited by: Levia, D. F., Carlyle-Moses, D., and Tanaka, T., Springer, Dordrecht, the Netherlands, 425–443, https://doi.org/10.1007/978-94-007-1363-5_21, 2011.
Levia, D. F., Nanko, K., Amasaki, H., Giambelluca, T. W., Hotta, N., Iida, S., Mudd, R. G., Sakai, N., Shinohara, Y., Sun, X., Suzuki, M., Tanaka, N., Tantasirin, C., and Yamada, K.: Throughfall partitioning by trees, Hydrol. Process., 33, 1698–1708, https://doi.org/10.1002/hyp.13432, 2019.
Llorens, P., Domingo, F., Garcia-Estringana, P., Muzylo, A., and Gallart, F.: Canopy wetness patterns in a Mediterranean deciduous stand, J. Hydrol., 512, 254–262, https://doi.org/10.1016/j.jhydrol.2014.03.007, 2014.
Llorens, P., Gallart, F., Cayuela, C., Roig-Planasdemunt, M., Casellas, E., Molina, A. J., Moreno-de las Heras, M., Bertran, G., Sánchez-Costa, E., and Latron, J.: What have we learnt about Mediterranean catchment hydrology? 30 years observing hydrological processes in the Vallcebre research catchments, Geogr. Res. Lett., 44, 475–501, https://doi.org/10.18172/cig.3432, 2018.
Lüpke, M., Leuchner, M., Levia, D., Nanko, K., Iida, S. I., and Menzel, A.: Characterization of differential throughfall drop size distributions beneath European beech and Norway spruce, Hydrol. Process., 33, 3391–3406, https://doi.org/10.1002/hyp.13565, 2019.
Molina, A. J., Llorens, P., Garcia-Estringana, P., de las Heras, M. M., Cayuela, C., Gallart, F., and Latron, J.: Contributions of throughfall, forest and soil characteristics to near-surface soil water-content variability at the plot scale in a mountainous Mediterranean area, Sci. Total Environ., 647, 1421–1432, https://doi.org/10.1016/j.scitotenv.2018.08.020, 2019.
Murakami, S.: A proposal for a new forest canopy interception mechanism: Splash droplet evaporation, J. Hydrol., 319, 72–82, https://doi.org/10.1016/j.jhydrol.2005.07.002, 2006.
Nakaya, K., Wakamatsu, T., Ikeda, H., Abe, S., and Toyoda, Y.: Development of raindrop kinetic energy model under canopy for the estimation of soil erosion in forest, CRIEPI Res. Rep. V11001, Central Research Institute of Electric Power Industry – CRIEPI, Japan, 2011.
Nanko, K., Hotta, N., and Suzuki, M.: Evaluating the influence of canopy species and meteorological factors on throughfall drop size distribution, J. Hydrol., 329, 422–431, https://doi.org/10.1016/j.jhydrol.2006.02.036, 2006.
Nanko, K., Onda, Y., Ito, A., and Moriwaki, H.: Effect of canopy thickness and canopy saturation on the amount and kinetic energy of throughfall: An experimental approach, Geophys. Res. Lett., 35, L05401, https://doi.org/10.1029/2007GL033010, 2008a.
Nanko, K., Mizugaki, S., and Onda, Y.: Estimation of soil splash detachment rates on the forest floor of an unmanaged Japanese cypress plantation based on field measurements of throughfall drop sizes and velocities, Catena, 72, 348–361, https://doi.org/10.1016/j.catena.2007.07.002, 2008b.
Nanko, K., Onda, Y., Ito, A., and Moriwaki, H.: Spatial variability of throughfall under a single tree: Experimental study of rainfall amount, raindrops, and kinetic energy, Agr. Forest Meteorol., 151, 1173–1182, https://doi.org/10.1016/j.agrformet.2011.04.006, 2011.
Nanko, K., Watanabe, A., Hotta, N., and Suzuki, M.: Physical interpretation of the difference in drop size distributions of leaf drips among tree species, Agr. Forest Meteorol., 169, 74–84, https://doi.org/10.1016/j.agrformet.2012.09.018, 2013.
Nanko, K., Hudson, S. A., and Levia, D. F.: Differences in throughfall drop size distributions in the presence and absence of foliage, Hydrolog. Sci. J., 61, 620–627, https://doi.org/10.1080/02626667.2015.1052454, 2016.
Nanko, K., Tanaka, N., Leuchner, M. and Levia, D. F.: Throughfall erosivity in relation to drop size and crown position: a case study from a teak plantation in Thailand, in: Forest-Water Interactions, edited by: Levia, D. F., Carlyle-Moses, D. E., Iida, S., Michalzik, B., Nanko, K., and Tischer, A., Springer, Cham, Switzerland, 279–298, https://doi.org/10.1007/978-3-030-26086-6_12, 2020.
Pinos, J., Latron, J., Nanko, K., Levia, D. F., and Llorens, P.: Throughfall isotopic composition and drop size distributions in a Mediterranean Scots pine stand, Dataset, available at: http://hdl.handle.net/10261/218057, last access: August 2020.
Poyatos, R., Latron, J., and Llorens, P.: Land use and land cover change after agricultural abandonment, Mt. Res. Dev., 23, 362–369, https://doi.org/10.1659/0276-4741(2003)023[0362:LUALCC]2.0.CO;2, 2003.
Saxena, R. K.: Estimation of canopy reservoir capacity and oxygen-18 fractionation in throughfall in a pine forest, Hydrol. Res., 17, 251–260, https://doi.org/10.2166/nh.1986.0017, 1986.
Stewart, M. K.: Stable isotope fractionation due to evaporation and isotopic exchange of falling waterdrops: Applications to atmospheric processes and evaporation of lakes, J. Geophys. Res., 80, 1133–1146, https://doi.org/10.1029/JC080i009p01133, 1975.
Xie, X., Li, Y., Chwang, A. T., Ho, P. L., and Seto, W. H.: How far droplets can move in indoor environments – revisiting the Wells evaporation-falling curve, Indoor Air, 17, 211–225, https://doi.org/10.1111/j.1600-0668.2007.00469.x, 2007.
Xu, X., Guan, H., and Deng, Z.: Isotopic composition of throughfall in pine plantation and native eucalyptus forest in South Australia, J. Hydrol., 514, 150–157, https://doi.org/10.1016/j.jhydrol.2014.03.068, 2014.