the Creative Commons Attribution 4.0 License.
the Creative Commons Attribution 4.0 License.
 | 03 Sep 2020
Climate elasticity of evapotranspiration shifts the water balance of Mediterranean climates during multi-year droughts
Francesco Avanzi
Joseph Rungee
Tessa Maurer
Roger Bales
Qin Ma
Steven Glaser
Martha Conklin
Multi-year droughts in Mediterranean climates may shift the water balance, that is, the partitioning rule of precipitation across runoff, evapotranspiration, and sub-surface storage. Mechanisms causing these shifts remain largely unknown and are not well represented in hydrologic models. Focusing on measurements from the headwaters of California's Feather River, we found that also in these mixed rain–snow Mediterranean basins a lower fraction of precipitation was partitioned to runoff during multi-year droughts compared to non-drought years. This shift in the precipitation–runoff relationship was larger in the surface-runoff-dominated than subsurface-flow-dominated headwaters (−39 % vs. −18 % decline of runoff, respectively, for a representative precipitation amount). The predictive skill of the Precipitation Runoff Modeling System (PRMS) hydrologic model in these basins decreased during droughts, with evapotranspiration (ET) being the only water-balance component besides runoff for which the drop in predictive skill during drought vs. non-drought years was statistically significant. In particular, the model underestimated the response time required by ET to adjust to interannual climate variability, which we define as climate elasticity of ET. Differences between simulated and data-driven estimates of ET were well correlated with accompanying data-driven estimates of changes in sub-surface storage (ΔS, r=0.78). This correlation points to shifts in precipitation–runoff relationships being evidence of a hysteretic response of the water budget to climate elasticity of ET during and after multi-year droughts. This hysteresis is caused by carryover storage offsetting precipitation deficit during the initial drought period, followed by vegetation mortality when storage is depleted and subsequent post-drought vegetation expansion. Our results point to a general improvement in hydrologic predictions across drought and recovery cycles by including the climate elasticity of ET and better accounting for actual subsurface water storage in not only soil, but also deeper regolith that stores water accessible to roots. This can be done by explicitly parametrizing carryover storage and feedback mechanisms capturing vegetation response to atmospheric demand for moisture.
- Article
(6139 KB) - Full-text XML
-
Supplement
(5190 KB) - BibTeX
- EndNote


Regions with a Mediterranean climate receive the bulk of precipitation during winter, while summers are dry (Klos et al., 2018). This seasonal imbalance in precipitation distribution, coupled with asynchronicity between precipitation input and potential-evapotranspiration demand (Fellows and Goulden, 2017; Rungee et al., 2018; Feng et al., 2019), complicates understanding and management of multi-year droughts and their impact on water supply (He et al., 2017). Water supply is the output of a water balance, that is, , where Q is runoff, P is precipitation, ET is evapotranspiration, and ΔS is the change in storage (in this paper, it is assumed that ΔS is predominantly dictated by sub-surface storage). Major droughts reduce P, which directly reduces Q, but quantifying this non-linear relationship is complicated by the additional, and often-overlooked, effects of drought on ET and ΔS. Understanding the impact of droughts on the water balance of Mediterranean climates is relevant to ecosystem services and water security (Bales et al., 2018), especially because droughts are likely to be more persistent than other water risks (He et al., 2017; Rungee et al., 2018) and increase in frequency and geographic extent under a warming climate (Cayan et al., 2010; Woodhouse et al., 2010).
Five possible mechanisms may alter ET and ΔS during and after droughts and thus intensify or alleviate the impact of changing P on Q in Mediterranean climates (Bales et al., 2018). These mechanisms are seldom measured and remain incompletely understood and are thus not well represented in hydrologic modeling (Bales et al., 2018). First, ET may not increase or reduce in proportion to P, thus shifting the fraction of local P partitioned to Q during dry periods. Direct measurements of evapotranspiration during non-drought years show a relatively muted response of ET to P (Rungee et al., 2018). Second is priority partitioning of P to ET, facilitated in some Mediterranean climates by slow-draining soils and thus ample water for sustaining dry-season ET (Bales et al., 2011; Oroza et al., 2018). For example, the importance of water stored in deeply weathered granitic rock in the Sierra Nevada to the productivity and survival of forest trees during the summer dry season is well established (Arkley, 1981; Jones and Graham, 1993). A set of coastal Californian basins with mixed coniferous‐-broadleaf evergreen forests or deciduous oak savanna showed limited interannual variability in ET, despite variable interannual precipitation and low water storage (Hahm et al., 2019). This is in contrast to similar precipitation-limited sites with deeper regolith storage in the Sierra Nevada that showed significant response to interannual precipitation amounts (Bales et al., 2018). Third, pre-drought aridity (Saft et al., 2016b), or the amount of storage and carryover from previous years (Saft et al., 2016b; Klos et al., 2018; Rungee et al., 2018), can affect the amount of stored water available for dry-season evapotranspiration and thus the relation between P and Q. The depletion of this multi-year storage was the major driver for the moisture stress that led to widespread tree mortality in the Sierra Nevada in 2015, during the multi-year drought (Goulden and Bales, 2019). Fourth, changes in either meteorology and evaporative demand (Griffin and Anchukaitis, 2014; He et al., 2017) or vegetation structure and transpiration can alter ET and either increase or decrease Q. Evaporative demand in the Sierra Nevada, indicated by moisture stress, during the 2012–16 drought was higher than in the 1987–1992 drought, owing to the 1–2∘C warmer temperature (Su et al., 2017). Variations in vegetation structure associated with drought-induced mortality and wildfire changed transpiration in the southern Sierra during the 2012–2016 drought and thus the P–Q relation (Bales et al., 2018). Fifth, the spatial heterogeneity and the covariance between P, ET, and ΔS shift the location and relative importance of source regions for Q across a basin (Bales et al., 2018). That is, interannual differences in spatial patterns of P, ET, and available subsurface water storage elicit a non-linear response in Q. For example, higher elevations of the Sierra Nevada have P>ET even in dry years, whereas lower elevations can switch from having P>ET in wet years to P<ET in dry years. These differences can be driven by local regolith lithology (see, e.g., Jefferson et al., 2008; Tague et al., 2008; Tague and Grant, 2009) as well as climate and the interaction of the two over long time periods (Klos et al., 2018).
Changes in runoff response during droughts have been observed in Australia (Saft et al., 2016b), California (Bales et al., 2018), and China (Tian et al., 2018) and have often been quantified as statistical shifts in the precipitation–runoff relationship, i.e., an empirical regression between annual precipitation and annual runoff (Chiew et al., 2014; Saft et al., 2015; Tian et al., 2018). These lumped approaches allow one to predict the occurrence of shifts based on basin and drought characteristics (Saft et al., 2016b), but they do not shed light on how the five internal basin mechanisms outlined above interact to cause them. Since performances of conceptual hydrologic models appear to degrade when these shifts occur (Chiew et al., 2014; Saft et al., 2016a), this knowledge gap limits improvements in hydrologic-model predictive accuracy and challenges the identification of drought-management solutions (Bales et al., 2018). Moreover, shifts in the precipitation–runoff relationship have been quantitatively characterized only in snow-free regions (Saft et al., 2016b; Tian et al., 2018): given the mitigating and delaying effect of snowmelt recharge on soil-water drawdown (Rungee et al., 2018), it is currently unclear whether shifts in the water balance could occur even in Mediterranean basins that are seasonally covered by snow (Bales et al., 2018). Unraveling interactions across water-balance components (P, ET, ΔS, and Q) is key to clarifying the mechanisms behind shifts in the precipitation–runoff relationship, reaching a better understanding of the water balance during droughts, and ultimately informing better water-management decisions.
California, a mixed rain–snow region with a Mediterranean climate, has seen four droughts since the 1970s (water years 1976–1977, 1987–1992, 2007–2009, and 2012–2016; see He et al., 2017). Because most precipitation in the state falls in the north and during winter, water supply is mostly generated in lithologically and topographically complex headwaters, while water is mainly consumed in lowland regions further south. Rising temperatures are threatening this equilibrium (Harpold et al., 2017; Hatchett and McEvoy, 2018), meaning the four Californian droughts between the 1970s and 2010s offer a decision-relevant opportunity to clarify the mechanisms behind shifts in precipitation–runoff relationships in a Mediterranean, mixed rain–snow climate as well as the adequacy of hydrologic models to simulate them. To achieve this goal, we used detailed water-balance indices and hydrologic modeling (PRMS; see Koczot et al., 2004; Markstrom et al., 2016; Avanzi et al., 2020) to address three research questions. First, do droughts cause shifts in the precipitation–runoff relationship of mixed rain–snow basins in a Mediterranean climate, similar to shifts in rainfall-dominated regions? If so, how is the occurrence of these shifts influenced by predominant basin lithology and so predominance of near-surface runoff vs. deeper groundwater baseflow? Second, does the occurrence of these shifts affect the predictive accuracy of PRMS, a spatially semi-distributed, physics-based hydrologic model that is widely used for water-supply forecasting? Third, what basin mechanisms are causing shifts during drought vs. wet periods in Mediterranean regions?
We focused on the Feather River upstream of Lake Oroville in the Sierra Nevada of California (∼9300 km2; see Fig. 1) and on three of its sub-basins with contrasting lithology (see Sect. 2.1 for details). Water from the Feather is both exploited locally for hydropower production by Pacific Gas & Electric (PG & E; see Freeman, 2011) and impounded by Oroville Dam to support water supply across the state through the State Water Project (Huang et al., 2012).
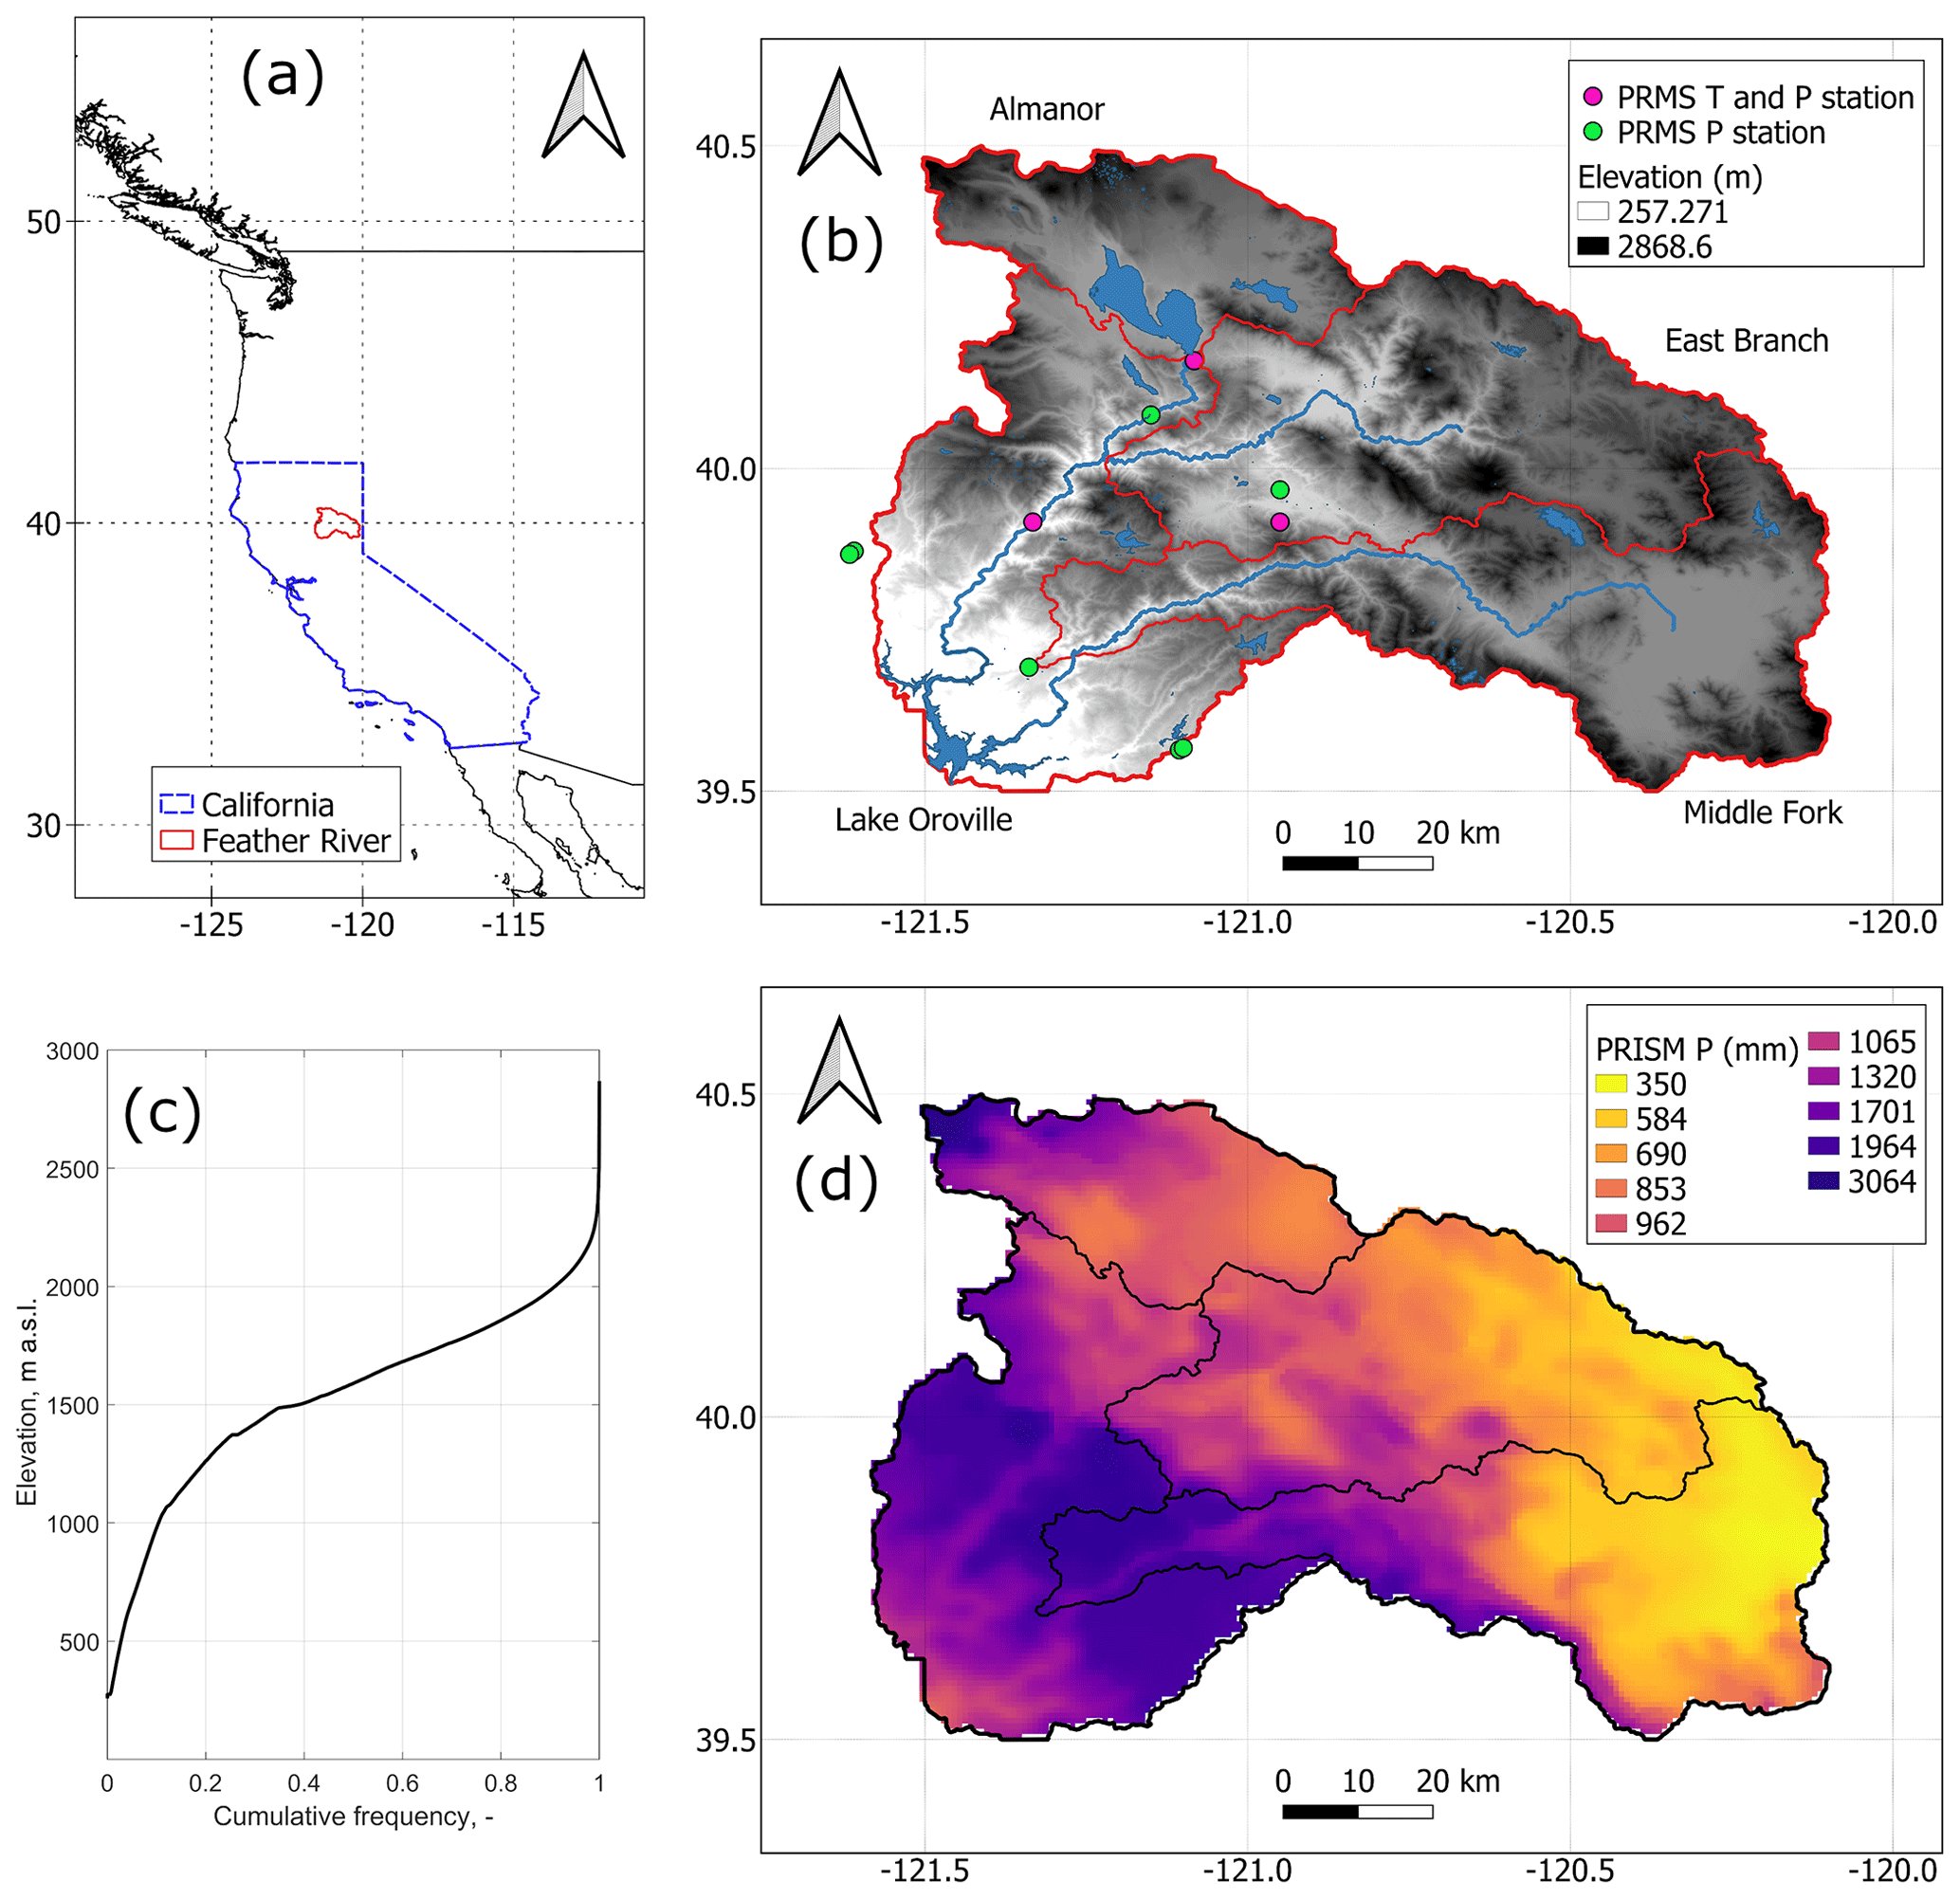
Figure 1The Feather River at Oroville and its three headwater sub-basins under study (Almanor, East Branch, and Middle Fork): location of the river along the Pacific coast of North America (a), orography and hydrography, along with in situ temperature and precipitation stations used to force PRMS (see Sect. 2.3.2) (b), cumulative-frequency distribution of the river basin's elevation (c), and PRISM 1981–2010 average annual precipitation (d).
Our research followed three main steps (Sect. 2.3.1 to 2.3.3). First, we quantified shifts during droughts in the observed precipitation–runoff relationship of the three (sub-)basins with serially complete full-natural-flow data (see Sect. 2.2 for details about full-natural-flow data). Second, we assessed the performance of the PRMS hydrologic model in predicting full-natural flow in all (sub-)basins, in particular during droughts, in order to gain insight into the potential impact of these periods on predictive accuracy. Third, we identified the driver of PRMS predictive accuracy during droughts and how this driver is related to shifts in the precipitation–runoff relationship by comparing independently estimated and PRMS-simulated basin-wide mass-balance indices (P, ET, ΔS, Q) in the (sub-)basins with serially complete full-natural-flow data.
We focused on water years 1970 to 2016 in order to cover the complete timespan of the most recent four multi-year droughts in California, as identified by general consensus in the State of California (He et al., 2017): 1976–1977, 1987–1992, 2007–2009, and 2012–2016. In the current analysis, as is done in operational hydrology in California, we thus use a hydrologic definition of drought rather than a legal definition linked to socioeconomic assistance by a governmental agency. Still, the designation of drought years in California focuses on impacts on water users, and so these water years correspond to a hydrologic and socioeconomic rather than a meteorological or agricultural drought (see definitions in Van Loon, 2015). In practice, this designation is based on a broad array of real-time indices collected throughout the state, including precipitation anomalies, snowpack accumulation, forecasted water supply for the dry season, and drought levels according to the US Drought Monitor at https://droughtmonitor.unl.edu/ (last access: 13 June 2020). The water year is defined as 1 October to 30 September and is indicated with the calendar year in which it ends (e.g., water year 2015 went from 1 October 2014 to 30 September 2015).
2.1 Study area
The climate of the Feather is Mediterranean, with dry, hot summers and wet, mild winters. Elevation ranges from ∼250 m a.s.l. (above sea level) at Oroville Dam (the outlet of the basin) to ∼2900 m a.s.l. at Mt. Lassen, but approximately 90 % of the basin lies below 2000 m a.s.l. (see Fig. 1c). Therefore, mixed rain–snow and rain-on-snow events are frequent across the basin (Koczot et al., 2004; White et al., 2019). The water balance of the Feather has experienced recent warming-related changes, including declining runoff and peak snow accumulation (Freeman, 2011, 2012), forest growth (Freeman, 2011), and a rise in the rain–snow transition elevation (Hatchett et al., 2017).
The Feather is the most northern of the 13 basins draining from the Sierra Nevada into the Sacramento–San Joaquin Valley (see Harrison and Bales, 2016). Contrary to most of these basins (Freeman, 2012; Harrison and Bales, 2016), some headwaters of the Feather lie on the eastern, rain-shadowed side of the Sierra divide (Fig. 1b and d): mean annual precipitation thus ranges from ∼2800 mm on the western side of the basin to less than 800 mm on the eastern side. Because anomalously low precipitation has been suggested as a key predictor of shifts during droughts (Saft et al., 2015), this basin is an ideal case study to answer our questions.
Our study considered two spatial scales (Fig. 1): the Feather at Oroville Dam and three of its headwater sub-basins: Almanor (∼1100 km2, 1400–2900 m a.s.l., rain-shadowed), East Branch (∼2600 km2, 725–2550 m a.s.l., rain-shadowed), and Middle Fork (∼2700 km2, 480–2660 m a.s.l., partially rain-shadowed). Hydrologic studies on the Feather River at Oroville are abundant (see for example Tang and Lettenmaier, 2010; Rosenberg et al., 2011; Huang et al., 2012; Anghileri et al., 2016, and references therein), whereas headwater sub-basins have rarely been studied as stand-alone basins (see examples in Freeman, 2011; Wayand et al., 2015; Sun et al., 2019; Avanzi et al., 2020).
The Almanor sub-basin lies at the intersection between the granitic Sierra Nevada and the volcanic Cascade Range and is thus dominated by a porous, volcanic bedrock, with soil texture being predominantly composed by silt (see a geologic and soil map in Koczot et al., 2004, p. 12). This sub-basin is largely fed by subsurface flow (Freeman, 2008) and has exhibited a 30 % decline in water-year inflow to Lake Almanor (located at the outlet of this sub-basin) since the 1960s. This drop is attributed to missed groundwater-recharge opportunities due to decreasing snow accumulation (Freeman, 2010). The lithology of East Branch and Middle Fork includes impervious granitic outcrops similar to the rest of the Sierra Nevada and an alternation between sand and silt. Water supply in these two sub-basins is dominated by surface runoff (Freeman, 2008), but East Branch is significantly drier than Middle Fork because it is fully rain-shadowed.
2.2 Data
Data include daily full-natural flow at the outlet of the four (sub-)basins under study; in situ precipitation, air temperature, and snow water equivalent (SWE) at various temporal resolutions; and estimated annual spatially distributed water-balance indices of precipitation, evapotranspiration, and variation in sub-surface storage. Table S1 in the Supplement further describes all data used, their spatial and temporal resolution, whether they were measured/estimated in situ or remotely, and their use in the paper.
Full-natural flow – sometimes also referred to as unimpaired flow or reconstructed streamflow – is a mass-balance reconstruction of runoff as if no dam or other man-made infrastructure affected it (a rare condition in California; see He et al., 2017). This reconstruction is achieved using published gauged streamflow and reservoir gauge data as well as estimates of unmeasured inflows and/or outflows. Thus, computing full-natural flow requires extensive knowledge of water infrastructures and reservoir operations. For the Almanor and East Branch sub-basins, full-natural flow data were thus provided directly by PG & E at a daily resolution for water years 1970 through 2017. For the Middle Fork sub-basin and for the Feather River at Oroville, data were obtained from the California Department of Water Resources (DWR) at daily resolution (water years 1987 to 2018 and 1985 to 2018, respectively).
In situ daily precipitation from 10 stations and daily maximum and minimum air temperature from three stations across the Feather River basin were obtained from PG & E, which routinely uses them as input for the PRMS hydrologic-forecasting model (see the locations of these stations in Fig. 1 and Koczot et al., 2004, for further details). These data were quality checked and serially gap filled by the company (water years 1970 to 2017). Additional data of monthly in situ precipitation and manual snow water equivalent were downloaded from the California Data Exchange Center (https://cdec.water.ca.gov/, last access: 19 July 2019) to study drought characteristics across the Feather (see a complete list and their location in Tables S2–S3 and in Figs. S1 and S2 in the Supplement, respectively).
Precipitation gauges used in the Feather River basin are managed by various operators, with the California Department of Water Resources collecting and archiving the data (Table S2). The design of these sensors resembles the one in use by the SNOTEL network throughout the western US (https://www.wcc.nrcs.usda.gov/about/mon_automate.html, last access: 1 February 2020). Most gauges are unheated and some are manual; most are located in small clearings where wind speed is low, which suggests that wind-driven undercatch is locally low, especially below the seasonal rain–snow line (Zhang et al., 2017). Because precipitation gauges considered in this study are predominantly located in forested valleys below 2000 m a.s.l. (see Figs. 1 and S1) and many of them were not colocated with wind-speed measurements, we did not correct for undercatch (Koczot et al., 2004). Undercatch and plugging increase in snow-dominated areas (Rasmussen et al., 2012; Avanzi et al., 2014).
Spatially distributed, estimated annual precipitation (P) was obtained by accumulating daily 800 m maps from the Parameter–elevation Relationships on Independent Slopes Model (PRISM; see Daly et al., 2008). Spatially distributed annual ET was estimated by extending the Landsat calibration approach by Goulden et al. (2012) and Goulden and Bales (2019) to include the average of the current and previous years' precipitation as a predictor in addition to the Landsat-based annual-averaged NDVI (Normalized Difference Vegetation Index, 30 m). Both predictors were used as single-term power-function transformations that were developed by individually regressing the NDVI and PRISM data with 13 flux-tower measurements of evapotranspiration in California (see a list and a map in Rungee et al., 2018). Performance of this approach was evaluated by removing an individual water year for model building and then evaluating on the water year removed. Results showed an improved fit to calibration data for wet sites compared to only using NDVI. Developing this ET product was the scope of earlier research, and we refer to Roche et al. (2020) for further details. Estimated variations in annual basin-wide subsurface storage were estimated as the residuals of , where P is basin-wide mean-annual PRISM-based precipitation, ET is basin-wide mean-annual estimated evapotranspiration, and Q is annual full-natural flow. Landsat-based data were available for water years 1985–2016; PRISM maps were processed for the same period. PRISM data have a pixel size of 800 m, which we downscaled to 30 m using a nearest-neighbor approach to match that of Landsat.
2.3 Analyses
2.3.1 Shift in precipitation–runoff relationship
We detected shifts in the precipitation–runoff relationship by fitting a multivariate regression across annual cumulative full-natural flow (target variable), basin-wide annual precipitation, and a categorical variable denoting drought and non-drought years (Saft et al., 2016a; Tian et al., 2018):
where I is a categorical drought variable (1 for drought years and 0 for non-drought years), b0, b1, and b2 are regression coefficients, ϵ is noise, and QBC is annual full-natural flow transformed according to a Box–Cox transformation following the arguments in Saft et al. (2016a, b) and Tian et al. (2018):
While λ should in principle be estimated from data to ensure linearity and heteroscedasticity (Sarkar, 1985), we assumed λ=0.25 as suggested by Santos et al. (2018) and references therein.
If different from zero, parameter b1 indicated a shift of the precipitation–runoff relationship during droughts. This parameter is usually negative, as shifts during droughts tend to decrease runoff compared to precipitation deficit alone (Saft et al., 2016a, b). We assessed the statistical significance of coefficient b1 and concluded that the shift during droughts was statistically significant if the signs of the confidence bounds agreed (significance level α=5 %; see Kottegoda and Rosso, 2008). We performed this analysis for the Feather River at Oroville (1985–2016) and the Almanor and East Branch sub-basins (1970–2016), for which we had serially complete time series of annual full-natural flow.
Rather than directly using PRISM maps to estimate basin-wide precipitation, we tilted their monthly mean surfaces using precipitation data at the 10 in situ stations available to this study (see again Sect. 2.2). This operational procedure (called DRAPER) is routinely used by PG&E forecasters on the river to force PRMS and is believed to provide more representative precipitation patterns for this basin than simply using PRISM surfaces (see Koczot et al., 2004; Donovan and Koczot, 2019, for details about the DRAPER algorithm).
We estimated the relative magnitude of the shift in precipitation vs. runoff (MQ) for each (sub-)basin with serially complete time series of annual full-natural flow by using the approach suggested by Saft et al. (2016b):
where is the (predicted annual) full-natural flow for a representative (annual) precipitation during dry periods according to the shifted precipitation–runoff relationship (Eq. 1, I=1), while Qdry,P is the full-natural flow for the same precipitation according to the non-shifted relationship (Eq. 1, I=0). We assumed as representative annual precipitation the mean between average and minimum annual precipitation across the entire period of record (see more details, including a schematic, in Saft et al., 2016b). Here again, we used DRAPER to estimate this representative precipitation, while full-natural flow in Eq. (3) was not transformed.
Saft et al. (2016b) originally proposed MQ to quantify the impact of the decade-long Millennium Drought in south-eastern Australia (∼1997–2009). The four Californian droughts under study were significantly shorter, so we applied Eq. (3) by aggregating all drought years in one sample. We also quantified shifts for single droughts (mQ) by assuming to be the observed, average annual full-natural flow across each drought and Qdry,P to be the expected annual full-natural flow according to the non-shifted precipitation–runoff relationship (Eq. 1, I=0) and a reference annual precipitation equal to the average across each drought.
This shift-detection approach requires time series of annual precipitation and runoff. These time series are comparatively short in California, where for example water-supply forecasts started in the 1930s (Harrison and Bales, 2016). Paleoclimatic data sets suggest prolonged, multi-decadal droughts in this region (megadroughts; see Griffin and Anchukaitis, 2014), but investigating such scenarios would involve developing data sets that would have less certainty in assessing model response than the ground-based measurements used in this study. In addition, drought vs. non-drought conditions in California have a strong interannual character because of the quasi-periodicity of El Niño–Southern Oscillation (Griffin and Anchukaitis, 2014), meaning that the timescale considered in this study is appropriate for answering our research questions.
2.3.2 PRMS performance during droughts: streamflow
PRMS is a hydrologic model that solves mass and energy conservation across a given basin by discretizing it into hydrologic response units (HRUs), regions of the basin that are assumed homogeneous (Markstrom et al., 2015). The model requires, as a minimum, inputs of daily precipitation and maximum–minimum temperature at one location, from which these data can be distributed to the grid of HRU centroids (Markstrom et al., 2015). In the Feather River PRMS model, air-temperature data from three stations are distributed using monthly lapse rates. Precipitation is distributed using the DRAPER method as outlined in Sect. 2.3.1 (Koczot et al., 2004; Donovan and Koczot, 2019). Processes simulated include precipitation-phase partitioning, precipitation interception and storage by canopy, evapotranspiration, radiation distribution, snow accumulation and snowmelt, infiltration and surface runoff, interflow, groundwater storage, and baseflow.
PRMS was calibrated and evaluated over the Feather River in the early 2000s by mostly focusing on full-natural-flow data between 1971 and 1997 (see Koczot et al., 2004, for more details, including specific modules used by the model). While PRMS has been updated since then (the current version is 5 – June 2019), the model is currently set up for this river in version 2. The main differences between more recent versions and version 2 are the sub-surface components: version 2 separates sub-surface storage into superficial soil (including the recharge zone), a deeper sub-surface reservoir, and groundwater (Koczot et al., 2004); more recent versions of PRMS consider instead a process-based separation into capillary, preferential, and gravity storage in addition to groundwater (Markstrom et al., 2015). Also, PRMS has recently been coupled with a full groundwater model (GSFLOW; see Markstrom et al., 2008). Lacking the data needed to describe groundwater flow in the basin with a higher level of rigor, we assessed that the simplified simulation of groundwater processes in PRMS 2 is appropriate for meeting the aims of this study, especially since it is representative of many conceptual models. For example, this version was implemented in inter-comparison tools like the Framework for Understanding Modeling Errors (FUSE; see Clark et al., 2008).
PRMS performance for full-natural flow was quantified using three different metrics: water-year Nash–Sutcliffe efficiency (NSE), annual relative bias (relative to observations), and observed vs. simulated climate elasticity of streamflow. Because full-natural flow is prone to large errors, we smoothed the data and simulations using a 5 d window before computing performance metrics.
NSE benchmarks the squared errors of simulations of a target variable (in our case, daily full-natural flow for each water year) against those obtained by using a long-term mean (Nash and Sutcliffe, 1970). The choice of this “long-term mean” can yield very sensitive results (Schaefli et al., 2007). In the Feather River basin, full-natural flow shows a large inter- and intra-annual variability (see some examples in Koczot et al., 2004), implying that a mean across all water years would be a particularly poor benchmark (resulting in overoptimistic NSE values). On the other hand, a water-year mean would be an excellent predictor during dry years and a very poor predictor during wet years. In order to limit these spurious results, we benchmarked PRMS using a mean across all years from the same type according to the classification used by PG & E (henceforth, NSEyrt; see Georgakakos et al., 2012, for some context on year types in California). We also computed the Nash–Sutcliffe efficiency using log-transformed values (LogNSEyrt) as this metric is more sensitive to low flow (Santos et al., 2018).
Climate elasticity measures the sensitivity of annual streamflow (in this case, full-natural flow) to changes in a relevant climate variable, usually precipitation and potential evapotranspiration (Andréassian et al., 2016; Cooper et al., 2018). Compared to NSE and bias, contrasting observed and simulated elasticity quantifies the performance of a hydrologic model in simulating inter-annual variability in streamflow and its relation to external forcings. Here, we considered absolute elasticity (nondimensional): eQ∕P and eQ∕PET are absolute elasticity to precipitation and potential evapotranspiration, respectively. Elasticity for both simulated and observed full-natural flow was computed in a bivariate linear framework using the approach proposed by Andréassian et al. (2016). As an independent benchmark, we also computed theoretical elasticity based on the Turc–Mezentsez formula (see again Andréassian et al., 2016). Similarly to shifts in precipitation–runoff relationships (see Sect. 2.3.1), we computed elasticity for the (sub-)basins with serially complete time series of annual full-natural flow, that is, the Feather River at Oroville (1985–2016) and the Almanor and East Branch sub-basins (1970–2016). We again used DRAPER to estimate basin-wide precipitation; potential evapotranspiration was estimated using the Jensen–Haise approach in PRMS (Koczot et al., 2004).
2.3.3 PRMS performance during droughts: water balance
We quantified the performance of PRMS for the four components of the annual water balance by adapting Eq. (1) to fit a regression between observed and simulated water-balance components during drought and non-drought years (period 1985–2016; see Sect. 2.2 for data availability of Landsat data products):
where, for example, Pobs and Psim are observed and simulated basin-wide annual precipitation, while b0,P, b1,P, and b2,P are regression coefficients, respectively. If b1,P was statistically different from zero, then PRMS performance for precipitation during droughts was statistically different from that during non-drought years (α=5 %). Similar definitions apply to the other water-balance components in Eq. (4). This analysis was carried out for the (sub-)basins with serially complete time series of annual full-natural flow (see Sect. 2.3.1).
Observed precipitation was assumed equal to the original PRISM maps in the absence of other independent, distributed sources. Observed ET was estimated through the product introduced in Sect. 2.2, while observed ΔS was estimated by closing the water balance with observed full-natural flow (see again Sect. 2.2). Note that the word observed is used here in a statistical framework and in contrast to PRMS simulations to highlight that PRISM, the ET product, and full-natural flow are derived from measurements; however, we stress that none of them were measured directly but are estimates of statistical models.
In addition to the standard four balance terms in Eq. (4), PRMS includes a groundwater sink. This term is used to account for (often unknown) water losses in the sub-surface portion of the water balance. Because this sink together with ET represents the only internal water loss in the model, it was summed to ETsim to fit a regression with observed evapotranspiration (note that this groundwater sink was set to zero in the original calibration of the Almanor sub-basin).
3.1 Drought hydro-climatic summary
Average minimum daily air temperature at the three index stations of Canyon Dam (1390 m a.s.l.), Quincy (1066 m a.s.l.), and Bucks Creek Powerhouse (536 m a.s.l.) showed a statistically significant increasing trend between water years 1970 and 2016 (Kendall τ=0.54, p value < 0.01, α=0.05, Sen's slope = 0.0477 ∘C yr−1, that is, ∼2.1 ∘C in 45 years, Fig. 2). Neither average maximum daily air temperature nor annual precipitation presented a statistically significant trend (p value = 0.67 and 0.82, respectively – statistics for precipitation refer to median values across all stations; see Fig. 2). SWE for 1 April had no significant trend for α=0.05, but its p value was significantly smaller (0.05; statistics again refer to median values across all stations; see Fig. 2).
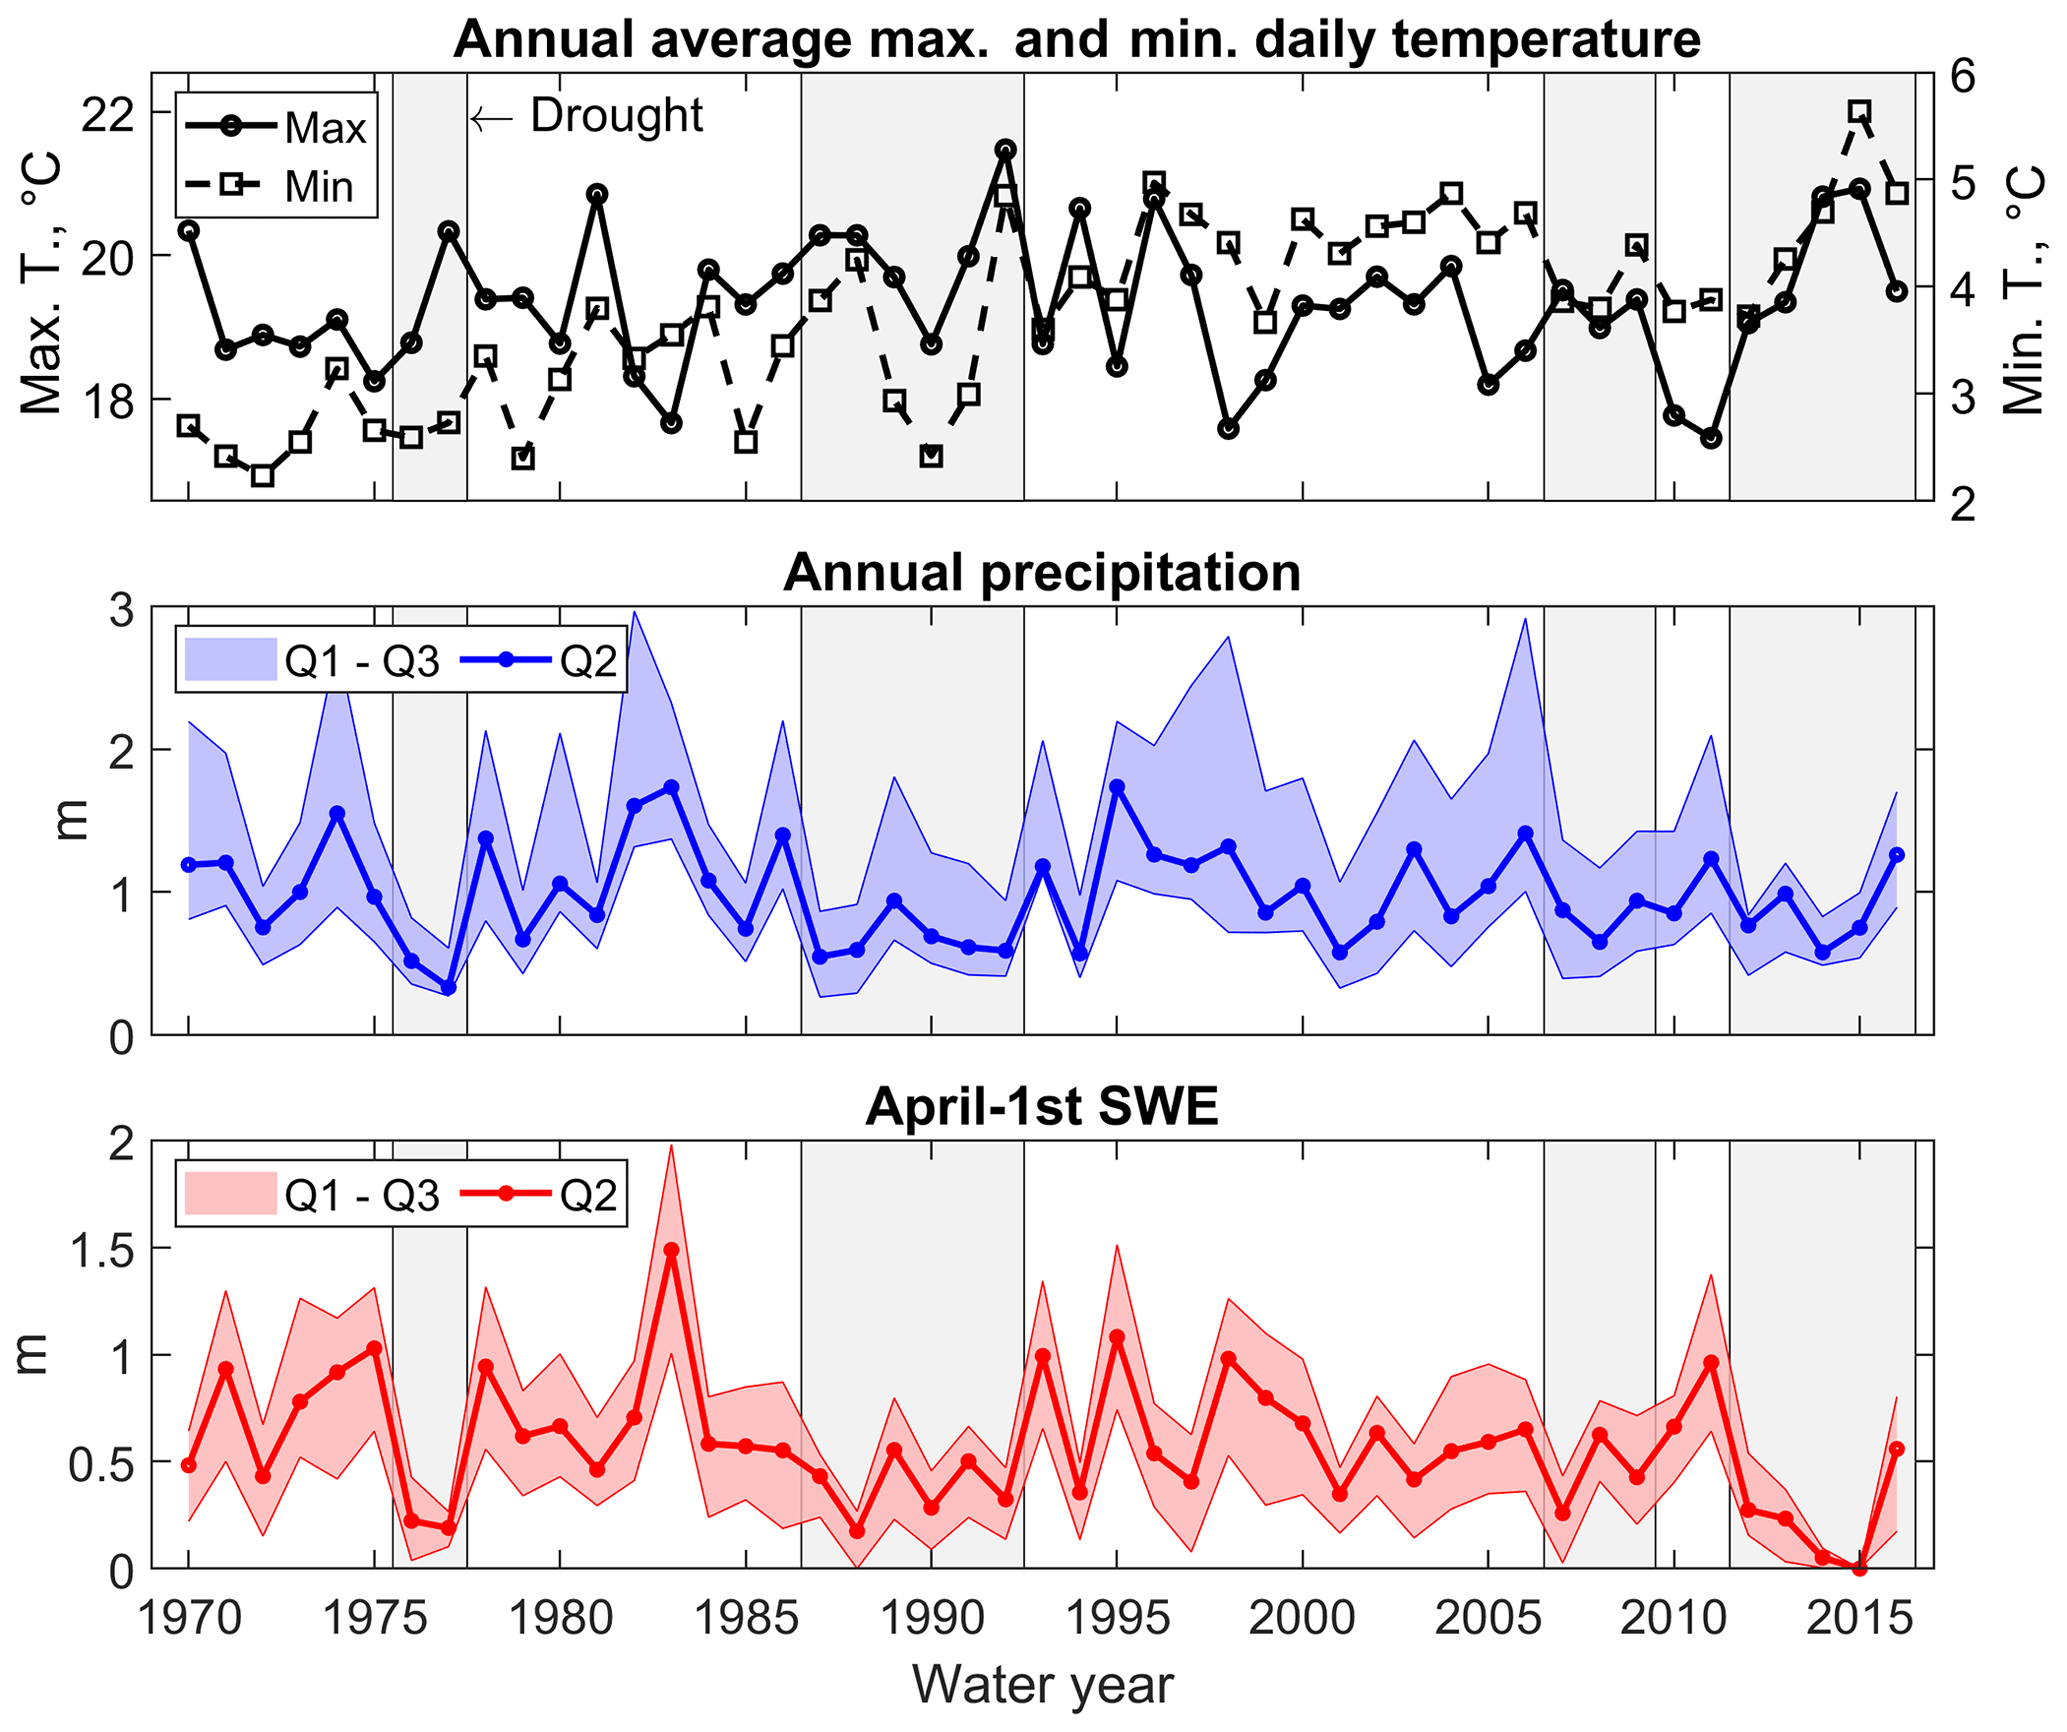
Figure 2Hydroclimatic summary of the four most recent Californian droughts compared to non-drought years. Maximum and minimum daily temperature is an annual average of the three index stations used by the PRMS model for air-temperature inputs: Canyon Dam (1390 m), Quincy (1066 m), and Bucks Creek Powerhouse (536 m). Annual precipitation and 1 April SWE were computed using 13 and 25 stations across the Feather River, respectively (see Tables S2 and S3). Q2 is the spatial median and Q1 and Q3 are the two quartiles, respectively. Sources: California Data Exchange Center (CDEC, https://cdec.water.ca.gov/, last access: 19 July 2019) and Pacific Gas & Electric.
The four droughts under study had very different hydro-climatic characteristics (Fig. 2 and Table 1). The 1976–1977 drought was both the coolest (in terms of minimum temperature) and driest in our record (∼51 % of average annual precipitation compared to 2012–2016), and as a result 1976 and 1977 were the fourth and first driest water years in the state's historical record at that time (DWR, 1978). Full-natural flow at Oroville was 43 % and 24 % of (contemporary) averages for 1976 and 1977, respectively, the latter being a new record.
Table 1Average precipitation (P), snow water equivalent (SWE), and maximum and minimum daily temperature (Tmax and Tmin, respectively) across the four California droughts under study.
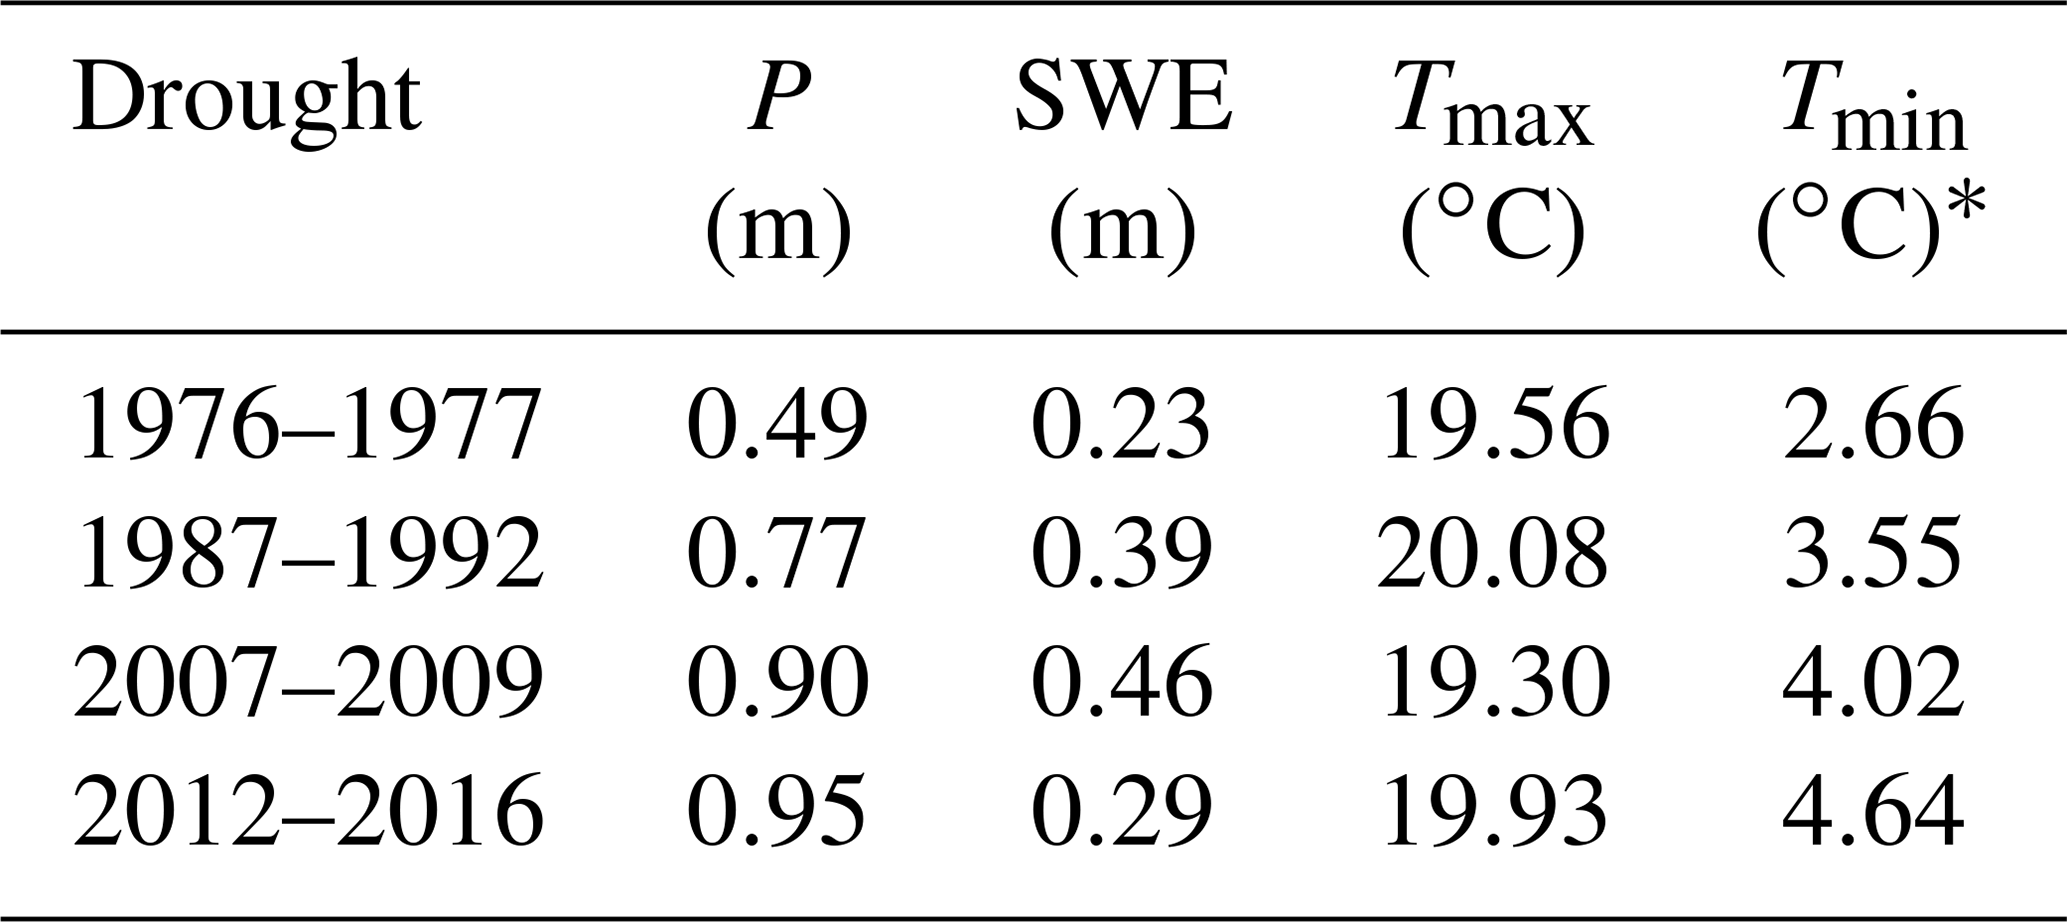
* P is average water-year precipitation during each drought across 13 stations on the Feather River (see Table S2). SWE is average 1 April SWE during each drought across 25 stations on the Feather River (see Table S3). Tmax and Tmin are average annual maximum and minimum daily temperature during the drought at the three index stations used by the PRMS model for air-temperature input: Canyon Dam (1390 m), Quincy (1066 m), and Bucks Creek Powerhouse (536 m). Data sources: California Data Exchange Center (CDEC, https://cdec.water.ca.gov/, last access: 19 July 2019) and Pacific Gas & Electric.
At the other end of the spectrum, the 2012–2016 drought was the warmest (in terms of minimum temperature) and the wettest during our study period (together with the 2007–2009 drought, Fig. 2 and Table 1). As a result, average 1 April SWE significantly declined during this drought compared to the similarly wet 2007–2009 drought. In between, the 1987–1992 drought was the longest one (6 years), with 5 years classified as critically dry and 1 (1989) as dry (DWR, 1993). Average minimum temperature during 1987–1992, 2007–2009, and 2012–2016 was ∼0.89, ∼1.36, and ∼1.98 ∘C higher than the 1976–1977 drought, respectively.
Runoff timing from all (sub-)basins under study was highly seasonal, with peak flow occurring during winter and spring due to precipitation and snowmelt and low flow occurring during the dry summer–fall season (Fig. 3). The surface-runoff-dominated East Branch sub-basin had a significantly lower flow during summer than the volcanic, subsurface-flow-fed Almanor sub-basin. This higher summer flow in the volcanic Almanor sub-basin compared to the granitic East Branch was consistent between drought and non-drought years.
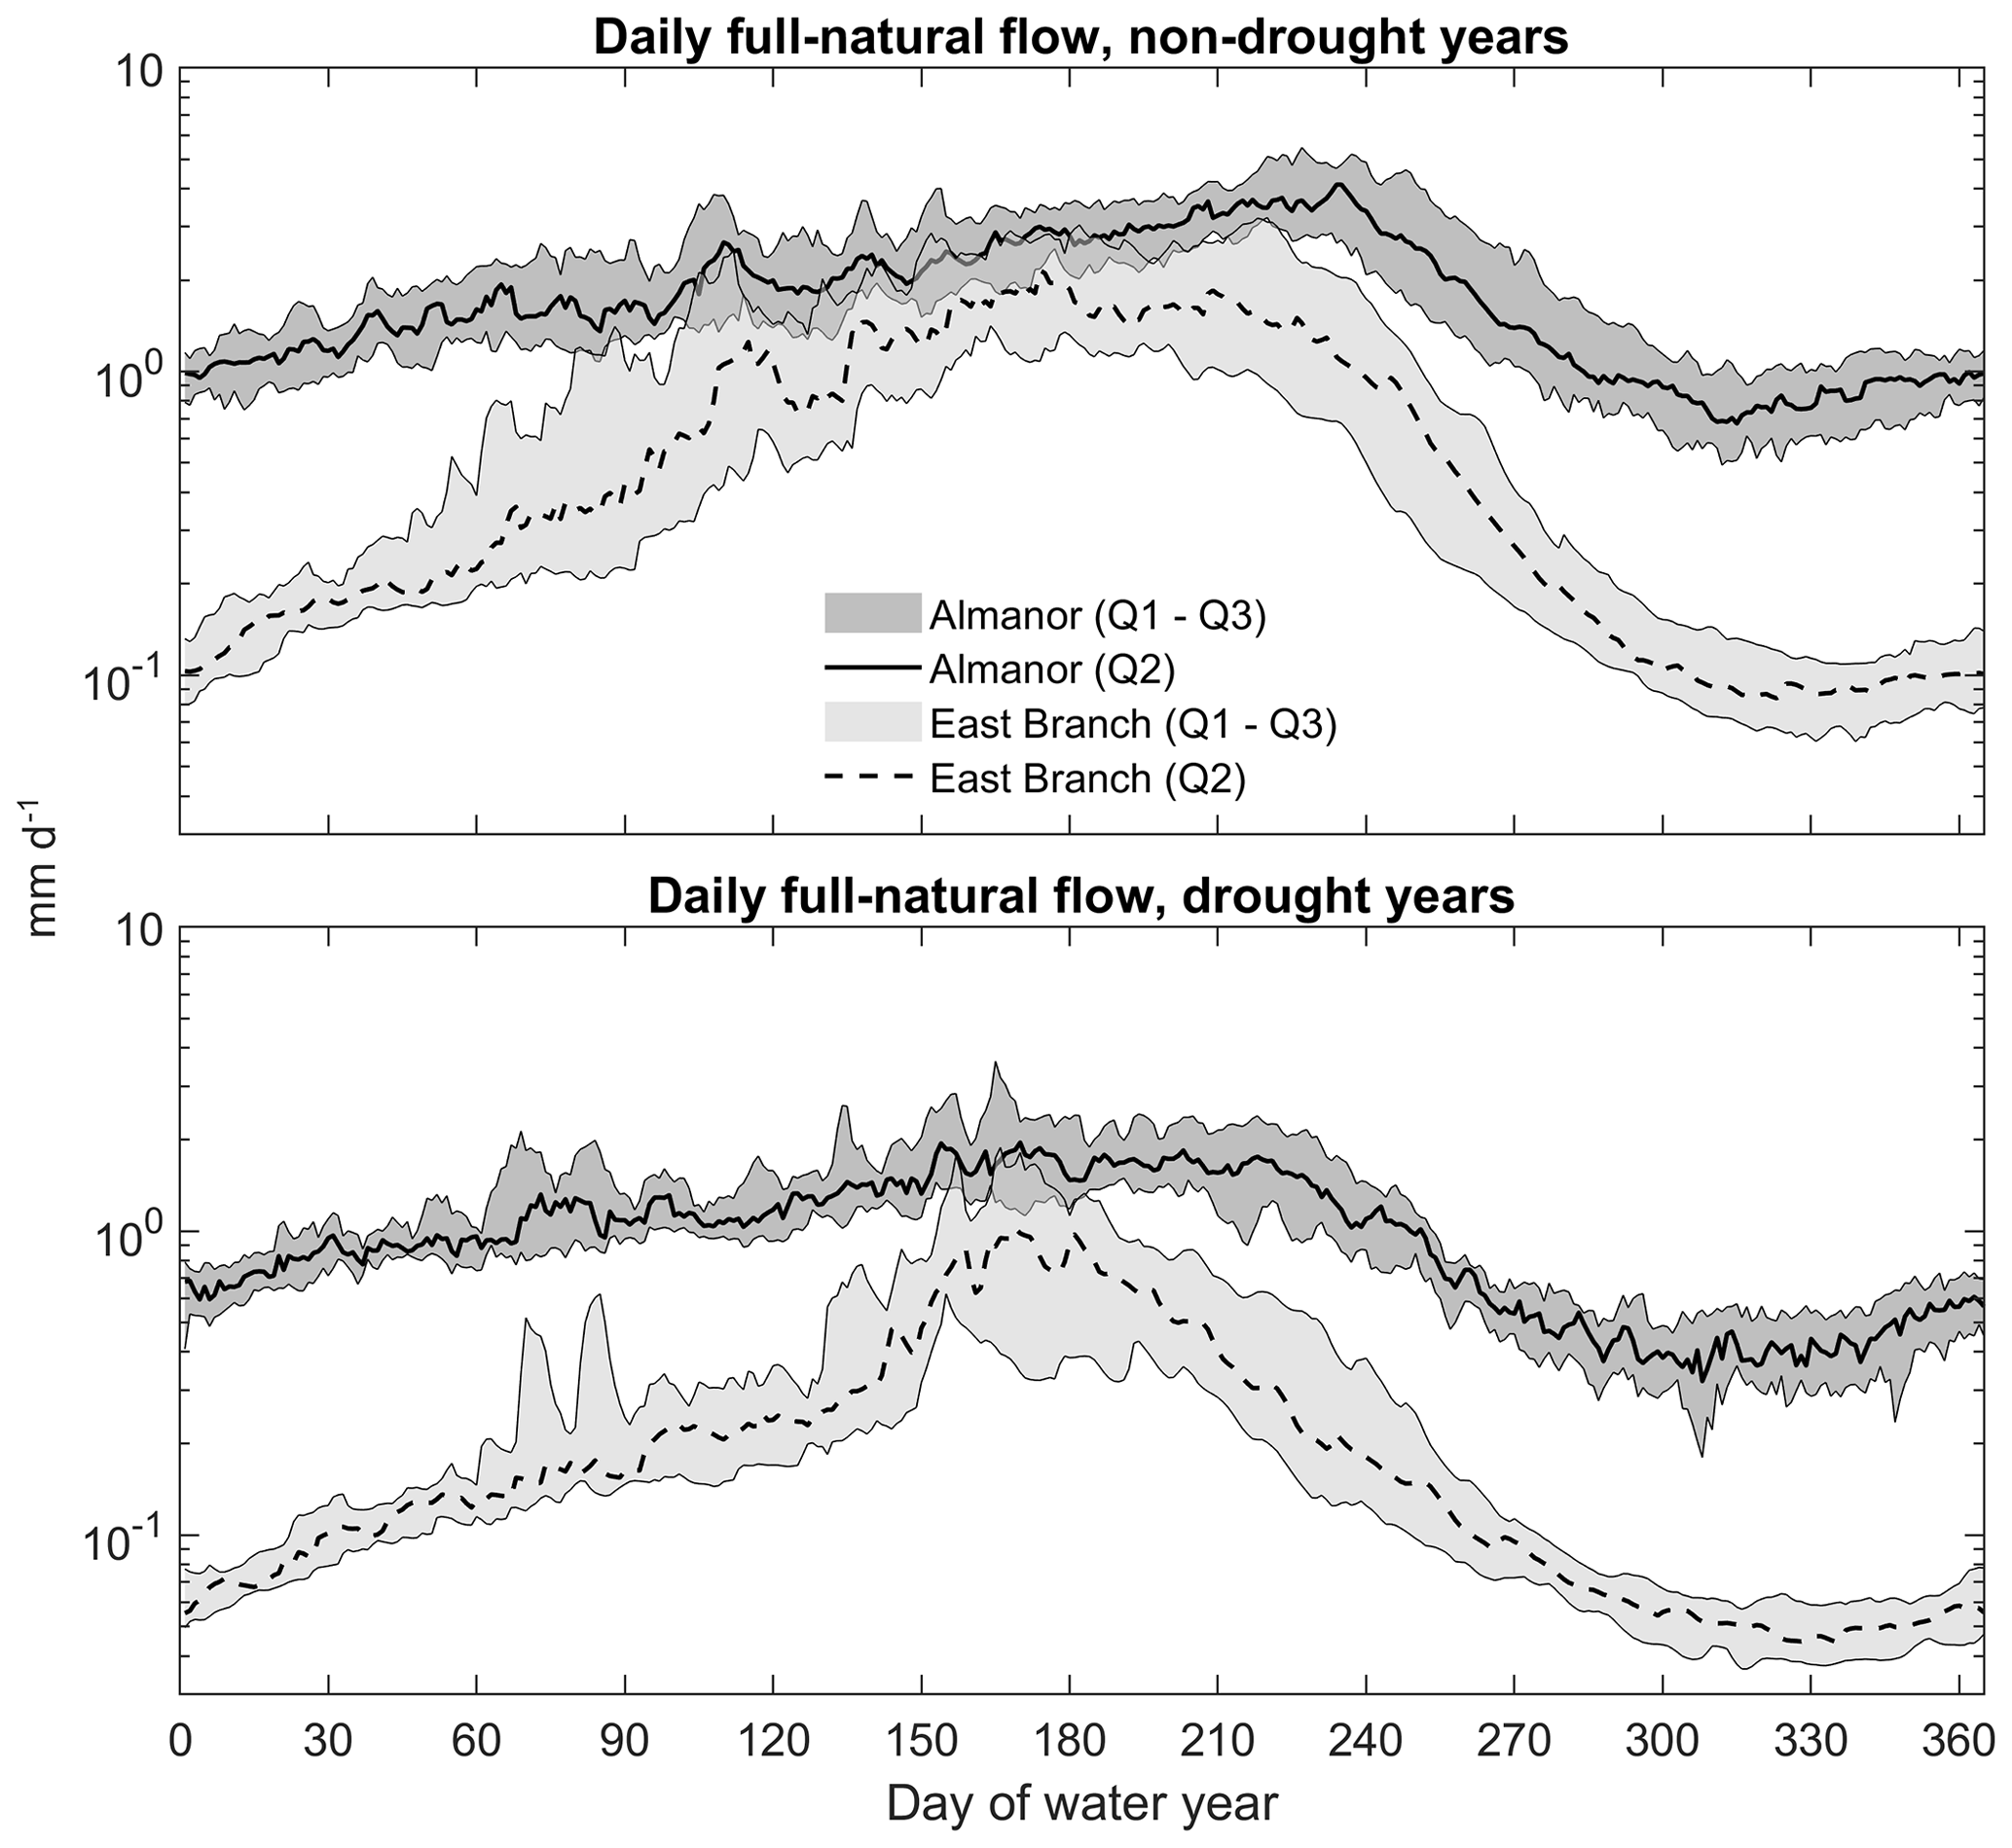
Figure 3Daily median (Q2) and quartiles (Q1 and Q3) of observed full-natural flow during drought and non-drought years at the outlet of two headwater basins of the Feather River with contrasting lithology. The Almanor sub-basin is a predominantly volcanic, subsurface-flow-fed sub-basin; East Branch is transitional to granitic and surface-runoff-dominated. The y axis is in log scale.

Figure 4Precipitation–runoff relationship for drought (red) vs. non-drought (black) years and the three basins under study with complete annual runoff data (Almanor, East Branch, and Feather River at Oroville). The red and grey bands represent 95 % confidence intervals for the regressions. The Box–Cox transformation for annual full-natural flow is introduced in Sect. 2.3.1, Eq. (2).
3.2 Shift in precipitation vs. runoff
The four droughts under study caused a shift in the precipitation–runoff relationship for both the two headwater sub-basins with complete annual data (Almanor and East Branch) and the Feather River at Oroville (Fig. 4). This shift means that the decrease in runoff observed during droughts in these (sub-)basins was larger than what could be explained by precipitation deficit alone (see Sect. 2.3.1 for details about the definition of shift). The 95 % confidence bounds for b1 were −1.49 and −0.38; −2.25 and −1.04; and −1.43 and −0.34, respectively (see Eq. 1 for a definition of b1), implying that this shift was statistically significant for all (sub-)basins. The magnitude of the shift (calculated using Eq. 3) was −18 %, −38 %, and −18 % compared to precipitation partitioning to runoff during non-drought years, respectively. Runoff from the volcanic Almanor sub-basin was thus more resilient to shifts during droughts than that from East Branch, even if shifts were significant in all the (sub-)basins investigated.
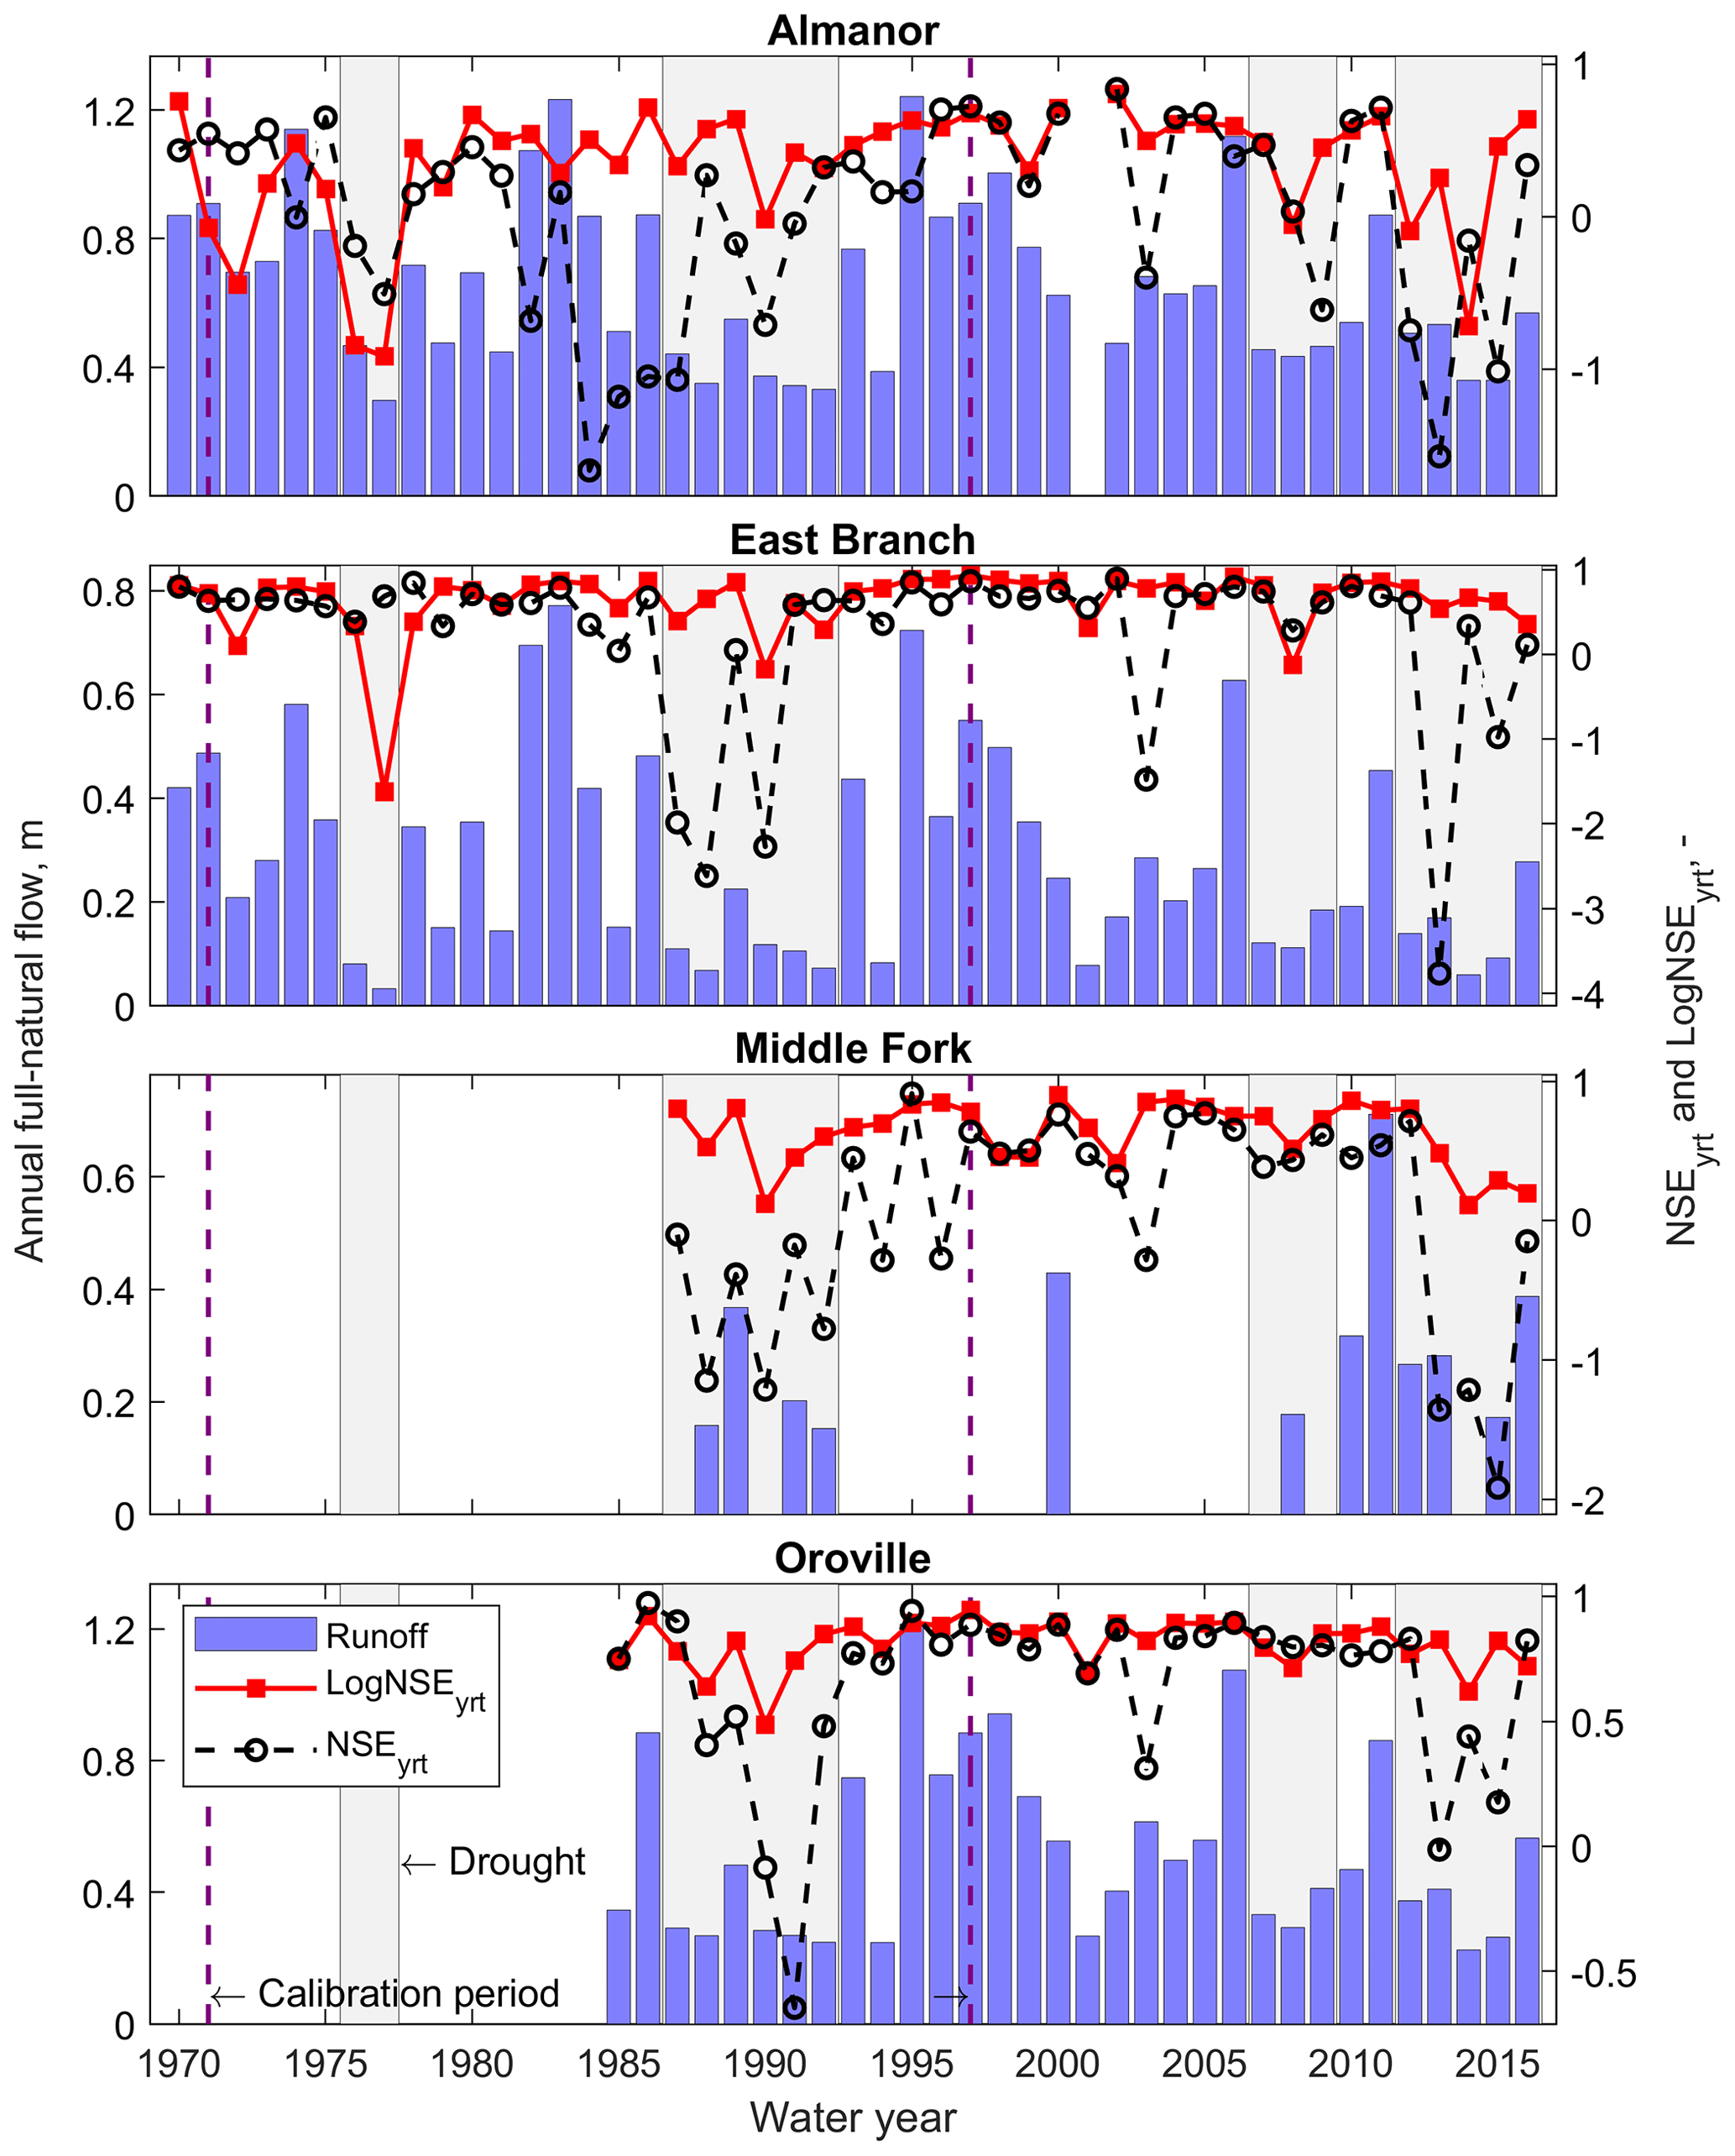
Figure 5Water-year Nash–Sutcliffe efficiency (NSEyrt) and Log-Nash–Sutcliffe efficiency (LogNSEyrt) for PRMS-modeled daily full-natural flow. The blue bars represent observed annual full-natural flow at the outlet of each (sub-)basin.
The magnitudes of these shifts varied from drought to drought and across (sub-)basins (Table 2). In the volcanic Almanor sub-basin, the largest shift corresponded to the 1987–1992 drought (−25 %), the longest in our record. For the surface-runoff-dominated East Branch, the largest shift was caused by the 1976–1977 drought (−51 %), the shortest, driest, and coolest in our record (see again Table 1); in general, this sub-basin consistently showed the largest shift during all droughts across all (sub-)basins. For the Feather River at Oroville, the largest shifts corresponded to the recent 2012–2016 drought and the 1987–1992 one (−21 % and −22 %, respectively; note that no data were available for this basin during the 1976–1977 drought). The 2007–2009 drought showed the smallest shift in all basins under study.
Table 2Estimated shift in the precipitation–runoff relationship for single droughts on the Feather River (see Sect. 2.3.1).

3.3 PRMS performance for streamflow
Both NSEyrt and LogNSEyrt significantly decreased during droughts (Fig. 5). The difference between average NSEyrt and LogNSEyrt during drought vs. non-drought years and the four (sub-)basins was −0.55 and −0.35 (Almanor); −0.99 and −0.39 (East Branch); −0.88 and −0.21 (Middle Fork); and −0.35 and −0.11 (Feather at Oroville). The performance during isolated dry years was better than during droughts (e.g., see water years 1994 or 2001 in Fig. 5). This decline in PRMS performance was comparable between droughts that were part of the calibration period (1970–1997) and those that occurred after 1997.
For the 1976–1977 drought, LogNSEyrt < NSEyrt in both the volcanic Almanor sub-basin and East Branch. NSEyrt is very sensitive to high flows, while LogNSEyrt puts more weight on low flows (Santos et al., 2018): low flows were thus the driver of performance drops during the 1976–1977 drought. In East Branch, NSEyrt during that drought was even comparable to non-drought years. For the 1987–1992 and 2012–2016 droughts, NSEyrt < LogNSEyrt in both the Almanor sub-basin and East Branch: high-flow peaks such as those during intense, winter rain-on-snow events (frequent in these (sub-)basins; see Wayand et al., 2015) or spring snowmelt were thus the main performance driver during these wetter droughts. The performance during the 2007–2009 drought was only slightly below non-drought-year standards. The response time of NSEyrt to droughts in the Almanor sub-basin was somewhat slower than in the other (sub-)basins, a good example being the decadal drop during the 1980s to early 1990s.
Observed annual full-natural flow was generally overestimated during all droughts but the 1976–1977 one, for which PRMS severely underestimated water supply for both the Almanor and East Branch sub-basins (relative biases of −0.44 and −0.86, respectively, Fig. 6). Inter-annual variability in relative bias was larger in the surface-runoff-dominated East Branch and Middle Fork than in the volcanic Almanor sub-basin. The 2007–2009 drought returned relative biases in East Branch and Middle Fork that were in line with non-drought years.

Figure 6Annual relative bias for full-natural flow at the outlet of all (sub-)basins under study (difference between model and observations of cumulative annual full-natural flow, relative to the latter).
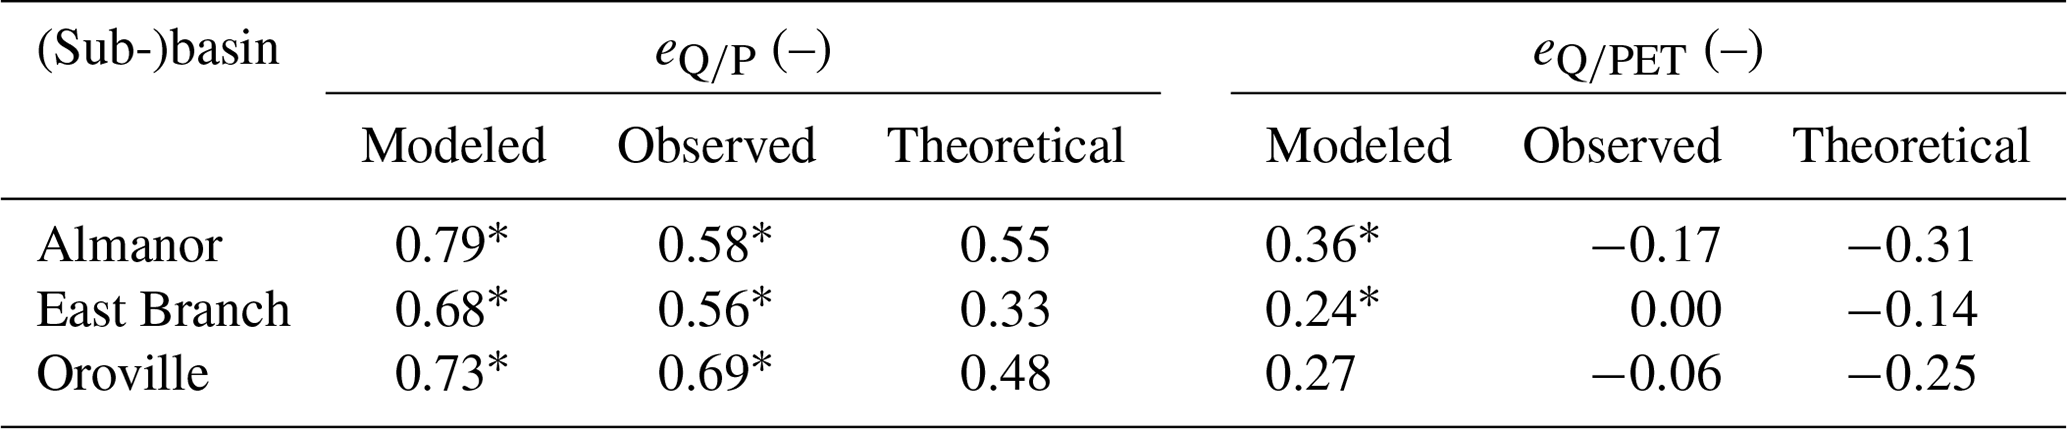
PRMS overestimated the absolute value of climate elasticity of streamflow to both annual precipitation and potential evapotranspiration (Table 3 and Fig. S3). In particular, both observations and simulations showed a statistically significant positive elasticity to precipitation, but observations were closer to the theoretical elasticity according to the Turc–Mezentsev formula. With regard to annual potential evapotranspiration, observations did not show any statistically significant elasticity, whereas PRMS-based elasticity was statistically significant for both the Almanor and East Branch sub-basins. We interpret the fact that modeled eQ∕PET was unexpectedly positive as likely spurious and related to the large scatter and weaker correlations between potential evapotranspiration and modeled full-natural flow compared to precipitation vs. modeled full-natural flow (Fig. S3, univariate correlation coefficient for precipitation and potential evapotranspiration vs. modeled full-natural flow being ∼0.94 and , respectively).
Table 3Modeled, observed, and theoretical climate elasticity of streamflow to annual precipitation (eQ∕P) and potential evapotranspiration (eQ∕PET) for the three (sub-)basins under study with complete annual full-natural flow data. Theoretical elasticity was computed according to the Turc–Mezentsev formula (Andréassian et al., 2016). The asterisk (*) denotes statistically significant elasticity values (that is, the sign of the confidence bounds agrees, 95 % confidence level).
3.4 Observed vs. modeled water balance
PRMS-modeled and PRISM-based basin-wide precipitation was visually in very good agreement, both in terms of annual values and in terms of inter-annual variability (Figs. 7, S4, and S5). This outcome was expected, as PRMS uses PRISM as a starting point to distribute precipitation across the watershed (DRAPER method; see Sect. 2.3.2), which does not significantly affect annual precipitation totals. On the other hand, the model significantly underestimated annual estimated evapotranspiration, even if this underestimation was partially compensated for by the groundwater sink (Figs. 7, S4, and S5). Also, the model systematically underestimated the interannual variability in sub-surface storage. In the Almanor sub-basin and the Feather at Oroville, PRMS also failed to reproduce the estimated multi-decadal decline in storage. While estimated changes in sub-surface storage may suffer from unquantifiable uncertainty across precipitation, full-natural flow, and evapotranspiration, this decline was confirmed by other pieces of evidence collected on the river (such as a decline in spring outflow; see Freeman, 2011) and agrees with a general trend of declining summer low flows in the maritime western US (Cooper et al., 2018).
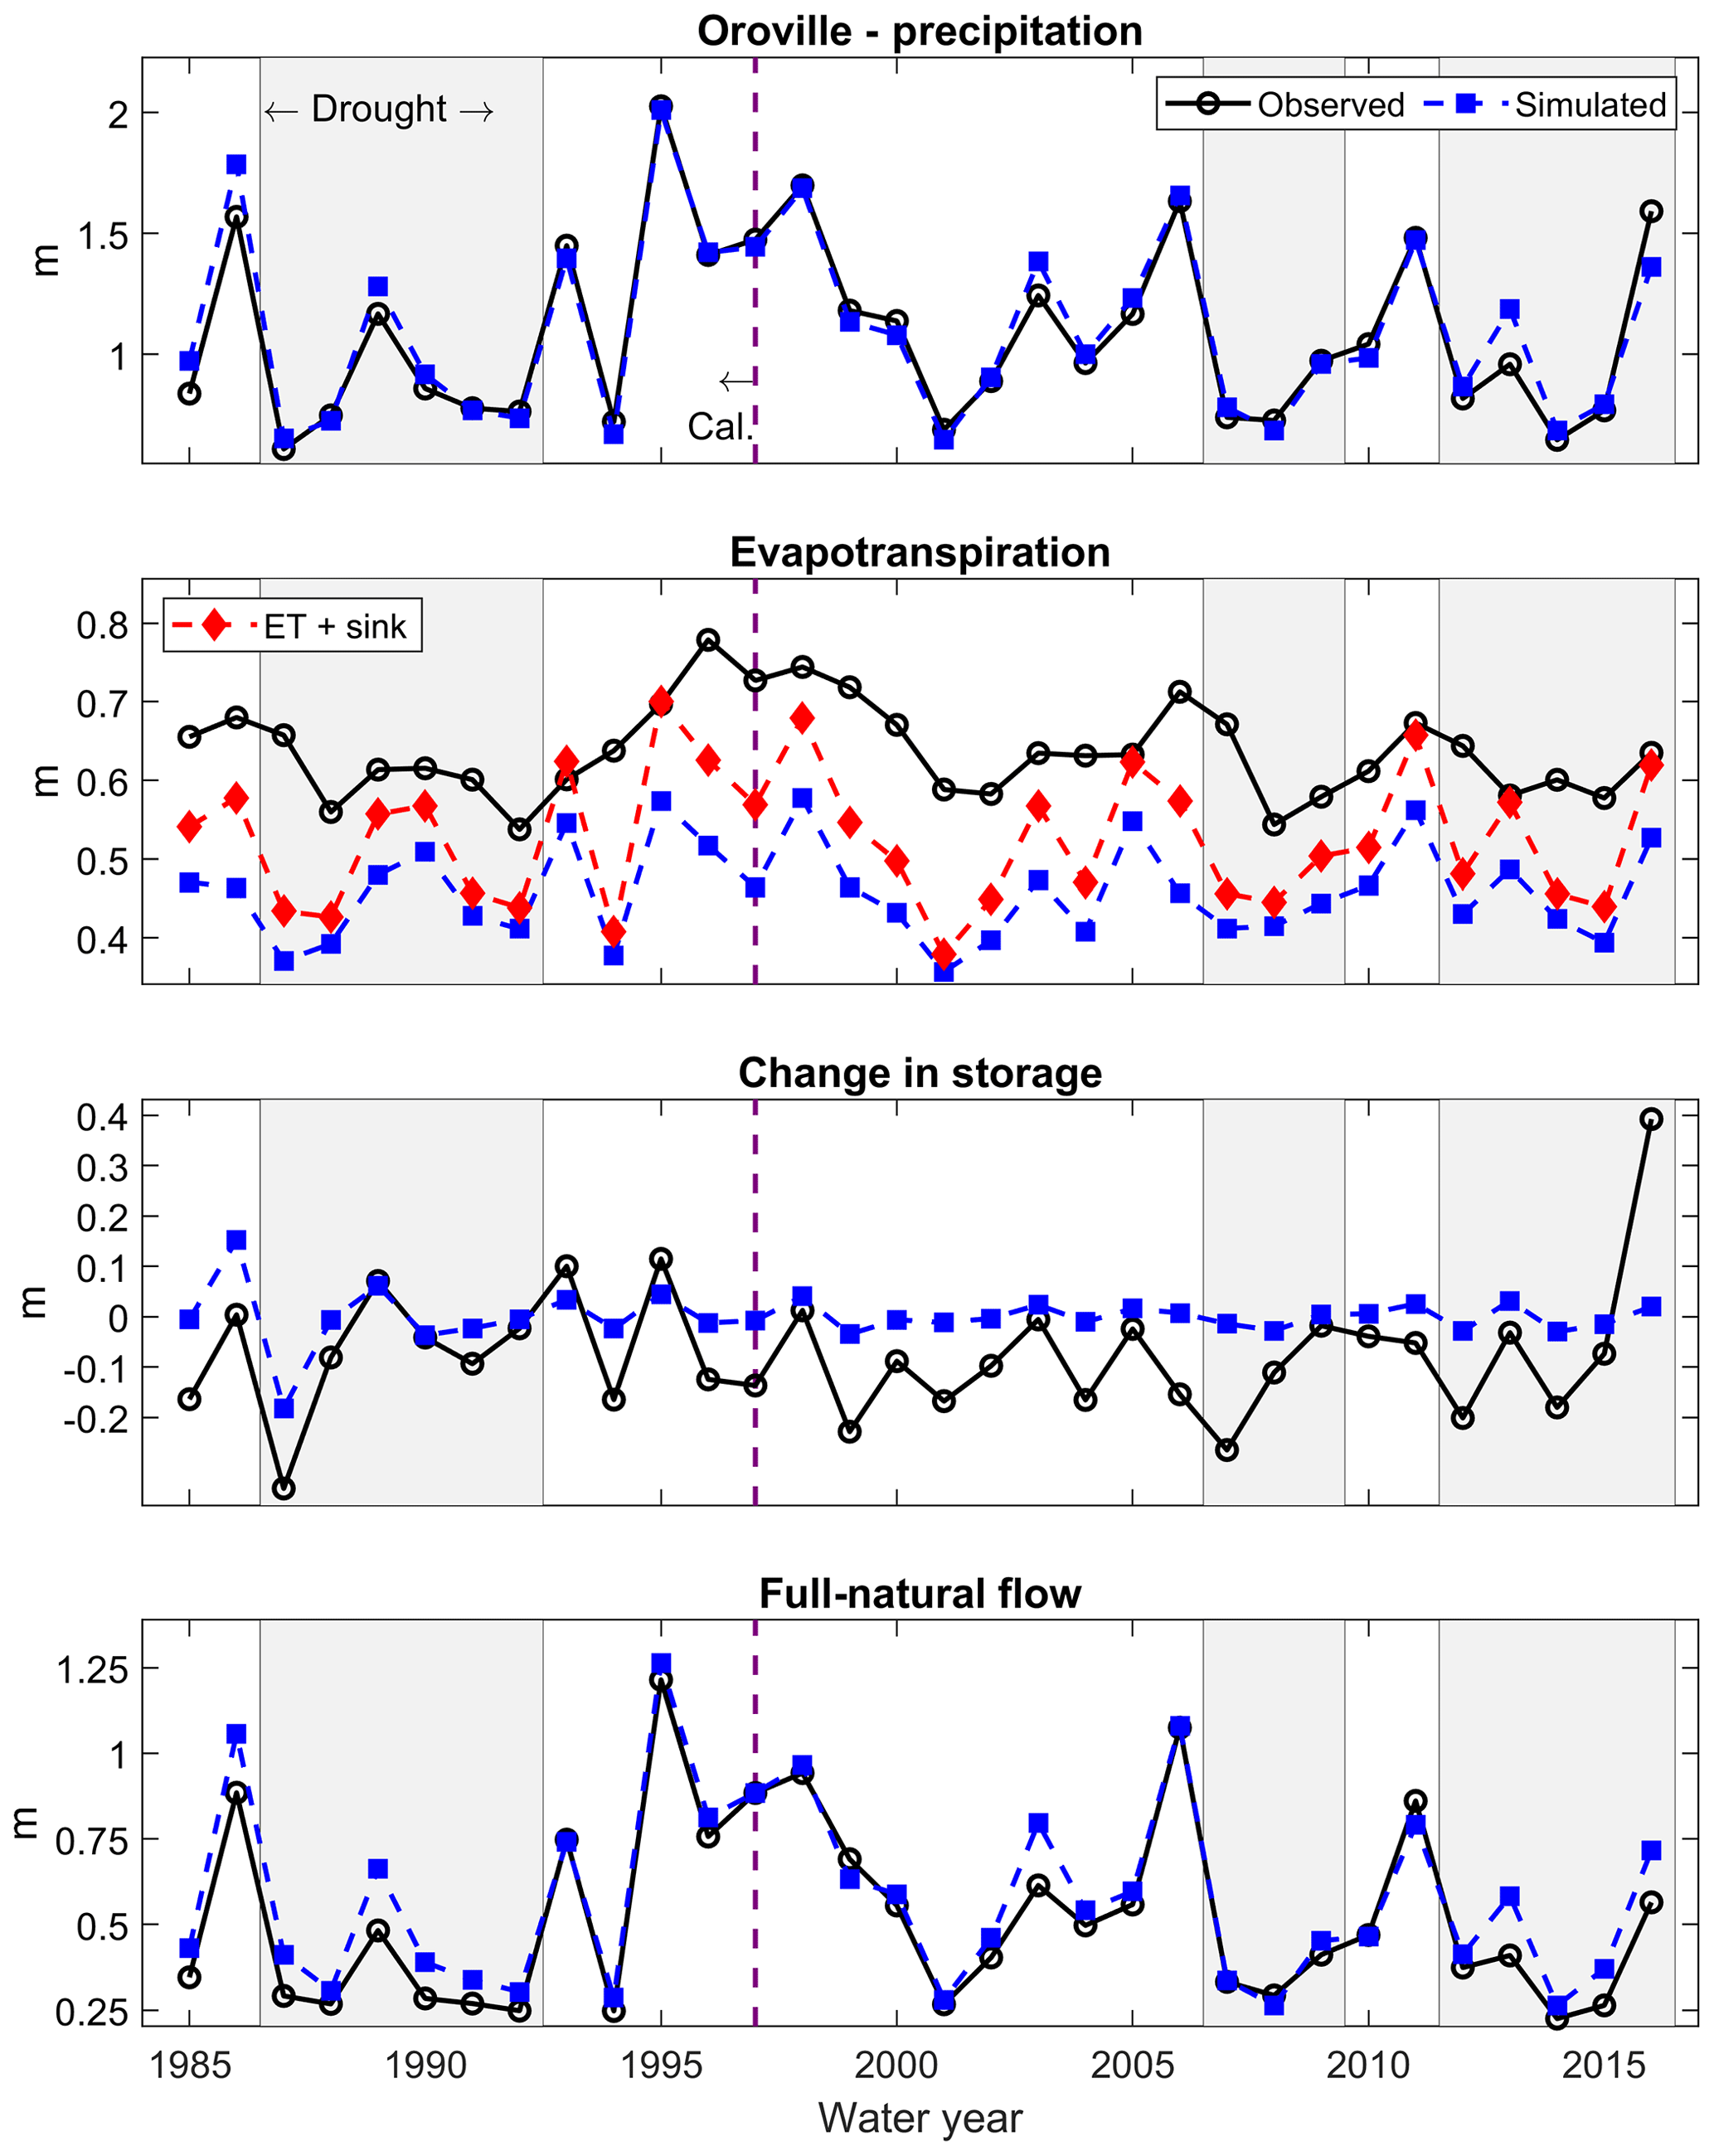
Figure 7Simulated vs. observed annual basin-wide water-balance components (P, ET, ΔS, and Q) for the Feather River at Oroville.
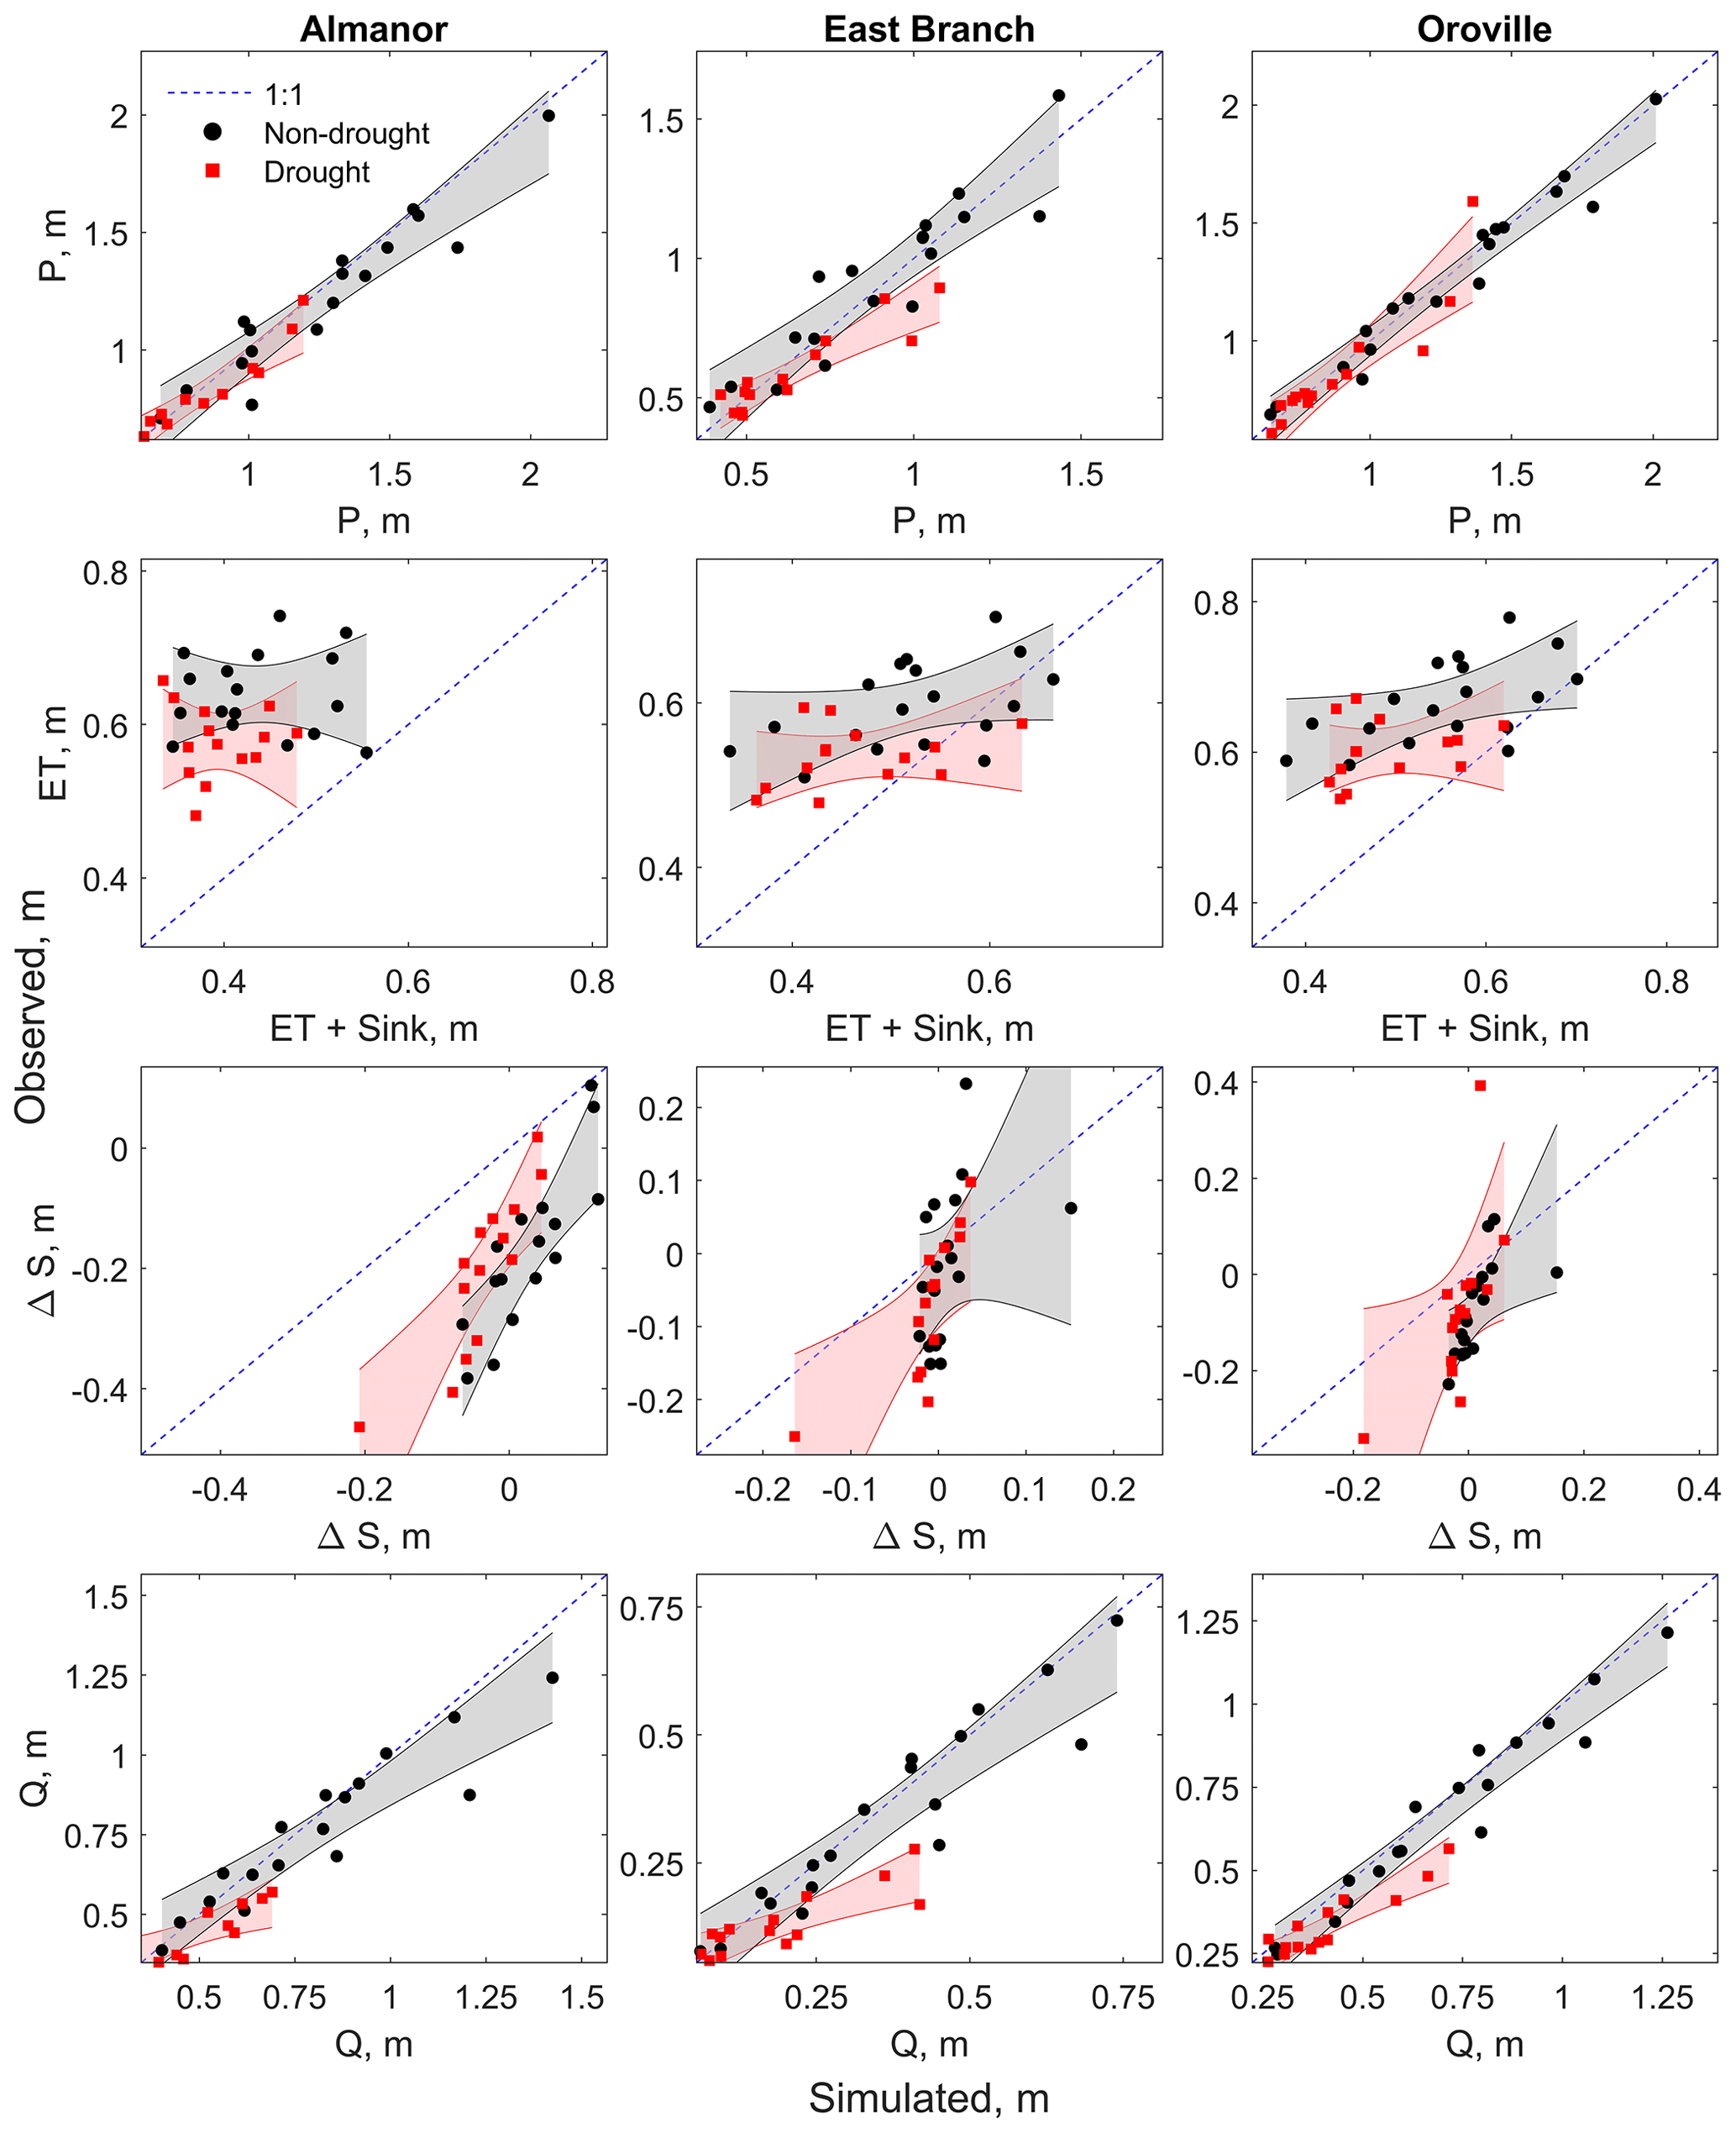
Figure 8Simulated vs. observed annual basin-wide water-balance components (P, ET, ΔS, and Q) separated between drought (red) and non-drought (black) years. Simulated annual ET includes the groundwater-sink mass-flux component (see Sect. 2.3.3). The red and grey bands represent 95 % confidence intervals for the regressions.
Among the three water-balance components determining full-natural flow, ET was the only one for which the performance of PRMS during drought and non-drought years was statistically different in all (sub-)basins (see Fig. 8 and Table 4). Conversely, the performance for precipitation and for changes in sub-surface storage was statistically different in only one sub-basin each: East Branch for P and Almanor for ΔS, respectively. As expected (see Sect. 3.3), differences in PRMS performance for full-natural flow during drought vs. non-drought years were statistically significant in all basins. Thus, ET was the only water-balance component (besides Q) that was systematically misrepresented during droughts.
Table 4Regression between observed and simulated water-balance components: confidence bounds of the regression parameter ruling shifts in performance during droughts (see Eq. 4). ET is the sum of ET and the groundwater sink (see Sect. 2.3.3). The asterisk (*) denotes statistically significant elasticity values (that is, the sign of the confidence bounds agrees, 95 % confidence level).

The statistically different performance of PRMS for ET during droughts was confirmed even when comparing simulated and observed average ET (including groundwater sink) over temporal windows of 2, 3, and 4 years (see Fig. S6), which may be more appropriate timescales for this evaluation because of the possible temporal lag between vegetation greenness and ET (Goulden et al., 2012). Results in Fig. 8 and Table 4 were also confirmed when only considering ET rather than the sum of ET and the groundwater sink (see Fig. S7 and Sect. 2.3.3 for details about the groundwater sink).
Multi-year droughts can trigger shifts in the precipitation–runoff relationship, which is the fundamental partitioning rule of a basin's water budget (Saft et al., 2015, 2016a, b; Tian et al., 2018). By showing that ET is the only water-balance component yielding statistically different performances during drought vs. non-drought years for a hydrologic model (PRMS), we quantitatively demonstrated that ET–drought feedback mechanisms are the likely driver of these shifts in water supply. Failure to fully account for these non-linear mechanisms results in the predictive inaccuracy of the model during droughts. We focused on mixed rain–snow basins with asynchronous precipitation and growing seasons, thus extending the climatic range of previous drought studies that identified shifts in precipitation–runoff relationships of comparable magnitude in rainfall-dominated semi-arid areas (Saft et al., 2015; Tian et al., 2018, and references therein).
If and where shifts in the precipitation–runoff relationship occur, runoff will decrease more than what would be predicted based on a precipitation–runoff relationship trained using non-drought years (Saft et al., 2016b). With hydrologic models that are often biased toward better reproducing high flows (Staudinger et al., 2011) and climate-change scenarios that predict increasing aridity in several regions of the world (Cayan et al., 2010), understanding the mechanisms behind these shifts and the predictive skill of models under such conditions has profound implications for water resource management and water security. In this section, we elaborate on three of these implications: first, are shifts in precipitation vs. runoff common across all basins of the Sierra Nevada? Second, how do ET–drought feedback mechanisms cause shifts in the water balance? Third, what are the lessons learned to improve water-supply simulations in drought-prone regions?
4.1 Are shifts in precipitation vs. runoff common across the Sierra Nevada?
Sierra Nevada lithology transitions from crystalline igneous intrusive rocks (granitic) in the southern and central Sierra Nevada to more porous igneous extrusive rock in the northern Sierra Nevada. In the Feather River, northern Sierra Nevada, the Almanor sub-basin is comprised of extrusive igneous bedrock and is subsurface-flow-dominated, whereas the East Branch sub-basin is transitional to granitic rock and is surface-runoff-dominated. Shifts in the precipitation–runoff relationship in response to droughts occur in both sub-basins. This may seem counterintuitive as the Almanor sub-basin has a relatively small inter-annual variability in low flows (Fig. 3), similar to other subsurface-flow-dominated basins (Jefferson et al., 2008; Tague et al., 2008; Cooper et al., 2018). Both the Almanor and East Branch sub-basins, however, are rain-shadowed (aridity index of ∼1.5 and 1.1, respectively). Pre-drought aridity is the most important predictor of shifts according to Saft et al. (2016b). This highlights that a higher summer flow does not necessarily provide resiliency to shifts in precipitation vs. runoff during droughts. Still, the Almanor sub-basin has been more sensitive to longer droughts than the East Branch sub-basin. This behavior may be related to the comparatively long time needed by groundwater-flow-dominated, slow-draining basins to respond to a superficial precipitation deficit (Cooper et al., 2018).
To test the sensitivity of western slope Sierra Nevada rivers to shifts in precipitation–runoff relationships in response to droughts, we extended our analysis to the 12 other major rivers. We found that 9 of these 12 basins showed statistically significant shifts, on the order of −20 % to −10 % (Fig. 9 and Table S4, water years 1985–2018, data from PRISM and https://cdec.water.ca.gov/, last access: 19 July 2019). The magnitudes of these shifts are comparable to previous studies, −24 % on average in 18 rivers in China (Tian et al., 2018) and a mode between −40 % and −20 % in Australia (Saft et al., 2016b). The basins that did not show a statistically significant shift were the relatively small, low-elevation Tule basin and two other southern basins, the Kaweah and the Kern (see a map and a summary of hydrologic characteristics of each basin in Harrison and Bales, 2016). While the Kaweah and the Kern have high-elevation, snow-dominated headwaters, they also have significant rain-modulated low-elevation areas. This suggests that some mixed rain–snow, Mediterranean basins in which rain plays a prominent role in the annual water budget are less prone to shifts in the precipitation–runoff relationship. In the snow-dominated basins where a significant shift is observed, snowmelt replenishes sub-surface storage later into the dry season and thus limits the dependence of evapotranspiration from deep sub-surface storage (Rungee et al., 2018), a key mechanism that reduces low-flow elasticity to climate variability (Cooper et al., 2018) and that is greatly reduced during longer droughts.
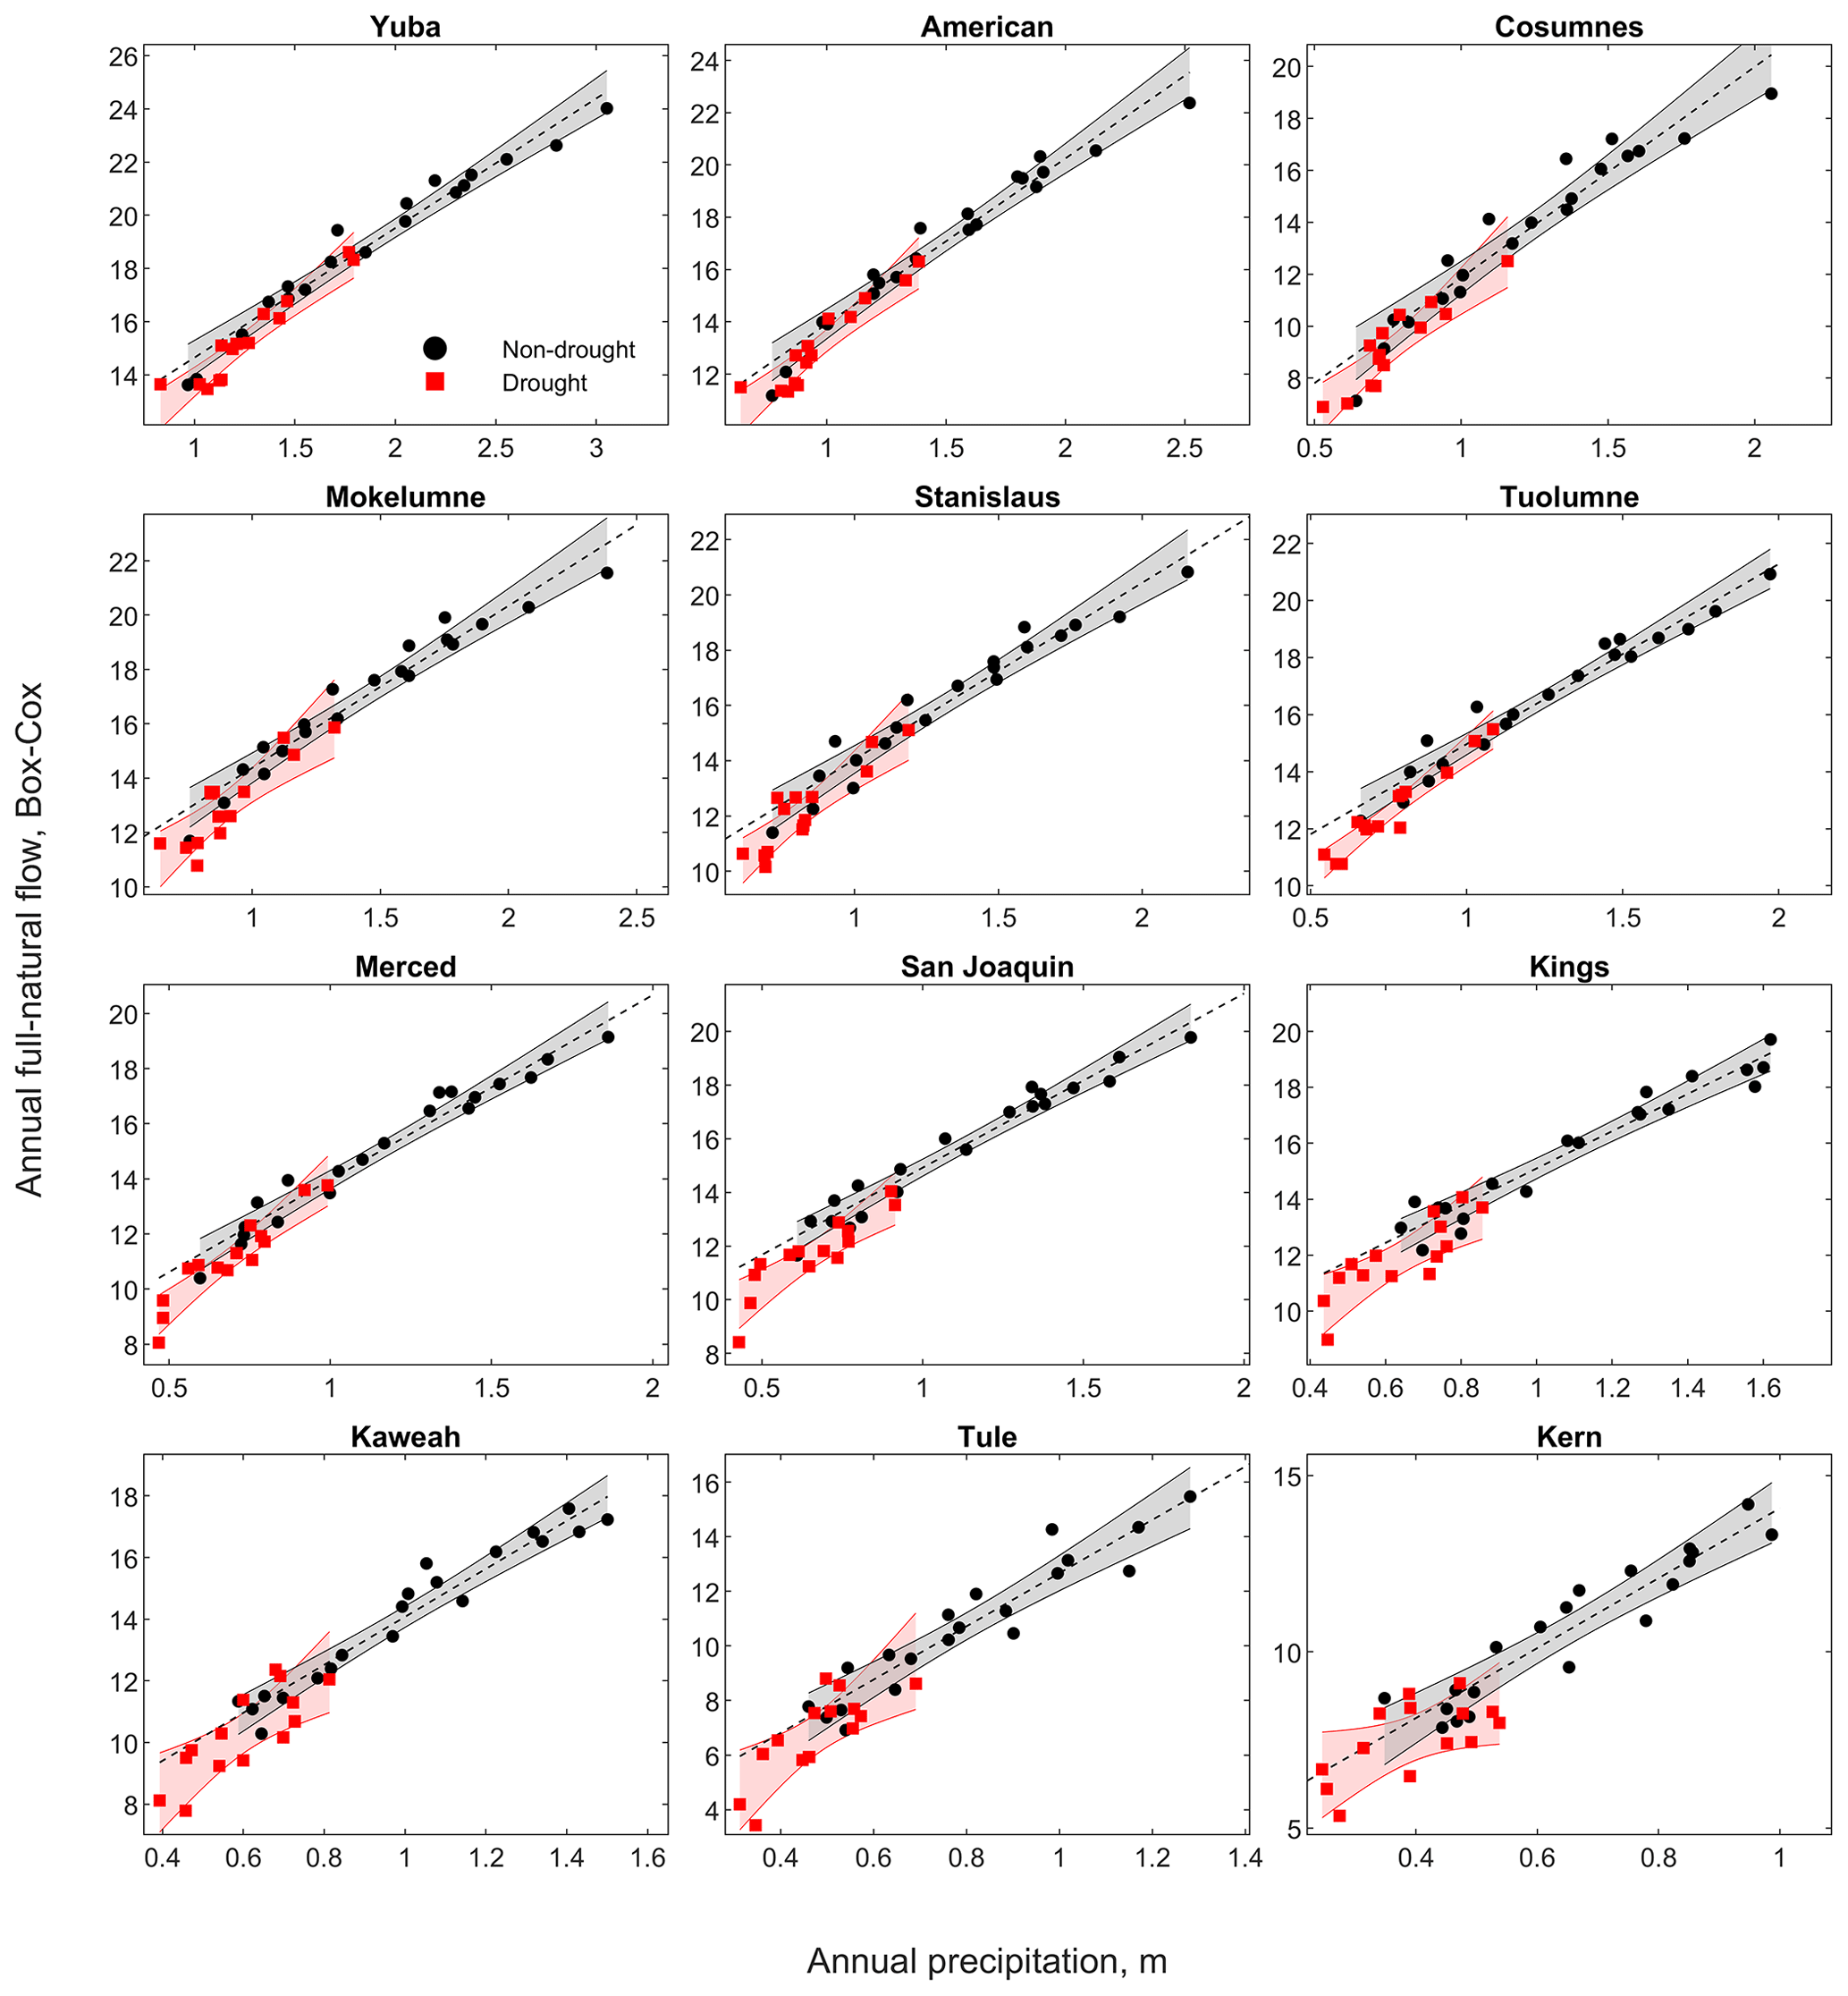
Figure 9Precipitation–runoff relationship for drought (red) vs. non-drought (black) years and the 12 (main) basins draining the western side of the Sierra Nevada to the California Central Valley in addition to the Feather River. Panels are organized by the most northern river in the upper left to the most southern river in the lower right. The red and grey bands represent 95 % confidence intervals for the regressions.
4.2 Climate elasticity of ET and hysteresis of the precipitation–runoff relationship
Annual PRMS errors for basin-wide ET were manifest in both a systematic bias (∼110 mm less simulated ET than observed) and an annually variable component (Fig. 7; results refer to the Feather at Oroville). The systematic bias could be explained by an underestimation of plant-accessible water storage, a recurring source of uncertainty in the Sierra Nevada (Klos et al., 2018). Like any hydrologic model that is calibrated on streamflow, the annual performance of PRMS for Q is relatively insensitive to systematic biases in internal fluxes like ET, as these can be offset by other fluxes during calibration (a good example being the groundwater sink). This means that the drop in modeling accuracy during droughts and its relationship with shifts in the precipitation–runoff relationship is related to the second component of the error (the annually variable one). This second component of the error was visually well correlated with annual precipitation and, in particular, with wetting–drying cycles (Fig. 10a). The model generally overestimated ET during wetting cycles and underestimated it during drying cycles, which suggests that the model did not realistically represent the buffered response of ET to precipitation variability, a property that we refer to as the climate elasticity of evapotranspiration and that emerges as a driver of water supply in a Mediterranean climate (Bales et al., 2018).
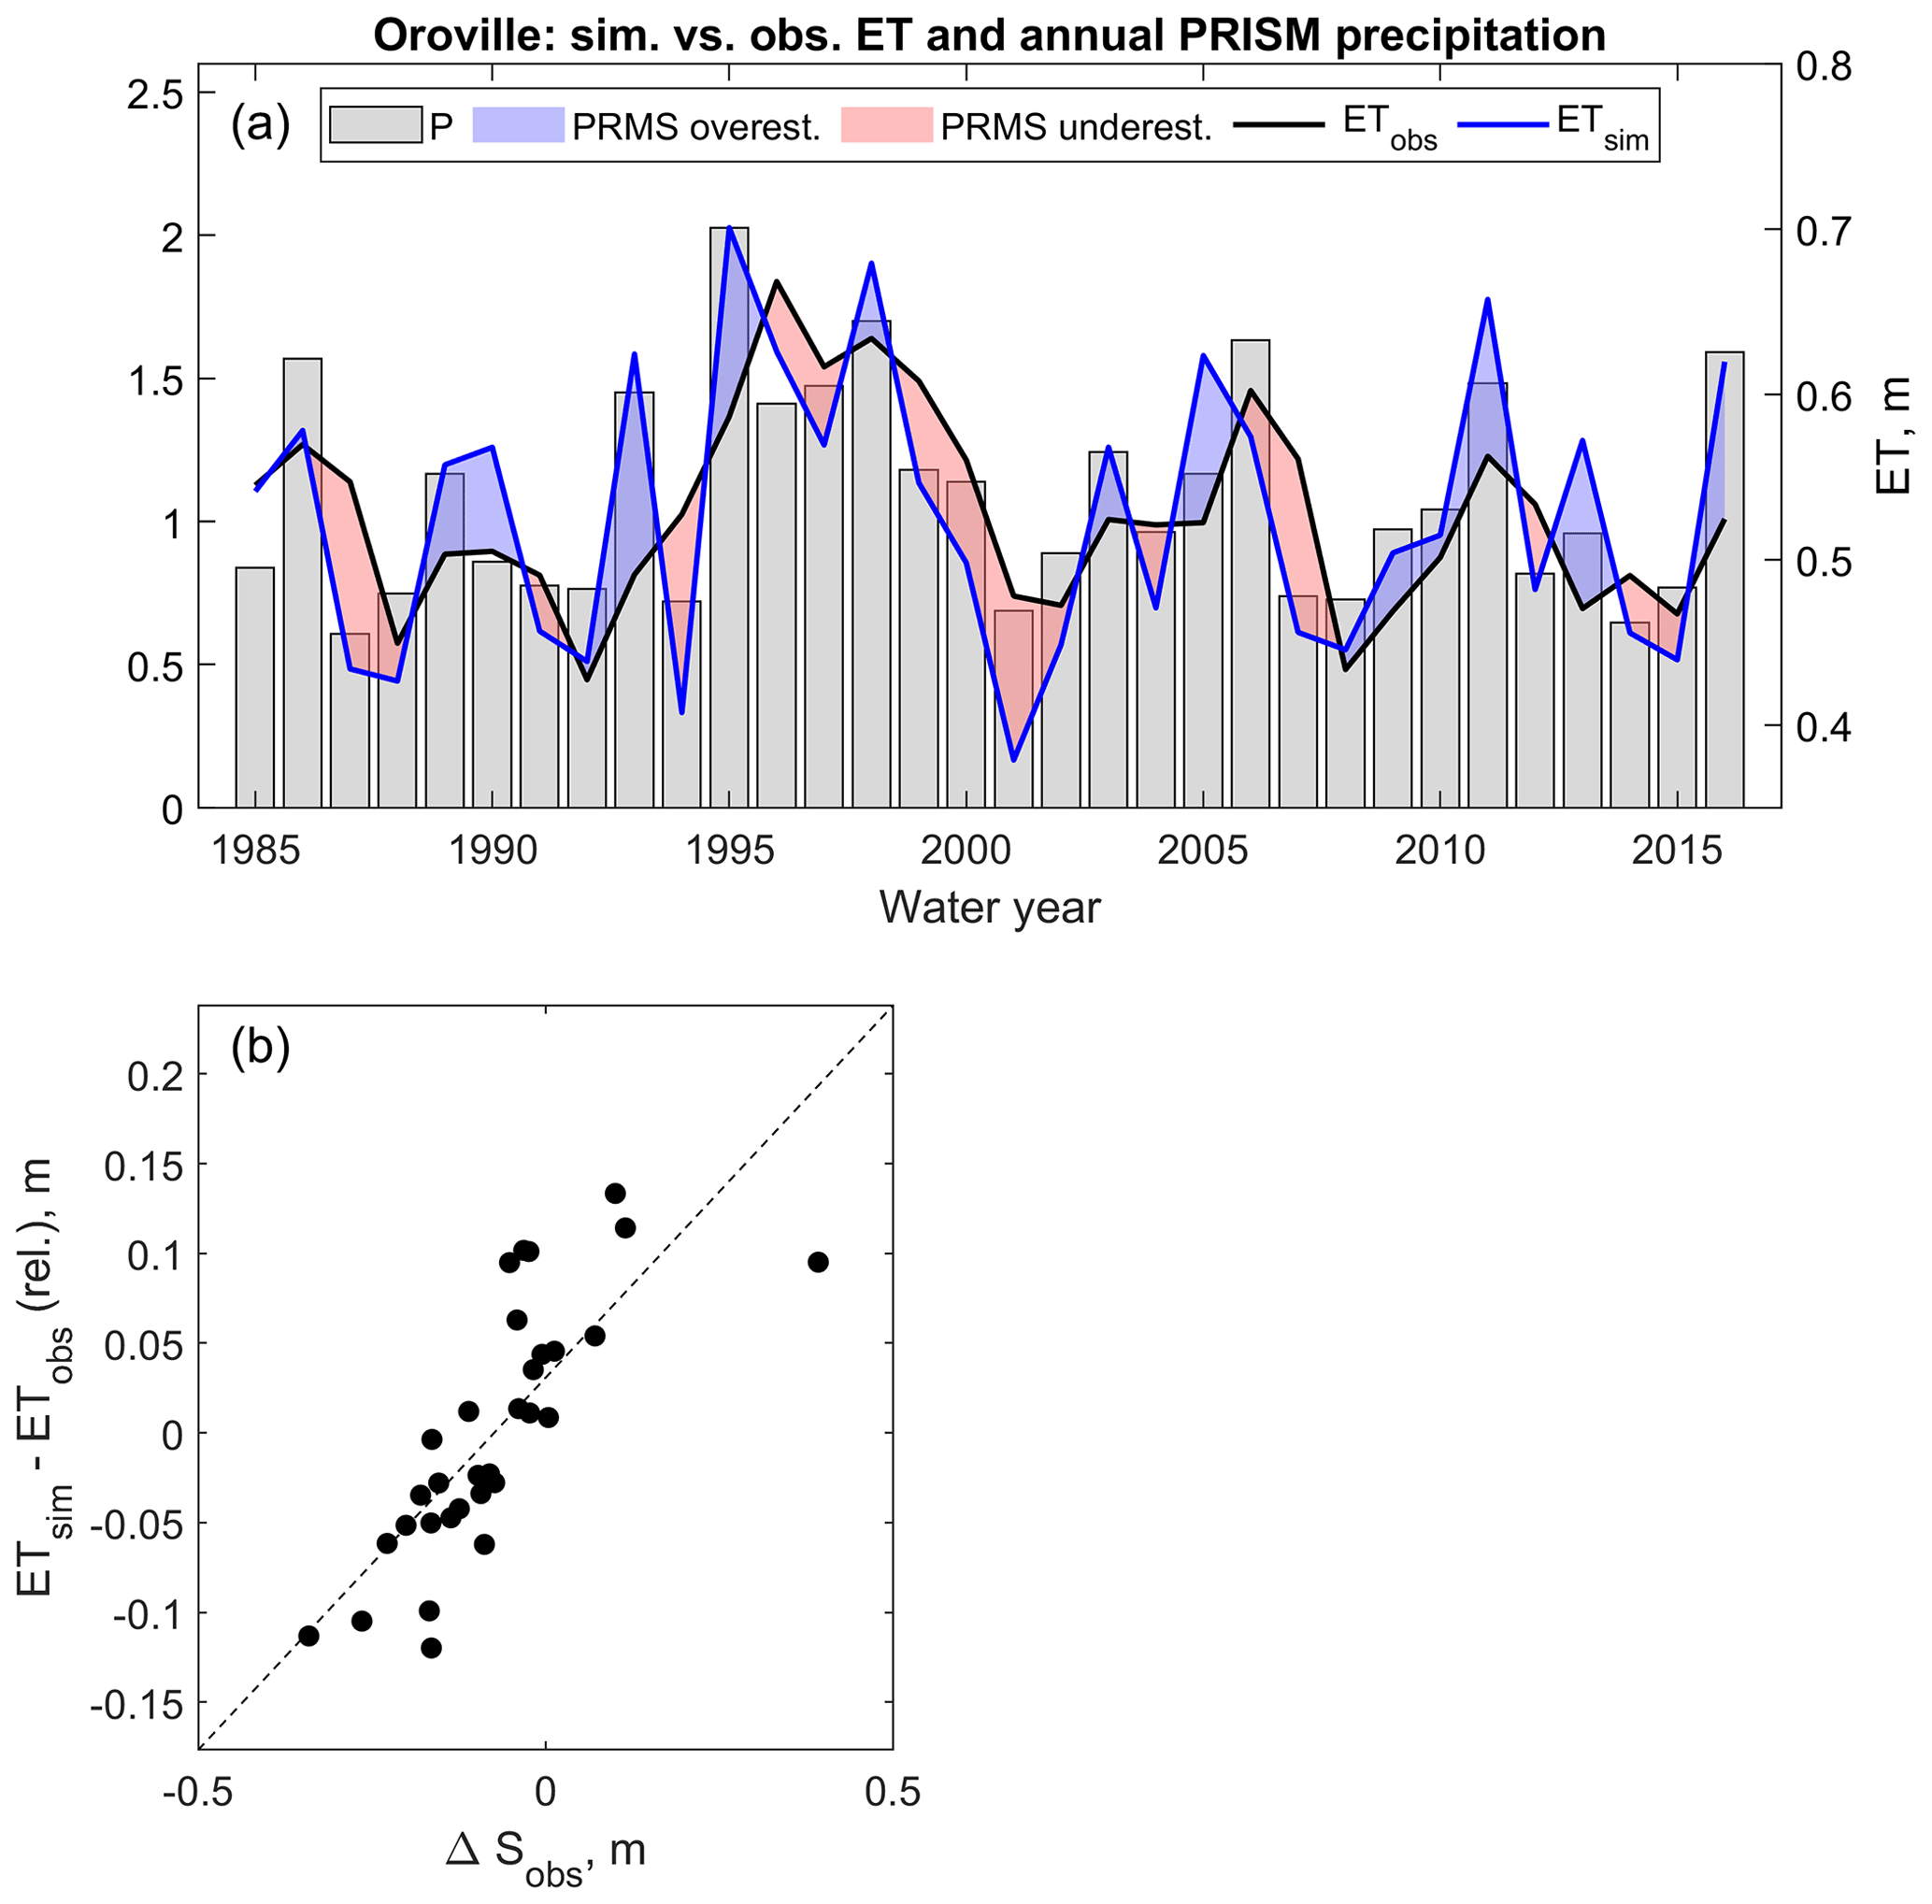
Figure 10(a) Simulated and estimated annual basin-wide evapotranspiration for the Feather River at Oroville (lines) and annual precipitation according to PRISM (bar chart). (b) Annual differences between simulated and estimated basin-wide evapotranspiration as a function of estimated change in subsurface water storage. The absolute value of the systematic bias between simulated and observed basin-wide evapotranspiration (∼110 mm; see Fig. 7) was subtracted from observed values for readability. Simulated annual evapotranspiration includes the groundwater-sink mass-flux component (see Sect. 2.3.3).
Bales et al. (2018) identified three sources of conceptual uncertainty about how models simulate evapotranspiration, which link back to the five mechanisms altering ET and ΔS during and after droughts outlined in the Introduction. The first is the oversimplification of regolith storage and rooting depth and thus misrepresentation of plant-accessible water storage (see also Rungee et al., 2018). The second is a lack of proper parametrization of the feedback between evaporative demand and stomatal closure. The third is the representation of vegetation as a static layer with no dynamic response to stresses. Across the Feather at Oroville, differences between estimated and simulated ET were well explained by estimated changes in storage (r=0.78; see Fig. 10b). The modeling missing piece behind the misrepresentation of climate elasticity of evapotranspiration and therefore behind the observed shifts in the water balance was thus the multi-year carryover of soil-water storage. This storage is a critical drought-resilience source, buffering ET temporal patterns from the lack of precipitation through the accumulation of plant-accessible water during wet periods and drawdown during dry periods (Fellows and Goulden, 2017; Klos et al., 2018). This buffering process was not reproduced by the model, likely because it miscaptured the magnitude and distribution of regolith moisture. This led to an underestimation of inter-annual variability in ΔS for all (sub-)basins (Fig. 7) and an overestimation of streamflow elasticity to precipitation (Table 3) as a result.
Interactions between ΔS and ET thus emerge at the ultimate cause of shifts in the water balance of mixed rain–snow, Mediterranean regions during droughts. Reinterpreting shifts as evidence of hysteresis in the precipitation–runoff relationship yields a process occurring in four distinct phases (Fig. 11). During the initial stages of a drought, multi-year carryover from previous wet periods can compensate for missing precipitation input, a mechanism that offsets ET deficit and therefore maintains proportionality between precipitation and runoff (phase 1; see Fig. 11). This offsetting mechanism is predominant during an isolated dry period, while during a prolonged drought drawdown leads to soil-water depletion and an associated drop in runoff due to preferential partitioning of surface water to ET (Bales et al., 2018); this ultimately leads to coevolution processes such as tree mortality (Troch et al., 2015; Bales et al., 2018) – phase 2. With the loss of buffering capacity, water basins will respond to precipitation according to a different precipitation–runoff relationship (phase 3) because of a different partitioning of P across ET, Q, and ΔS. Recovery during following wet periods will eventually lead to other coevolution processes such as vegetation expansion, which will possibly restore the initial precipitation–runoff relationship (phase 4, end of hysteresis).
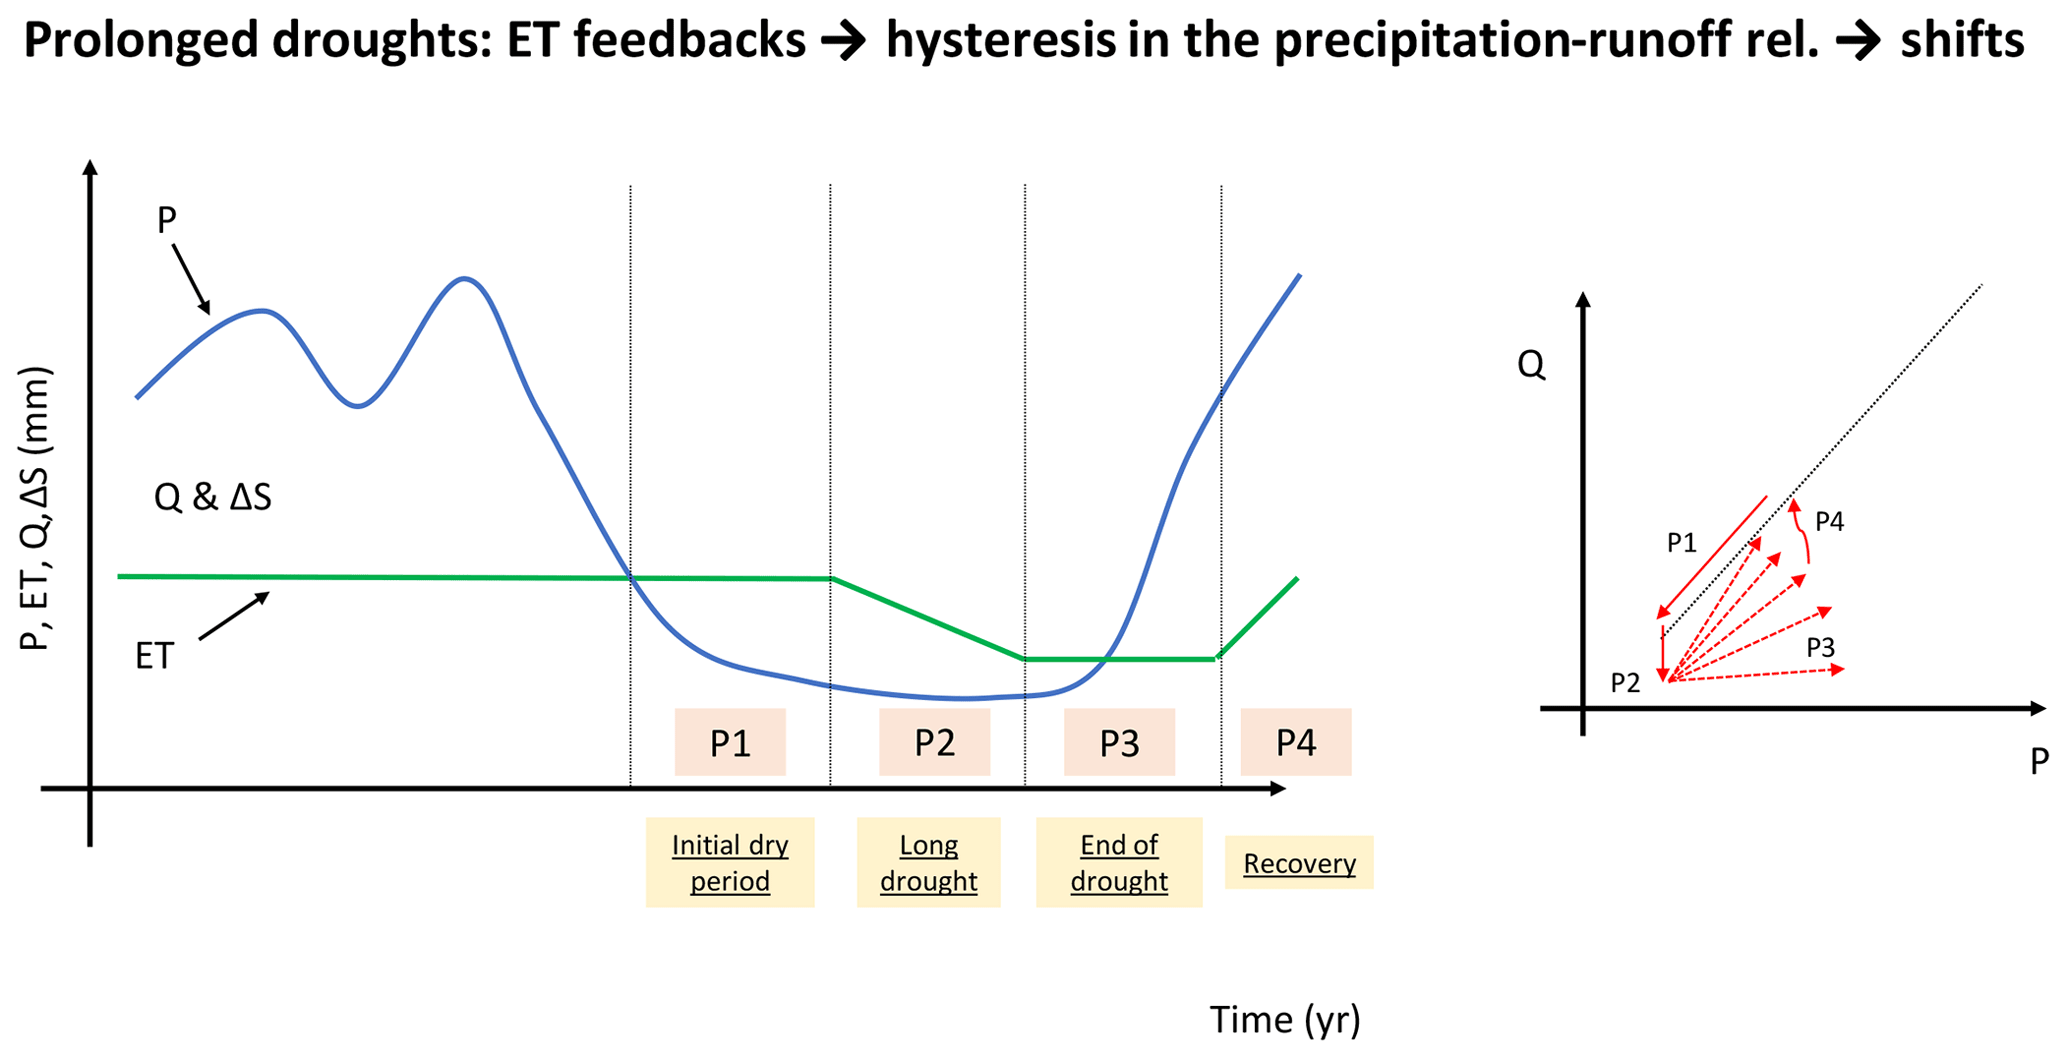
Figure 11Schematic of ET response to climate variability and its effect of the precipitation–runoff relationship. ET is initially approximated constant with time due to its significantly smaller variability than precipitation (Bales et al., 2018; Orth and Destouni, 2018). Details on the four phases of precipitation–runoff hysteresis (P1 to P4) are discussed in Sect. 4.2.
The role that these four phases of ET elasticity play in driving precipitation–runoff hysteresis has never been investigated in a systematic way, but recent Critical Zone studies in the Kings River, California, show that this was the predominant mechanism controlling water-supply changes during droughts (Bales et al., 2018). We believe them to apply to the higher-precipitation, transition lithology of the Feather River basin and across the Sierra Nevada. Recent pan-European studies have also showed persistence of ET for longer temporal scales than runoff during droughts (Orth and Destouni, 2018), while modeling studies across the European Alps have showed that ET can even increase during droughts if air temperature increases (Mastrotheodoros et al., 2020). Better understanding hysteresis in the precipitation–runoff relationship is, therefore, a priority of future work, especially in a warming climate.
4.3 How to achieve more robust runoff predictions during droughts?
The conceptual uncertainty source outlined in Fig. 11 is a common feature among hydrologic models that traces back to fundamental knowledge gaps in critical-zone science (Klos et al., 2018), including their tendency to systematically underestimate multi-year carryover of soil-water storage and therefore miscapture interannual variability in subsurface flow (see Fig. 7 and Fowler et al., 2020). Thus, predictions of hydrologic models during droughts should be interpreted with caution.
While Chiew et al. (2014) hypothesize that more observations could improve the performance of models during droughts, we found that the accuracy of PRMS for droughts during the calibration period was similar to that for droughts outside it. More measurements of the water balance in mountain regions could help better parametrize climate elasticity of evapotranspiration and multi-year carryover of soil-water storage, thus unraveling the role that these mechanisms play in buffering the impact of precipitation deficit on runoff during droughts and supporting improved process representations.
Shifts in the precipitation–runoff relationship of snow-dominated regions are critical because in these contexts snow plays a key role in both water supply and its seasonal predictability. In the western United States, water-supply forecasts are based on statistical regressions across full-natural flow, precipitation, and snowpack accumulation (Pagano et al., 2004; Rosenberg et al., 2011; Harrison and Bales, 2016). These forecasts play a key role in water resource allocation across industrial and agricultural uses as well as freshwater supply (Harrison and Bales, 2016). While using runoff-to-date as a predictor and fitting different regression coefficients for different year types may partially correct for runoff deficit, these regressions do not explicitly account for shifts in precipitation–runoff relationships during droughts (Harrison and Bales, 2016). Since shifts in precipitation–runoff relationships are common across the Sierra Nevada (Fig. 9), we suggest embedding a shift predictor into these regressions as done in Eq. (1) as the next step to improve water-supply forecasts.
The underestimation of runoff during the 1976–1977 drought disagrees with the general consensus that these models tend to overestimate water supply in regions where droughts shift the precipitation–runoff relationship (Saft et al., 2016a; Tian et al., 2018). Water year 1977 was still the driest among the 114 years on record for California in 2015 (DWR, 2015), and it was the last of 3 years of consecutively decreasing precipitation (Fig. 2). Dry periods may lead to a disconnection between soil and groundwater storage, which in turn may prevent recharge and favor direct surface runoff and interflow (see Lange and Haensler, 2012; Saft et al., 2016b, and references therein). This condition and the subsequent slower-than-expected recovery of soil-water storage (Sowerby et al., 2008) are not captured by PRMS. Neglecting this process may lead to erroneously allocating precipitation to the recharge zone (where it becomes available for evapotranspiration) or to groundwater; in either case, runoff would be underestimated. Here again, surface-to-subsurface mass and energy fluxes emerge as the most relevant knowledge gap in this field that would benefit from more targeted research.
Droughts cause a shift in the precipitation–runoff relationship of Mediterranean mixed rain–snow mountain basins of the Sierra Nevada of California. The magnitude of this shift is comparable to previous findings in rainfall-dominated semi-arid areas with year-around or summer-monsoon-dominated precipitation, which points to common feedbacks impacting the process across precipitation regimes, regardless of lithology. By comparing observed water-balance components during drought vs. non-drought years with those simulated by a hydrologic model, we identified these common feedbacks as being driven by the interplay between the response of evapotranspiration to climate (climate elasticity of evapotranspiration) and multi-year carryover of subsurface water storage. Shifts therefore appear as a hysteretic response of the water budget to buffered basin-climate coevolution mechanisms like tree mortality and expansion and soil-water drawdown and replenishment. These processes take place over comparatively long, multi-year timescales, thus explaining why short dry periods are often not subjected to shifts. The complex response of evapotranspiration to climate in mixed rain–snow Mediterranean basins caused significant drops in performance for a hydrologic model (PRMS). Improved parametrizations of climate elasticity of evapotranspiration are thus highly needed to make models and water resource management more robust to droughts, especially in a warming and more variable climate. A primary need in this regard is to better represent the buffering role of deep, plant-accessible subsurface water storage during multi-year dry periods in sustaining vegetation evaporative demand.
Sources of data used in this paper are reported in the main text (in particular in Sect. 2.2). The PRMS hydrologic model is available at https://www.usgs.gov/software/precipitation-runoff-modeling-system-prms (USGS, 2020).
The supplement related to this article is available online at: https://doi.org/10.5194/hess-24-4317-2020-supplement.
FA conceived and designed the investigation presented in this paper based on discussions with all the coauthors; he performed analyses and prepared the first draft of the manuscript and the following revisions. JR developed the ET-mapping algorithm and provided comments on preliminary results and on drafts of the manuscript. TM supported PRMS evaluation and provided comments on preliminary results and on drafts of the manuscript. QM developed the ET-mapping algorithm and provided comments on drafts of the manuscript. RB, MC, and SG provided comments on preliminary results and on drafts of the manuscript and supervised the overall research.
The authors declare that they have no conflict of interest.
This work was supported by the California Energy Commission under contract EPC-14-067, Pacific Gas & Electric (PG & E), the California Department of Water Resources, the UC Water Security and Sustainability Research Initiative, and the National Science Foundation through the Southern Sierra Critical Zone Observatory (EAR-1331939) and a Major Research Instrumentation grant (EAR-1126887). Tessa Maurer was supported by the National Science Foundation Graduate Research Fellowship under grant no. DGE 1106400. We would like to thank Kevin Richards (PG & E) for his continuous support and advice throughout this work.
This research has been supported by the California Energy Commission (grant no. EPC-14-067) and the National Science Foundation (grant nos. DGE 1106400, EAR-1331939 and EAR-1126887).
This paper was edited by Dominic Mazvimavi and reviewed by two anonymous referees.
Andréassian, V., Coron, L., Lerat, J., and Le Moine, N.: Climate elasticity of streamflow revisited – an elasticity index based on long-term hydrometeorological records, Hydrol. Earth Syst. Sci., 20, 4503–4524, https://doi.org/10.5194/hess-20-4503-2016, 2016. a, b, c, d
Anghileri, D., Voisin, N., Castelletti, A., Pianosi, F., Nijssen, B., and Lettenmaier, D. P.: Value of long-term streamflow forecasts to reservoir operations for water supply in snow-dominated river catchments, Water Resour. Res., 52, 4209–4225, https://doi.org/10.1002/2015WR017864, 2016. a
Arkley, R. J.: Soil moisture use by mixed conifer forest in a summer-dry climate, Soil Sci. Soc. Am. J., 45, 423–427, 1981. a
Avanzi, F., De Michele, C., Ghezzi, A., Jommi, C., and Pepe, M.: A processing-modeling routine to use SNOTEL hourly data in snowpack dynamic models, Adv. Water Resour., 73, 16–29, https://doi.org/10.1016/j.advwatres.2014.06.011, 2014. a
Avanzi, F., Maurer, T., Glaser, S. D., Bales, R. C., and Conklin, M. H.: Information content of spatially distributed ground-based measurements for hydrologic-parameter calibration in mixed rain-snow mountain headwaters, J. Hydrol., 582, 124478, https://doi.org/10.1016/j.jhydrol.2019.124478, 2020. a, b
Bales, R. C., Hopmans, J. W., O'Geen, A. T., Meadows, M., Hartsough, P. C., Kirchner, P., Hunsaker, C. T., and Beaudette, D.: Soil moisture response to snowmelt and rainfall in a Sierra Nevada mixed-conifer forest, Vadose Zone J., 10, 786–799, 2011. a
Bales, R. C., Goulden, M. L., Hunsaker, C. T., Conklin, M. H., Hartsough, P. C., O'Geen, A. T., Hopmans, J. W., and Safeeq, M.: Mechanisms controlling the impact of multi-year drought on mountain hydrology, Scient. Rep., 8, 690, https://doi.org/10.1038/s41598-017-19007-0, 2018. a, b, c, d, e, f, g, h, i, j, k, l, m, n, o
Cayan, D. R., Das, T., Pierce, D. W., Barnett, T. P., Tyree, M., and Gershunov, A.: Future dryness in the southwest US and the hydrology of the early 21st century drought, P. Natl. Acad. Sci. USA, 107, 21271–21276, https://doi.org/10.1073/pnas.0912391107, 2010. a, b
Chiew, F. H. S., Potter, N. J., Vaze, J., Petheram, C., Zhang, L., Teng, J., and Post, D. A.: Observed hydrologic non-stationarity in far south-eastern Australia: implications for modelling and prediction, Stoch. Environ. Res. Risk A., 28, 3–15, https://doi.org/10.1007/s00477-013-0755-5, 2014. a, b, c
Clark, M. P., Slater, A. G., Rupp, D. E., Woods, R. A., Vrugt, J. A., Gupta, H. V., Wagener, T., and Hay, L. E.: Framework for Understanding Structural Errors (FUSE): A modular framework to diagnose differences between hydrological models, Water Resour. Res., 44, W00B02, https://doi.org/10.1029/2007WR006735, 2008. a
Cooper, M. G., Schaperow, J. R., Cooley, S. W., Alam, S., Smith, L. C., and Lettenmaier, D. P.: Climate Elasticity of Low Flows in the Maritime Western U.S. Mountains, Water Resour. Res., 54, 5602–5619, https://doi.org/10.1029/2018WR022816, 2018. a, b, c, d, e
Daly, C., Halbleib, M., Smith, J. I., Gibson, W. P., Doggett, M. K., Taylor, G. H., Curtis, J., and Pasteris, P. P.: Physiographically sensitive mapping of climatological temperature and precipitation across the conterminous United States, Int. J. Climatol., 28, 2031–2064, https://doi.org/10.1002/joc.1688, 2008. a
Donovan, J. and Koczot, K.: User's manual for the Draper climate-distribution software suite with data-evaluation tools, U.s. geological survey techniques and methods 7-c22, U.S. Geological Survey, Reston, Virginia, p. 55, 2019. a, b
DWR: The 1976–1977 California drought – a review, Tech. rep., State of California, Department of Water Resources, Sacramento, 1978. a
DWR: California's 1987–82 drought – A summary of six years of drought, Tech. rep., State of California, Department of Water Resources, Sacramento, 1993. a
DWR: California's Significant Droughts: Comparing Historical and Recent Conditions, Tech. rep., State of California, Department of Water Resources, available at: https://cawaterlibrary.net/document/californias-most-significant-droughts-comparing-historical-and-recent-conditions/ (last access: 31 August 2020), 2015. a
Fellows, A. W. and Goulden, M. L.: Mapping and understanding dry season soil water drawdown by California montane vegetation, Ecohydrology, 10, e1772, https://doi.org/10.1002/eco.1772, 2017. a, b
Feng, X., Thompson, S. E., Woods, R., and Porporato, A.: Quantifying asynchronicity of precipitation and potential evapotranspiration in Mediterranean climates, Geophys. Res. Lett., 46, 14692–14701, https://doi.org/10.1029/2019GL085653, 2019. a
Fowler, K., Knoben, W., Peel, M., Peterson, T., Ryu, D., Saft, M., Seo, K. W., and Western, A.: Many commonly used rainfall‐runoff models lack long, slow dynamics: Implications for runoff projections, Water Resour. Res., 56, e2019WR025286, https://doi.org/10.1029/2019WR025286, 2020. a
Freeman, G. J.: Runoff Impacts of Climate Change on Northern California's Watersheds as Influenced by Geology and Elevation – A Mountain Hydroelectric System Perspective, in: Proceedings of the 76th Annual Western Snow Conference, Hood River, Oregon, 23–34, 2008. a, b
Freeman, G. J.: Tracking the Impact of Climate Change on Central and Northern California's Spring Snowmelt Subbasin Runoff, in: Proceedings of the 78th Annual Western Snow Conference, Logan, Utah, 107–118, 2010. a
Freeman, G. J.: Climate Change and the Changing Water Balance for California's North Fork Feather River, in: Proceedings of the 79th Annual Western Snow Conference, Stateline, Nevada 18–21 April 2011, 71–82, 2011. a, b, c, d, e
Freeman, G. J.: Analyzing the Impact of Climate Change on Monthly River Flows in California's Sierra Nevada and Southern Cascade Mountain Ranges, in: Proceedings of the 80th Annual Western Snow Conference, Anchorage, Alaska, 3–14, 2012. a, b
Georgakakos, A., Yao, H., Kistenmacher, M., Georgakakos, K., Graham, N., Cheng, F.-Y., Spencer, C., and Shamir, E.: Value of adaptive water resources management in Northern California under climatic variability and change: Reservoir management, J. Hydrol., 412–413, 34–46, https://doi.org/10.1016/j.jhydrol.2011.04.038, 2012. a
Goulden, M. L. and Bales, R. C.: California forest die-off linked to multi-year deep soil drying in 2012–2015 drought, Nat. Geosci., 12, 632–637, https://doi.org/10.1038/s41561-019-0388-5, 2019. a, b
Goulden, M. L., Anderson, R. G., Bales, R. C., Kelly, A. E., Meadows, M., and Winston, G. C.: Evapotranspiration along an elevation gradient in California's Sierra Nevada, J. Geophys. Res.-Biogeo., 117, G03028, https://doi.org/10.1029/2012JG002027, 2012. a, b
Griffin, D. and Anchukaitis, K. J.: How unusual is the 2012–2014 California drought?, Geophys. Res. Lett., 41, 9017–9023, https://doi.org/10.1002/2014GL062433, 2014. a, b, c
Hahm, W. J., Rempe, D. M., Dralle, D. N., Dawson, T. E., Lovill, S. M., Bryk, A. B., Bish, D. L., Schieber, J., and Dietrich, W. E.: Lithologically Controlled Subsurface Critical Zone Thickness and Water Storage Capacity Determine Regional Plant Community Composition, Water Resour. Res., 55, 3028–3055, 2019. a
Harpold, A. A., Dettinger, M., and Rajagopal, S.(: Defining snow drought and why it matters, Eos, 98, https://doi.org/10.1029/2017EO068775, 2017. a
Harrison, B. and Bales, R.: Skill Assessment of Water Supply Forecasts for Western Sierra Nevada Watersheds, J. Hydrol. Eng., 21, 04016002, https://doi.org/10.1061/(ASCE)HE.1943-5584.0001327, 2016. a, b, c, d, e, f, g
Hatchett, B. J. and McEvoy, D. J.: Exploring the Origins of Snow Drought in the Northern Sierra Nevada, California, Earth Interacti., 22, 1–13, https://doi.org/10.1175/EI-D-17-0027.1, 2018. a
Hatchett, B. J., Daudert, B., Garner, C. B., Oakley, N. S., Putnam, A. E., and White, A. B.: Winter Snow Level Rise in the Northern Sierra Nevada from 2008 to 2017, Water, 9, 899, https://doi.org/10.3390/w9110899, 2017. a
He, M., Russo, M., and Anderson, M.: Hydroclimatic Characteristics of the 2012–2015 California Drought from an Operational Perspective, Climate, 5, 5, https://doi.org/10.3390/cli5010005, 2017. a, b, c, d, e, f
Huang, G., Kadir, T., and Chung, F.: Hydrological response to climate warming: The Upper Feather River Watershed, J. Hydrol., 426–427, 138–150, https://doi.org/10.1016/j.jhydrol.2012.01.034, 2012. a, b
Jefferson, A., Nolin, A., Lewis, S., and Tague, C.: Hydrogeologic controls on streamflow sensitivity to climate variation, Hydrol. Process., 22, 4371–4385, https://doi.org/10.1002/hyp.7041, 2008. a, b
Jones, D. P. and Graham, R. C.: Water-Holding Characteristics of Weathered Granitic Rock in Chaparral and Forest Ecosystems, Soil Sci. Soc. Am. J., 57, 256–261, https://doi.org/10.2136/sssaj1993.03615995005700010044x, 1993. a
Klos, P. Z., Goulden, M. L., Riebe, C. S., Tague, C. L., O'Geen, A. T., Flinchum, B. A., Safeeq, M., Conklin, M. H., Hart, S. C., Berhe, A. A., Hartsough, P. C., Holbrook, W. S., and Bales, R. C.: Subsurface plant-accessible water in mountain ecosystems with a Mediterranean climate, Wiley Interdisciplin. Rev.: Water, 5, e1277, https://doi.org/10.1002/wat2.1277, 2018. a, b, c, d, e, f
Koczot, K. M., Jeton, A. E., McGurk, B., and Dettinger, M. D.: Precpitation-Runoff Processes in the Feather River Basin, Northeastern California, with Prospects for Streamflow Predictability, Water Years 1971–1997, Scientific Investigations Report 5202, U.S. Geological Survey, Reston, Virginia, 2004. a, b, c, d, e, f, g, h, i, j, k
Kottegoda, N. T. and Rosso, R.: Applied statistics for civil and environmental engineers, McGraw-Hill, New York, 2008. a
Lange, J. and Haensler, A.: Runoff generation following a prolonged dry period, J. Hydrol., 464-465, 157–164, https://doi.org/10.1016/j.jhydrol.2012.07.010, 2012. a
Markstrom, S. L., Niswonger, R. G., Regan, R. S., Prudic, D. E., and Barlow, P. M.: GSFLOW–Coupled Ground-Water and Surface-Water Flow Model Based on the Integration of the Precipitation-Runoff Modeling System (PRMS) and the Modular Ground-Water Flow Model (MODFLOW-2005), Tech. rep., US Geological Survey Techniques and Methods, U.S. Geological Survey, Reston, Virginia, 2008. a
Markstrom, S. L., Regan, R. S., Hay, L. E., Viger, R. J., Webb, R. M., Payn, R. A., and LaFontaine, J. H.: PRMS-IV, the Precipitation-Runoff Modeling System, Version 4, Tech. rep., US Geological Survey Techniques and Methods, U.S. Geological Survey, Reston, Virginia, https://doi.org/10.3133/tm6B7, 2015. a, b, c
Markstrom, S. L., Hay, L. E., and Clark, M. P.: Towards simplification of hydrologic modeling: identification of dominant processes, Hydrol. Earth Syst. Sci., 20, 4655–4671, https://doi.org/10.5194/hess-20-4655-2016, 2016. a
Mastrotheodoros, T., Pappas, C., Molnar, P., Burlando, P., Manoli, G., Parajka, J., Rigon, R., Szeles, B., Bottazzi, M., Hadjidoukas, P., and Fatichi, S.: More green and less blue water in the Alps during warmer summers, Nat. Clim. Change, 10, 155–161, 2020. a
Nash, J. E. and Sutcliffe, J. V.: River flow forecasting through conceptual models Part I – A discussion of principles, J. Hydrol., 10, 282–290, 1970. a
Oroza, C. A., Bales, R. C., Stacy, E. M., Zheng, Z., and Glaser, S. D.: Long-Term Variability of Soil Moisture in the Southern Sierra: Measurement and Prediction, Vadose Zone J., 17, 170178, https://doi.org/10.2136/vzj2017.10.0178, 2018. a
Orth, R. and Destouni, G.: Drought reduces blue-water fluxes more strongly than green-water fluxes in Europe, Nat. Commun., 9, 1–8, 2018. a, b
Pagano, T., Garen, D., and Sorooshian, S.: Evaluation of Official Western U.S. Seasonal Water Supply Outlooks, 1922–2002, J. Hydrometeorol., 5, 896–909, https://doi.org/10.1175/1525-7541(2004)005<0896:EOOWUS>2.0.CO;2, 2004. a
Rasmussen, R., Baker, B., Kochendorfer, J., Meyers, T., Landolt, S., Fischer, A. P., Black, J., Thériault, J. M., Kucera, P., Gochis, D., Smith, C., Nitu, R., Hall, M., Ikeda, K., and Gutmann, E.: How Well Are We Measuring Snow: The NOAA/FAA/NCAR Winter Precipitation Test Bed, B. Am. Meteorol. Soc., 93, 811–829, https://doi.org/10.1175/BAMS-D-11-00052.1, 2012. a
Roche, J. W., Ma, Q., Rungee, J., and Bales, R. C.: Evapotranspiration Mapping for Forest Management in California's Sierra Nevada. Front. For. Glob. Change 3:69. doi: 10.3389/ffgc.2020.00069, 2020. a
Rosenberg, E. A., Wood, A. W., and Steinemann, A. C.: Statistical applications of physically based hydrologic models to seasonal streamflow forecasts, Water Resour. Res., 47, W00H14, https://doi.org/10.1029/2010WR010101, 2011. a, b
Rungee, J., Bales, R., and Goulden, M.: Evapotranspiration response to multiyear dry periods in the semiarid western United States, Hydrol. Process., 33, 182–194, https://doi.org/10.1002/hyp.13322, 2018. a, b, c, d, e, f, g, h
Saft, M., Western, A. W., Zhang, L., Peel, M. C., and Potter, N. J.: The influence of multiyear drought on the annual rainfall–runoff relationship: An Australian perspective, Water Resour. Res., 51, 2444–2463, https://doi.org/10.1002/2014WR015348, 2015. a, b, c, d
Saft, M., Peel, M. C., Western, A. W., Perraud, J.-M., and Zhang, L.: Bias in streamflow projections due to climate-induced shifts in catchment response, Geophys. Res. Lett., 43, 1574–1581, https://doi.org/10.1002/2015GL067326, 2016a. a, b, c, d, e, f
Saft, M., Peel, M. C., Western, A. W., and Zhang, L.: Predicting shifts in rainfall-runoff partitioning during multiyear drought: Roles of dry period and catchment characteristics, Water Resour. Res., 52, 9290–9305, https://doi.org/10.1002/2016WR019525, 2016b. a, b, c, d, e, f, g, h, i, j, k, l, m, n, o
Santos, L., Thirel, G., and Perrin, C.: Technical note: Pitfalls in using log-transformed flows within the KGE criterion, Hydrol. Earth Syst. Sci., 22, 4583–4591, https://doi.org/10.5194/hess-22-4583-2018, 2018. a, b, c
Sarkar, N.: Box-cox transformation and the problem of heteroscedasticity, Commun. Stat., 14, 363–379, https://doi.org/10.1080/03610928508828918, 1985. a
Schaefli, B., Hingray, B., and Musy, A.: Climate change and hydropower production in the Swiss Alps: quantification of potential impacts and related modelling uncertainties, Hydrol. Earth Syst. Sci., 11, 1191–1205, https://doi.org/10.5194/hess-11-1191-2007, 2007. a
Sowerby, A., Emmett, B. A., Tietema, A., and Beier, C.: Contrasting effects of repeated summer drought on soil carbon efflux in hydric and mesic heathland soils, Global Change Biology, 14, 2388–2404, https://doi.org/10.1111/j.1365-2486.2008.01643.x, 2008. a
Staudinger, M., Stahl, K., Seibert, J., Clark, M. P., and Tallaksen, L. M.: Comparison of hydrological model structures based on recession and low flow simulations, Hydrol. Earth Syst. Sci., 15, 3447–3459, https://doi.org/10.5194/hess-15-3447-2011, 2011. a
Su, Y., Bales, R. C., Ma, Q., Nydick, K., Ray, R. L., Li, W., and Guo, Q.: Emerging Stress and Relative Resiliency of Giant Sequoia Groves Experiencing Multiyear Dry Periods in a Warming Climate, J. Geophys. Res.-Biogeo., 122, 3063–3075, https://doi.org/10.1002/2017JG004005, 2017. a
Sun, F., Berg, N., Hall, A., Schwartz, M., and Walton, D.: Understanding End-of-Century Snowpack Changes Over California's Sierra Nevada, Geophys. Res. Lett., 46, 933–943, https://doi.org/10.1029/2018GL080362, 2019. a
Tague, C. and Grant, G. E.: Groundwater dynamics mediate low-flow response to global warming in snow-dominated alpine regions, Water Resour. Res., 45, W07421, https://doi.org/10.1029/2008WR007179, 2009. a
Tague, C., Grant, G., Farrell, M., Choate, J., and Jefferson, A.: Deep groundwater mediates streamflow response to climate warming in the Oregon Cascades, Climatic Change, 86, 189–210, https://doi.org/10.1007/s10584-007-9294-8, 2008. a, b
Tang, Q. and Lettenmaier, D. P.: Use of satellite snow-cover data for streamflow prediction in the Feather River Basin, California, Int. J. Remote Sens., 31, 3745–3762, https://doi.org/10.1080/01431161.2010.483493, 2010. a
Tian, W., Liu, X., Liu, C., and Bai, P.: Investigation and simulations of changes in the relationship of precipitation-runoff in drought years, J. Hydrol., 565, 95–105, https://doi.org/10.1016/j.jhydrol.2018.08.015, 2018. a, b, c, d, e, f, g, h, i
Troch, P. A., Lahmers, T., Meira, A., Mukherjee, R., Pedersen, J. W., Roy, T., and Valdés-Pineda, R.: Catchment coevolution: A useful framework for improving predictions of hydrological change?, Water Resour. Res., 51, 4903–4922, https://doi.org/10.1002/2015WR017032, 2015. a
USGS: Precipitation Runoff Modeling System (PRMS), available at: https://www.usgs.gov/software/precipitation-runoff-modeling-system-prms, last access: 1 September 2020. a
Van Loon, A. F.: Hydrological drought explained, WIREs Water, 2, 359–392, https://doi.org/10.1002/wat2.1085, 2015. a
Wayand, N. E., Lundquist, J. D., and Clark, M. P.: Modeling the influence of hypsometry, vegetation, and storm energy on snowmelt contributions to basins during rain-on-snow floods, Water Resour. Res., 51, 8551–8569, https://doi.org/10.1002/2014WR016576, 2015. a, b
White, A. B., Moore, B. J., Gottas, D. J., and Neiman, P. J.: Winter Storm Conditions Leading to Excessive Runoff above California's Oroville Dam during January and February 2017, B. Am. Meteorol. Soc., 100, 55–70, https://doi.org/10.1175/BAMS-D-18-0091.1, 2019. a
Woodhouse, C. A., Meko, D. M., MacDonald, G. M., Stahle, D. W., and Cook, E. R.: A 1,200-year perspective of 21st century drought in southwestern North America, P. Natl. Acad. Sci. USA, 107, 21283–21288, https://doi.org/10.1073/pnas.0911197107, 2010. a
Zhang, Z., Glaser, S., Bales, R., Conklin, M., Rice, R., and Marks, D.: Insights into mountain precipitation and snowpack from a basin‐scale wireless‐sensor network, Water Resour. Res., 53, 6626–6641, https://doi.org/10.1002/2016WR018825, 2017. a