the Creative Commons Attribution 4.0 License.
the Creative Commons Attribution 4.0 License.
 | 21 Aug 2020
Development of a revised method for indicators of hydrologic alteration for analyzing the cumulative impacts of cascading reservoirs on flow regime
Xingyu Zhou
Hongbin Zhao
The impacts of reservoirs, especially multiple reservoirs, on the flow regimes and ecosystems of rivers have received increasing attention. The most widely used metrics to quantify the characteristics of flow regime alterations are the indicators of hydrologic alteration (IHAs) which include 33 parameters. Due to the difference in the degree of alteration and the intercorrelation among IHA parameters, the conventional method of evaluating IHA parameters that assigns the same weight to each indicator is obviously inadequate. A revised IHA method is proposed by utilizing the projection pursuit (PP) and real-coded accelerated genetic algorithm (RAGA). Data reliability is analyzed by using the length of record (LOR) method. The projection values reflecting the comprehensive characteristics of the evaluation parameters are calculated. Based on these methods, a scientific and reliable evaluation of the cumulative impacts of cascading reservoirs on the flow regime was made by examining the Jinsha River. The results showed that with the increase in the number of reservoirs, the alteration degrees of IHA parameters gradually increased in groups 1, 2, 3 and 4 but decreased in group 5 (each group addresses the magnitude, timing, frequency, duration and rate of change in turn), and the flow duration curves showed a declining trend at the high-flow part and an increasing trend at the low-flow part. The flow regime alteration of the outlet section was more stable than before. This change had a negative impact on downstream fish reproduction and ecological protection. An attempt at ecological regulation was made to simulate the natural rising process of water, and four major Chinese carps have a positive response to the flood peak process caused by manual regulation.
- Article
(5228 KB) - Full-text XML
- BibTeX
- EndNote


Free-flowing rivers (FFRs) support diverse, complex and dynamic ecosystems globally, providing important societal and economic services (Grill et al., 2019). Humans have extensively altered river systems through impoundments and diversions to meet their water, energy and transportation needs (Nilsson et al., 2005). Only 37 % of rivers longer than 1000 km remain free-flowing over their entire length, and 23 % flow uninterrupted into the ocean around the world. Very long FFRs are largely restricted to remote regions of the Arctic and the Amazon and Congo basins. From 1978 (when China's reform and opening up began) to 2017, China experienced an unprecedented boom in the construction of dams. From 1949 to 2017, 98 795 reservoirs and dams were built in China with a total storage capacity of 9.035×10¹¹ m3, accounting for 32 % of the annual runoff of all rivers and streams in China, of which 732 reservoirs are large reservoirs with a total capacity of 7.21×10¹¹ m3, accounting for 79.8 % of the total capacity (Ministry of Water Resources, 2018). Flow regulation and fragmentation of large global river systems have received increasing attention (Nilsson et al., 2005; Winemiller et al., 2016; Chen and Olden, 2017; Schmitt et al., 2018; Best, 2019). Flow variability is widely recognized as a primary driver of biotic and abiotic conditions in riverine ecosystems (Poff et al., 1997; Poff and Zimmerman, 2010). However, fully understanding the cumulative impacts of multiple dams on flow regime remains a challenge in both the scientific and management communities.
To evaluate the characteristics and ecological effects of flow regime changes, indicators are often needed to quantify the extent of hydrological alterations caused by reservoirs or dams. Olden and Poff (2003) found more than 170 hydrological indicators that can describe the different components of the flow regime and capture the ecologically relevant streamflow attributes. However, large numbers of hydrologic metrics are too complicated to use, and many metrics are intercorrelated, resulting in statistical redundancy (Gao et al., 2009; Poff and Zimmerman, 2010). Studies have sought to explore redundancy among hydrological indicators. For example, Olden and Poff (2003), Yang et al. (2008), Gao et al. (2009), and Fantin-Cruz et al. (2015) used principal component analysis (PCA) to evaluate the patterns of statistical variation for each parameter and identified a small subset of hydrological indicators as the most representative of the ecological flow regimes. Yang et al. (2017) used the criteria importance through intercriteria correlation (CRTTIC) algorithm to remove repetition and identify the weights of indicators. The weight of each hydrological indicator is assumed to be proportional to the standard deviation and inversely proportional to its correlation with other indicators. Then, high-weight indicators and some low-weight indicators that have important effects on aquatic ecology are used as representative indicators. Obviously, this selection is subjective and arbitrary. The most widely used metrics for characterizing river flow regime changes are the indicators of hydrologic alteration (IHAs), which were developed based on 33 hydrological parameters in five groups, namely, the magnitude of monthly streamflow, the magnitude and duration of annual extreme flows, the timing of annual extreme flows, the frequency and duration of high and low pulses, and the rate and frequency of flow changes (Richter et al., 1996; Mathews and Richter, 2007). Richter et al. (1997) proposed the range of variability (RVA) method for evaluating the degree of alteration of the hydrological flow regime with IHA metrics. Nevertheless, intercorrelation still exists among the 33 parameters (Olden and Poff, 2003; Gao et al., 2012). Vogel et al. (2007) proposed a small set of representative indicators, i.e., the nondimensional metrics of ecodeficit and ecosurplus, which are based on flow duration curves (FDCs) and are computed over any time period of interest (month, season or year). Ecodeficit and ecosurplus reflect the overall loss or gain of streamflow resulting from flow regulation. Some studies (Gao et al., 2009, 2012; Zhang et al., 2015) have demonstrated that the ecodeficit and ecosurplus metrics provide a simplified and adequate representation of hydrological impacts, compared with the use of the more complex IHA and RVA hydrological approaches.
Scholars have become increasingly concerned with the cumulative effects of multiple dams deriving from individual dams on hydrological processes (Santucci et al., 2005; Deitch et al., 2013; Wang et al., 2017a, 2018; Wen et al., 2018; Huang et al., 2018). The combined effect of cascade reservoirs on hydrological processes is cumulative and greater than that associated with individual reservoirs (Huang et al., 2010; Dos Santos et al., 2018). In comparison, Santucci et al. (2005) found little evidence of the cumulative effects of low-head dams (< 15 m in height). There are few existing studies that compare the effects of single versus multiple dams on the hydrologic regime (Zhao et al., 2012). Are the effects of multiple dams additive, multiplicative or largely insignificant? These fundamental problems always cause disturbances to scientific and management communities (Timpe and Kaplan, 2017).
In summary, previous studies on method improvement were based on the statistical reduction in the dimensionality of multi-index data and evaluated the hydrological alterations of rivers. The disadvantage is that retaining most of the information also leads to the loss of some information. For example, a PCA usually only maintains 80 % of the data information. In this study, a very different idea was employed. Data mining and data optimization methods were used to identify the characteristics of the indicator system and identify the difference weight of each indicator to overcome the deficiency in the comprehensive evaluation given the same weight for each indicator. At the same time, global optimization also reduced the deviation in the evaluation caused by intercorrelation among indicators.
Based on previous studies, the objectives of the present study are as follows: (1) to develop an updated weight determination method for IHA indicators and precisely evaluate hydrological alteration; (2) to analyze cumulative effects on the flow regime of the construction of cascade reservoirs; and (3) to simulate the process of natural flooding, implement reservoir flow regulation and provide recommendations for water resource management.
2.1 Study area
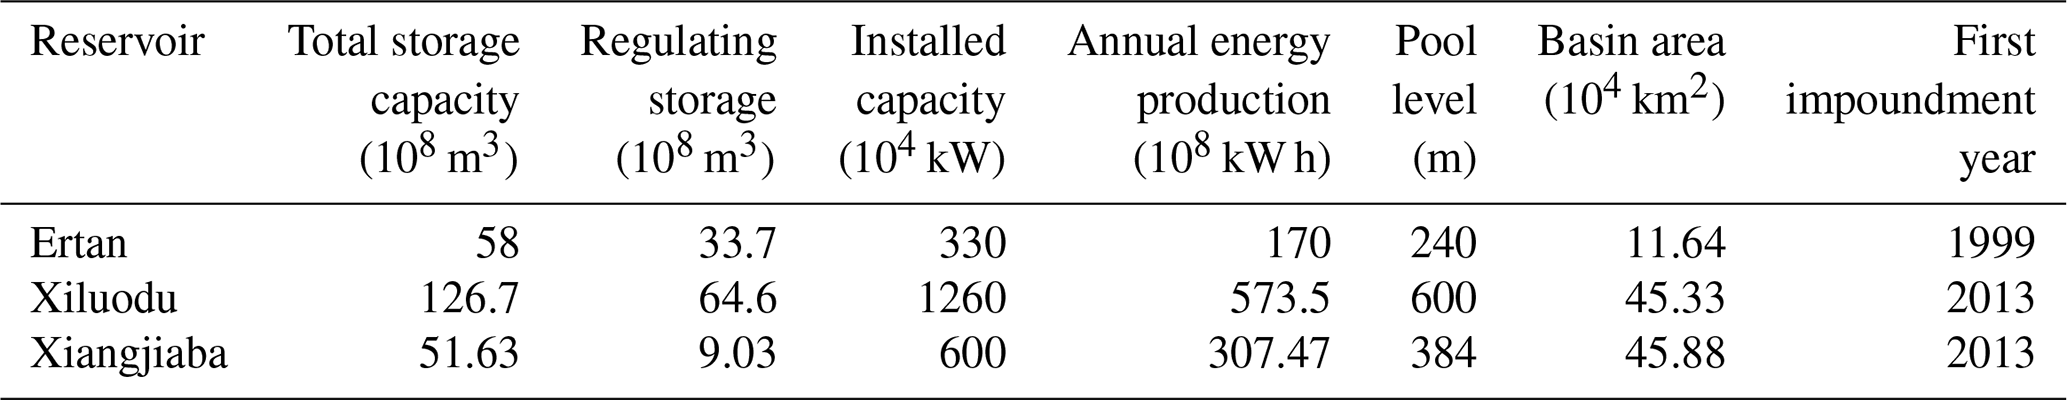
The Jinsha River comprises the upper reaches of the Yangtze River in China and originates from the northern foot of the Tanggula Mountains in the Tibetan Plateau. The Jinsha River flows along a distance of approximately 3500 km and has a drainage area of 502 000 km2, which is approximately 27.8 % of the entire basin area of the Yangtze River. The mean annual precipitation in the Jinsha River basin is 710 mm yr−1, and the average annual runoff is 4471 m3 s−1. The largest tributary of the Jinsha River is the Yalong River, and its inflow accounts for a third of the total discharge of the Jinsha River. At present, 20 reservoirs have been planned for development along its mainstream, and 21 reservoirs have been planned along the Yalong River (Fig. 1). Among the 13 reservoirs built, most have weak regulation capacity, while the Ertan, Xiangjiaba and Xiluodu reservoirs have large capacities, strong regulation abilities and great effects on the flow regime (Table 1).
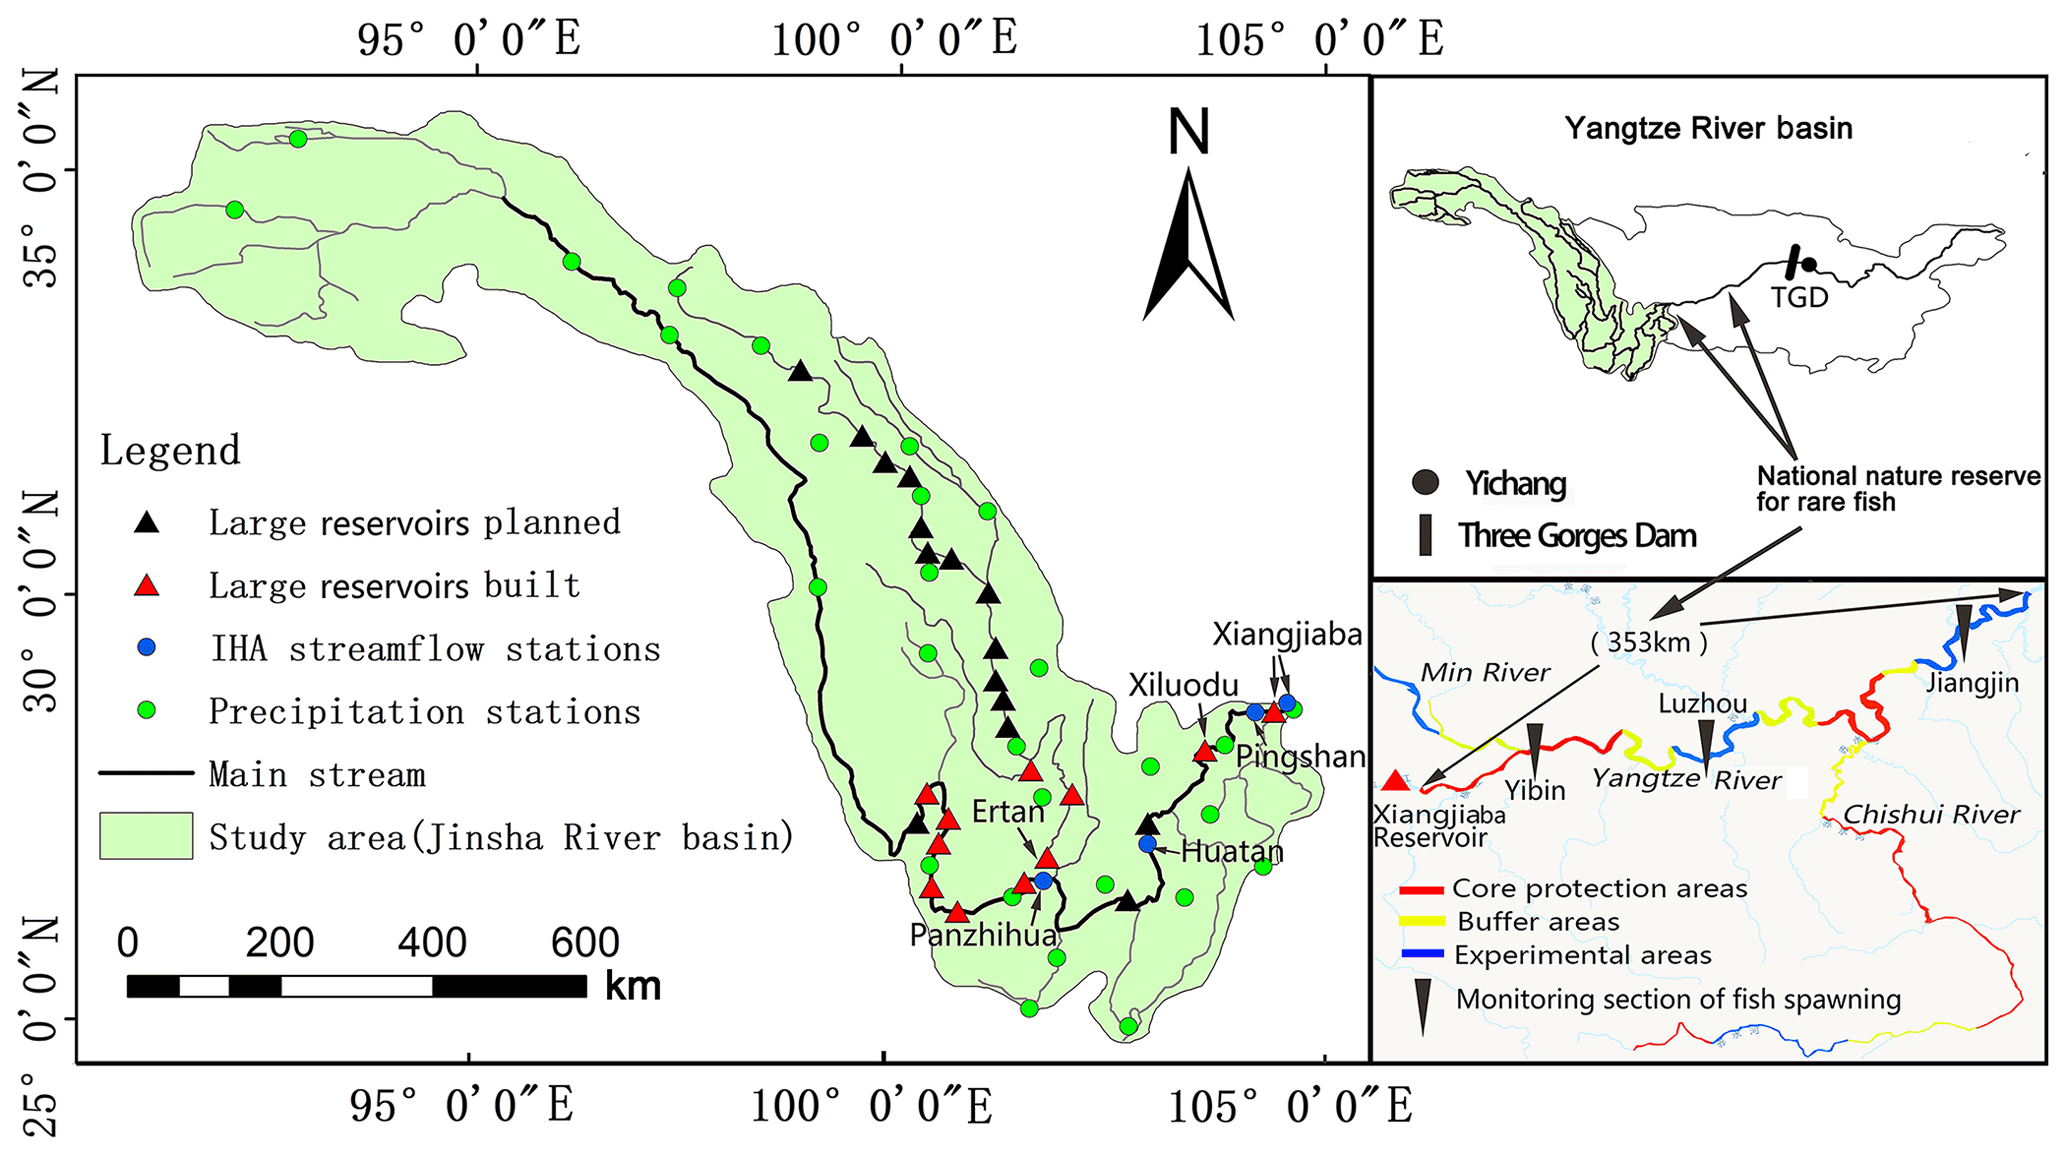
Figure 1Generalized map of study region. TGD: Three Gorges Dam.
There is a national nature reserve in China that protects rare fish from 1.8 km downstream of Xiangjiaba Reservoir to the main stream of the Yangtze River in Masangxi, in the municipality of Chongqing (355 km in length). The nature reserve's main protection targets include three rare fish, i.e., paddlefish (Psephurus gladius), Yangtze sturgeon fish (Acipenser dabryanus) and Chinese sucker fish (Myxocyprinus asiaticus), and 67 unique fish. This region is also an important habitat for four major Chinese carps, i.e., black carp (Mylopharyngodon piceus), grass carp (Ctenopharyngodon idella), silver carp (Hypophthalmichthys molitrix) and bighead carp (Aristichthys nobilis). With the successive construction of the Jinsha River cascade reservoirs, flow regime changes will have an impact on downstream fish habitats.
2.2 Data
The daily streamflow data of the Panzhihua, Huatan, Pingshan and Xiangjiaba hydrological gauges were collected (Table 2). The climate data used in this study are daily precipitation data at 28 stations from 1966 to 2017, and the daily inflow and outflow data of Xiangjiaba Reservoir and Xiluodu Reservoir were collected to analyze the effects of flow regulation. Pingshan Station is located approximately 28 km upstream of Xiangjiaba Reservoir and covers 99.96 % of the controlled drainage area of the reservoir, but it has been out of service since 2012 due to the construction of Xiangjiaba Reservoir. Therefore, data from Xiangjiaba Station, which was newly built in 2012 and is located close to Xiangjiaba Reservoir, were supplemented with Pingshan Station data (Huang et al., 2018).
Table 2List of hydrological stations and their features.
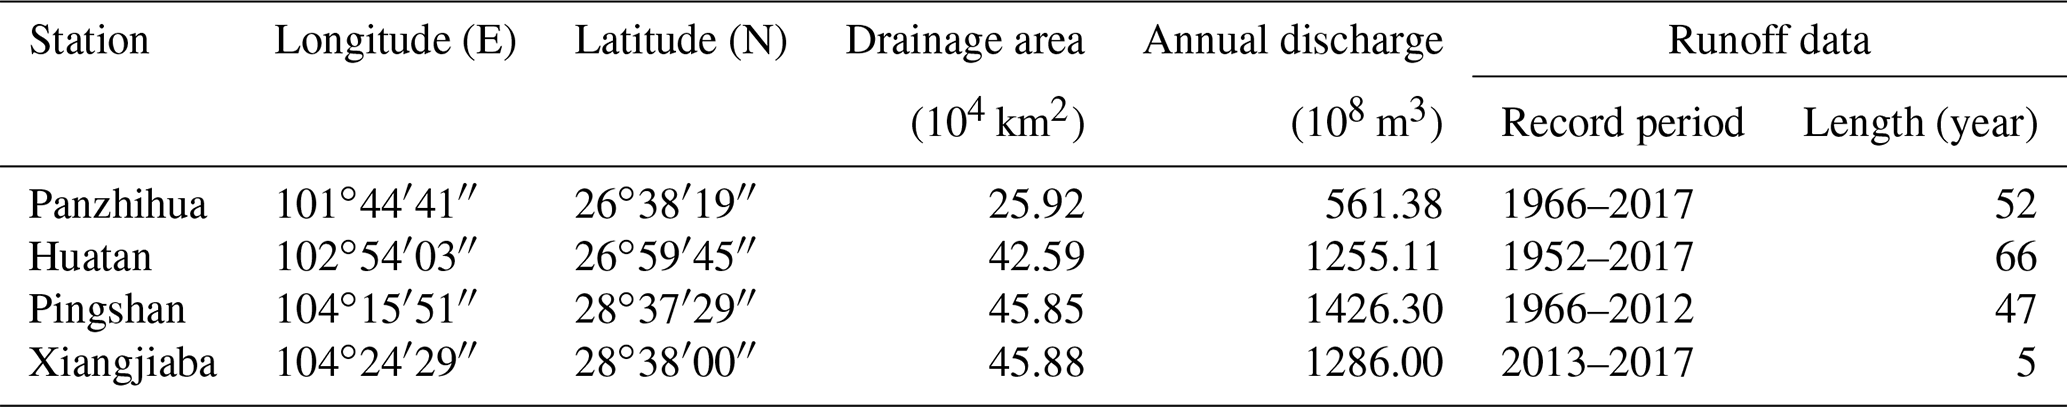
Xiangjiaba Station was also called Pingshan Station in this study.
3.1 Projection pursuit method
Projection pursuit (Friedman and Tukey, 1974; Wang et al., 2017b, 2019) uses data mining and data optimization methods to project high-dimensional data into low-dimensional space and analyze the characteristics of high-dimensional data through the distribution structure of low-dimensional projection data. The main steps are as follows.
Step 1. We normalize all of the indicators, since the dimensions of some indicators are not the same or the data ranges are quite different. The indicators for which larger is better are preprocessed by Eq. (1), and the indicators for which smaller is better are preprocessed by Eq. (2):
where is the jth indicator value of the ith sample and n and m are the length of daily streamflow data and number of IHA indicators (in this paper, the number is 32), respectively. For example, the mean flow in January (the first IHA indicator) in 1966 (the first year of data collection) at Panzhihua Station is 705 m3 s−1, so . and are the minimum and maximum values of the jth indicator, respectively. xij is the normalized indicator value.
Step 2. The projection pursuit method projects high-dimensional data into one-dimensional linear space for research; therefore, we construct a projection index function for linear projection. is the projection direction and is the one-dimensional projection value of xij, which is defined as follows:
Step 3. The projection value is selected by constructing an objective function, and its scattering characteristics should be as follows: local projection points should be as dense as possible, and it is better to concentrate the points into several clusters. At the same time, the overall projection points should be spread as much as possible. Therefore, the projection objective function Q(a) is defined as follows:
where Sz is the standard deviation of the projection value (Pearson, 1900) and Dz is the local density of the projection value . Sz and Dz are defined as follows:
where Ez is the average of all projection values and R is the window density of the local density. Through experiments, it was found that using 0.1Sz as the value of R could ensure that the average number of projection points contained in the window was not too small, which could make the deviation in the sliding average as small as possible. At the same time, it could also prevent the value of R from increasing too much as n increased; rij is the distance between projection values (i.e., ; u(t) is unit step function that equals 0 if t<0 or equals 1 if t≥0.
Step 4. The function value for the projection objective function (Qa) changes when the projection direction (aj) changes. To obtain an optimal projection direction and ensure that the structural features of the high-dimensional data are displayed as much as possible, the maximum value of the projection objective function should be solved, therefore, as it is an optimization problem:
It is very difficult to solve this complicated nonlinear optimization problem by using the traditional optimization method. Therefore, the real-coded accelerated genetic algorithm (RAGA) was used to address this problem, and RAGA, which simulates the survival of the fittest and the intragroup chromosome information exchange mechanism, is a general global optimization method (Yang et al., 2005). It includes the following eight steps.
Step 1: encoding by real number coding. For example, the general optimization problem is as follows:
where X(j) represents the jth optimization variable, [A(j), B(j)] represents the interval of change of X(j), M represents the number of optimization variables and F represents the objective function.
Then, a random number with is introduced, and the following linear transformation is used:
Step 2: random generation of initial parent groups. The N group uniform random number is generated, for which each group has m numbers in the range [0,1] (that is . The W(j) is used as the parent individual value of each initial group, and then, W(j) is plugged into Eq. (10) to get the optimized variable value X(j). The corresponding objective function value F(X) is obtained in Eq. (9).
Step 3: evaluation of the fitness of the parent population. According to step 2, the corresponding fitness function F(X) is obtained, and the larger the function value is, the higher the individual adaptability is.
Step 4: probability of selection of the parent individual. Selection is the key to a genetic algorithm, which reflects the idea of survival of the fittest. The excellent parent individuals are directly added to the child group.
Step 5: performing a hybridization of the parent individual. The new population selected in step 4 is hybridized according to the random linear combination with crossover probability to generate a second child generation.
Step 6: performing a mutation of the descendant individual. The second child generation is mutated according to the probability of mutation to generate the third child generation. If the fitness function value of any parent is small, the probability of variation of the parent is larger.
Step 7: evolution iteration. The excellent descendant individuals are obtained after step 6, and the RAGA algorithm is transferred to step 3 and enters the next round of evolution.
Step 8: accelerated circulation. The algorithm jumps to step 1, and the variable-change interval of the excellent individuals is taken as the new initial-change interval. The acceleration is not ended until the algorithm runs a predetermined number of accelerations.
3.2 Evaluation method for the hydrological-alteration degree
The IHA system, consisting of 33 hydrological indicators, is employed to assess hydrological alteration. The 33 IHAs are categorized into five groups addressing the magnitude, timing, frequency, duration and rate of change (Shiau and Wu, 2010), and each group has a different ecological significance (Table 3). For the IHA statistics of the pre-impact period, its range of variation between the 75th and 25th percentiles is considered as the ecological target range. The alteration degree (Di) of the post-impact flow regime for the ith IHA parameter is calculated as follows:
where and Ne are the observed and expected number of years during which the post-impact values of the ith IHA parameters should fall within the ecological target range, respectively. Ranges of 0 %–33 %, 33 %–66 % and 66 %–100 % are defined as the evaluation boundaries of low-, medium- and high-alteration degrees, respectively. Then, the overall hydrological-alteration degree is calculated as follows:
where c is the number of parameters. In this study, 32 parameters were considered, since there were no zero-flow days. As seen from Eq. (10), the conventional method gives the same weight for each IHA parameter.
Table 3The 33 indicators of hydrologic alteration.
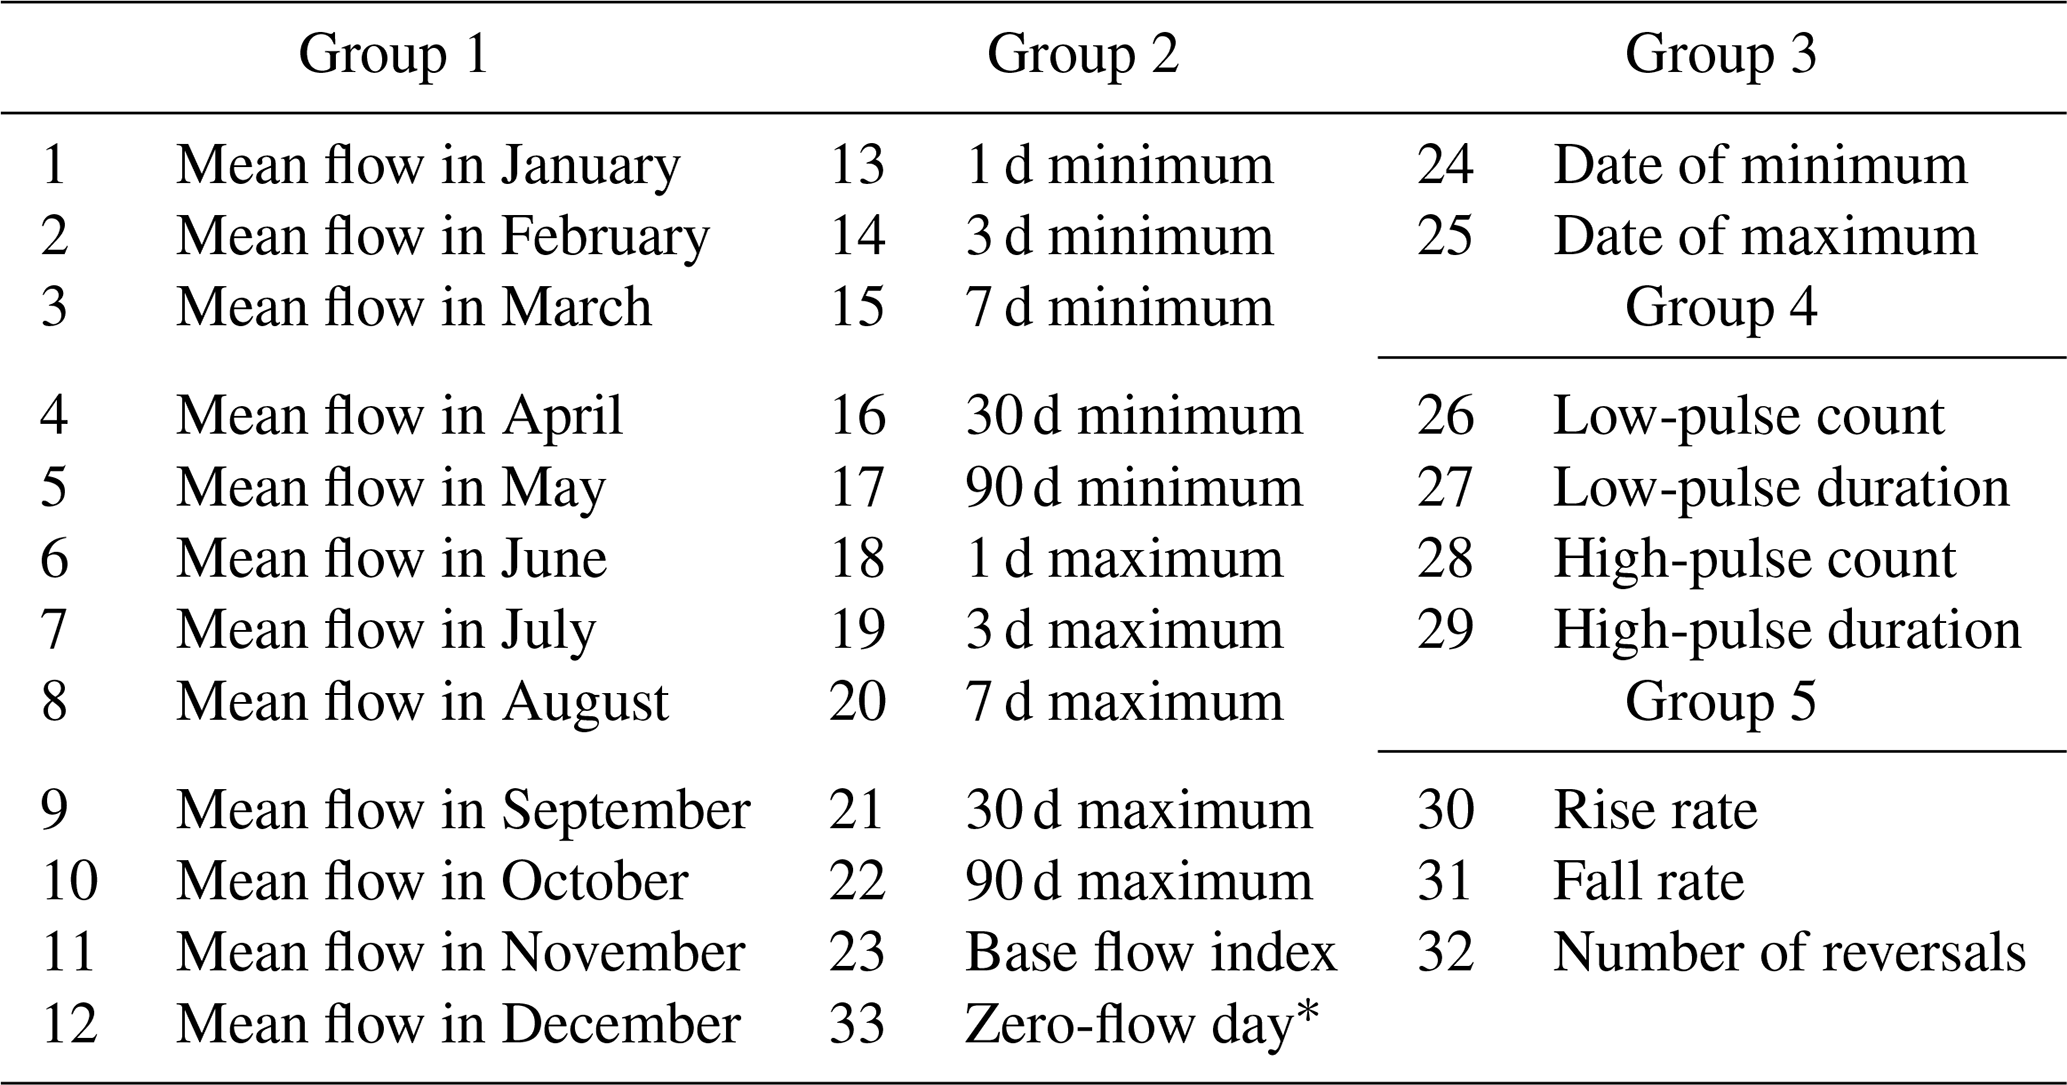
* This parameter is excluded from the study.
3.3 FDC method and LOR analysis
A flow duration curve is simply a plot of the ordered daily streamflow observations Q(k) (where k=1 is the largest flow) as a function of their exceedance probability (pk) (Vogel et al., 2007) and is defined as follows:
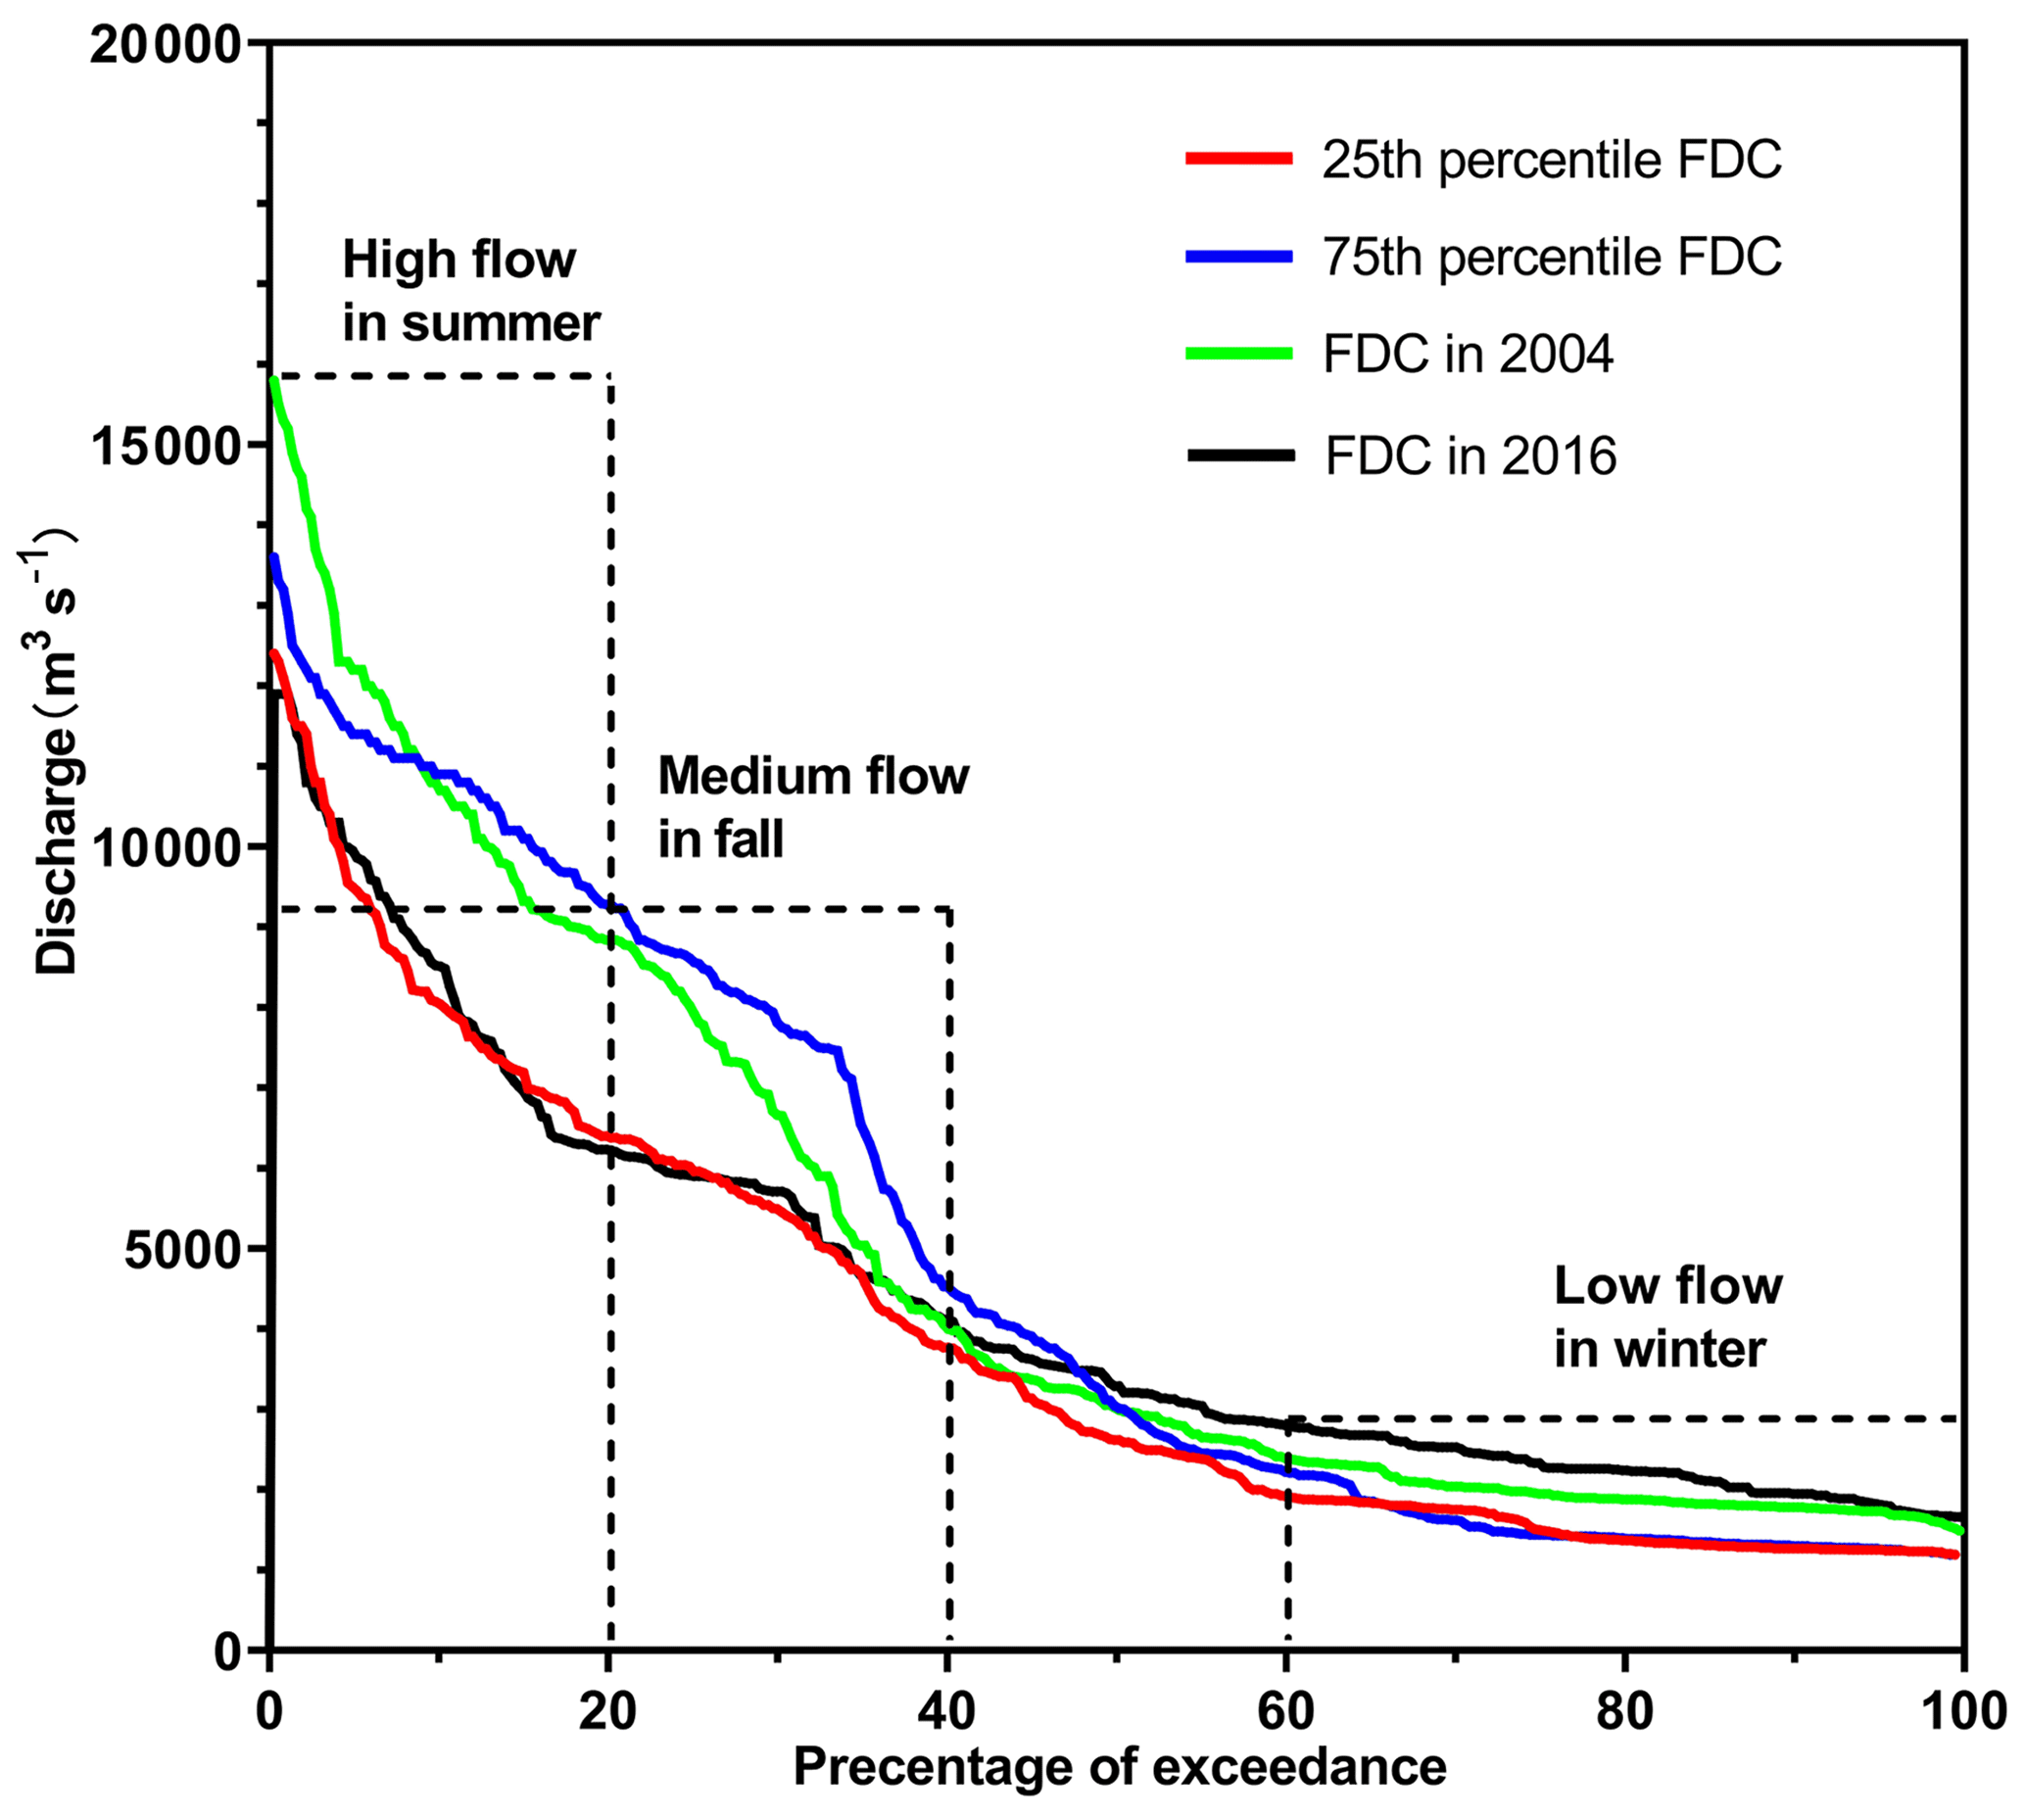
where y is the number of flow days (365 or 366 d in this paper) and k is the rank of flow. In this study, two typical annual FDCs during the pre-impact period (the 25th percentile FDC and the 75th percentile FDC) were used as the comparison objects.
The length of record (LOR) method is used to provide quantitative advice on the length of record required for each IHA parameter. The result of the LOR for a station is considered as a reference for other stations with similar hydrologic regimes; therefore, the station with the smallest anthropogenic impact and longest record length in the study area was chosen for LOR analysis. For each IHA parameter, we calculate its statistics for each year in a data set along with the long-term mean as the reference for LOR analysis. Then, the statistics of each parameter are ordered randomly and grouped into record-length increments ranging from 2 years to the full LOR. The mean of each increment is calculated for a comparison with the long-term mean. This process is repeated 50 000 times, from which 95 %, 90 % and 85 % confidence intervals (CIs) are calculated. Finally, we calculate the LOR required within 5 % and 10 % long-term mean errors at a specified confidence interval for the river in the study. For the convenience of discussion, the LOR result within 10 % of the long-term mean with a CI of 85 % is abbreviated as 10/85 (Timpe and Kaplan, 2017).
3.4 Mann–Kendall test method
When we evaluate the effect of reservoirs on the hydrological regime, it is necessary to consider the potential impacts of climate change on hydrological data, since there may be different climatic conditions in the pre- and post-stages (Wang et al., 2017a). Therefore, the Mann–Kendall (hereafter referred to as MK) test method was used to analyze the trend in the annual-precipitation time series of 1966–2017 (52 years) for 28 stations in the Jinsha River basin. The MK test is based on statistics S defined as follows:
where Yi and Yj are the sequential data values of annual precipitation, N is the data set record length, and sgn is the signum. The standardized statistic Z is computed by:
where Var is the variance and at the 5 % significance level, the null hypothesis of no trend is rejected if and rejected if at the 1 % significance level (Tao et al., 2011).
4.1 Characteristic analysis of annual-precipitation change
In the study area, annual precipitation showed no significant trend or trend below the 10 % significance level at 21 stations, and only two and three stations showed increasing trends at 1 % and 5 % significance levels, respectively. A decreasing trend was found at only one station with the 1 % significance level (Fig. 2). The moment estimation method was used to calculate the characteristic values of precipitation from two short time series (1966–1998 and 1999–2017) and one long time series (1966–2017). Compared with the value of the long time series, the relative errors of the mean of two short time series did not exceed ±3 % at 22 and 16 stations, respectively, and the absolute errors of the coefficient of variation do not exceed ±0.03 at 26 and 18 stations. The results imply that the precipitation series from 1999 to 2017 (post-impact period) and from 1966 to 1998 (pre-impact period) have the same meteorological conditions and show no significant trends.
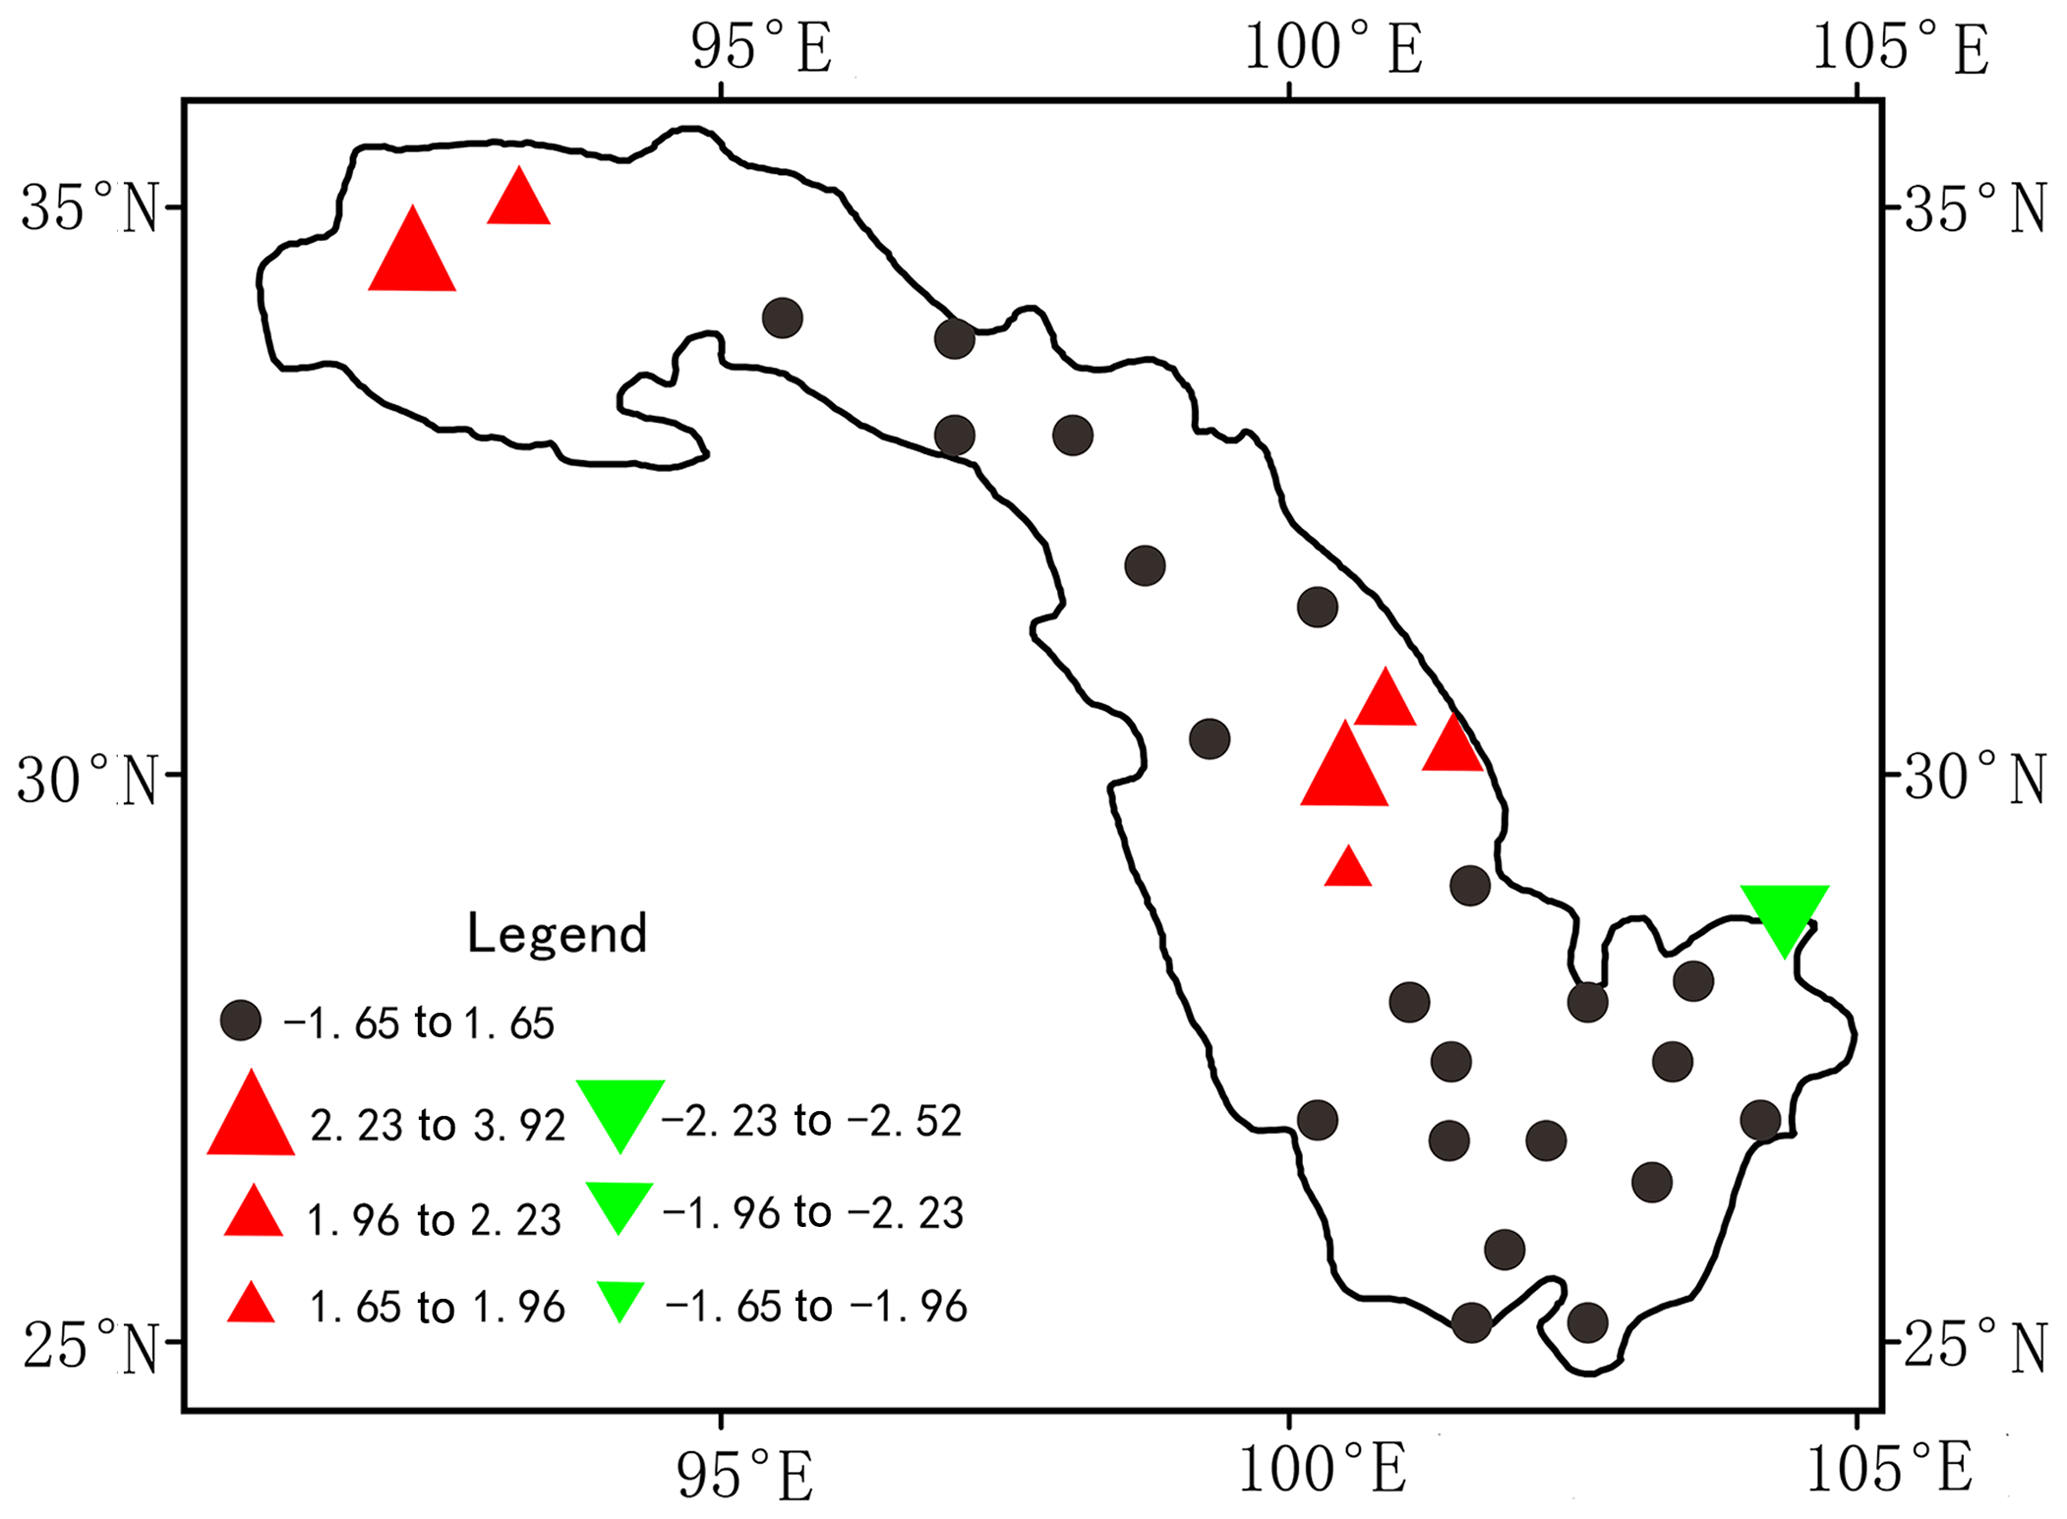
Figure 2Precipitation changes in the Jinsha River basin. Trend of annual precipitation at 28 stations between 1966 and 2017 where upward (downward) triangles indicate positive (negative) trends from the MK test. The size of the triangles depicts the significance levels 10 % (small), 5 % (medium) and 1 % (large). Black dots show stations with no trends or trends below the 10 % significance level. The value in the legend is the standardized statistic Z).
4.2 Projection pursuit analysis
4.2.1 Applying data mining to identify indicator weights
The IHA statistics software developed by the US Nature Conservancy (http://www.nature.org/, last access: 23 December 2019) was used to analyze the daily streamflow data of the Panzhihua, Huatan and Pingshan hydrological stations from 1966 to 2017, and a matrix of 32 IHA statistics with long time series was obtained. In line with the principle that the optimal pattern for a flow regime occurs in a natural state with no interference (Bayley, 1995), that is, the characteristics of intra-annual cyclical changes in wet and dry situations in a river are maintained, we first preprocessed the indicator system and transferred the high-dimensional data to low-dimensional subspaces using the PP method and then obtained the optimal projection direction of each indicator by the optimal projection objective function and model parameters with RAGA. In this paper, the population number was 400, the probability of crossover was 0.8, the probability of mutation was 0.8, the number of excellent individuals was 20 and the acceleration time was 10.
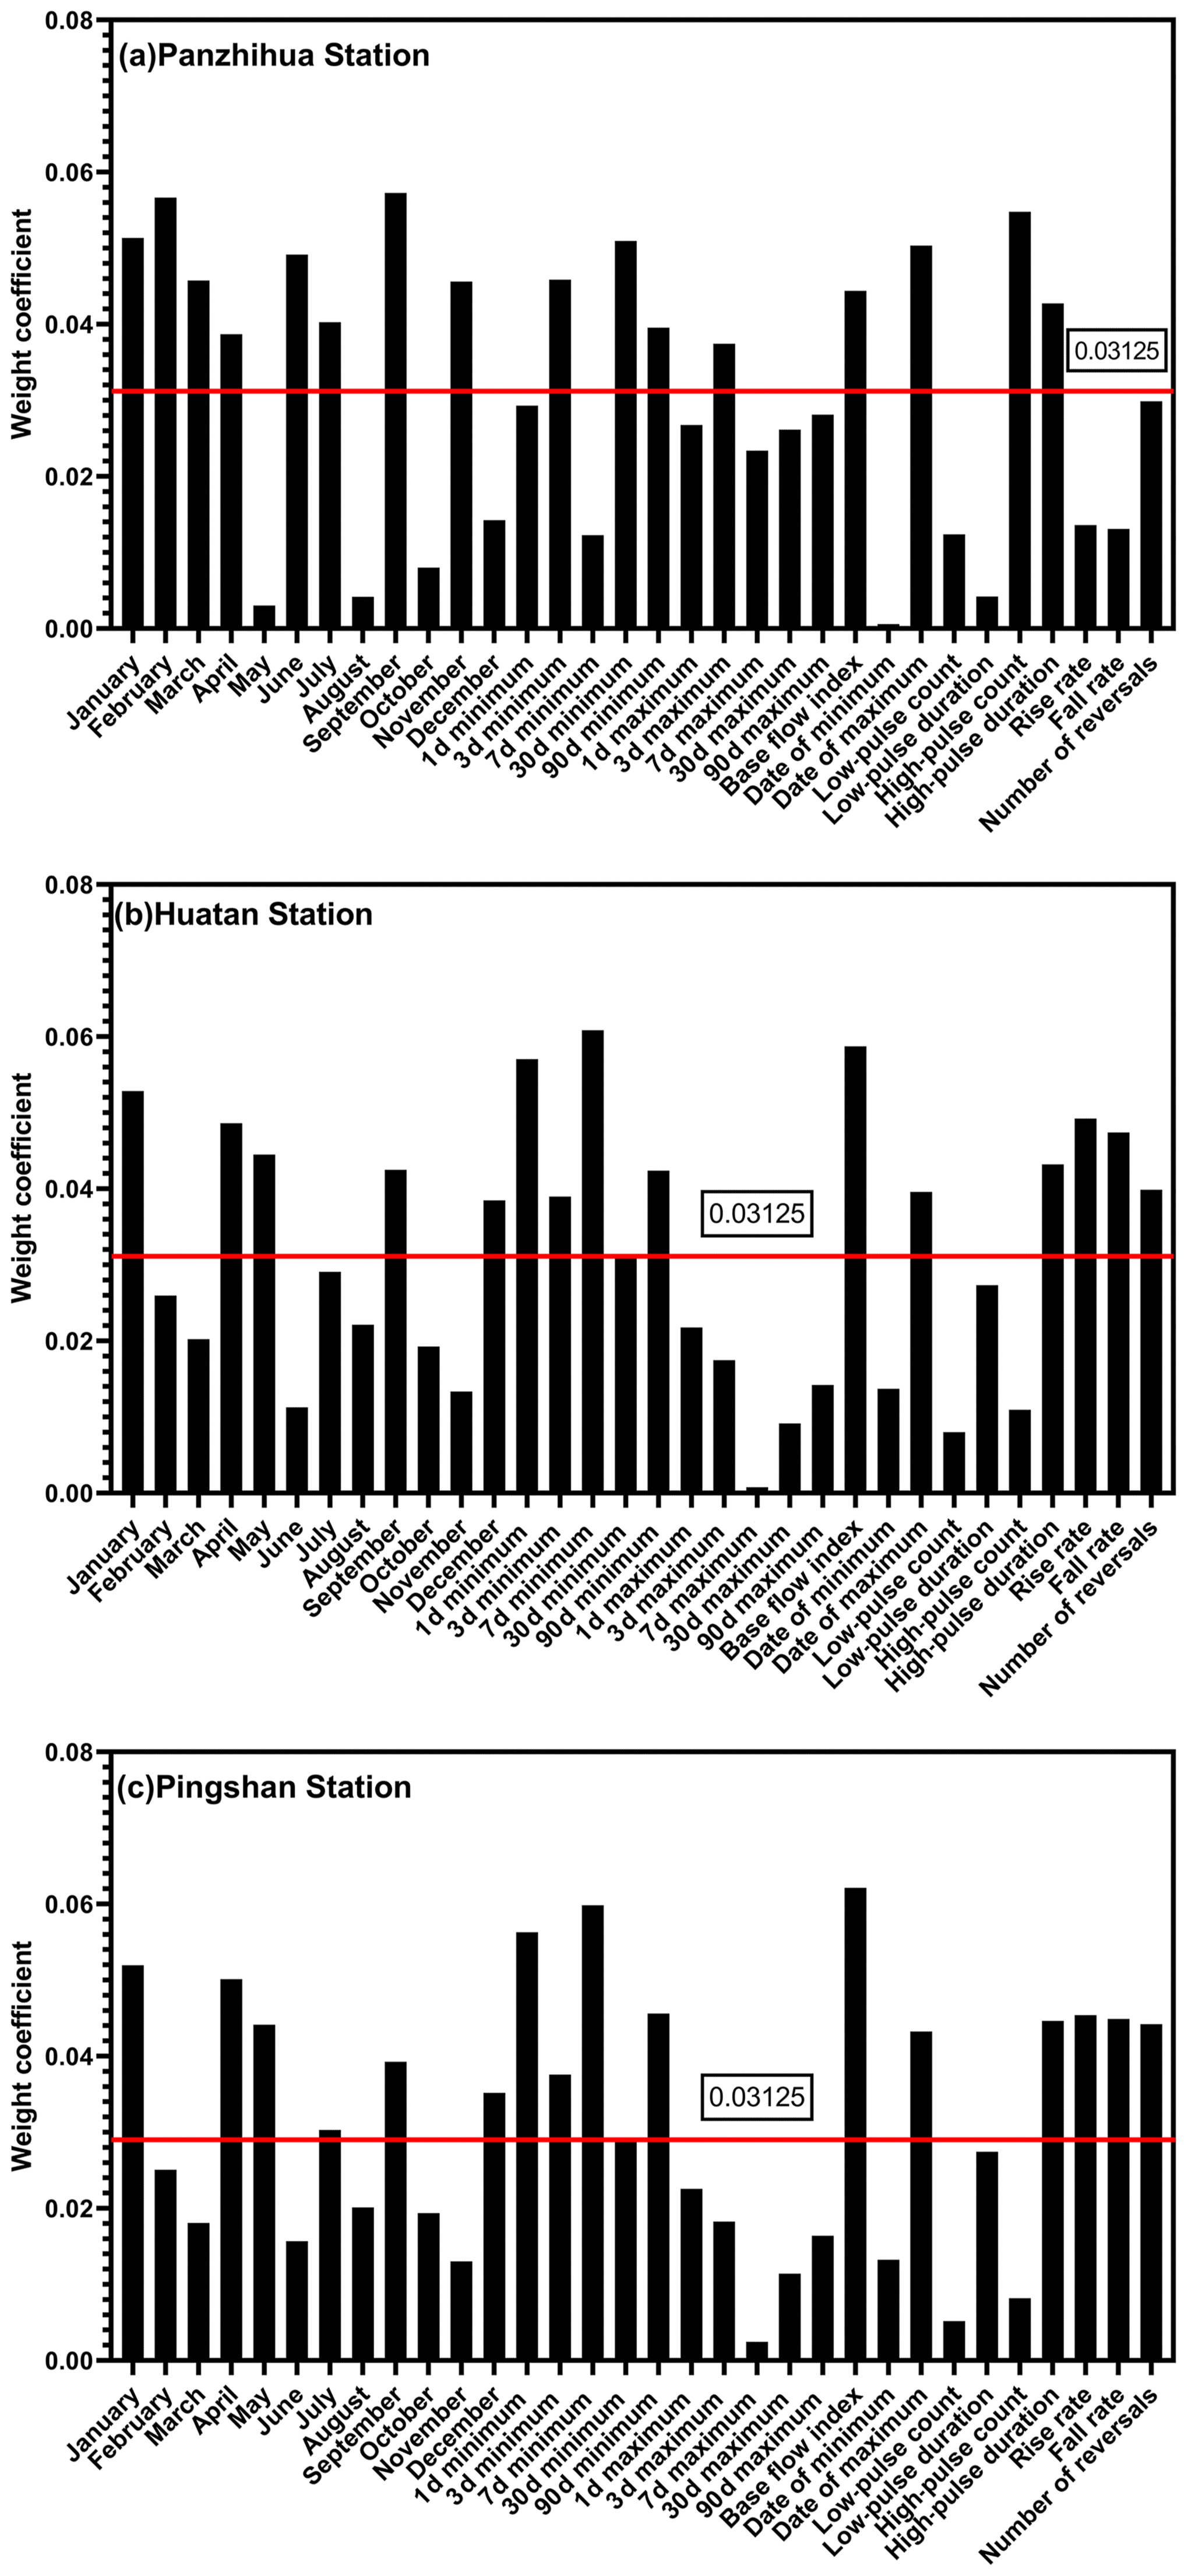
Figure 3Value of weights of 32 IHA parameters in (a) Panzhihua Station, (b) Huatan Station and (c) Pingshan Station. The red line is the equal weight line ().
The larger the optimal projection direction value is, the greater the contribution to the flow regime evaluation is, that is, the higher the weight of the indicator is. As shown in Fig. 3, at the Pingshan and Huatan stations, the weight allocations are similar (Fig. 3b and c), and the parameters with similar high-weight values (greater than 0.04) are mean flow in January, April and May; annual minimum discharge (1 d mean, 7 d mean and 90 d mean); base flow index; duration of high flow pulse; rise rate; fall rate; and number of reversals, while at Panzhihua Station (Fig. 3a), the high-weight parameters are mean flow in January, February, March, June, September and November; annual minimum discharge (3 d mean and 30 d mean); base flow index; date of minimum; and count and duration of high pulse (Table 4). This result indicates that the data structure of the characteristics of the flow regime characterized by IHA parameters has both similar and different parts upstream and downstream, and it also implies that different weights may be related to tributary imports, reservoir constructions or interval water supplies.
Table 4Alteration degree and weight of 32 IHA parameters.
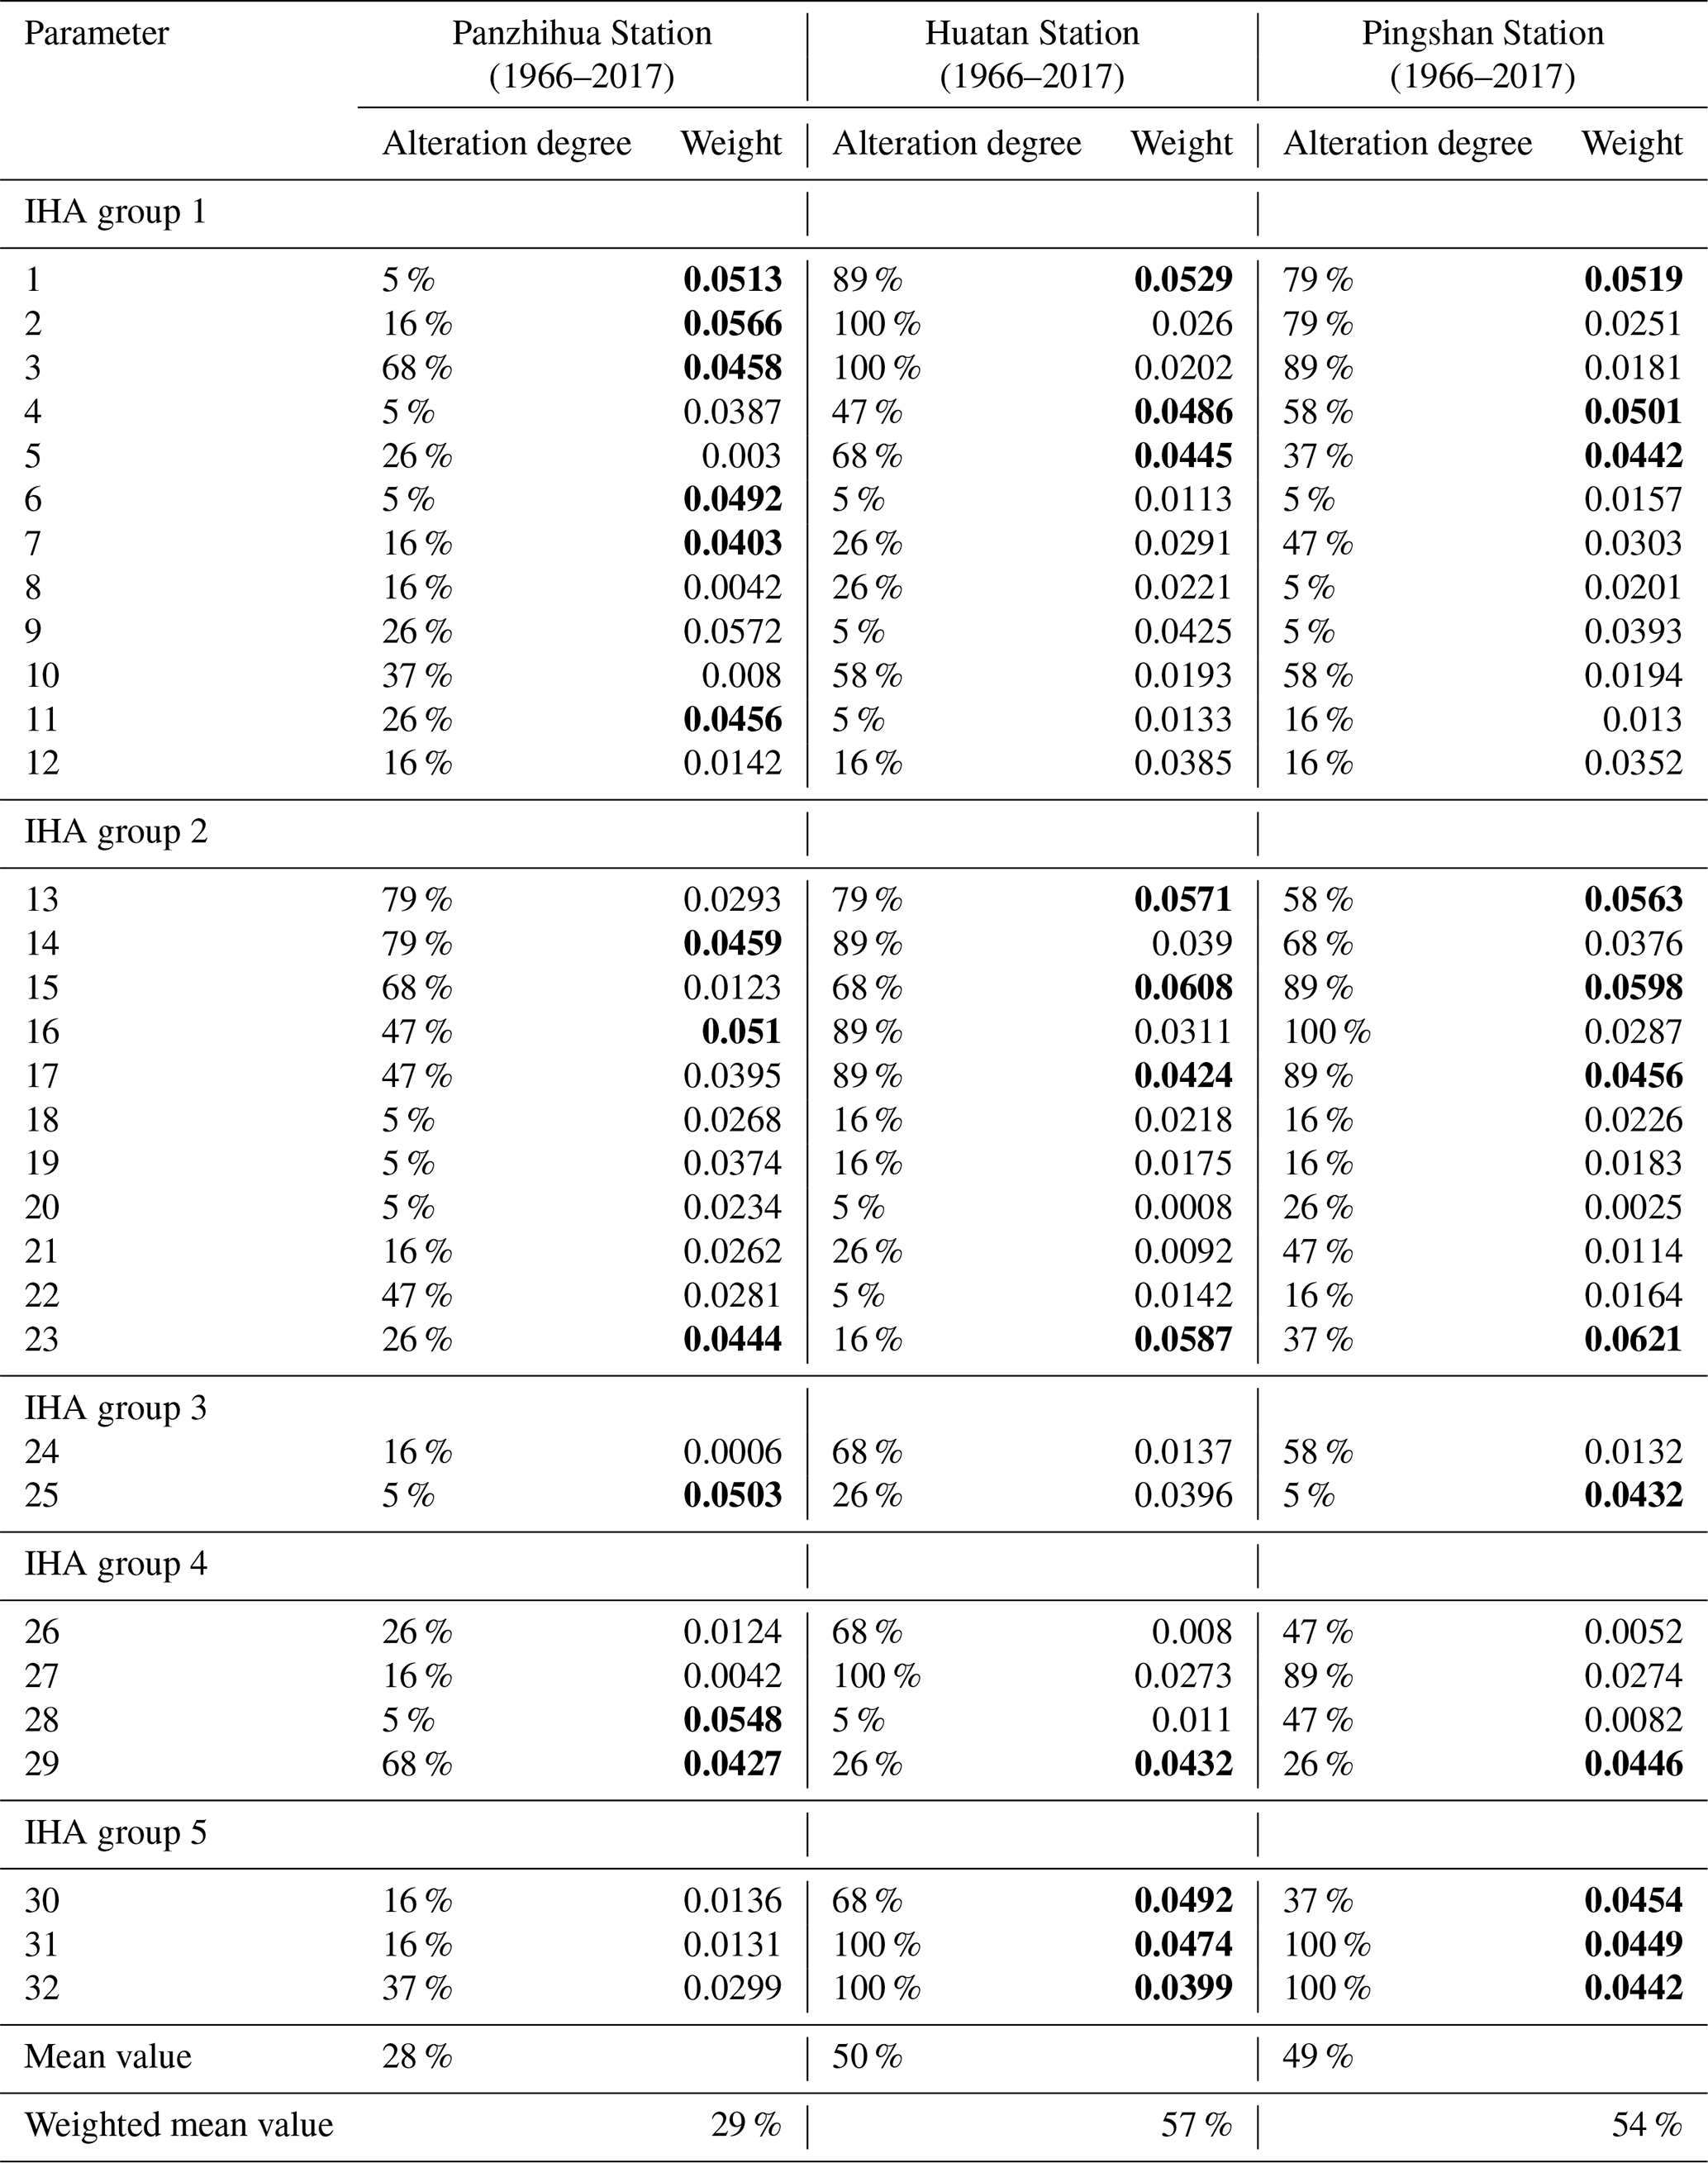
The values in bold mean high weights.
4.2.2 Projection value calculation
The projection values of the flow regime from the 1966–2017 hydrological series (Fig. 4) were obtained by substituting the optimal projection directions into Eq. (3) at three stations. The results of the trend analysis on the projection values by the MK test suggest that at Panzhihua Station, the projection values fluctuated periodically without any significant change trend (Fig. 4a), while the significant decreasing trends were found at the 1 % significance level at the Huatan and Pingshan stations (Fig. 4b and c), especially at Pingshan Station, where the decreasing trend was more intense after 2012. The projection value is a comprehensive evaluation result of flow regime changes and takes into account the monthly flow condition, the magnitude and duration of extreme discharge conditions, the occurrence time of extreme discharge conditions, the frequency and duration of high or low flow pulse, and the frequency and rate of hydrological-process changes. The larger the projection value is, the more distinct the intra-annual cyclical change in wet and dry situations is and the smaller the interference caused by human activities is. As shown in Fig. 4b and c, the projection values both began to show a significant decline in 1999, and a more significant decreasing trend was found at Pingshan Station from 2013 to 2017 (Fig. 4c). The timing of the two drastic changes coincides with the time when Ertan Reservoir in the Yalong River (tributary) and the Xiangjiaba and Xiluodu reservoirs in the lower reaches of the Jinsha River (main stream) were first put into operation. This finding also implies that the impact of giant reservoirs on the flow regime is substantial and that the degree of impact is further aggravated with the continuous construction of reservoirs.
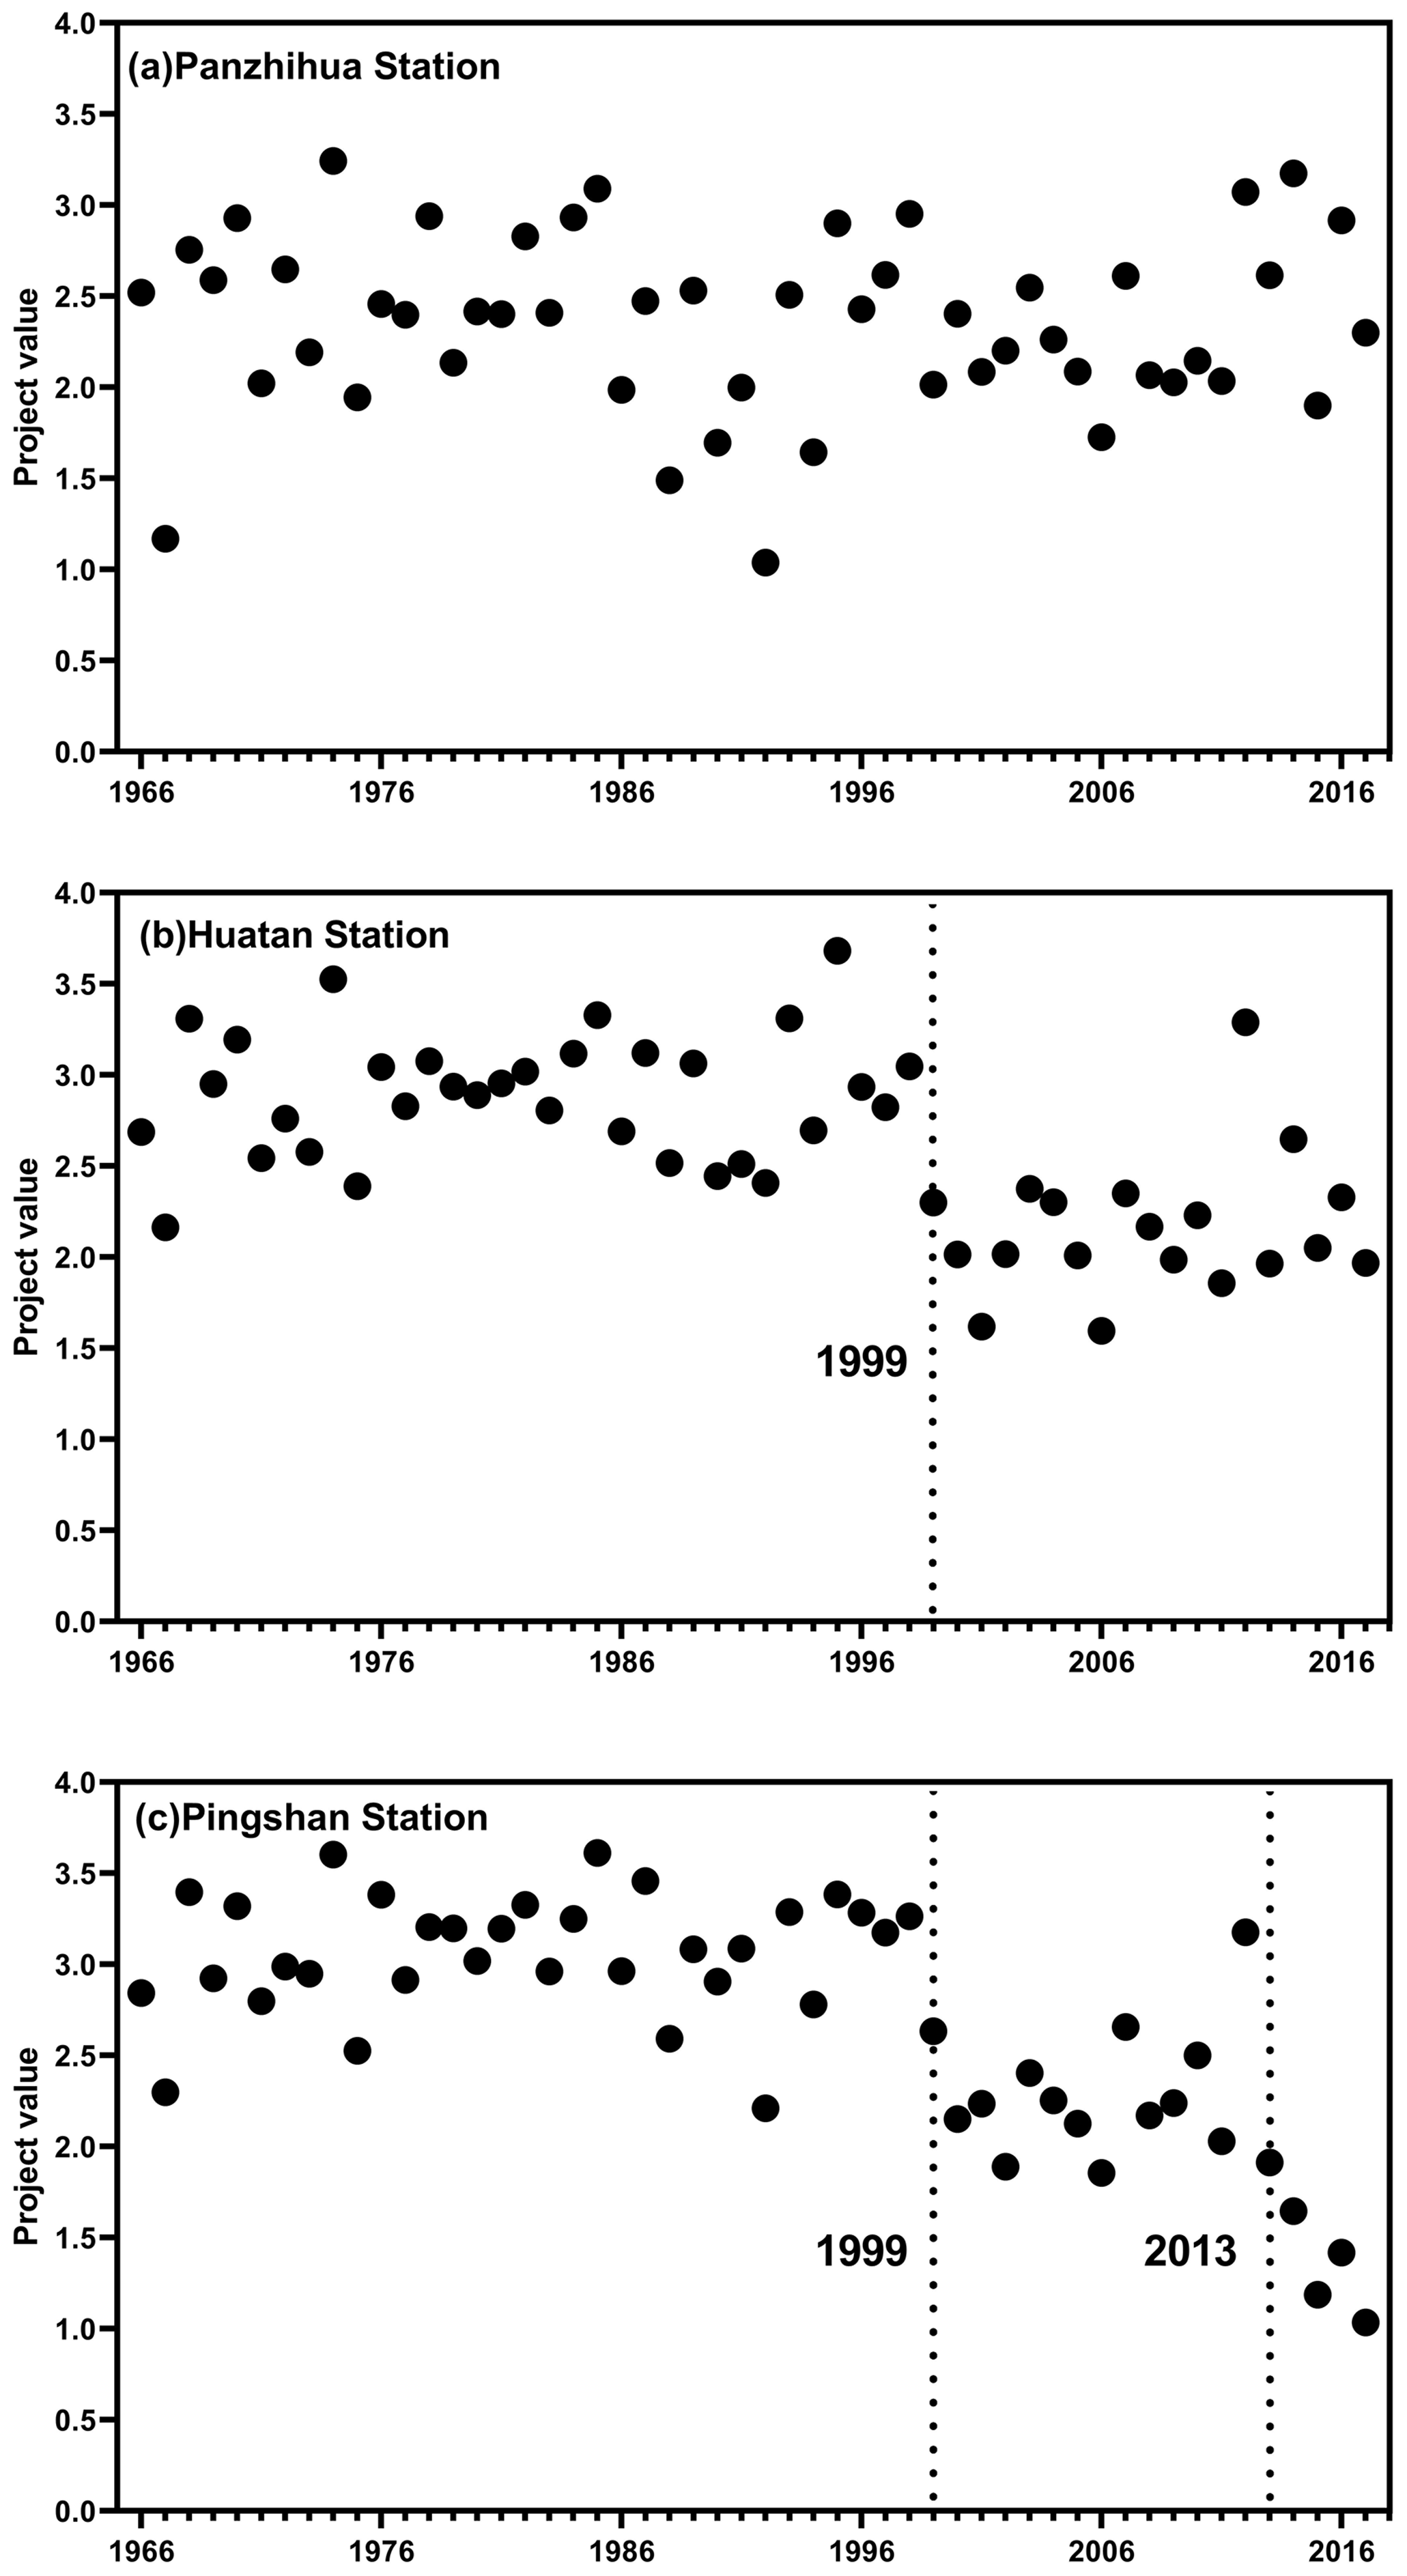
Figure 4Project values in (a) Panzhihua Station, (b) Huatan Station and (c) Pingshan Station.
4.2.3 Evaluation of the hydrological-alteration degree with a revised method
According to the commissioning time of the first generator set in Ertan Reservoir, the period of 1966–1998 is considered as the natural state of hydrological series unaffected by human activities (pre-impact period), and the period of 1999–2017 is considered as when the series is affected by human activities (post-impact period). The alterations and weights of the 32 IHA parameters are shown in Table 4. As shown in Table 4, the alteration degree calculated by the revised IHA method is larger than that by the traditional method. For the Panzhihua, Huatan and Pingshan stations, the overall alteration degrees calculated by the revised method are 0.29, 0.57 and 0.54, and those by the traditional method are 0.28, 0.50 and 0.49 by the traditional method with relative changes of 3.57 %, 14 % and 10.20 %, respectively. The traditional IHA method, analyzing overall hydrological alteration with the same weight for each parameter, constantly underestimates or overestimates actual hydrological changes, since many parameters are intercorrelated (Yang et al., 2017).
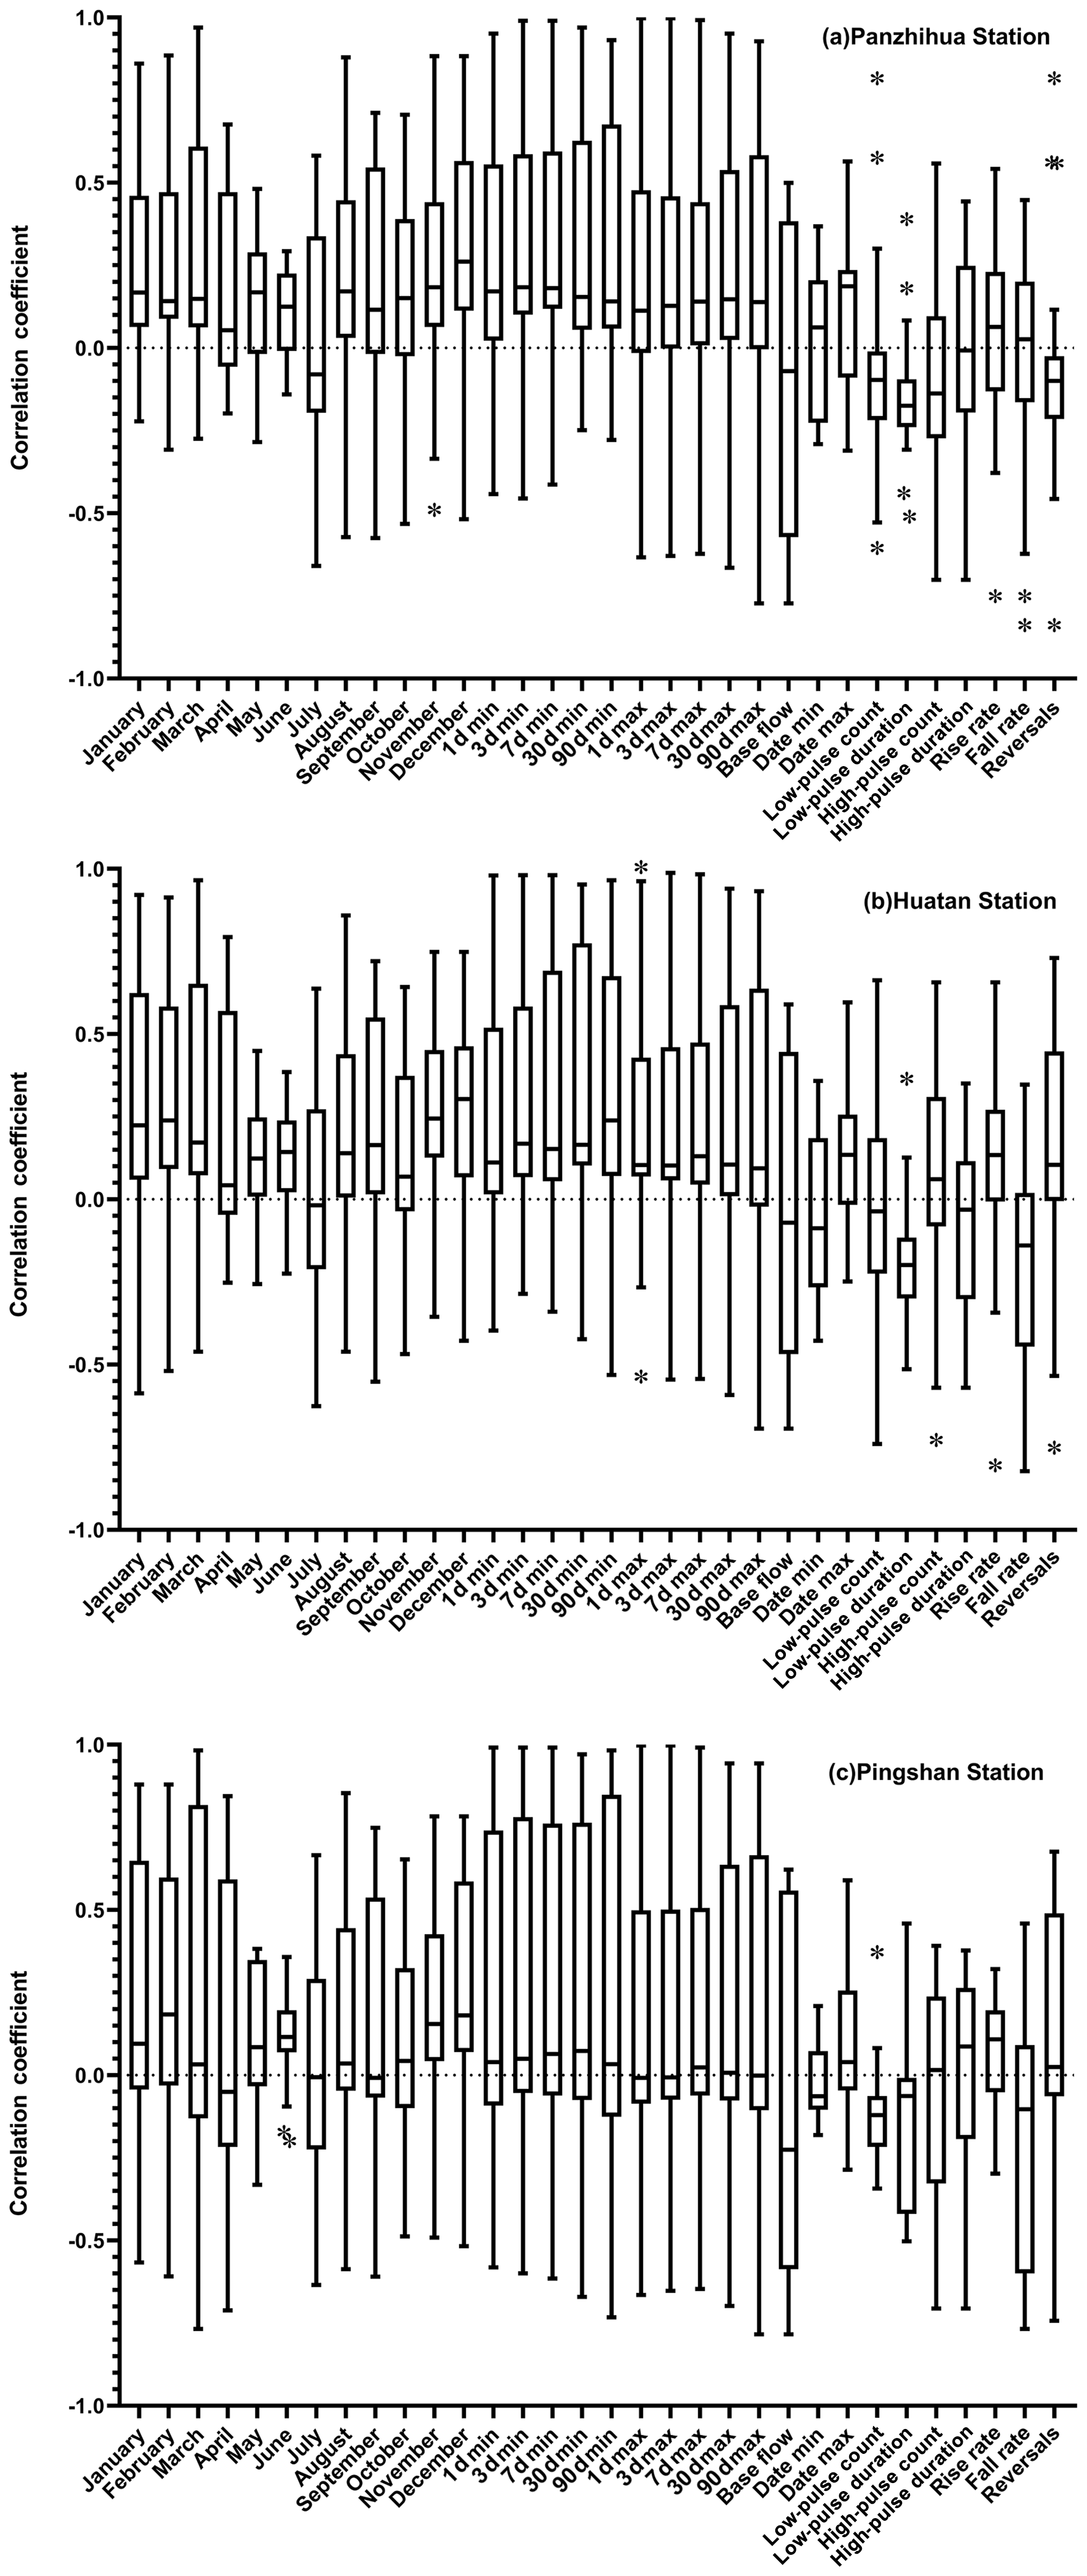
Figure 5Correlation coefficients among the IHA statistics for the observed data sets in (a) Panzhihua Station, (b) Huatan Station and (c) Pingshan Station (* means outlier).
Figure 5 illustrates boxplots of the correlation coefficients between each IHA parameter and the remaining 31 IHA parameters at the three hydrological stations mentioned above. At Panzhihua Station, the absolute values of the correlation coefficients among the IHA parameters range from 0.0016 to 0.9976, with a mean of 0.2852 (Fig. 5a). The absolute values of the correlation coefficients at Huatan Station range from 0.0 to 0.9876 with a mean of 0.2931 (Fig. 5b). The absolute values of the correlation coefficients at Pingshan Station range from 0.0012 to 0.9972 with a mean of 0.2920 (Fig. 5c). Figure 5 shows that the correlations among parameters at the Huatan and Pingshan stations are stronger than that at Panzhihua Station, which suggests that the correlations among parameters has an impact on the evaluation of the hydrological alteration when combined with the results of the above two methods. The stronger the correlation among parameters is, the greater the impact is. Panzhihua Station is located 10 km upstream of the junction of the Yalong River and the Jinsha River; therefore, operation of Ertan Reservoir does not affect its hydrological streamflow series. This is also confirmed by the fact that the overall hydrological alteration at Panzhihua Station is low.
4.3 Cumulative impacts of cascade reservoirs on the flow regime
4.3.1 Hydrological-alteration degree
The large reservoirs of Ertan, Xiluodu and Xiangjiaba were successively built along the Jinsha River. Three periods were utilized for studying the cumulative impacts of cascade reservoirs. Ertan Reservoir was put into operation in 1999, and the Xiluodu and Xiangjiaba reservoirs were both put into operation in 2013. Therefore, the first period is 1966–1998 with natural flow regime conditions; the second period is 1999–2012 with the effects of individual reservoirs; and the third period is 2013–2017 with the effects of the cascade reservoirs of Ertan, Xiluodu and Xiangjiaba. A total of 32 IHA statistics at Pingshan Station were calculated, and the weights of each parameter were obtained by PP and RAGA. For the three different periods, the alteration degrees of each parameter and the overall alteration degrees are shown in Tables 5 and 6, respectively. The cumulative impacts on the flow regime are very obvious with the successive construction of the reservoirs. During the period of 1999–2012, the number of high-alteration-degree parameters was 8, with an overall alteration degree of 47 %, while during the period of 2013–2017, the number of high-alteration-degree parameters increased to 13, with an overall alteration degree of 70 %. In particular, for the parameters of the mean flow in May (5), base flow index (23) and low-pulse count (26), the alteration degrees of the three parameters were low during the period of 1999–2012, but they became high alteration degrees during the period of 2013–2017.
Table 5Alteration degree of 32 indicators in Pingshan Station in different periods.
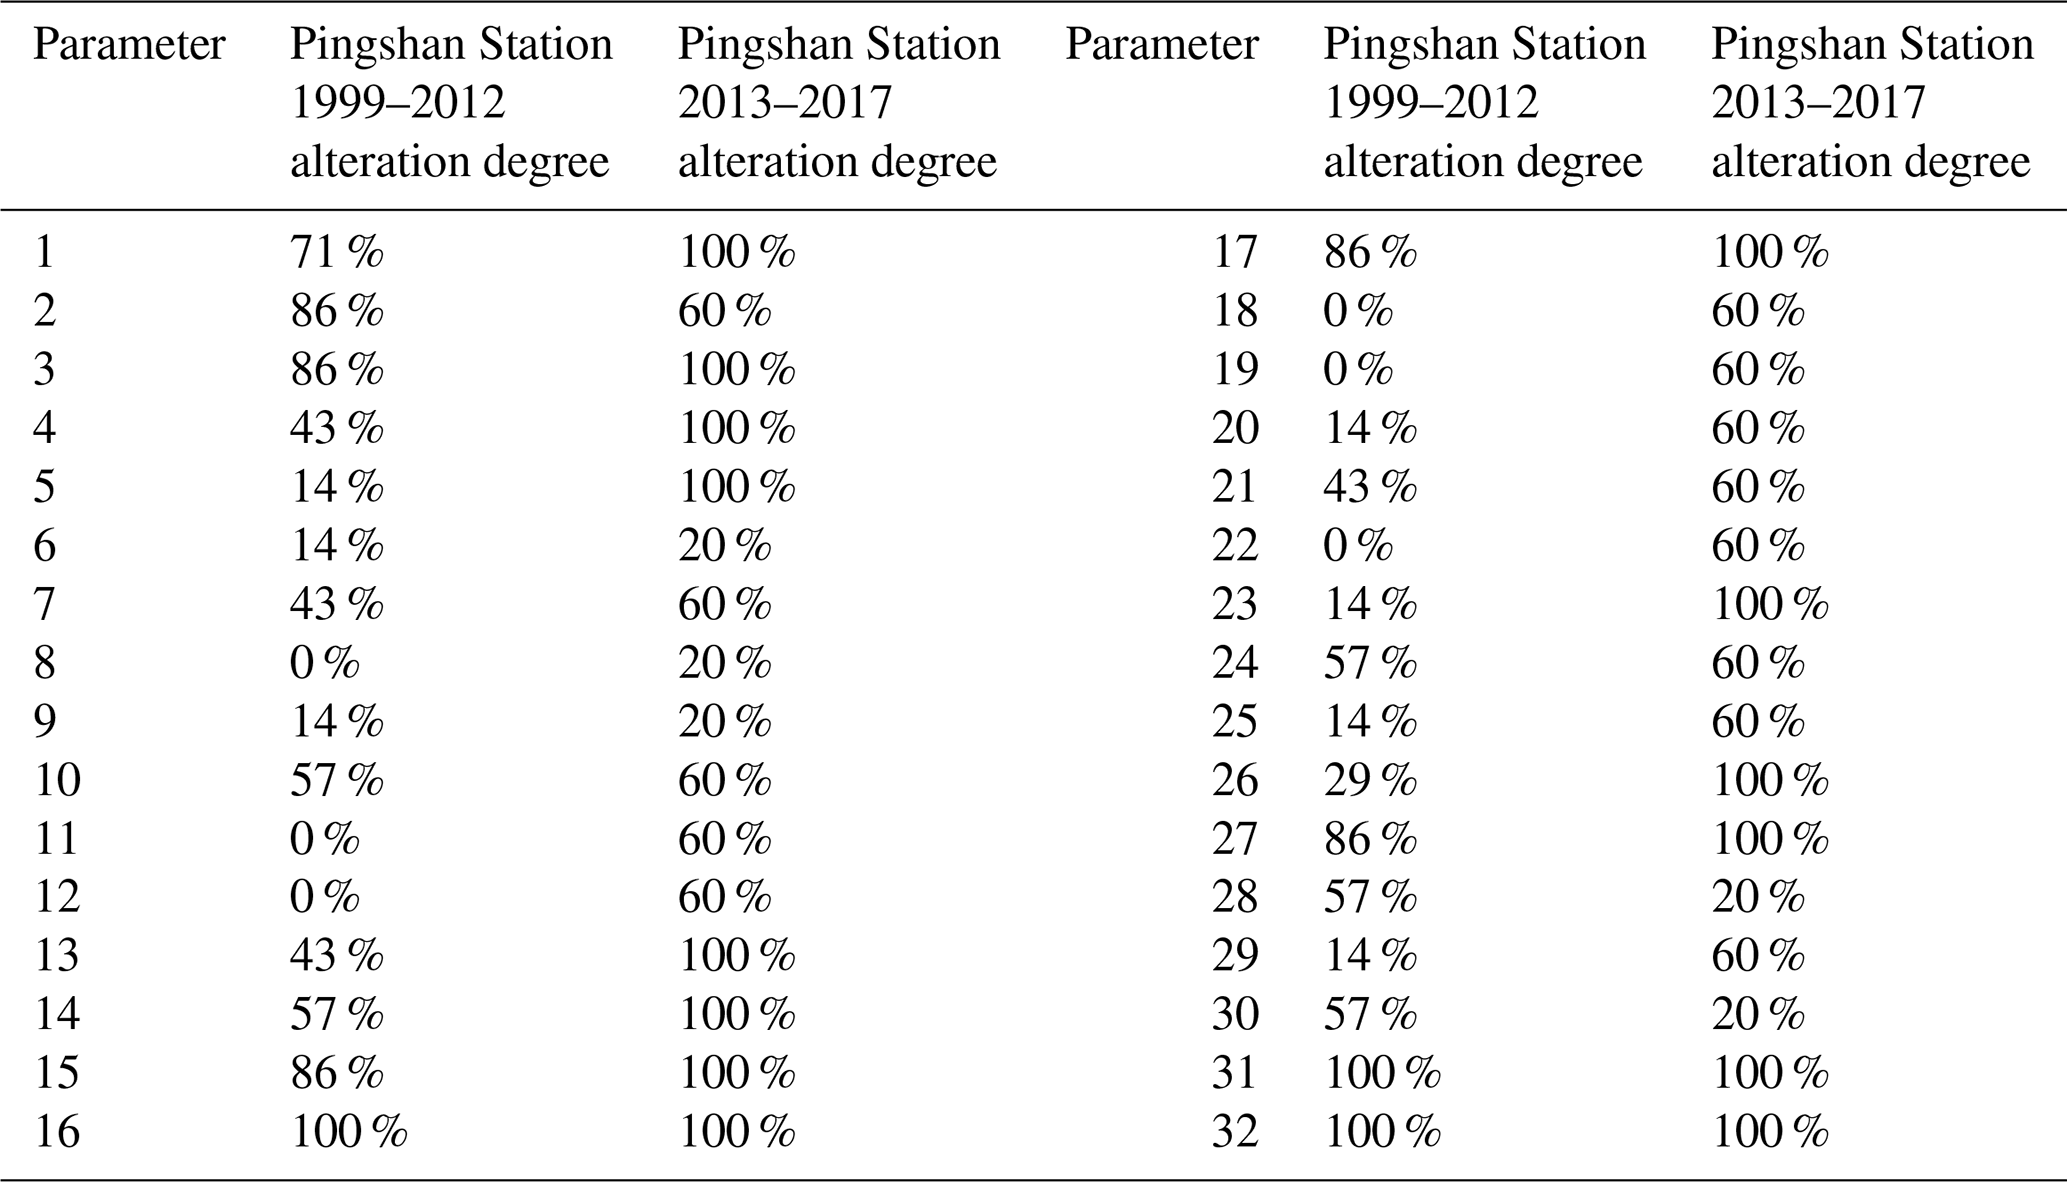
Table 6Overall degree of alteration of five groups of IHA parameters.
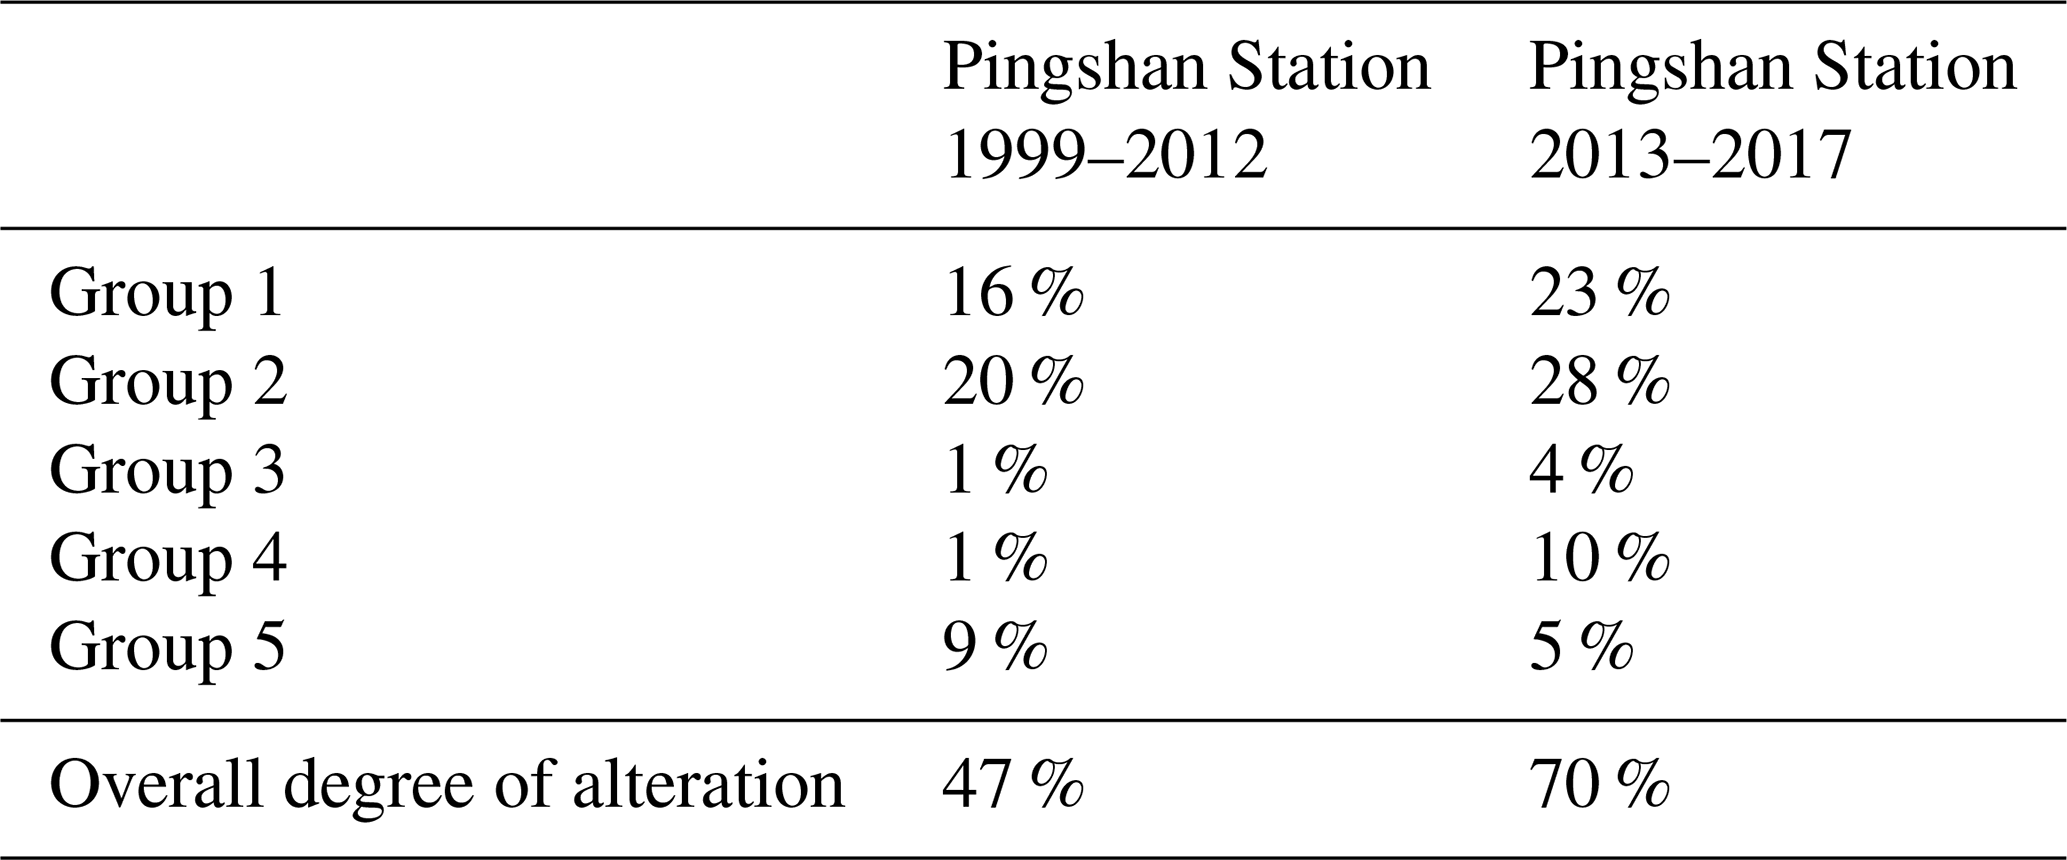
The weight of each parameter has been considered.
Huang et al. (2018) found the cumulative effect of cascade reservoirs was not a simple additive effect. Since the joint operation of cascade reservoirs for guaranteed output, flood regulation and hump modulation were complicated; a decreasing trend in the impact of reservoir operation on downstream hydrological conditions along the direction of flow of the Jinsha River could be found, while the runoff averaging effect became more evident. Zhang et al. (2020) found the impacts of anthropogenic factors on water discharge were more significant than the impacts of precipitation, especially for the high discharge during flood season. In this paper, the increasing trends in the alteration degree were shown in groups 1, 2, 3 and 4, especially for the indicators of maximum or minimum flow in group 2; the change of extreme flow was the main reason for the averaging effect of the river. However, group 5 showed a decreasing trend in alteration degree, and this could mainly result from the joint operation of cascade reservoirs. For the single reservoir, its limited regulation ability made the rate of change and reversals show dramatic and uncertain changes, while for the cascade reservoirs, their joint operation with strong regulation ability enhanced the averaging effect and also made the rate of change stable, especially for the ecological regulation that has been implemented in recent years, trying to maintain the flow changes under similar natural conditions during the spawning period of fish.
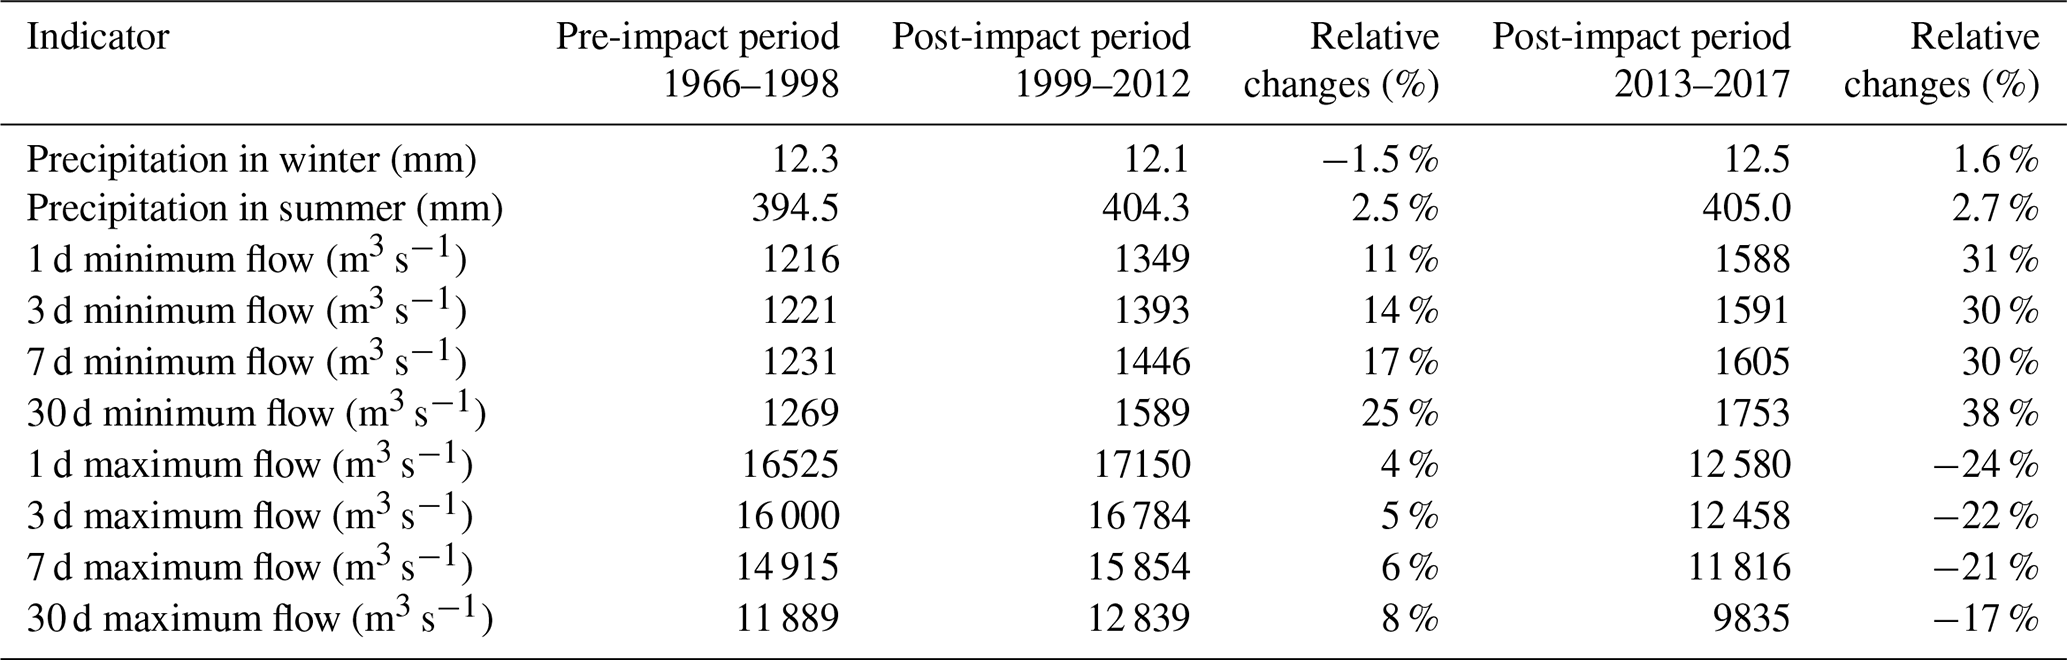
As shown in Table 7, compared with the period of 1966–1998, the changes in winter precipitation during the periods of 1999–2012 and 2013–2017 were very small, −1.5 % and 1.6 %, respectively, but the minimum flow values of the two periods increased by approximately 11 %–25 % and 30 %–38 %, respectively. However, slightly different changes in the flow regime were found in summer. Precipitation in summer had slight increases during the two periods, 2.5 % and 2.7 %, respectively. Significant decreases in maximum flow values were found during the period of 2013–2017, approximately 17 %–24 %. However, during the period of 1999–2012, the maximum flow values increased by 4 %–8 %, which is basically consistent with the increase in precipitation. These findings suggest that during the period of 1999–2012, only Ertan Reservoir was operating in the tributary; therefore, its ability to control runoff and the impact on hydrological conditions on the outlet section of the basin were limited. In summer, the changes in the flow regime were mainly influenced by precipitation. However, in winter, the regulation of Ertan Reservoir was still relatively obvious. With the operation of the Xiluodu and Xiangjiaba reservoirs in the main stream, the impacts of reservoir regulation on the flow regime were greater in summer than before.
Table 7Changes in the annual minimum and annual maximum flows between the periods 1966–1998, 1999–2012 and 2013–2017 in Pingshan Station.
4.3.2 FDC analysis
To better compare and analyze the cumulative effect of cascade reservoirs on the flow regime, 2 years were selected at Pingshan Station, that is, 2004 and 2016, based on the annual flow of periods of 1999–2012 and 2013–2017 (Fig. 6). These years represent the years with an annual flow in the 50th percentile, and their annual mean discharges are 4796 and 4063 m3 s−1, respectively. Compared with the annual FDC above the 20th percentile in 2016, the high flow in 2004 was larger. The high flow above the 20th percentile of the FDC typically occurred in summer (Gao et al., 2012), and the precipitation anomalies (the deviation from the mean) in summer were 0 mm in 2004 and −29 mm in 2016. The summer runoff was basically consistent with precipitation in the same period, indicating that summer runoff changes are mainly caused by seasonal precipitation changes. By analyzing the annual FDCs between the 20th and 60th percentiles, we found that the flow in 2016 was smaller than that in 2004. This flow occurred mostly in fall, and the fall precipitation anomalies were −3 mm in 2004 and −47 mm in 2016. We analyzed the consistency of the underlying surface in the two pre- and post-impact periods, and the results indicate that the precipitation–runoff correlation trend lines for the two periods nearly coincide (Fig. 7). Therefore, the main reason for the phenomenon in fall is the accumulation of the impact of reservoir storage after the Xiangjiaba and Xiluodu reservoirs were put into operation. The cumulative impact was much larger than the single impact of Ertan Reservoir before 2012. At the same time, even if there was a large increase in precipitation in the fall of 2016, the impact of precipitation on the flow was also weakened by the cumulative impact of water storage. The low flows below the 80th percentile of the FDC occurred in winter, and two typical annual FDCs during the pre-impact period (the 25th percentile FDC and the 75th percentile FDC) were almost coincident during the low flows. This indicates that the changes in runoff in the dry season were slight during the pre-impact period. The winter precipitation anomalies were −3 mm in 2004 and 3 mm in 2016. Therefore, the reservoir water release was the main reason that the annual FDCs below the 80th percentile in 2004 and 2016 were generally above two typical annual FDCs. Due to the cumulative effect, the low flow in 2016 was even higher than the low flow in 2004.
4.4 Data reliability analysis
The characterization of natural and altered flow regimes using IHA requires adequate flow data (Zhang et al., 2019). Richter et al. (1997) suggested using > 20 years of pre- and post-impact data to characterize the hydrologic regime. Timpe and Kaplan (2017) found that fewer than 20 years of data could be used to yield statistically significant IHA results for a number of rivers across the Amazon by using the length of record (LOR) method. Given this uncertainty, further research is needed to determine the reliability of the data required by IHA. We chose 47 years from 1952 to 1998 at Huatan Station as the LOR calculation period with the smallest anthropogenic impact and the longest record length in the study area. Table 8 shows the length of record required for the 32 IHA parameters within 5 % and 10 % long-term mean errors at different specified confidence intervals at Huatan Station. Comparing the results between different groups, it is observed that the data volume requirement in group 4 is the highest, while when comparing and analyzing within the same group, it is observed that the amount of data required to describe the parameters for low flow is less than that required to describe the parameters for a relatively high flow. For example, the amount of data required for monthly mean flow in the flood season is higher than that for the monthly mean flow in the dry season in group 1. Zhang et al. (2019) found that the amount of data required has a consistent relationship with the amount of average monthly flow and the variability in hydrological data. Both the Huatan and Pingshan stations are located downstream of the Jinsha River with similar hydrologic regimes (Fig. 3). Referring to the results of Table 8, the 33-year daily streamflow data from 1966 to 1998 at Pingshan Station fully satisfy the highest requirement (31 years) to produce a 10∕85 LOR result for all parameters. These data also satisfy the requirement to produce a 10∕90 LOR result except that the parameter of high-pulse duration requires 34 years for analysis. Furthermore, the number of the IHA parameters that satisfy the requirement to produce 10/95, 5/85, 5/90 and 5/95 LOR results are 30, 30, 28 and 28, respectively. This indicates that the 33-year daily streamflow data at Pingshan Station could capture intra- and interannual flow variations. At the same time, the 19 years of post-impact data we collected from 1999 to 2017 could mainly satisfy the data requirement for analysis. Therefore, the data collection in this study basically satisfies the requirements for the analysis, and the overall evaluation of the hydrological-alteration degree is basically reasonable.
Table 8Length of record (LOR) results for each IHA parameter in Huatan Station.
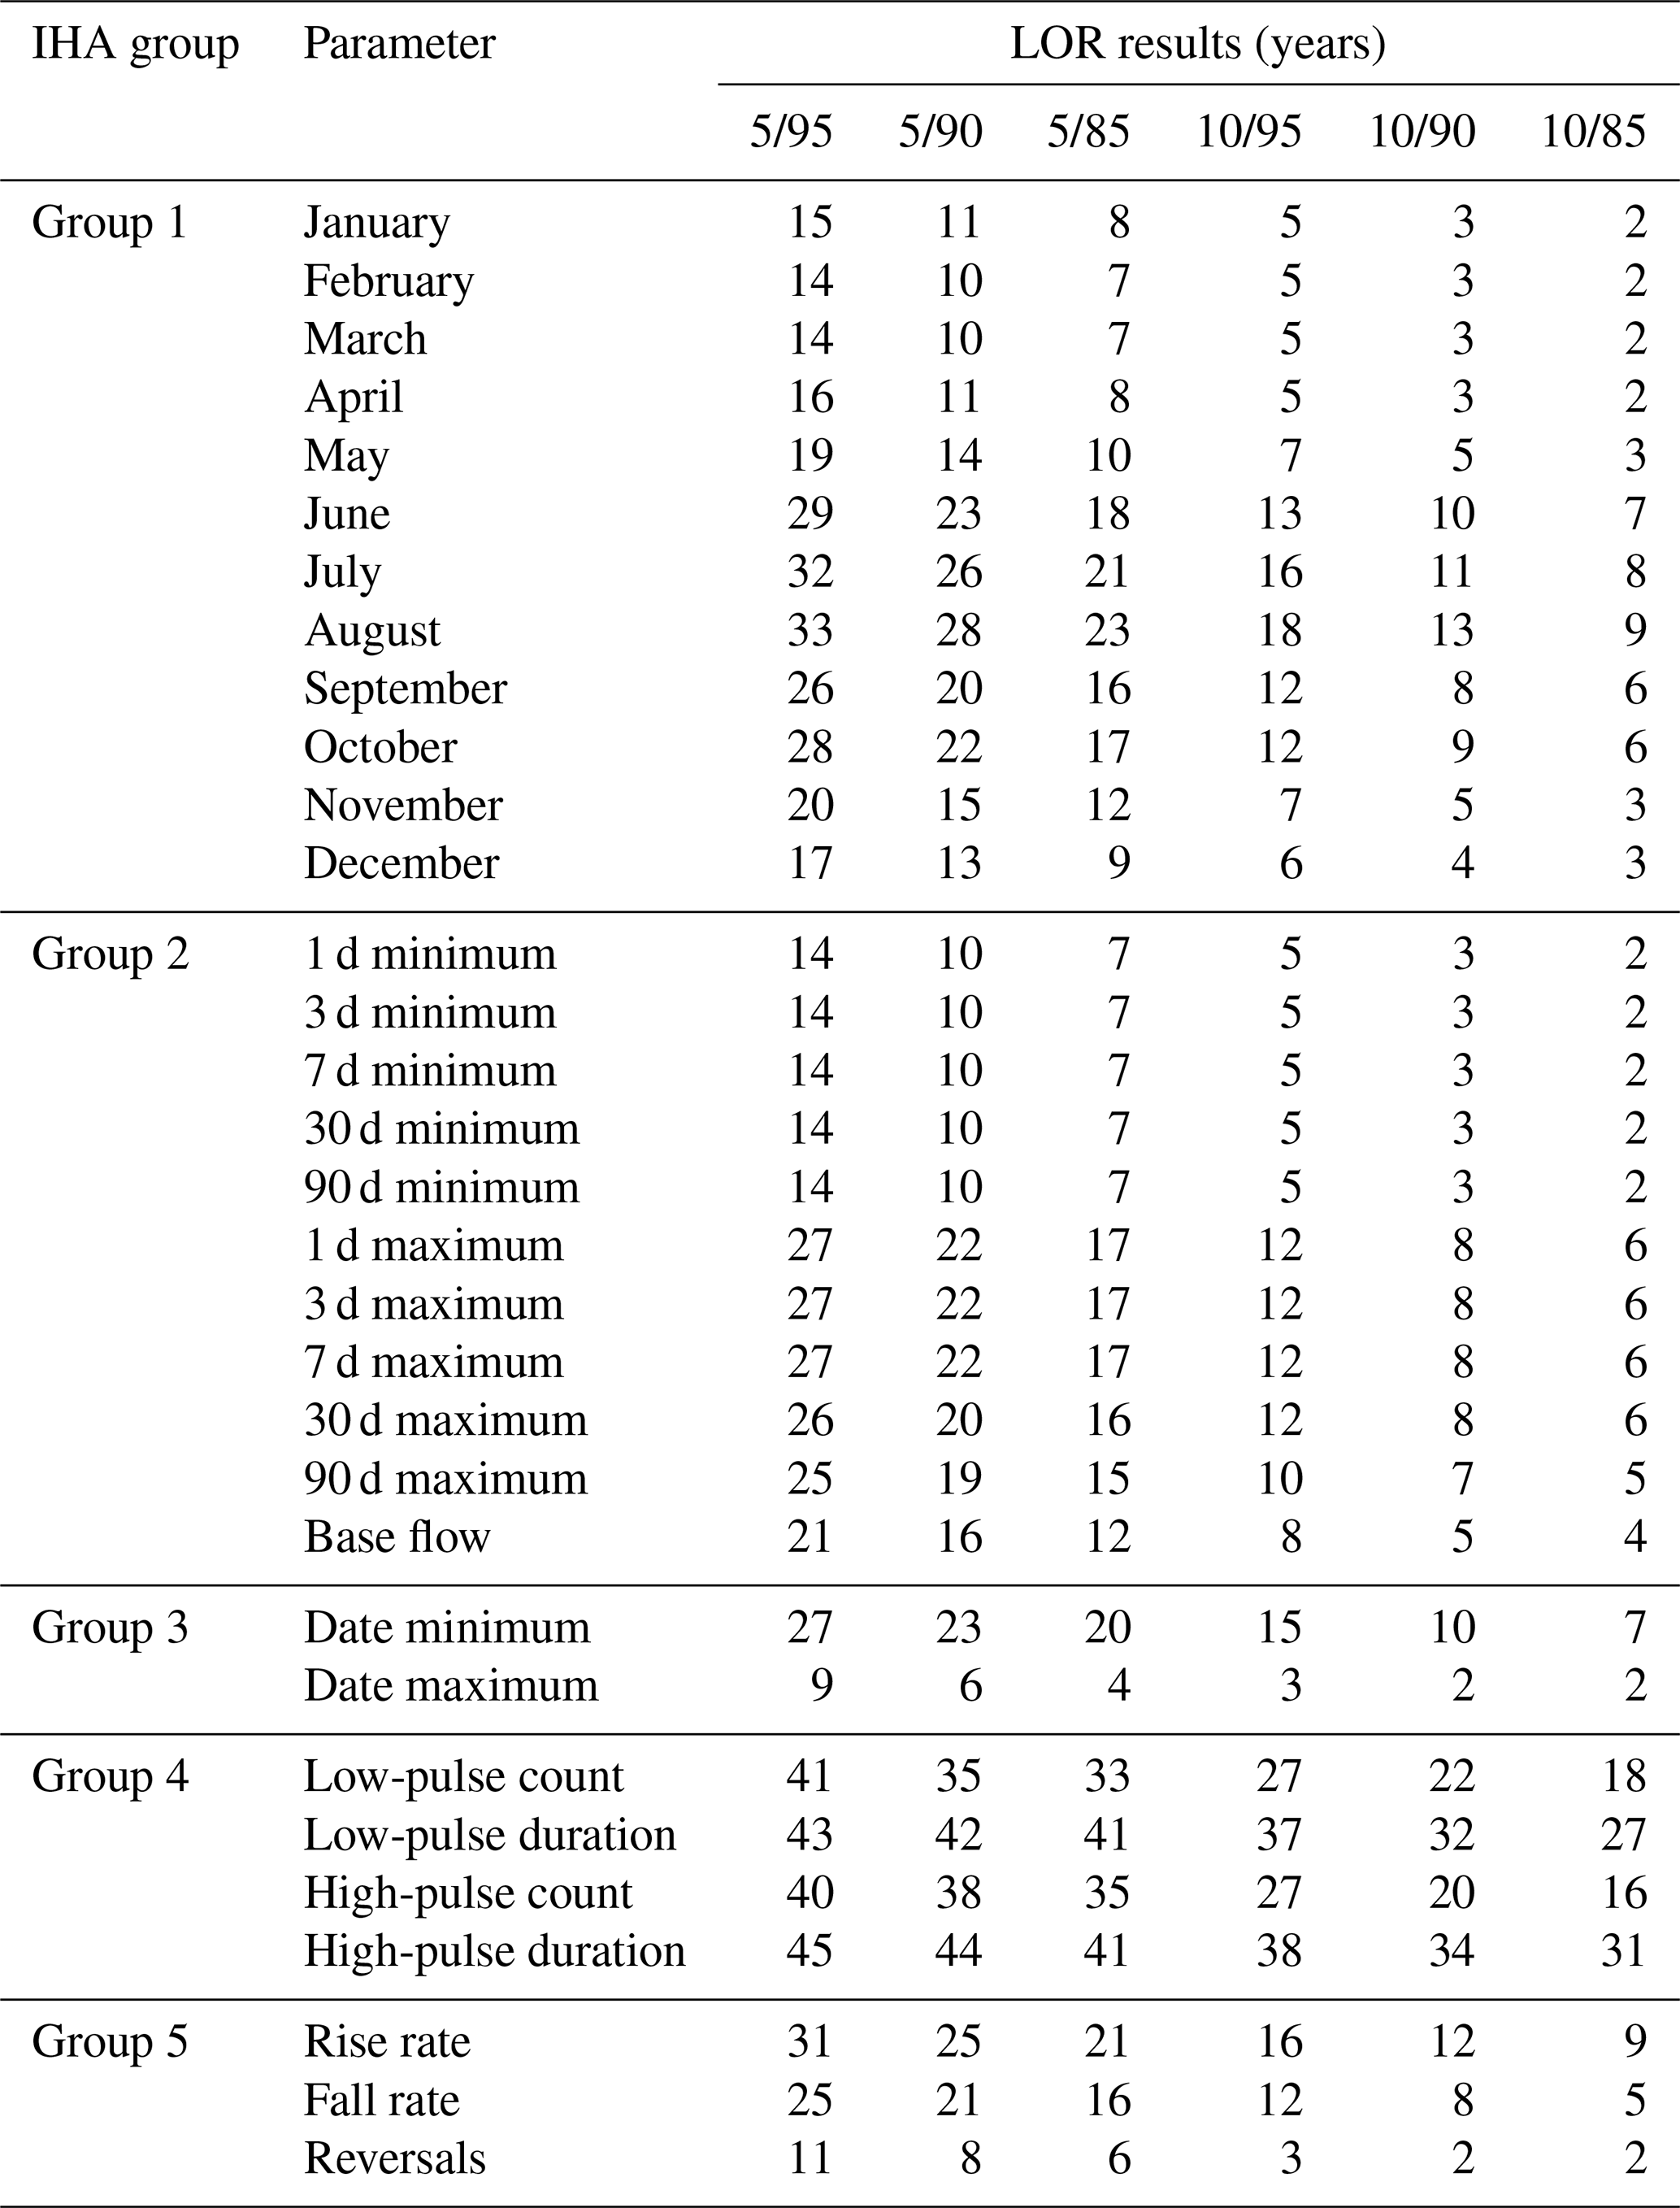
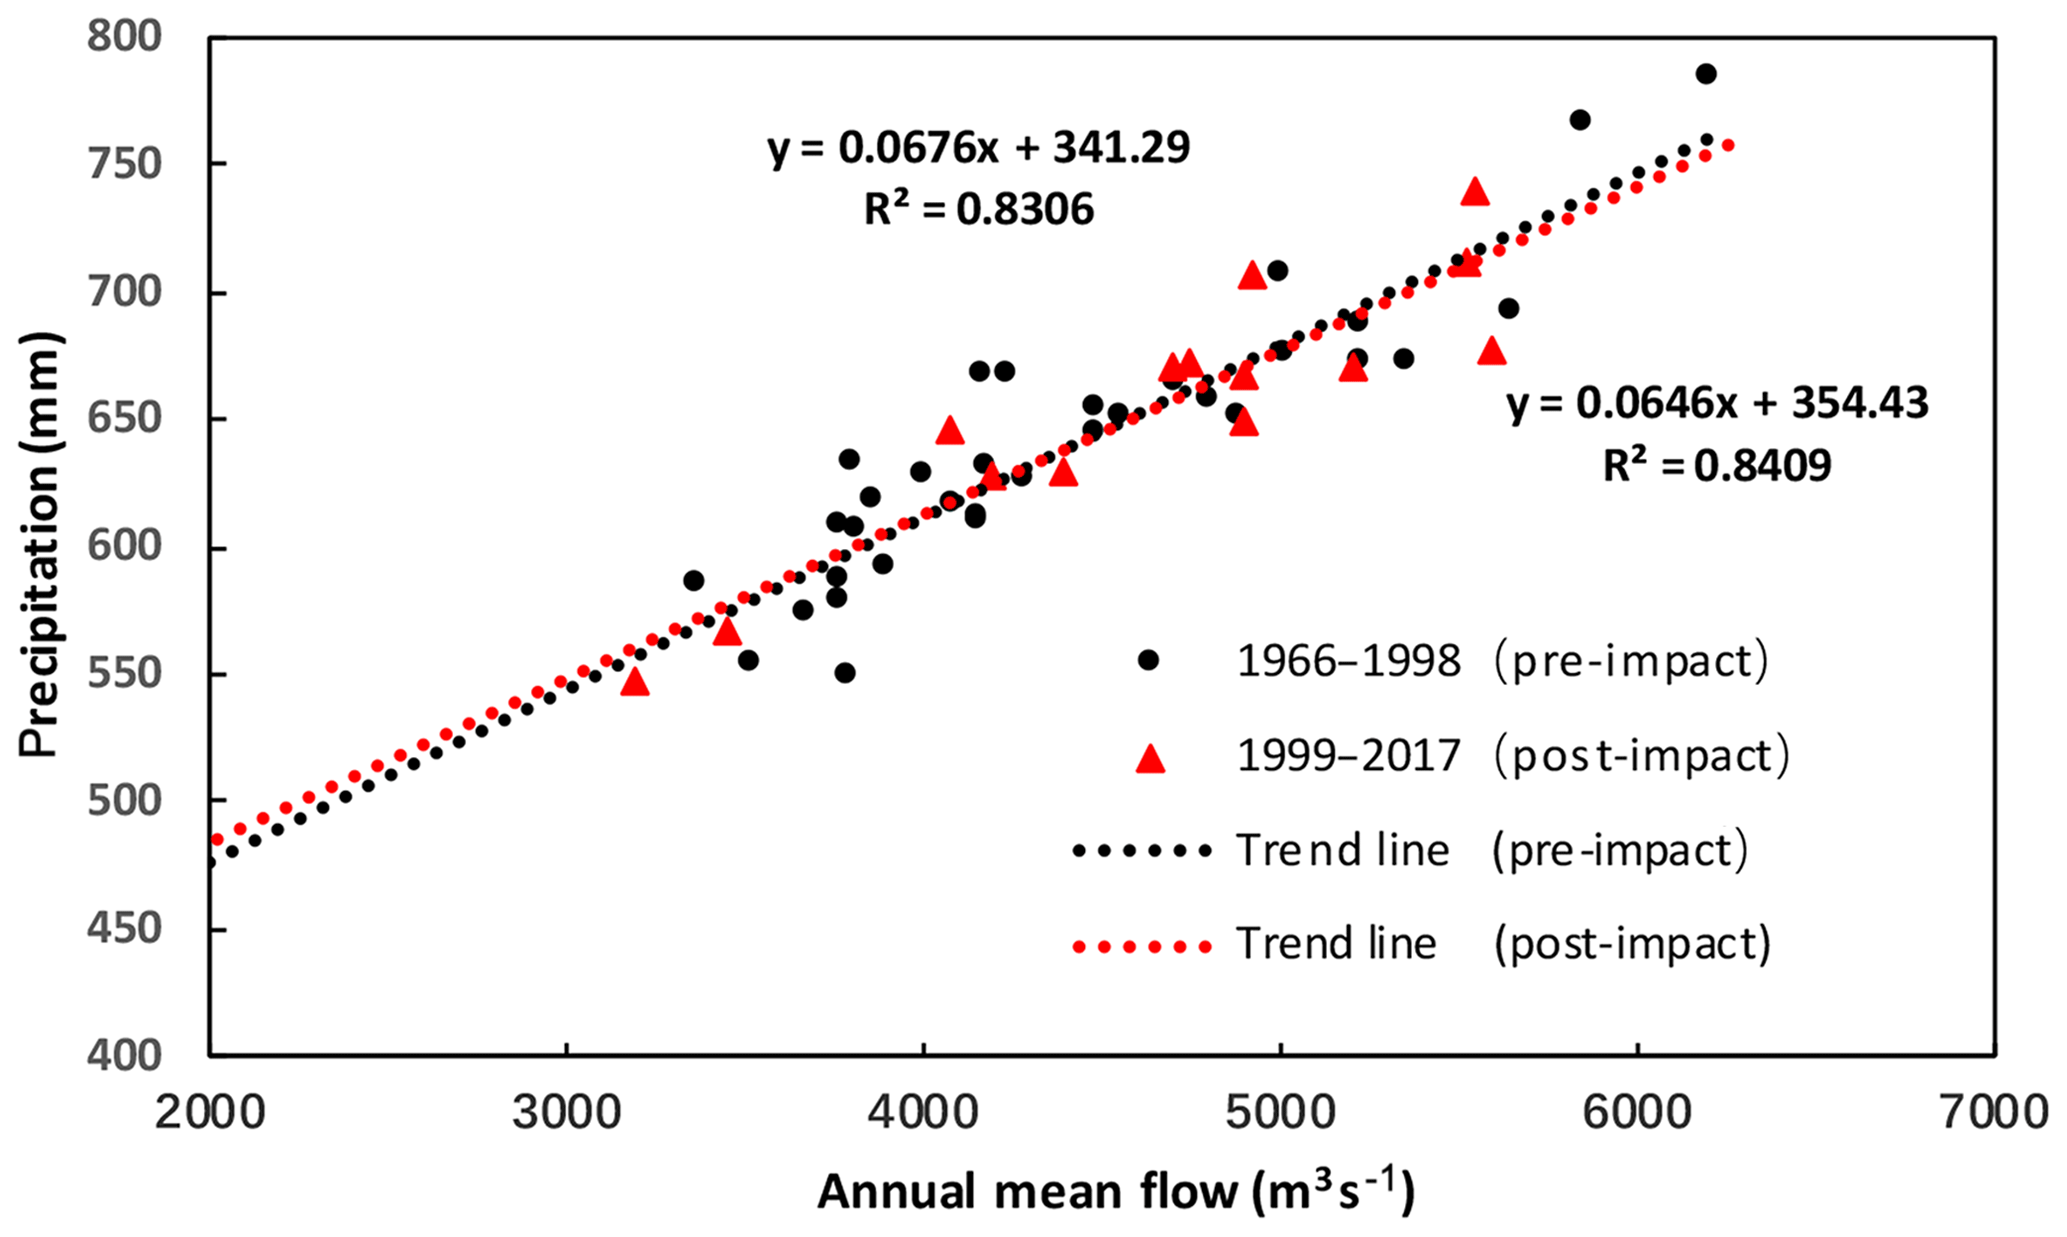
Figure 7Correlation between runoff and precipitation for the periods of pre- and post-impact in Panzhihua Station.

Figure 8Hydrograph for daily average inflow, outflow and reservoir water level in the (a) Xiluodu and (b) Xiangjiaba reservoirs.
4.5 Attempts at ecological regulation
Li et al. (2006) found that the total number of days with rising water from May to June in the Yangtze River is an important environmental driving factor that determines the amount of spawn produced by fish with pelagic eggs. Four major Chinese carps are typical fish with pelagic eggs and the most widely distributed species in protected areas. The cumulative impact of the construction and operation of cascade reservoirs on the flow regime in the downstream nature reserve of the Jinsha River has aroused widespread concern. During the period from 15 to 18 May 2018, the management institution conducted a joint ecohydrological regulation test of the Xiluodu and Xiangjiaba reservoirs for 4 d (Fig. 8). On 15 May, the outflow discharge of Xiluodu Reservoir was 2770 m3 s−1, and it increased to 3420 m3 s−1 on 16 May. After that, it increased slightly to 3470 m3 s−1 in the next 2 d. On May 14, the outflow discharge of Xiangjiaba Reservoir was 2740 m3 s−1, and it increased to 3330 m3 s−1 on 15 May. Then, it evenly increased 300 m3 s−1 every day and reached 4320 m3 s−1. Ecological regulation promoted the spawning of fish. The Yibin monitoring section showed obvious spawning during the ecological regulation period, and fish spawning under the reservoir was obviously stimulated. The spawning peak was found at the Jiangjin monitoring section on the sixth day after the end of the regulation. Before the regulation, the amount of spawning was much lower in the Jiangjin monitoring section, but a significant increasing trend was found during the regulation and after the regulation. During the period of joint regulation, the number of fish eggs was 3 million in the Yibin section, 7 million in the Luzhou section and 173 million in the Jiangjin section. The result of a joint regulation test indicates that the spawning of four major Chinese carps generally took place along with the artificial flooding process, and there was a delay of several days between the peak of spawning and the peak of flood. Before the operation of the Xiluodu and Xiangjiaba reservoirs from 1966 to 2012, the average coefficient of variation (CV) value of runoff at Pingshan Station in May was 0.204, while after the operation of the two reservoirs, the CV values in 2013, 2014, 2015 and 2016 were 0.138, 0.134, 0.245 and 0.174 (with an average of 0.173), respectively. The joint ecological regulation was implemented in 2017 and 2018, and the CV values at Pingshan Station in May were 0.243 and 0.181. It indicates that the ecological regulation in May has a positive repairing effect on fish reproduction signal and the artificial flood process caused by manual regulation can promote the spawning of these four major Chinese carps. In addition to the natural reproduction of the four major Chinese carps, the feasibility of studying other important species is still in progress.
In this study, a revised IHA method is presented by combining projection pursuit (PP) with a real-coded genetic algorithm (RAGA) to obtain the weight of each IHA parameter. The method is applied to assess the cumulative impacts of cascade reservoirs on the flow regime in the Jinsha River. The main points can be summarized as follows:
-
The impacts of the construction and operation of the cascade reservoirs on the flow regime are huge. Using the revised IHA method to analyze the cumulative effects of the Ertan, Xiangjiaba and Xiluodu reservoirs on the flow regime of the outlet section of the Jinsha River, we found that with the continuous construction of the reservoir, the alteration degrees of IHA parameters in groups 1, 2, 3 and 4 are gradually increasing but are decreasing in group 5 (rise rate, fall rate and number of reversals). Due to reservoir water storage and release, the FDC shows decreasing trends in high flow and increasing trends in low flow. The whole curve shows the characteristics of a head drop and a tail lift. The maximum flow is reduced, and the minimum flow is increased. The rate and frequency of discharge changes tend to be subtle. As the cascade reservoirs are completed, the flow regime alteration at the outlet section is more stable. This change has a negative impact on downstream fish reproduction and ecological protection.
-
The traditional IHA method employs 33 parameters to quantify the characteristics of flow regime changes and analyze the overall hydrological alteration with the same weight for each parameter. The revised IHA method gives each parameter its own weight by applying a projection pursuit model to project high-dimensional data into a low-dimensional space and optimize the projection direction of each parameter. This method achieves a more reasonable evaluation of hydrological alterations and overcomes the problem of underestimating the hydrological alterations in the study area due to the difference in the degree of alteration and the intercorrelation among IHA parameters.
-
Previous studies have suggested using > 20 years of pre- and post-impact data to characterize the hydrologic regime. In this study, we chose 47 years from 1952 to 1998 at Huatan Station as the LOR calculation period. As a reference, the 33-year daily streamflow data from 1966 to 1998 at Pingshan Station fully satisfy the highest requirement (31 years) to produce a 10∕85 LOR result. These data also satisfy the requirement to produce a 10∕90 LOR result except that the parameter of high-pulse duration requires 34 years for analysis. In summary, the data collected in this study basically satisfy the requirements for the analysis, and the overall hydrological-alteration degree evaluated by the IHA method is essentially reliable and reasonable.
The hydrological data used in this study were provided by China Yangtze Power Co., Ltd. The precipitation data were downloaded from https://data.cma.cn/en/?r=data/detail&dataCode=SURF_CLI_CHN_MUL_DAY_CES (last access: 25 October 2019) (CMDC, 2019).
XZ and XH suggested the idea and formulated the overarching research goals and aims. XZ, HZ and KM corrected and managed the data. XZ and XH employed statistical methods to analyze study data. XZ prepared the paper with contributions from all coauthors.
The authors declare that they have no known competing financial interests or personal relationships that could have appeared to influence the work reported in this paper.
The opinions expressed here are those of the authors and not those of other individuals or organizations.
The authors would like to thank the China Meteorological Data Service Center for providing the precipitation datasets. Comments from the editor and five anonymous reviewers were greatly appreciated.
This research has been supported by the National Natural Science Foundation of China (grant nos. 51579161 and 51779160).
This paper was edited by Dominic Mazvimavi and reviewed by five anonymous referees.
The authors declare that they have no conflict of interest.
Bayley, P. B.: Understanding large river floodplain ecosystems, Bioscience, 45, 153–158, https://doi.org/10.2307/1312554, 1995.
Best, J.: Anthropogenic stresses on the world's big rivers, Nat. Geosci., 12, 7–21, https://doi.org/10.1038/s41561-018-0262-x, 2019.
CMDC: Dataset of daily climate data from Chinese surface stations for global exchange, continuing from 1 January 1951, available at: https://data.cma.cn/en/?r=data/detail&dataCode=SURF_CLI_CHN_MUL_DAY_CES last access: 25 October 2019.
Chen, W. and Olden, J. D.: Designing flows to resolve human and environment water needs in a dam-regulated river, Nat. Commun., 8, 2158, https://doi.org/10.1038/s41467-017-02226-4, 2017.
Deitch, M. J., Merenlender, A. M., and Feirer, S.: Cumulative effect of small reservoirs on streamflow in northern coastal California catchments, Water Resour. Manage., 27, 5101–5118, https://doi.org/10.1007/s11269-013-0455-4, 2013.
Dos Santos, N. C. L, Lopes, T. M., and Gomes, L. C.: Cumulative ecological effects of a Neotropical reservoir cascade across multiple assemblages, Hydrobiologia, 819, 77–91, https://doi.org/10.1007/s10750-018-3630-z, 2018.
Fantin-Cruz, I., Pedrollo, O., Girard, P., Zeilhofer, P., and Hamilton, SK.: Effects of a diversion hydropower facility on the hydrological regime of the Correntes River, a tributary to the Pantanal floodplain, Brazil, J. Hydrol., 531, 810–820, https://doi.org/10.1016/j.jhydrol.2015.10.045, 2015.
Friedman, J. H. and Tukey, J. W.: A projection pursuit algorithm for exploratory data analysis, IEEE T. Comput., 23, 881–890, https://doi.org/10.1109/t-c.1974.224051, 1974.
Gao, B., Yang, D. W., Zhao, T. T. G., and Yang, H. B.: Changes in the eco-flow metrics of the upper Yangtze River from 1961 to 2008, J. Hydrol., 448, 30–38, https://doi.org/10.1016/j.jhydrol.2012.03.045, 2012.
Gao, Y., Vogel, R. M., Kroll, C. N., Poff, L. R., and Olden, J. D.: Development of representative Indicators of Hydrologic Alteration, J. Hydrol., 374, 136–147, https://doi.org/10.1016/j.jhydrol.2009.06.009, 2009.
Grill, G., Lehner, B., Thieme, M., Geenen, B., Tickner, D., Antonelli, F., Babu, S., Borrelli, P., Cheng, L., Crochetiere, H., Macedo, H. E., Filgueiras, R., Goichot, M., Higgins, J., Hogan, Z., Lip, B., McClain, M. E., Meng, J., Mulligan, M., Nilsson, C., Olden, J. D., Opperman, J. J., Petry, P., Liermann, C. R., Saenz, L., Salinas-Rodriguez, S., Schelle, P., Schmitt, R. J. P., Snider, J., Tan, F., Tockner, K., Valdujo, P. H., van Soesbergen, A., and Zarfl, C.: Mapping the world's free-flowing rivers, Nature, 569, 215–221, https://doi.org/10.1038/s41586-019-1111-9, 2019.
Huang, W., Chen, J., and Wang, B.: Study on averaging effect of cascade hydropower development on flow and water temperature process, Resources and Environment in the Yangtze Basin, 19, 335–339, https://doi.org/10.3724/SP.J.1088.2010.00432, 2010 (in Chinese).
Huang, X. R., Gao, L. Y., Yang, P. P., and Xi, Y. Y.: Cumulative impact of dam constructions on streamflow and sediment regime in lower reaches of the Jinsha River, China, J. Mt. Sci., 15, 2752–2765, https://doi.org/10.1007/s11629-018-4924-3, 2018.
Li, C., Peng, J., and Liao, W. G.: Study on the eco-hydrological factors and flow regime requirement on spawning of four major Chinese carps in the middle reaches of Yangtze River, Journal of China Institute of Water Resources and Hydropower Research, 4, 170–176, https://doi.org/10.3969/j.issn.1672-3031.2006.03.002, 2006 (in Chinese).
Mathews, R. and Richter, B. D.: Application of the indicators of hydrologic alteration software in environmental flow setting, J. Am. Water Resour. As., 43, 1400–1413, https://doi.org/10.1111/j.1752-1688.2007.00099.x, 2007.
Ministry of Water Resources, People's Republic of China: 2017 Statistic Bulletin on China Water Activities, China WaterPower Press, Beijing, 2018.
Nilsson, C., Reidy, C. A., Dynesius, M., and Revenga, C.: Fragmentation and flow regulation of the world's large river systems, Science, 308, 405–408, https://doi.org/10.1126/science.1107887, 2005.
Olden, J. D. and Poff, N. L.: Redundancy and the choice of hydrologic indices for characterizing streamflow regimes, River Res. Appl., 19, 101–121, https://doi.org/10.1002/rra.700, 2003.
Pearson, K.: On lines and planes of closest fit to points in space, Philos. Mag., 2, 559–572, https://doi.org/10.1080/14786440109462720, 1900.
Poff, N. L. and Zimmerman, J. K. H.: Ecological responses to altered flow regimes: A literature review to inform the science and management of environmental flows, Freshwater Biol., 55, 194–205, https://doi.org/10.1111/j.1365-2427.2009.02272.x, 2010.
Poff, N. L., Allan, J. D., Bain, M. B., Karr, J. R., Prestegaard, K. L., Richter, B. D., Sparks, R. E., and Stromberg, J. C.: The natural flow regime: A paradigm for river conservation and restoration, Bioscience, 47, 769–784, https://doi.org/10.2307/1313099, 1997.
Richter, B. D., Baumgartner, J. V., Powell, J., and Braun, D. P.: A method for assessing hydrologic alteration within ecosystems, Conserv. Biol., 10, 1163–1174, https://doi.org/10.1046/j.1523-1739.1996.10041163.x, 1996.
Richter, B. D., Baumgartner, J. V., Wigington, R., and Braun, D. P.: How much water does a river need?, Freshwater Biol., 37, 231–249, https://doi.org/10.1046/j.1365-2427.1997.00153.x, 1997.
Santucci, J., Gephard, S. R., and Pescitelli, S. M.: Effects of multiple low-head dams on fish, macroinvertebrates, habitat, and water quality in the Fox River, Illinois, North Am. J. Fish Manage., 25, 975–992, https://doi.org/10.1577/M03-216.1, 2005.
Schmitt, R. J. P., Bizzi, S., Castelletti, S. B., and Kondolf, G. M.: Improved trade-offs of hydropower and sand connectivity by strategic dam planning in the Mekong, Nature Sustainability, 1, 86–104, https://doi.org/10.1038/s41893-018-0022-3, 2018.
Shiau, J. T. and Wu, F. C.: Assessment of hydrologic alterations caused by chi-chi diversion weir in chou-shui creek, taiwan: opportunities for restoring natural flow conditions, River Res. Appl., 20, 401–412, https://doi.org/10.1002/rra.762, 2010.
Tao, H., Gemmer, M., Bai, Y. G., Su, B. D., and Mao, W. Y.: Trends of streamflow in the Tarim River Basin during the past 50 years:Human impact or climate change?, J. Hydrol., 400, 1–9, https://doi.org/10.1016/j.jhydrol.2011.01.016, 2011.
Timpe, K. and Kaplan, D.: The change hydrology of a dammed Amazon, Science Advances, 3, 1–13, https://doi.org/10.1126/sciadv.1700611, 2017.
Vogel, R. M., Sieber, J., Archfield, S. A., Smith, M. P., Apse, C. D., and Huber-Lee, A.: Relations among storage, yield and instream flow, Water Resour. Res., 43, W05403, https://doi.org/10.1029/2006WR005226, 2007.
Wang, L., Wang, J., and Gao, X. S.: Toward the health measure for open source software ecosystem via Projection Pursuit and Real-Coded Accelerated Genetic, IEEE Access, 7, 87396–87409, https://doi.org/10.1109/ACCESS.2019.2926306, 2019.
Wang, Y. K., Wang, D., Lewis, Q. W., Wu, J. C., and Huang, F.: A framework to assess the cumulative impacts of dams on hydrological regime: a case study of the Yangtze River, Hydrol. Process., 31, 3045–3055, https://doi.org/10.1002/hyp.11239, 2017a.
Wang, W. C., Chau, K. W., Xu, D. M., Qiu, L., and Liu, C. C.: The annual maximum flood peak discharge forecasting using hermit projection pursuit regression with SSO and LS method, Water Resour. Manag., 31, 461–477, https://doi.org/10.1007/s11269-016-1538-9, 2017b.
Wang, Y. K., Zhang, N., Wang D., Wu, J. C., and Zhang, X.: Investigating the impacts of cascade hydropower development on the natural flow regime in the Yangtze River, China, Sci. Total Environ., 624, 1187–1194, https://doi.org/10.1016/j.scitotenv.2017.12.212, 2018.
Wen, X., Liu, Z. H., Lei, X. H., Lin, R. J., Fang, G. H., Tan, Q. F., Wang, C., Tian, Y., and Quan, J.: Future changes in Yuan River ecohydrology: individual and cumulative impacts of climates change and cascade hydropower development on runoff and aquatic habitat quality, Sci. Total Environ., 633, 1403–1417, https://doi.org/10.1016/j.scitotenv.2018.03.309, 2018.
Winemiller, K. O., Mcintyre, P. B., Castello, L. Fluet-Chouinard, E., Giarrizzo, T., Nam, S., Baird, I. G., Darwall, W., Lujan, N. K., Harrison, I., Stiassny, M. L. J., Silvano, R. A. M., Fitzgerald, D. B., Pelicice, F. M., Agostinho, A. A., Gomes, L. C., Albert, J. S., Baran, E., Petrere, M., Zarfl, C., Mulligan, M., Sullivan, J. P., Arantes, C. C., Sousa, L. M., Koning, A. A., Hoeinghaus, D. J., Sabaj, M., Lundberg, J. G., Armbruster, J., Thieme, M. L., Petry, P., Zuanon, J., Vilara, G. T., Snoeks, J., Ou, C., Rainboth, W., Pavanelli, C. S., Akama, A., van Soesbergen, A., and Saenz, L.: Balancing hydropower and biodiversity in the Amazon, Congo, and Mekong, Science, 351, 128–129, https://doi.org/10.1126/science.aac7082, 2016.
Yang, T., Cui, T., Xu, C. Y., Ciais, P., and Shi, P. F.: Development of a new IHA method for impact assessment of climate change on flow regime, Global Planet. Change, 156, 68–79, https://doi.org/10.1016/j.gloplacha.2017.07.006, 2017.
Yang, T., Zhang, Q., Chen, Y. Q. D., Tao, X., Xu, C. Y., and Chen, X.: A spatial assessment of hydrologic alteration caused by dam construction in the middle and lower Yellow River, China, Hydrol. Process., 22, 3829–3843, https://doi.org/10.1002/hyp.6993, 2008.
Yang, X., Yang, Z., Lu, G. H., and Li, J.: A gray-encoded, hybrid-accelerated, genetic algorithm for global optimizations in dynamical systems, Commun. Nonlinear Sci., 10, 355–363, https://doi.org/10.1016/j.cnsns.2003.12.005, 2005.
Zhang, Z. X., Chen, X., Xu, C. Y., Hong, Y., Hardy, J., and Sun, Z. H.: Examining the influence of river–lake interaction on the drought and water resources in the Poyang Lake basin, J. Hydrol., 522, 510–521, https://doi.org/10.1016/j.jhydrol.2015.01.008, 2015.
Zhang, W. H., Jia, Y. W., Ge, J. J., Huang, X. R., Ni, G. H., Hou, J. M., and Wang, H.: Multi-index data dimension reduction approach and its applicability in the calculation of indicators of hydrological alteration, Hydrol. Res., 50, 231–243, https://doi.org/10.2166/nh.2018.068, 2019.
Zhang, P. P., Cai, Y. P., Yang, W., Yi, Y. J., and Yang, Z. F.: Climatic and anthropogenic impacts on water and sediment generation in the middle reach of the Jinsha River Basin, River Res. Appl., 36, 338–350, https://doi.org/10.1002/rra.3572, 2020.
Zhao, Q. H., Liu, S. L., Deng, L., Dong, S. K., Cong., Wang., Yang, Z. F., and Yang, J. J.: Landscape change and hydrologic alteration associated with dam construction, Int. J. Appl. Earth Obs., 16, 17–26, https://doi.org/10.1016/j.jag.2011.11.009, 2012.