the Creative Commons Attribution 4.0 License.
the Creative Commons Attribution 4.0 License.
 | 20 Aug 2020
A combination of soil water extraction methods quantifies the isotopic mixing of waters held at separate tensions in soil
Jason J. Mercer
Mark S. Pleasants
David G. Williams
Measurements of the isotopic composition of separate and potentially interacting pools of soil water provide a powerful means to precisely resolve plant water sources and quantify water residence time and connectivity among soil water regions during recharge events. Here we present an approach for quantifying the time-dependent isotopic mixing of water recovered at separate suction pressures or tensions in soil over an entire moisture release curve. We wetted oven-dried, homogenized sandy loam soil first with isotopically “light” water (δ2H ‰; δ18O ‰) to represent antecedent moisture held at high matric tension. We then brought the soil to near saturation with “heavy” water (δ2H ‰; δ18O ‰) that represented new input water. Soil water samples were subsequently sequentially extracted at three tensions (“low-tension” centrifugation ≈0.016 MPa; “mid-tension” centrifugation ≈1.14 MPa; and “high-tension” cryogenic vacuum distillation at an estimated tension greater than 100 MPa) after variable equilibration periods of 0 h, 8 h, 1 d, 3 d, and 7 d. We assessed the differences in the isotopic composition of extracted water over the 7 d equilibration period with a MANOVA and a model quantifying the time-dependent isotopic mixing of water towards equilibrium via self-diffusion. The simplified and homogenous soil structure and nearly saturated moisture conditions used in our experiment likely facilitated rapid isotope mixing and equilibration among antecedent and new input water. Despite this, the isotope composition of waters extracted at mid compared with high tension remained significantly different for up to 1 d, and waters extracted at low compared with high tension remained significantly different for longer than 3 d. Complete mixing (assuming no fractionation) for the pool of water extracted at high tension occurred after approximately 4.33 d. Our combination approach involving the extraction of water over different domains of the moisture release curve will be useful for assessing how soil texture and other physical and chemical properties influence isotope exchange and mixing times for studies aiming to properly characterize and interpret the isotopic composition of extracted soil and plant waters, especially under variably unsaturated conditions.
- Article
(6389 KB) - Full-text XML
- BibTeX
- EndNote


Quantifying the residence time and connectivity of soil water requires methods that differentiate the isotopic signature of water pools held across different-sized soil pores and ranges of matric tensions or suction pressures. A variety of field- and lab-based methods are typically employed for such analyses, and each separately assesses different pools of water recovered at discrete ranges of tension (Oerter and Bowen, 2017; Orlowski et al., 2016b; Sprenger et al., 2015). These methods effectively recover and analyze water from different soil-pore size ranges, and only a few methods are capable of sampling hygroscopic water, i.e., the water that forms thin films around soil particles held at matric tensions greater than plants are able to extract. The “two water worlds” (TWW) hypothesis (McDonnell, 2014) considers that transpiration and runoff to streams derive from separate pools of water that are incompletely mixed in time or across pore regions in the soil. Brooks et al. (2010) presented stable isotope evidence of ecohydrologic separation between plant available water in smaller pore regions and mobile water passing through preferential flow paths when smaller pores were filled, challenging the hypothesis of translatory flow and establishing a mechanism to explain the TWW hypothesis. However, most studies examining ecohydrologic separation and the TWW hypothesis fail to differentiate isotopic signatures beyond that of mobile water and bulk soil water. More comprehensive evaluation of soil water isotopes across multiple pore sizes and soil regions is needed to examine recharge processes explaining the TWW hypothesis (Berry et al., 2018; Brantley et al., 2017; Brooks et al., 2010; McDonnell, 2014; Sprenger et al., 2019). At a more fundamental level, such methods are needed to thoroughly address the dynamics of soil water movement, mixing, and isotopic fractionation (Barnes and Allison, 1988; Braud et al., 2005; Gaj and McDonnell, 2019) to improve quantification of the water budget and trace fluxes of nutrients via water transport in the critical zone.
Characterization of water isotope ratios in soils involves careful consideration of the methods used to recover soil water; depending on the method employed, water is recovered at different energies, and the proportion of water extracted is dependent on the volumetric water content of the sample and the soil water retention curve – the relationship between the volumetric water content and matric potential, or the negative equivalent of matric tension (Sprenger et al., 2015). The terminology for water pools recovered at different applied energies has been debated. For the purposes of relating our study to ecohydrologic separation studies, we specify two commonly defined pools – gravity-drained water and matrix water – consistent with the recent terminology used by Brantley et al. (2017). Gravity-drained water is the most mobile pool of water within soil that freely drains through large pores under the force of gravity; matrix water, in contrast, consists of capillary and hygroscopic water that does not drain freely under the force of gravity but is held across a broad range of tensions by smaller pores. There is likely a continuum of water mobility in soil from the largest pores to the smallest pores with progressively less water mobility as the pore size decreases (Sprenger et al., 2018). However, we currently lack the methodology to infer the degree of connectivity and dynamics of mixing over time between separate soil water pools extracted at different applied energies.
Methods to characterize soil water pools in situ include water vapor laser spectroscopy, which assumes that most mobile soil water is in equilibrium with soil water vapor (Oerter and Bowen, 2017), or field extraction using suction lysimeters (Sprenger et al., 2015). However, the analysis of soil water isotopes more often involves water extraction in the lab from soil samples collected in the field. The most common of these extraction methods, in order of the lowest to the highest amount of energy applied to the soil sample, are suction cup lysimeters, mechanical squeezing, centrifugation, and cryogenic vacuum distillation (Sprenger et al., 2015). Suction cup lysimeters typically sample water held at low tension (0.05 to 0.10 MPa) and are,therefore, limited to the analysis of only the highly mobile fraction of soil water, but application of much higher tensions using suction cup lysimeters is feasible (Li et al., 2007). Mechanical squeezing and centrifugation recover water across much broader tension ranges and with no fractionation, but they are unable to drain pores with diameters of less than 0.03 µm, i.e., to extract water held at tensions beyond 1 MPa (Orlowski et al., 2016b; Sprenger et al., 2015). Centrifugation is particularly useful because the rotational velocity and the centrifuge setup are physically related to the energy applied to the soil sample and, in turn, the pore size drained (Edmunds and Bath, 1976). Cryogenic vacuum distillation (CVD) recovers nearly all water from a soil sample, with the more clay- and more organic-rich soil samples requiring greater extraction times or temperatures (Orlowski et al., 2016a). Each method has been used to determine the isotopic composition of specific pools of water in the soil, but they are rarely employed in combination to understand the dynamics of soil water pools that make up the bulk water.
CVD has been separately compared to centrifugation with the assumption that water held across matric tensions is well mixed (Tsuruta et al., 2019), but recent findings show that applying the two methods in combination has the potential to assess water isotope compartmentation and interactions that can inform proper characterization of soil water isotopic compositions for ecohydrological studies (Adams et al., 2019). Adams et al. (2019) concluded that soil water extracted using centrifugation was consistently incompletely mixed after 72 h of equilibration time. However, their experimental design precluded the analysis of the time necessary for hygroscopic, capillary, and gravitationally drained waters to completely mix. In addition to understanding mixing between water pools within soil, recent work has highlighted the importance of also considering fractionations that may affect the isotopic composition of extracted water. Isotope effects related to adhesion under various matric potentials, soil wettability, and solid interfacial chemistry of soil particles are important to consider (Gaj et al., 2019; Gaj and McDonnell, 2019).
Here, we present and evaluate a stepwise procedure to recover and analyze the isotopic composition of different pools of soil water and characterize the dynamics of their interaction over time. To demonstrate the method, we confine our initial study to soil moisture conditions near saturation and investigate the time course of mixing between waters applied sequentially to oven-dried soil. We address the following questions:
-
Can soil water held at different tensions be separately extracted from the same soil sample and analyzed for isotopic composition?
-
Do isotopically labeled fractions of water sequentially added to dry soil thoroughly mix?
-
Can the time course for isotopic mixing be determined quantitatively for waters held at different tensions within soil?
2.1 Experimental design
Our experiment involved sequentially wetting oven-dried soil using isotopically contrasting water inputs that then allowed us to quantify the degree that separate pools of soil water mixed over time. We used a novel combination of centrifuge extraction and cryogenic vacuum distillation to recover pools of soil water held at discrete ranges of tension, spanning gravitationally drained, capillary, and hygroscopic water pools. We first applied a small amount of isotopically “light” water to oven-dried soil followed by nearly saturating the soil samples with an isotopically “heavy” water. Three pools of water were recovered from wetted soils after variable mixing times via a stepwise increase of applied energy using two centrifugation speed steps followed by distilling the remaining water in the soil samples using cryogenic vacuum distillation (CVD). Subsets of samples were extracted using CVD only (hereafter called “bulk sample extraction” or “BSE”) either immediately after applying only the small amount of isotopically light water (BSElight) or immediately after adding both the isotopically light and heavy waters (BSElight+heavy). Prior to stepwise extraction for the remainder of the soil samples, the light and heavy water additions were allowed to freely mix and equilibrate under nearly saturated conditions for variable amounts of time: 0 h (n=15), 8 h (n=3), 1 d (n=3), 3 d (n=3), and 7 d (n=3). The water recovered from each soil sample, either from BSE or stepwise extractions, and from various time points was then analyzed for hydrogen and oxygen stable isotope ratios (δ2H and δ18O, respectively).
2.2 Experimental soil and wetting procedure
We used a sandy loam soil collected from the top 10 cm of the surface from prairie vegetation east of Laramie, WY. Soil was passed through a 2 mm sieve, and all coarse litter was removed except for very fine fragments. Therefore, our experimental soil was highly homogenized and lacked natural physical structure with complex soil aggregates. We employed the hydrometer method to determine the soil particle size distribution using sodium hexametaphosphate as the chemical aid for dispersion (Day, 1965). The particle size distribution defined by the U.S. Department of Agriculture classification system was 9 % clay, 32 % silt, and 59 % sand. We constructed a soil retention curve (Fig. 1) using previously reported parameters for modeling the water retention of sandy loam soil (van Genuchten, 1980; Kosugi et al., 2002) and also highlight the relative maximum pore size filled across the range of matric potentials as described by Schjonning (1992). We did not detect carbonates in the soil using tests with 1 N HCl (Schoeneberger et al., 2012).
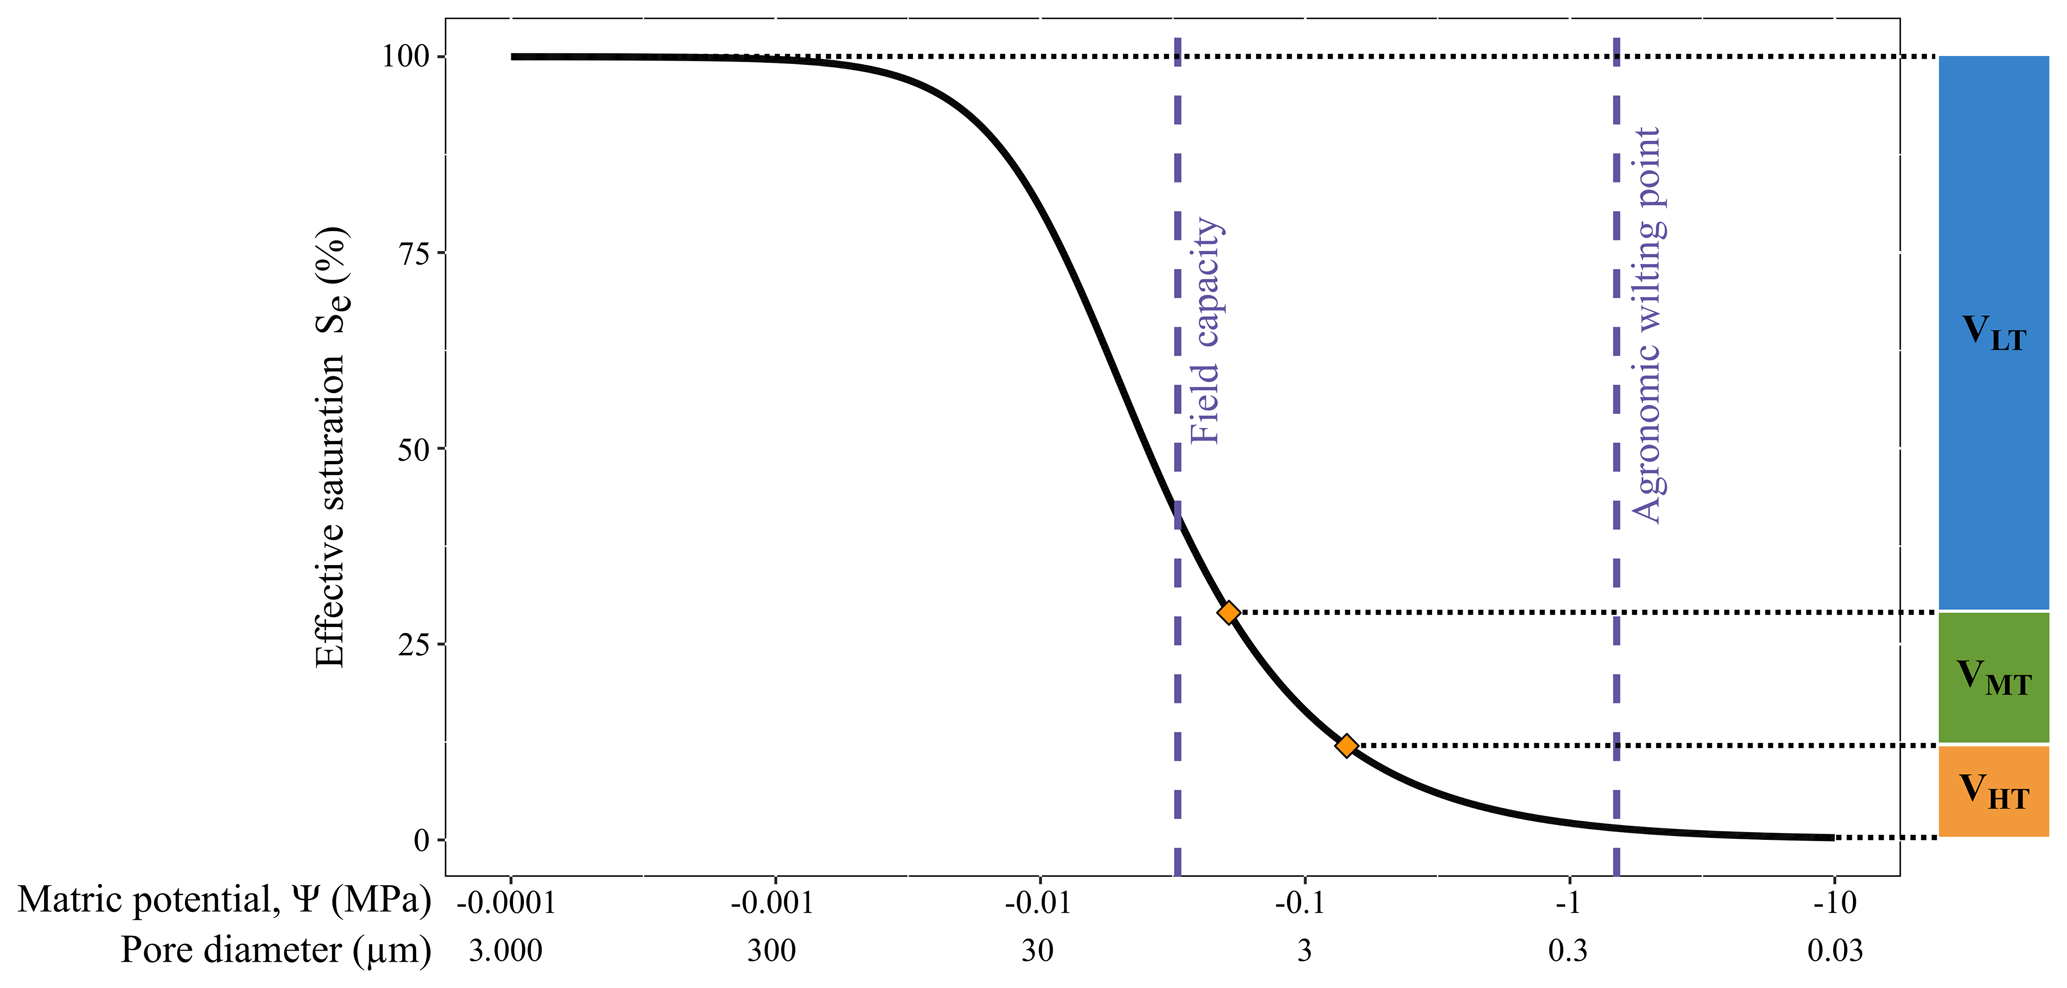
Figure 1Soil retention curve for a sandy loam soil using van Genuchten parameters for a general sandy loam (Kosugi et al., 2002). Average volumes (V) from each extraction step of the experiment are illustrated on the right, where “LT” denotes low tension, “MT” denotes mid tension, and “HT” denotes high tension. Vertical lines are matric potential points of interest: field capacity of −0.033 MPa and agronomic wilting point of −1.5 MPa. The y axis is effective saturation, which is a standardized form of volumetric water content. The x axis has two scales: the top scale is the matric potential, and the bottom scale is the relative maximum pore size filled at the respective matric potentials (Schjonning, 1992). Samples wetted with both light and heavy waters were near but not at 100 % effective saturation.
We prepared the homogenized soil material by oven-drying a 350 g subsample at 105 ∘C for 48 h. We then sequentially applied two isotopically distinct waters to bring the soil to near saturation. The isotopically light water used in the experiments was local tap water from the University of Wyoming campus in Laramie, and the heavy water was from multiple bottles of FIJI Water (FIJI Water LLC, Los Angeles, CA, USA). The isotope ratio value standardized to Vienna Standard Mean Ocean Water (VSMOW) was ‰ for δ2H and ‰ for δ18O (n=5) for the light water, whereas it was ‰ for δ2H and ‰ for δ18O (n=5) for the heavy water. We selected these waters because of their contrasting isotopic values that represented the natural range expected for cold season (light water) and warm season (heavy water) precipitation in temperate continental interior regions.
After the soil cooled from the drying procedure, we applied 20 mL of the light water with a spray bottle to the 350 g subsample; we then mixed the subsample with gloved hands to ensure homogenous application. Between 18 and 30 g of this slightly wetted soil was gently packed to form soil columns in each of six custom-made centrifuge inserts (Fig. 2). The custom steel tube inserts were perforated with small drilled holes at the bottom and fitted with a collar at the top. The collar secured the position of the insert within the sleeve at roughly 19 mm above the bottom to establish a reservoir for collecting the extracted water through the perforated bottom during extraction by centrifugation (below). We placed four steel screens secured by rubber o-rings at the bottom of each insert to reduce the loss of soil while also permitting water flow during centrifugation. In addition, we placed a small gravity-secured cap on top of each insert to reduce evaporation from the soil samples in the inserts during equilibration and centrifugation. The caps were loose enough to not generate vacuum within the sample as water was eluted during centrifugation. We recorded the weights of the inserts and sleeves prior to adding the soil. Except for samples that were immediately taken for bulk sample extraction (BSElight) using cryogenic vacuum distillation (CVD), the packed inserts were then wetted from the bottom up by immersion in a container with heavy water at a level just below the soil level in each insert. This ensured that the soil samples were wetted to near saturation by reducing the chance of air being trapped within the soil matrix. We then removed a second set of samples for bulk sample extractions (BSElight+heavy) using CVD. The remaining samples were transferred to storage in an airtight container at 20 ∘C in the lab until the desired equilibration time points were reached. Complete saturation was not possible, as some water was lost from perforations at the bottom of the inserts when they were removed from the container of heavy water. Wetted samples were weighed prior to the centrifuge extraction process to determine the total wetted weight and the amount of heavy water infused in each sample.
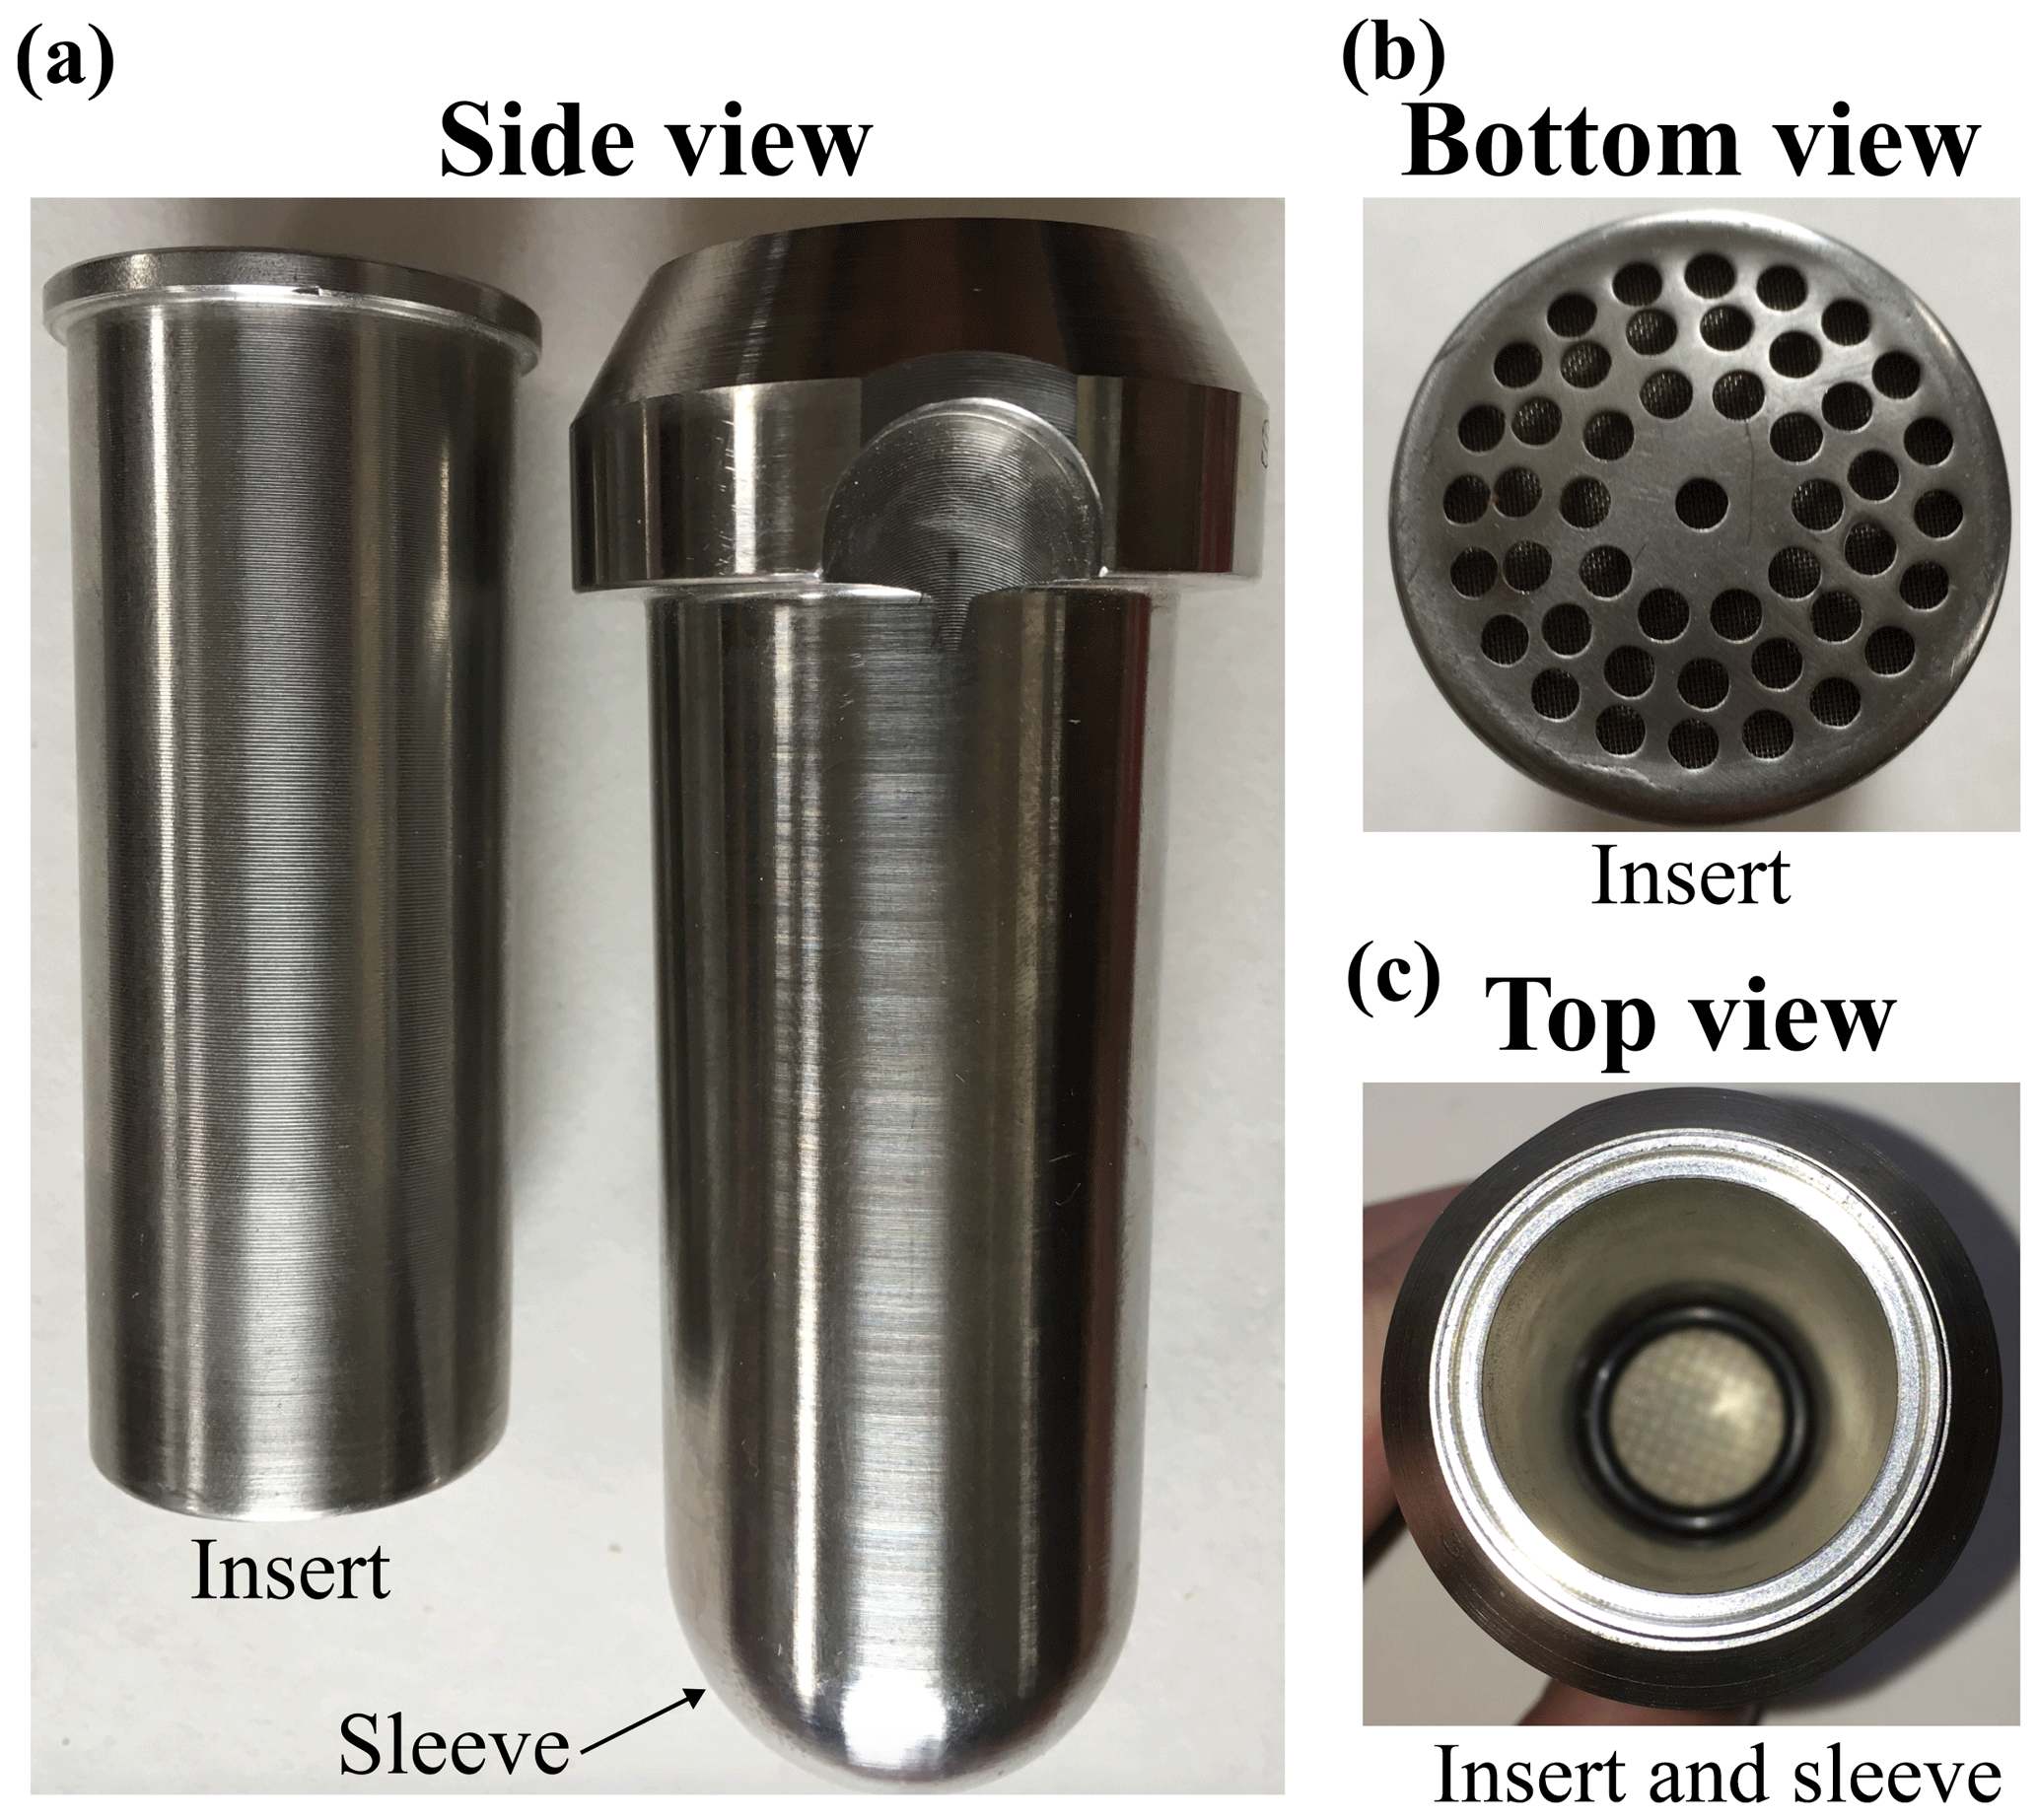
Figure 2(a) Image of a custom-made centrifuge insert and Sorvall sleeve. (b) Bottom view of an insert perforated with drilled holes to allow water movement during centrifugation. (c) Top view of an insert and sleeve, including the steel screens at the bottom of the insert secured with a rubber o-ring to reduce soil loss during centrifugation. The steel tube inserts were fitted with a collar at the top that secured the position of the insert within the sleeve at roughly 19 mm above the bottom to establish a reservoir for collecting extracted water through the screens and perforated bottom. The small gravity-secured caps described in Sect. 2.2 are not shown in this image.
After each centrifugation step, we recorded the weights of the sleeves and inserts, and we collected and filtered extracted water into plastic vials with silicon caps, ready for stable isotope analysis. Vials with Parafilm were stored in a 4 ∘C fridge until they were processed. The remaining water after centrifugation was extracted using CVD ∼2 h to ensure that all water was removed (West et al., 2006). We performed the CVD procedure at 102 ∘C and < 0.1–2.7 Pa vacuum pressure, which were controlled and monitored using heating coils, thermistors, and vacuum gauges. The vacuum pressure used during CVD is not the same as the estimated tension applied using CVD described in Sect. 2.3. The final sample masses after extraction were compared to the oven-dried masses to determine the recovery of the extracted water; every sample processed in our experiment had more than 99 % of water extracted at this step. Recent work has highlighted that CVD near 100 ∘C or oven-drying soil near 105 ∘C does not extract all of the water from soil (Adams et al., 2019). The amount of water not recovered using CVD in the current study was assumed to be negligible and have minimal impact on the isotopic values of extracted water.
2.3 Soil water extractions
We extracted water from soil using a Sorvall RC 5B Plus centrifuge fitted with a Sorvall aluminum rotor with four stainless-steel sleeves designed for 50 mL Falcon tubes (Sorvall, Newton, CT, USA). Centrifugation was performed with the cooling function activated; the internal temperature during centrifugation never exceeded 25 ∘C. We focused on extracting waters near two ecohydrologically relevant pressures for the waters recovered at “low” and “mid” tension: field capacity (i.e., the point at which no more water drains freely under the force of gravity) and agronomic wilting point. While the field capacity and wilting point vary among different soil types and plants, respective reference values of 0.033 and 1.5 MPa for field capacity and agronomic wilting point are useful as guidelines for understanding potential boundaries on ecohydrologically separate water pools. Revolutions per minute (rpm) for the centrifuge extractions at field capacity and agronomic wilting point were calculated using an equation from Nimmo et al. (1987), which relates rotational velocity to the matric potential and radii of a centrifuge setup as follows:
where Ψ is the matric potential (Pa), ρ is the density of water (kg m−3), ω is the rotational velocity (s−1), r1 is the radius (m) from the center of the centrifuge rotor to a point of interest in the soil column during rotation, and r2 is the radius from the center of centrifuge rotor to the perforated bottom of the insert where the water drains. Due to difficulties in determining the precise force distribution (Zhang et al., 2018) and as force applied using Eq. (1) varies depending on the r1 value selected, we used the center of the soil column as the point of interest for r1. The first centrifuge step (“low tension”) at ≈0.016 MPa was performed for 3 h at 950 rpm. The second centrifuge step (“mid tension”) at ≈1.14 MPa was performed for 4 h at 8000 rpm. Afterward, the remaining water in each sample was extracted using CVD and is referenced here as “high-tension” extraction; this is the fraction of water held under high tension that is rarely directly compared to more mobile waters within soils that have a sufficient volumetric water content to permit sampling with methods like suction lysimeters. Applied tension using CVD is estimated to be greater than 100 MPa (Sprenger et al., 2015).
2.4 Stable isotope analysis
The stable isotope composition of water is expressed as δ values in units of per mill (‰), where δ= ((Rsample∕Rstandard) −1) ×1000. Rsample and Rstandard are the isotope ratios of 2H∕1H or 18O∕16O for samples and those for the international standard Vienna Standard Mean Oceanic Water (VSMOW), respectively. Our measurements on samples were corrected to the VSMOW scale using working reference waters calibrated to VSMOW and SLAP (Standard Light Antarctic Precipitation) reference waters obtained from the IAEA (International Atomic Energy Agency). Samples were analyzed on a Delta V isotope ratio mass spectrometer (IRMS) using a temperature conversion/elemental analyzer (TC/EA) interface (Thermo Scientific Corporation, Bremen, Germany) at the University of Wyoming Stable Isotope Facility. The analytical accuracy for the quality assessment lab reference water was 0.33 ‰ for δ2H and 0.38 ‰ for δ18O, while the analytical precision for the quality assessment lab reference water was 0.98 ‰ for δ2H and 0.22 ‰ for δ18O. We report the accuracy as the absolute difference between the mean of the analyzed lab reference water samples (n=15) and the calibrated value of lab reference water. We report precision as the standard deviation of all lab reference water samples analyzed (n=15).
2.5 Data analysis and mixing times
We fitted a two-part mass balance mixing model using δ2H and δ18O data to account for the light and heavy water applied to the ovendry soil and determine the distribution of added water across extracted fractions. Using Eq. (2) below, all possible combinations of replicates in this study at each equilibration time point and for each isotope (δ2H and δ18O) were assessed (n=54):
where m is the mass of water (in kg), and R is the isotope ratio calculated from either δ2H or δ18O values for the particular water component. The left side of Eq. (2) represents water inputs to the soil samples, whereas the right side represents water components recovered using the stepwise extractions. To determine the percentage of water recovered, the sum of outputs was divided by the sum of inputs and multiplied by 100. The subscripts , and HT refer to the heavy water added and the low-tension, mid-tension, and high-tension extracted waters, respectively. The subscript LW refers to light water extracted from the bulk soil extraction after only the isotopically light water was applied (BSElight). The δ values determined for BSElight samples were used in the mass balance model rather than that of the light water added to accommodate for the slight δ offset between these waters. This slight offset may have developed from evaporative fractionation (Allison et al., 1983) that likely occurred when applying the light water to the recently oven-dried soil within the dry local atmosphere of our lab, or from a small amount of hygroscopic water adsorbed from local atmosphere once soil was removed from the oven (Hillel, 2003). The direction of this slight offset was not consistent with previous observations of isotope effects associated with interactions with clay minerals (Gaj et al., 2017) or carbonates (Meißner et al., 2014). The mass of water remaining in soil samples before high-tension extraction was calculated using gravimetric water contents and the mass of the soil samples after the mid-tension centrifuge step. The mass of total water applied to each sample was determined by adding the masses of water remaining in the soil before high-tension extraction and the water extracted from both centrifuge steps. The mass of light water applied was determined by subtracting the amount of heavy water infused in the sample (covered in Sect. 2.2) from the mass of total water applied.
To assess the fractionation associated with evaporation, we calculated the difference in mass for soil-filled inserts and the corresponding extracted waters. This was evaluated throughout the experiment between centrifuge steps as well as prior to and after equilibration periods. We only observed differences of less than 1 % of the mass of the extracted water in all cases; therefore, we discounted the impacts of evaporative fractionation on our results and in our interpretations.
We conducted a pairwise MANOVA between the paired mean δ2H and δ18O isotope values for each of the soil water pools extracted from the three tension ranges, the δ values of the two applied waters, and the δ values of waters from BSElight and BSElight+heavy samples. There was a total of seven groups compared against one another at each of the five time points.
Furthermore, we used a time-dependent isotope mixing equation to approximate the time required for soils to completely mix (i.e., reach equilibrium). The model takes the following general form:
where t is the time since mixing (h), δ (t) is the isotope ratio of water extracted at a particular tension by centrifugation or CVD at a particular time point, δe is the equilibrium isotopic ratio expected for the extracted water under perfectly mixed conditions assuming no fractionation or other effects, δ0 is the isotopic ratio of the extracted sample at time 0, and k is the time or proportionality constant (h−1). Because we were interested in how the isotopic values of waters varied with different tensions, δ0 and k were allowed to vary based on each extracted water pool (i.e., low tension, mid tension, and high tension). The interaction among the three pools of water in this study within an ecohydrological perspective is diagramed in Fig. 3.
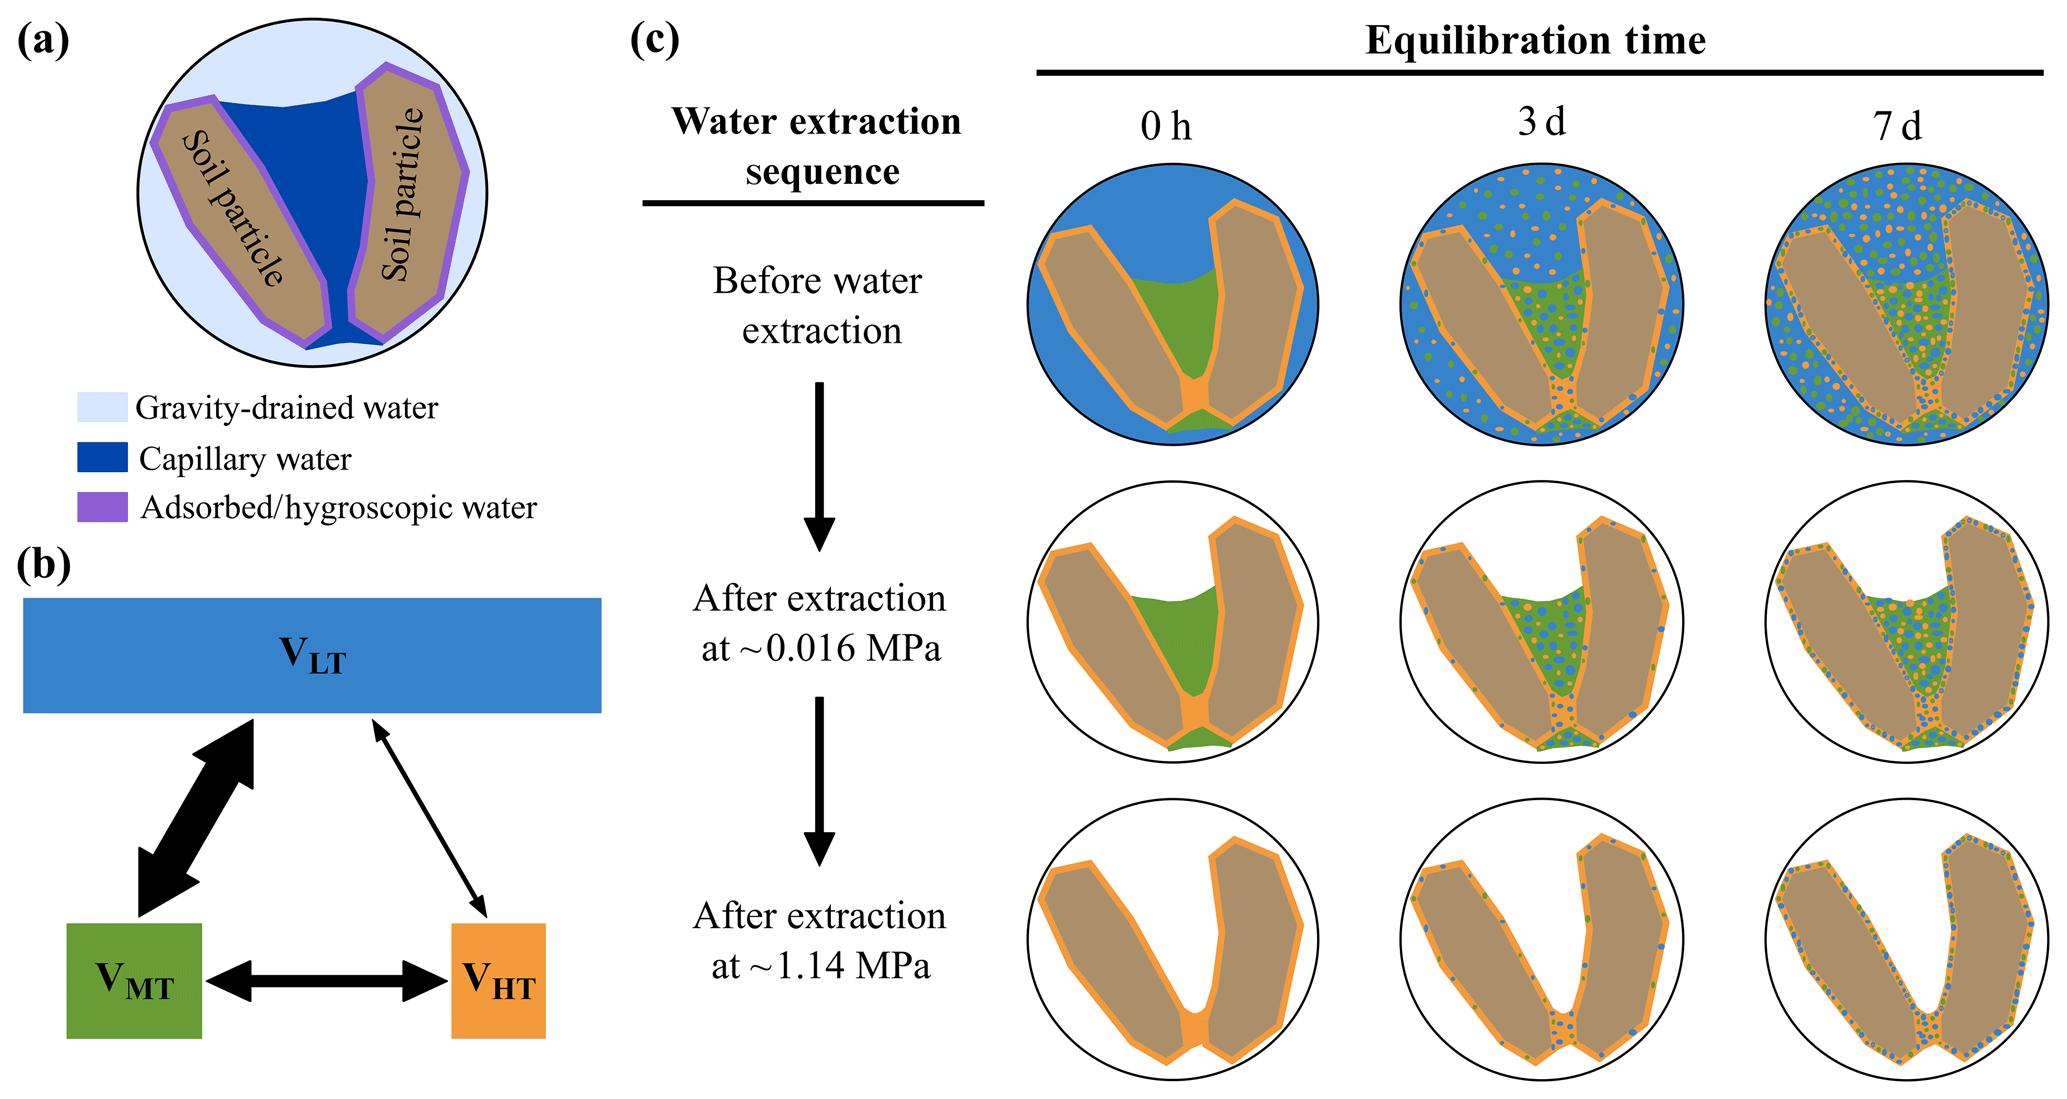
Figure 3(a) Spatial relationship of the three most commonly discussed water pools that make up the bulk water pool in soil near saturation. Absorbed/hygroscopic water, capillary water, and gravity-drained water are depicted in a hypothetical cross-sectional view of two soil particles within the soil matrix. (b) Relative volumes (V) of soil water pools in this study based on Fig. 1 (“LT” denotes low tension, “MT” denotes mid tension, and “HT” denotes high tension) and the relative amount of interactions (size of black arrows) between pools as equilibration time proceeds. (c) Three soil water pools for this study in hypothetical pore space, as diagramed in panel (a), at three equilibration time points and various points in the water extraction sequence. Based on Fig. 1, water extracted at low tension is comprised of gravity-drained water and capillary water, water extracted at mid tension is composed of capillary water, and water extracted at high tension is comprised of capillary water and hygroscopic water. As equilibration time increases, each pool moves closer towards a well-mixed state (i.e., equilibrium).
We used data across all experiments to fit Eq. (3), which made initial conditions (δ0) somewhat uncertain. To account for this error and the expectation that such uncertainties would converge as time went on, we applied a heteroskedastic error term that depends on time since mixing:
where b0 and b1 are the respective intercept and slope terms that vary with the different extraction tensions. We determined δe from the mean value of fully mixed water inputs on the left side of Eq. (2) from every two-part mixing model. Mean δ values and standard deviations used for δe were ‰ for δ2H (n=27) and ‰ for δ18O (n=27), which are heavily weighted towards the value of the heavy water, reflecting the much larger proportion of this water in fully wetted samples.
We compared the distribution of the expected equilibrium value (δe) to those of the different extracted fractions to evaluate mixing times. We considered the system to be completely mixed when the median expected δ value of the different extracted fractions was within the 90th percent credible interval of δe.
All statistical analyses were performed with the R v. 3.6.1 software (R Core Team, 2019). The “emmeans” R package was used to conduct the MANOVA analysis (Lenth, 2019). The time-dependent mixing models were analyzed using the probabilistic programming language Stan (Carpenter et al., 2017), with the rstan programming interface (Stan Development Team, 2019).
3.1 Isotope ratios of extracted waters and MANOVA
The amount of water removed from the soil within each of the tension ranges was consistent across all samples. The low- and mid-tension centrifuge extractions removed 71±6 % and 17±6 % (n=27) of the soil water, respectively, and the high-tension CVD extraction recovered the remaining 12±1 % (n=27) of the soil water. Average volumes from the three extraction steps in the experiment are illustrated on Fig. 1 in relation to the soil water retention curve for sandy loam soil.
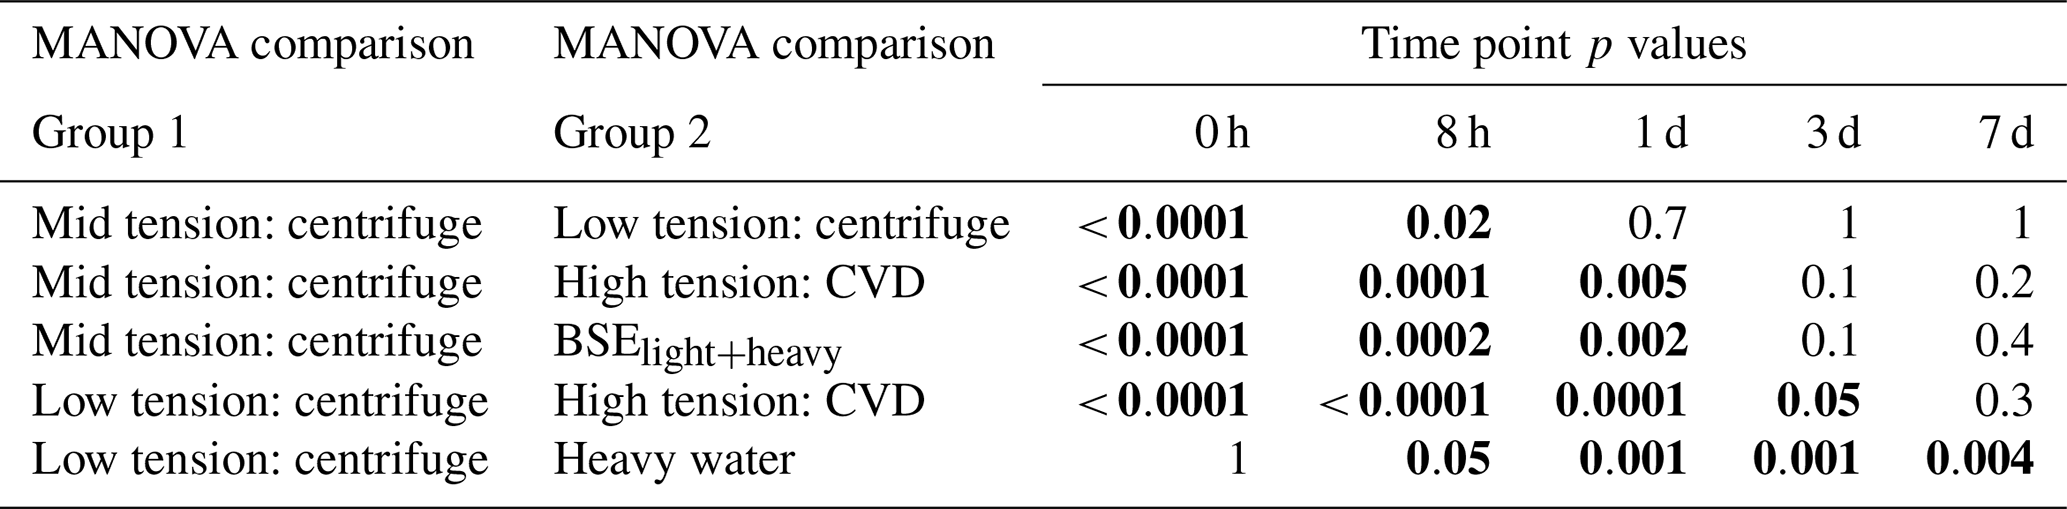
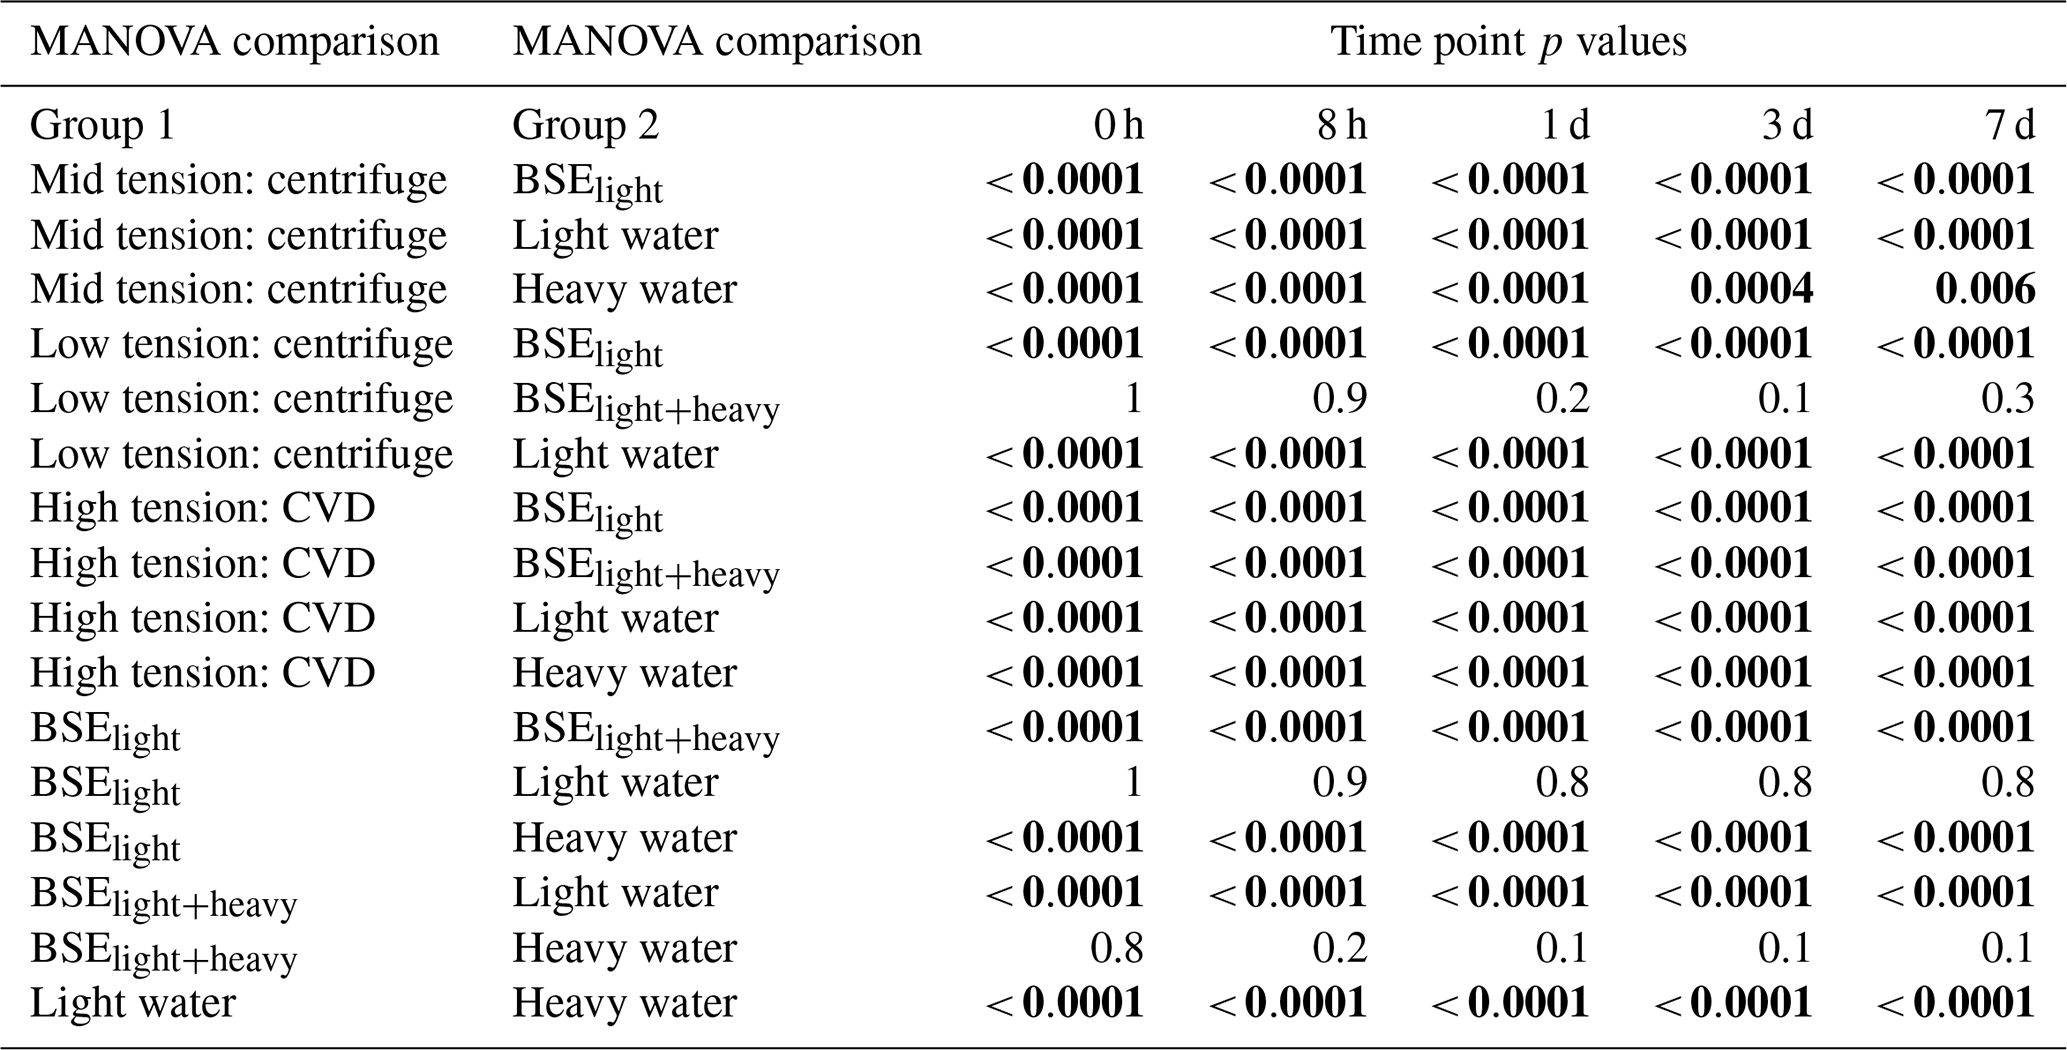
The isotope composition of waters extracted at the three tensions were clearly different at 0 h after soil wetting, but the differences diminished with the amount of time the added light and heavy waters were allowed to interact (Fig. 4, Table 1). The isotope ratio of water recovered using CVD of BSElight samples (bulk sample extraction after light water applied) indicates that the water in the sample at this step was potentially altered slightly by evaporative enrichment of heavy isotopes mixed into the oven-dried soil, which had a high amount of surface area exposed to the dry local atmosphere. Although this changed the isotopic value of water in soil before the application of the heavy water, the light waters applied and the BSElight extracted waters were not significantly different (p > 0.05). The isotope ratio values of the BSElight+heavy samples were not significantly different from that of the heavy waters applied (p > 0.05). At 0 h, the isotope ratio values of water extracted using centrifugation at low rotational velocity (water extracted at low tension) were not significantly different from those of either the heavy waters applied (p > 0.05) or the BSElight+heavy samples (p > 0.05). However, for the samples assessed at 0 h, the isotope ratio values among waters extracted across the three different tensions were significantly different from one another (p values < 0.01; Table 2). After 8 h of mixing, the isotope ratio values of water extracted at low tension were significantly different from that of the heavy water applied (p < 0.05), and these remained significantly different over the remaining equilibration times (p values < 0.01). After 1 d, the isotope ratio values of the waters extracted at low tension were not significantly different from those extracted at mid tension (p > 0.05), whereas the isotope ratio values of water extracted at mid tension were significantly different from those extracted at high tension (p < 0.01). After 3 d of mixing, the isotope ratio values of waters extracted at low and high tensions remained statistically different (p=0.05), but even these were indistinguishable after 7 d of mixing (p > 0.05). Over time, the isotopic ratio values for waters recovered from all three tensions converged upon the expected equilibrium value based on mass balance mixing of the two applied waters, predominantly weighted by the heavy water due to the proportionally much larger amount of heavy water applied. The isotope ratio values of water extracted at high tension were significantly different (p values < 0.01) from BSElight samples, BSElight+heavy samples, heavy water samples, and light water samples for all equilibration time points. A shortened list of the comparisons between groups is presented in Table 2, and a complete list is found in Appendix A (Table A1).
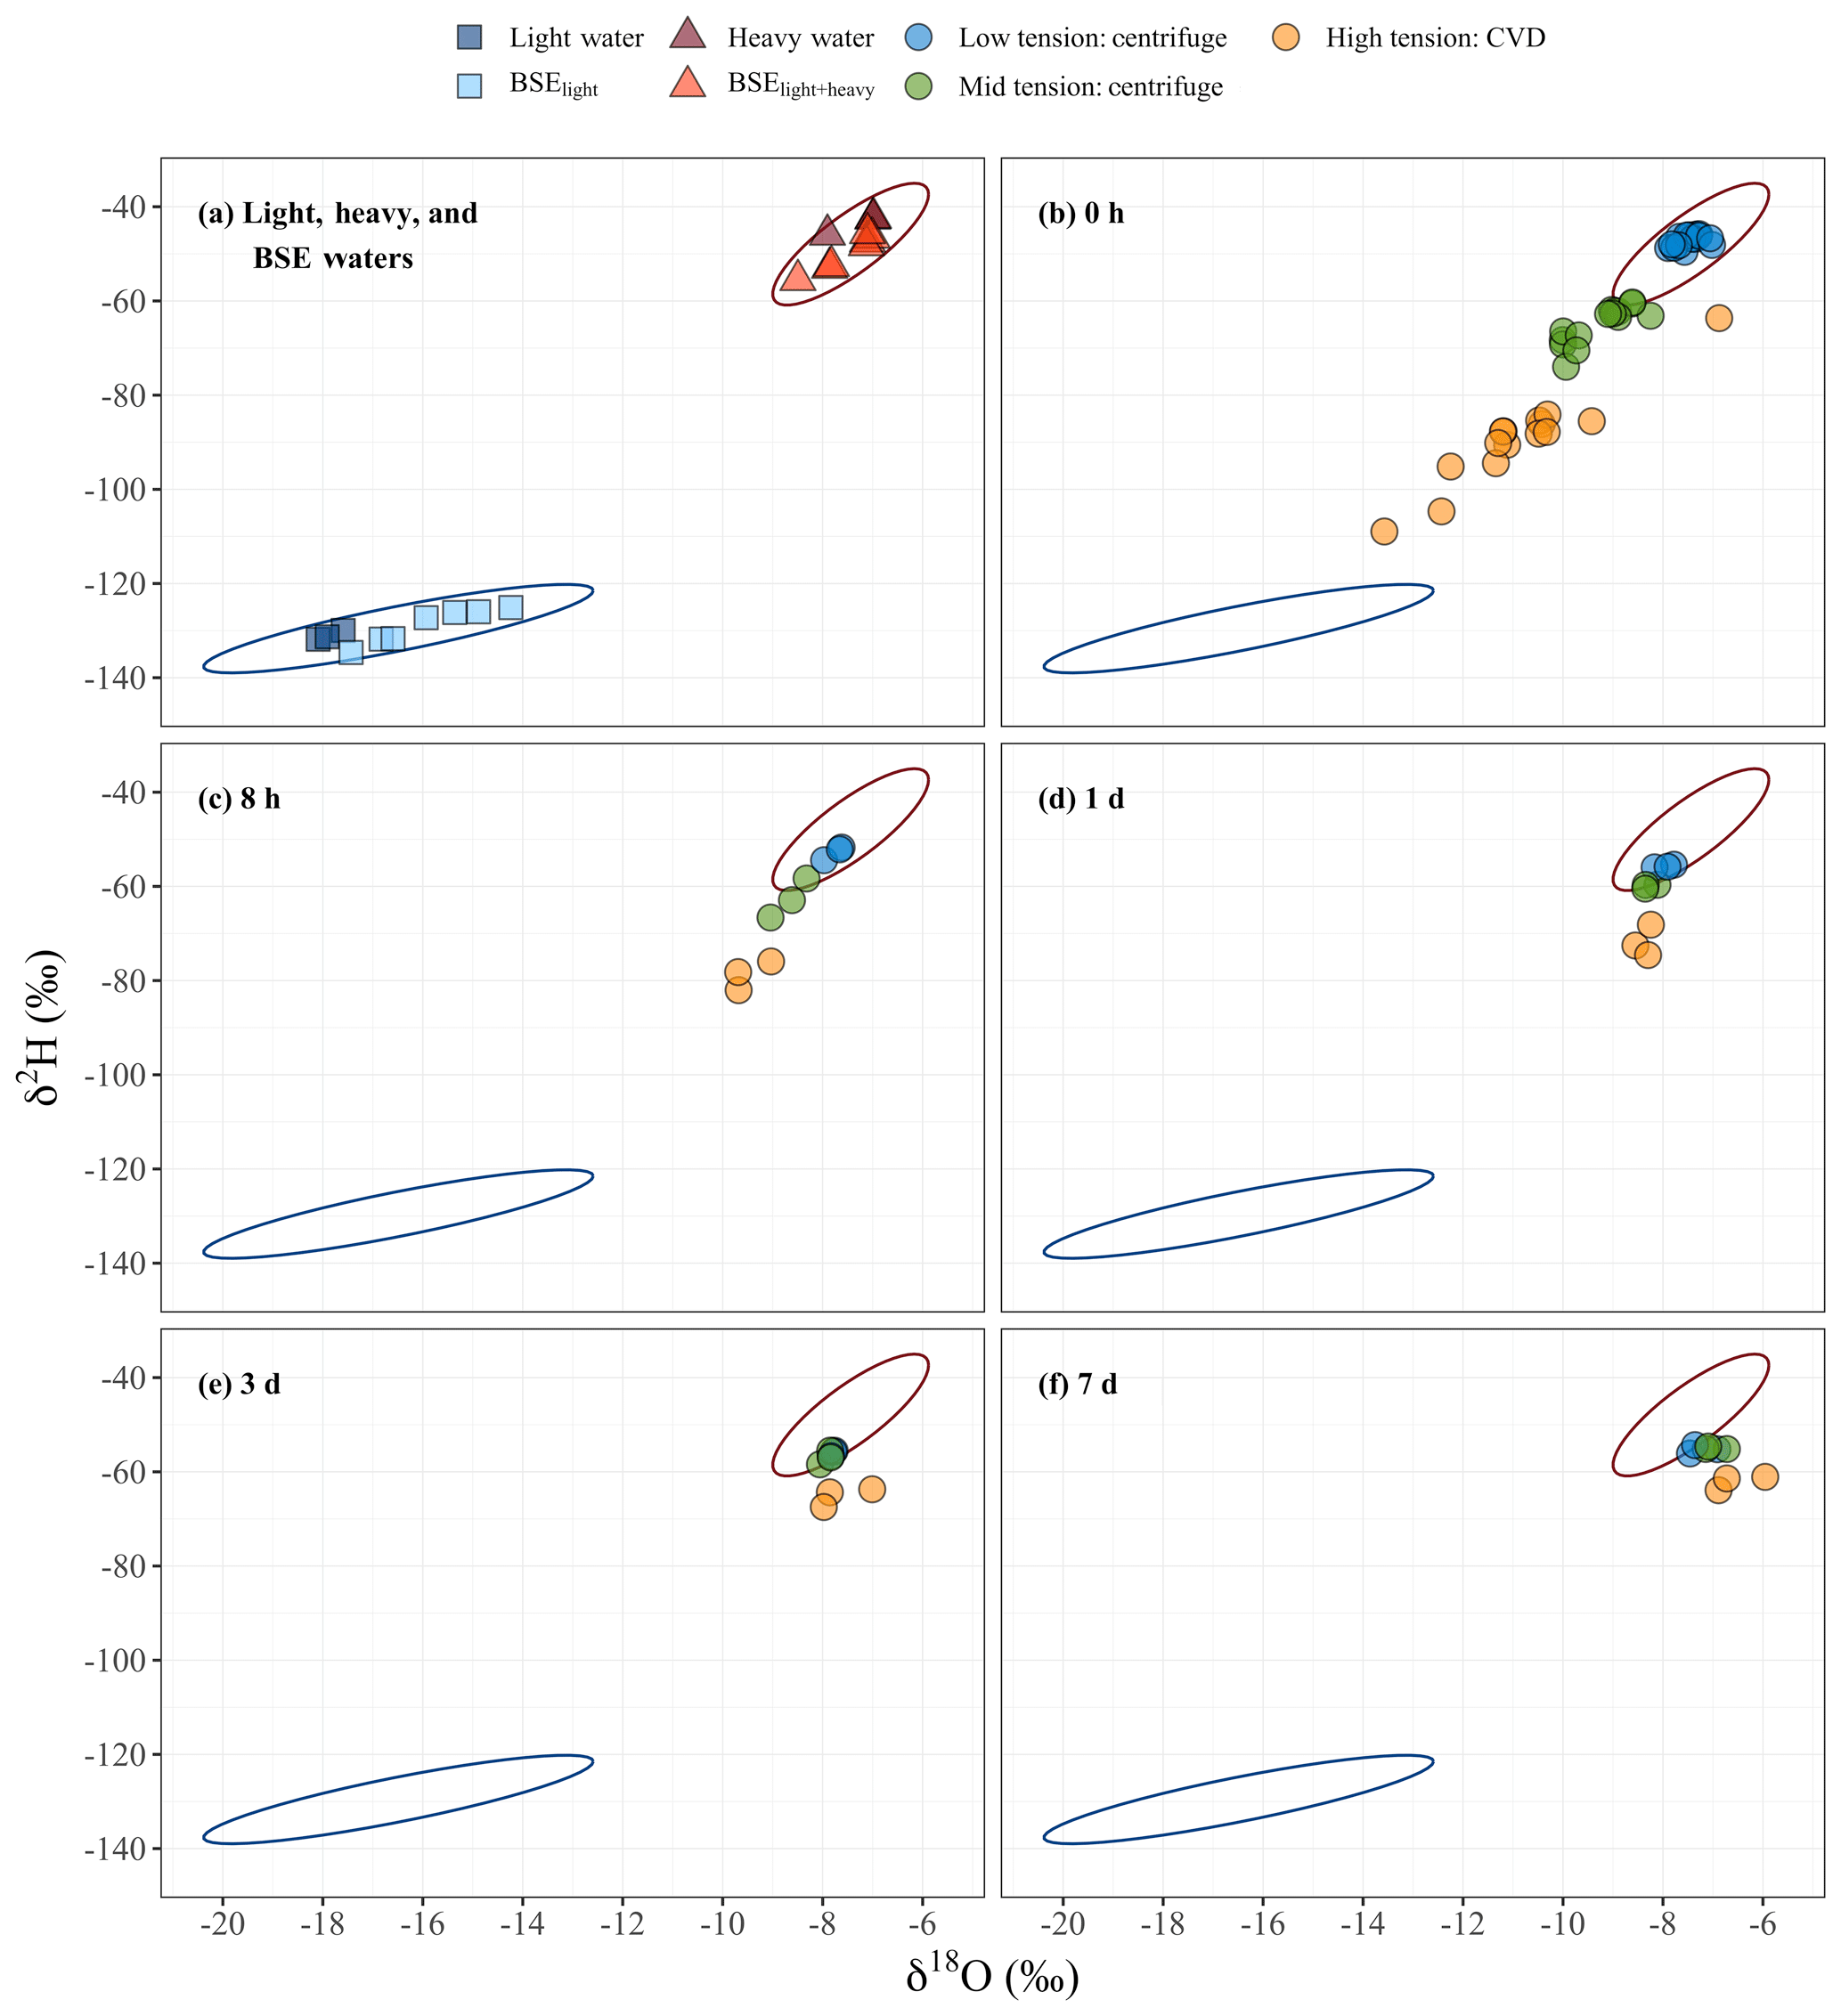
Figure 4Isotopic values of water samples in dual-isotope space, δ2HVSMOW (‰) vs. δ18OVSMOW (‰). (a) Light, heavy, and BSE (bulk sample extraction) waters with 95 % confidence interval ellipses generated by pooled data of light, heavy, and BSE waters, as the pooled groups were found to be not significantly different with pairwise MANOVA (Table A1); the blue ellipse represent BSElight and light water, and the red ellipse represent BSElight+heavy and heavy water. (b–f) Waters extracted at low, mid, and high tension for each equilibration time point. The 95 % confidence interval ellipses from (a) are included in (b–f) for reference.
Table 1The mean, standard deviation, and range of isotope values for each extracted water sample from each time point.
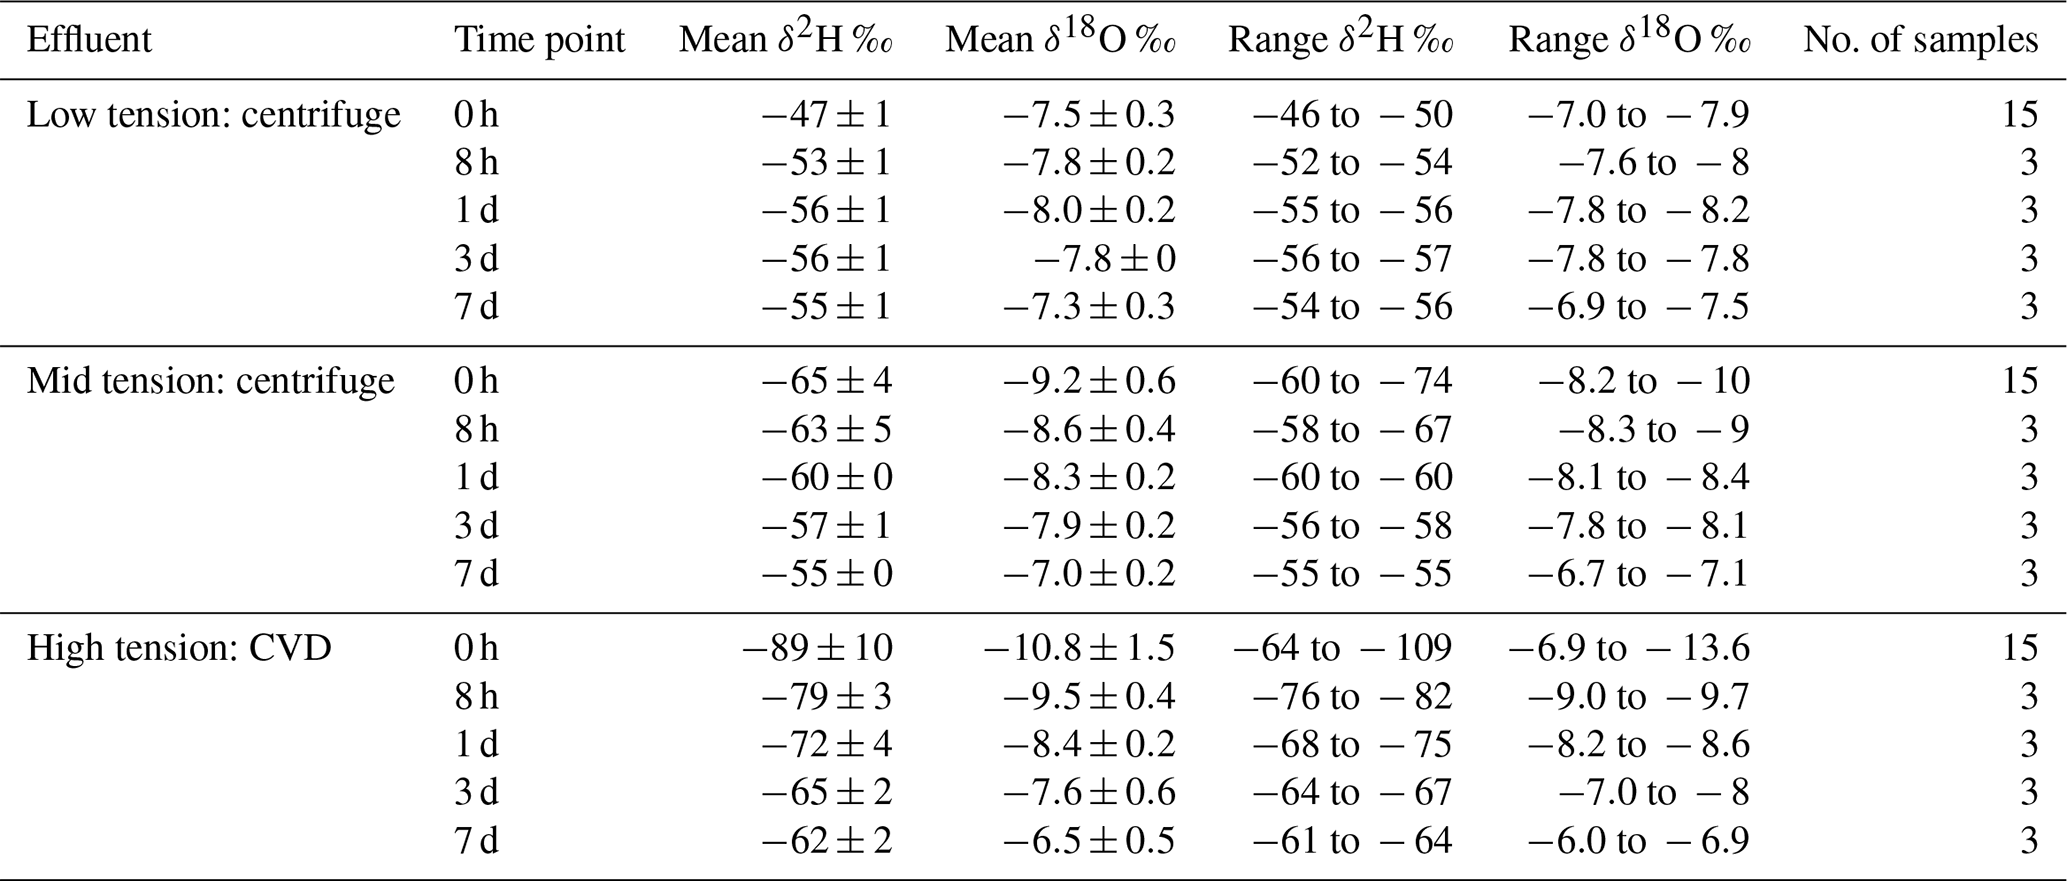
Table 2The results of pairwise MANOVA tests for the experiment with comparisons between groups of samples; group 1 compared to group 2 is shown in the respective rows. Significant values are highlighted in bold (p value ≤0.05). Only comparisons that changed from significant to insignificant or vice versa throughout the experiment are shown; the 16 comparisons that either remained significant or insignificant for all time points can be found in the Appendix (Table A1).
3.2 Two-part isotope mass balance model
The results from the mixing model using Eq. (2) were uniform across soil samples. The mean percentage of water recovered was 100.2±0.4 % (n=27) based on δ2H data, with a range of 99.34 % to 102.05 %, whereas the mean percentage of water recovered was 100.1±0.1 % (n=27) based on δ18O data, with a range of 99.88 % to 100.25 %. These values suggest that all water applied was accounted for in the extraction processes and that minimal, if any, fractionation occurred due to evaporation.
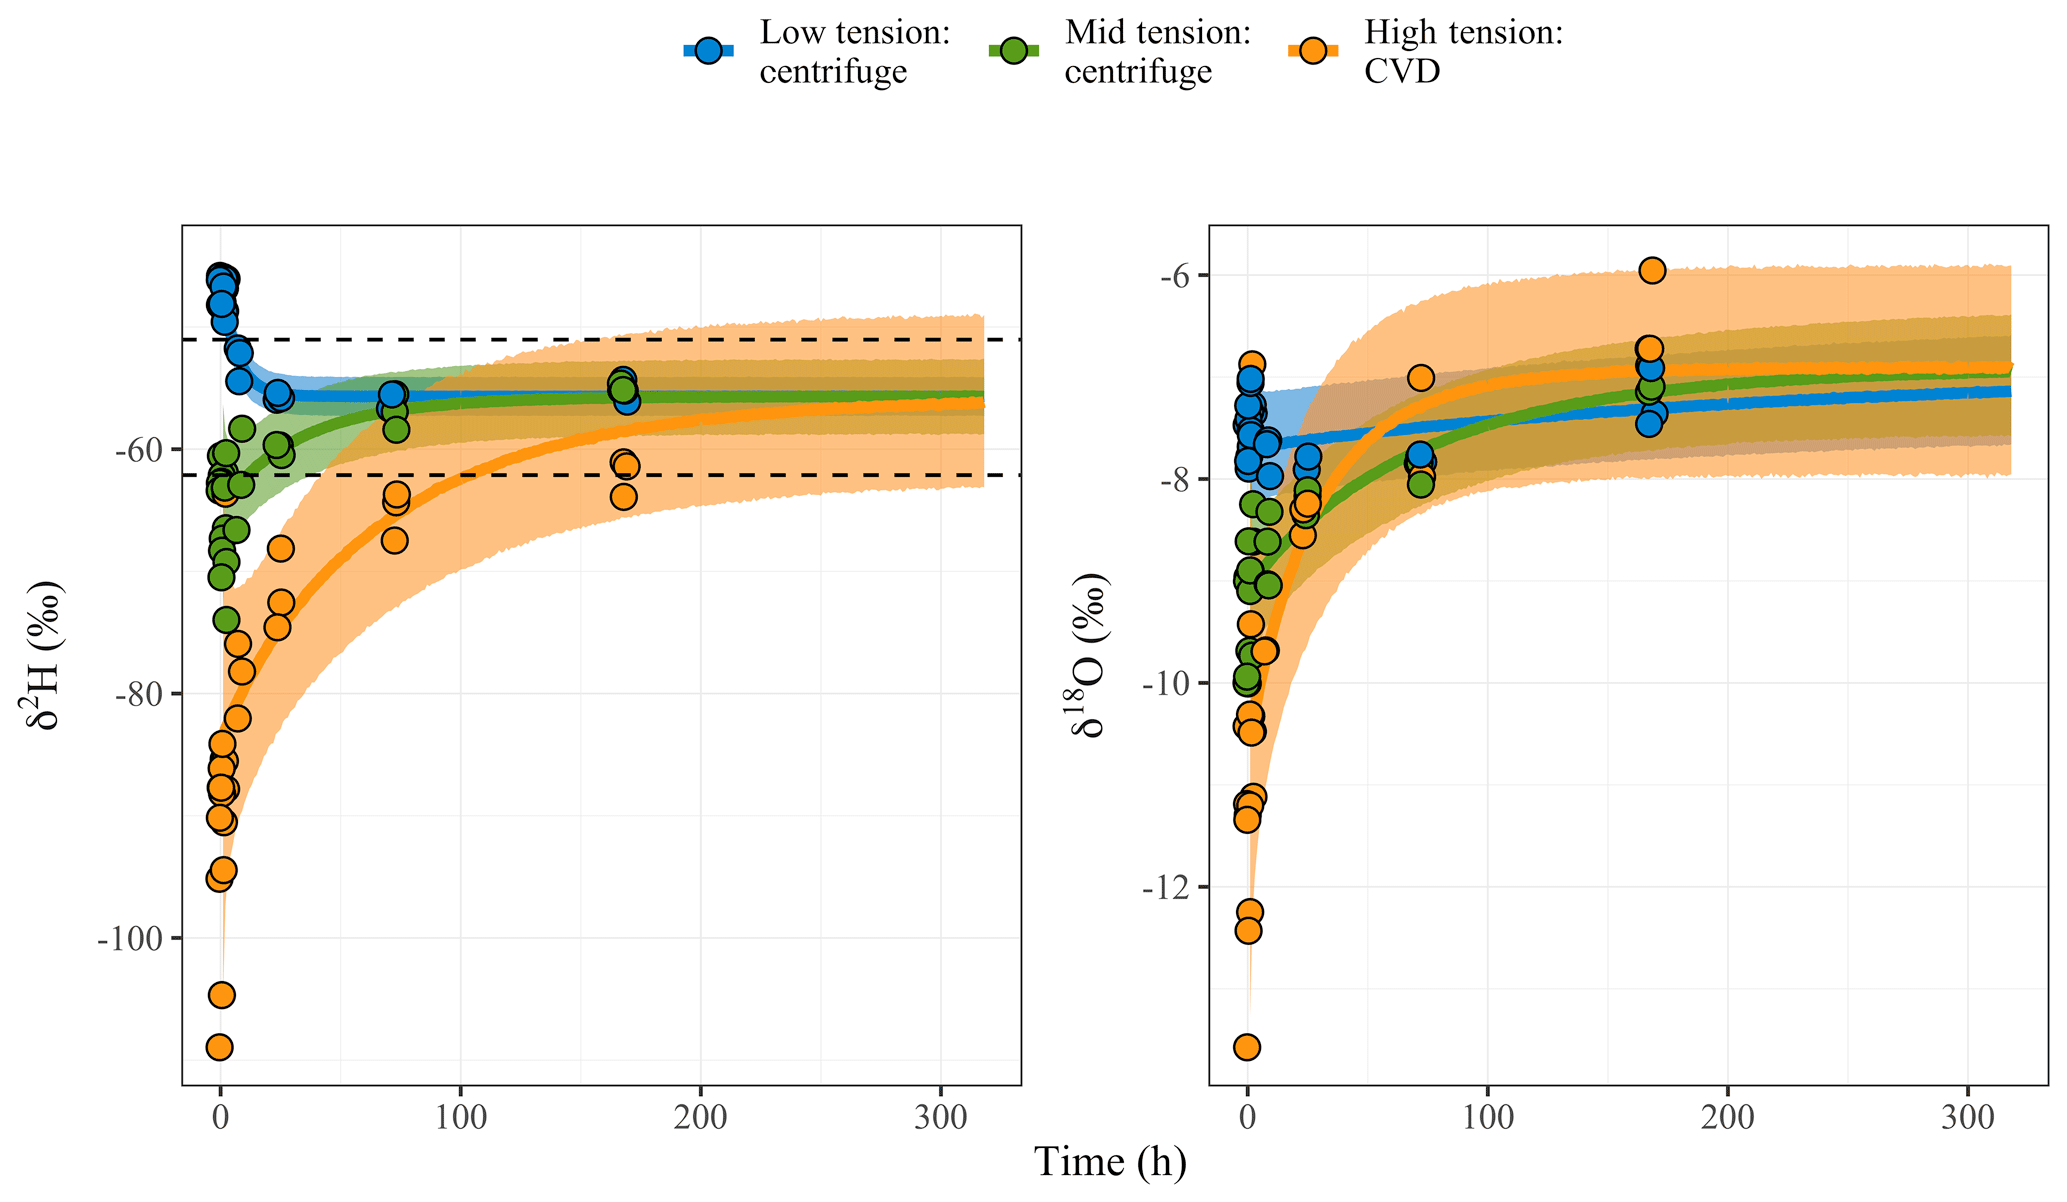
Figure 5Time-dependent mixing model curves plotted for δ2H and δ18O (‰, VSMOW) for each extracted water fraction over time. Shaded regions are the 90th credible intervals for each curve. The dashed lines represent the 90th credible interval for the equilibrium (δe) estimate of δ2H. δ18O measured values indicated possible fractionation offset near when equilibrium was achieved according to δ2H values. Due to this offset, probability densities with δ18O data were not evaluated similarly to the δ2H values, as the time-dependent mixing model works under the assumption that there are no fractionation offsets occurring. Therefore, no dashed lines are shown in the right plot for δ18O data.
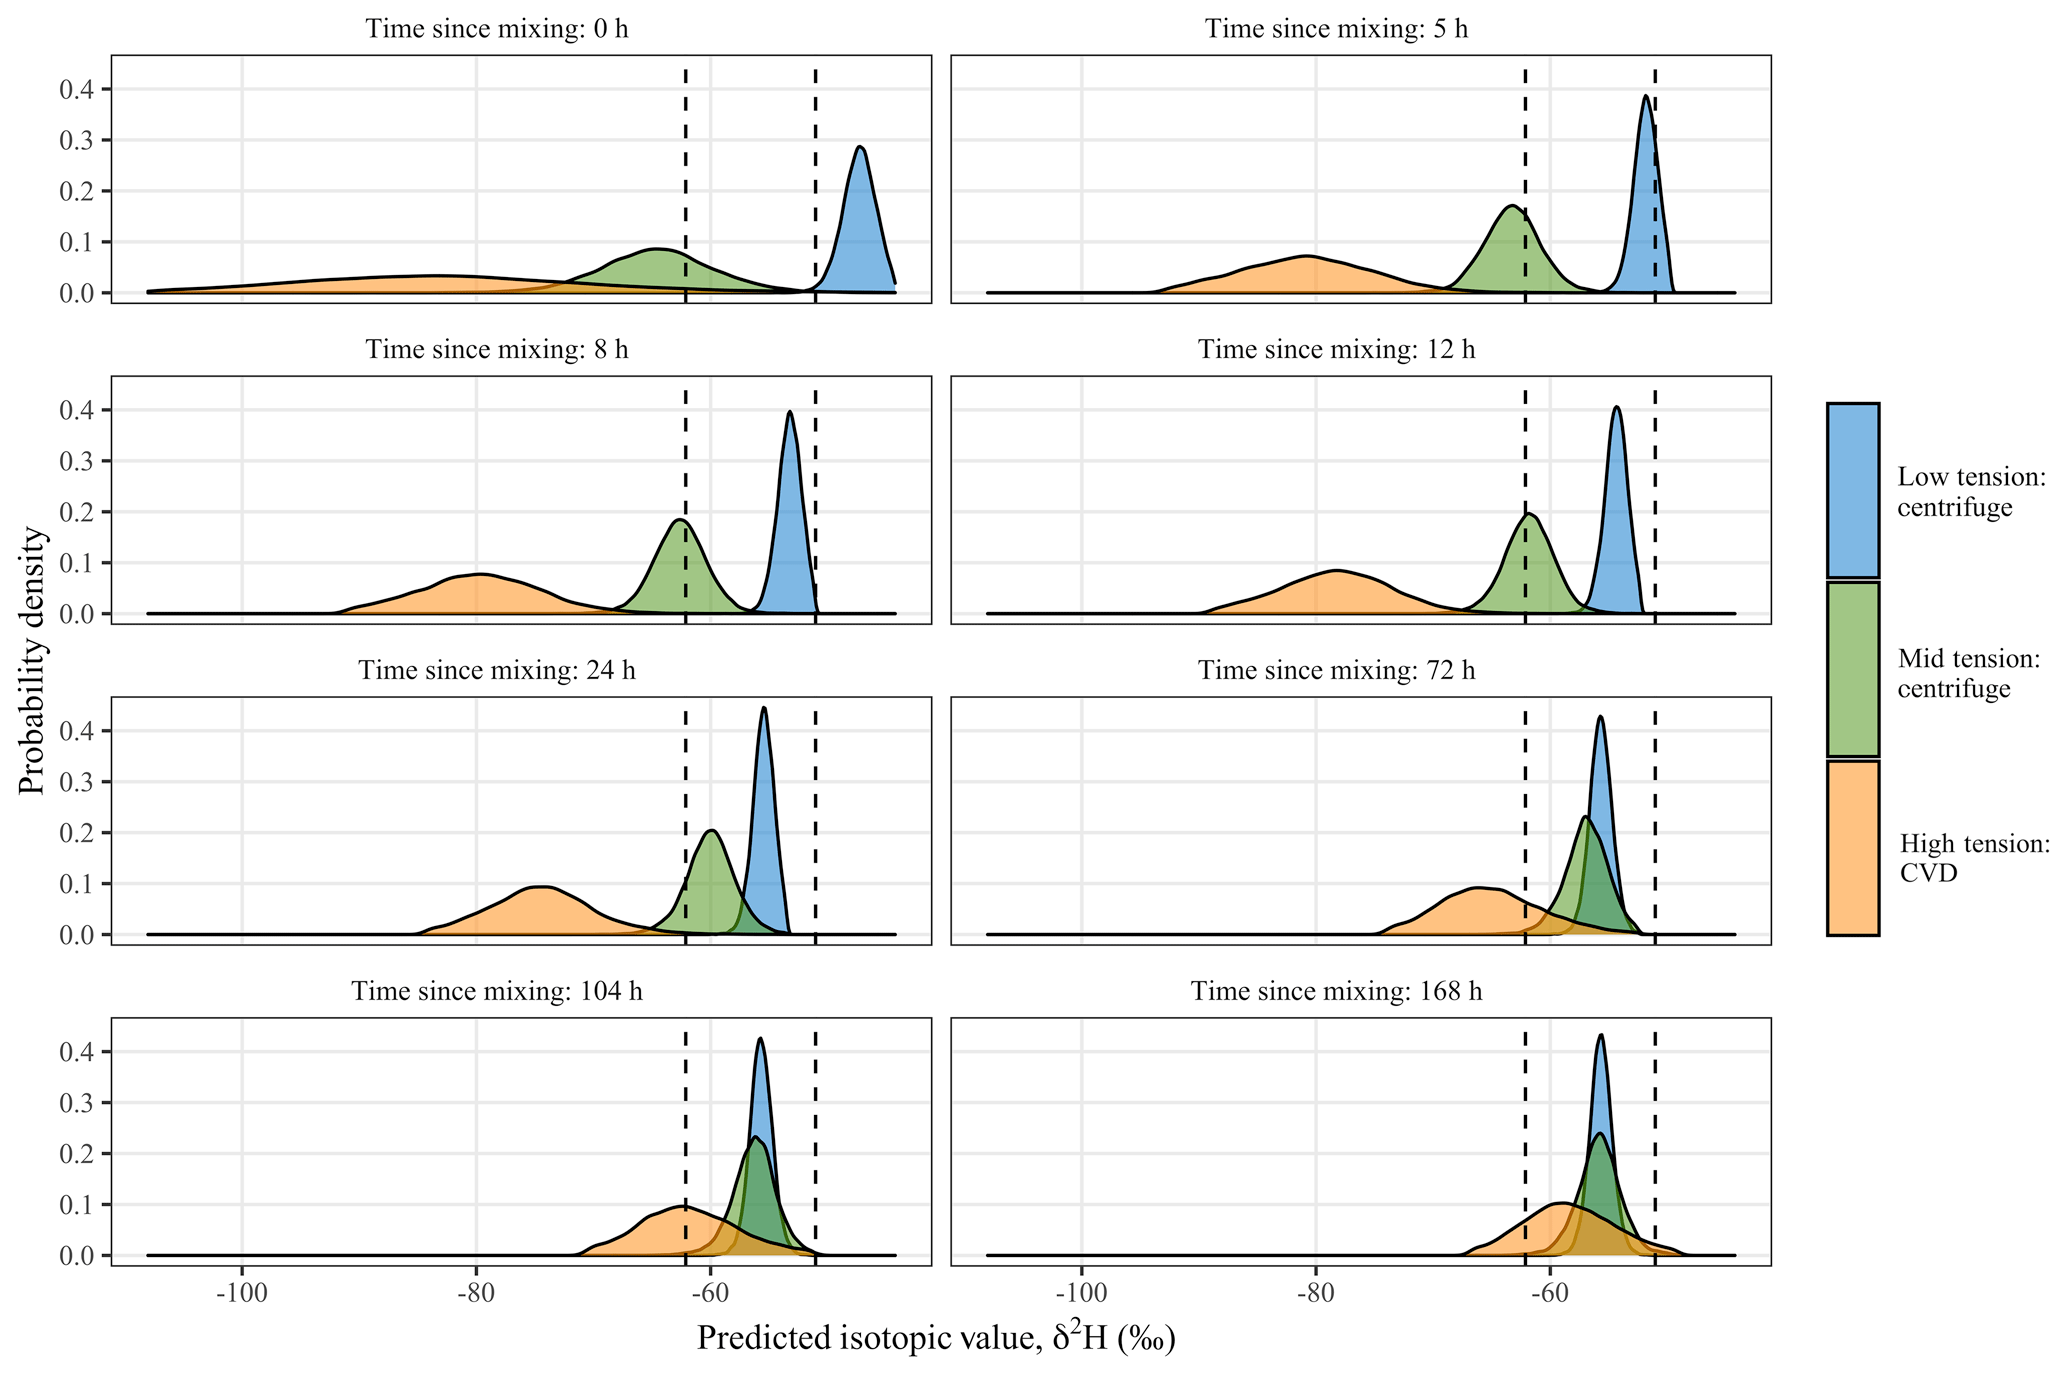
Figure 6Time-dependent model for mixing time with distributions of δ2H for each of the three extracted water fractions over time in relation to the 90th credible interval for equilibrium value (δe, dashed lines). Panels include extraction times for the experiment as well as important time points for mixing. At 5 h the median low-tension value was within the 90th credible interval of the equilibrium value. At 12 h, the isotope composition of waters extracted at low and mid tension was similar to the equilibrium value. It was not until 104 h (∼4.33 d) that the median isotopic value of the water extracted at high tension was also within the 90th credible interval of the equilibrium value.
3.3 Time-dependent mixing model
Model estimates determined from the time-dependent mixing equation (Eq. 3) are provided in Figs. 5 and 6. A 1:1 relationship between the observed and predicted values indicates that the model did reasonably well at predicting observed values and their uncertainty, with only one value observed outside the given uncertainty bound for δ2H (Fig. 7). Results were generally consistent between the two isotopes; however, δ18O expressed an upward shift in values as the mixing time proceeded. Mean values of parameters for the time-dependent mixing models are reported in Table 3.
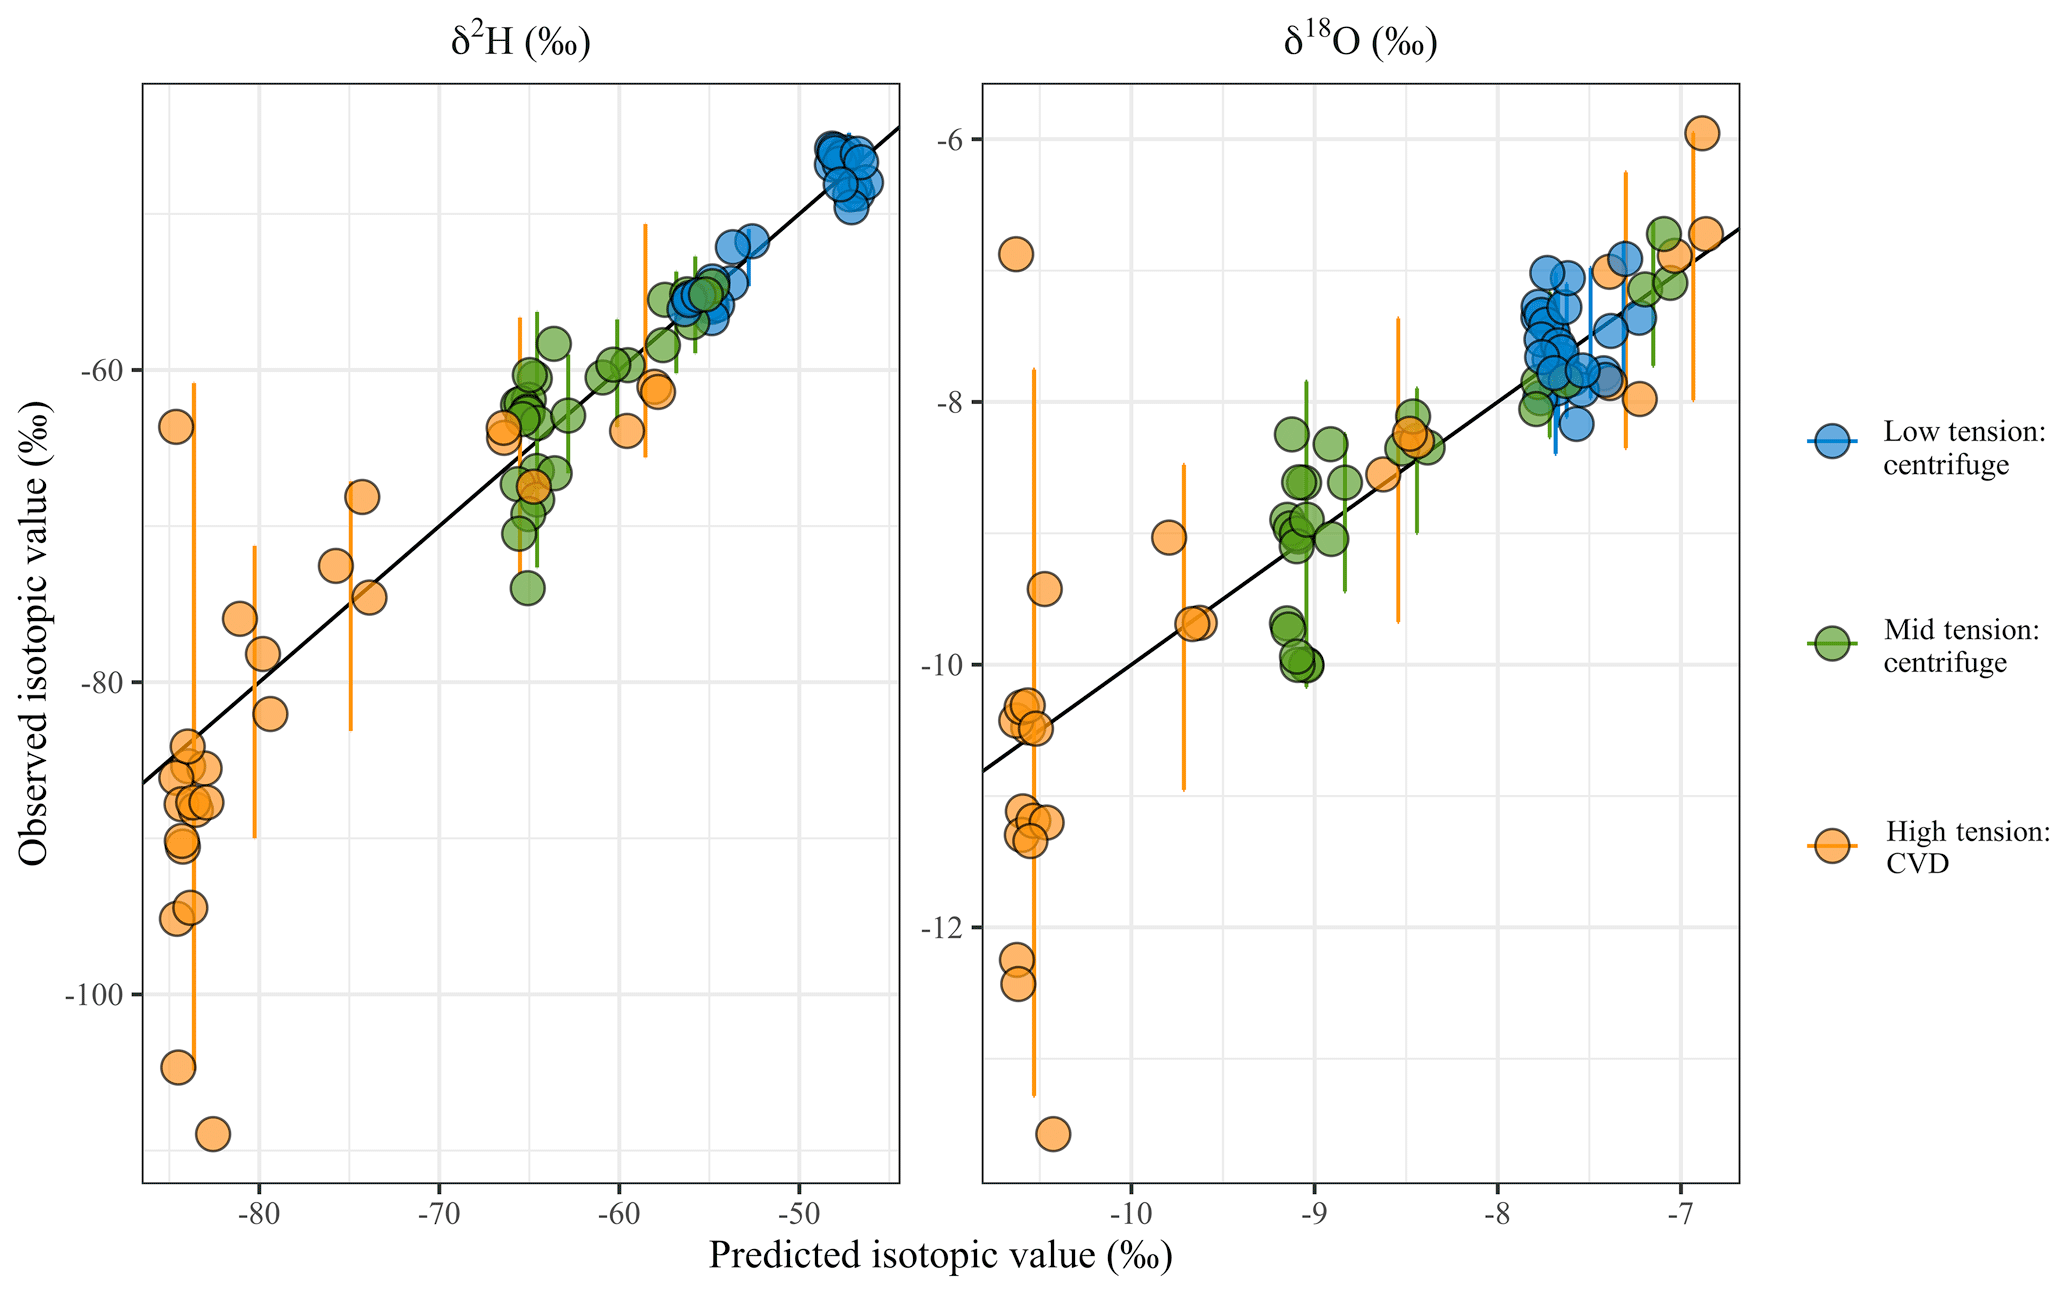
Figure 7Comparison of predicted, with Eq. (3), and observed values for waters extracted with different tensions. The 1:1 line is shown. Bars represent the credible interval (90 %) of the predicted values by time point and tension. A slight jitter (3%) has been added to the predicted value (x axis) in an effort to display the points.
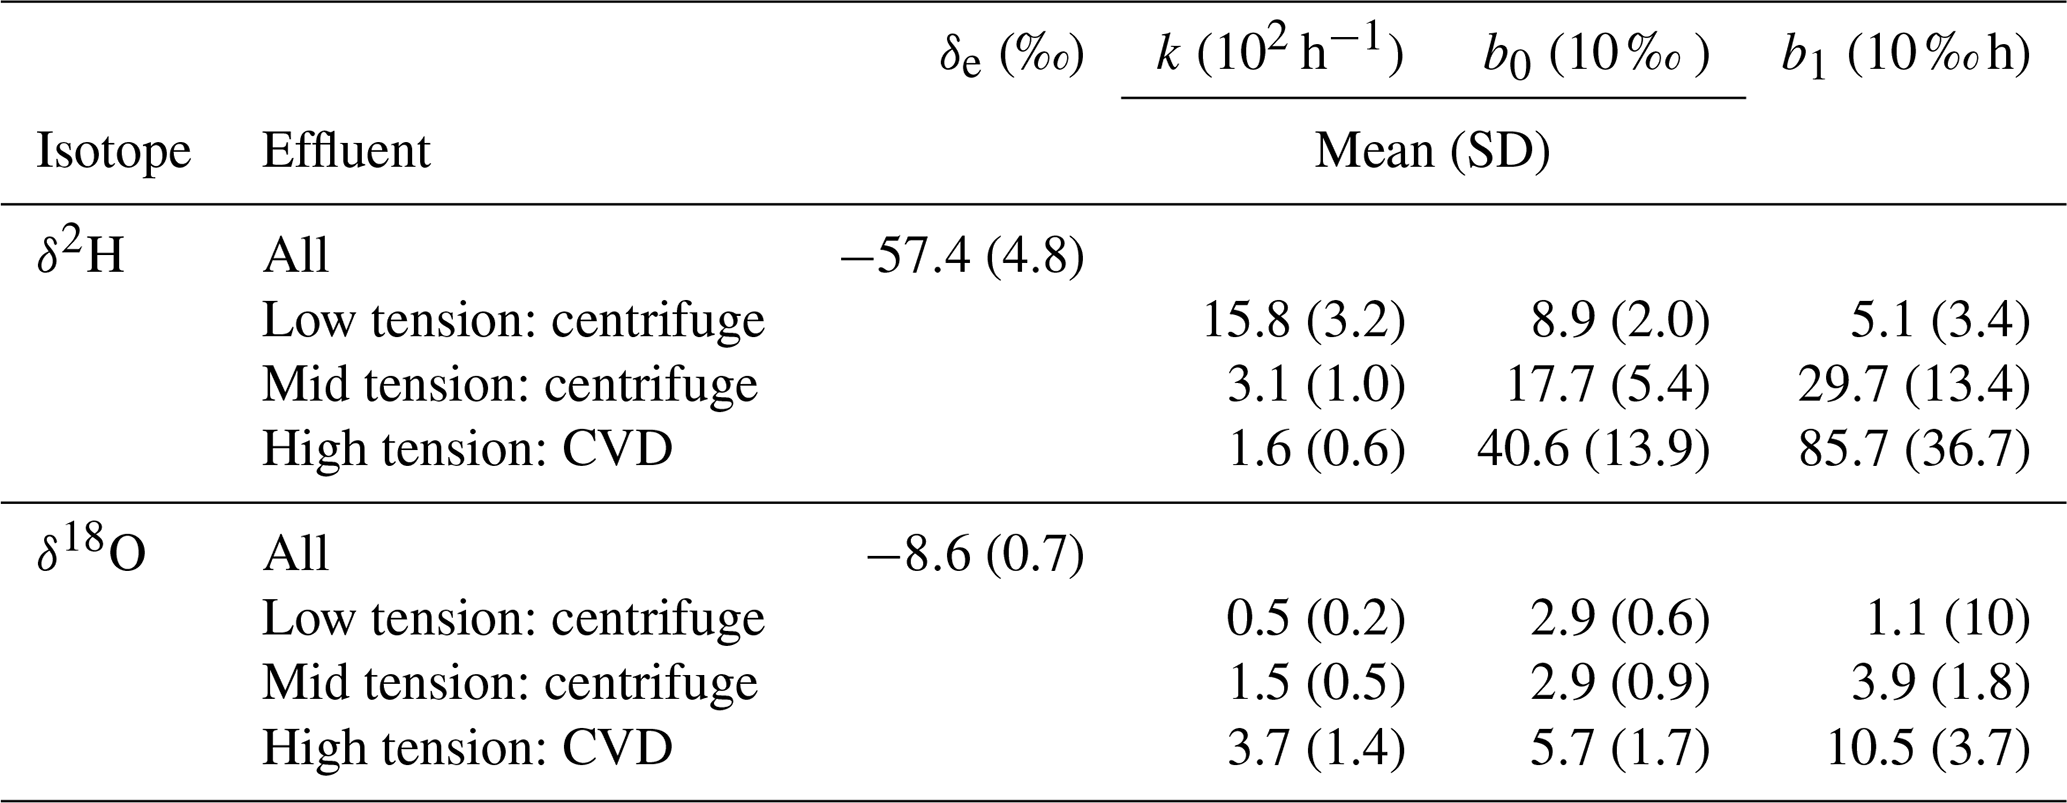
Table 3Means and standard deviations of parameters used in the time-dependent mixing model.
δ2H values at the beginning of the experiment, across tensions, were distinct from one another (Fig. 6). It took about 5 h for the isotope values of water extracted at low tension to become similar to the expected equilibrium (i.e., well-mixed) δe value. Water extracted at mid tension did not attain a thoroughly mixed value until 12 h. It took ∼104 h for the water recovered at high tension by CVD to reach the expected equilibration value. These model results suggest that it would have taken the sequentially added waters a little more than 4 d to completely mix and equilibrate across the pools of soil water. δ18O values indicate possible fractionation expressed at day 3 and 7 equilibration time points with offsets towards heavier values. Due to these offsets, probability densities were not evaluated with δ18O data, as our time-dependent mixing model did not account for fractionation offsets occurring during equilibration.
Recent work by the ecohydrological community has emphasized the need to understand how the isotopic composition of various pools of water held at a range of tensions interact and evolve over time (Adams et al., 2019; Oerter et al., 2019; Poca et al., 2019). Our approach successfully permitted the analysis of the isotopic composition of water extracted at different tensions within a single soil sample, thereby offering a method to assess the time-dependent isotopic exchange among soil pools. We believe our approach can be extended to investigate potential isotopic fractionations and chemical exchanges that shape the isotopic and geochemical composition of water in different soil regions over time. Our findings are consistent with those from other recent studies (Adams et al., 2019), suggesting that waters occupying different pore spaces added sequentially to dry soil do not immediately and completely mix. Lags in isotopic mixing and equilibration have implications for studies focused on plant water sources, soil water age or residence times, water balance, and flux partitioning (Evaristo et al., 2015, 2019; Good et al., 2015; He et al., 2019; Sprenger et al., 2018; Wang et al., 2019).
The isotopically distinct waters applied to ovendry soil in our proof-of-concept study required more than 3 d to fully mix and equilibrate. Even with some advection through and out of the soil matrix during centrifugation steps as well as possible minor gravitational downward movement of water during equilibration storage, these results reveal relatively long lag times for complete mixing. Complete mixing would likely take longer for undisturbed soil samples with complex aggregate structure compared with our homogenized and disturbed soil samples. The connectivity of water pools within and between soil aggregates and other pore regions for undisturbed soil is likely much lower than in disturbed soils where this complex structure has been reduced. The time-dependent mixing model indicated that complete mixing was achieved at ∼4.33 d, and this time frame was consistent with the MANOVA results between the waters recovered at the three tensions. However, at 7 d the waters extracted under high tension were significantly different from those of the BSElight+heavy samples (MANOVA), but they were within the 90 % credible interval for δ2H of δe according to the time-dependent mixing model. This highlights a key difference between the statistical methods of comparison: while the MANOVA compares the multivariate normal means across isotopes, our mixing model analysis ignored the δ18O values due to currently unexplained (see below for further discussion) deviations in the mixing model. Nonetheless, while these methods highlight slight differences in their estimate of when the two added waters were completely mixed across all extracted fractions, they both highlight the long time lags in mixing.
The mass balance mixing model revealed that 99 % of the water applied to the ovendry soil in our experiment was recovered over the sequence of centrifuge and CVD extractions, suggesting minimal losses or isotopic fractionation with evaporation after the soils were completely wetted. We chose to use the isotope value of the bulk water extracted after the light water was applied (BSElight) as the end-member in the mass balance model rather than the isotope ratio value of the light water itself. We felt this was justified for the objective of our study, which was to demonstrate the capability of the combined centrifuge–CVD method to evaluate mixing dynamics among different soil water pools.
We observed slightly higher δ18O values of the extracted water pools at days 3 and 7 than predicted based on simple mixing of the two waters added to the dry soil (Fig. 5). Because we recovered the expected mass of water (> 99 %) for these samples, we do not feel that the observed 18O enrichment was a result of evaporation. Water interactions with clay minerals (Gaj et al., 2017) and carbonates (Meißner et al., 2014), in contrast, typically result in depletion of 18O in matrix water. However, the positive shift in δ18O of soil water observed in our study is consistent with observations reported by Oerter et al. (2014), who found that at low water content δ18O of matrix water increased in the presence of clays enriched with potassium. We cannot discount the possibility of such ionic interactions in our study. The time course for ionic exchanges with clays that influence the oxygen isotope composition of matrix water might explain why the mixing dynamics observed in our study differed between H and O isotopes. Identifying and analyzing such effects require more thorough analysis.
As we limited the vapor transport and advection in the current study by holding samples in a closed, isothermal vessel near saturation, we assume the isotope mixing among soil pore waters was dominated primarily by self-diffusion of isotopologues by Brownian motion. This mixing towards equilibrium by self-diffusion in hypothetical pore space is shown in Fig. 3. The diffusion rate in soil solution is a function of the diffusion coefficient for the solute of interest, a tortuosity factor, volumetric water content (θ), and the solute effective concentration gradient (Chou et al., 2012). We did not measure these variables in our study; instead, we simplified the analysis by lumping these processes into a single empirical parameter (k) in our time-dependent mixing model (Eq. 3). However, we expect the soil water content as well as other features that determine tortuosity, like aggregate structure and pore size distribution will have strong influences on the isotopic mixing times of soil water pools. For example, complete mixing in finer textured soils and unsaturated soils will be much longer than those reported here because of these effects but can be assessed using the general approach we describe.
Further development of the general approach we present should address potential artifacts related to centrifugation and CVD as a means to extract waters sequentially from a single sample across a range of tensions. First, the pressure applied to the soil varies within the soil column at a single rotational velocity depending on the distance from the center of the centrifuge rotor. This is unavoidable, but potential artifacts may be reduced or avoided by using low-profile centrifuge vessels. Second, the tension by the soil may change between or during centrifugation steps because the proportion of small pores within the soil column increases as pores get compacted to smaller diameters. This also is unavoidable, and the magnitude of this effect on the distribution of isotopically distinct waters recovered at different tensions should be explored further.
Additional improvements and expanded applications of the combination approach we present should be considered. For example, the use of waters with a greater isotopic difference for experimentally wetting dry soil and reversing the order of the addition of the heavy and light waters would better resolve rates of mixing and possible fractionation effects. Furthermore, applying this combination method to undisturbed soil would need to carefully consider how soil is sampled before it is placed in centrifuge inserts. Collecting field samples directly into inserts would minimize compaction and disturbance of aggregate structure. In addition, the oven-drying step could be eliminated, and equilibration could be assessed using antecedent moisture within undisturbed soil samples. Finally, minimizing the time of centrifugation at each step (Fraters et al., 2017) would provide more highly resolved estimates of soil water mixing times and increase sample throughput. Higher sample throughput is needed because the low temporal and spatial resolution of sampling from the field often limits our ability to thoroughly test mechanisms that create spatial and temporal heterogeneity in the isotopic composition of soil water (Dubbert et al., 2019).
We present a method for separately extracting water held at different tensions within soil for isotopic analysis and provide a quantitative framework for evaluating the time-dependent mixing of isotopically distinct waters within a soil sample. Our general approach could be extended to provide a means to evaluate the time-dependent interactions among pools of soil water and self-diffusion of water in soils with different soil textures, for undisturbed soil cores that retain complex structure, and under variably saturated conditions. Additional work is needed to refine the application of the centrifuge–CVD combination method for such studies but embracing the general notion of a combination method will overcome perceived limitations unique to each separate extraction technique.
Table A1The p value results of pairwise MANOVA tests for the experiment with comparisons between groups of samples; group 1 compared to group 2 is shown in the respective rows. Significant values are highlighted in bold (p value ≤0.05). This table shows the comparisons not displayed in Table 2.
The code and data used in this study can be accessed via Open Science Framework (https://doi.org/10.17605/OSF.IO/ET3G5, Bowers and Mercer, 2020).
WHB conducted the experiment, performed data analysis, developed the figures, and drafted the paper. JJM helped conceive the experiments, prototyped and refined the centrifugation insert, performed data analysis, and developed the self-diffusion model. MSP provided ideas regarding the experimental design and the interpretation of results. DGW helped conceive the experiment and write the paper. All authors edited the paper.
The authors declare that they have no conflict of interest.
This article is part of the special issue “Water, isotope and solute fluxes in the soil–plant–atmosphere interface: investigations from the canopy to the root zone”. It is not associated with a conference.
We thank Brent Ewers and his lab personnel for letting us use their workspace, centrifuge, and rotor. We are also grateful to Thijs Kelleners for guidance on acquiring soil and the use of lab space and equipment. In addition, we would like to thank the University of Wyoming Stable Isotope Facility for assistance with water isotope analysis and for access to space and equipment for cryogenic vacuum distillation. Lastly, we acknowledge the Engineering Machine Shop at the University of Wyoming for making the custom inserts.
This research has been supported by the National Science Foundation (grant no. 1208909).
This paper was edited by Josie Geris and reviewed by two anonymous referees.
Adams, R. E., Hyodo, A., SantaMaria, T., Wright, C. L., Boutton, T. W., and West, J. B.: Bound and mobile soil water isotope ratios are affected by soil texture and mineralogy while extraction method influences their measurement, Hydrol. Process., 34, 991–1003, https://doi.org/10.1002/hyp.13633, 2019.
Allison, G. B., Barnes, C. J., and Hughes, M. W.: The distribution of deuterium and 18O in dry soils 2. Experimental, J. Hydrol., 64, 377–397, https://doi.org/10.1016/0022-1694(83)90078-1, 1983.
Barnes, C. J. and Allison, G. B.: Tracing of water movement in the unsaturated zone using stable isotopes of hydrogen and oxygen, J. Hydrol., 100, 143–176, https://doi.org/10.1016/0022-1694(88)90184-9, 1988.
Berry, Z. C., Evaristo, J., Moore, G., Poca, M., Steppe, K., Verrot, L., Asbjornsen, H., Borma, L. S., Bretfeld, M., Hervé-Fernández, P., Seyfried, M., Schwendenmann, L., Sinacore, K., De Wispelaere, L., and McDonnell, J.: The two water worlds hypothesis: Addressing multiple working hypotheses and proposing a way forward, Ecohydrology, 11, e1843, https://doi.org/10.1002/eco.1843, 2018.
Bowers, W. and Mercer, J.: Combination of soil water extraction methods quantifies isotopic mixing of waters held at separate tensions in soil [data files and R code], Open Science Framework, https://doi.org/10.17605/OSF.IO/ET3G5 2020.
Brantley, S. L., Eissenstat, D. M., Marshall, J. A., Godsey, S. E., Balogh-Brunstad, Z., Karwan, D. L., Papuga, S. A., Roering, J., Dawson, T. E., Evaristo, J., Chadwick, O., McDonnell, J. J., and Weathers, K. C.: Reviews and syntheses: on the roles trees play in building and plumbing the critical zone, Biogeosciences, 14, 5115–5142, https://doi.org/10.5194/bg-14-5115-2017, 2017.
Braud, I., Bariac, T., Gaudet, J. P., and Vauclin, M.: SiSPAT-Isotope, a coupled heat, water and stable isotope (HDO and ) transport model for bare soil. Part I. Model description and first verifications, J. Hydrol., 309, 277–300, https://doi.org/10.1016/j.jhydrol.2004.12.013, 2005.
Brooks, J. R., Barnard, H. R., Coulombe, R., and McDonnell, J. J.: Ecohydrologic separation of water between trees and streams in a Mediterranean climate, Nat. Geosci., 3, 100–104, https://doi.org/10.1038/ngeo722, 2010.
Carpenter, B., Gelman, A., Hoffman, M. D., Lee, D., Goodrich, B., Betancourt, M., Brubaker, M. A., Guo, J., Li, P., and Riddell, A.: Stan: A probabilistic programming language, J. Stat. Softw., 76, 1–32, https://doi.org/10.18637/jss.v076.i01, 2017.
Chou, H., Wu, L., Zeng, L., and Chang, A.: Evaluation of solute diffusion tortuosity factor models for variously saturated soils, Water Resour. Res., 48, 1–11, https://doi.org/10.1029/2011WR011653, 2012.
Day, P. R.: Particle fractionation and particle size analysis, in: Methods of soil analysis. Part 1. ASA and SSSA, edited by: Black, C. A., Madison, Wisconsin, USA, 545–567, https://doi.org/10.2134/agronmonogr9.1.c43, 1965.
Dubbert, M., Caldeira, M. C., Dubbert, D., and Werner, C.: A pool-weighted perspective on the two-water-worlds hypothesis, New Phytol., 222, 1271–1283, https://doi.org/10.1111/nph.15670, 2019.
Edmunds, W. M. and Bath, A. H.: Centrifuge Extraction and Chemical Analysis of Interstitial Waters, Environ. Sci. Technol., 10, 467–472, https://doi.org/10.1021/es60116a002, 1976.
Evaristo, J., Jasechko, S., and McDonnell, J. J.: Global separation of plant transpiration from groundwater and streamflow, Nature, 525, 91–94, https://doi.org/10.1038/nature14983, 2015.
Evaristo, J., Kim, M., van Haren, J., Pangle, L. A., Harman, C. J., Troch, P. A., and McDonnell, J. J.: Characterizing the Fluxes and Age Distribution of Soil Water, Plant Water, and Deep Percolation in a Model Tropical Ecosystem, Water Resour. Res., 55, 3307–3327, https://doi.org/10.1029/2018WR023265, 2019.
Fraters, D., Boom, G. J. F. L., Boumans, L. J. M., de Weerd, H., and Wolters, M.: Extraction of soil solution by drainage centrifugation–effects of centrifugal force and time of centrifugation on soil moisture recovery and solute concentration in soil moisture of loess subsoils, Environ. Monit. Assess., 189, 83, https://doi.org/10.1007/s10661-017-5788-7, 2017.
Gaj, M. and McDonnell, J. J.: Possible soil tension controls on the isotopic equilibrium fractionation factor for evaporation from soil, Hydrol. Process., 33, 1629–1634, https://doi.org/10.1002/hyp.13418, 2019.
Gaj, M., Kaufhold, S., Koeniger, P., Beyer, M., Weiler, M., and Himmelsbach, T.: Mineral mediated isotope fractionation of soil water, Rapid Commun. Mass Sp., 31, 269–280, https://doi.org/10.1002/rcm.7787, 2017.
Gaj, M., Lamparter, A., Woche, S. K., Bachmann, J., McDonnell, J. J., and Stange, C. F.: The Role of Matric Potential, Solid Interfacial Chemistry, and Wettability on Isotopic Equilibrium Fractionation, Vadose Zone J., 18, 1–11, https://doi.org/10.2136/vzj2018.04.0083, 2019.
Good, S. P., Noone, D., and Bowen, G.: Hydrologic connectivity constrains partitioning of global terrestrial water fluxes, Science, 349, 175–177, https://doi.org/10.1126/science.aaa5931, 2015.
He, Z., Unger-Shayesteh, K., Vorogushyn, S., Weise, S. M., Kalashnikova, O., Gafurov, A., Duethmann, D., Barandun, M., and Merz, B.: Constraining hydrological model parameters using water isotopic compositions in a glacierized basin, Central Asia, J. Hydrol., 571, 332–348, https://doi.org/10.1016/j.jhydrol.2019.01.048, 2019.
Hillel, D.: Introduction to Environmental Soil Physics, Elsevier, ISBN 9780123486554 2003.
Kosugi, K., Hopmans, J. W., and Dane, J. H.: Water Retention and Storage – Parametric Models, in: Methods of Soil Analysis. Part 4. Physical Methods, edited by: Dane, J. H. and Topp, G. C., in: Soil Science Society of America Book Series, 739–758, 2002.
Lenth, R.: emmeans: Estimated Marginal Means, aka Least-Squares Means, R package, GitHub, available at: https://github.com/rvlenth/emmeans, last access: 15 November 2019.
Li, F., Song, X., Tang, C., Liu, C., Yu, J., and Zhang, W.: Tracing infiltration and recharge using stable isotope in Taihang Mt., North China, Environ. Geol., 53, 687–696, 2007.
McDonnell, J. J.: The two water worlds hypothesis: ecohydrological separation of water between streams and trees?, Wiley Interdiscip. Rev. Water, 1, 323–329, https://doi.org/10.1002/wat2.1027, 2014.
Meißner, M., Köhler, M., Schwendenmann, L., Hölscher, D., and Dyckmans, J.: Soil water uptake by trees using water stable isotopes (δ2H and δ18O) – a method test regarding soil moisture, texture and carbonate, Plant Soil, 376(1–2), 327–335, https://doi.org/10.1007/s11104-013-1970-z, 2014.
Nimmo, J. R., Rubin, J., and Hammermeister, D. P.: Unsaturated flow in a centrifugal field: Measurement of hydraulic conductivity and testing of Darcy's Law, Water Resour. Res., 23, 124–134, https://doi.org/10.1029/WR023i001p00124, 1987.
Oerter, E., Finstad, K., Schaefer, J., Goldsmith, G. R., Dawson, T., and Amundson, R.: Oxygen isotope fractionation effects in soil water via interaction with cations (Mg, Ca, K, Na) adsorbed to phyllosilicate clay minerals, J. Hydrol., 515, 1–9, https://doi.org/10.1016/j.jhydrol.2014.04.029, 2014.
Oerter, E. J. and Bowen, G.: In situ monitoring of H and O stable isotopes in soil water reveals ecohydrologic dynamics in managed soil systems, Ecohydrology, 10, 1–13, https://doi.org/10.1002/eco.1841, 2017.
Oerter, E. J., Siebert, G., Bowling, D. R., and Bowen, G.: Soil water vapour isotopes identify missing water source for streamside trees, Ecohydrology, 12, e2083, https://doi.org/10.1002/eco.2083, 2019.
Orlowski, N., Breuer, L., and Mcdonnell, J. J.: Critical issues with cryogenic extraction of soil water for stable isotope analysis, Ecohydrology, 9, 3–10, https://doi.org/10.1002/eco.1722, 2016a.
Orlowski, N., Pratt, D. L., and McDonnell, J. J.: Intercomparison of soil pore water extraction methods for stable isotope analysis, Hydrol. Process., 30, 3434–3449, https://doi.org/10.1002/hyp.10870, 2016b.
Poca, M., Coomans, O., Urcelay, C., Zeballos, S. R., Bodé, S., and Boeckx, P.: Isotope fractionation during root water uptake by Acacia caven is enhanced by arbuscular mycorrhizas, Plant Soil, 441, 485–497, https://doi.org/10.1007/s11104-019-04139-1, 2019.
R Core Team: R: A Language and Environment for Statistical Computing, available at: https://www.r-project.org/ (last access: 24 April 2020), 2019.
Schjonning, P.: Size Distribution of Dispersed and Aggregated Particles and of Soil Pores in 12 Danish Soils, Acta Agr. Scand. B-S. P., 42, 26–33, https://doi.org/10.1080/09064719209410196, 1992.
Schoeneberger, P. J., Wysocki, D. A., Benham, E. C., and Soil Survey Staff: Field Book for Describing and Sampling Soils, Version 3.0. Natural Resources Conservation Service. National Soil Survey Center, Lincoln, NE., Natl. Soil Surv. Ctr., Lincoln, NE, 2012.
Sprenger, M., Herbstritt, B., and Weiler, M.: Established methods and new opportunities for pore water stable isotope analysis, Hydrol. Process., 29, 5174–5192, https://doi.org/10.1002/hyp.10643, 2015.
Sprenger, M., Tetzlaff, D., Buttle, J., Laudon, H., Leistert, H., Mitchell, C. P. J., Snelgrove, J., Weiler, M., and Soulsby, C.: Measuring and Modeling Stable Isotopes of Mobile and Bulk Soil Water, Vadose Zone J., 17, 170149, https://doi.org/10.2136/vzj2017.08.0149, 2018.
Sprenger, M., Llorens, P., Cayuela, C., Gallart, F., and Latron, J.: Mechanisms of consistently disjunct soil water pools over (pore) space and time, Hydrol. Earth Syst. Sci., 23, 2751–2762, https://doi.org/10.5194/hess-23-2751-2019, 2019.
Stan Development Team: RStan: the R interface to Stan, R package, available at: https://cran.r-project.org/web/packages/rstan/vignettes/rstan.html, last acess: 15 November 2019.
Tsuruta, K., Yamamoto, H., Katsuyama, M., Kosugi, Y., Okumura, M., and Matsuo, N.: Effects of cryogenic vacuum distillation on the stable isotope ratios of soil water, Hydrol. Res. Lett., 13, 1–6, https://doi.org/10.3178/hrl.13.1, 2019.
van Genuchten, M. T.: A Closed-form Equation for Predicting the Hydraulic Conductivity of Unsaturated Soils, Soil Sci. Soc. Am. J., 44, 892–898, 1980.
Wang, P., Deng, Y., and Wei, Z.: Modeling Investigation of Diurnal Variations in Water Flux and Its Components with Stable Isotopic Tracers, Atmosphere (Basel), 10, 403, https://doi.org/10.3390/atmos10070403, 2019.
West, A. G., Patrickson, S. J., and Ehleringer, J. R.: Water extraction times for plant and soil materials used in stable isotope analysis, Rapid Commun. Mass Sp., 20, 1317–1321, https://doi.org/10.1002/rcm.2456, 2006.
Zhang, Z., Guo, H., and Wang, Z.: Differences in major ions as well as hydrogen and oxygen isotopes of sediment pore water and lake water, Water Sci. Eng., 11, 147–156, https://doi.org/10.1016/j.wse.2018.07.005, 2018.