the Creative Commons Attribution 4.0 License.
the Creative Commons Attribution 4.0 License.
 | 23 Jul 2020
Assessment and projection of the water budget over western Canada using convection-permitting weather research and forecasting simulations
Sopan Kurkute
Fei Huo
Water resources in cold regions in western Canada face severe risks posed by anthropogenic global warming as evapotranspiration increases and precipitation regimes shift. Although understanding the water cycle is key for addressing climate change issues, it is difficult to obtain high spatial- and temporal-resolution observations of hydroclimatic processes, especially in remote regions. Climate models are useful tools for dissecting and diagnosing these processes, especially the convection-permitting (CP) high-resolution regional climate simulation, which provides advantages over lower-resolution models by explicitly representing convection. In addition to better representing convective systems, higher spatial resolution also better represents topography, mountain meteorology, and highly heterogeneous geophysical features. However, there is little work with convection-permitting regional climate models conducted over western Canada. Focusing on the Mackenzie River and Saskatchewan River basins, this study investigated the surface water budget and atmospheric moisture balance in historical and representative concentration pathway (RCP8.5) projections using 4 km CP Weather Research and Forecasting (WRF). We compared the high-resolution 4 km CP WRF and three common reanalysis datasets, namely the North American Regional Reanalysis (NARR), the Japanese 55-year Reanalysis (JRA-55), and European Centre for Medium-Range Weather Forecasts reanalysis interim dataset (ERA-Interim). High-resolution WRF outperforms the reanalyses in balancing the surface water budget in both river basins with much lower residual terms. For the pseudo-global-warming scenario at the end of the 21st century with representative concentration pathway (RCP8.5) radiative forcing, both the Mackenzie River and Saskatchewan River basins show increases in the amplitude for precipitation and evapotranspiration and a decrease in runoff. The Saskatchewan River basin (SRB) shows a moderate increase in precipitation in the west and a small decrease in the east. Combined with a significant increase in evapotranspiration in a warmer climate, the Saskatchewan River basin would have a larger deficit of water resources than in the current climate based on the pseudo-global-warming (PGW) simulation. The high-resolution simulation also shows that the difference of atmospheric water vapour balance in the two river basins is due to flow orientation and topography differences at the western boundaries of the two basins. The sensitivity of water vapour balance to fine-scale topography and atmospheric processes shown in this study demonstrates that high-resolution dynamical downscaling is important for large-scale water balance and hydrological cycles.
- Article
(19306 KB) - Full-text XML
- BibTeX
- EndNote


If the current pace of greenhouse gas (GHG) emissions continues, evidence points to fast-paced anthropogenic climate change in this century (Pachauri et al., 2014). The warming climate's impacts on water resources and ecosystems are generating considerable interest, particularly its impact on water balance in polar and subpolar regions. Most climate projections have shown that polar and subpolar regions warm faster than the regions in lower latitudes (IPCC, 2013). These results have been robust both in projections of anthropogenic climate change and in observations due to the polar amplification from various local feedback mechanisms (Pithan and Mauritsen, 2014; Winton, 2006) and atmospheric heat transport (Hwang and Frierson, 2010). In the polar and subpolar regions of North America, the Canadian Prairies and Canada's boreal forest will be strongly affected by climate change by the end of century. Climate change greatly affects the water cycle, which closely couples with every aspect of the ecosystem. The precipitation regime changes as moisture transport changes and storm tracks shift, evapotranspiration enhances as temperature rises, soil moisture decreases in summer due to larger evapotranspiration, snow amount increases in wetter winters and melts earlier as spring becomes warmer, and consequently river stream regimes change. Due to these factors, how climate change will affect the water resources and water cycle over the two largest river basins in western Canada, namely the Mackenzie River and Saskatchewan River basins, is uncertain. It is important to enhance our understanding of the water budget in the two large river basins of western Canada.
Previous studies found it difficulty to close the water budget from observations in western Canada. Evapotranspiration and precipitation accounts for the exchange of water between the atmosphere and land. However, observing these processes on a large scale and at a high temporal resolution is costly and challenging. Remote sensing of evapotranspiration relies on thermal imagery and thus has difficulty estimating the temperature of land surface under cloudiness. The in situ observations of evapotranspiration are only available at the locations of the flux towers. Both the observation and simulation of precipitation processes are challenging as a large range of scales from metres to thousands of kilometres are involved. Observation of precipitation suffers from instrument bias and lack of coverage in the less populated regions.
Numerical models can enhance our understanding of the complex, nonlinear, interconnected hydro-meteorological processes in the Earth system by providing virtual laboratories. Through data assimilation and climate simulation, climate models can provide systematic overviews in investigating aspects of water balance on the land surface and in the atmosphere, which is difficult to comprehensively monitor through observation. However, the simulated changes in the water cycle from global climate models (GCMs) are of poor quality due to the relatively poor representation of the small-scale physical processes related to the water cycle, such as convection and orographic precipitation (Rasmussen et al., 2011). Climate simulations from GCMs have to be downscaled before their application in regional hydrology and ecology studies. The lack of explicit representation of small-scale processes also affects the quantification of the feedback of these processes to the large-scale atmospheric and hydrological processes. Therefore, dynamical downscaling using high-resolution regional climate models (Rasmussen et al., 2014) can more accurately represent various important hydroclimatic processes and provide projections without the assumption of stationarity.
The dynamical downscaling at a convection-permitting resolution has advantages over coarser resolution due to its improvements in the simulation of convective precipitation (Prein et al., 2015) and more realistic representation of topography and lower boundary. Because convections contribute the most to extreme precipitations and the vertical transport of moisture, representing convective systems is critical in simulating precipitation and water balance. Convection-permitting (CP) regional climate modelling can explicitly resolve deep convection and other local-scale hydroclimatic processes and their feedback on the larger-scale systems. Moisture transport is significantly affected by the circulation response, which, in turn, is affected by the topography through the generation of mountain waves and lee waves. For instance, chinooks, the North American version of foehn, descend the lee of the Canadian Rockies, causing significant warming over the cold plains in winter. The concurrent warming at the surface and the heat transport by strong surface winds can have significant effects on water balance (MacDonald et al., 2018). For western Canada, particularly the Mackenzie River and the Saskatchewan River basins, using high-resolution CP regional climate models (RCMs) for hydroclimatic research is especially useful because of the large orographic features, such as the Canadian Rockies and active convections during summer. We also want to compare the improvement of water balance closure in CP RCMs to several reanalyses and those in the paper by Szeto et al. (2008).
There have been several investigations utilizing coarse-resolution datasets to study the water budget of the two basins. Szeto et al. (2008) used observation-assimilated reanalysis datasets, including the National Centers for Environmental Prediction Global Reanalysis 2 (NCEP-R2), the global, 40-year European Centre for Medium-Range Weather Forecasts reanalysis (ERA-40), the National Centers for Environmental Prediction (NCEP), the North American Regional Reanalysis (NARR), and the Canadian Meteorological Centre (CMC) operational regional analysis as well as results from the Canadian Regional Climate Model (CRCM) simulations to investigate the water balance and energy balance in the Mackenzie River basin (MRB). They found the residual terms in the water closure equation can be as large as budget terms in MRB, indicating the large uncertainties in hydrological variables in the observation and the deficiencies in GCMs in regional-scale studies. Liu and Stewart (2003) used NCEP–NCAR reanalysis to calculate atmospheric moisture flux into and out of the Saskatchewan River basin and found its moisture flux characteristics are different from the Mackenzie River basin, partly due to its topography and mean wind field. However, these studies are all based on relatively coarse-resolution datasets that poorly represent convection and fine-scale topography's effects on precipitation and moisture transport.
With the CP RCM simulation available over western Canada (Li et al., 2019), it is opportune to investigate the following important questions regarding the water cycle in the two major river basins in western Canada:
-
How does the water cycle and budget in CP RCMs compare to reanalyses? We first compared the annual cycle of the components of surface water balance in the high-resolution model to several reanalyses to see whether the CP RCM closes the water balance better than reanalyses.
-
How can the fine-scale topography cause subtle differences in water balance and moisture flux between the two major river basins within the high-resolution RCM simulation with better representation of the topography in CP RCMs?
-
How is the water balance and cycle in the two river basins going to change compared to the current climate under a high-end emission warming scenario (RCP8.5)?
This paper analyzes the impact of climate change on the water budget based on the CP RCM historical simulation (CTL) and RCP8.5 pseudo-global-warming (PGW) simulation using the Weather Research and Forecasting (WRF) model. Section 2 describes the observation/reanalysis datasets and model configurations. Section 3 briefly describes the analysis and diagnostic methodology. Section 4 compares the water balance terms in of WRF, reanalyses in it detail, and discusses it in the context of climate change and regional impacts. Section 5 discusses the results, and Sect. 6 summarizes the paper.
2.1 Study domain and configuration of WRF
Two 15-year numerical experiments were conducted using version 3.6.1 of the WRF with a domain size of 639×699 grid points, a horizontal resolution of 4 km, and 37 vertical eta levels with the model top at 50 hPa. The model domain covers parts of western Canada (red frame in Fig. 1) from 46 to 74∘ N latitude and 83–150∘ W longitude. We used the new Thompson microphysics scheme (Thompson et al., 2008) and the Yonsei University (YSU, South Korea) scheme for the planetary boundary layer (Hong et al., 2006). For short-wave and long-wave radiations, the Community Atmosphere Model (CAM) schemes from the CAM3 climate model were used (Collins et al., 2004). The land surface model (LSM) component is the Noah land surface model (Chen and Dudhia, 2001). With a 4 km horizontal resolution, the model explicitly resolves deep convection, and the deep cumulus parameterization was turned off. No sub-grid cloud cover or shallow cumulus parameterizations were used, and spectral nudging was not applied. A more detailed description of the model setup can be found in Li et al. (2019).
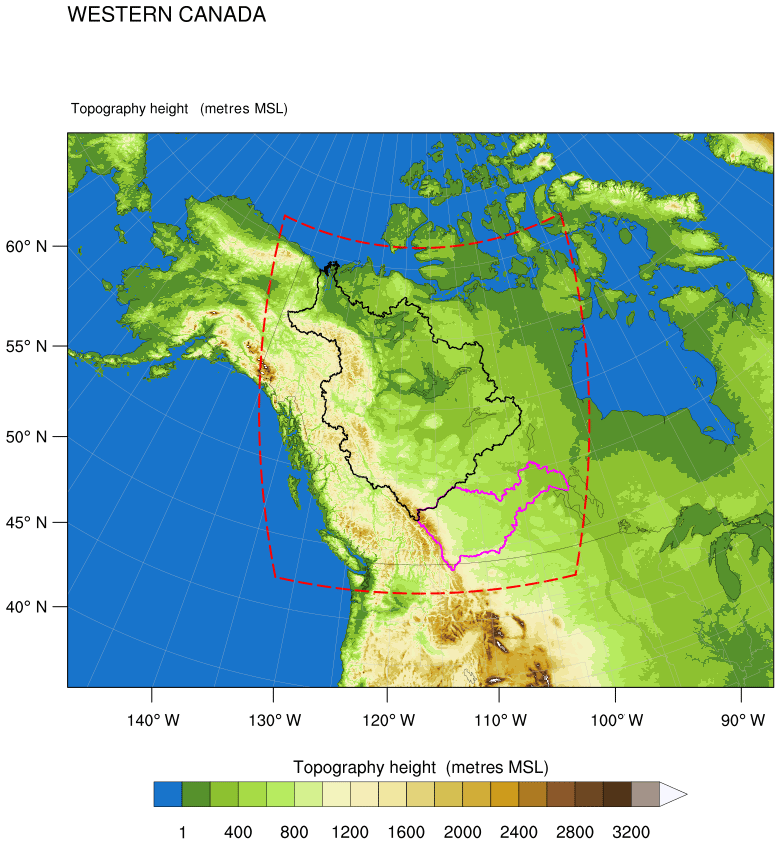
Figure 1WRF simulation domain (2560 km × 2800 km) at 4 km grid spacing showing topographic height in metres above mean sea level (m a.m.s.l.). The simulation domain is indicated by a red frame. The bold pink and black polygons represent the Mackenzie River basin (MRB) and the Saskatchewan River basin (SRB), respectively.
2.2 Numerical experiments
Two 15-year experiments were conducted with historical and projected climate settings. The first experiment was a retrospective/control simulation intending to reproduce the statistics (variability and mean state) of the current climate within the domain. The current climate simulation extends from 1 October 2000 to 30 September 2015. This simulation was forced with 6 h reanalysis by the interim version of the next European Centre for Medium-Range Weather Forecasts reanalysis interim dataset (ERA-Interim; Dee et al., 2011). Instead of using multiple reanalysis datasets, we only chose the best reanalysis data during the design phase of the project to force the WRF model due to the high computing cost of high-resolution climate modelling at 4km. This retrospective simulation representing current climate is denoted as WRF–CTL.
The pseudo-global-warming simulation, denoted as WRF–PGW, is forced by the RCP8.5 scenario by the end of 21st century. We used a Coupled Model Intercomparison Project Phase 5 (CMIP5) ensemble mean to deduce the climate change signal due to GHG forcing and conducted the simulation using a pseudo-global-warming approach. Deser et al. (2012) argued that internal variability in individual simulations might cause large decadal differences even without the GHG-forced climate change. Besides, individual simulations cannot measure the range of climate sensitivity among GCMs. Therefore, an ensemble mean of 19 CMIP5 models was calculated to reduce the impact of internal variability, model errors, and uncertainties in investigating the climate response to the GHG forcing under RCP8.5. These models were chosen based on their performances in simulating the late-21st century climate over North America. The perturbation was added to the initial fields in the sensitivity simulation following the PGW approach used in the work of Rasmussen et al. (2014, 2011). This 15-year (October 2000–September 2015) PGW simulation was forced with 6 h ERA-Interim plus the climate perturbation as follows:
where ΔCMIP5RCP8.5 is the change in 95-year CMIP5 ensemble mean under the RCP8.5 emissions scenario for all essential variables as follows:
The perturbed fields include all essential variables such as horizontal winds, geopotential height, temperature, specific humidity, sea surface temperature, soil temperature, sea level pressure, and sea ice.
The evaluation of the WRF–CTL simulation was conducted by Li et al. (2019). The WRF–CTL simulation did a decent job with temperature and precipitation distribution compared to station data and gridded observation analysis.
2.3 Reanalysis data
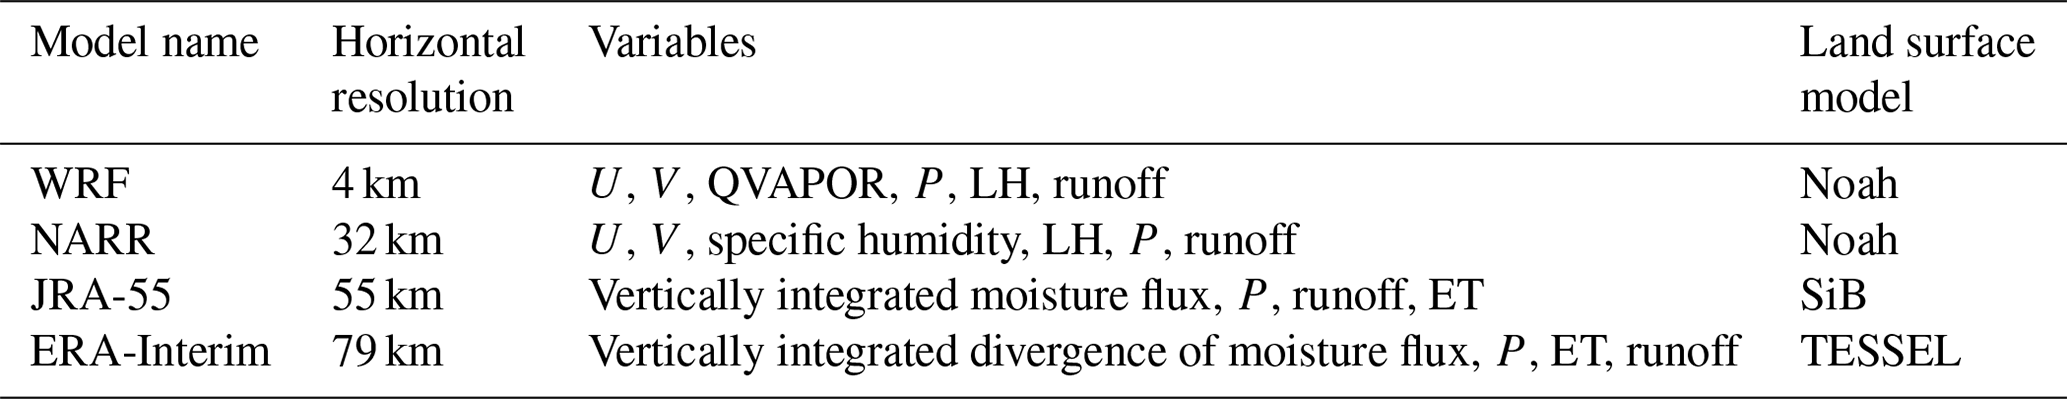
In this study, three different atmospheric reanalyses are used, namely the North American Regional Reanalysis (NARR), ERA-Interim, and Japanese 55-year Reanalysis (JRA-55; Kobayashi et al., 2015) as shown in Table 1.
Table 1Reanalysis products used in the comparison with WRF–CTL. P is precipitation, LH is latent heat, ET is evaporation, and QVAPOR is the vapour mixing ratio.
2.3.1 NARR
The NARR dataset from the National Centers for Environmental Prediction (NCEP) is used for diagnostic computation. Unlike other reanalyses in which precipitation is not assimilated, this reanalysis product assimilates high-quality and detailed precipitation observations as latent heating profiles (Mesinger et al., 2006). Though the methodology NARR employed to assimilate observations may introduce spurious grid-scale precipitation (West et al., 2007), it is not a concern for our application as it concerns mainly the monthly mean precipitation amount. The sparse availability of precipitation in the north also limits the quality of NARR's precipitation over Canada compared to the US (Mesinger et al., 2006). The Noah land surface model included in NARR allows for more realistic land–atmosphere interactions than simpler land surface schemes. The NARR data are available from October 1978 to November 2018 at relatively high spatial (32 km horizontal) and temporal (3 h time interval) resolutions.
2.3.2 JRA-55
JRA-55 is the latest long-term reanalysis dataset produced by the Japan Meteorological Agency (JMA) operational data assimilation system (Ebita et al., 2011). This dataset features significant improvements over its predecessor as it provides a 25-year reanalysis with higher resolution, improved model physics, and an advanced data assimilation system with variational bias correction for satellite radiances (Ebita et al., 2011). JRA-55 is configured with horizontal spacing TL319 (about 55 km) and a hybrid sigma pressure coordinate scheme using 60 levels up to 0.1 hPa and provides vertically integrated meridional and zonal moisture flux components. The land surface model of JRA-55 is the simple biosphere model (SiB; Sellers et al., 1986, 1996).
2.3.3 ERA-Interim
ERA-Interim is produced by the European Center for Medium-Range Weather Forecasts (ECMWF) with an improved atmospheric model and assimilation system that replaces those used in ECMWF reanalysis (ERA-40; Dee et al., 2011). Additionally, the ERA-Interim dataset provides the vertically integrated divergence of moisture flux as data output, which can help us diagnostically evaluate the results of the WRF model. This dataset is based on an atmospheric model and reanalysis system with 60 levels in the vertical with a top level at 0.1 hPa and horizontal grid spacing with a T255 spherical harmonic representation (Dee et al., 2011). The land surface model of ERA-Interim is the Tiled ECMWF Scheme for Surface Exchanges over Land (TESSEL; Dee et al., 2011; Viterbo and Beljaars, 1995; Viterbo et al., 1999).
2.4 Surface water budget
Water balance is an important constraint for understanding water availability and partitioning in model simulations and observations. The land surface components of the water budget include precipitation (P), evapotranspiration (ET), runoff, and storage (snow water equivalent, soil moisture, canopy water, etc.). In the assessment of WRF simulation and reanalyses, there is no accounting for runoff transport between model grid points and horizontal movement of water. Thus, total runoff from WRF simulations represents the flux of water that is not taken up by or stored as soil moisture as in the study by Rasmussen et al. (2014). The surface water budget equation over the study regions can be written as follows:
where is the change in the storage of water (S) in and above the ground over time, P is precipitation, ET is evapotranspiration, Q is runoff, and RESW is the residual. Equation (3) describes the partitioning of P into ET, runoff, and storage in land. The residual forcing is combined with the tendency term (i.e., ) in assessing the water balance closure. In this study, we estimated an annual budget of the surface water budget for MRB and SRB. The performance of the high-resolution WRF model was assessed by comparing the surface water budget with available reanalysis data products.
2.5 Atmospheric moisture budget
The atmospheric moisture budget provides an additional method for the evaluation of P−ET in the RCM simulation. The spatially averaged water budget of the atmosphere relates to the surface water budget in the following way:
Here, ET is the evapotranspiration, P is the precipitation, ∇⋅ is the horizontal divergence operator, W is the total columnar liquid content per unit area, and MF is the vertically integrated moisture flux (kg m−1 s−1) given by the following:
where q is the specific humidity in kg kg−1, g is the gravitational acceleration constant of 9.8 m s−2, dp is the change in pressure from land surface to the top of the atmospheric model (50 hPa), and V is the horizontal wind vector given by the following:
where u and v are wind components along the eastern and northern directions, respectively. The horizontal divergence of the vertically integrated moisture flux ∇⋅MF is the main variable of interest in this study. A negative value of moisture divergence corresponds to moisture convergence.
3.1 Surface water budget
Figure 2 shows that both the peak and annual runoffs in MRB in the WRF model are comparable to those in JRA-55 and much larger than the other reanalyses, which is partly related to their estimations in winter precipitation and storage terms, such as snow cover and soil moisture, that are larger (Li et al., 2019). Another factor is how the WRF model's Noah land surface model (LSM) models the frozen soil permeability. The Noah LSM treats the frozen soil permeability as seen in Koren et al. (1999), which is shown to underestimate the infiltration of water through frozen soil and generate excessive surface runoff in spring over the Arctic river basins because the model's frozen soil permeability is too small (Niu and Yang, 2006). In cold regions, melting of snow accumulated over the winter generates high flows with orders of magnitude greater than the winter discharge (Woo, 2008). Runoff and the change in storage dominate in spring and peak in May in the WRF simulation and JRA-55 and reaches the maximum in summer in NARR. The spring peak runoffs in WRF and JRA-55 are about 3 mm d−1, which is 3 times as large as the observation (Yang et al., 2015). The winter runoff in WRF and NARR is close to 0, whereas the observation shows a 0.2 mm d−1 runoff in winter (Yang et al., 2015). Runoff is much smaller in NARR and ERA-Interim and significantly less than the observation (Yang et al., 2015) in spring, summer, and autumn due to their unrealistically small storage terms.
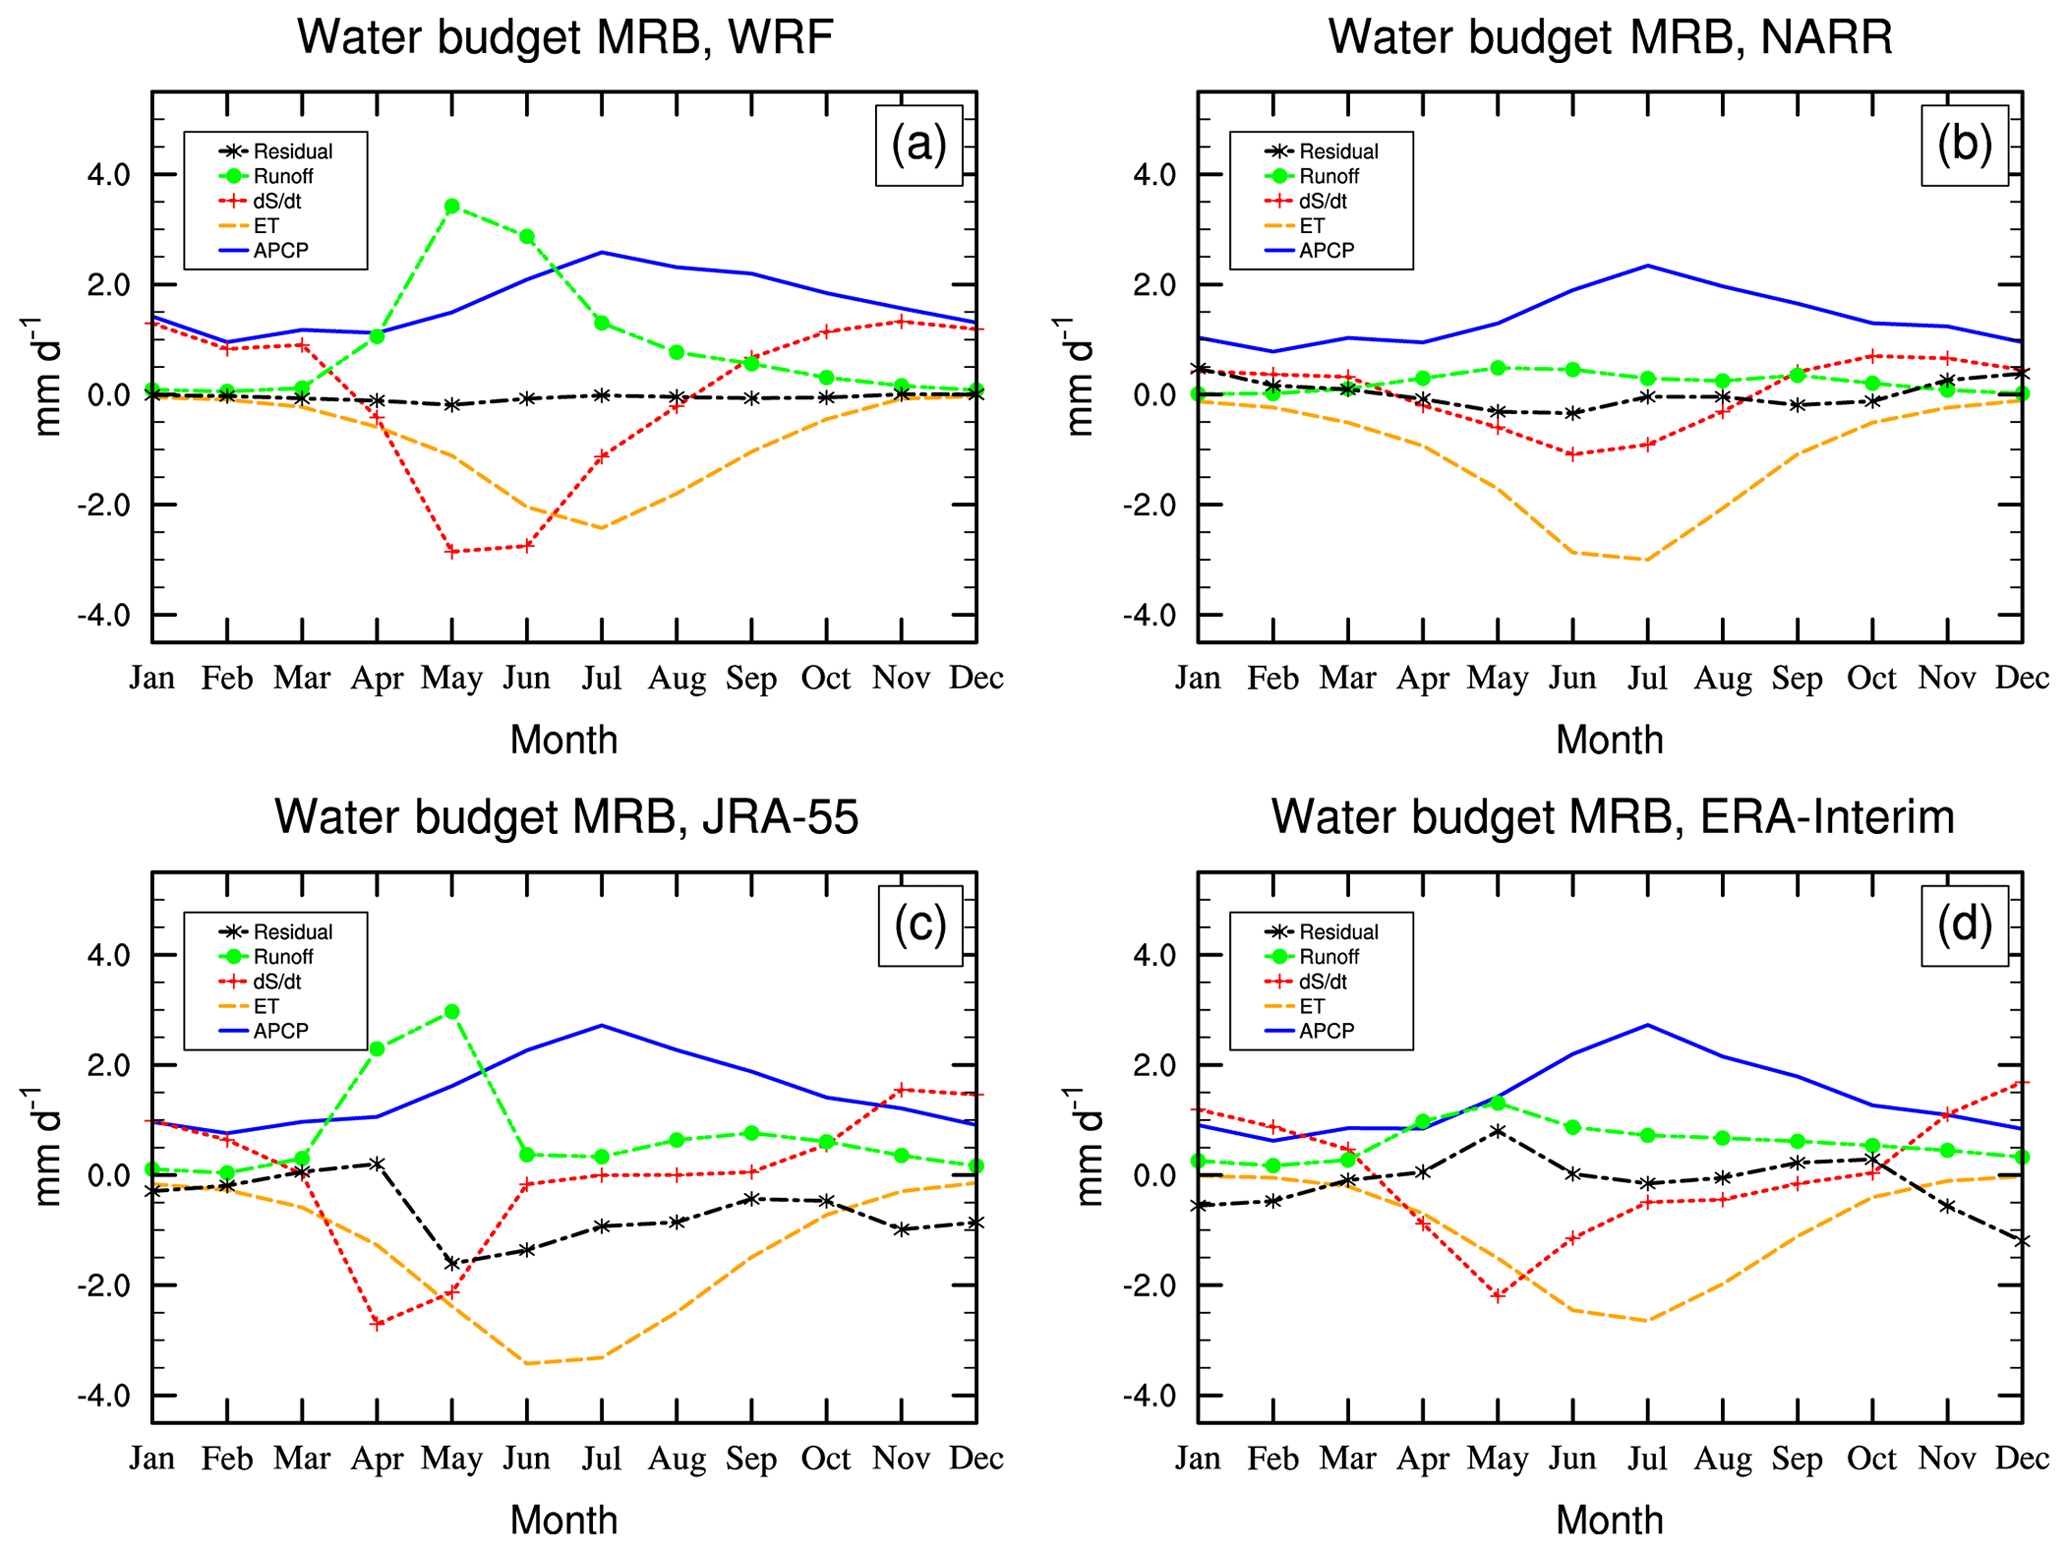
Figure 2The surface water budget (mm d−1) in MRB from WRF–CTL and the reanalysis datasets (NARR, ERA-Interim, and JRA-55). ET denotes evapotranspiration. APCP denotes accumulated precipitation per time interval.
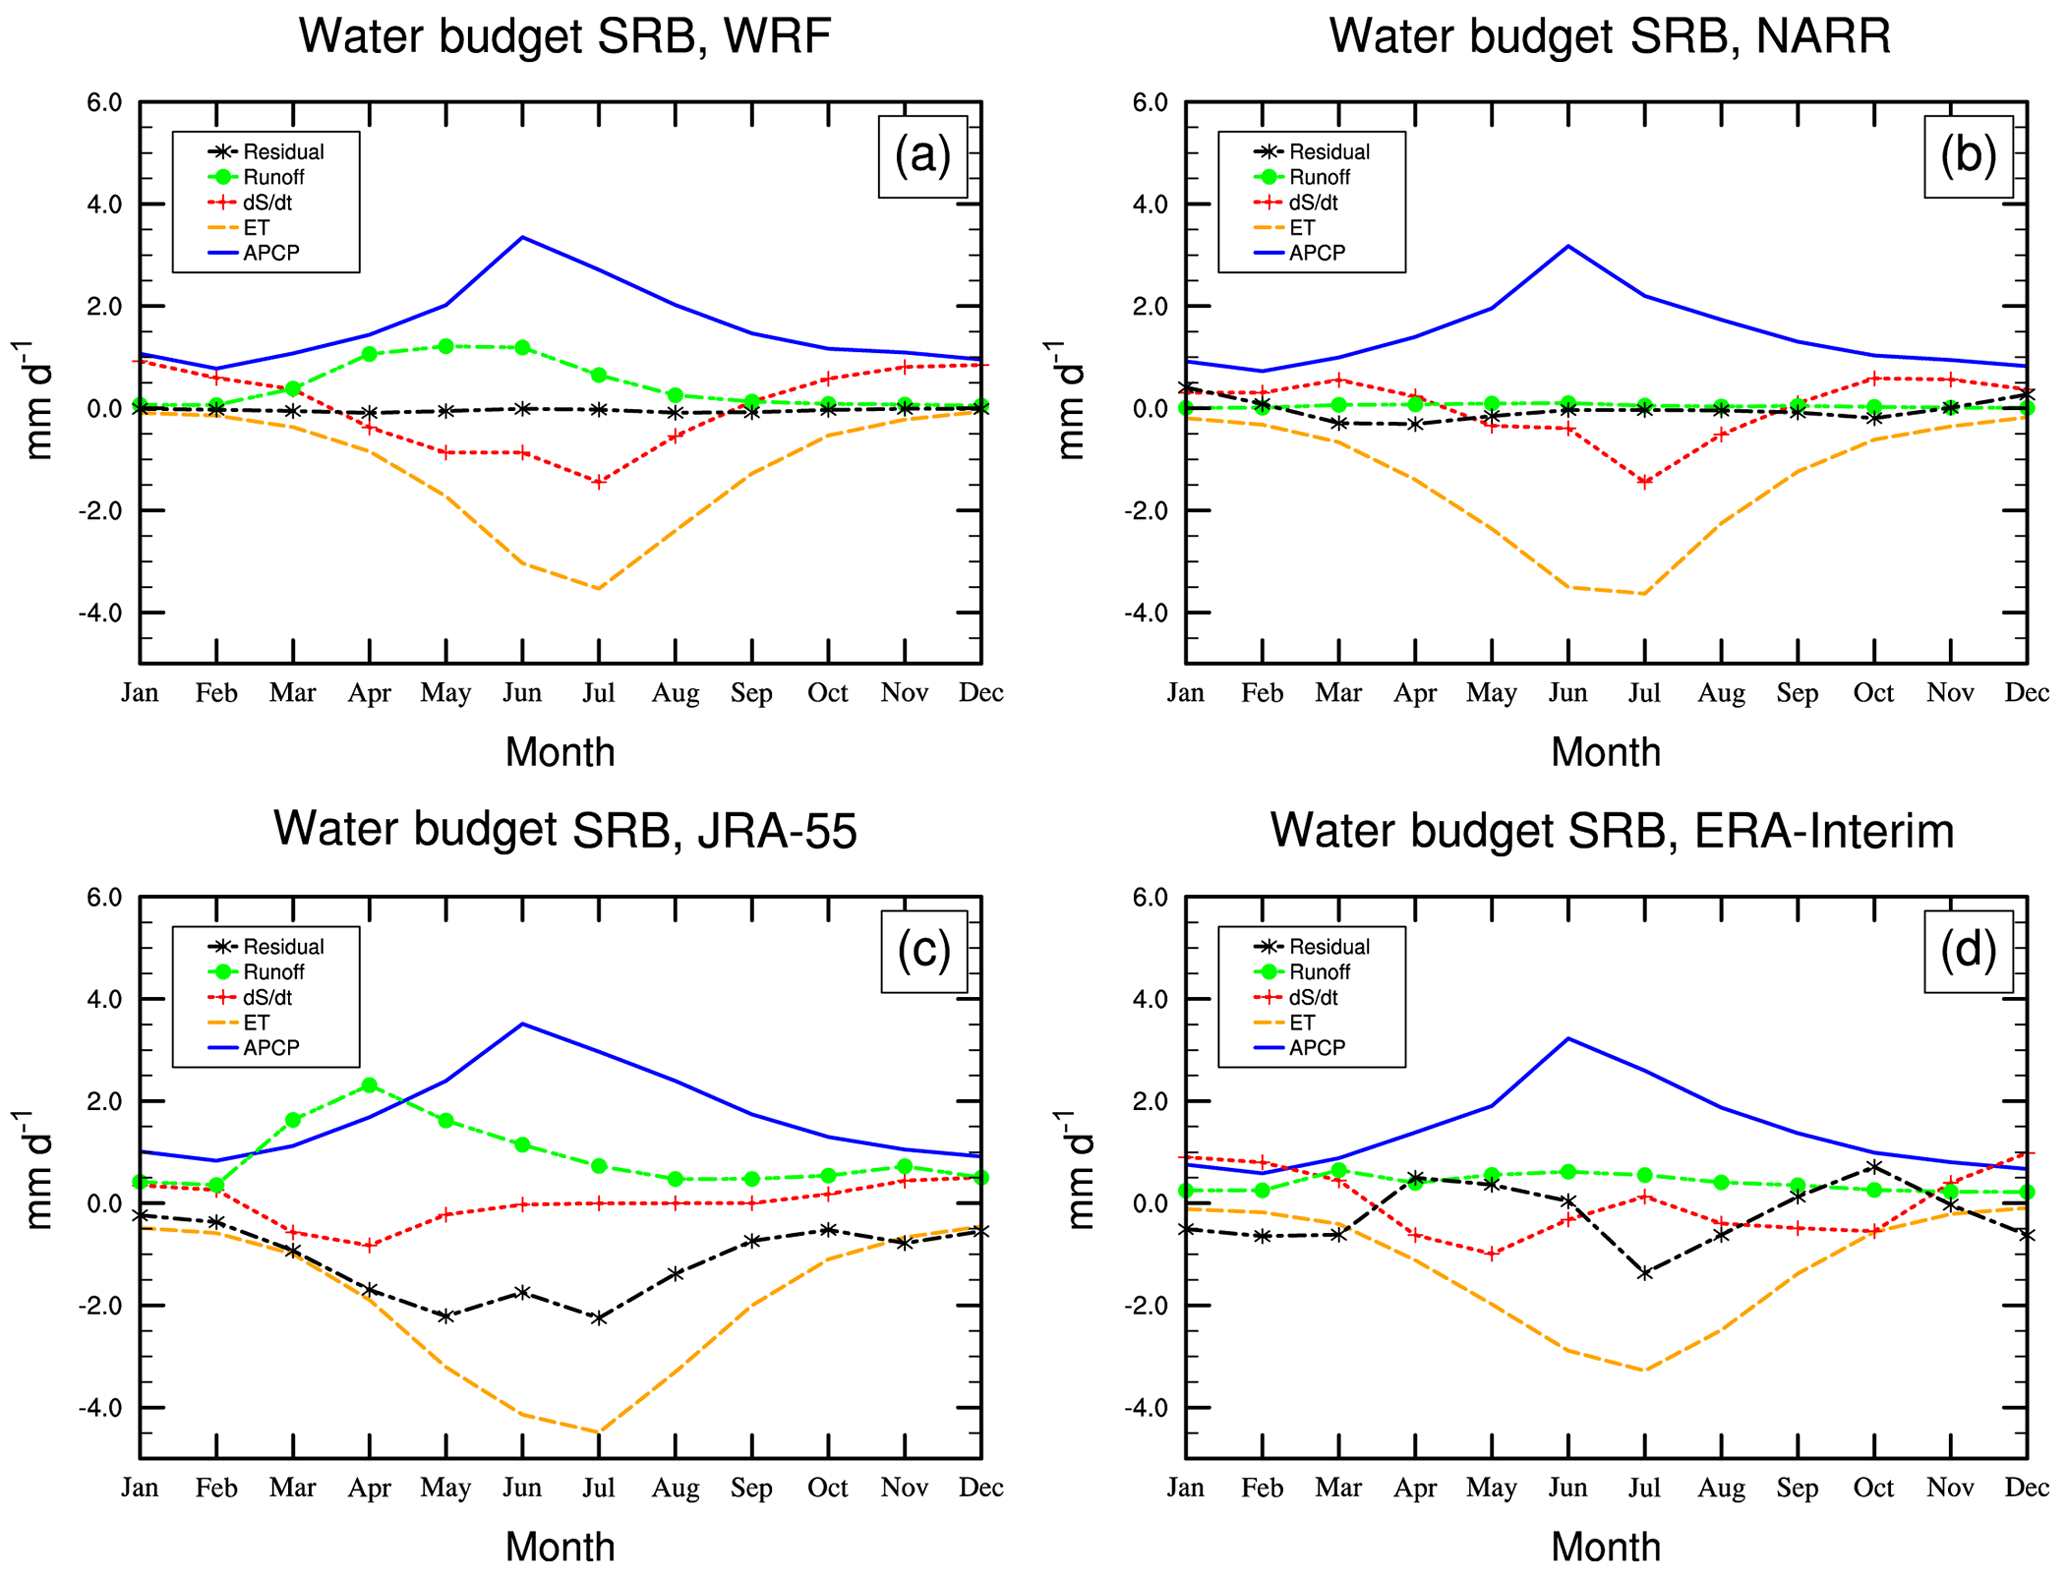
Figure 3The surface water budget (mm d−1) in SRB from WRF–CTL and the reanalysis datasets (NARR, ERA-Interim, and JRA-55). ET denotes evapotranspiration. APCP denotes accumulated precipitation per time interval.
Figure 3 shows that both the WRF simulation and the NARR reanalysis show a better balance between P, ET, the change in storage, and runoff in SRB, with the lowest residual term for all months. Both JRA-55 and WRF present a peak runoff in April, whereas ERA-Interim shows that runoff is negligible compared to other terms throughout the year. The residual term in JRA-55 is large for the whole year, indicating poor representation of the surface water budget in SRB. The residual term in ERA-Interim switches from positive to negative from May to September, again showing large uncertainties in ERA-Interim in the associated hydro-climatic variables in SRB. Compared to MRB, the seasonal cycle of ET in SRB in the WRF simulation is more consistent with those in the reanalyses as the maximum ET occurs in July for all datasets.
The WRF–CTL simulation captures the peak runoff in spring for SRB (in April) and MRB (in May) as shown in Figs. 3 and 2. Although solar insolation enhances in spring, the prevalence of frozen ground effectively reduces meltwater infiltration (Pomeroy et al., 2007); the Noah LSM in WRF especially tends to overestimate the impermeability of frozen ground. Much of the snowmelt stays on the ground and gives rise to surface saturation and generates substantial runoff, which is especially true for the Noah LSM that underestimates the permeability of the frozen soil in the cold regions (Niu and Yang, 2006). Additionally, the storage terms (consisting of soil moisture and snow water equivalent, hereafter SWE) vary among reanalyses and WRF because of the different soil layer depths among the model and the reanalyses. Finally, differences may occur because the depth-to-bedrock information used by different reanalysis products may vary. For ERA-Interim, the simple assumption of no bedrock everywhere has been adopted (Balsamo et al., 2009).
For all the datasets, the predominant terms are P and ET during the warm seasons. P and ET's annual cycles are also more consistent across the datasets, unlike storage, runoff, and residual terms. The residual terms are much smaller in the WRF simulation and NARR, indicating that the components of the budget equation such as P, ET, the change in storage, and runoff are more balanced in the WRF model and NARR. This indicates large uncertainties in the hydro-climatic variables assimilated by ERA-Interim and JRA-55, as the residual terms are essentially the unbalanced term introduced to the model through assimilation of observation. In winter, P is balanced by the increase in storage as snow and ice; in spring, the change in storage is balanced by the increased runoff and generally P−ET; in summer, P−ET is close to 0, with the change in storage equalling runoff; in autumn, ET decreases more than P does, resulting in the enhanced storage term. Runoff is extremely low in the WRF simulation and the reanalyses since winter snowfall provide little melting over most parts of the basins.
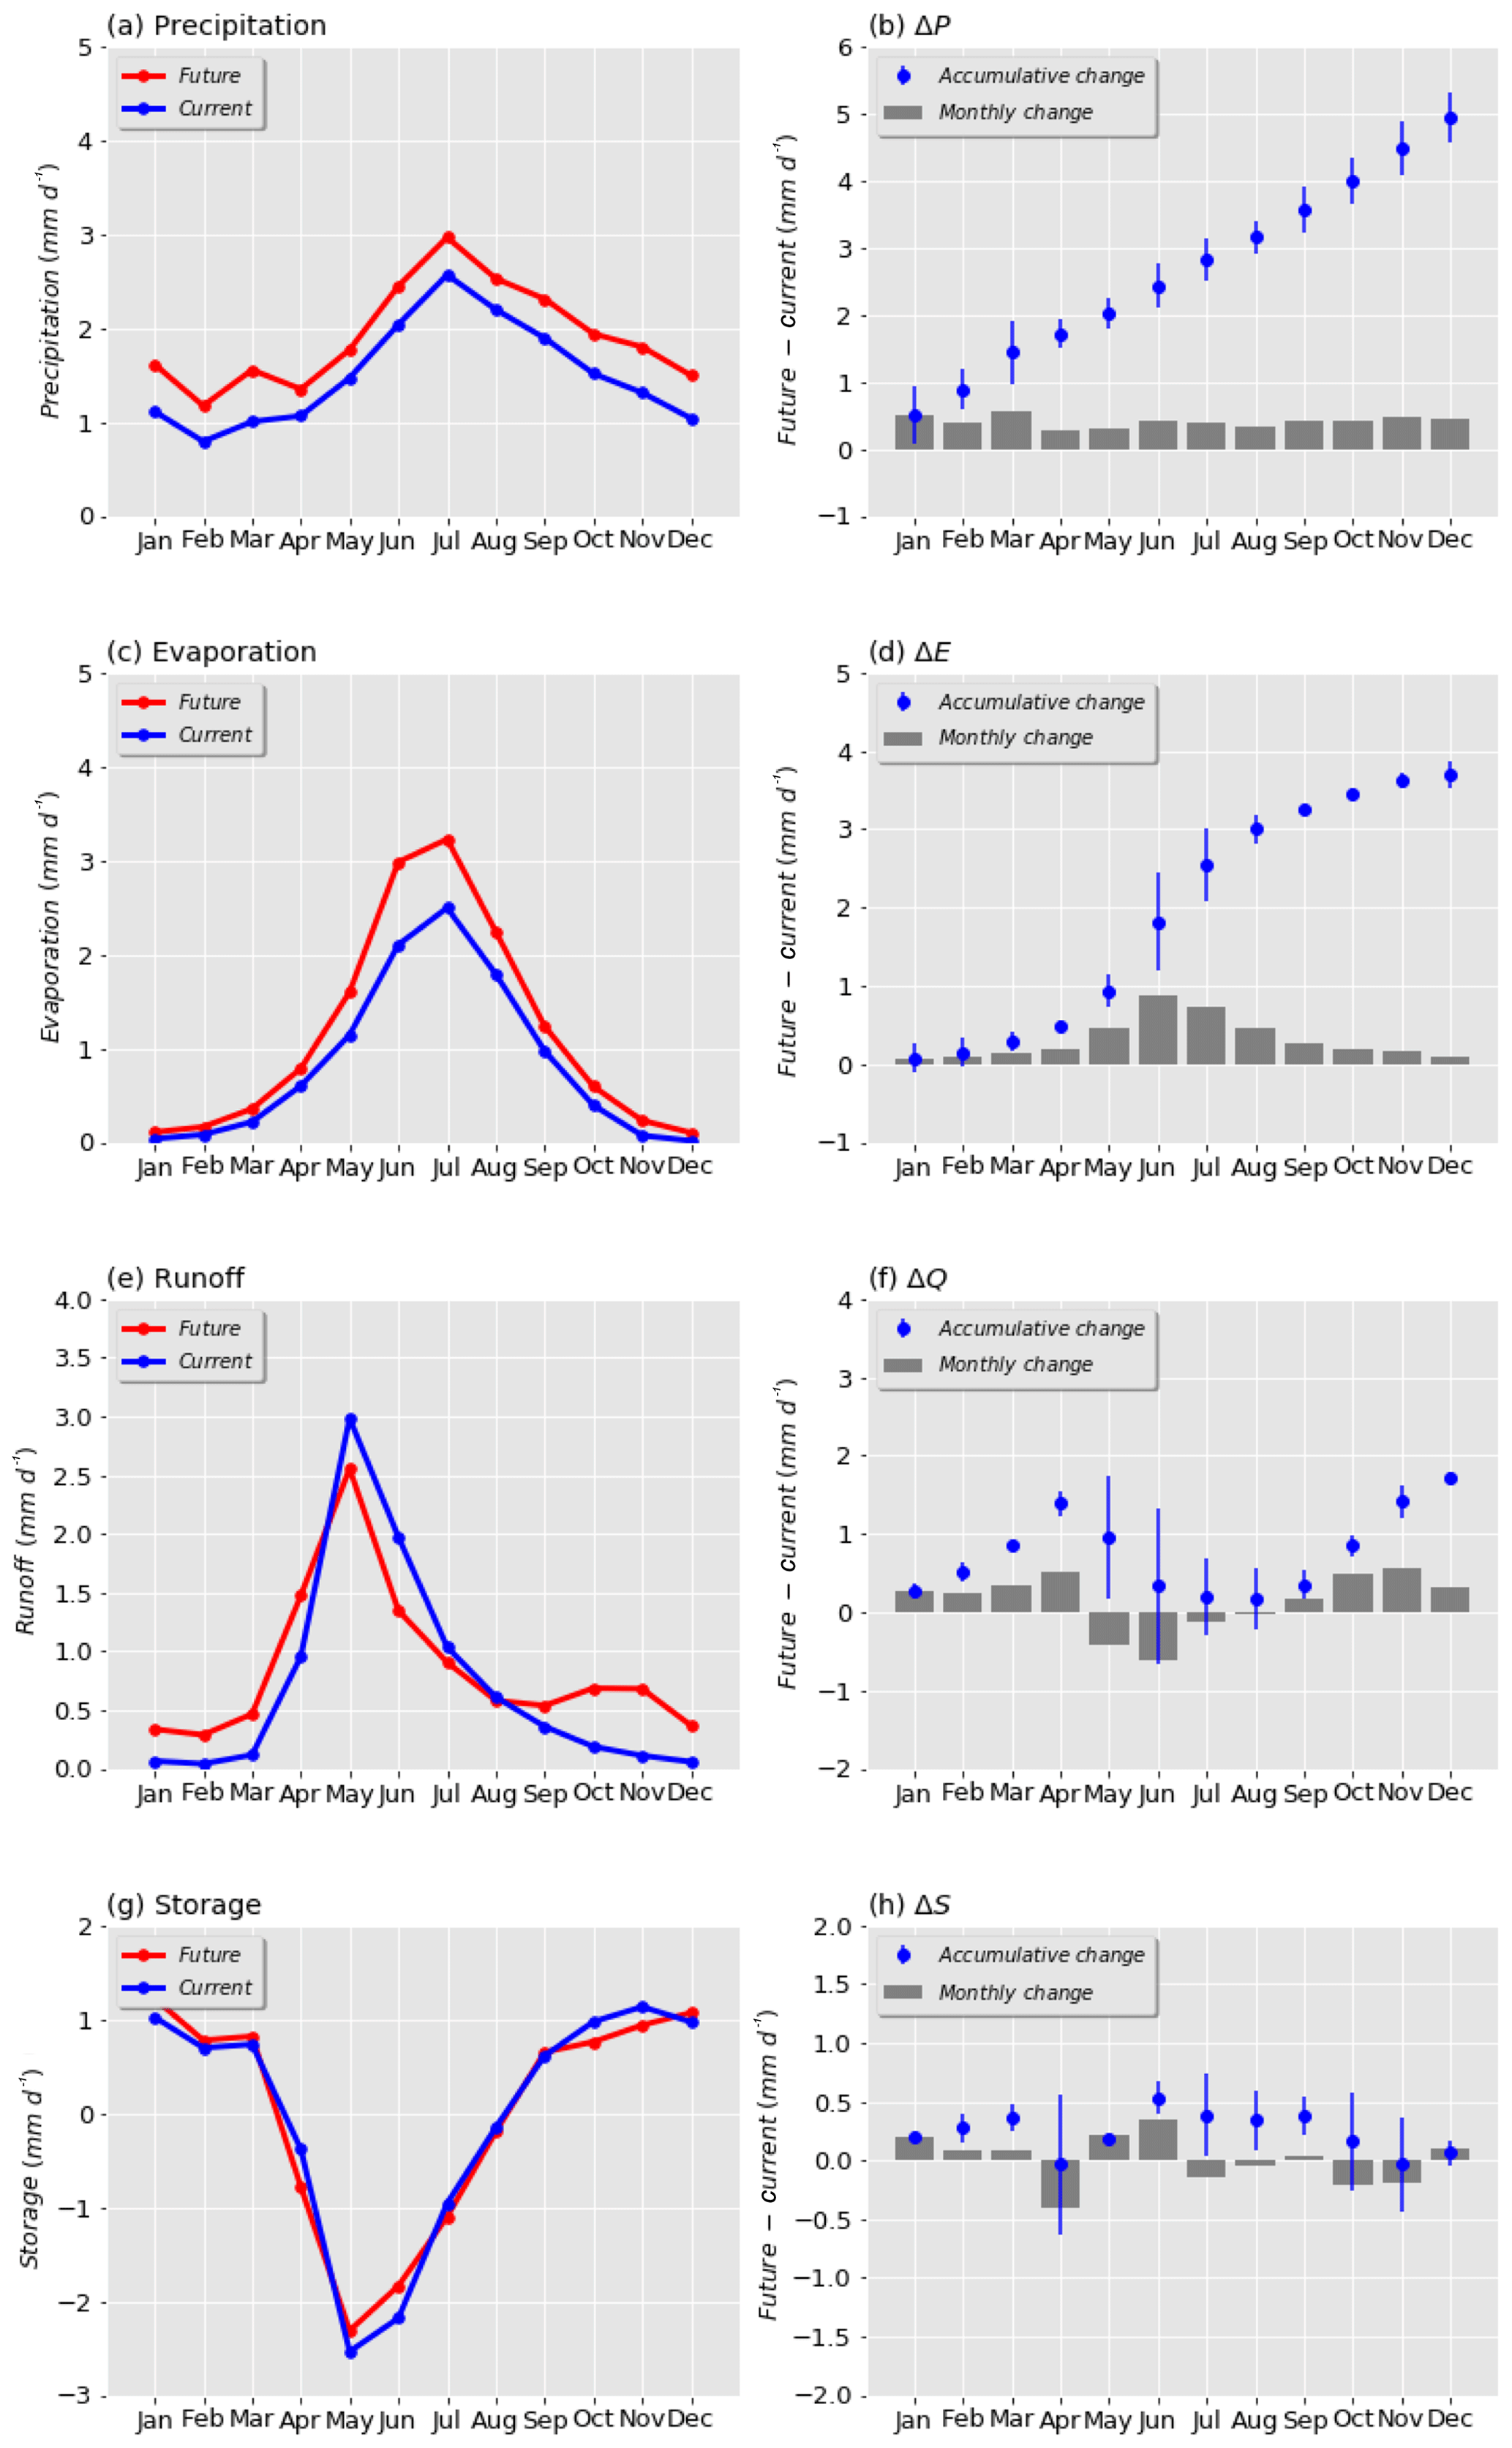
Figure 4The surface water budget (mm d−1) in MRB for the WRF–CTL and the WRF–PGW simulations: (a) P, (b) changes in P, and its accumulated changes in P; (c) ET, (d) changes in ET, and its accumulated changes in ET; (e) runoff, (f) changes in runoff, and its accumulated changes in runoff; and (g) storage, (h) changes in storage, and its accumulated change.
The changes in each component of the water balance equation in WRF–PGW relative to WRF–CTL are shown in Figs. 4 and 5. Compared to WRF–CTL, the amplitudes of the annual cycle of P and ET in both basins are larger in WRF–PGW because of the increases in P and ET in summer, signalling an enhanced water cycle. Both MRB and SRB show a decrease in peak runoff. Runoff in MRB decreases in warm seasons and increases in cold seasons. Runoff in SRB shows a large reduction in April and May and a small increase in November and winter. These changes are due to the fact that in a warmer climate ET increases more than P in summer, which causes less water storage to be converted to runoff during spring and summer. The peak runoff for SRB also shifts from April in WRF–CTL to June in WRF–PGW. The increase in winter P in MRB exceeds the increase in storage in WRF–PGW, which causes a small increase in winter runoff and a decrease in summer runoff in MRB. The storage change term in SRB shows a significant decrease in summer due to the deficit in P−ET in the future, which also results in a decrease in runoff.

3.2 Divergence of vertically integrated moisture flux
Unlike the surface water budget, which considers the water added to and extracted from the land surface, the general balance equation for atmospheric water vapour considers the water vapour budget for the whole atmospheric column. The general balance equation for atmosphere considers the extraction by P and addition by ET from the underlying surface and convergence or divergence of water vapour through atmospheric transport.
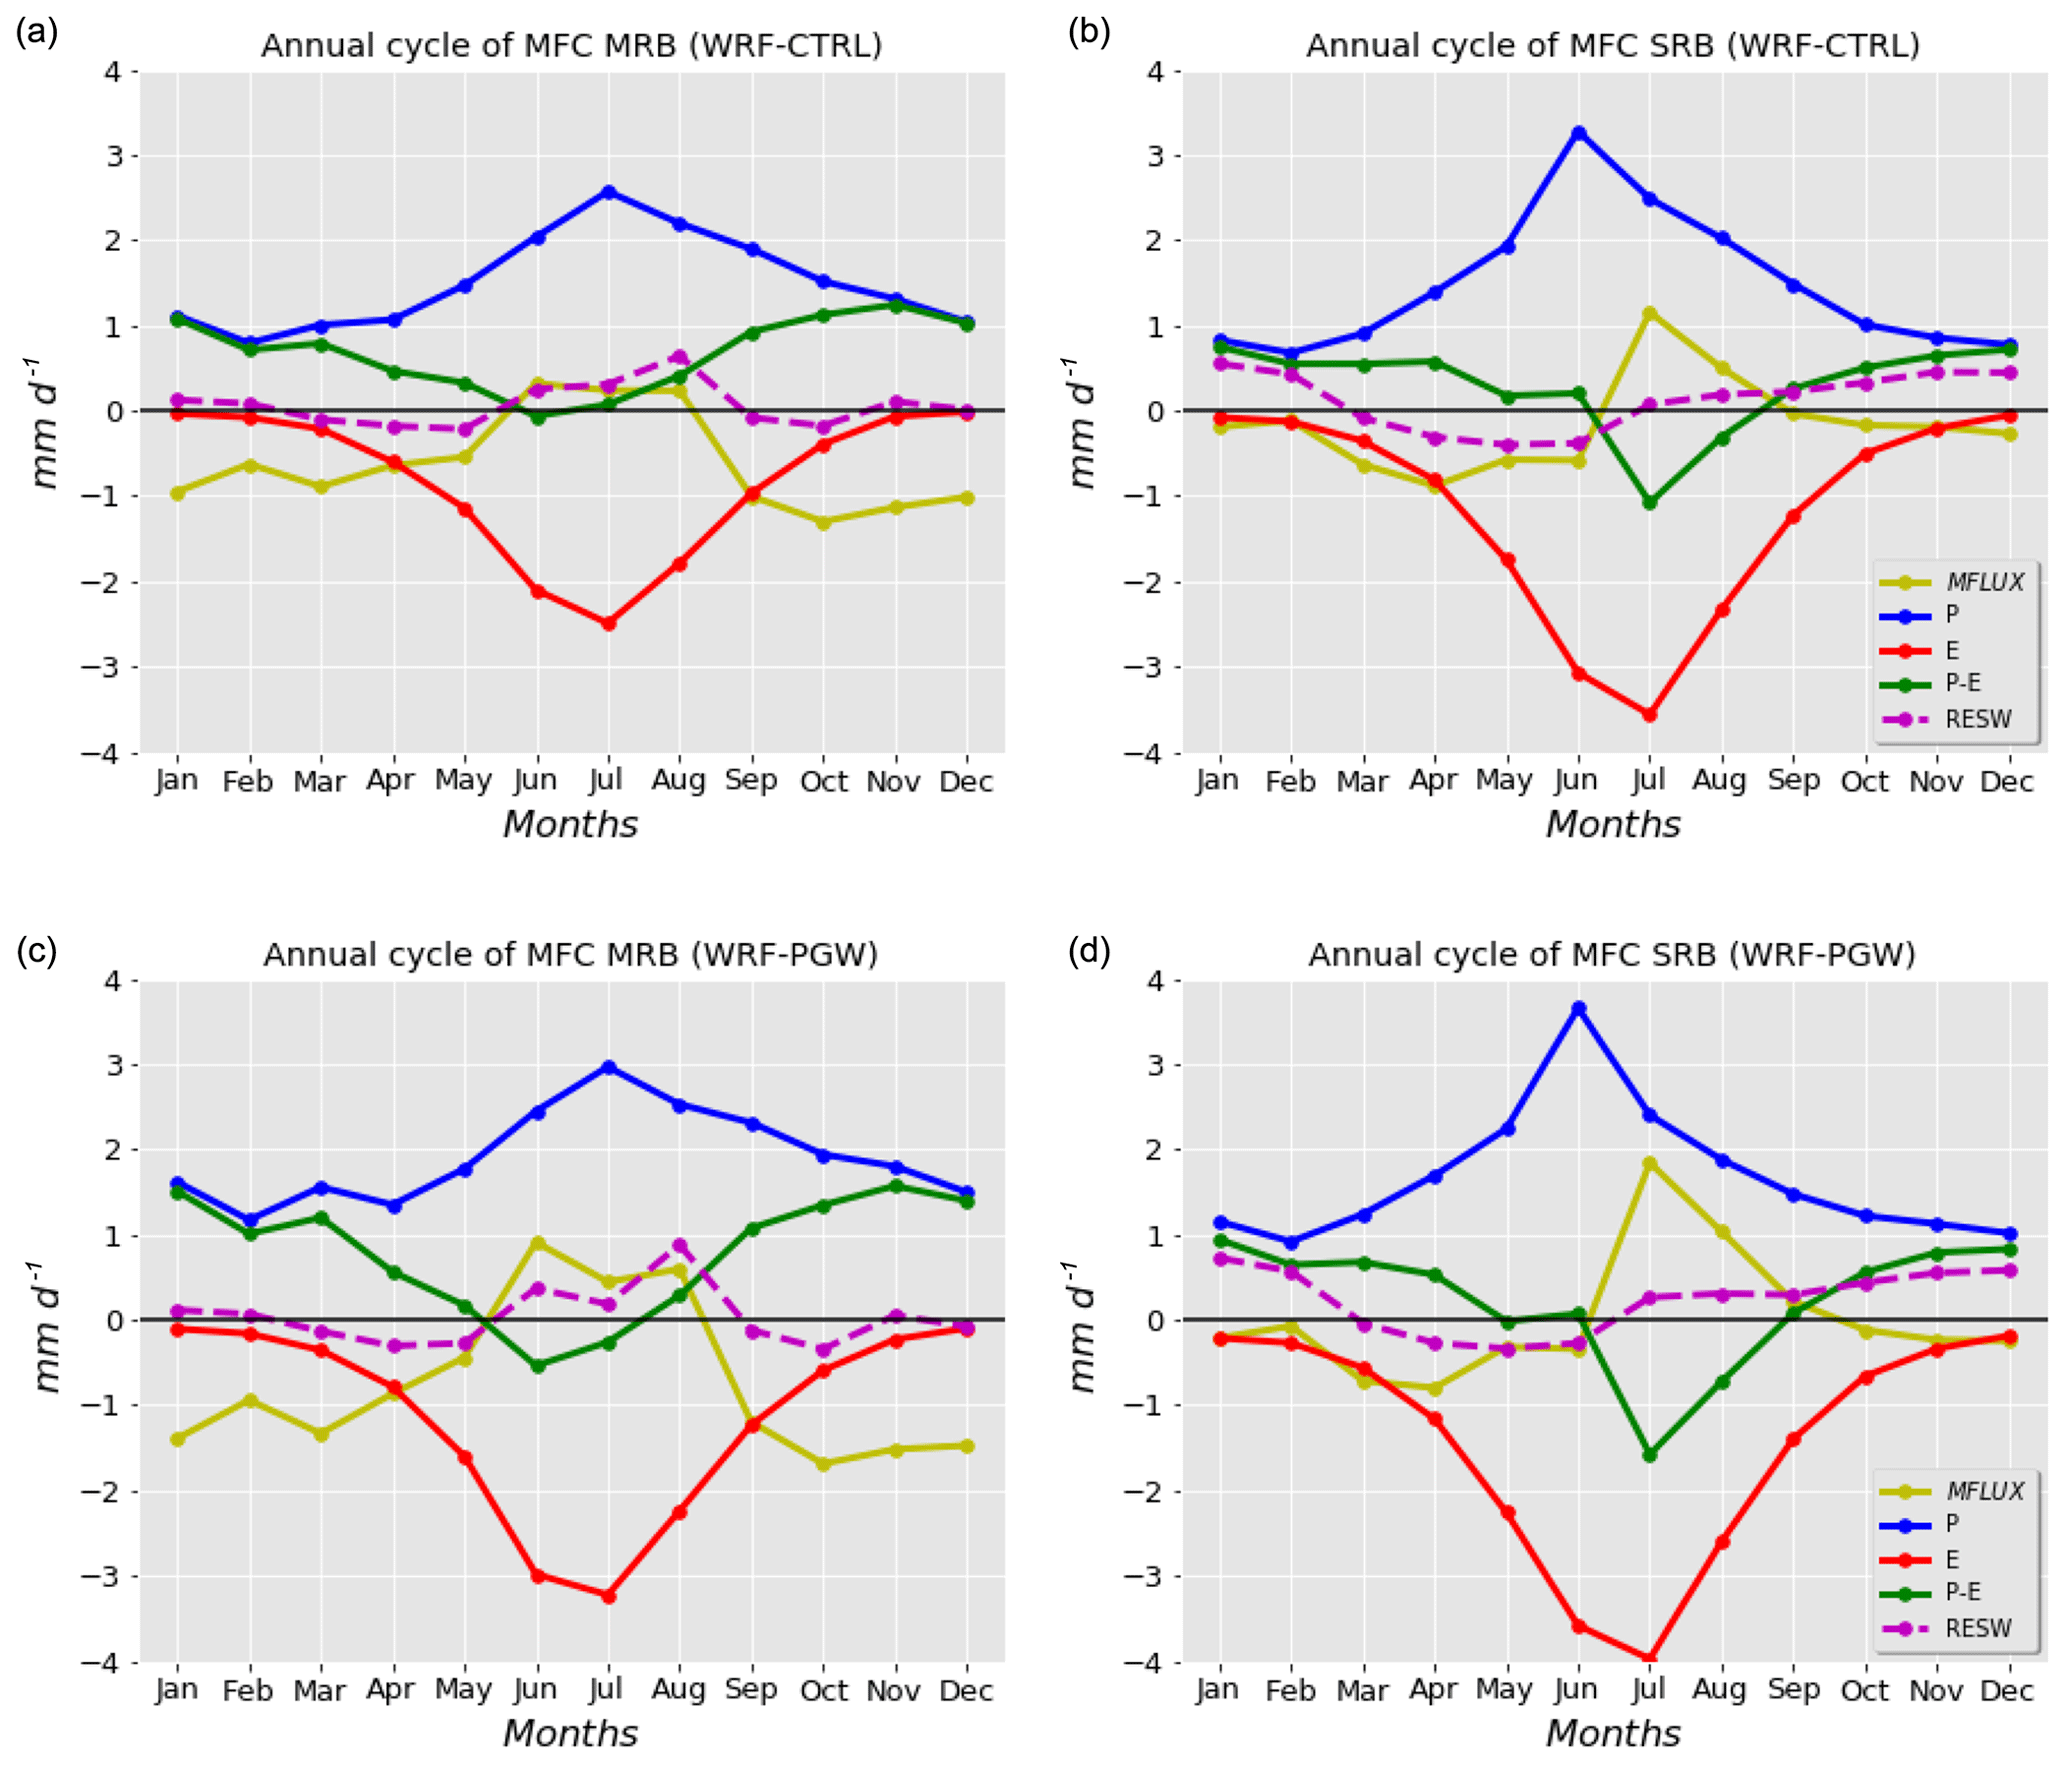
Figure 6Atmospheric water vapour budget (mm d−1) in WRF–CTL (a, b) and WRF–PGW (c, d) in MRB (a, c) and SRB (b, d). MFLUX denotes the vertically integrated moisture flux convergence (MFC).
Figure 6 shows the seasonal cycle of the components of surface moisture flux over the two river basins in the WRF simulations. Over winter, spring, and autumn, the vapour convergence is much larger in MRB (−0.6–1.2 mm d−1; peaks in October) than in SRB (−0.1–0.9 mm d−1; peaks in April). MRB shows a more balanced P and ET during summer, with a small moisture divergence (0.2–0.4 mm d−1) during summer. SRB has a vapour convergence in June (−0.6 mm d−1) and large divergence in July (1.1 mm d−1) and a smaller divergence (0.5 mm d−1) in July and August. Due to the large deficit of P−ET and positive moisture divergence, more moisture is transported out of the two basins. The residual term in the transitional months reflects the change in the water-vapour-holding capacity as follows: fast-warming months correspond to the increases in water vapour in the atmosphere and the positive residual (adding vapour to the air, which is opposite to P). Cooling months correspond to the decreases in water vapour in the atmosphere and the negative residual. The timing of the peak residual terms for MRB in warm seasons is earlier than SRB as MRB starts to cool earlier (in August) than SRB.
The atmospheric water vapour budget in WRF–PGW is also shown in Fig. 6. The seasonal cycles of each component are similar in both WRF–PGW and WRF–CTL. Over winter, spring, and autumn, the vapour convergence is much larger in MRB (−1–1.5 mm d−1) than in SRB (−0.1–0.8 mm d−1). MRB shows a more balanced P and ET during summer, with a small moisture divergence (0.5–1.0 mm d−1) during summer. Compared to WRF–CTL, ET in both SRB and MRB increases significantly in summer, especially in July. During summer, both MRB and SRB show moisture divergence in the CTL and PGW experiments as ET is larger than P for each basin. In MRB, the moisture divergence in summer increases from 0.3 mm d−1 in WRF–CTL to about 1 mm d−1 in WRF–PGW, which is consistent with the increase in the deficit of P−ET in WRF–PGW. In SRB, the July moisture divergence in WRF–CTL is about 1 mm d−1 and increases to about 2 mm d−1 in WRF–PGW, which is consistent with the large increases in ET and small changes in P.
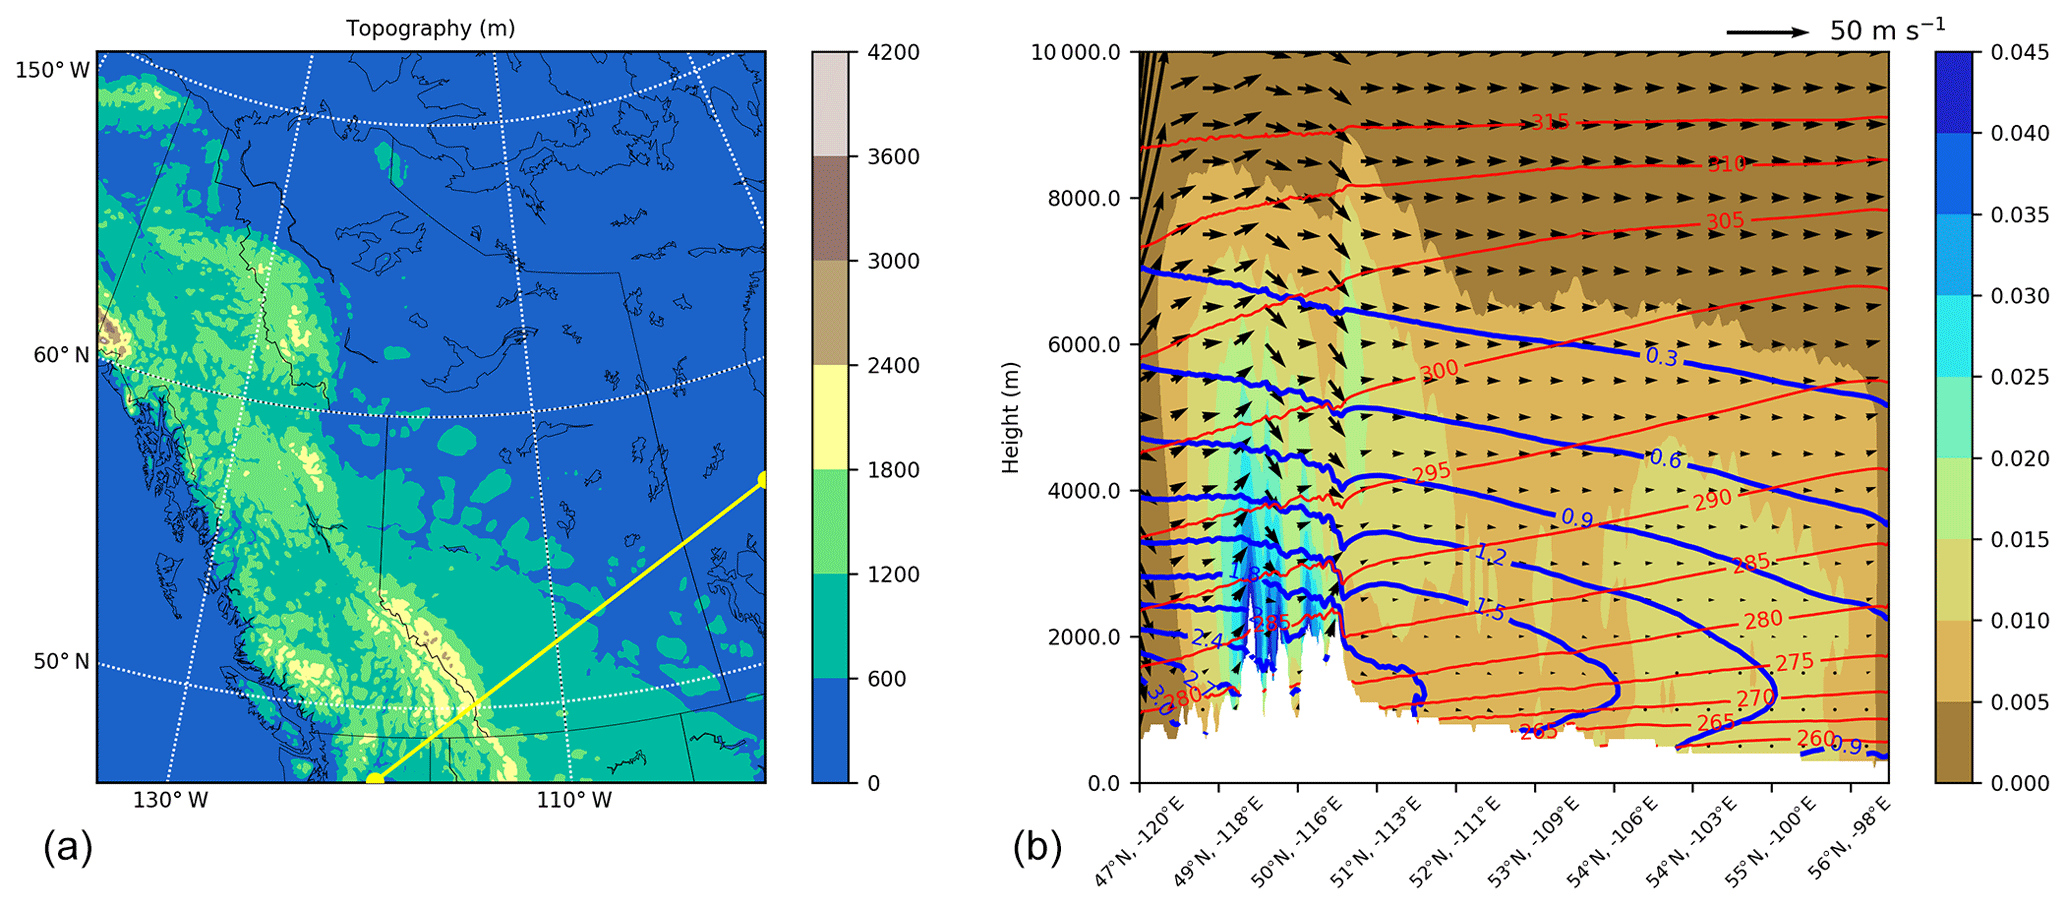
Figure 7(a) Topography in western Canada. (b) Cross section of potential temperature (K; thin red contour); water vapour mixing ratio (g kg−1; thick blue contour); the sum of snow, ice, and graupel mixing ratio (g kg−1; shading); and wind (m s−1) perpendicular to the Canadian Rockies (115∘ W, 50∘ N) in December. The vertical component of wind is scaled to 100 for illustration purposes.
Unlike MRB, where P is largely balanced by moisture convergence in winter, SRB shows a large residual term in its atmospheric water vapour balance (Fig. 6) in winter. This large residual term in water vapour budget during winter in SRB is due to the fact that a portion of water in the basin is in the form of solids that are transported over the mountain by the westerly wind. This transport in a solid form of water causes a large residual term in the atmospheric water vapour budget as it is not accounted for, as shown in Fig. 6. The cross-mountain/basin transport in condensates either becomes precipitation or melts/sublimates back into water vapour when the air descends and warms adiabatically. This mechanism is consistent with the changes in the solid form of water across the mountain barrier on the western edge of SRB and the increases in moisture in the descent flow of the lower atmosphere on the lee side, as shown in Fig. 7. The ice/snow content distribution in the atmosphere is of a relatively large quantity (0.025 g kg−1), is concentrated in the lower atmosphere on the windward side of the mountain, and is close to 0 on the lee side (not shown). The downward motion in the lower part of the troposphere over the lee side of the Canadian Rockies is demonstrated by the sharp drop in the potential temperature contour just at the western boundary of SRB, which corresponds to a significantly lower troposphere warming. Accompanying this downward motion is higher temperature and moisture near the western part of SRB. The increase in moisture content in the lower atmosphere on the lee side of the Canadian Rockies cannot be accounted for by the moisture content before the adiabatic descent, as the moisture layer is much thinner over the mountain. The added water vapour comes from the evaporation of ice particles as the air descends and warms, as shown by the decrease in ice content near the 288 K isentrope. Due to this process, the average moisture content and temperature are higher at the mid- and lower levels near the mountain than in locations further downwind. Consistent with this fact is the higher vapour mixing ratio near the Canadian Rockies because the divergence of water vapour is mainly concentrated in the lower 1 km. The upward motion in the upper troposphere overlaying over the downward flow corresponds to a region of a large ice-mixing ratio over the lee side of the mountain, which is caused by the lifting and cooling related to a mountain wave response (Cotton et al., 2010a). Because topography strongly impacts ascent/descent and condensation/evaporation, high-resolution regional climate modelling is better suited to representing the process than lower-resolution modelling and statistical downscaling.
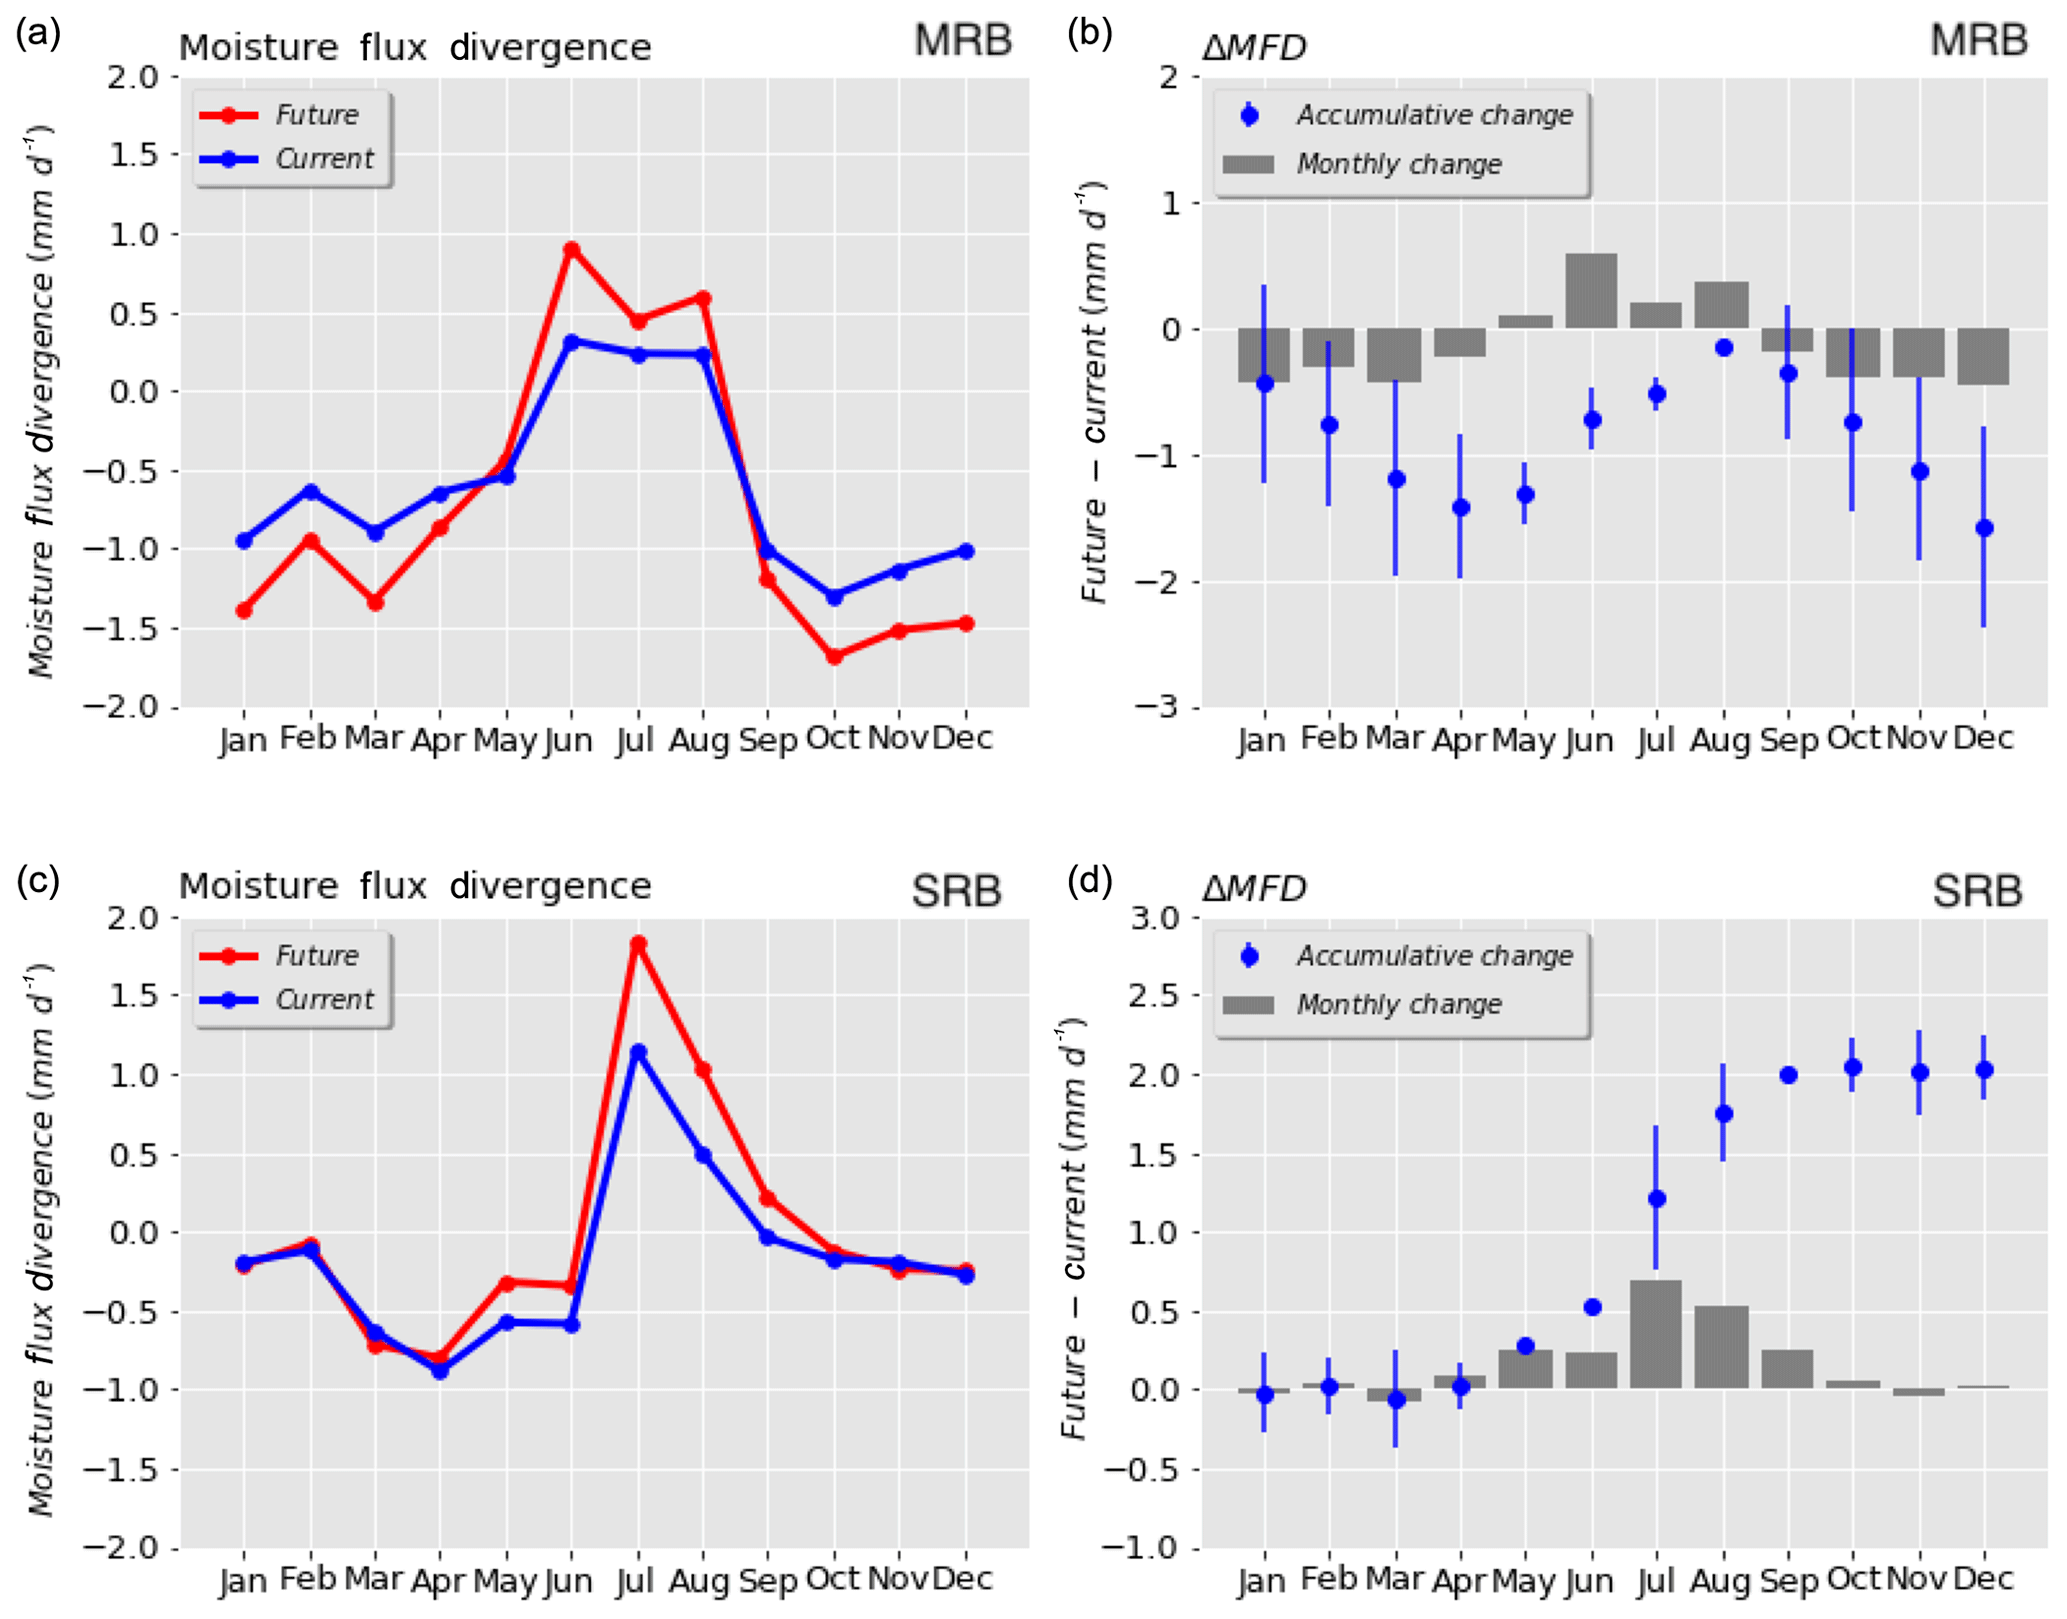
Figure 8Changes in atmospheric water vapour divergence (mm d−1) for each calendar month between WRF–PGW and WRF–CTL over MRB (a, b) and SRB (c, d).
Changes in atmospheric moisture divergence are presented in Fig. 8. The MRB moisture divergence shows an increase in summer and reductions in winter and autumn, which means more water vapour converges into MRB during cold seasons and vice versa in summer. The largest increase in moisture divergence in MRB occurs in June when evaporation greatly increases in the eastern MRB and precipitation only increases slightly. The accumulative change in moisture divergence decreases throughout the year in MRB. The SRB moisture divergence shifts from increasing during the warm months (May–September) to little change over the cold months. The maximum changes in divergence over SRB occur in July. The annual accumulative change in the moisture flux over SRB shows an enhanced divergence of about 2 mm d−1, which is mainly driven by the large accumulative increase in ET over SRB. Few changes occur in storage during the cold season in SRB until spring (April and May) when higher precipitation in PGW causes larger water storage on the land surface. The increase in vapour divergence in summer is supplied by a larger drawdown in soil moisture and reduction in runoff. The vertical profile of atmospheric vapour divergence (not shown) shows that the majority of the increase in the divergence occurs below 850 hPa.
3.3 Distribution of precipitation, evapotranspiration, and moisture divergence
Figures 9–12 show the spatial distribution of precipitation, evapotranspiration (ET), atmospheric moisture divergence, and soil moisture terms for both WRF–CTL and WRF–PGW. The increases in precipitation (P) and ET in PGW are the most predominant features in all months, indicating that the water cycle and the water exchange between the land and the atmosphere become stronger in a warmer future.

Figure 9P, ET, changes in soil moisture, and divergence of vertically integrated moisture flux for WRF–CTL (left), WRF–PGW (middle), and differences between WRF–CTL and WRF–PGW (right) in March. The unit of all variables is turned into millimetres per day (mm d−1), which makes comparisons among variables easy. All variables are averaged over the simulation period and over the calendar month.
As shown in Fig. 9, the major increase in P extends northeastward from the Canadian Rockies and covers mainly the MRB and Nelson River basin in March. Due to general warming in the domain, ET is also enhanced across the domain, especially in British Columbia and near the eastern end of SRB. Soil moisture shows a large reduction in British Columbia and a large increase over central and eastern Saskatchewan, where the increase in ET is larger than the increase in P. This increase in soil moisture in the prairies is beneficial to agriculture as the growing seasons may be advanced to April in a warmer climate. The moisture flux shows an increase in divergence in the southern prairies and an enhancement of the convergence over MRB, which corresponds to the spatial distribution of the change in P over these regions.
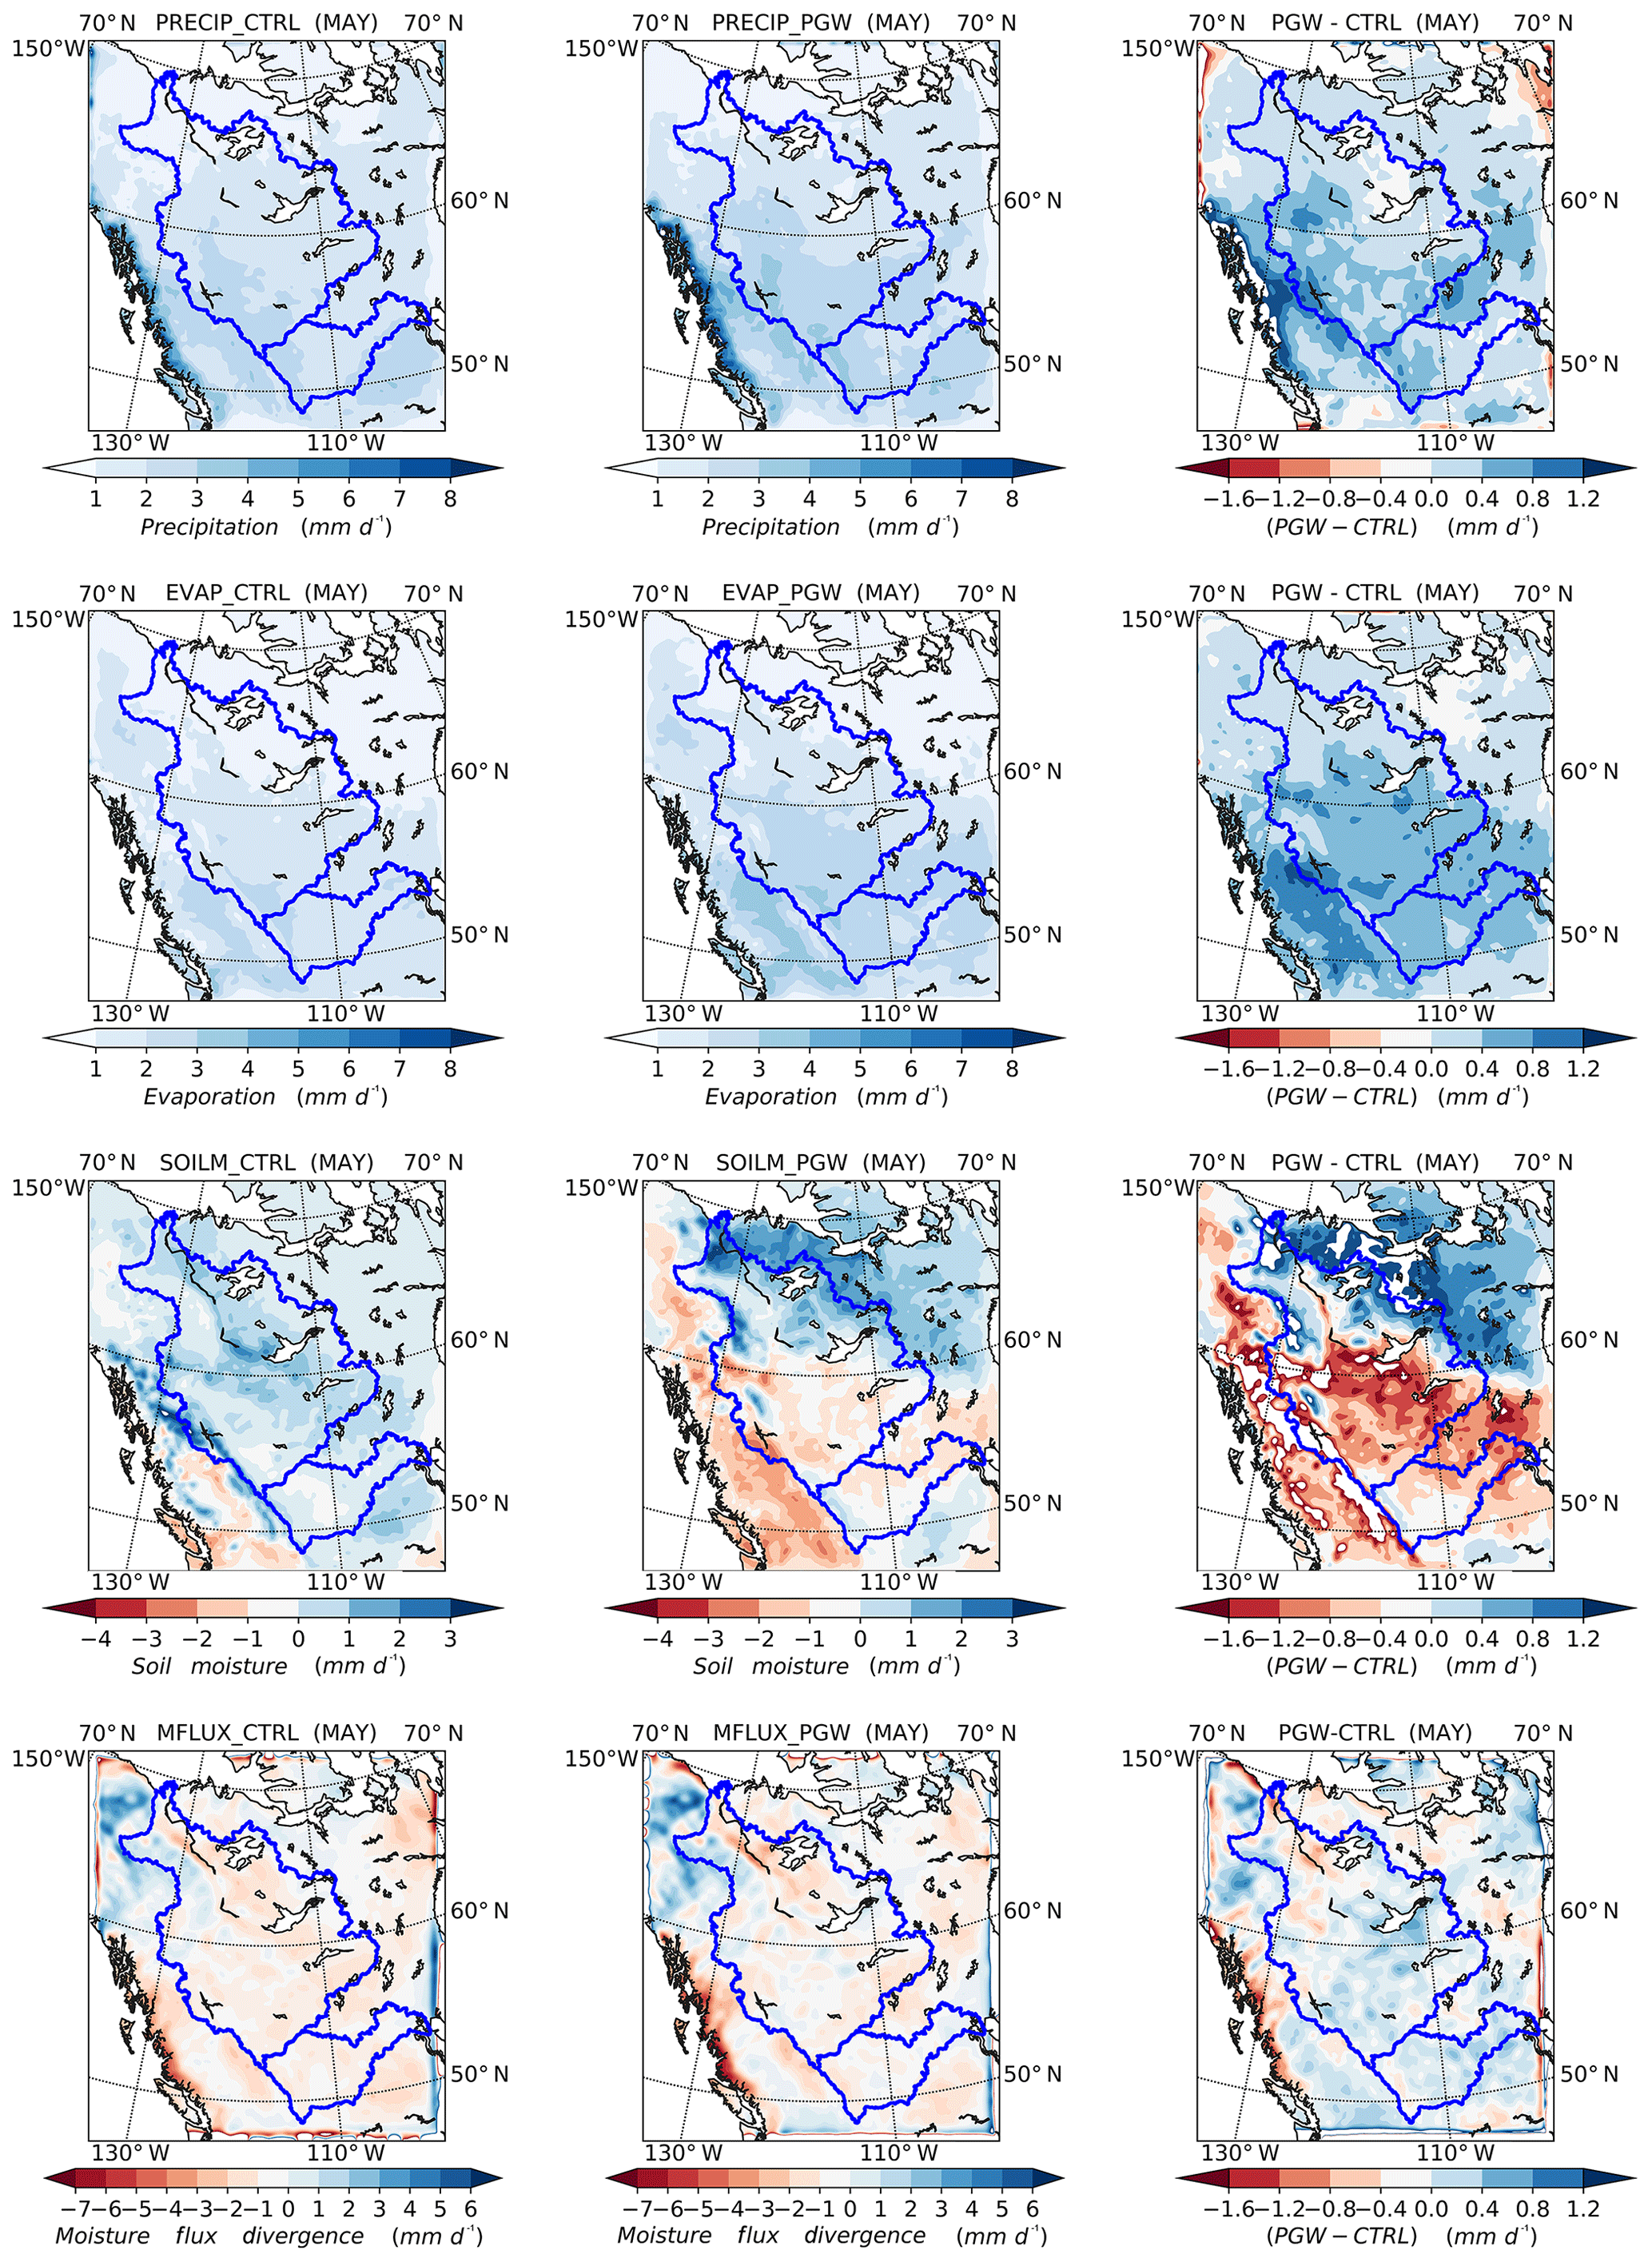
Figure 10Same as in Fig. 9, except for May.
Figure 10 shows P increases across the domain, with a strong magnitude over the Pacific coast and the northern mountainous regions in May. This strengthening in P is countered by the increased ET, especially in the southern domain, which generates a reduction in soil moisture over large regions in the southern and western regions covering British Columbia, southern MRB, and SRB. The decrease in soil moisture in May is due to earlier snowmelt and increased evaporation demand in the warmer future. The deficit of P over ET corresponds to stronger atmospheric moisture divergence in MRB than in SRB. In general, PGW presents a drier condition for the major agricultural regions compared to CTL in the early growing season.
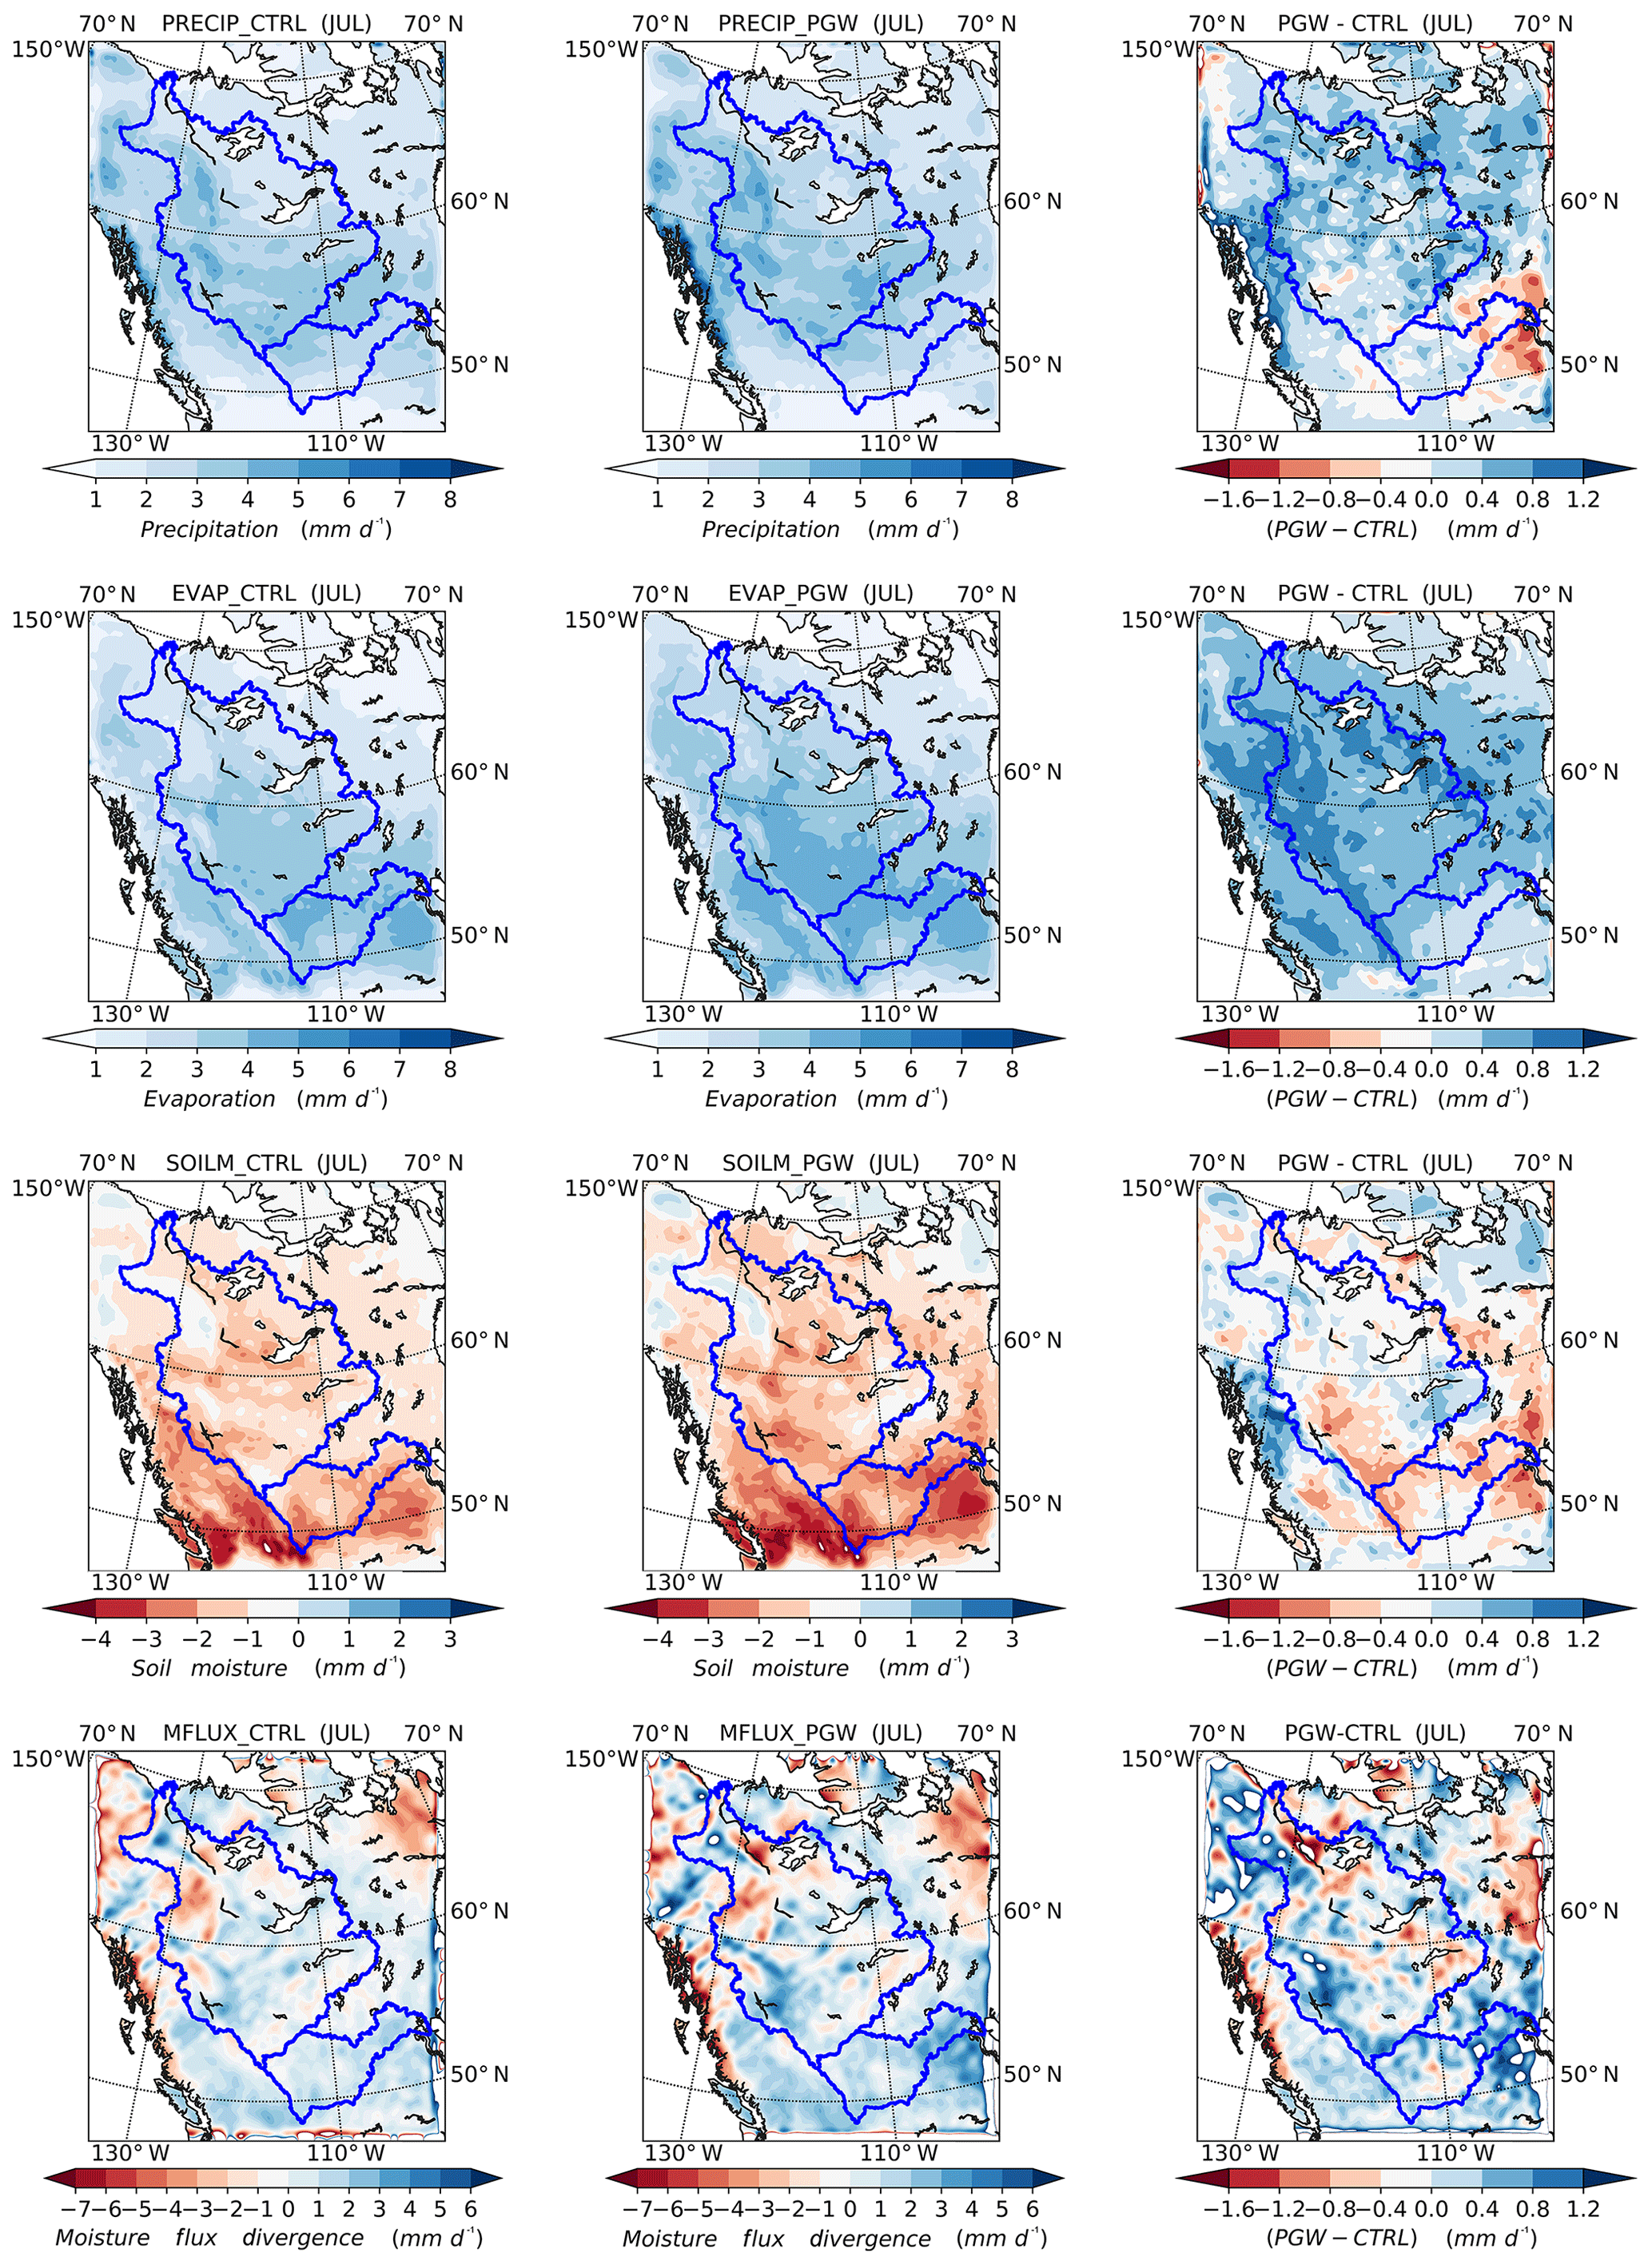
Figure 11Same as in Fig. 9, except for July.
In July, a general increase in P is shown over most of the domain in WRF–PGW except the southern region, especially near the eastern part of SRB, as shown in Fig. 11. The decrease in soil moisture in the antecedent spring months may contribute to the lack of precipitation increase in PGW in these regions. Compared to May, the increase in ET is more widespread and shifted northward. With this P and ET configuration, the soil moisture substantially decreases in SRB, southwestern MRB, and the region close to Hudson Bay. The enhanced ET and unchanged P correspond to an increase in divergence of atmospheric water vapour over SRB, which is consistent with Fig. 6. Like in May, the soil moisture decreases in the major agricultural regions in Saskatchewan and Alberta, which provides water for the extra evaporation.
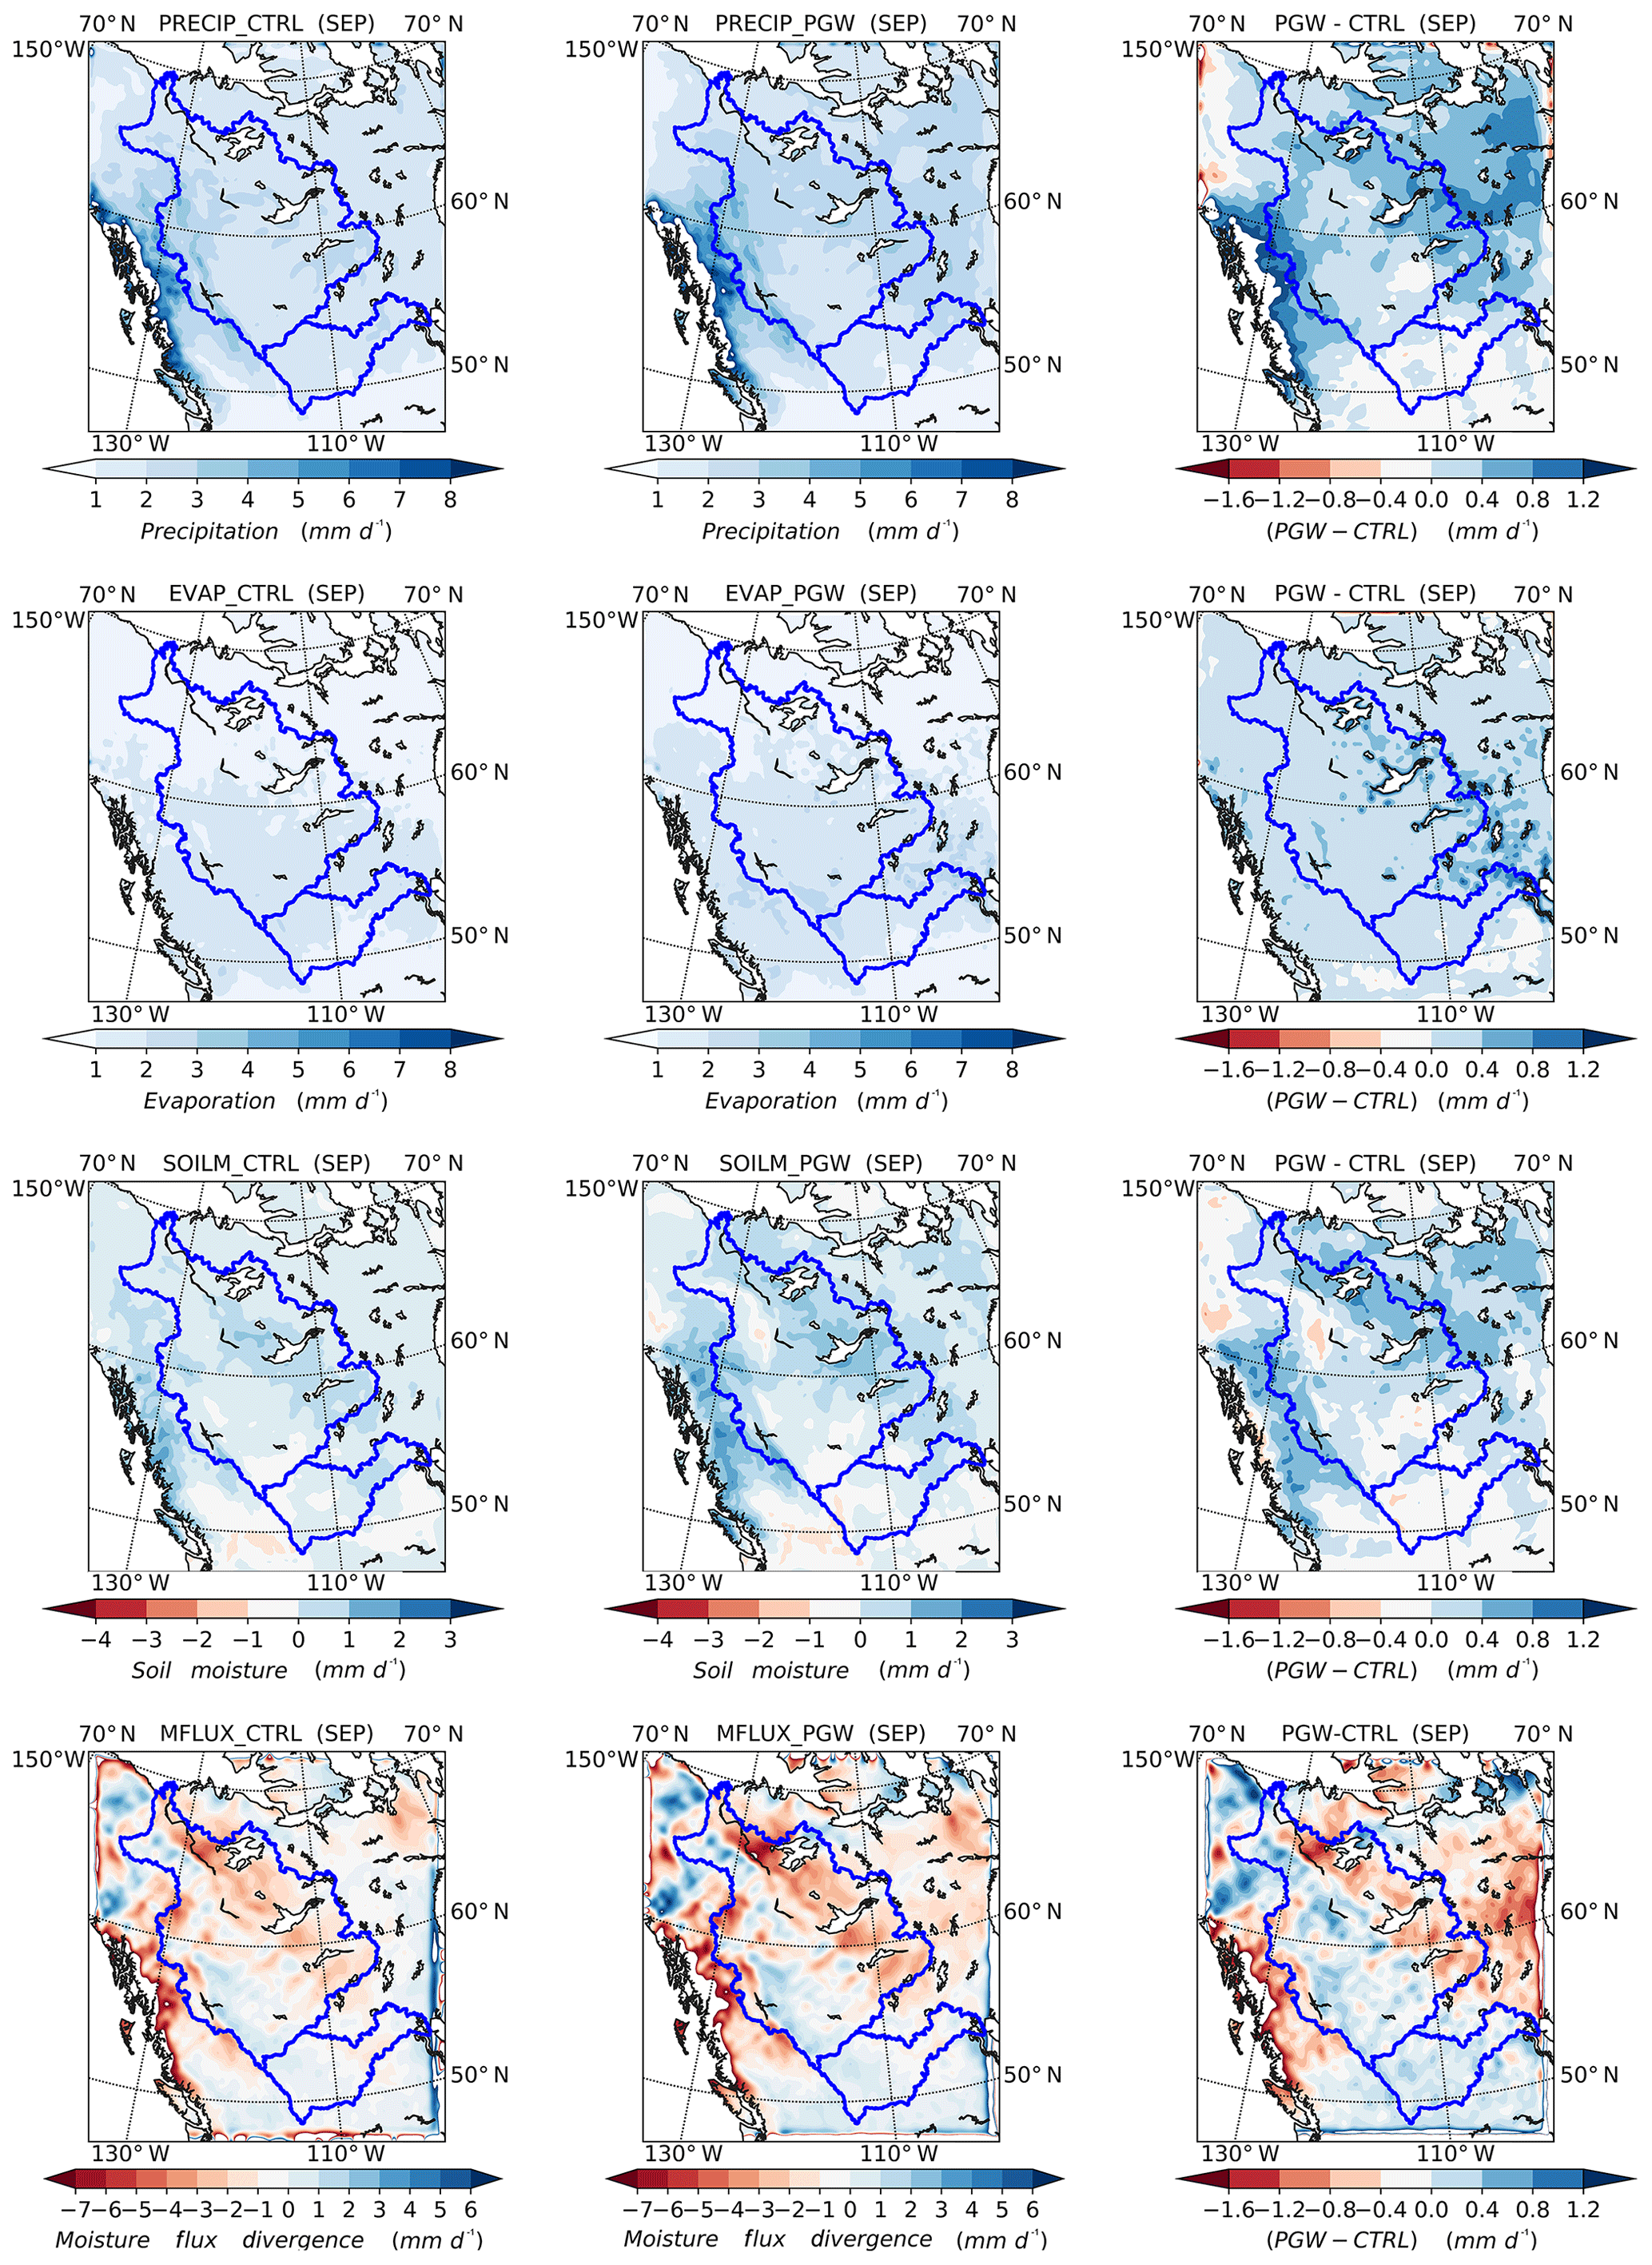
Figure 12Same as in Fig. 9, except for September.
At the end of the growing season and early autumn, Fig. 12 shows that the WRF–PGW simulation shows a large increase in precipitation near the Pacific coast and the northeastern part of the domain; a small decrease in precipitation occurs in SRB. The ET enhancement is the largest near the eastern edge of MRB and SRB. The increase in precipitation is larger than that of ET for MRB, the BC coastal region, and the northeastern corner of the domain, where large increases in soil moisture occur. The convergence of atmospheric water vapour increases in the northeastern and eastern parts of MRB, which matches well with increases in P and ET. Conversely, the increase in the divergence of the moisture flux over western MRB and SRB is due to the decreases in P−ET.
Over the course of the year, the atmosphere provides a net influx of water vapour for the two river basins through moisture convergence during spring, autumn, and winter. In summer, the excess of P−ET over the two basins is balanced by moisture divergence over the regions and by the residual term (the decreases in precipitable water) in MRB. Compared to WRF–CTL, PGW's water vapour exchange between land and atmosphere shows increased water cycling through enhanced P and ET throughout the year. Higher temperatures allow more water vapour in the atmosphere, and thus more water vapour transportation from the Pacific and the Gulf of Mexico. Due to the spatial and temporal heterogeneity of the changes in P and ET, the changes in atmospheric and surface water balance vary over the two basins.
We have investigated the water balance in the WRF simulations and the reanalyses from two perspectives, namely the surface water budget and the atmospheric moisture budget. Moisture divergence is affected by two factors, namely water vapour distribution and atmospheric flow. Convergence of wind can generate moisture flux convergence in a constant field of moisture distribution. Sharp gradients of moisture can also cause large fluxes of moisture without the convergence of wind.
The surface water budgets in the model and reanalyses are strongly affected by the representation of the hydrometeorological processes involved in the surface water balance equations. Each reanalysis dataset has different magnitudes of biases in the P, ET, runoff, and water storage terms, depending on geographic locations and seasons. Due to the large uncertainty in model diagnostic terms (i.e. not directly constrained by observation), such as precipitation and evapotranspiration, great caution needs to be exerted when using hydrological variables from reanalyses (Trenberth et al., 2011). Furthermore, the assimilation system of reanalyses has to adjust the model variables according to newly available observation; though water vapour is constrained by satellite observation, the dry air mass or water balance is not strongly constrained (Takacs et al., 2016). In general, the results here show that the model simulation and reanalyses with higher resolution are more inclined to close the surface water budget with minimum residual terms.
In addition to the atmospheric forcing, the generation of runoff through LSMs can further introduce discrepancies in the runoff among models. Though the Noah LSM, JRA-55's land surface model SiB, and ERA-Interim's TESSEL calculate runoff using similar algorithms, their treatments of land cover and soil can make big differences in runoff generation. Additionally, the land surface in reanalyses is periodically forced by observations at the screen level through assimilation, which could introduce imbalance. Noah LSM has four soil layers, with a leaf area index (LAI) changing monthly and diverse soil types and land cover. JRA-55's simple biosphere model provides three layers of soil with varied depth, depending on 13 land cover types. TESSEL is the most crude model in terms of the treatment of the soil and vegetation cover. TESSEL has fixed LAI throughout the year and only one soil type across the globe, which has been shown to introduce biases in near-surface temperature biases among other deficiencies over the Canadian Prairies (Betts and Beljaars, 2017).
Although P generally increases throughout the domain in WRF–PGW compared to WRF–CTL in summer, it substantially decreases in the eastern part of SRB and the surrounding region in July. In the summer months (June, July, and August), SRB experiences no increase or only a slight decrease in P in the WRF–PGW simulation compared to WRF–CTL. The reason for the decrease in P in eastern SRB is unclear, and further investigation is needed to figure out the cause of the decrease in summer P in the region. An examination of the atmospheric circulation differences in the forcing field of WRF–PGW compared to WRF–CTL in the lower atmosphere showed a decreased westerly mean wind at 750 and 500 hPa in response to the reduced meridional thermal gradient across SRB in summer. We found that changes in WRF–PGW circulation caused by accumulated differences in the WRF-simulated mesoscale processes are very different from the forcing field and depend on the internal atmospheric and terrestrial processes (Li et al., 2019). Indeed, the WRF–PGW large-scale forcing caused shifts in mean flow, but changes in horizontal and vertical transport of heat and moisture also depend on the responses of the mesoscales to local-scale processes. This dynamic feedback again shows the importance of high-resolution dynamical downscaling both to represent the unresolved processes by producing a fine-scale realization of hydroclimatic processes and to properly produce the accumulated effects on the large-scale fields.
From the atmospheric water vapour balance perspective, convergence and divergence of the vertically integrated moisture flux are essentially the differences between P and ET in winter and summer when changes in air temperature are relatively small. A region with a mean excess (deficit) of P over ET corresponds to the convergence (divergence) of moisture flux. Therefore, both MRB and SRB are water vapour divergence regions in summer because their ET exceeds P. As the summer precipitation over SRB and MRB is mostly related to convections, the middle and upper troposphere above these two regions is wetter than their counterparts west of the Canadian Rockies due to the vertical transport of moisture by convections. The blocking effects of the North American Cordillera on the westerly moisture flux suppress the net moisture convergence in the basin throughout the year. The basin on the whole remains as a moisture sink. As surface evaporation is extremely weak, winter P is largely balanced by the large-scale moisture convergence in the basin in MRB.
Moisture convergence is associated with stronger P−ET; however, the convergence is not the driving factor. In fact, weather systems, such as extratropical cyclones, are responsible for the bulk transfer of heat (vapour as a form of latent heat) meridionally to balance the excess (deficit) of solar heating in low (high) latitudes, and deep convections transfer heat and moisture between the lower and upper atmosphere (Cotton et al., 2010b). MRB and SRB are situated in an area where polar fronts fluctuate with passing extratropical cyclones. During winter over the Canadian Prairies, the polar-front zone locates in MRB more often than in SRB with fewer orographic barriers. Therefore, the moisture flux into MRB and P over MRB is larger than that over SRB (Fig. 6).
In the PGW simulation, the water recycling rate increases at seasonal and sub-seasonal scales. On the one hand, during the cold season the increase in P and storage is supplied by the enhanced atmospheric moisture convergence as atmospheric vapour loading increases. The increased storage in snow cover and soil moisture provides the excessive evaporation demand during warm seasons in the PGW simulation compared to CTL. On the other hand, during the warm season, the increased evaporation corresponds to an increased divergence of atmospheric vapour flux out of MRB and SRB, especially at the lower troposphere, which means more stored water and concurrent precipitation are recycled back into the atmosphere. Due to the net export of water vapour from both basins, the downwind regions of MRB and SRB get more water vapour flux in PGW than in CTL.
For the surface water budget, the high-resolution WRF simulation shows a significantly lower residual than the reanalysis datasets, though each component of the water cycle has its bias relative to the station observation. Among the reanalysis datasets, NARR has the lowest residual term. Runoffs in NARR and ERA-Interim are too small compared to observations due to their large overestimation of ET. Changes in the surface water budget simulated by WRF show an enhanced water cycle throughout the year. The enhanced ET causes soil moisture to decrease through summer, with the largest decreases moving in tandem with the band of the strongest increases in ET. As a result, at the beginning of the growing season (May) the soil moisture content is lower in the Canadian Prairies in WRF–PGW than in WRF–CTL.
There is a significant difference between the water balance of MRB and SRB due to their geographic features. For the atmospheric water budget, during winter P is balanced by the residual term in SRB. However, in MRB, P−ET is balanced by moisture divergence. The difference in this budget between the two basins is caused by the cross-mountain transport through descending flow with a large quantity of ice particles. This descending flow over the lee slope often occurs over the SRB's western boundary. As the prevailing westerly airflow ascends on the western side of the Canadian Rockies, water vapour cools and freezes to ice crystals that contribute to precipitation. The remainder is transported over the mountain into the SRB as ice in the air. This is an important part of the water budget that can only be faithfully simulated with high-resolution topography.
Future changes in the water cycle as indicated by WRF–PGW (RCP8.5) and WRF–CTL show a general enhancement of the water cycle in both basins. The recycling rate of water is larger when more water vapour is coming from local evaporation than atmospheric transport for precipitation generation. Therefore, for both MRB and SRB the recycling rates are larger in PGW simulations; both basins have much larger evaporation increases in summer than P with increases in column vapour divergence (water vapour going out of the basins). For MRB, precipitation and evaporation increase consistently in the warm season. Thus, for MRB, the more moisture there is from local evaporation, the more precipitation there will be. For MRB, the change in soil moisture is small, and evaporation is mostly the recycling of precipitation. The precipitation increases from May to June for SRB but decreases in July and August; the evaporation increases in all months, and moisture divergence increases in the warm season. For SRB, the increase in evaporation is at the expense of soil moisture, canopy water, and so forth (storage from earlier months) in July and August, which could partly explain the decrease in precipitation.
High-resolution regional climate modelling provides indispensable insights into the hydroclimatic processes that are critical to the water cycle over SRB and MRB. This study shows that further work using CP RCMs is important for enhancing the understanding and accurate projection of the impact of climate change on the water cycle in the region.
The WRF western Canada simulation is available from zhenhua.li@usask.ca. The ERA-Interim reanalysis is available from ECMWF's website at https://apps.ecmwf.int/datasets/data/interim-full-daily/ (ECMWF, 2018). The JRA-55 is available from the Research Data Archive of the National Center for Atmospheric Research at http://rda.ucar.edu/datasets/ds628.1/ (Japan Meteorological Agency, 2018). NARR is provided by the NOAA/OAR/ESRL PSD, Boulder, Colorado, USA, and is available at https://www.esrl.noaa.gov/psd/data/gridded/data.narr.html (NOAA/OAR/ESRL PSD, 2018).
SK designed the outline of the project. YL and ZL provided guidance and direction in the research. SK conducted most of the technical analysis and data processing, and FH worked on several figures. SK and ZL wrote the paper. YL and FH revised the paper.
The authors declare that they have no conflict of interest.
This article is part of the special issue “Understanding and predicting Earth system and hydrological change in cold regions”. It is not associated with a conference.
The authors gratefully acknowledge the support from the Global Water Futures project, within the Global Institute of Water Security at the University of Saskatchewan, and Compute Canada (http://www.computecanada.ca, last access: 8 February 2020).
This research has been supported by the Natural Sciences and Engineering Research Council of Canada (NSERC), the Changing Cold Regions Network (CCRN), the Natural Sciences and Engineering Research Council of Canada (Global Water Futures), and the NSERC Discovery Grant.
This paper was edited by John Hanesiak and reviewed by two anonymous referees.
Balsamo, G., Beljaars, A., Scipal, K., Viterbo, P., van den Hurk, B., Hirschi, M., and Betts, A. K.: A Revised Hydrology for the Ecmwf Model: Verification From Field Site To Terrestrial Water Storage and Impact in the Integrated Forecast System, J. Hydrometeorol., 10, 623–643, https://doi.org/10.1175/2008jhm1068.1, 2009. a
Betts, A. K. and Beljaars, A. C. M.: Analysis of Near‐surface Biases in Era – INterim Over the CAnadian PRairies, J. Adv. Model. Earth Syst., 9, 2158–2173, https://doi.org/10.1002/2017ms001025, 2017. a
Chen, F. and Dudhia, J.: Coupling an Advanced Land Surface-Hydrology Model With the Penn State-Ncar Mm5 Modeling System. Part I: Model Implementation and Sensitivity, Mon. Weather Rev., 129, 569–585, https://doi.org/10.1175/1520-0493(2001)129<0569:CAALSH>2.0.CO;2, 2001. a
Collins, W. D., Rasch, P., Boville, B., Hack, J., McCaa, J., Williamson, D., Kiehl, J., Briegleb, B., Bitz, C., Lin, S.-J., Zhang, M., and Dai, Y.: Description of the NCAR Community Atmosphere Model (CAM 3.0), Tech. rep., NCAR Technical Note/TN464+STR, Natl. Cent. for Atmos. Res., Boulder, Colorado, USA, 2004. a
Cotton, W. R., Bryan, G., and Van den Heever, S. C.: The Influence of Mountains on Airflow, Clouds, and Precipitation, vol. 99 of International Geophysics Series, chap. 11, 2 edn., Academic press, Oxford, UK, 673–750, 2010a. a
Cotton, W. R., Bryan, G., and Van den Heever, S. C.: Storm and cloud dynamics, vol. 99, Academic press, Oxford, UK, 2010b. a
Dee, D., Uppala, S., Simmons, A., Berrisford, P., Poli, P., Kobayashi, S., Andrae, U., Balmaseda, M. A., Balsamo, G., Bauer, P., Bechtold, P., Beljaars, A., van de Berg, L., Bidlot, J.-R., Bormann, N., Delsol, C., Dragani, R., Fuentes, M., Geer, A., Haimberger, L., Healy, S., Hersbach, H., Hólm, E. V., Isaksen, L., Kållberg, P., Köhler, M., Matricardi, M., McNally, A., Monge-Sanz, B., Morcrette, J.-J., Peubey, C., Rosnay, P. D., Tavolato, C., Thepaut, J.-J., and Vitart, F.: The ERA-Interim reanalysis: Configuration and performance of the data assimilation system, Q. J. Roy. Meteor. Soc., 137, 553–597, https://doi.org/10.1002/qj.828, 2011. a, b, c, d
Deser, C., Phillips, A., Bourdette, V., and Teng, H.: Uncertainty in Climate Change Projections: the Role of Internal Variability, Clim. Dynam., 38, 527–546, https://doi.org/10.1007/s00382-010-0977-x, 2012. a
Ebita, A., Kobayashi, S., Ota, Y., Moriya, M., Kumabe, R. and Onogi, K., Harada, Y., Yasui, S., Miyaoka, K., Takahashi, K., Kamahori, H., Kobayashi, C., Endo, H., Soma, M, Oikawa, Y., and Ishimizu, T.: The Japanese 55-year Reanalysis “JRA-55”: an Interim Report, SOLA, 7, 149–152, https://doi.org/10.2151/sola.2011-038, 2011. a, b
ECMWF: ERA-Interim reanalysis, available at: https://apps.ecmwf.int/datasets/data/interim-full-daily/, last access: 10 August 2018. a
Hong, S.-Y., Noh, Y., and Dudhia, J.: A New Vertical Diffusion Package With an Explicit Treatment of Entrainment Processes, Mon. Weather Rev., 134, 2318–2341, https://doi.org/10.1175/mwr3199.1, 2006. a
Hwang, Y.-T. and Frierson, D. M. W.: Increasing Atmospheric Poleward Energy Transport With Global Warming, Geophys. Res. Lett., 37, L24807, https://doi.org/10.1029/2010gl045440, 2010. a
IPCC: Climate Change 2013: The Physical Science Basis. Contribution of Working Group I to the Fifth Assessment Report of the Intergovernmental Panel on Climate Change, edited by: Stocker, T. F., Qin, D., Plattner, G. K., Tignor, M., Allen, S. K., Boschung, J., Nauels, A., Xia, Y., Bex, V., and Midgley, P. M., Cambridge University Press, Cambridge, UK and New York, NY, USA, https://doi.org/10.1017/CBO9781107415324, 2013. a
Japan Meteorological Agency: JRA-55, available at: http://rda.ucar.edu/datasets/ds628.1/, last access: 10 August 2018. a
Kobayashi, S., Ota, Y., Harada, Y., Ebita, A., Moriya, M., Onoda, H., Onogi, K., Kamahori, H., Kobayashi, C., Endo, H., Miyaoka, K., and Takahashi, K.: The JRA-55 Reanalysis: General Specifications and Basic Characteristics, J. Meteorol. Soc. Jpn. Ser. II, 93, 5–48, https://doi.org/10.2151/jmsj.2015-001, 2015. a
Koren, V., Schaake, J., Mitchell, K., Duan, Q.-Y., Chen, F., and Baker, J.: A Parameterization of Snowpack and Frozen Ground Intended for Ncep Weather and Climate Models, J. Geophys. Res.-Atmos., 104, 19569–19585, 1999. a
Li, Y., Li, Z., Zhang, Z., Chen, L., Kurkute, S., Scaff, L., and Pan, X.: High-resolution regional climate modeling and projection over western Canada using a weather research forecasting model with a pseudo-global warming approach, Hydrol. Earth Syst. Sci., 23, 4635–4659, https://doi.org/10.5194/hess-23-4635-2019, 2019 a, b, c, d, e
Liu, J. and Stewart, R. E.: Water Vapor Fluxes Over the Saskatchewan River Basin, J. Hydrometeorol., 4, 944–959, https://doi.org/10.1175/1525-7541(2003)004<0944:WVFOTS>2.0.CO;2, 2003. a
MacDonald, M. K., Pomeroy, J. W., and Essery, R. L.: Water and Energy Fluxes Over Northern Prairies As Affected By Chinook Winds and Winter Precipitation, Agr. Forest Meteorol., 248, 372–385, https://doi.org/10.1016/j.agrformet.2017.10.025, 2018. a
Mesinger, F., DiMego, G., Kalnay, E., Mitchell, K., Shafran, P. C., Ebisuzaki, W., Jović, D., Woollen, J., Rogers, E., Berbery, E. H., Ek, M. B., Fan, Y., Grumbine, R., Higgins, W., Li, H., Lin, Y., Manikin, G, Parrish, D., and Shi, W.: North American Regional Reanalysis, B. Am. Meteorol. Soc., 87, 343–360, https://doi.org/10.1175/bams-87-3-343, 2006. a, b
Niu, G.-Y. and Yang, Z.-L.: Effects of Frozen Soil on Snowmelt Runoff and Soil Water Storage At a Continental Scale, J. Hydrometeorol., 7, 937–952, https://doi.org/10.1175/jhm538.1, 2006. a, b
NOAA/OAR/ESRL PSD: NARR, Boulder, Colorado, USA, available at: https://www.esrl.noaa.gov/psd/data/gridded/data.narr.html, last access: 10 August 2018. a
Pachauri, R. K., Allen, M. R., Barros, V. R., Broome, J., Cramer, W., Christ, R., Church, J. A., Clarke, L., Dahe, Q., Dasgupta, P., Dubash, N. K., Edenhofer, O., Elgizouli, I., Field, C. B., Forster, P., Friedlingstein, P., Fuglestvedt, J., Gomez-Echeverri, L., Hallegatte, S., Hegerl, G., Howden, M., Jiang, K., Cisneroz, B. J., Kattsov, V., Lee, H., Mach, K. J., Marotzke, J., Mastrandrea, M. D., Meyer, L., Minx, J., Mulugetta, Y., O'Brien, K., Oppenheimer, M., Pereira, J. J., Pichs-Madruga, R., Plattner, G.-K., Pörtner, H.-O., Power, S. B., Preston, B., Ravindranath, N. H., Reisinger, A., Riahi, K., Rusticucci, M., Scholes, R., Seyboth, K., Sokona, Y., Stavins, R., Stocker, T. F., Tschakert, P., van Vuuren, D., and van Ypserle, J.-P.: Climate Change 2014: Synthesis Report. Contribution of Working Groups I, II and III to the Fifth Assessment Report of the Intergovernmental Panel on Climate Change, IPCC, Geneva, Switzerland, 2014. a
Pithan, F. and Mauritsen, T.: Arctic Amplification Dominated By Temperature Feedbacks in Contemporary Climate Models, Nat. Geosci., 7, 181–184, https://doi.org/10.1038/ngeo2071, 2014. a
Pomeroy, J. W., Gray, D. M., Brown, T., Hedstrom, N. R., Quinton, W. L., Granger, R. J., and Carey, S. K.: The Cold Regions Hydrological Model: a Platform for Basing Process Representation and Model Structure on Physical Evidence, Hydrol. Process., 21, 2650–2667, https://doi.org/10.1002/hyp.6787, 2007. a
Prein, A. F., Langhans, W., Fosser, G., Ferrone, A., Ban, N., Goergen, K., Keller, M., Tölle, M., Gutjahr, O., Feser, F., Brisson, E., Kollet, S., Schmidli, J., van Lipzig, N. P. M., and Leung, R.: A Review on Regional Convection-Permitting Climate Modeling: Demonstrations, Prospects, and challenges, Rev. Geophys., 53, 323–361, https://doi.org/10.1002/2014RG000475, 2015. a
Rasmussen, R., Liu, C., Ikeda, K., Gochis, D., Yates, D., Chen, F., Tewari, M., Barlage, M., Dudhia, J., Yu, W., Miller, K., Arsenault, K., Grubišić, V., Thompson, G., and Gutmann, E.: High-Resolution Coupled Climate Runoff Simulations of Seasonal Snowfall Over Colorado: A Process Study of Current and Warmer Climate, J. Climate, 24, 3015–3048, https://doi.org/10.1175/2010JCLI3985.1, 2011. a, b
Rasmussen, R., Ikeda, K., Liu, C., Gochis, D., Clark, M., Dai, A., Gutmann, E., Dudhia, J., Chen, F., Barlage, M., Yates, D., and Zhang, G.: Climate Change Impacts on the Water Balance of the Colorado Headwaters: High-Resolution Regional Climate Model Simulations, J. Hydrometeorol., 15, 1091–1116, https://doi.org/10.1175/jhm-d-13-0118.1, 2014. a, b, c
Sellers, P. J., Mintz, Y., Sud, Y. C., and Dalcher, A.: A Simple Biosphere Model (SIB) for Use Within General Circulation Models, J. Atmos. Sci., 43, 505–531, https://doi.org/10.1175/1520-0469(1986)043<0505:ASBMFU>2.0.CO;2, 1986. a
Sellers, P. J., Randall, D., Collatz, G., Berry, J., Field, C., Dazlich, D., Zhang, C., Collelo, G., and Bounoua, L.: A Revised Land Surface Parameterization (SiB2) for Atmospheric Gcms. Part I: Model Formulation, J. Climate, 9, 676–705, https://doi.org/10.1175/1520-0442(1996)009<0676:ARLSPF>2.0.CO;2, 1996. a
Szeto, K. K., Tran, H., MacKay, M. D., Crawford, R., and Stewart, R. E.: The Mags Water and Energy Budget Study, J. Hydrometeorol., 9, 96–115, https://doi.org/10.1175/2007jhm810.1, 2008. a, b
Takacs, L. L., Suárez, M. J., and Todling, R.: Maintaining Atmospheric Mass and Water Balance in Reanalyses, Q. J. Roy. Meteor. Soc., 142, 1565–1573, https://doi.org/10.1002/qj.2763, 2016. a
Thompson, G., Field, P. R., Rasmussen, R. M., and Hall, W. D.: Explicit Forecasts of Winter Precipitation Using an Improved Bulk Microphysics Scheme. Part II: Implementation of a New Snow Parameterization, Mon. Weather Rev., 136, 5095–5115, https://doi.org/10.1175/2008mwr2387.1, 2008. a
Trenberth, K. E., Fasullo, J. T., and Mackaro, J.: Atmospheric Moisture Transports From Ocean To Land and Global Energy Flows in Reanalyses, J. Climate, 24, 4907–4924, https://doi.org/10.1175/2011JCLI4171.1, 2011. a
Viterbo, P. and Beljaars, A. C.: An Improved Land Surface Parameterization Scheme in the Ecmwf Model and Its Validation, J. Climate, 8, 2716–2748, 1995. a
Viterbo, P., Beljaars, A., Mahfouf, J.-F., and Teixeira, J.: The Representation of Soil Moisture Freezing and Its Impact on the Stable Boundary Layer, Q. J. Roy. Meteor. Soc., 125, 2401–2426, https://doi.org/10.1002/qj.49712555904, 1999. a
West, G. L., Steenburgh, W. J., and Cheng, W. Y. Y.: Spurious Grid-Scale Precipitation in the North American Regional Reanalysis, Mon. Weather Rev., 135, 2168–2184, https://doi.org/10.1175/mwr3375.1, 2007. a
Winton, M.: Amplified Arctic Climate Change: What Does Surface Albedo Feedback Have To Do With It?, Geophys. Res. Lett., 33, L03701, https://doi.org/10.1029/2005gl025244, 2006. a
Woo, M.-K. (Ed.): Cold Region Atmospheric and Hydrologic Studies. The Mackenzie Gewex Experience, Springer Berlin Heidelberg, https://doi.org/10.1007/978-3-540-75136-6, 2008. a
Yang, D., Shi, X., and Marsh, P.: Variability and Extreme of Mackenzie River Daily Discharge During 1973–2011, Quatern. Int., 380–381, 159–168, https://doi.org/10.1016/j.quaint.2014.09.023, 2015. a, b, c