the Creative Commons Attribution 4.0 License.
the Creative Commons Attribution 4.0 License.
 | 01 Jul 2020
Pacific climate reflected in Waipuna Cave drip water hydrochemistry
Cinthya Nava-Fernandez
Adam Hartland
Fernando Gázquez
Ola Kwiecien
Norbert Marwan
Bethany Fox
John Hellstrom
Andrew Pearson
Brittany Ward
Amanda French
David A. Hodell
Adrian Immenhauser
Sebastian F. M. Breitenbach
Cave microclimate and geochemical monitoring is vitally important for correct interpretations of proxy time series from speleothems with regard to past climatic and environmental dynamics. We present results of a comprehensive cave-monitoring programme in Waipuna Cave in the North Island of New Zealand, a region that is strongly influenced by the Southern Westerlies and the El Niño–Southern Oscillation (ENSO). This study aims to characterise the response of the Waipuna Cave hydrological system to atmospheric circulation dynamics in the southwestern Pacific region in order to assure the quality of ongoing palaeo-environmental reconstructions from this cave.
Drip water from 10 drip sites was collected at roughly monthly intervals for a period of ca. 3 years for isotopic (δ18O, δD, d-excess parameter, δ17O, and 17Oexcess) and elemental (Mg∕Ca and Sr∕Ca) analysis. The monitoring included spot measurements of drip rates and cave air CO2 concentration. Cave air temperature and drip rates were also continuously recorded by automatic loggers. These datasets were compared to surface air temperature, rainfall, and potential evaporation from nearby meteorological stations to test the degree of signal transfer and expression of surface environmental conditions in Waipuna Cave hydrochemistry.
Based on the drip response dynamics to rainfall and other characteristics, we identified three types of discharge associated with hydrological routing in Waipuna Cave: (i) type 1 – diffuse flow, (ii) type 2 – fracture flow, and (iii) type 3 – combined flow. Drip water isotopes do not reflect seasonal variability but show higher values during severe drought. Drip water δ18O values are characterised by small variability and reflect the mean isotopic signature of precipitation, testifying to rapid and thorough homogenisation in the epikarst. Mg∕Ca and Sr∕Ca ratios in drip waters are predominantly controlled by prior calcite precipitation (PCP). Prior calcite precipitation is strongest during austral summer (December–February), reflecting drier conditions and a lack of effective infiltration, and is weakest during the wet austral winter (July–September). The Sr∕Ca ratio is particularly sensitive to ENSO conditions due to the interplay of congruent or incongruent host rock dissolution, which manifests itself in lower Sr∕Ca in above-average warmer and wetter (La Niña-like) conditions. Our microclimatic observations at Waipuna Cave provide a valuable baseline for the rigorous interpretation of speleothem proxy records aiming at reconstructing the past expression of Pacific climate modes.
- Article
(10789 KB) - Full-text XML
-
Supplement
(11039 KB) - BibTeX
- EndNote


The southwestern fringe of the Pacific Ocean between 30 and 40∘ S marks the transition zone between the tropical Pacific and the sub-tropical Southern Ocean. This region's position near the boundary of two markedly different climates makes the southwestern Pacific a key site to capture the signatures of the coupled atmosphere–ocean climate sub-systems of the El Niño–Southern Oscillation (ENSO) and the Southern Westerlies (Basher, 1998; Shulmeister et al., 2004). The midlatitude Westerlies are a dominant feature in Southern Hemisphere general circulation. The prevailing wind flow from west to east over Aotearoa/New Zealand is present throughout the year but shows maximum intensity in winter (Sturman and Tapper, 2014). The westerly circulation has a significant impact on mean rainfall in New Zealand, with strong wind circulation bringing more rainfall to the western parts of the islands (Griffiths, 2006). The effects of both of these circulation features are well expressed in seasonal to multi-annual climate variability in New Zealand (Mullan, 1996). New Zealand's climate is strongly modulated by both ENSO and the Southern Westerlies, and its agricultural economy reacts sensitively to inter-annual fluctuations in weather patterns caused by their dynamics (Basher, 1998).
During El Niño events, New Zealand is susceptible to increases in the frequency and intensity of westerly and southwesterly winds, accompanied by decreased rainfall in the North Island (Ummenhofer and England, 2007). In contrast, La Niña events are accompanied by stronger northeasterly winds and increased rainfall in the North Island (Griffiths, 2006; Ummenhofer and England, 2007). The link between ENSO events and climate on the western coast of the North Island of New Zealand is reflected in the correlation between precipitation and the Niño 3.4 and SOI (Southern Oscillation Index) indices (Fig. S1 in the Supplement). Rainfall in this area is negatively correlated with the Niño 3.4 index for the months June to November (austral winter), indicating that during El Niño events New Plymouth receives below average rainfall. The SOI index also shows a fairly strong correlation with austral-winter rainfall (July to November), with above-normal precipitation on the western coast during times of positive SOI values, indicative of La Niña (Fig. S1).
The environmental and economic impacts of strong ENSO events for New Zealand are considerable. For example, the severe drought triggered by the strong El Niño event of 1997–1998 caused economic losses of ca. NZD 1 billion (Basher, 1998). The projected effects of ENSO on New Zealand's hydroclimate are based on observations of El Niño and La Niña dynamics recorded over the instrumental period. However, such observations cover only a comparatively short time span (beginning in the early 1800s). The study of the long-term natural variability of New Zealand's hydroclimate (and emergent teleconnection patterns) is a priority both because of the effects of ENSO variability on local economic conditions and because records from this region are sparse but vital for improving the robustness of model projections of future ENSO conditions. Since the nature of ENSO over the last few millennia remains poorly understood, ENSO-sensitive study sites that provide long, robustly datable proxy reconstructions are urgently needed. Prior to building robust palaeo-climate (ENSO) reconstructions (e.g. by using speleothems), field sites that are highly susceptible to ENSO-related environmental changes must be identified through monitoring campaigns.
Speleothems (secondary cave carbonates) offer precise chronological control and a wide range of environmentally sensitive proxies, including growth rate, carbon, and oxygen isotopes (δ13C and δ18O); major and trace elements; and increasingly, non-traditional isotope systems such as δ44Ca (Henderson, 2006; Fairchild and Baker, 2012, 7–10; Owen et al., 2016; Magiera et al., 2020) or δ26Mg (Immenhauser et al., 2010; Riechelmann et al., 2012).
Over the last 2 decades, speleothems have provided invaluable reconstructions of past rainfall, changes in vegetation, and coupled atmosphere–ocean dynamics (Dorale et al., 1998; Asmerom et al., 2010; Myers et al., 2015; Chen et al., 2016; Griffiths et al., 2016; Lechleitner et al., 2017; Kaushal et al., 2018). Speleothems provide reliable continental palaeo-climate records because they allow for modern calibrations linking palaeo-data from stalagmites with meteorological and direct in-cave monitoring, thus making it possible to trace climatic signals from the surface to the speleothem at timescales from seasonal (Frappier et al., 2002) to orbital (Wang et al., 2001, 2008; Meckler et al., 2012; Cheng et al., 2016). Apart from established methods, ongoing investigations are exploring the use of triple oxygen isotopes (i.e. 17Oexcess; see Sect. 3.4 for definition) in carbonate and fluid inclusions in speleothems as a proxy for changes in atmospheric humidity (Affolter et al., 2015; Sha et al., 2020). In rainfall – and presumably in cave drip water – 17Oexcess mostly reflects the relative humidity during the formation of water vapour at the moisture source (i.e. ocean surface), with temperature having a minor effect (Uechi and Uemura, 2019).
The monitoring of modern cave environments, encompassing ventilation, hydrology, and hydrochemistry, is critical for reliable interpretations of palaeo-environmental proxies preserved in speleothems because numerous studies have shown imperfect replication between coeval stalagmites, as well as differences in drip water composition (McDermott, 2004; Fairchild et al., 2006a; Breitenbach et al., 2015). Some of the key parameters affecting a speleothem's fidelity as an environmental archive include cave air and water temperature, drip discharge dynamics, and cave air pCO2, as well as drip water chemistry (Fairchild and Baker, 2012, p. 110; Tremaine et al., 2016). Analysis of the latter allows a distinction to be made between the processes involved in the transfer of the external environmental signals (e.g. precipitation history, temperature, or soil dynamics) and the processes inherent to the epikarst and cave (e.g. degree of water–rock interaction, seepage water CO2 degassing, cave air CO2 dynamics, and prior carbonate precipitation; Oster et al., 2012; Fairchild and Baker, 2012, pp. 24–27).
The characterisation of infiltration pathways is an essential prerequisite for delineating the processes that can modulate drip water chemistry, i.e. the degree of water–rock interaction taking place in the epikarst and the climate signal transferred by the drip water to the speleothems. The climatic signal transferred to speleothems can vary even between speleothems from the same chamber, which emphasises the need for detailed monitoring. As every stalagmite records the conditions that occur in the epikarst and which signals transferred by the feeding drip water, an in-depth understanding of the forcing mechanisms is vital to understand the differences between non-replicating records.
The physical proprieties of the karst zone define the different levels of porosity (Ford and Williams, 2007). Primary porosity is a matrix of inter-granular pore space; secondary porosity is associated with joints and fractures; and tertiary porosity is associated with solution-enhanced conduits. Seepage water experiences one or a combination of these different porosity types, which determine hydrological pathways (Fairchild and Baker, 2012, p. 114). Conceptual models of cave drip water hydrology have traditionally sought to delineate these different types of flow routing on the basis of peak discharge and discharge variability. Smart and Friederich (1987), later modified by Baker et al. (1997), and more recently, Jex et al. (2012), Markowska et al. (2015), and Mahmud et al. (2018) proposed new classification systems based on long-term drip discharge time series, statistical tests, and clustering models. These site-specific classification systems argue that drip discharge characterisation enables a better understanding of the controls on stalagmite growth and of climate proxies such as stable isotopes and trace metals.
Flow routing to speleothem drip points is the first-order control on drip water hydrochemistry, with particular relevance for trace elements and other proxies of prior calcite precipitation (PCP; Fairchild et al., 2000; Wassenburg et al., 2012). PCP serves as a proxy system for moisture availability (Magiera et al., 2020), as it controls the distribution of trace elements in the infiltrating water during the precipitation of carbonate depending on their partition coefficient prior to their arrival at a stalagmite. During the dry season, when the epikarst is less water-filled, PCP can occur, resulting in an increase in X∕Ca ratios in solution (and subsequently the speleothem), while during the wet season, when the epikarst is refilled, PCP is suppressed and drip water X∕Ca ratios are lowered (Fairchild and Treble, 2009). Common PCP proxy systems include the group II alkaline earth metals (Mg, Sr, and Ba) and stable Ca isotopes (δ44Ca) (Magiera et al., 2020; Owen et al., 2016). Calcium isotopes show particular potential for future quantitative PCP reconstructions. However, linking PCP to rainfall amount requires careful site-specific monitoring and calibration (Li et al., 2018).
Cave-monitoring studies in tropical and southwestern Pacific regions have documented strong ENSO signals in Australia (Tadros et al., 2016), Borneo (Moerman et al., 2014), and on Niue Island in the central Pacific (Tremaine et al., 2016). In New Zealand, however, the number of comparable monitoring studies is still limited. Williams and Fowler (2002) investigated the relationship between the oxygen isotope composition of rainfall and drip water in Aranui Cave (Waitomo region, North Island). They found that neither the seasonal variability nor the ENSO-related variability detected in δ18O values of rainfall was transferred to the cave drip waters. In the case of Aranui Cave, this seems to result from the homogenisation of the water isotope signal on its path through the soil and epikarst (Williams and Fowler, 2002). These results highlight the importance of understanding local settings and indicate a need for revisiting other New Zealand cave systems in order to test the relationship between external environmental signals and those inherent to the epikarst and cave system.
We hypothesise that the hydrochemistry of Waipuna Cave is sensitive to changes in precipitation patterns and thus to seasonal variations and dynamics related to ENSO and the Southern Westerlies, due to its geographical position and geometry. Our study aims to test this hypothesis through a 3-year cave-monitoring study, including measurements of cave ventilation, drip water hydrochemistry, and local temperature patterns. Our study has three consecutive objectives: (i) characterising the drip water chemistry, including major and trace elements (Mg∕Ca and Sr∕Ca) and isotope geochemistry (δ17O, δ18O, δD, d-excess parameter, and 17Oexcess); (ii) identifying the mechanisms controlling drip water chemistry; and (iii) understanding the relationship between drip water chemistry and variations in precipitation, with special reference to seasonal and inter-annual (ENSO) climate conditions.
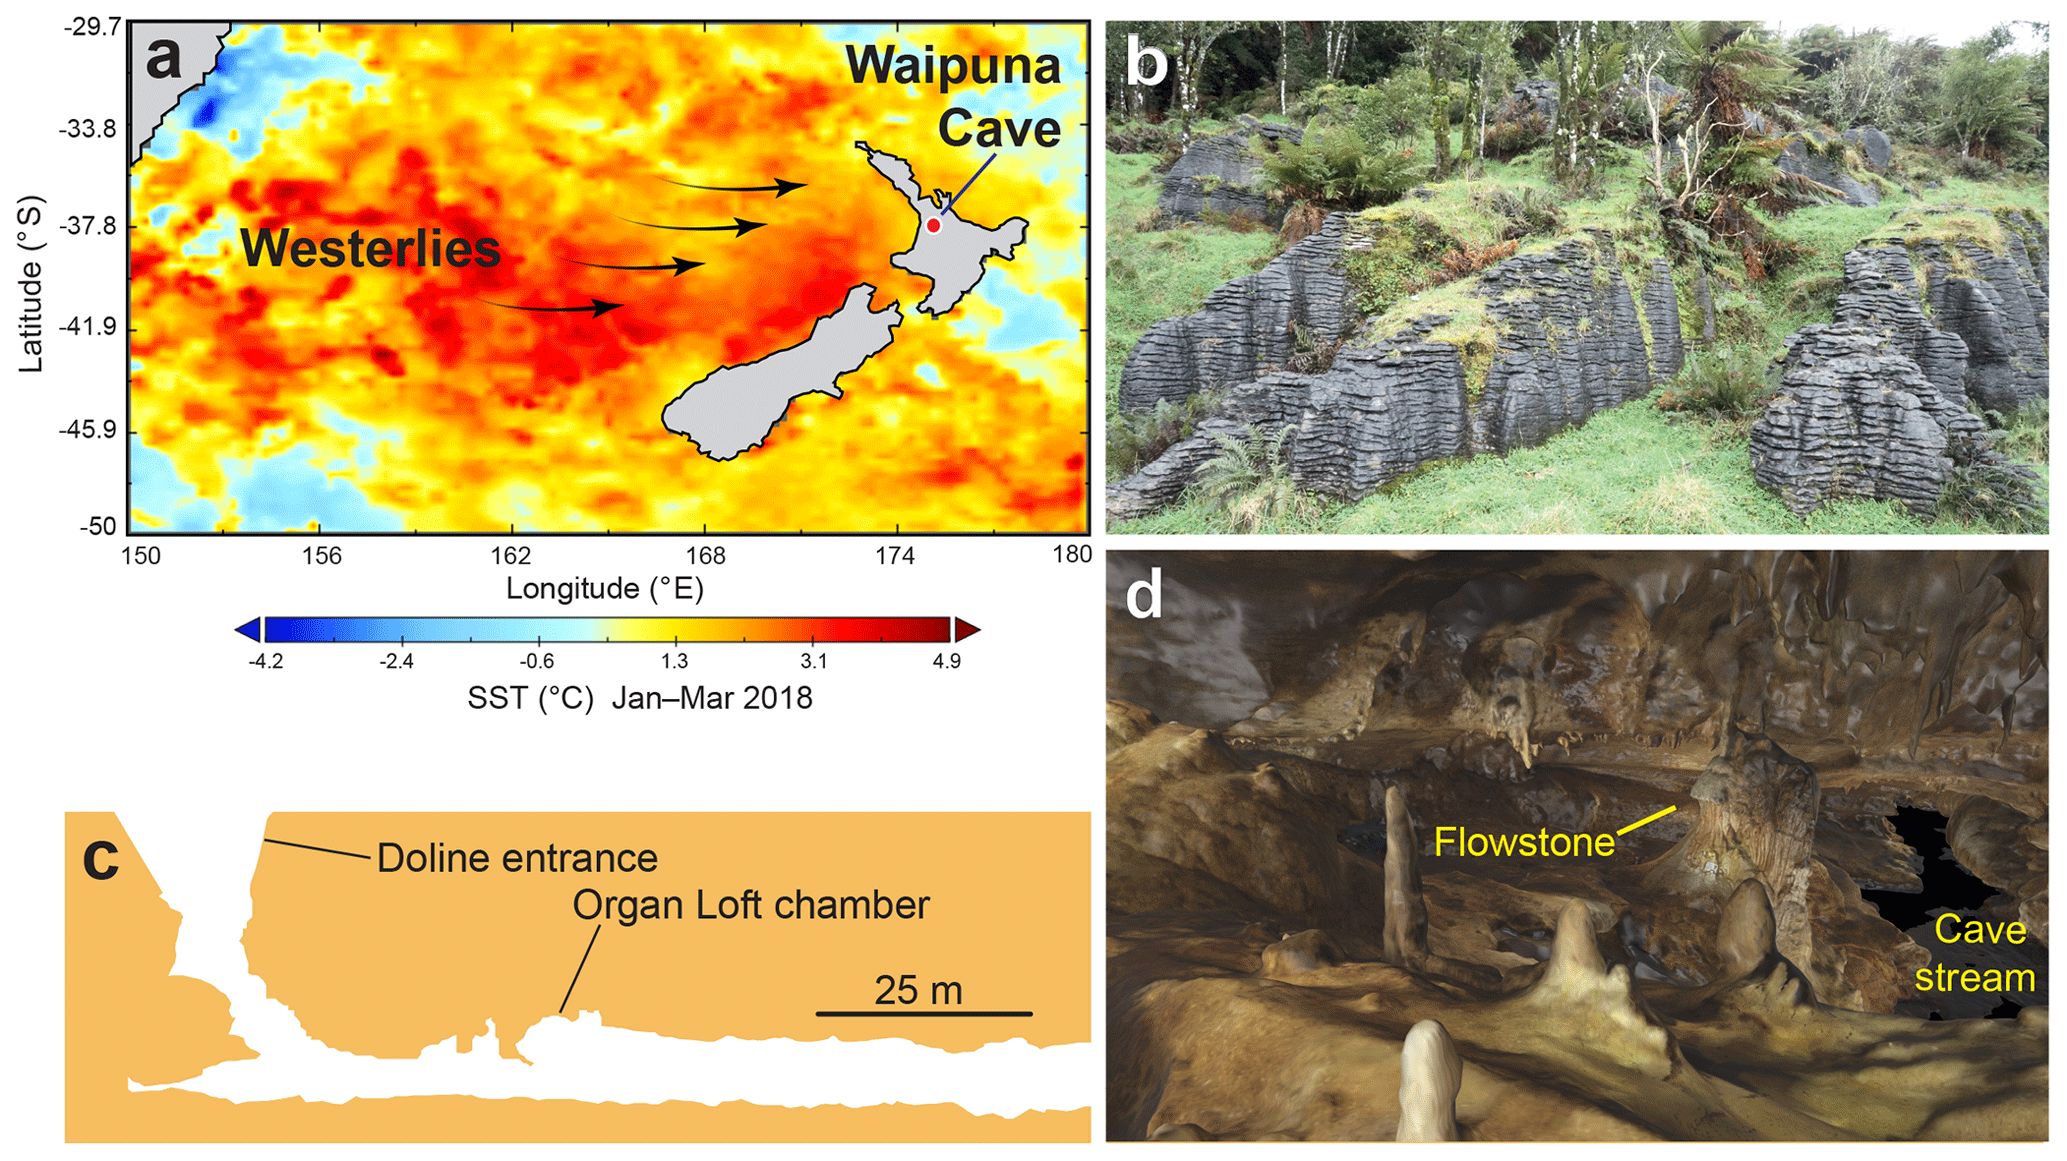
Figure 1(a) Geographical location of Waipuna Cave and its climatic settings during La Niña conditions in summer 2018, with the direction of the Westerlies. Source data: OSTIA. SST: sea surface temperature. (b) Pancake limestone outcrop landscape above Waipuna Cave. (c) Cross section through the entrance and first stretch of Waipuna Cave. (d) 3D model of the “Organ Loft” chamber photo taken by John Hellstrom using structure-from-motion (SfM) mapping.
Geographical and climatological setting
Waipuna Cave is located in the Waitomo district, North Island, New Zealand (38∘18′41.3′′ S, 175∘1′14.3′′ E; 395 m above sea level), ca. 27 km from the western coast (Fig. 1a). The Waipuna Cave is a ca. 3.5 km long river cave developed in the clay-rich, stylobedded Oligocene pancake limestone (Nelson, 1973, Fig. 1b). The estimated bedrock overburden is ca. 20–30 m. The main passage is accessed via a ca. 25 m deep doline. An underground stream flowing through the cave connects a number of larger chambers (Fig. 1c and d). The winding and narrow passage that connects the main chambers limits cave air flow, and the cave atmosphere is relatively isolated from the surface conditions (Fig. 1c). The surface morphology around Waipuna Cave is characterised by a craggy-karst landscape with frequent large dolines (Fig. 1b).
The soil zone is generally >1 m thick Typic Orthic Allophanic (LO) developed on extensive and exceptionally well drained North Island rhyolitic volcanic ash deposits (Hewitt, 2010). The vegetation cover is a patchwork of lush podocarp–hardwood forest with a dense undergrowth of shrubs, ferns, and tree ferns. This is surrounded by grassland pasture used for grazing cattle. Based on data from Te Kuiti High School, a meteorological station in the Waitomo district, the average conditions during the period from 1950 to 2000 CE include annual rainfall of 1539 mm. Summer and winter monthly precipitation means vary between 95 and 150 mm, respectively, with the highest values in austral winter (July) and lowest values during austral summer (February). The mean annual temperature is 13.4 ∘C, ranging from an average of 18.5 ∘C in summer to 8 ∘C in winter.
3.1 External environmental monitoring
Several meteorological datasets were used to constrain the relationship between surface and in-cave environmental conditions. A HOBO temperature logger (ONSET, Bourne, Massachusetts, USA) with a precision of ±0.2 ∘C housed in a purpose-built meteorological station was deployed a few hundred metres from the cave entrance and recorded air temperature at half-hourly intervals between June 2017 and May 2018, from which daily means were calculated. The same station recorded daily rainfall over the periods April to September 2016 and May 2017 to May 2018. Rainfall was recorded with a precision of 0.1 mm using a combination of Campbell Scientific (established in September 2016) and HOBO tipping-bucket rain gauges (established May 2017). Due to technical difficulties, it was not feasible to collect rainfall data over the entire monitoring period. To complement the local meteorological dataset, daily rainfall, and potential evapotranspiration (PET; based on the Priestley–Taylor equation) data were obtained from the NIWA (National Institute of Water and Atmospheric Research) National Database (https://cliflo.niwa.co.nz/, last access: 26 June 2020) using proximal stations at Otorohanga Glenbrook and Te Kuiti Ews, 22 and 13 km from Waipuna Cave, respectively.
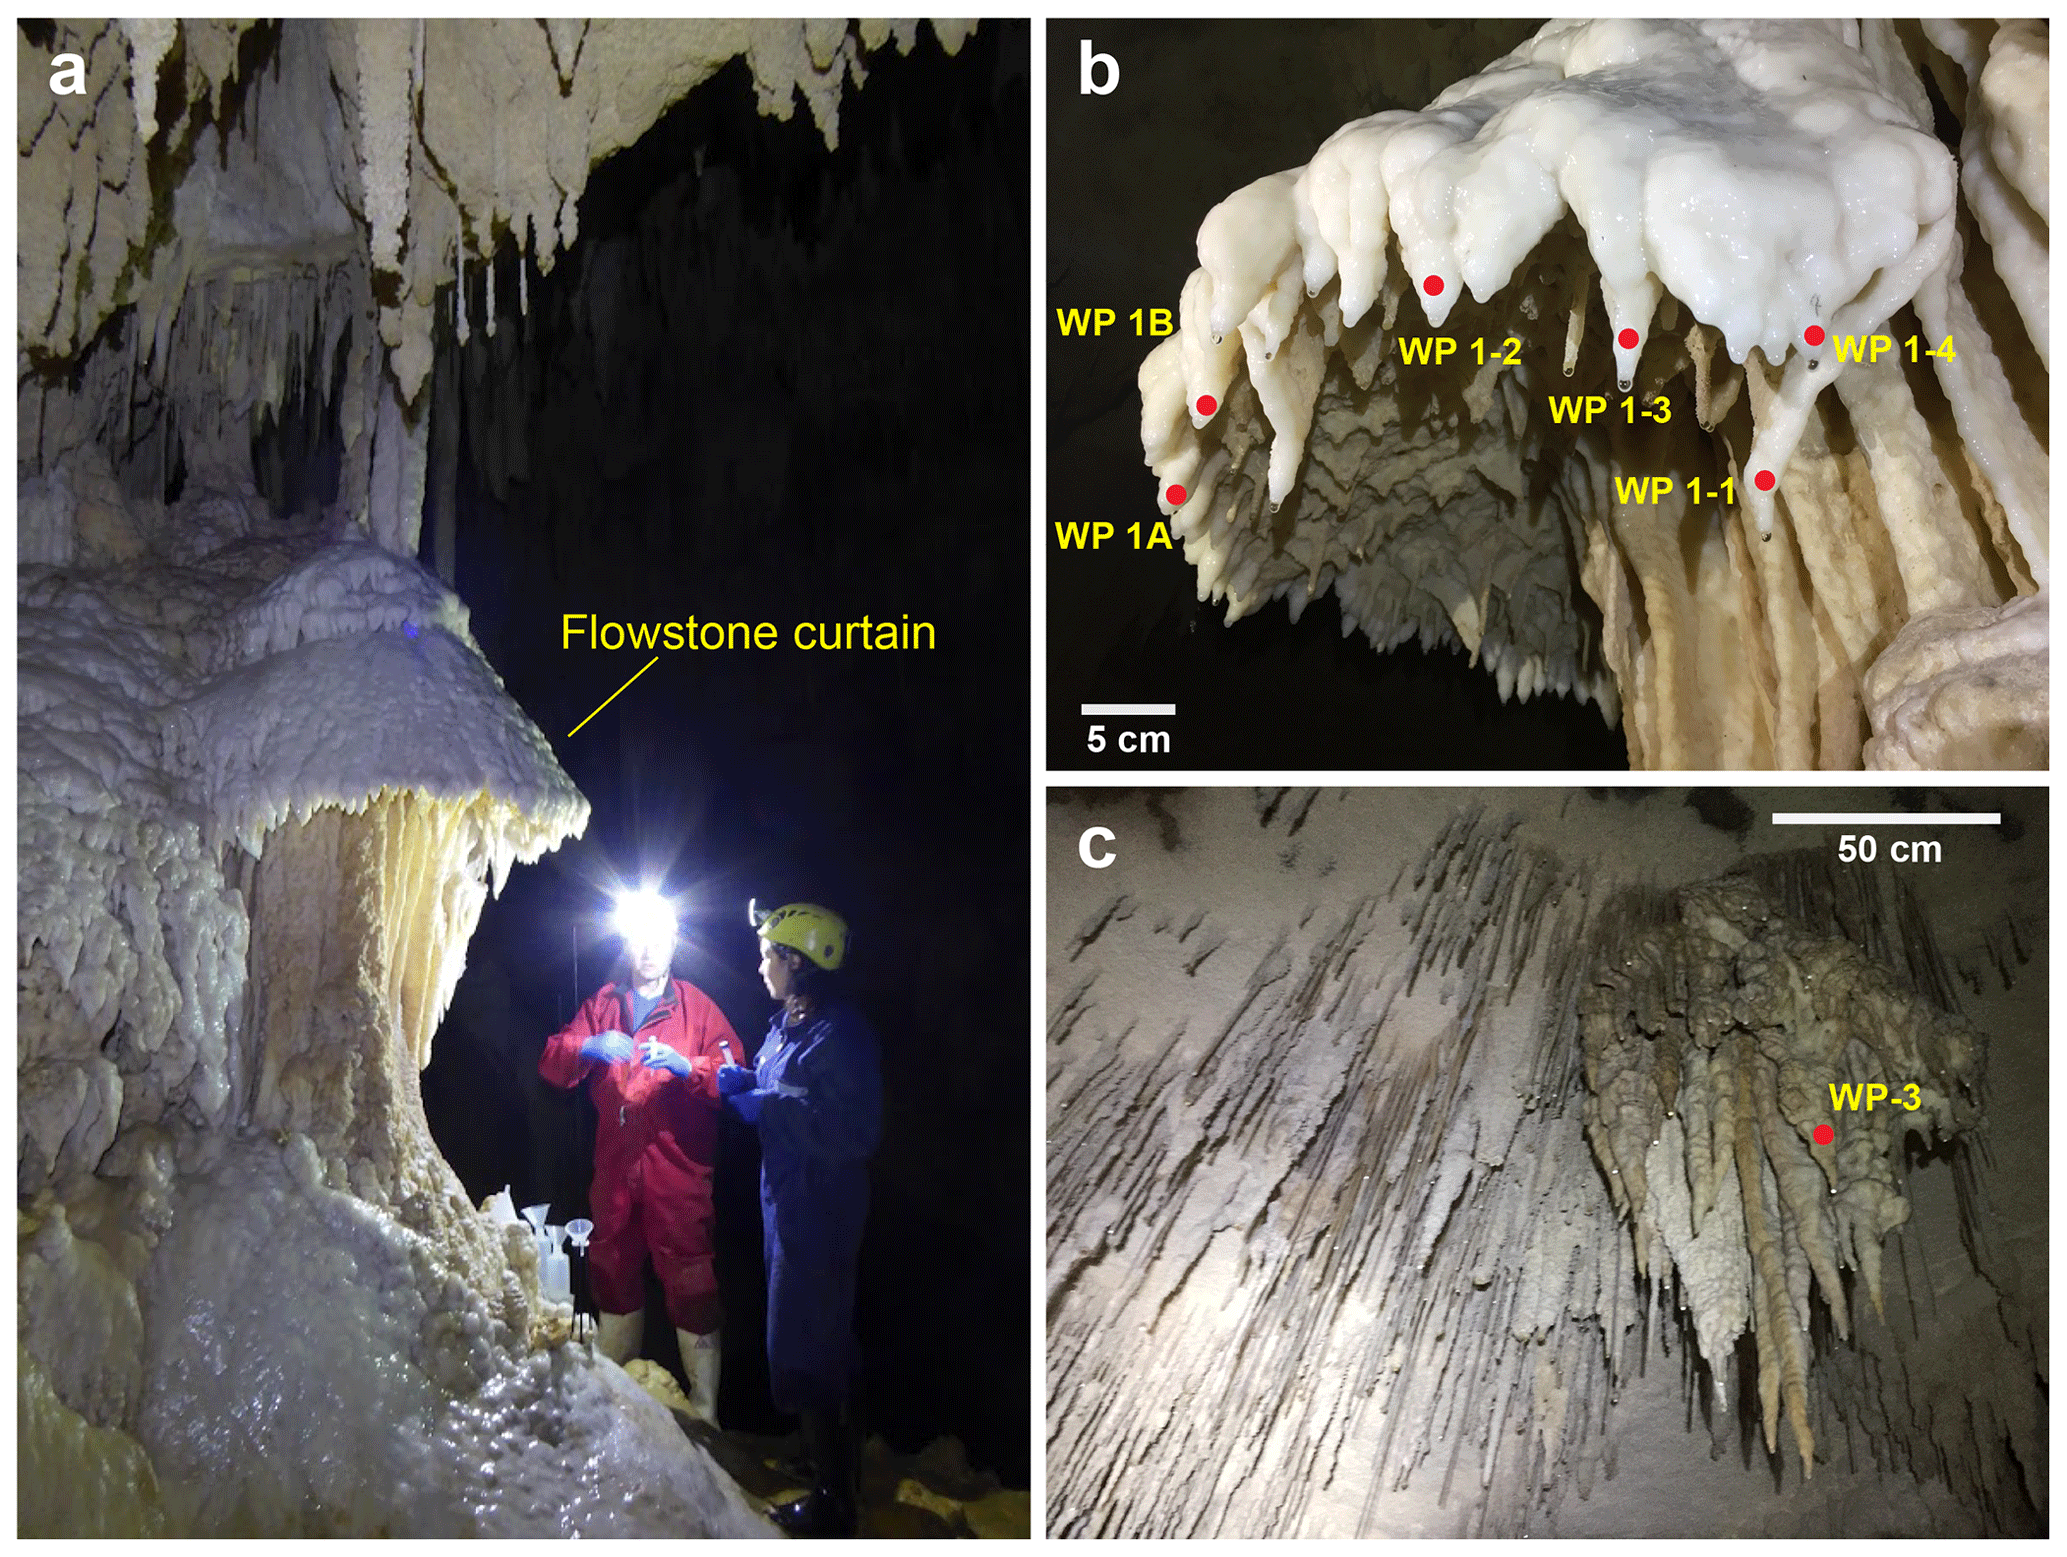
Figure 2(a) Flowstone formation in the Organ Loft chamber (Photograph courtesy of Inken Heidke). (b) Drip sites at the flowstone curtain. (c) Stalactite cluster where drip site WP-3 is located, hanging from the ceiling 6 m high in an inclined plane.
3.2 Cave environment monitoring
Waipuna Cave was visited at ca. monthly intervals for a period of almost 3 years from April 2016 to February 2019 (32 visits in total). Discrete cave air pCO2 measurements were conducted during each visit in the sampling chamber using a Vaisala CARBOCAP Carbon Dioxide Probe GMP343 with an MI70 indicator with a precision of ±1 % of the reading. These measurements were always done before all team members entered the cave chamber to avoid contamination. Water temperature, pH, and electrical conductivity were manually measured on the drip waters using LAQUAtwin pH and conductivity probes (HORIBA Scientific, Japan) calibrated prior to each sampling event. Air temperature in the Organ Loft was recorded every 30 min throughout the monitoring period using an automatic HOBO logger.
3.3 Cave water collection and drip rates
A total of 10 drip sites, along with the cave stream, were sampled for water isotopes and elemental concentrations. Seven of the drip sites (WP 1-1, WP 1-2, WP 1-3, WP 1-4, WP 1A, WP 1B, and WP FB) feed a flowstone (Fig. 2a and b). Three further drip sites (WP-2, WP-3, and WP-4) are located a few metres apart below active stalactites (Fig. 2c) on an elevated section within the same chamber and higher in the ceiling than the first seven drip sites. Additional water samples from the cave stream were also collected (one per visit). Drip water samples for stable isotope analysis (δ17O, δ18O, and δD) were collected and stored in sterile 2 or 10 mL polypropylene bottles, filled with no head space and sealed using laboratory film. Water samples for trace element analysis were collected in 15 mL polypropylene (Falcon) tubes, previously demonstrated to have low metal blanks (Hartland et al., 2015). These samples were acidified with 2 % HNO3 (using in-house, double Teflon-distilled acid) and refrigerated until analysis.
Drip rates at the monitored sites were determined using two independent methods. First, spot measurements were performed at all drip sites. The number of drips per minute was counted during each visit using a stopwatch and counting at least 10 drips. Second, continuous measurements were carried out at four drip sites, WP 1-1, WP 1-2, WP 1-3, and WP-2, using acoustic Driptych Stalagmate drip loggers (http://www.driptych.com/, last access: 26 June 2020).
3.4 Oxygen and hydrogen isotopes of water
The oxygen and hydrogen isotope composition (δ17O, δ18O, and δD) of drip water and stream water was measured using cavity ring-down spectroscopy (CRDS; Steig et al., 2014). Drip water samples collected between August 2016 and April 2017 were analysed for δ18O and δD using a Picarro L1102-i water isotope analyser at the Godwin Laboratory for Paleoclimate Research, University of Cambridge, UK. Samples collected between June 2017 and February 2018 were analysed for δ17O, δ18O, and δD using a Picarro L2140-i at the School of Environmental Sciences of the University of St Andrews, UK. Samples collected from March 2018 to February 2019 were measured for δ17O, δ18O, and δD on a Picarro L2140-i at the Department of Biology and Geology at the Universidad de Almería, Spain. This instrument permits the measurement of the triple oxygen and hydrogen isotope composition of liquid water with no sample pretreatment. The CRDS devices were interfaced with an A0211 high-precision vaporiser.
The results were normalised to the VSMOW (Vienna Standard Mean Ocean Water) scale by analysing internal standards before and after a set of measurements of 10 to 12 samples. Three internal water standards (JRW, BOTTY, and SPIT) were calibrated against VSMOW and SLAP (Standard Light Antarctic Precipitation) using δ17O values of 0.0 ‰ and −29.69865 ‰, respectively, and δ18O values of 0.0 ‰ and −55.5 ‰, respectively (Schoenemann et al., 2013). This standardisation considers 17Oexcess=0 for both international standards. δD was calibrated against VSMOW, GISP (Greenland Ice Sheet Precipitation), and SLAP. All isotopic deviations are reported in parts per thousand (‰) relative to VSMOW. 17Oexcess values are given in per meg units (0.001 ‰), where (Barkan and Luz, 2005). The 17Oexcess expresses a small δ17O deviation (normally a few per meg units) of a water sample with respect to the global meteoric water line (GMWL) for triple oxygen isotopes, for which the slope is 0.528 (Luz and Barkan, 2010). The d-excess parameter describes the deviation for δ18O and δD of a given sample with respect to the GMWL (; Craig, 1961).
The long-term precision (1σ) of oxygen and hydrogen isotope analyses was evaluated by measuring an internal standard (BOTTY) every five to six samples. The long-term precision of the Picarro L1102-i was ±0.08 ‰ for δ18O and ±0.7 ‰ for δD (n=33), while for the Picarro L2140-i it was ±0.03 ‰, ±0.05 ‰, and ±0.4 ‰ for δ17O, δ18O, and δD, respectively (n=43). The long-term precision of the d-excess parameter () was ±0.7‰ for the Picarro L1102-i and ±0.3 ‰ for the Picarro L2140-i. The long-term precision for 17Oexcess was ±8 per meg. The calibrated value of BOTTY was indistinguishable within analytical errors when using the three different instruments, suggesting results are comparable.
3.5 Major and trace elements in drip water
Elemental and major cation concentrations in cave stream, drip water, and rainwater were measured on two generations of instruments at the University of Waikato. Samples collected between August 2016 and October 2017 were analysed using a PerkinElmer ELAN quadrupole ICP-MS (inductively coupled plasma mass spectrometer), and samples collected between November 2017 and February 2019 were analysed with an Agilent 8900 triple quadrupole ICP-MS at the Waikato Environmental Geochemistry Laboratory. The precision of both instruments is similar, and all relative standard deviations (RSDs) were <5 %. The ICP-MS was optimised to maximum sensitivity daily, ensuring oxides and double-charged species were less than 2 %. External calibration standards were prepared using an IV71-A multi-element standard from 0.1 to 500 ppb for trace elements, and single-element standards were used to prepare calibration standards for major elements Ca, Fe, Si, P, S, K, and Na. An internal standard containing Sc, Ge, Te, Ir, and Rh was used for all samples. Check standards were analysed every 20 samples and re-calibration was performed every 100 samples. Blank samples were analysed every 10 samples to ensure minimal carryover between analyses.
3.6 Data analysis
In order to characterise the hydrological behaviour of the drip sites, the coefficient of variation (CV; Smart and Friederich, 1987; Baldini et al., 2006) was calculated for discharge relative to the time of data collection (CV % = , with σ being the standard deviation and being the mean). Cross-correlation analysis between cumulative antecedent rainfall and drip rates was used to identify the response time of the drip sites to the rainfall amount during the monitoring period. Cluster analysis was employed to classify the drip sites according to hydrological similarities. Linear regressions were used to visualise the relationships between drip water Mg∕Ca and Sr∕Ca ratios, the cave air CO2, and cave air temperature as well as between rainfall amount and water isotopes. From these analyses a determination coefficient R2 and p values were calculated; p values < 0.05 were considered to be statistically significant.
4.1 Local meteorology
The available daily precipitation and temperature datasets from the stations at Waipuna, Otorohanga Glenbrook, and Te Kuiti Ews show the same pattern when overlapped, although the amplitudes differ (Fig. 3). The Waipuna meteorological station records large variations in annual surface temperature, with minimum and maximum temperatures ranging from −0.6 ∘C in July to 33 ∘C in January. Daily precipitation ranged from 118 mm in May 2017 to 51 mm in December 2018, without any pronounced seasonality. The driest months are typically November and December (austral summer), and the wettest months are August and September. While the variability and timing of rainfall at the three stations have the same seasonal structure, the Waipuna rain station typically recorded higher amounts. This is consistent with its higher altitude (∼90 m) relative to Otorohanga Glenbrook (40 m) and Te Kuiti Ews (62 m) and thus indicates an orographic effect on rainfall.
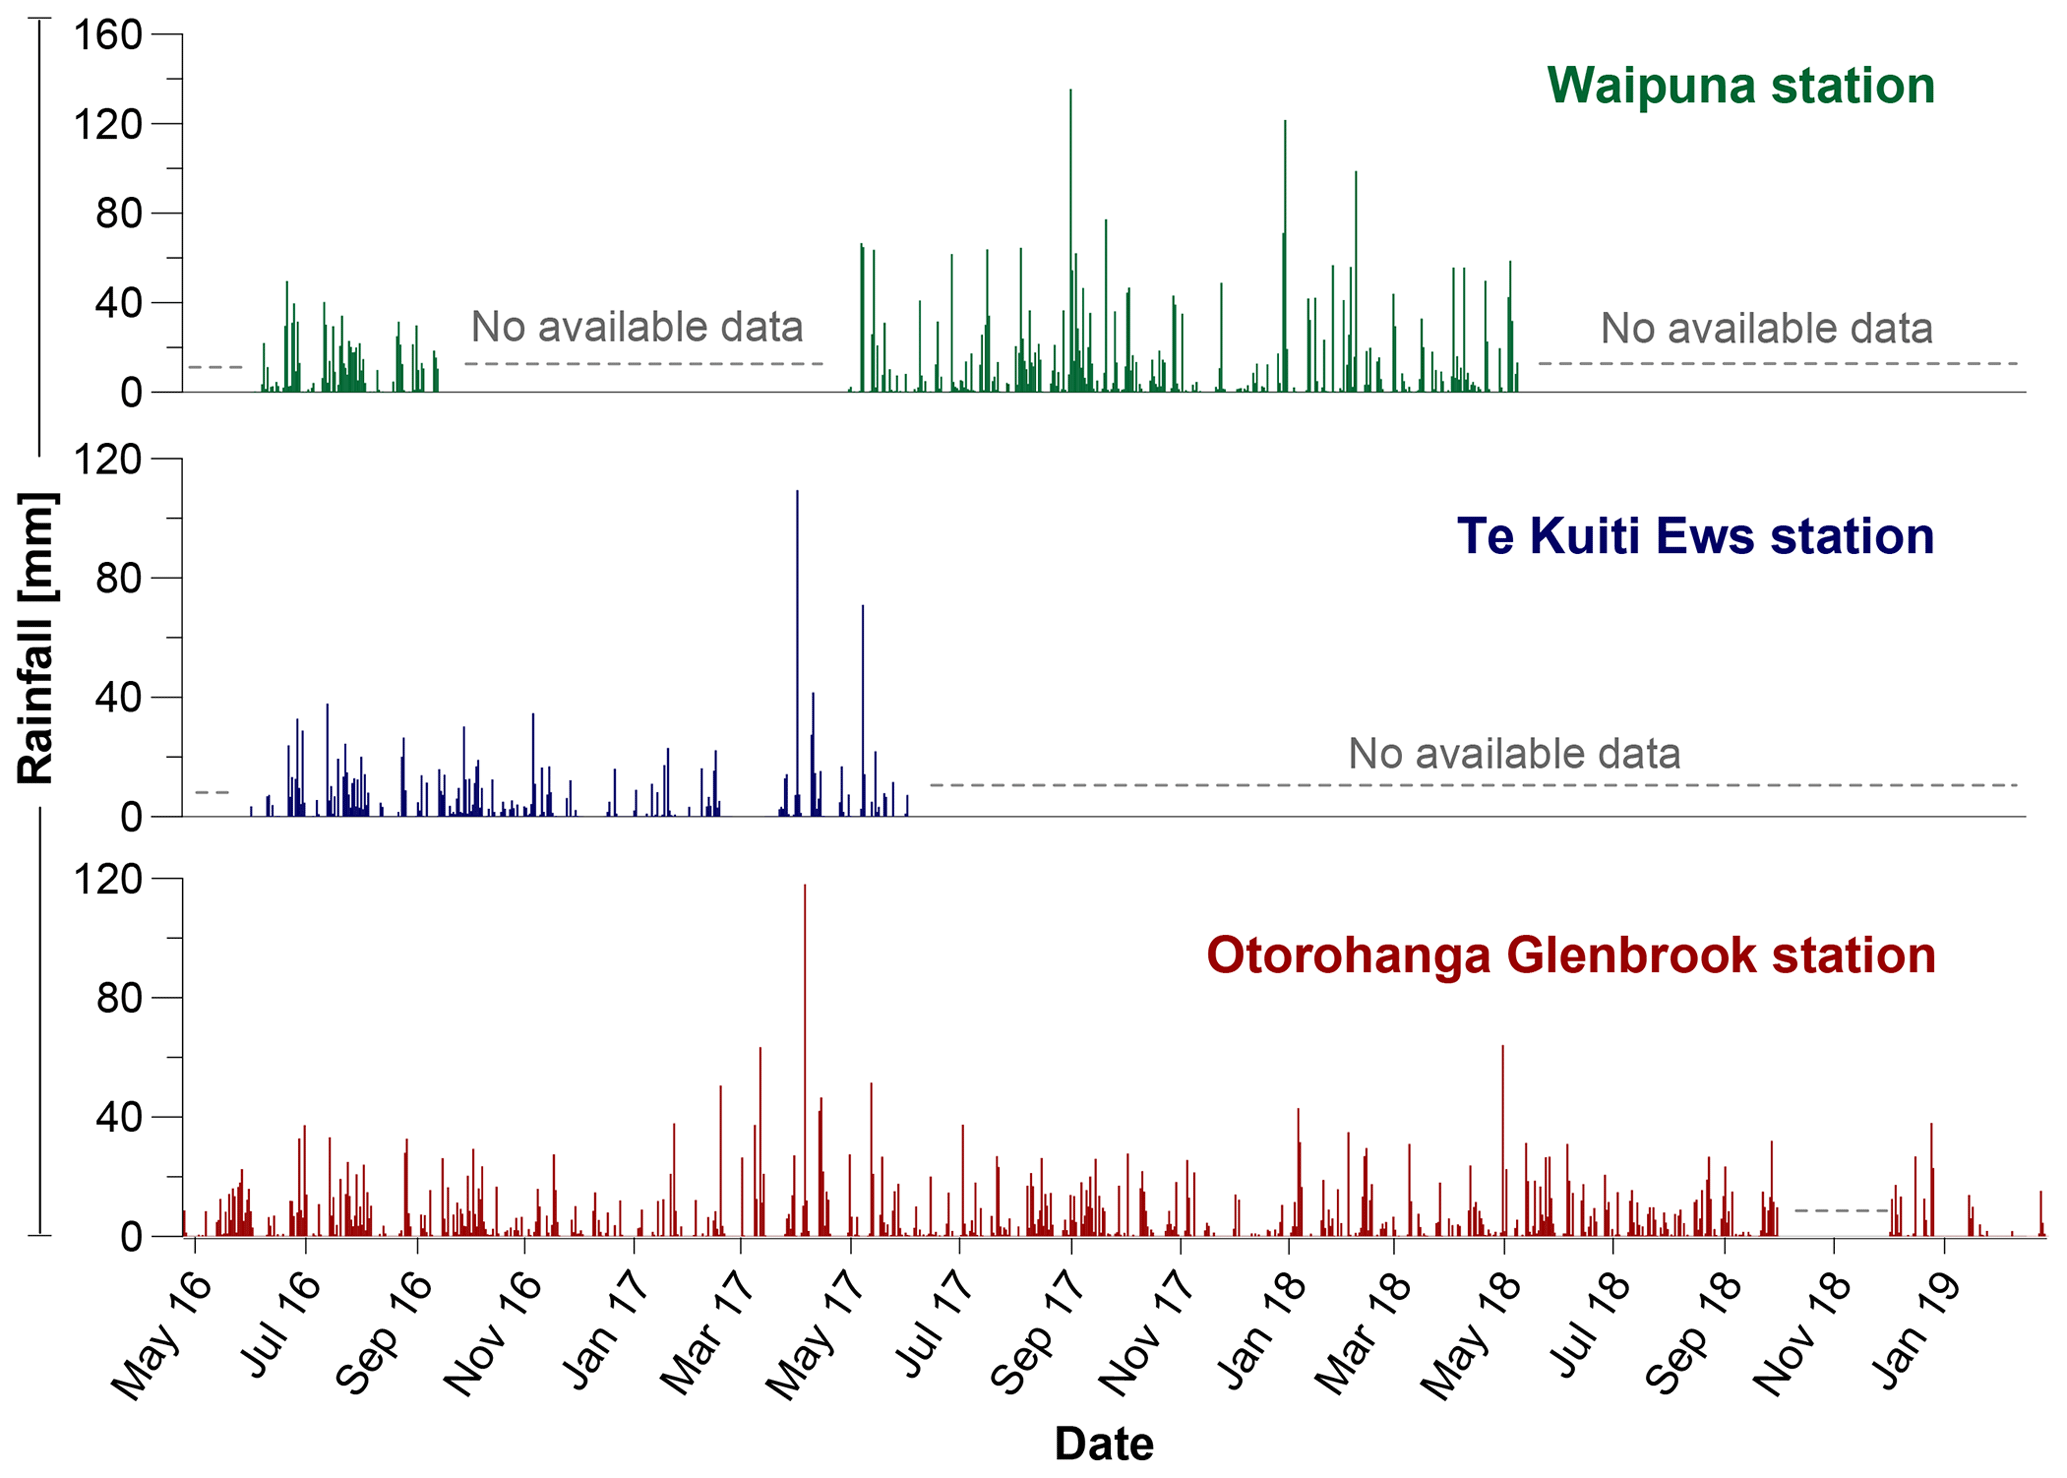
Figure 3Daily precipitation from the Waipuna meteorological station (no data are available for October and November 2018 due to instrument failure) and the Otorohanga Glenbrook and Te Kuiti Ews stations (data from NIWA National Climate Database, https://cliflo.niwa.co.nz/, last access: 26 June 2020).
The mean monthly surface conditions (2002–2019) from Te Kuiti Ews station are shown in Fig. 4. These comprise monthly mean rainfall, monthly mean temperature, potential evapotranspiration (PET), and effective rainfall (Peff), calculated as the difference between P and PET.

Figure 4Mean monthly temperature (red line), precipitation (blue line), and Priestley–Taylor potential evapotranspiration (PET) recorded at Te Kuiti Ews station between 2002 and 2019 (green line) (https://cliflo.niwa.co.nz/, last access: 26 June 2020) and the difference between rainfall and PET (purple line). The shaded blue area represents the effective rainfall (Peff).
4.2 Waipuna Cave hydrology
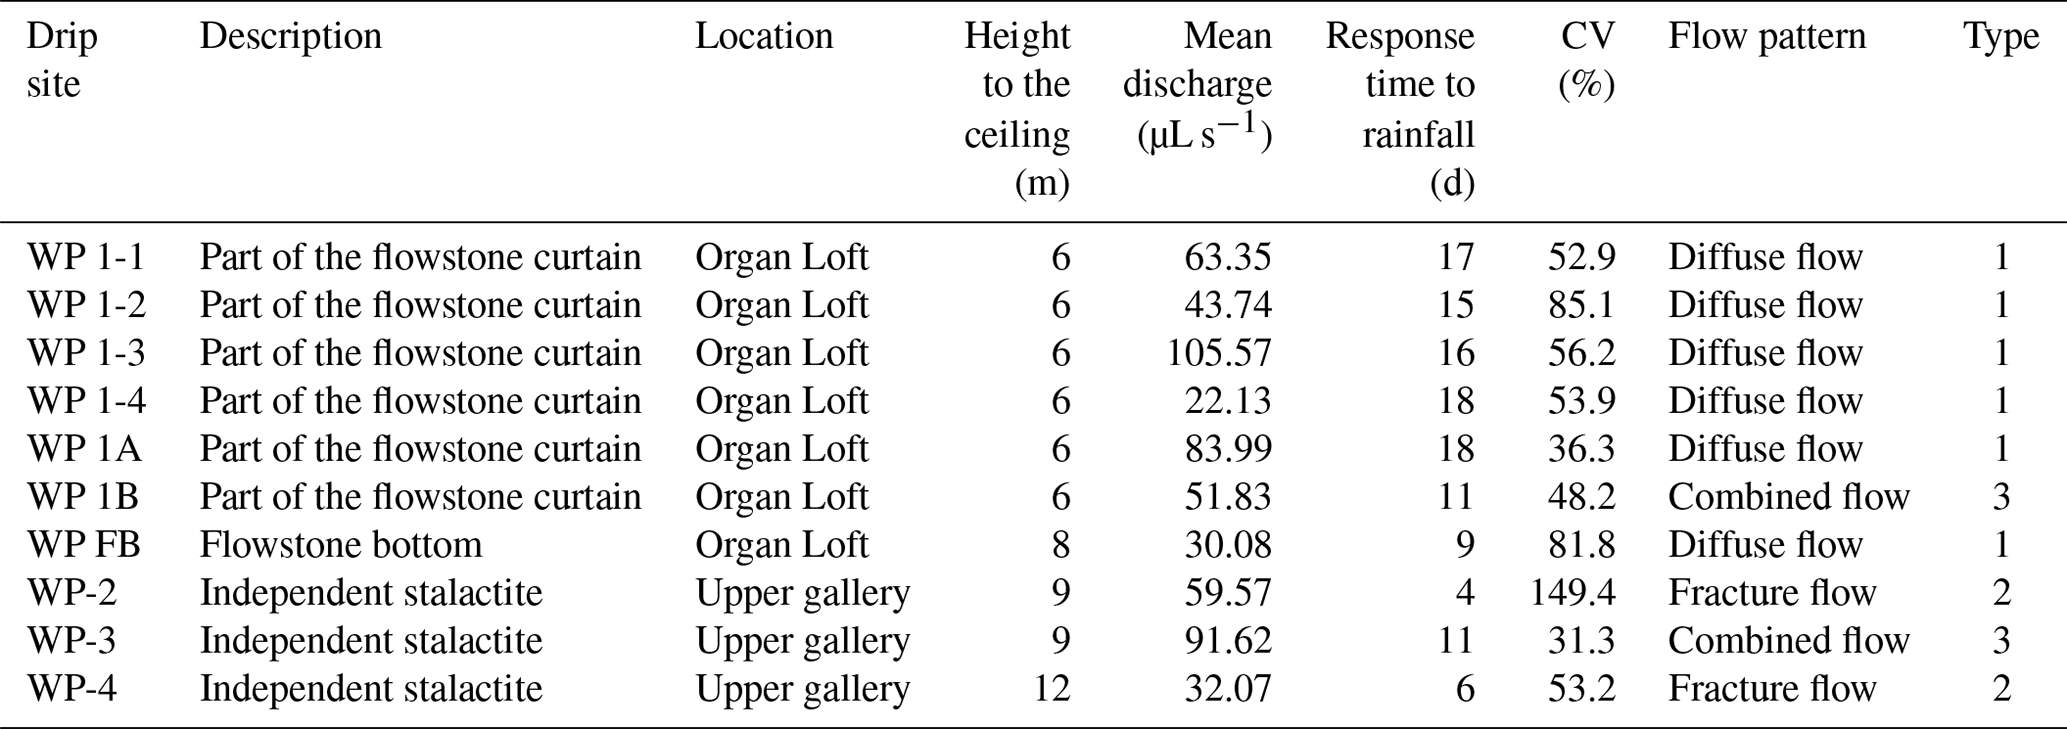
All drip sites were hydrologically active during the monitoring period, with variable mean discharges between 10.5 and 22.1 µL s−1. The CV of the drip sites varied between 31 % and 149 % (Table 1). Cross-correlation analysis between antecedent cumulative rainfall and drip rate time series from the acoustic drip loggers show different lag times for each drip. These are 19 d for WP 1-1, 15 d for WP 1-2, 16 d for WP 1-3, and 4 d for WP-2 (Table 1; Fig. 5). For some drip sites, where drip rates were only measured manually during the cave visits, the observed lags were 18 d for WP 1-4 and WP 1A, 11 d for WP 1B and WP-3, and 6 d for WP-4. Cluster analysis using manual and logger data reveals three main groups of drip sites based on 25 observations of discharge at each drip site with four common data points among them (Fig. 6). Based on the cluster analysis, we identified three flow types, defined hereafter as type 1, which includes drip sites with the slowest response to rainfall (WP 1-1, WP 1-2, WP 1-4, and WP-4); type 2, which isolates drip WP-2 with the fastest response to rainfall; and type 3, which includes drip sites WP 1-3 and WP-3 with intermediate response time to rainfall. For comparison we have also located the drip sites in the classification grid of Smart and Friederich (1987) (Fig. S2), which will be discussed in Sect. 5.1.
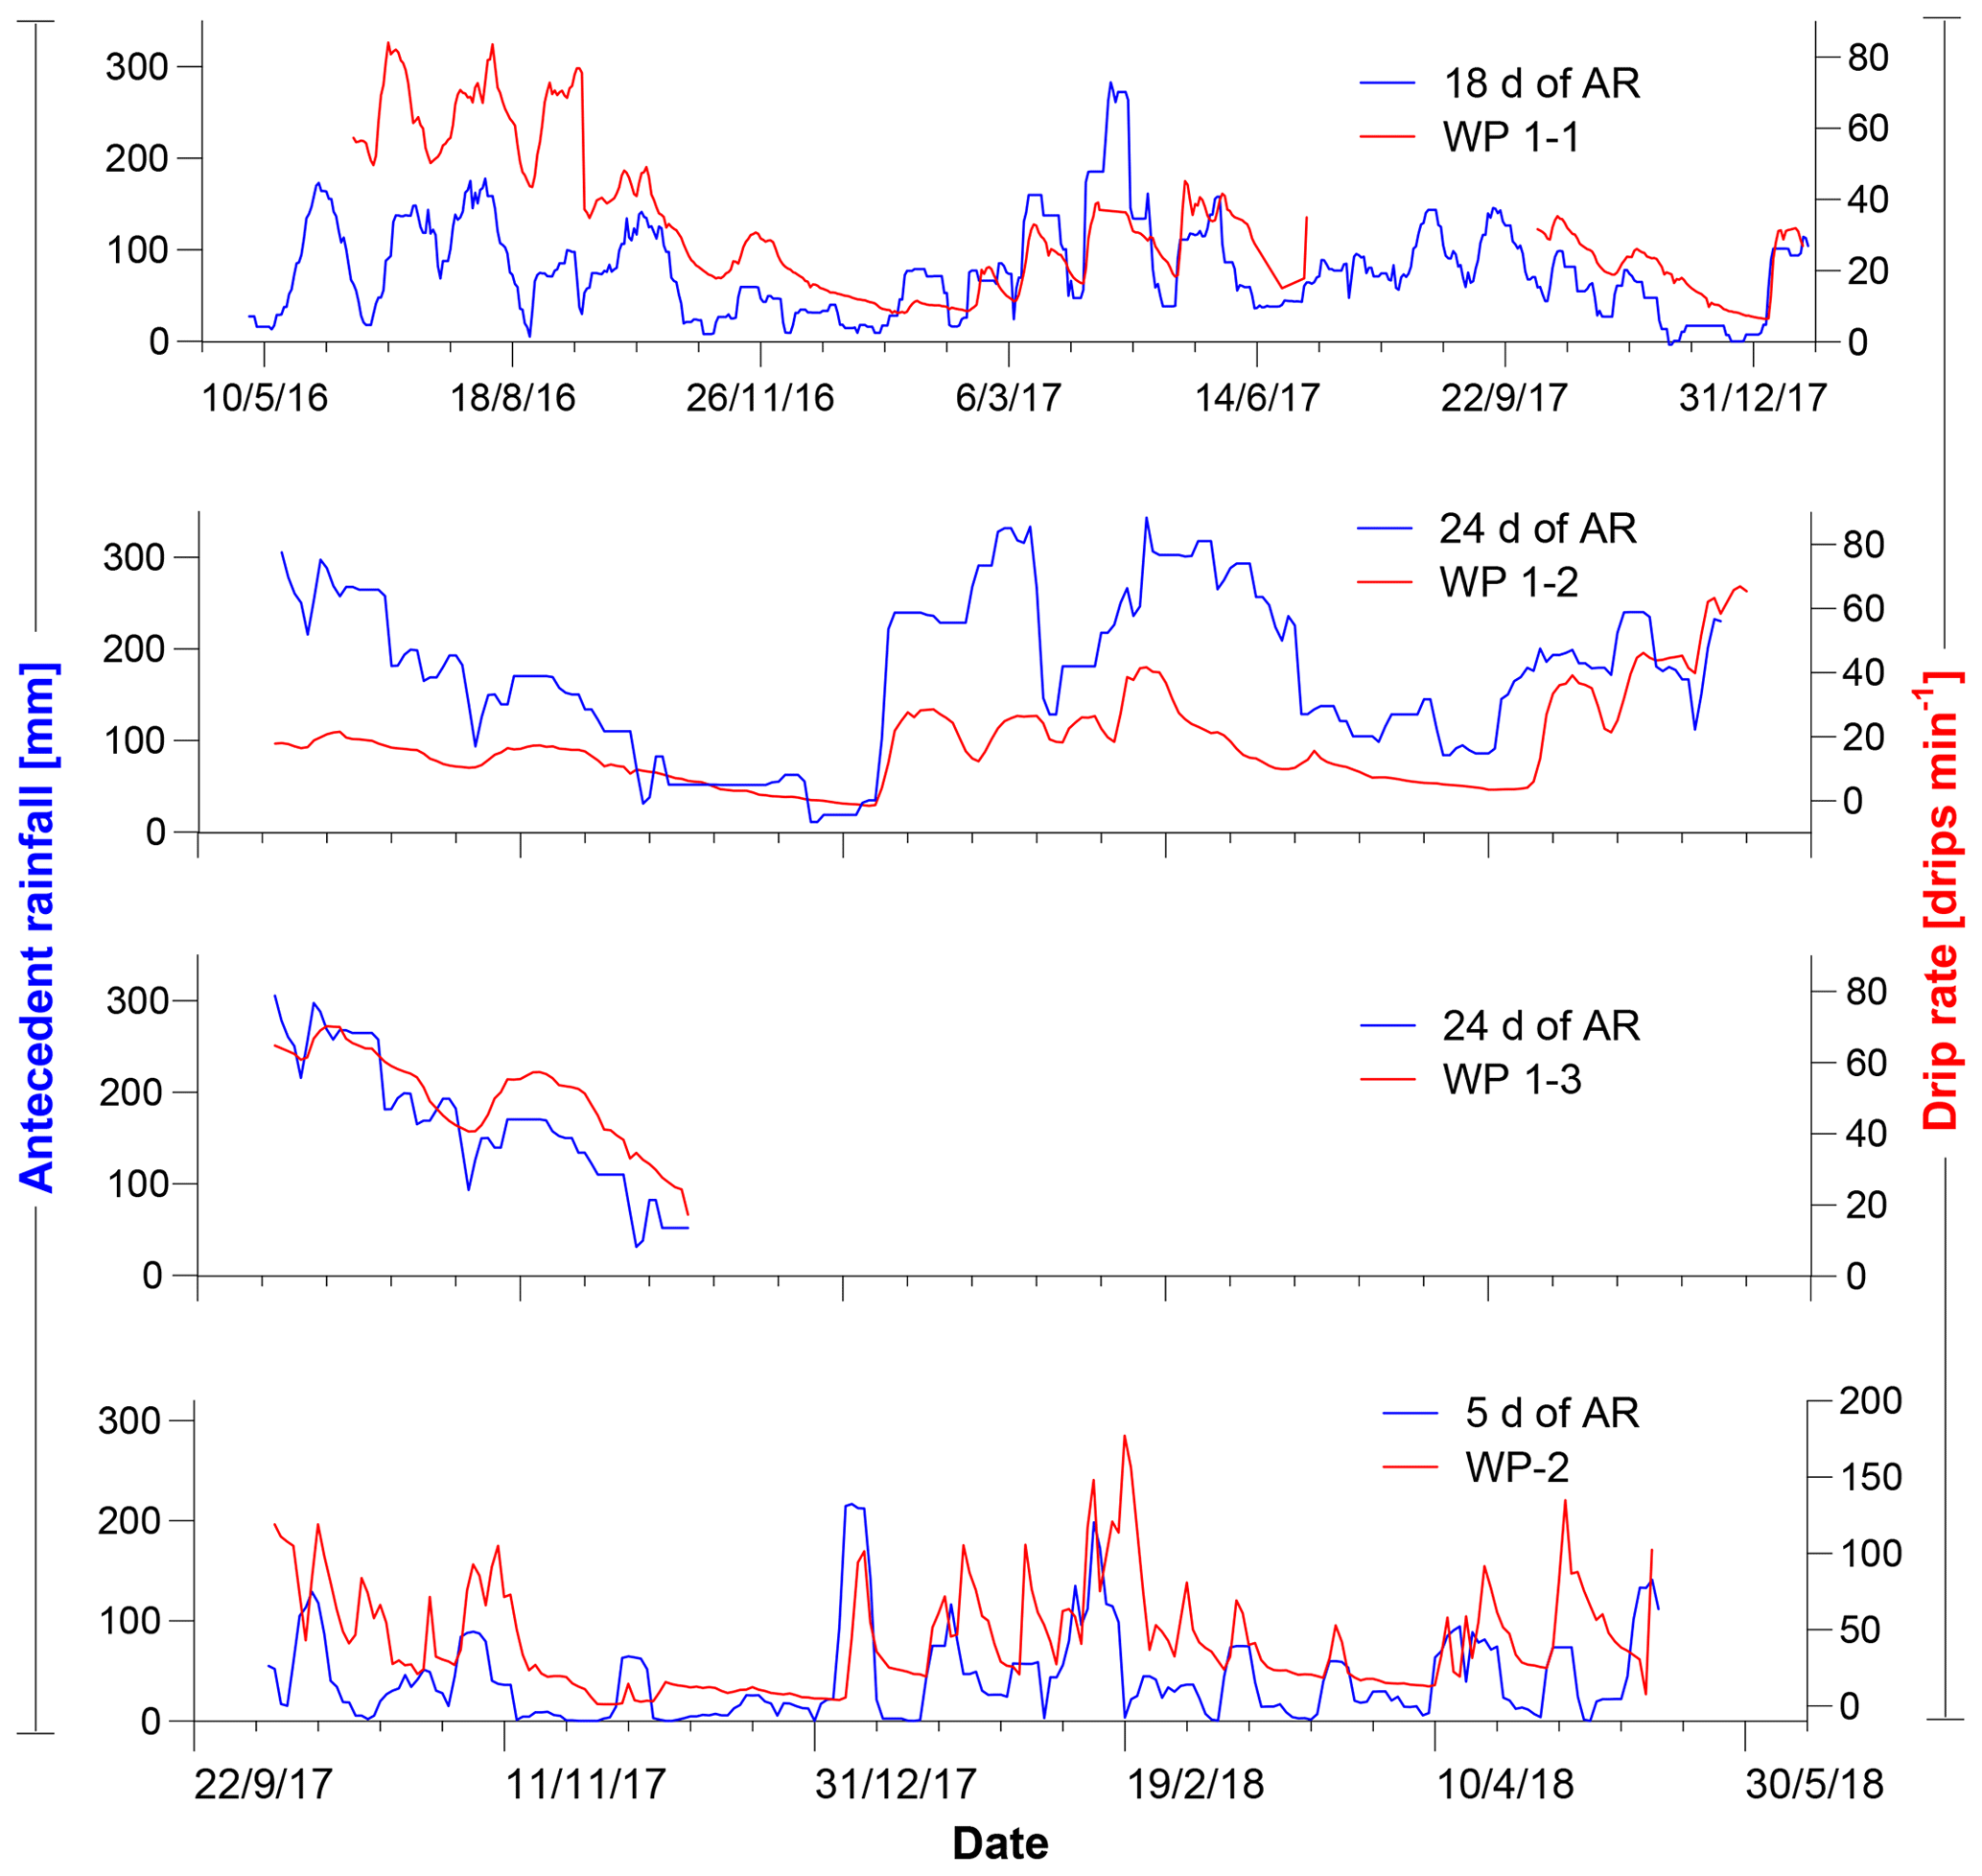
Figure 5Drip rates recorded by the loggers (red line) for the drip sites WP 1-1, WP 1-2, WP 1-3, and WP-2, plotted with their best fit of antecedent effective-rainfall days (blue). The date format in this figure is day/month/year.

Figure 6Results of cluster analysis of the drip site discharge time series, indicating the number of lag days calculated from the cross-correlation analysis. The grey cluster shows the drip site with the shortest lag to the antecedent rainfall (4 d); the blue cluster groups the drip sites with lag days between 11 and 16 d to antecedent rainfall; and the red cluster includes drip sites with a lag to antecedent rainfall between 15 and 24 d, with the exception of WP-4 (see main text).
Table 1Summary of drip site morphological characteristics, location in the cave, response time to antecedent rainfall (values in bold were calculated from the logger records, while the rest are from manual drip counts), coefficient of variation as a percentage (CV), and hydrological behaviour.
4.3 Isotope geochemistry
Drip water oxygen isotope values varied between −3.0 ‰ and −2.4 ‰ for δ17O, −5.8 ‰ and −5.2 ‰ for δ18O, and −32.7 ‰ and −28.3 ‰ for δD. The d-excess value ranged from 8.8 ‰ to 15.4 ‰ (Fig. S6). All drip water δ18O and δD values fall on the local meteoric water line (LMWL; ) as determined from rainwater samples from the Waikato region in the North Island (Fig. 7; Keller et al., 2014). A linear regression of all drip waters is expressed as . The very low intercept of −2.3 is the result of the very narrow range of the drip water cluster and is not related to secondary evaporation. The δ18O values of the cave stream are in the same range as the drip waters, but δD values are ∼20 ‰ higher (). The d-excess value of the stream water ranged from 9.4 ‰ to 15 ‰.
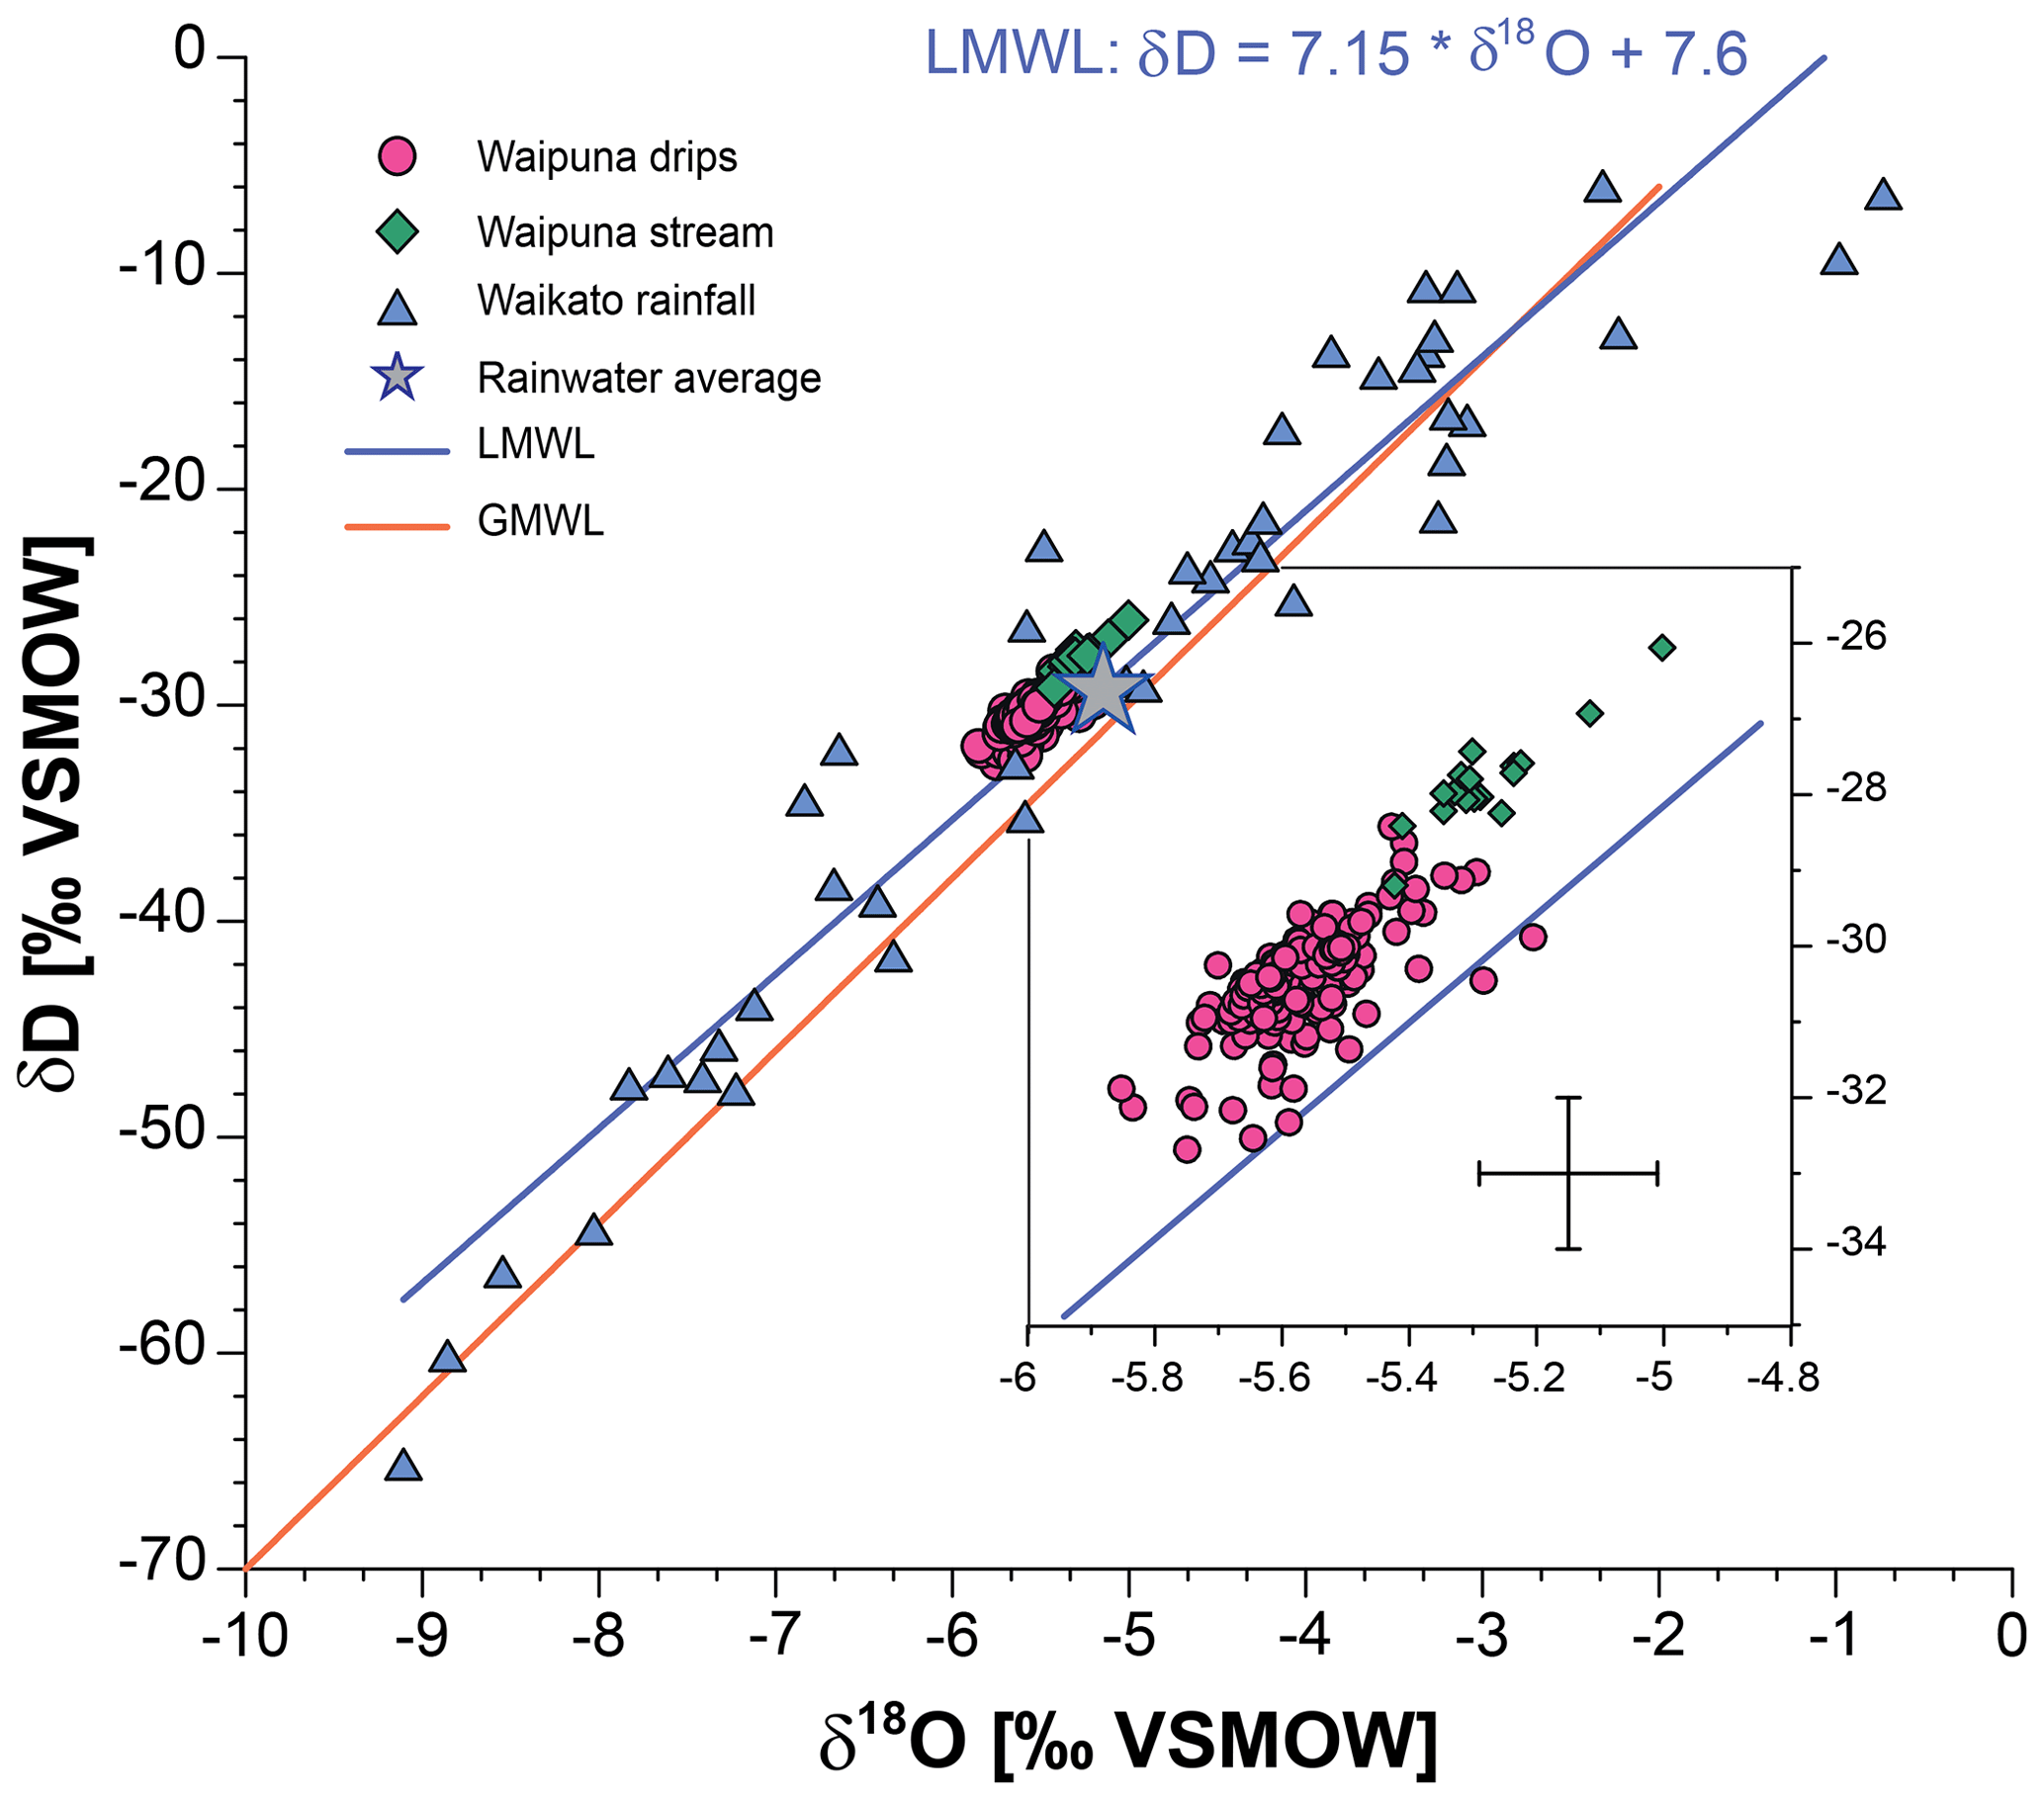
Figure 7Cross plot of δD versus δ18O in drip water (pink circles), the Waikato region precipitation (blue triangles), and Waipuna stream (green diamonds). All cave waters fall in a very narrow range (inset) and within error on the local meteoric water line (blue line; Keller et al., 2014). The cross in the inset shows the 2σ uncertainties for δ18O and δD.
All drip water δ17O and δ18O values fall close to the GMWL (Fig. S3), the equation for which is (Luz and Barkan, 2010). The mean δ17O deviation with respect to the GMWL (17Oexcess) in the drip water is 26±8 per meg, with the values ranging from 6 to 44 per meg. The 17Oexcess values of the cave stream were 25±4 per meg on average.
Between September 2016 and June 2017, drip sites WP 1-1, WP 1-2, WP 1-3, WP 1-4, WP 1A, and WP 1B showed low variability in drip water δ18O and δD, with ranges of 0.5 ‰ (−5.4 ‰ to −5.9 ‰) in δ18O and 3.9 ‰ (−28.8 ‰ to −32.7 ‰) in δD and mean values of ‰ (2σ) and ‰, respectively. Although small, this range is still greater than the analytical error of 0.16 ‰ and 1.4 ‰, respectively (Figs. 8b–c and S4). From July 2017 to January 2019 virtually no variability was observed in δ18O and δD (Figs. 8b–c and S4). The drip water δ18O and δD in that period have ranges of 0.3 ‰ (−5.4 ‰ to −5.7 ‰) in δ18O and 2.16 ‰ (−29.2 ‰ to −31.3 ‰) in δD, with mean values of ‰ (2σ) and ‰. This range is virtually at the analytical uncertainty level.
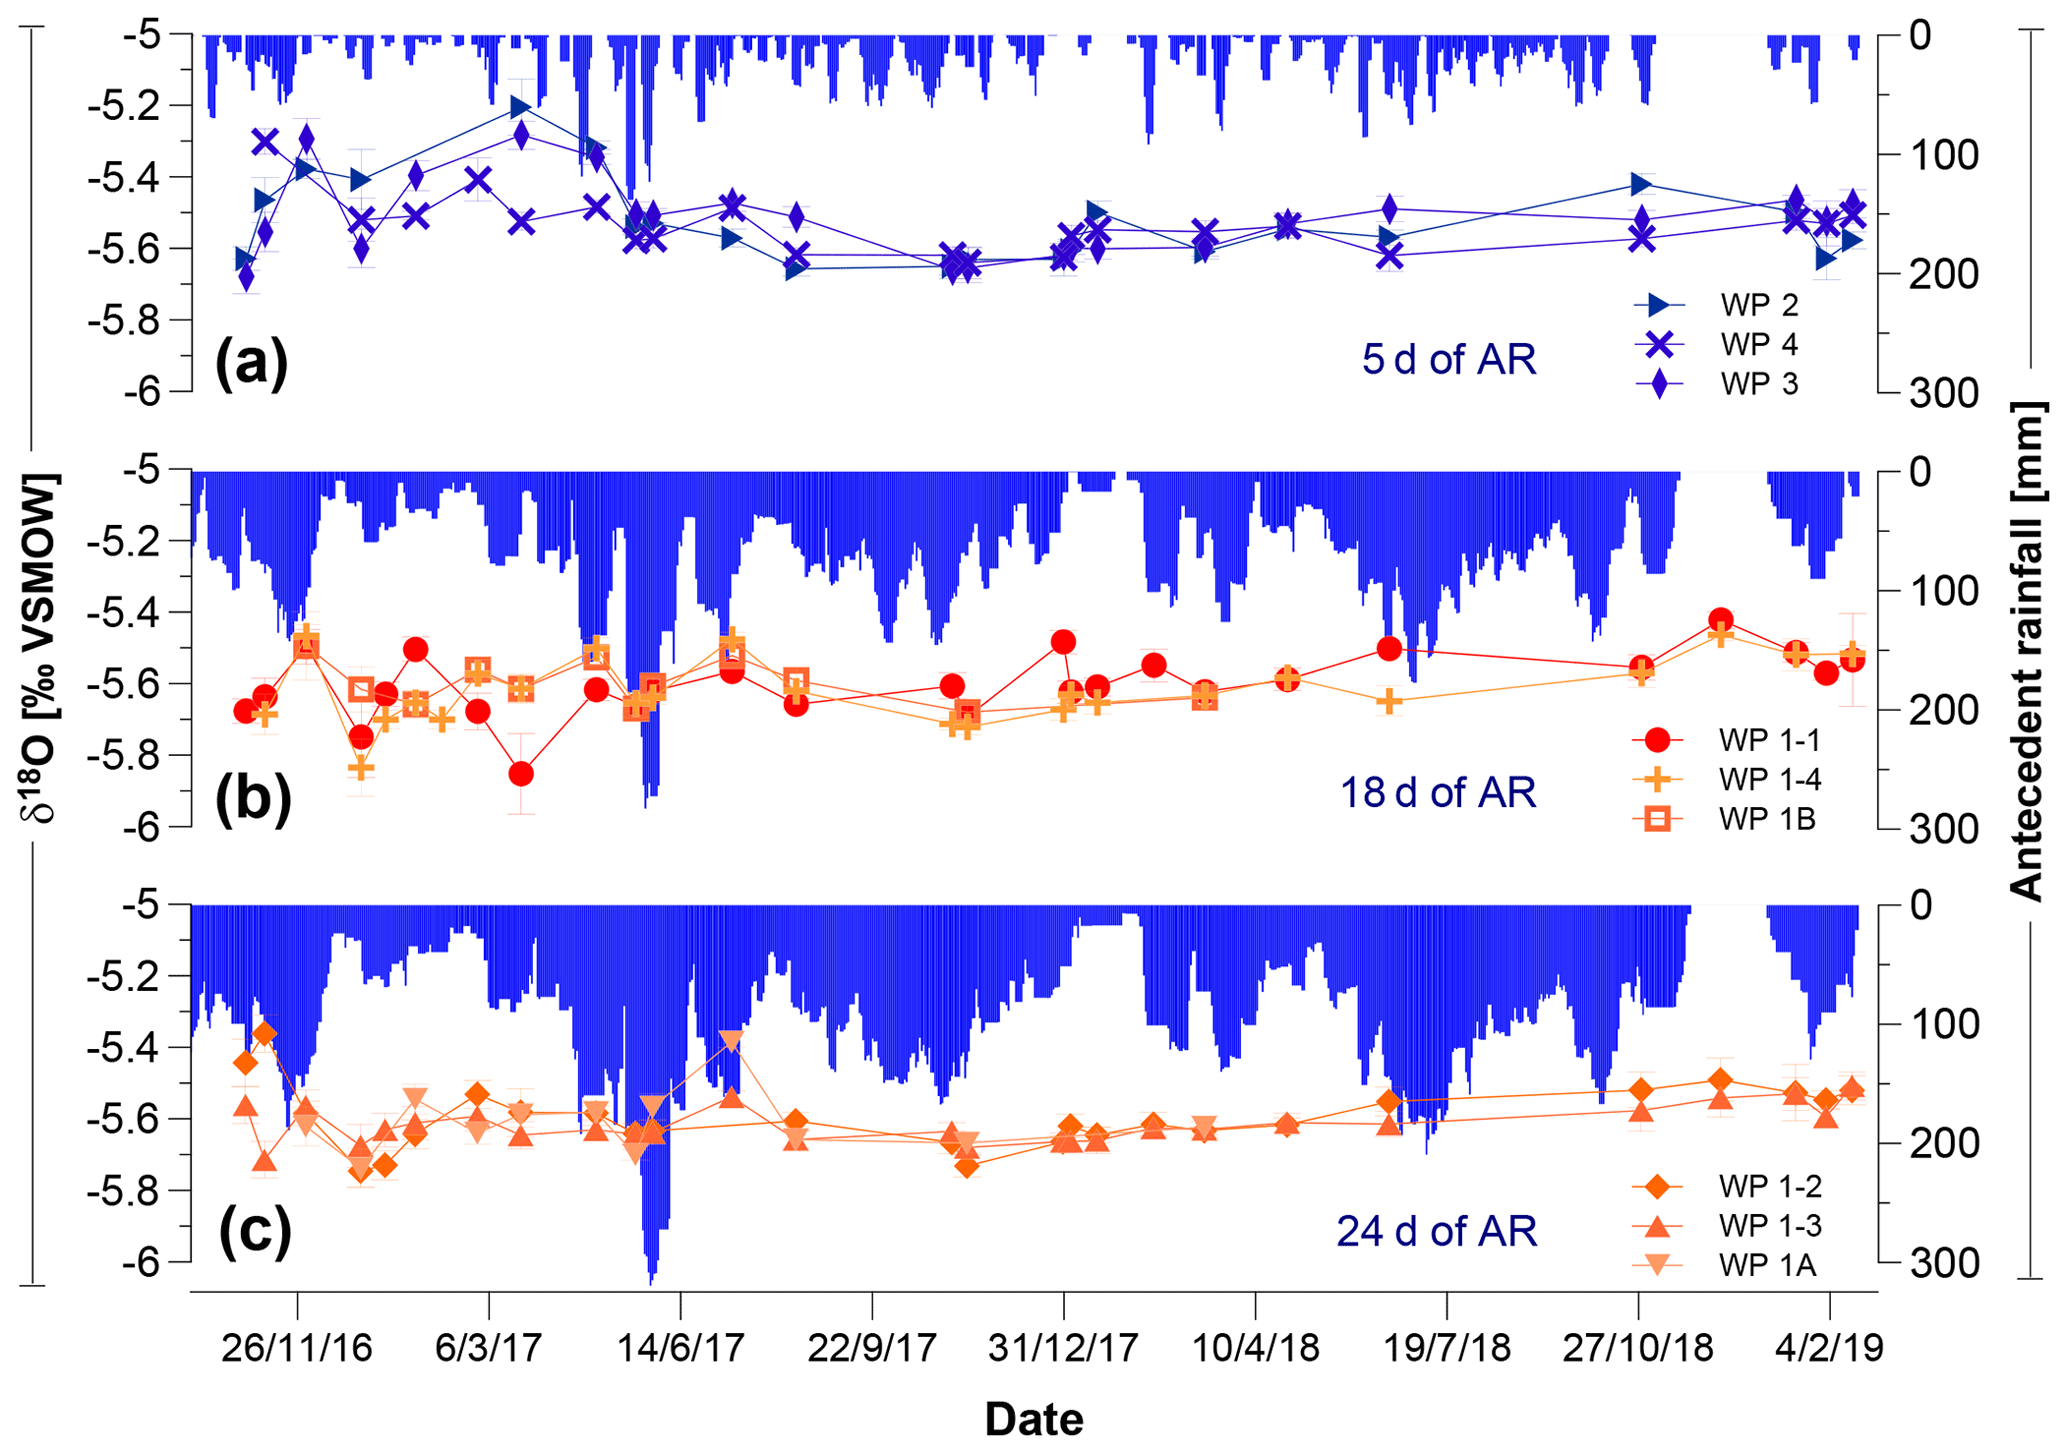
Figure 8Drip water δ18O time series of all drips grouped according to the three main response lags (5, 18, and 24 d) to antecedent rainfall (AR) at Otorohanga Glenbrook station (blue vertical bars). (a) Drip sites WP-2, WP-3, and WP-4 (5 d antecedent rainfall). (b) Drip sites from the flowstone curtain, WP 1-1, WP 1-4, and WP 1B (18 d antecedent rainfall). (c) Drip sites from the flowstone curtain, WP 1-2, WP 1-3, and WP 1A (24 d antecedent rainfall). The Otorohanga rainfall record covers the period between September 2016 and January 2019; no data are available for October and November 2018. The date format in this figure is day/month/year.
By contrast, the three drip sites with the shortest lags, WP-2, WP-3, and WP-4, exhibit higher variability in δ18O and δD. In particular, sites WP-2 and WP-3 show a marked increase (0.5 ‰) in δ18O between December 2016 and January 2017 (Fig. 8a). δ17O varies in the same way as δ18O (Fig. S5).
4.4 Drip water major and trace elements
Here we report elemental composition data for those components typically influenced by PCP, i.e. Ca concentration (Fairchild et al., 2000) and Mg∕Ca and Sr∕Ca ratios (Tremaine et al., 2016). Drip water Ca concentrations range from 0.7 to 2.2 mol L−1; Mg∕Ca varied from 17.7 to 66.5; and Sr∕Ca varied from 0.24 to 1.11 (mmol mol−1). All drip sites show a strong positive correlation between Mg∕Ca and Sr∕Ca ratios, with coefficients of determination varying from 0.68 to 0.9 (Fig. 10b). The two different trends observed in the relationship between Mg∕Ca and Sr∕Ca ratios will be discussed in Sect. 5.5. The temporal variability of the Mg∕Ca and Sr∕Ca ratios shows three noticeable peaks for all drip sites during the summers of 2017 (February), 2018 (January), and 2019 after the previously reduced effective rainfall. Drip waters collected during late summer (January–February) generally had higher Mg∕Ca and Sr∕Ca ratios and lower Ca concentrations, while samples collected in winter (July–August) had the lowest Mg∕Ca and Sr∕Ca ratios and the highest Ca concentrations (Figs. 11 and S7).

Figure 9Drip water 17Oexcess time series of all drips grouped according to the three main response lags (5, 18, and 24 d) to antecedent rainfall (AR) at Otorohanga Glenbrook station (blue vertical bars). (a) Drip sites WP-2, WP-3, and WP-4 (5 d antecedent rainfall). (b) Drip sites from the flowstone curtain, WP 1-1, WP 1-4, and WP 1B (18 d antecedent rainfall). (c) Drip sites from the flowstone curtain, WP 1-2, WP 1-3, and WP 1A (24 d antecedent rainfall). The Otorohanga rainfall record covers the period between September 2016 and January 2019; no data are available for October and November 2018. The date format in this figure is day/month/year.

Figure 10Waipuna Cave drip waters sampled during the monitoring period October 2016 to January 2019. (a) Ca concentration versus Mg∕Ca ratios. (b) Mg∕Ca versus Sr∕Ca; R2=0.82, p<0.001. The orange symbols correspond to diffuse flow drip sites and blue symbols signify fracture flow drip sites. The two different trends evident in the relationship between Mg∕Ca and Sr∕Ca will be discussed in Sect. 5.5.
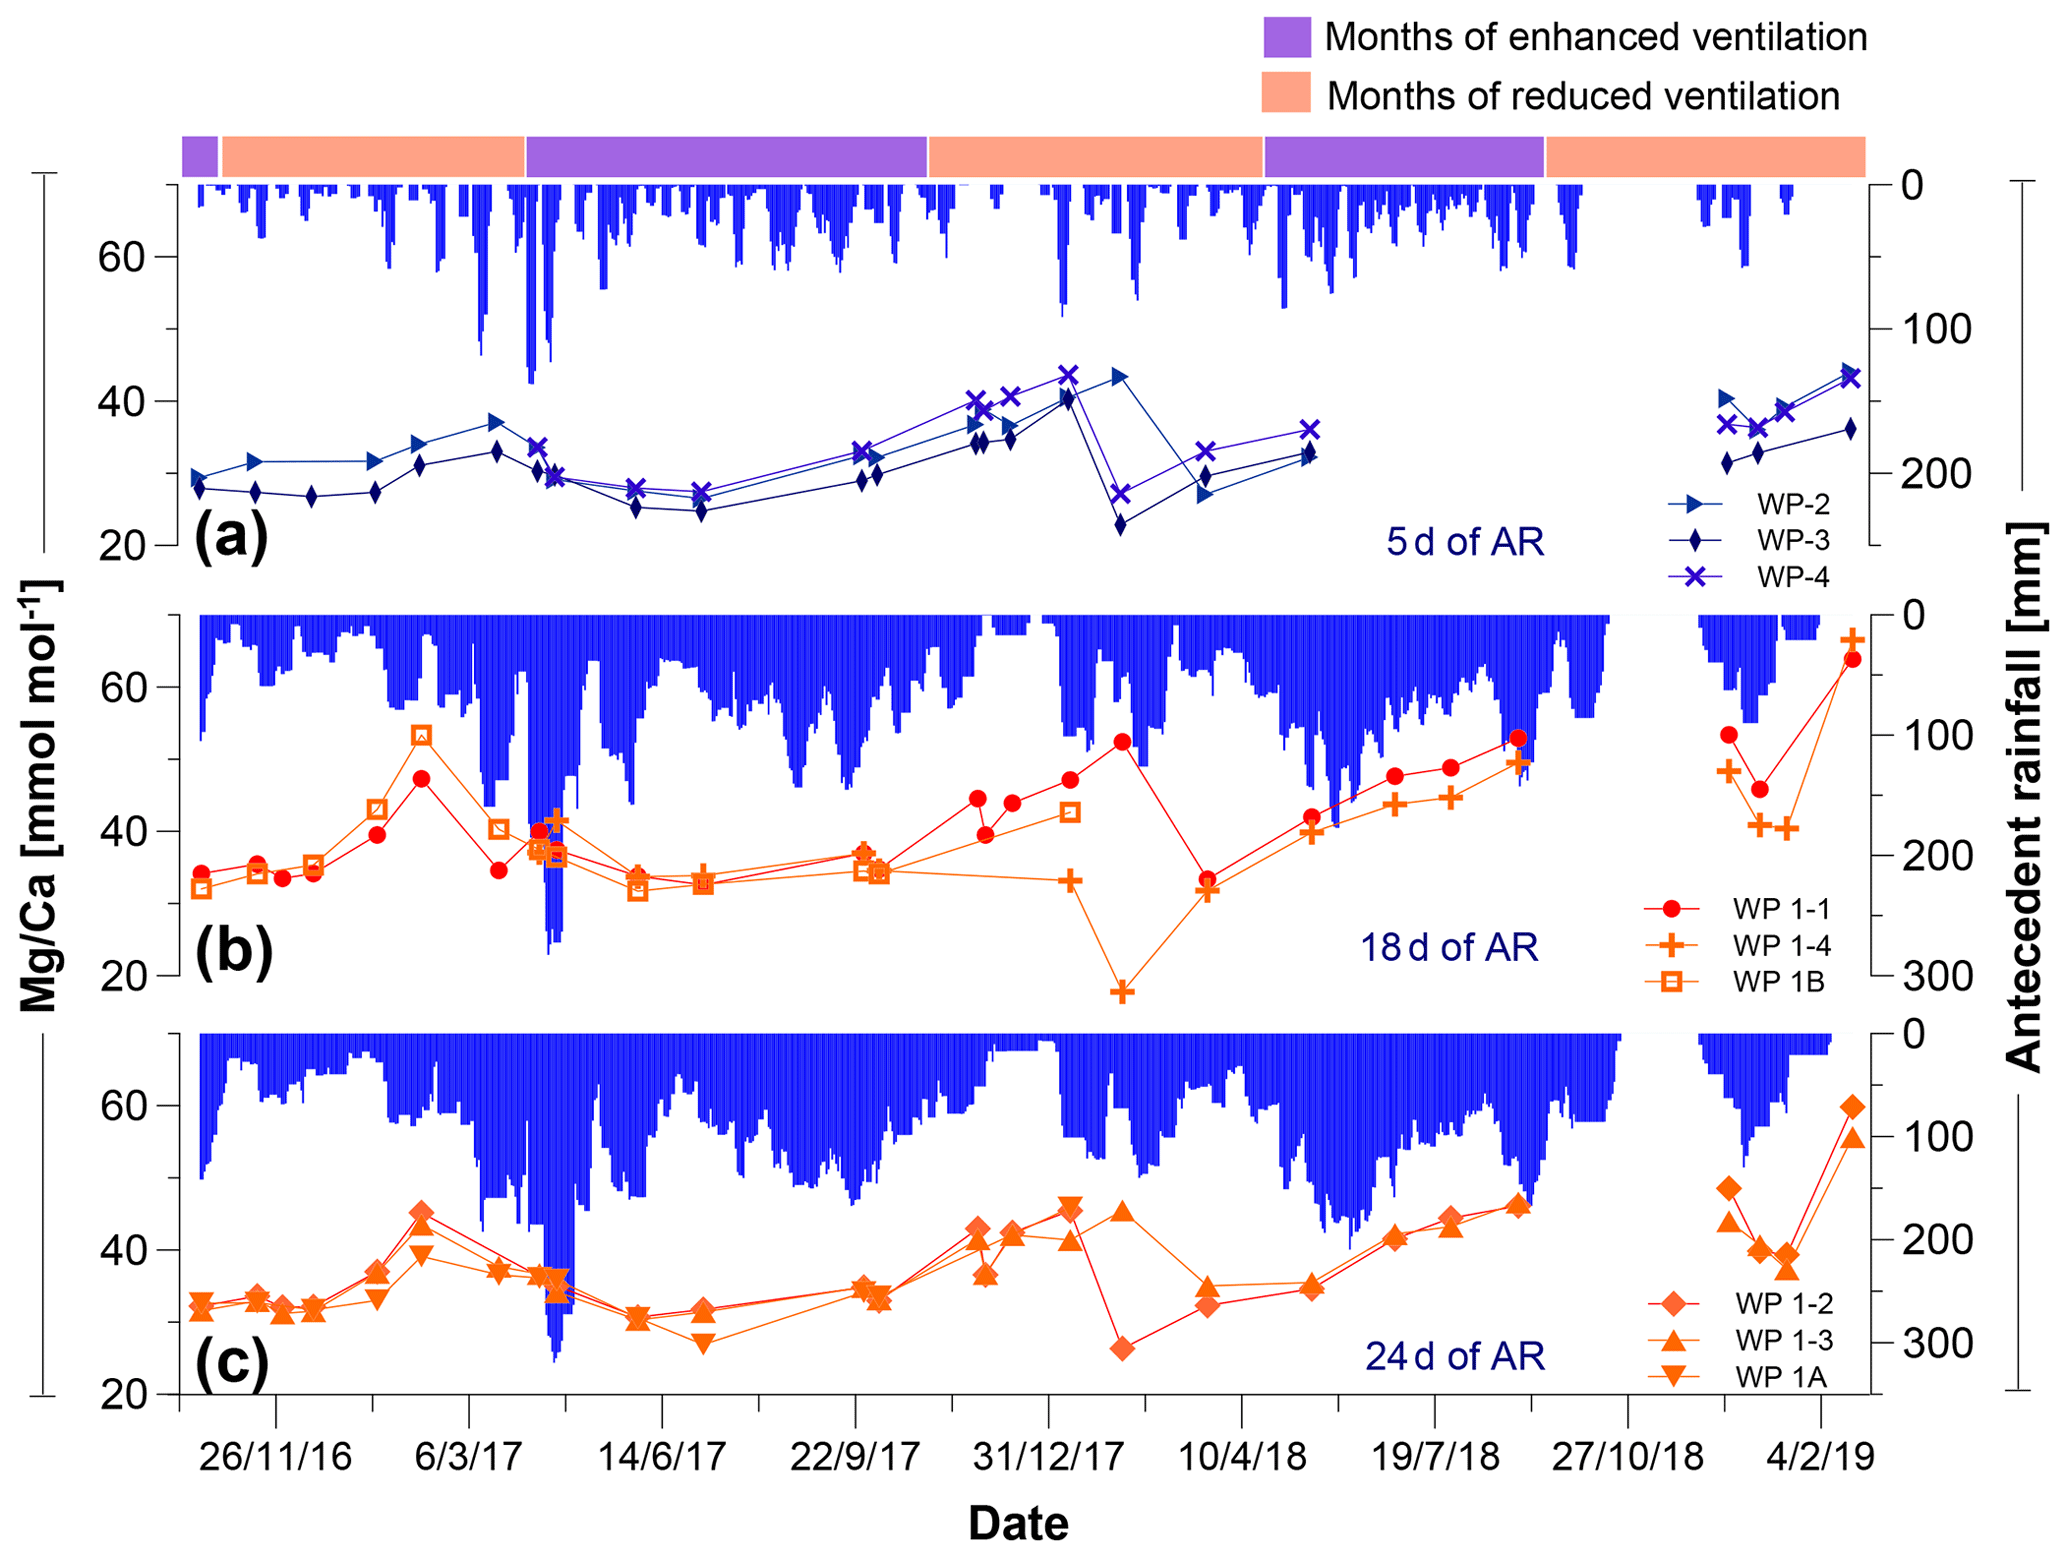
Figure 11Drip water Mg∕Ca ratios time series of all drips grouped according to the three main response lags (5, 18, and 24 d) to antecedent rainfall (AR) at Otorohanga Glenbrook station (blue vertical bars). (a) Drip sites WP-2, WP-3, and WP-4 (5 d antecedent rainfall). (b) Drip sites from the flowstone curtain, WP 1-1, WP 1-4, and WP 1B (18 d antecedent rainfall). (c) Drip sites from the flowstone curtain, WP 1-2, WP 1-3, and WP 1A (24 d antecedent rainfall). The Otorohanga rainfall record covers the period between September 2016 and January 2019; no data are available for October and November 2018. The date format in this figure is day/month/year.
4.5 Cave air temperature and CO2
Daily cave air temperature in the Organ Loft chamber recorded between June 2017 and May 2018 varied between 7.4 and 11.7 ∘C (mean 10.4 ∘C; Fig. 12a and b), with the highest temperatures measured in summer (February and March) and the lowest temperatures in winter (July and August). The air temperature logger at the Waipuna Cave meteorological station recorded temperatures between −0.6 and 29.3 ∘C. The temperature difference (ΔT) between Waipuna Cave air and the external air shows an annual cycle (Fig. 12c), ranging from −22 to 8.3 ∘C, with a mean of −2.1 ∘C. The largest negative ΔT values occurred from late spring in November 2017 to early autumn in April 2017 owing to the marked increase in external temperature.
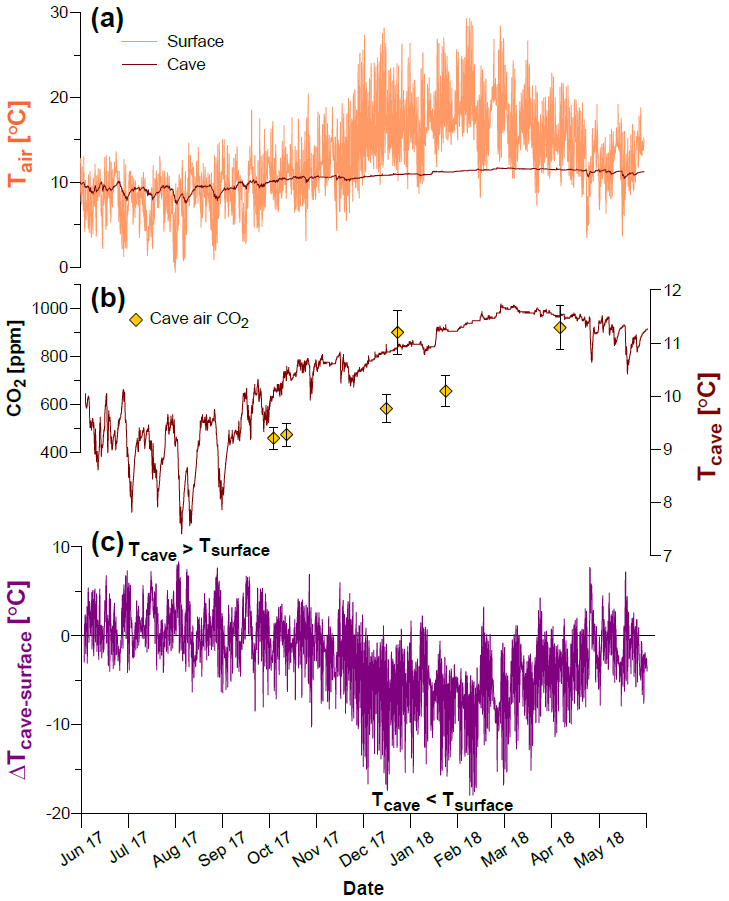
Figure 12Comparison of meteorological parameters. (a) Daily mean air temperature at Waipuna station and in Waipuna Cave (in the Organ Loft chamber). (b) Manual cave air CO2 concentrations and daily mean air temperature in the Organ Loft chamber. (c) Calculated temperature difference ΔT between cave air and surface air from June to May 2018. During winter, the cave is warmer, and during summer, the cave is colder compared to the surface air.
Cave air pCO2 varied from a minimum of 438 ppm in September 2016 to a maximum of 930 ppm recorded in March 2019 (Fig. 12b). Cave air pCO2 is positively correlated with cave air temperature (R2=0.67, p=0.045). The highest air pCO2 values are registered when cave air temperature reaches its maximum in summer and decrease when cave air temperature is lowest in winter (see the discussion in Sect. 5.4).
This work aims at evaluating the hydrochemical response of Waipuna Cave to environmental dynamics and to test its suitability for speleothem-based palaeo-climate reconstructions. We explore the links between the physiochemical parameters measured in Waipuna Cave and rainfall and temperature changes at seasonal to inter-annual timescales. Our results show that Waipuna Cave reflects the external environmental dynamics on inter-annual timescales. The results and interpretation of monitoring data constitute a solid platform for the interpretation of speleothem-based reconstructions that are ongoing.
5.1 Waipuna Cave hydrology
The meteorological data from the Otorohanga Glenbrook and Te Kuiti Ews stations are considered suitable for evaluating the Waipuna Cave monitoring data, given the rainfall patterns are similar to those at Waipuna. The monitored drip sites in Waipuna Cave are highly sensitive to rainfall variability, demonstrating the permeability of the overlying soil and the relatively thin bedrock overburden.
Our results indicate that the monitored drip sites respond to three different infiltration pathways: (i) type 1 – diffuse flow, (ii) type 2 – fracture flow, and (iii) type 3 – combined flow. Type 1 drips WP 1-1, WP 1-2, WP 1-4, and WP 1A show the slowest response to rainfall (lagging between 11 and 19 d). These drips belong to the Organ Loft curtain, which strongly supports the hypothesis that these sites are hydrologically connected to each other. Given that the curtain is part of the continuum from the ceiling to the floor (ca. 6 m height), it is likely that all its drip sites are mainly fed by diffuse flow through the limestone matrix, which is a function of the primary porosity of the karst (Bradley et al., 2010). Type 2 is represented by drip sites WP-2 and WP-4, which are located in the upper gallery of the Organ Loft with a higher ceiling. These drips have a faster response (4 to 6 d) to antecedent rainfall, suggesting that these drips are controlled mainly by fracture flow. This is consistent with the clear identification of zones of structural weakness along the ceiling (physically representing fault- or joint-like structures) and the shorter vadose flow path at these locations. The cross-correlation of the antecedent rainfall and the drip rates agrees with the cluster output for all drip sites except drip site WP-4, which has a response time of 4 d but clusters with the group of drip sites with a lag of 18 to 24 d. This can be explained by the limited size of the dataset: the drip rates of WP-4 were measured only manually, thus limiting the input for the cluster analysis compared to drip sites monitored with loggers. Finally, we grouped WP 1-3 and WP-3 into flow type 3 because these two drip sites have similar intermediate response rates to rainfall (11 d), independent of their location in the Organ Loft chamber, which is in the ceiling of the upper gallery for WP-3 and the flowstone curtain for WP 1-3. It is likely that these drips are fed by a combination of fracture and matrix flow (Mahmud et al., 2018).
Although the response time varies from days to 2–3 weeks, all drip sites forming stalagmites and feeding the flowstone reflect precipitation dynamics at a sub-annual scale. The three types of drip discharge in Waipuna Cave do not satisfactorily fit into the classification model of Smart and Friederich (1987), which locates drip sites WP 1A, WP 1B, and WP-3 fall in the seepage flow and sites WP 1-1, WP 1-2, WP 1-3, WP 1-4, WP FB, WP-4, and WP-2 in the fracture flow range (Fig. S2).
5.2 Rainwater isotope geochemistry
The distribution of the rainwater oxygen and hydrogen isotopes along the LMWL (Fig. 7) does not reveal a clear seasonal pattern. However, when comparing rainfall δ18O values with the amount of precipitation across the entire monitoring period (Fig. 13, black line), we observe a positive relationship (R2=0.56, ). The strongest correlations between rainfall amount and δ18O values are observed in austral spring and summer (R2=0.68, p=0.0002 and R2=0.89, p=0.0001, respectively) when temperature is highest in the Waikato area (Fig. 13, green and orange lines). Among the various climatic and geographical effects on the isotopic composition of rainwater, the “amount effect” has been shown to significantly influence rainwater δ18O in sub-tropical regions. The amount effect is the empirical negative correlation between rainfall amount and rainwater δ18O (Dansgaard, 1964) which arises from the partial re-evaporation and thus isotopic enrichment of rain droplets falling through relatively dry air below cloud level during periods of reduced precipitation (Dansgaard, 1964; Risi et al., 2008; Lachniet, 2009; Breitenbach et al., 2010). This process affects the isotopic signature in rainfall observed in the Waitomo region in spring and summer but not during the winter season when re-evaporation from falling rain is minimal due to high relative humidity (this is reflected in lower R2 value samples from April to September; Fig. 13). In the wet season, rain droplets are less affected by re-evaporation and remain unaltered with respect to δ18O. These observations suggest that regional atmospheric conditions, associated with ENSO dynamics or the strength of the Westerlies, can impose their signature on the isotopic composition of precipitation.
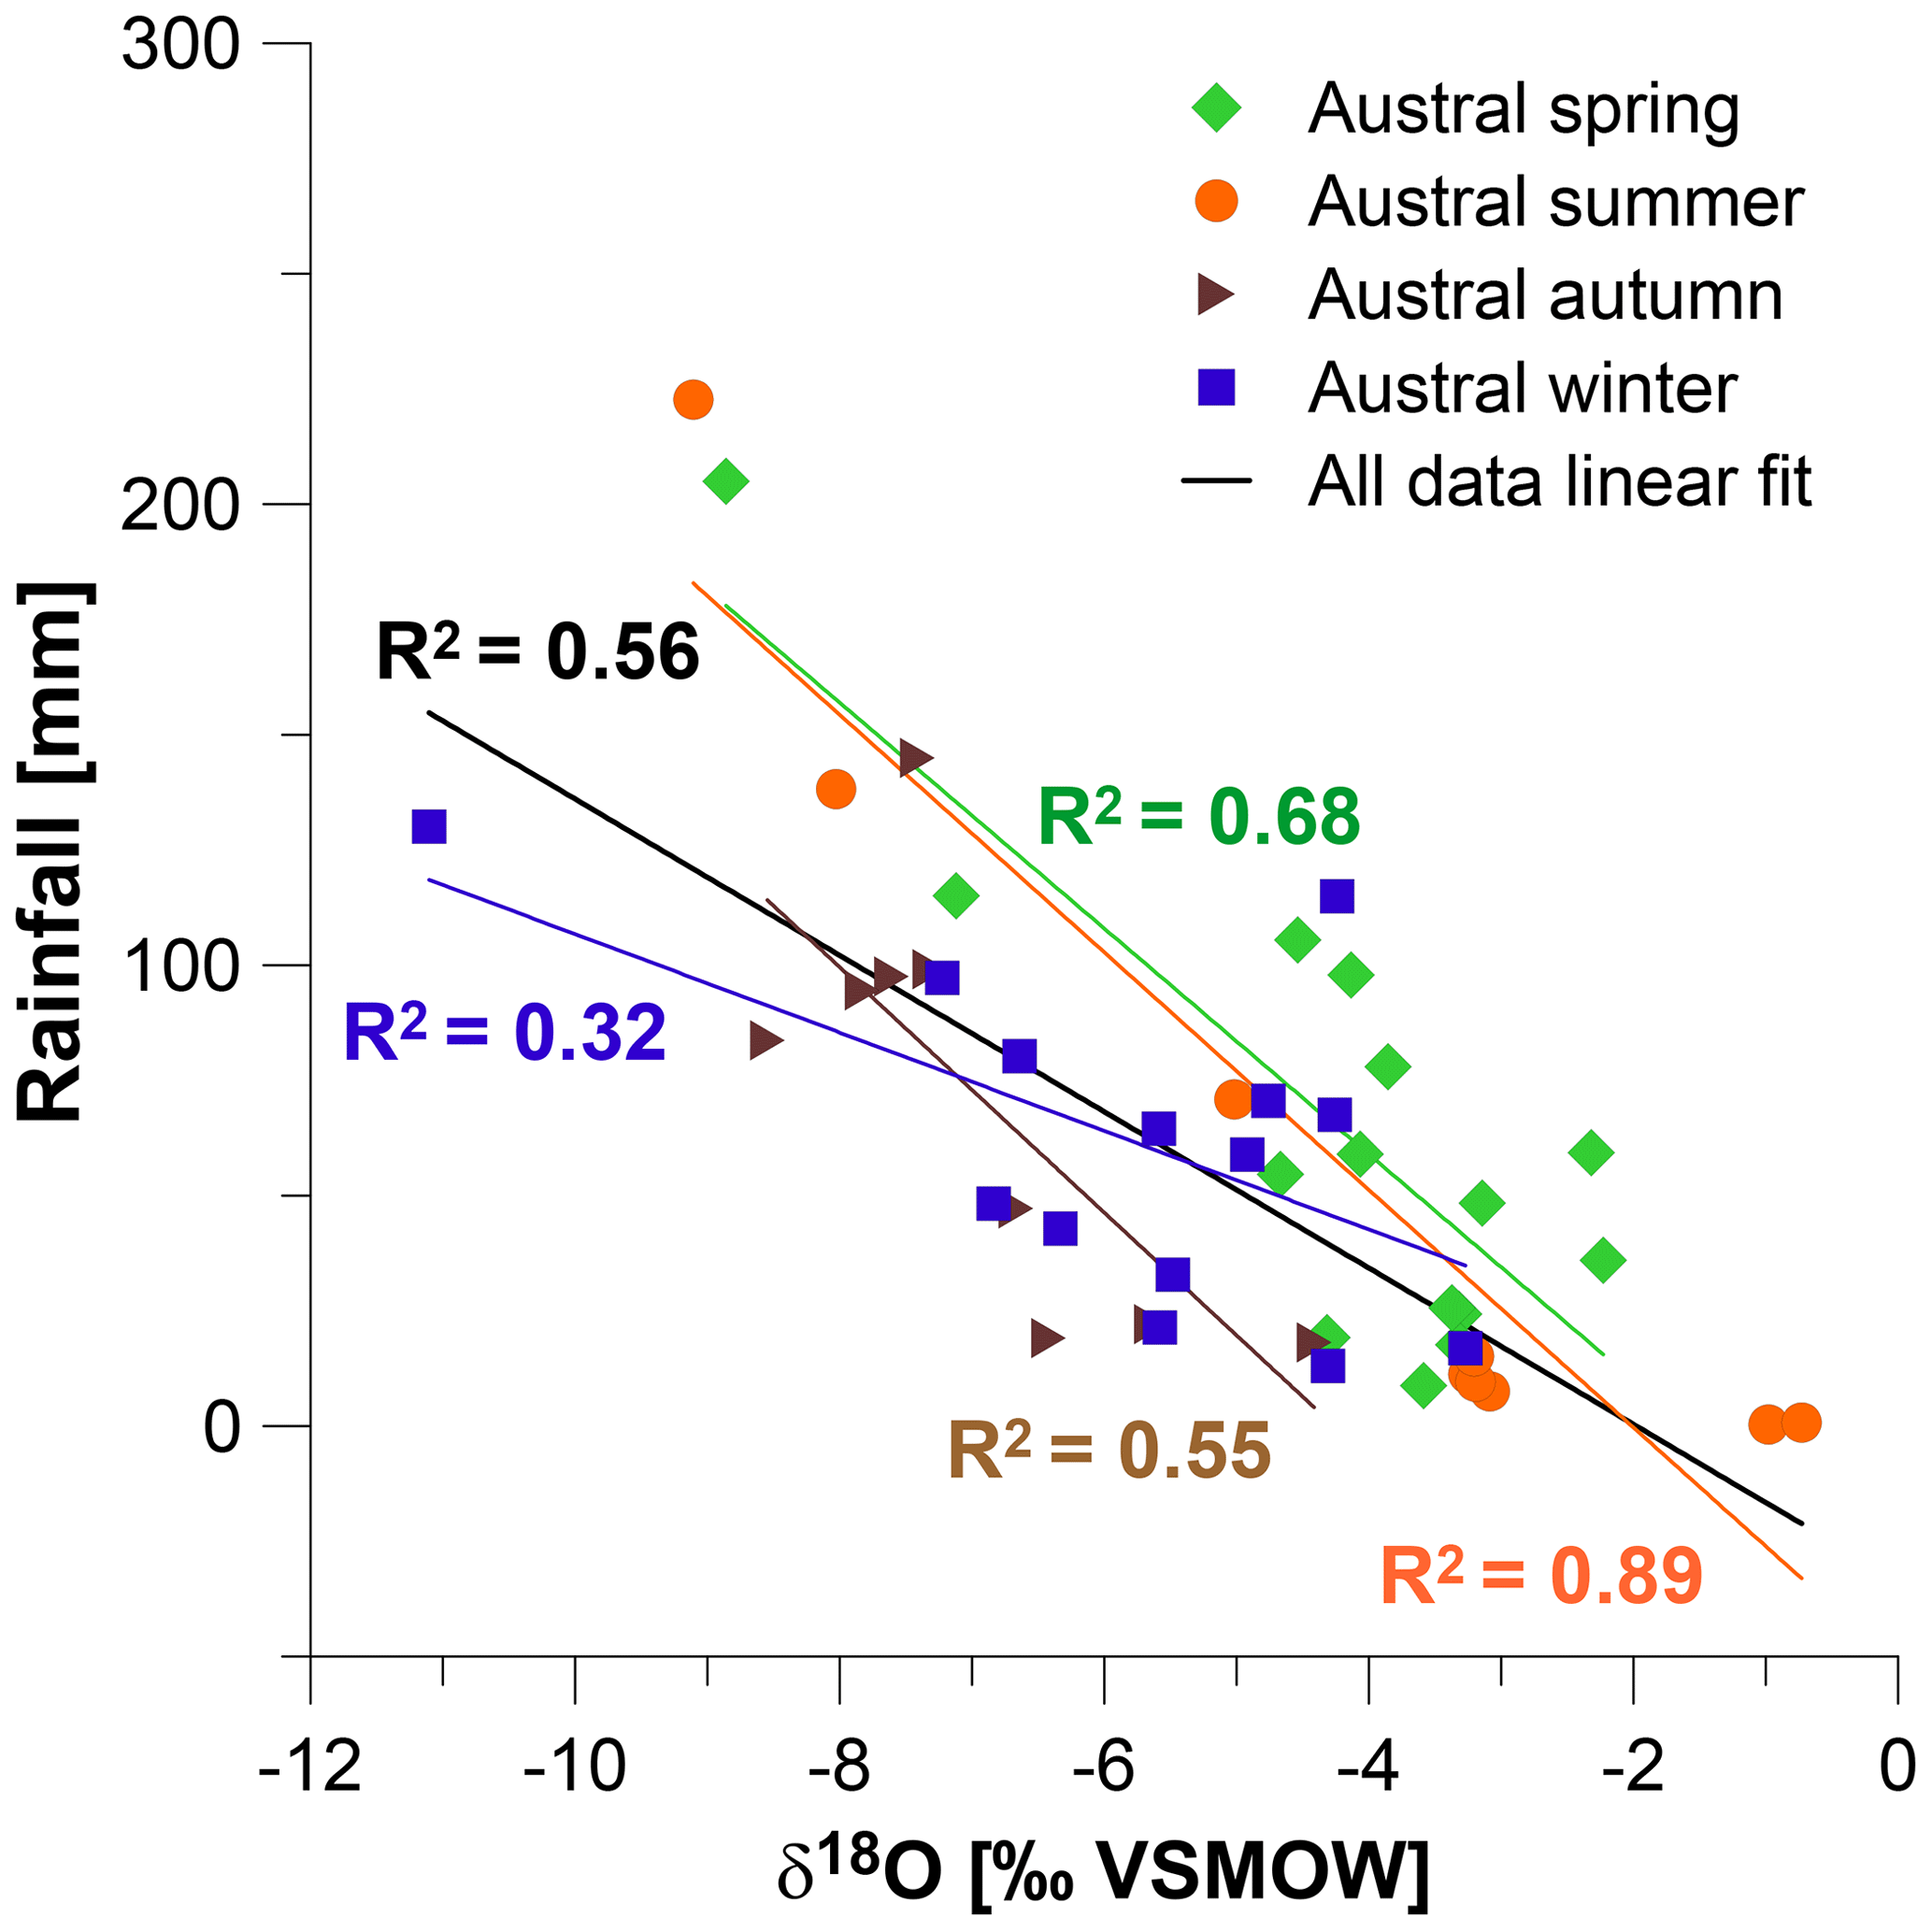
Figure 13Cross plot of precipitation amount versus δ18O in rainfall for the period August 2007 to December 2009 from the Waikato region (data source: Keller et al., 2014). The black line indicates the correlation if all data are considered, while the coloured symbols and regressions relate to the different seasons.
Drip water δ18O and δD values closely reflect the mean isotopic composition of the rainwater (Fig. 7). The isotope signatures of drip waters from the Organ Loft curtain lack seasonal patterns, as they are decoupled from recharge rates by a significant epikarst store (Figs. 8b–c and S4c). Instead, homogenisation in the epikarst reservoir controls the isotopic composition of the water feeding the Organ Loft curtain. As highlighted in Fig. 7, δ18O values vary minimally around a mean drip water δ18O value of −5.6 ‰, which is only slightly lower than the average rainwater value (−5.15 ‰; Keller et al., 2014). This similarity indicates the rapid mixing of freshly infiltrating water with older water in the epikarst, as also found in earlier studies from the Waitomo district (Williams and Fowler, 2002) and elsewhere (Mattey et al., 2008; Tremaine et al., 2016; Breitenbach et al., 2019). The observed buffering of drip water towards the mean rainwater δ18O value suggests that speleothem δ18O ratios can be expected to reflect multi-annual to multi-decadal changes in rainfall isotope geochemical patterns. Furthermore, it may be possible that speleothems from Waipuna Cave record a long-term temperature signal that is unbiased with regard to seasonal infiltration changes. On the other hand, this pattern might also indicate that Waipuna Cave speleothem isotope geochemistry is insensitive to sub-seasonal changes in rainfall δ18O and δD ratios. Flowstone δ18O values originating from water from these drips are unlikely to reflect atmospheric dynamics related to seasonal or ENSO variability, and other proxies must be used instead to identify these dynamics.
Waipuna Cave drip waters do not show significant variations in 17Oexcess over time, and most results overlap within analytical errors (Fig. 9). Recent investigations into triple oxygen isotopes in midlatitude rainfall have reported seasonal oscillations in 17Oexcess that have been attributed to changes in relative humidity at the moisture source (i.e. where the water vapour originates) or to swings between different moisture sources with evaporation occurring under different environmental conditions (Affolter et al., 2015; Uechi and Uemura, 2019). Unlike the d-excess parameter, 17Oexcess in rainfall is apparently almost exclusively controlled by relative humidity at the water-vapour boundary layer (i.e. the interface between water and free atmosphere), with insignificant temperature effects (Luz and Barkan, 2010). Thus, if there are seasonal changes in the dominant moisture source and origin of storms for the Waikato area, these would be likely to affect local precipitation and this variability could be recorded in Waipuna Cave drip water. However, no significant variations in 17Oexcess are found over the studied period (September 2017 to October 2018), suggesting that the isotope values of meteoric water are homogenised in the epikarst and that Waipuna Cave drip water 17Oexcess is insensitive to (sub-)seasonal changes. We suspect that, as with δ18O ratios, the interannual response of cave drip water might be controlled by long-term variations in the 17Oexcess of rainfall and changes in the relative importance of ENSO and the Southern Westerlies. However, given that the narrow range of 17Oexcess in rainwater in the midlatitudes (normally <30 per meg; Luz and Barkan, 2010) and the relatively large errors of current analytical methods (i.e. ∼8 per meg), longer (i.e. multi-decadal) drip water monitoring would be needed to test this hypothesis.
The fracture-flow-fed drip sites WP-2, WP-3, and WP-4 are more sensitive to variations in surface conditions and were likely affected by a moderate drought in the summer of 2016–2017 (Fig. 8a). 2016 was the warmest year on record for New Zealand, with average annual temperatures 0.5 to 1.2 ∘C above normal (NIWA annual climate summary; NIWA, 2016a). Rainfall was 50 %–79 % below average in December 2016, causing anomalously low soil moisture levels (NIWA summer 2016–2017 report; NIWA, 2016b). Hence the January 2017 δ18O values of −5.08 ‰ and −5.12 ‰ (Fig. 8a) might have been affected by the reduced infiltration caused by the higher evapotranspiration relative to precipitation.
The rapid decrease in drip water δ18O at the fast drip sites in March and April 2017 could have been caused by aquifer recharge (Fig. 8a). The decrease coincides with a period of increased precipitation, which would have quickly infiltrated the relatively dry soil and entered the aquifer. This is consistent with the short water residence time of 5 d and the greater degree of fracture flow and vadose zone influence at these sites compares with the slower drip sites.
5.3 Drip water major and trace elements
Detecting short-term (sub-seasonal to annual) hydrological changes related to environmental conditions above Waipuna Cave requires sensitive (and ideally quantitative) proxies. In the following, we review the parameters we have measured in terms of their sensitivity.
Negative effective precipitation (Peff), either from reduced rainfall or enhanced PET, can enhance the degassing of CO2 from the epikarst zone and thus prior calcite precipitation (PCP) in the epikarst (Fairchild et al., 2000). Another factor potentially controlling PCP is cave ventilation. Enhanced ventilation removes moisture and CO2 from the cave environment, which can result in <100 % relative humidity (RH) and/or near-atmospheric CO2 concentrations in cave air (Gázquez et al., 2016). Low cave air RH values can lead to drip water evaporation, while low cave air pCO2 can enhance drip water degassing and the formation of speleothems at the cave ceiling. Both processes can affect X∕Ca and stable isotope ratios (Fairchild et al., 2006a; Breitenbach et al., 2015). Normally, the processes in the epikarst and in the cave act in concert and cannot be disentangled. Here, we show that detailed monitoring of X∕Ca dynamics in drip water can give valuable insights into the relative importance of these two zones, namely the epikarst and cave itself, for PCP intensity.
The PCP predictor line represents the modelled evolution of the Caaq concentration which precipitates calcite in equilibrium as pCO2 decreases from the soil to the cave (Fairchild et al., 2006b). The Mg∕Ca ratios of Waipuna Cave drip waters closely follow the PCP predictor line (Fig. 10a). Mg∕Ca and Sr∕Ca ratios are plotted in Fig. 10b, and a strong positive correlation is observed in Waipuna Cave drip waters (R2=0.82, ; Sinclair et al., 2012; Tremaine and Froelich, 2013). This effect has also been widely identified in cave systems in Australia, with a climate similar to the Waitomo region. For example, Harrie Wood Cave (35∘44′ S, 148∘30′ E) drip water Mg∕Ca and Sr∕Ca ratios show enhanced PCP during dry periods associated with El Niño and reduced PCP during La Niña events (Tadros et al., 2016).
The degree of PCP could be expected to be linked to infiltration rates, with fracture flow being prone to more PCP because it empties faster compared to seepage flow. As long as the epikarst remains water-filled, PCP would be minimised, whereas the fast drying of the epikarst results in the intrusion of soil air, which might induce PCP. The fracture-flow-fed drips can be distinguished from seepage-flow-fed ones by lower Ca concentrations and increased scatter around the predicted PCP line (Fig. 10a). This can be explained by somewhat shorter interaction between the infiltrating water and the host rock. When comparing the elemental composition of the different drip sites (Fig. 10b), we observe that all drips show comparable Mg∕Ca and Sr∕Ca ratios, suggesting that all drips are similarly affected by PCP. The different infiltration lag time of the individual drips thus does not appear to affect the extent of PCP in Waipuna Cave.
Although rainfall is evenly distributed throughout the year, a strong seasonal PCP signal is found in the drip water for all drip sites across the whole monitoring period (Fig. 11). Lower Mg∕Ca and Sr∕Ca ratios occurred in the wettest months, when precipitation exceeded evapotranspiration. Conversely, higher Mg∕Ca and Sr∕Ca ratios are found in the driest months (i.e. November to March), when the potential evapotranspiration exceeds rainfall and effective infiltration is negative (Figs. 11 and S7). Hydrological changes thus govern epikarst PCP, which in turn controls drip water Mg∕Ca and Sr∕Ca ratios (Fig. 10b). This observation supports our hypothesis that Waipuna Cave drip waters are capable of registering changes in local hydrology, with seasonal differences being most strongly expressed in Sr∕Ca ratios. Changes in the Sr∕Ca ratio potentially reflect the interplay of PCP and enhanced selective Sr leaching (incongruent dissolution), which both operate to increase Sr∕Ca in the drier months (Sinclair et al., 2012), while the wetter months are characterised by infiltration and reduced selective Sr leaching (congruent dissolution; see Sect. 5.5).
5.4 Cave ventilation
The monitoring of temperature and pCO2 between June 2017 and June 2018 shows that Waipuna Cave ventilation is driven by changes in the density of internal and external air in response to seasonal external temperature (Fig. 12), i.e. Waipuna Cave is a barometric cave sensu Fernandez-Cortes et al. (2008). This behaviour has been observed in other caves globally (Wong et al., 2011; Breitenbach et al., 2015; Riechelmann et al., 2019).
During late spring and summer (November 2017 to May 2018), cave air is colder than surface air (ΔT<0) (Fig. 12c). A greater relative density of the cave air and the pressure difference compared to the surface air creates a cold-air “lake” within the cave. This cold air mass is isolated from the warmer, less dense exterior air (i.e. isolation period) due to the geometry of the cave (Fig. 14). The cold, stagnant cave air inhibits the exhalation of CO2 released from the drip water, which then accumulates in the cave atmosphere. Inversely, from autumn to early spring (June 2017 to October 2017), a positive ΔT (i.e. warmer cave air relative to the surface, though still colder than summer cave air) leads to the barometric ventilation of cave air (Fig. 12c). Due to the pressure gradient, cool and dense surface air will sink into the cave, whilst rising warm cave air leaves the cave. The intensified air exchange promotes CO2 extraction from the cave. This effect is reflected in the positive relation between Tcave and CO2 values (R2=0.67, p=0.04). These two phases of cave ventilation dynamics fit the chimney circulation model (Fairchild and Baker, 2012, p. 125) and have been observed in similar climatic settings in the USA (Oster et al., 2012), India (Breitenbach et al., 2015), and Spain (Gázquez et al., 2017) among others.
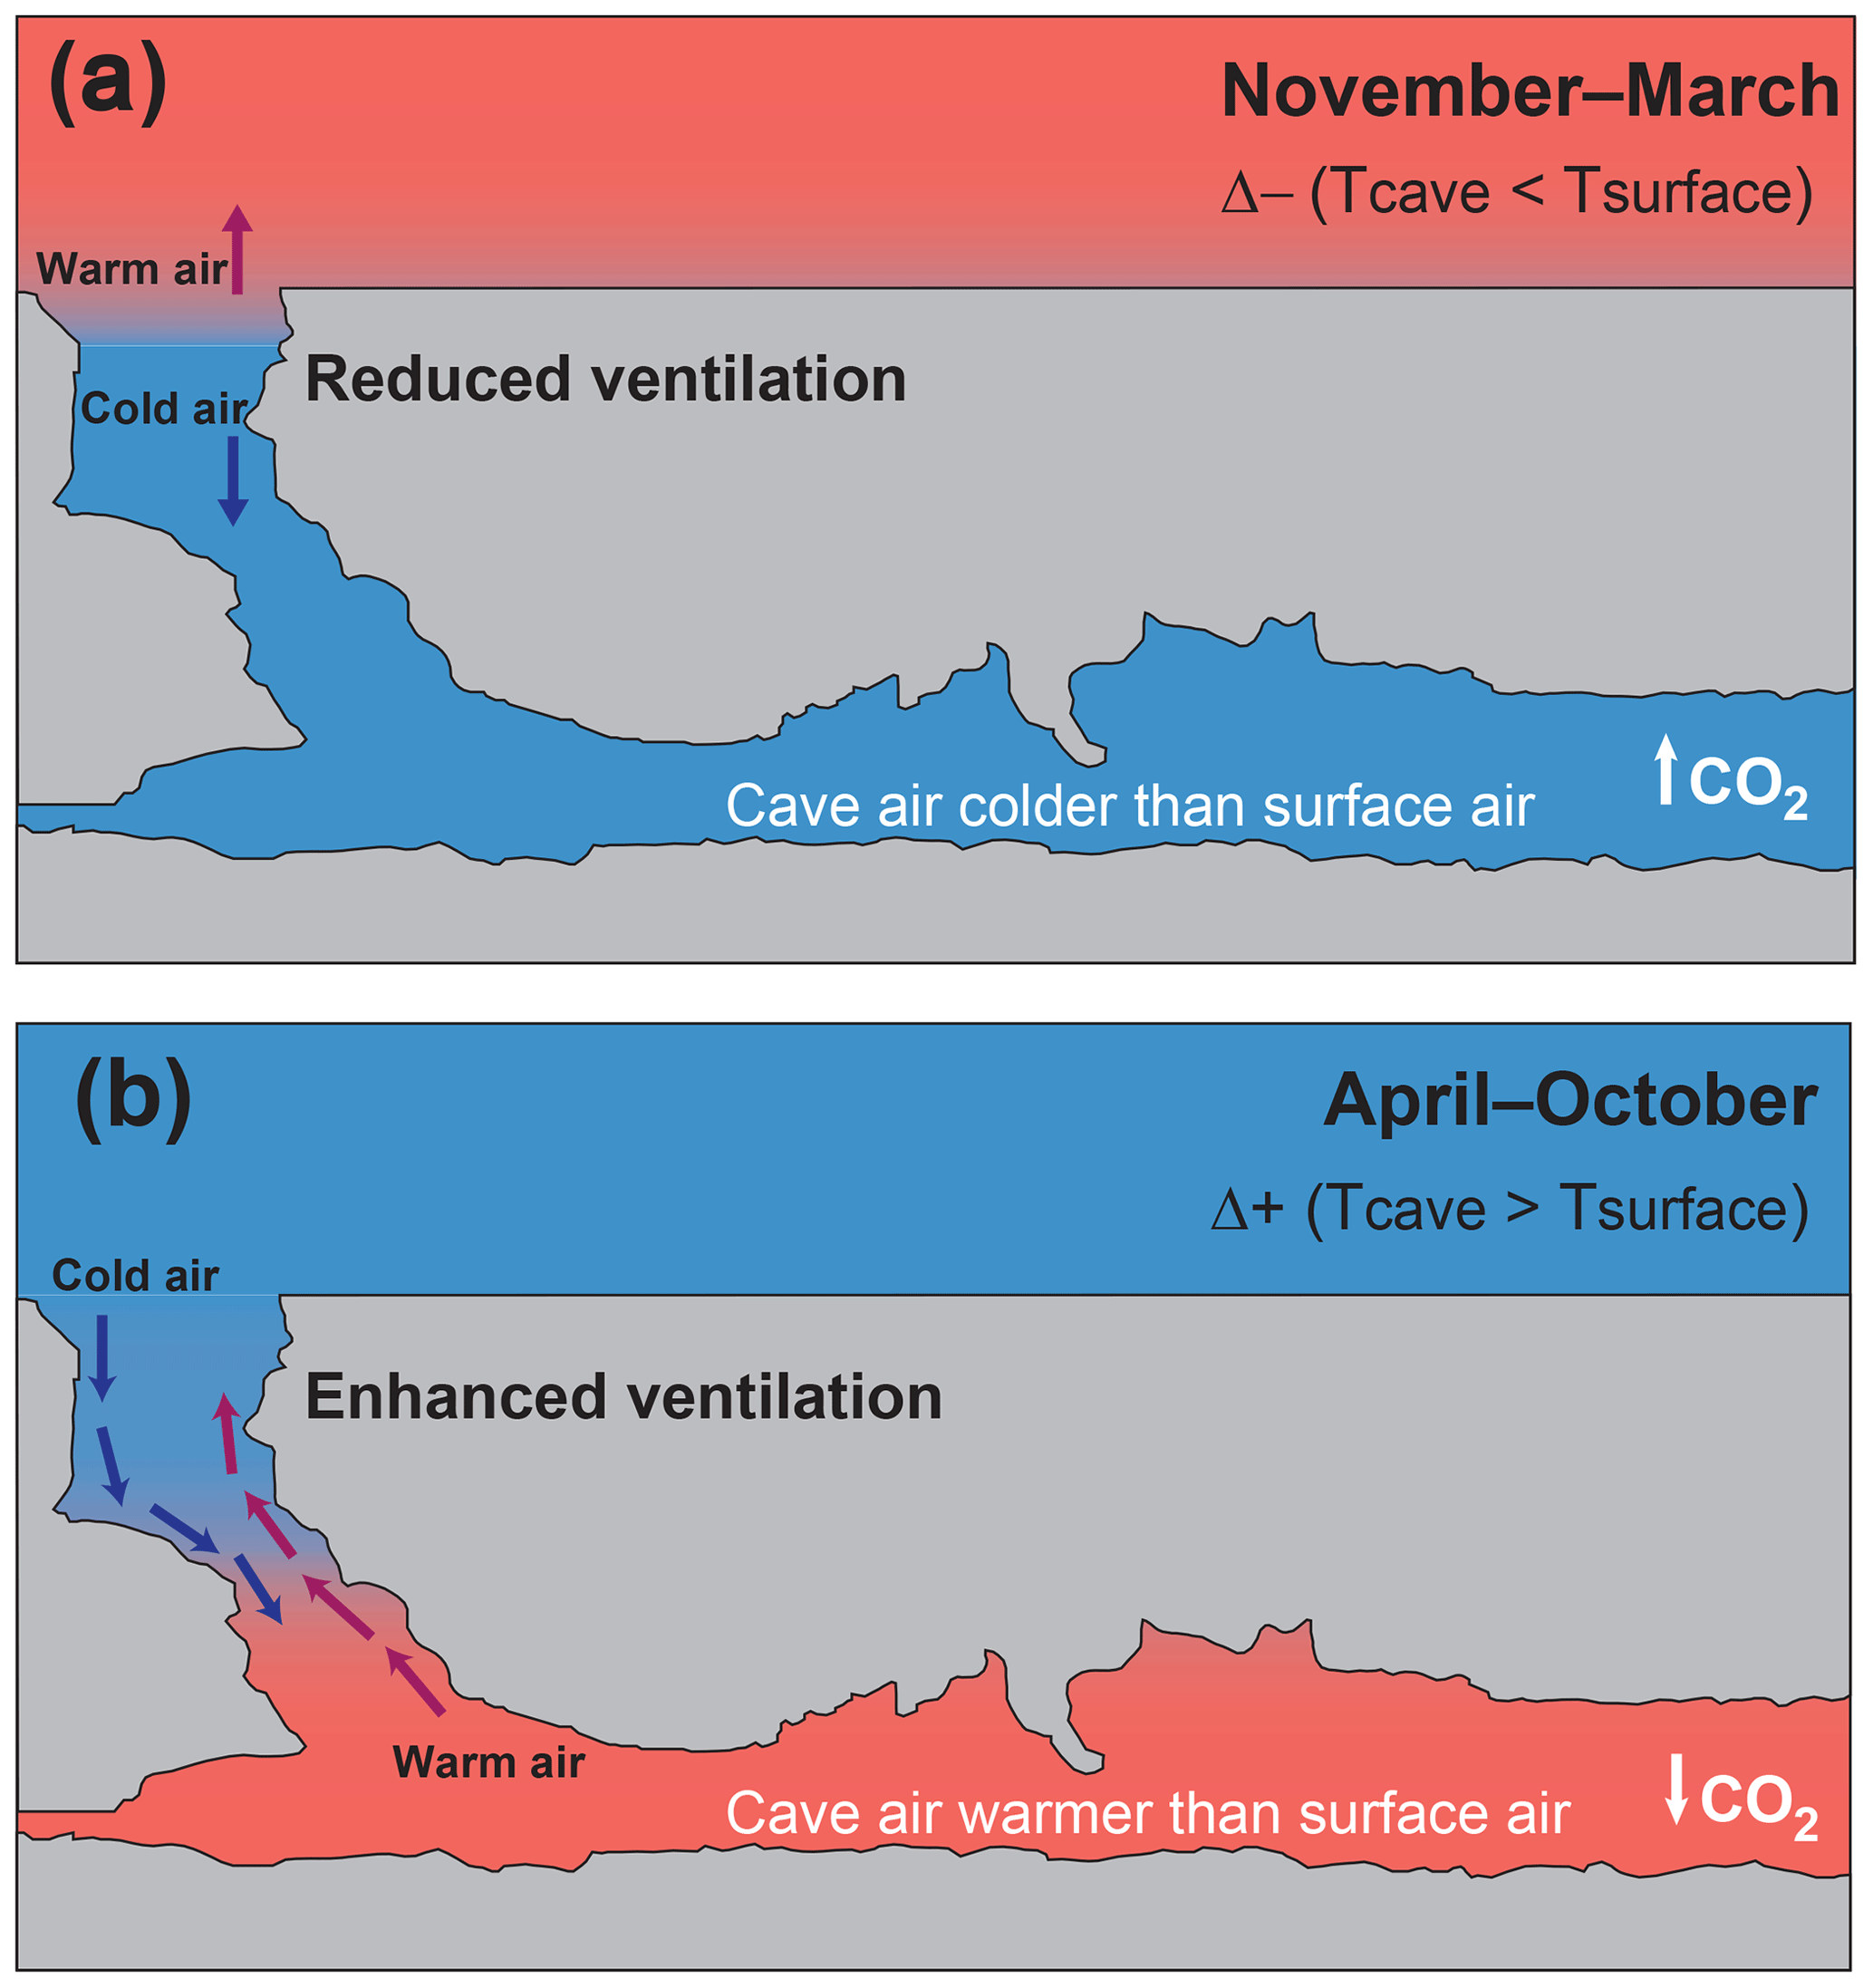
Figure 14Conceptual model of Waipuna Cave ventilation and cave air CO2 dynamics. The cave air is warmer in summer and colder in winter. However, in summer, the cave air is colder than surface air (Δ+), and in winter, the cave air is warmer than surface air (Δ−). (a) Spring and summer when warmer surface conditions compared to the cave interior leads to a stagnant cold-air lake and maximum CO2 values in the cave. (b) Autumn and winter conditions characterised by low surface and relatively higher cave air temperatures, facilitating barometric ventilation and the exhalation of cave air CO2 to the surface.
Furthermore, we find that during the period with a negative Peff, normally the summer season, the relationship between Mg∕Ca and Sr∕Ca ratios is more pronounced, reflected in a higher R2 value (R2=0.92, p<0.001) and a steeper slope compared to the winter season (R2=0.52, p<0.001), when this relationship is less strong and the slope is lower (Fig. S8). Together with lower drip water X∕Ca values in the winter season, this suggests a less significant role for PCP at times of higher ventilation and CO2 changes in Waipuna Cave. Since all Mg∕Ca and Sr∕Ca ratios fall along the PCP line during the months of reduced ventilation (November–March), it seems that enhanced cave ventilation does not affect PCP.
5.5 Modern ENSO signature in Waipuna Cave
We have demonstrated that in Waipuna Cave, Mg∕Ca and Sr∕Ca ratios are sensitive PCP indicators. Here we discuss how they potentially react to infiltration changes governed by ENSO dynamics.
A plot of Mg∕Ca versus Sr∕Ca ratios displays two clusters, each along a clear trend (Figs. 10b and 15). Orange data points indicate all samples collected between October 2016 and February 2019, minus the period that comprises the blue group of samples. Blue-coloured symbols represent samples collected between February 2018 and the end of August 2018, a period with above-average rainfall, likely related to a La Niña event that developed in December 2017. These conditions prevailed over the following months (January to March 2018; NIWA, 2018a). Even though La Niña dissipated in March 2018, it still affected early-autumn circulation patterns in the central North Island, expressed generally by stronger-than-usual northeasterly winds, average temperatures 1.2 ∘C higher than normal, rainfall well above normal (>149 % of normal), and much higher soil moisture levels for this time of year (NIWA, 2018b). Drip water samples collected before February 2018 and after August 2018 (ENSO-neutral conditions) plot on the main PCP trend, but samples collected between February and August 2018 (during a La Niña event decay) plot on a distinct line (Fig. 15). Some water samples collected on 7 February 2018 fall into the same range as the orange (stronger PCP) group, while others collected on the same day fall into the range of the blue group, potentially explaining that the cave's hydrology reacts within days to weeks (depending on drip lag response) to infiltration changes.

Figure 15Drip water ln (Mg∕Ca) versus ln (Sr∕Ca) ratios in Waipuna Cave. Blue diamonds indicate samples collected between late February to the end of August 2018; orange circles are for all other samples collected between October 2016 and February 2019.
It therefore seems possible to identify ENSO events by singling out different regression trends in Sr∕Ca–Mg∕Ca space (Fig. 15). Our data, combined with meteorological information, suggest different behaviour of Sr∕Ca during the warm and wet La Niña event. A comparison of intercept values of the two trend lines suggests that wet La Niña conditions promoted higher effective infiltration, thereby reducing Sr availability.
Mg∕Ca and Sr∕Ca ratios are lower during winter, the wettest months with the lowest PET. Conversely, Sr∕Ca and Mg∕Ca ratios are higher in the higher-PET, drier summer months (Figs. 11 and S8). We postulate that in Waipuna Cave, the La Niña climate mode, although short-lived, has a strong influence on Sr∕Ca variation that produces an overprint on PCP dynamics. In the case of the 2017 La Niña event, we interpret the data to indicate that the extra infiltration associated with the event fundamentally altered the regime of host rock dissolution, thereby decreasing Sr availability (Fairchild and Treble, 2009) in a manner consistent with congruent host rock dissolution and reduced selectivity in Sr leaching (Fairchild et al., 2000). In summary, we argue that hydrological change associated with ENSO, which amplifies the length of the “wet” time window, should modulate Sr∕Ca to a greater extent than seasonal changes.
The results of a 3-year long multi-parameter monitoring campaign in Waipuna Cave help to characterise the sensitivity of the cave with respect to external climatic changes occurring on intra- and inter-annual timescales in the North Island of New Zealand. The monitored parameters include drip rates, cave air temperature, drip water trace elements, water stable isotopes, and cave air pCO2. These were compared to meteorological data from nearby stations. Based on geochemical and drip rate data, we identify three distinct infiltration pathways for the studied drip sites. These are type 1 – diffuse flow, type 2 – fracture flow, and type 3 – combined flow, with lagged responses to antecedent rainfall of 24–18, 4–6, and 11 d, respectively. Waipuna Cave thus reacts quickly (within less than 1 month) to external precipitation variability and is sensitive to sub-seasonal changes in epikarst hydrology.
Drip water isotope composition in Waipuna Cave reflects the mean rainwater δ17O, δ18O, and δD values. Mixing processes in soil and epikarst obscure any seasonal isotopic signal in the drip water. However, long-term (i.e. inter-annual to decadal) atmospheric changes are very likely recorded by speleothem calcite δ18O and 17Oexcess in Waipuna Cave. Because local spring and summer rainfall isotope values are influenced by the amount effect, pronounced droughts can affect the isotopic composition of the drip water, and that signal may be recorded in speleothems.
Drip water Mg∕Ca and Sr∕Ca ratios are modulated by PCP and reflect local hydrological changes. Higher Mg∕Ca and Sr∕Ca ratios reflect periods of reduced effective infiltration from November to March when the potential evapotranspiration exceeds the local rainfall amount. The relationship between Mg∕Ca and Sr∕Ca ratios may be affected by ENSO variability, with wetter conditions and reduced PCP occurring during La Niña events reflected in lower Mg∕Ca–Sr∕Ca slopes. This relationship may thus be a sensitive geochemical tracer of ENSO dynamics. However, longer monitoring is required to validate this interpretation.
Surface air temperature changes govern cave ventilation in Waipuna Cave. Enhanced ventilation occurs between April and October (austral winter) when the surface air temperature is lower than in the cave. During austral summer, surface air temperatures are higher than cave air temperatures, resulting in reduced ventilation by virtue of a cold cave air lake. The Waipuna Cave ventilation pattern is an important factor controlling drip water degassing, cave air CO2 dynamics, speleothem growth rates, and isotope fractionation.
The findings of this study on the hydrochemistry in Waipuna Cave establish a baseline that will allow for the interpretation of speleothem-based proxy records at seasonal and inter-annual scales to reconstruct local hydrological changes as well as regional dynamics, e.g. ENSO events. Longer-term monitoring is required in order to better constrain the effects of synoptic-scale environmental fluctuations on speleothem records from Waipuna Cave and nearby caves.
Data reported here are available to the public as data tables in the Supplement. Additionally, data can be requested from the corresponding author (Cinthya Nava-Fernandez, cinthya.navafernandez@rub.de).
The supplement related to this article is available online at: https://doi.org/10.5194/hess-24-3361-2020-supplement.
CNF conducted fieldwork, collected the samples and data, analysed the data, and prepared the original draft of the paper. AH designed and carried out the cave-monitoring programme, conducted fieldwork, and supervised the study. FG conducted the stable water analyses and contributed to the discussion of the results. OK participated in the fieldwork, contributed to the discussion, helped with the figures, supervised the study, and contributed to the discussion. NM helped with the statistical analysis and discussion. BF conducted fieldwork and helped with the statistical analysis and writing. JH performed fieldwork and contributed the structure-from-motion images. AP and BW helped in the cave-monitoring effort. AF carried out the major and trace elements analysis and contributed to the discussion. DAH provided laboratory resources and helped in the acquisition of funding. AI contributed to the editing process. SFMB designed the monitoring programme, supervised the study, collected samples, and contributed to the interpretation, visualisation, and preparation of the paper.
The authors declare that they have no conflict of interest.
Thanks go to Ingrid Lindeman, Inken Heidke, and Jackson White for their valuable fieldwork contributions. We thank Peter and Libby Chandler for their permission to access Waipuna Cave and their ongoing support of research. Cinthya Nava-Fernandez acknowledges financial support from the German Academic Exchange Service (DAAD). Fernando Gázquez was financially supported by the HIPATIA research programme of the University of Almería.
This research has been supported by the European Union's Horizon 2020 Research and Innovation programme through a Marie Skłodowska-Curie grant (no. 691037), the Royal Society of New Zealand (grant no. RIS-UOW1501), and the Rutherford Discovery Fellowship programme (grant no. RDF-UOW1601).
This open-access publication was funded
by Ruhr-Universität Bochum.
This paper was edited by Gerrit H. de Rooij and reviewed by two anonymous referees.
Affolter S., Häuselmann, A. D., Fleitmann, D., Häuselmann, P., and Leuenberger, M.: Triple isotope (δD, δ17O, δ18O) study on precipitation, drip water and speleothem fluid inclusions for a Western Central European cave (NW Switzerland), Quaternary Sci. Rev., 127, 73–89, https://doi.org/10.1016/j.quascirev.2015.08.030, 2015.
Asmerom, Y., Polyak, V. J., and Burns, S. J.: Variable winter moisture in the southern United States linked to rapid glacial climatic shifts, Nat. Geosci., 3, 114–117, https://doi.org/10.1038/ngeo754, 2010.
Baker, A., Barnes, W. L., and Smart, P. L.: Variations in the discharge and organic matter content of stalagmite drip waters in Lower Cave, Bristol, Hydrol. Process., 11, 1541–1555, https://doi.org/10.1002/(sici)1099-1085(199709)11:11<1541::aid-hyp484>3.0.co;2-z, 1997.
Baldini, J. U. L., McDermott, F., and Fairchild, I. J.: Spatial variability in cave drip water hydrochemistry: Implications for stalagmite paleoclimate records, Chem. Geol., 235, 390–404, https://doi.org/10.1016/j.chemgeo.2006.08.005, 2006.
Barkan, E. and Luz, B.; High precision measurements of 17O∕16O and 18O∕16O ratios in H2O, Rapid Commun. Mass Sp., 19, 3737–3742, https://doi.org/10.1002/rcm.2250, 2005.
Basher, R. E.: The 1997/98 El Niño Event: Impacts, responses and outlook for New Zealand, Report No. 73, Ministry of Research, Science and Technology, Wellington, p. 28, 1998.
Bradley, C., Baker, A., Jex, C. N., and Leng, M. J.: Hydrological uncertainties in the modelling of cave drip-water δ18O and the implications for stalagmite palaeoclimate reconstructions, Quaternary Sci. Rev., 29, 2201–2214, https://doi.org/10.1016/j.quascirev.2010.05.017, 2010.
Breitenbach, S. F. M., Adkins, J. F., Meyer, H., Marwan, N., Kumar, K. K., and Haug, G. H.: Strong influence of water vapor source dynamics on stable isotopes in precipitation observed in Southern Meghalaya, NE India, Earth Planet. Sc. Lett., 292, 212–220, https://doi.org/10.1016/j.epsl.2010.01.038, 2010.
Breitenbach, S. F. M., Lechleitner, F. A., Meyer, H., Diengdoh, G., Mattey, D., and Marwan, N.: Cave ventilation and rainfall signals in dripwater in a monsoonal setting – a monitoring study from NE India, Chem. Geol., 402, 111–124, https://doi.org/10.1016/j.chemgeo.2015.03.011, 2015.
Breitenbach, S. F. M., Plessen, B., Waltgenbach, S., Tjallingii, R., Leonhardt, J., Jochum, K. P., Meyer, H., Goswami, B., Marwan, N., and Scholz, D.: Holocene interaction of maritime and continental climate in Central Europe: New speleothem evidence from Central Germany, Global Planet. Change, 176, 144–161, https://doi.org/10.1016/j.gloplacha.2019.03.007, 2019.
Chen, S., Hoffman, S. S., Lund, D. C., Cobb, K. M., Emile-Geay, J., and Adkins, J. F.: A high-resolution speleothem record of western equatorial Pacific rainfall: Implications for Holocene ENSO evolution, Earth Planet. Sc. Lett., 442, 61–71, https://doi.org/10.1016/j.epsl.2016.02.050, 2016.
Cheng H., Spötl C., Breitenbach, S. F. M., Sinha, A., Wassenburg, J. A., Jochum, P. K., Scholz, D., Li, X., Yi, Liang, Peng, Y., Lv, Y., Zhang, P., Votintseva A., Loginov, V., Ning, Y., Kathayat, G., and Edwards, L.: Climate variations of Central Asia on orbital to millennial timescales, Sci. Rep., 6, 36975, https://doi.org/10.1038/srep36975, 2016.
Craig, H.: Isotopic Variations in Meteoric Waters, Science, 133, 1702–1703, https://doi.org/10.1126/science.133.3465.1702, 1961.
Dansgaard, W.: Stable isotopes in precipitation, Tellus, 16, 436–468, 1964.
Dorale, J. A., Edwards, R. L., Ito, E., and Gonzalez, L. A.: Climate and vegetation history of the midcontinent from 75 to 25 ka: a speleothem record from Crevice, Science, 282, 1871–1874, https://doi.org/10.1126/science.282.5395.1871, 1998.
Fairchild, I. J. and Baker, A.: Speleothem Science: From Process to Past Environments, Wiley-Blackwell, UK, 1–432, 2012.
Fairchild, I. J. and Treble, P. C.: Trace elements in speleothems as recorders of environmental change, Quaternary Sci. Rev., 28, 449–468, https://doi.org/10.1016/j.quascirev.2008.11.007, 2009.
Fairchild, I. J., Borsato, A., Tooth, A. F., Frisia, S., Hawkesworth, C. J., Huang, Y., McDermott, F., and Spiro, B.: Controls on trace element (Sr-Mg) compositions of carbonate cave water: implications for speleothem climatic records, Chem. Geol., 166, 255–269, https://doi.org/10.1016/S0009-2541(99)00216-8, 2000.
Fairchild, I. J., Smith, C. L., Baker, A., Fuller, L., Spötl, C., Mattey, D., and McDermott, F.: Modification and preservation of environmental signals in speleothems, Earth Sci. Rev., 75, 105–153, https://doi.org/10.1016/j.earscirev.2005.08.003, 2006a.
Fairchild, I. J. Tuckwell, G. W., Baker, A., and Tooth, A. F.: Modelling of dripwater hydrology and hydrogeochemistry in a weakly karstified aquifer (Bath, UK): Implications for climate change studies, J. Hydrol., 321, 213–231, https://doi.org/10.1016/j.jhydrol.2005.08.002, 2006b.
Fernandez-Cortes, A., Calaforra, A., and Sanchez-Martos, F.: Hydrogeochemical processes as environmental indicators in drip water: study of the Cueva del Agua (Southern Spain), Int. J. Speleol., 37, 41–52, https://doi.org/10.5038/1827-806X.37.1.4, 2008.
Ford, D. and Williams, P.: Karst Hydrogeology and Geomorphology, John Wiley, Chichester, UK, 2007.
Frappier, A., Sahagian, D., Gonzalez, L. A., and Carpenter, S. J.: El Niño Events Recorded by Stalagmite Carbon Isotopes, Science, 298, 565, https://doi.org/10.1126/science.1076446, 2002.
Gázquez, F., Quindos-Poncela, L., Sainz-Fernandez, C., Fernandez-Villar, A., Fuente-Merino, I., and Celaya-Gonzalez, S.: Spatiotemporal distribution of δ13C-CO2 in a shallow cave and its potential use as indicator of anthropic pressure, J. Environ. Manage., 180, 421–432, https://doi.org/10.1016/j.jenvman.2016.05.078, 2016.
Gázquez, F., Calaforra, J. M., Evans, N. P., and Hodell D. A.: Using stable isotopes (δ17O, δ18O and δD) of gypsum hydration water to ascertain the role of water condensation in the formation of subaerial gypsum speleothems, Chem. Geol., 452, 34–46, https://doi.org/10.1016/j.chemgeo.2017.01.021, 2017.
Griffiths, G. M.: Changes in New Zealand daily rainfall extremes 1930–2004, Weather Clim., 27, 3–44, https://doi.org/10.2307/26169689, 2006.
Griffiths, M. L., Kimbrough, A. K., Gagan, M. K., Drysdale, R. N., Cole, J. E., Kathleen, J. R., Zhao, J.-X., Cook, B. I., Hellstrom, J. C., and Hantoro, W. S.: Western Pacific hydroclimate linked to global climate variability over the past two millennia, Nat. Commun., 7, 11719, https://doi.org/10.1038/ncomms11719, 2016.
Hartland, A., Andersen, M. S., and Hamilton, D. P.: Phosphorus and arsenic distributions in a seasonality stratified, iron- and manganese-rich lake: microbiological and geochemical controls, Environ. Chem., 12, 708–722, https://doi.org/10.1071/EN14094, 2015.
Henderson, G. H.: Caving in to new chronologies, Science, 313, 620–622, https://doi.org/10.1126/science.1128980, 2006.
Hewitt, A. E.: New Zealand soil classification, Landcare Res. Sci. Ser. N. Zeal., 1, 1–136, 2010.
Immenhauser, A., Buhl, D., Richter, D., Niedermayr, A., Riechelmann, D., Dietzel, M., and Schulte, U.: Magnesium-isotope fractionation during low-Mg calcite precipitation in a limestone cave – Field study and experiments, Geochim. Cosmochim. Ac., 74, 4346–4364, https://doi.org/10.1016/j.gca.2010.05.006, 2010.
Jex, C. N., Mariethoz, G., Baker, A., Graham, P., Andersen, M., Acworth, I., Edwards, N., and Azcurra, C.: Spatially dense drip hydrological monitoring and infiltration behaviour at the Wellington Caves, South East Australia, Int. J. Speleol., 41, 283–296, https://doi.org/10.5038/1827-806X.41.2.14, 2012.
Kaushal, N., Breitenbach, S. F. M., Lechleitner, F. A., Sinha A., Tewari, V. C., Ahmad, S. M., Berkelhammer, M., Band, S., Yadava, M., Ramesh, R., and Henderson G.M.: The Indian Summer Monsoon from a Speleothem δ18O Perspective – A Review, Quaternary, 1, 29, https://doi.org/10.3390/quat1030029, 2018.
Keller, E., Ehtesham, E., Hayman, A., Hale, R., Baisen, T., and Frew, R.: NZ CDRP full isotope database, available at: https://www.researchgate.net/publication/260636451_NZ_CDRP_full_isotope_database (last access: 26 June 2020), 2014.
Lachniet, M. S.: Climatic and environmental controls on speleothem oxygen-isotope values, Quaternary Sci. Rev., 28, 412–432, https://doi.org/10.1016/j.quascirev.2008.10.021, 2009.
Lechleitner, F. A., Breitenbach, S. F. M., Cheng, H., Plessen B., Rehfeld K., Goswami B., Marwan, N., Eroglu D., Adkins, J., and Haug, G. H.: Climatic and in-cave influences on δ18O and δ13C in a stalagmite from northeastern India through the last deglaciation, Quatern. Res., 88, 458–471, https://doi.org/10.1017/qua.2017.72, 2017.
Li, X., Cui, X., He, D., Liao, J., and Hu, C.: Evaluation of the Heshang Cave stalagmite calcium isotope composition as a paleohydrologic proxy by comparison with the instrumental precipitation, Sci. Rep., 8, 2615, https://doi.org/10.1038/s41598-018-20776-5, 2018.
Luz, B. and Barkan E.: Variations of 17O∕16O and 18O∕16O in meteoric waters, Geochim. Cosmochim. Ac., 74, 6276–6286, https://doi.org/10.1016/j.gca.2010.08.016, 2010.
Magiera, M., Lechleitner, F. A., Erhardt, A. M., Hartland, A., Kwiecien, O., Cheng, H., Bradbury, H. J., Turchyn, A. V., Riechelmann, S., Edwards, L., and Breitenbach, S. F. M.: Local and regional Indian Summer Monsoon precipitation dynamics during Termination II and Last Interglacial, Geophys. Res. Lett., 46, 1245–12463, https://doi.org/10.1029/2019GL083721, 2020.
Mahmud, K., Marienthoz, G., Baker, A., and Treble, P. C.: Hydrological characterization of cave drip waters in a porous limestone: Golgotha Cave, Western Australia, Hydrol. Earth Syst. Sci., 22, 977–988, https://doi.org/10.5194/hess-22-977-2018, 2018.
Markowska, M., Baker, A., Treble, P. C., Andersen, M. S., Hankin, S., Jex, C. N., Tadros, C. V., and Roach, R.: Unsaturated zone hydrology and cave drip discharge water response: Implications for speleothem paleoclimate record variability, J. Hydrol., 529, 662–675, https://doi.org/10.1016/j.jhydrol.2014.12.044, 2015.
Mattey, D., Lowry, D., Duffet, J., Fisher, R., Hodge, E., and Frisia, S.: A 53 year seasonally resolved oxygen and carbon isotope record from a modern Gibraltar speleothem: Reconstructed drip water and relationship to local precipitation, Earth Planet. Sc. Lett., 269, 80–95, https://doi.org/10.1016/j.epsl.2008.01.051, 2008.
McDermott, F.: Palaeo-climate reconstruction from stable isotope variations in speleothems: a review, Quaternary Sci. Rev., 23, 901–918, https://doi.org/10.1016/j.quascirev.2003.06.021, 2004.
Meckler, A. N., Clarkson, M. O., Cobb, K. M., Sodemann, H., and Adkins, J. F.: Interglacial Hydroclimate in the Tropical West Pacific Through the Late Pleistocene, Science, 336, 1301–1304, https://doi.org/10.1126/science.1218340, 2012.
Moerman, J. W., Cobb, K. M., Partin, J. W., Meckler, A. N., Carolin, S. A., Adkins, J. F., Lejau, S., Malang, J., Clark, B., and Tuen, A. A.: Transformation of ENSO-related rainwater to dripwater δ18O variability by vadose water mixing, Geophys. Res. Lett., 41, 7907–7915, https://doi.org/10.1002/2014GL061696, 2014.
Mullan, B.: Effects of ENSO on New Zealand and the South Pacific, in: Prospects and needs for climate forecasting, Miscellaneous Series 34, edited by: Braddock, D., Royal Society of New Zealand, Wellington, New Zealand, 23–27, 1996.
Myers, C. G., Oster, J. L., Sharp, W. D., Bennartz, Kelley, N. P., Covey, A. K., and Breitenbach, S. F. M.: Northeast Indian stalagmite records Pacific decadal climate change: Implications for moisture transport and drought in India, Geophys. Res. Lett., 42, 4124–4132, https://doi.org/10.1002/2015GL063826, 2015.
Nelson, C. S.: Stratigraphy and sedimentology of the Te Kuiti Group in Waitomo County, South Auckland, PhD Dissertation, University of Auckland, Auckland, New Zealand, 1973.
NIWA: Annual Climate Summary 2016, available at: https://niwa.co.nz/climate/summaries/annual-climate-summary-2016 (last access: 26 June 2020), 2016a.
NIWA: Seasonal Climate Summary Summer 2016–17, available at: https://niwa.co.nz/climate/summaries/seasonal/summer-2016-17 (last access: 26 June 2020), 2016b.
NIWA: Seasonal Climate Summary Summer 2017–18, available at: https://niwa.co.nz/climate/summaries/seasonal/summer-2017-18 (last access: 26 June 2020), 2018a.
NIWA: Seasonal Climate Summary Autumn 2018, available at: https://niwa.co.nz/climate/summaries/seasonal/autumn-2018 (last access: 26 June 2020), 2018b.
Oster, J. L., Montañez, I. P., and Kelley, N. P.: Response of a modern cave system to large seasonal precipitation variability, Geochim. Cosmochim. Ac., 91, 92–108, https://doi.org/10.1016/j.gca.2012.05.027, 2012.
Owen, R. A., Day, C. C., Hu, C.-Y., Liu, Y.-H., Pointing, M. D., Blättler, C. L., and Henderson, G. M.: Calcium isotopes in caves as a proxy for aridity: Modern calibration and application to the 8.2 kyr event, Earth Planet. Sc. Lett., 443, 129–138, https://doi.org/10.1016/j.epsl.2016.03.027, 2016.
Riechelmann, S., Buhl, D., Schröder-Ritzrau, A., Riechelmann, D. F. C., Richter, D. K., Vonhof, H. B., Wassenburg, J., Geske, A., Spötl, C., and Immenhauser, A.: The magnesium isotope record of cave carbonate archives, Clim. Past, 8, 1849–1867, https://doi.org/10.5194/cp-8-1849-2012, 2012.
Riechelmann, S., Breitenbach, S. F. M., Schröder-Ritzrau, A., Mangini, A., and Immenhauser, A.: Ventilation and cave air pCO2 in the Bunker-Emst Cave System (NW Germany): implications for speleothem proxy data, J. Cave Karst Stud., 81, 98–112, https://doi.org/10.4311/2018ES0110, 2019.
Risi, C., Bony, S., and Vimeux, F.: Influence of convective processes on the isotopic composition (δ18O and δD) of precipitation and water vapor in the tropics: 2. Physical interpretation of the amount effect, J. Geophys. Res., 113, D19306, https://doi.org/10.1029/2008JD009943, 2008.
Schoenemann, S. W., Schauer, A. J., and Steig, E. J.: Measurement of SLAP and GISP δ17O and proposed VSMOW-SLAP normalization for δ17O and 17O-excess, Rapid Commun. Mass Sp., 27, 582–590, https://doi.org/10.1002/rcm.6486, 2013.
Sha, L., Mahata, S., Duan, P., Luz, B., Zhang, P., Baker, J., Zong, B., Ning, Y., Brahim, Y. A., Zhang, H., Edwards, R. L., and Cheng, H.: A novel application of triple oxygen isotope ratios of speleothems, Geochim. Cosmochim. Ac., 270, 360–378, https://doi.org/10.1016/j.gca.2019.12.003, 2020.
Shulmeister, J., Goodwin, I., Renwick, J., Harle, K., Aremand, L., McGlone, M. S., Cook, E., Dodson, J., Hesse, P. P., Mayewski, P., and Curran, M.: The Southern Hemisphere westerlies in the Australasian sector over the last glacial cycle: a synthesis, Quatern. Res., 118–119, 23–53, https://doi.org/10.1016/S1040-6182(03)00129-0, 2004.
Sinclair, D. J., Banner, J. L., Taylor, F. W., Partin, J., Jenson, J., Mylroie, J., Goddard, E., Quinn, T., Jocson, J., and Miklavic, B.: Magnesium and strontium systematics in tropical speleothems from the Western Pacific, Chem. Geol., 294, 1–17, https://doi.org/10.1016/j.chemgeo.2011.10.008, 2012.
Smart, P. L. and Friederich, H.: Water movement and storage in the unsaturated zone of a maturely karstified carbonate aquifer, in: Proceedings of the conference on Environmental Problems in Karst Terranes and their Solutions, Dublin, Ohio, 59–87, 1987.
Steig, E. J., Gkinis, V., Schauer, A. J., Schoenemann, S. W., Samek, K., Hoffnagle, J., Dennis, K. J., and Tan, S. M.: Calibrated high-precision 17O-excess measurements using laser-current tuned cavity ring-down spectroscopy, Atmos. Meas. Tech., 7, 2421–2435, https://doi.org/10.5194/amt-7-2421-2014, 2014.
Sturman, A. and Tapper, N.: The Weather and Climate of Australia and New Zealand, Oxford University Press, Australia, 1–541, 2014.
Tadros, C. V., Treble, P. C., Baker, A., Fairchild, I., Hankin, S., Roach, R., Markowska, M., and McDonald, J.: ENSO–cave drip water hydrochemical relationship: a 7-year dataset from south-eastern Australia, Hydrol. Earth Syst. Sci., 20, 4625–4640, https://doi.org/10.5194/hess-20-4625-2016, 2016.
Tremaine, D. M. and Froelich, P. N.: Speleothem trace element signatures: A hydrologic geochemical study of modern cave dripwaters and farmed calcite, Geochim. Cosmochim. Ac., 121, 522–545, https://doi.org/10.1016/j.gca.2013.07.026, 2013.
Tremaine, D. M., Sinclair D. J., Stoll, H. M., Lagerström, M., Carvajal, C. P., and Sherrell, R. M.: A two-year automated dripwater chemistry study in a remote cave in the tropical south Pacific: Using [Cl−] as a conservative tracer for seasalt contribution of major cations, Geochim. Cosmochim. Ac., 184, 289–310, https://doi.org/10.1016/j.gca.2016.03.029, 2016.
Uechi, Y. and Uemura, R.: Dominant influence of the humidity in the moisture source region on the 17O-excess in precipitation on a subtropical island, Earth Planet. Sc. Lett., 513, 20–28, https://doi.org/10.1016/j.epsl.2019.02.012, 2019.
Ummenhofer, C. C. and England, M. H.: Interannual Extremes in New Zealand Precipitation Linked to Modes of Southern Hemisphere Climate Variability, J. Climate, 20, 5418–5440, https://doi.org/10.1175/2007JCLI1430.1, 2007.
Wang, Y. J., Cheng, H., Edwards, R. L., An, Z. S., Wu, J. Y., Shen, C.-C., and Dorale, J. A.: A High-Resolution Absolute-Dated Late Pleistocene Monsoon Record from Hulu Cave, China, Science, 294, 2345–2348, https://doi.org/10.1126/science.1064618, 2001.
Wang, Y. J., Cheng, H., Edwards R. L., Kong, X., Shao, X., Chen, S., Wu, J., Jiang, X., Wang, X., and An, Z.: Millennial-and orbital-scale changes in the East Asian monsoon over the past 224,000 years, Nature, 451, 1090–1093, https://doi.org/10.1038/nature06692, 2008.
Wassenburg, J., Immenhauser, A., Richter, D. K., Jochum, K. P., Fietzke, J., Deininger, M., Goos, M., Scholz, D., and Sabaoui, A.: Climate and cave control on Pleistocene/Holocene calcite-to-aragonite transitions in speleothems from Morocco: Elemental and isotopic evidence, Geochim. Cosmochim. Ac., 92, 23–47, https://doi.org/10.1016/j.gca.2012.06.002, 2012.
Williams, P. W. and Fowler, A.: Relationship between oxygen isotopes in rainfall, cave percolation waters and speleothem calcite at Waitomo, New Zealand, J. Hydrol., 41, 53–70, 2002.
Wong, C. I., Banner, J. L., and Musgrove, M.: Seasonal dripwater Ma∕Ca and Sr∕Ca variations driven by cave ventilation: Implications for and modelling of speleothem paleoclimate records, Geochim. Cosmochim. Ac., 75, 3514–3529, https://doi.org/10.1016/j.gca.2011.03.025, 2011.