the Creative Commons Attribution 4.0 License.
the Creative Commons Attribution 4.0 License.
 | 30 Apr 2020
Contribution of understory evaporation in a tropical wet forest during the dry season
César Dionisio Jiménez-Rodríguez
Miriam Coenders-Gerrits
Jochen Wenninger
Adriana Gonzalez-Angarita
Hubert Savenije
Tropical wet forests are complex ecosystems with a large number of plant species. These environments are characterized by a high water availability throughout the whole year and a complex canopy structure. However, how the different sections of the canopy contribute to total evaporation is poorly understood. The aim of this work is to estimate the total evaporation flux and differentiate the contribution among canopy layers of a tropical wet forest in Costa Rica. The fluxes were monitored during the dry season by making use of the energy balance to quantify the fluxes and stable water isotopes to trace the sources of water vapor. Total evaporation was 275.5 mm and represents 55.9 % of the recorded precipitation (498.8 mm), with 11.7 % of the precipitation being intercepted and evaporated along the forest canopy. The understory beneath 8 m contributed 23.6 % of the evaporation, and almost half of it comes from the first 2 m of the understory. Stable water isotope signatures show different soil water sources depending on the plant type. Palms make use of a water source with an isotope signature similar to precipitation and throughfall. Soil water with a fractionated signature is used by trees, bushes and lianas. The isotope signature of water vapor samples overlap among different heights, but it was not possible to make use of the Keeling plot method due to the similar isotope signature of the possible sources of water vapor as well as the high water concentration even on the dryer days.
- Article
(8914 KB) - Full-text XML
- BibTeX
- EndNote


Total evaporation (E) of forest ecosystems includes water vapor originating from transpiration (Et), soil evaporation (Es) and the intercepted water evaporated from wet surfaces (Ei) (Roberts, 1999; Savenije, 2004; Shuttleworth, 1993). Evaporation from tropical forests exports more than 1000 mm yr−1 of water to the atmosphere (Lion et al., 2017; Loescher et al., 2005; Sun et al., 2016). Partitioning of E is usually focused on the differentiation among Et, Es and Ei (Kool et al., 2014; Moore et al., 2018; Xiao et al., 2018). However, the contributions of different sections of the canopy in forest ecosystems are often not considered and are not yet fully understood. The differentiation of E fluxes according to the vertical forest structure had been performed in savanna woodlands and boreal forests (Heijmans et al., 2004; Iida et al., 2009; Scott et al., 2003; Yepez et al., 2003). However, in tropical regions, the vegetation is more complex than the aforementioned ecosystems (savanna woodlands and boreal forests) and few data concerning the differentiation between understory and overstory evaporation are available (Aparecido et al., 2016; Loescher et al., 2005; Read, 1968).
In tropical forest ecosystems (TFEs) the available radiation along the canopy determines the photosynthesis rates and consequently the Et flux (Hogan and Kattan, 2002). The high radiation received by the overstory in tropical forests allow the emergent trees to transpire more water (Aparecido et al., 2016). Differences in forest evaporation between wet and dry seasons depend on energy and water availability, respectively. Water availability during the wet season does not limit the forest evaporation, which depends mostly on the available energy along the canopy gradient (Hogan and Kattan, 2002; Loescher et al., 2005). Contrary to the wet season, the dry season experiences a strong reduction in the precipitation rates triggering physiological responses from the trees. One of these responses is the increment of litterfall (Peters, 2016; Raich, 2017), which depends on precipitation and wind conditions. This temporal drop of leaves during the dry season allows the creation of a thinner canopy layer with respect to the canopy in the wet season, which can alter the transpiration of understory species such as Geonoma cuneata H. Wendl. ex Spruce or Piper arieianum C.DC. which exploit the most shaded microsites (Chazdon, 1986, 1992). Thus most of the total evaporation is coming from the overstory during the dry season (Kunert et al., 2017). The understory environment of tropical moist forests is highly variable. This layer receives up to 4 % of the radiation received by the overstory, while canopy gaps can receive 4.3 times more radiation (Tymen et al., 2017) and a vapor pressure deficit almost 3 times higher (Fetcher et al., 1985). These conditions can induce larger transpiration rates as consequence of the plant physiological response to rise in air temperature and vapor pressure deficit (Adelman et al., 2008; Hogg and Hurdle, 1997). This determines the small daily contribution of the understory heat fluxes to the net radiation. However, during days with low net radiation this contribution can be significant at ecosystem level (Loescher et al., 2005). Additionally, the soil water reservoir used by understory shrubs and overstory trees differs. Shrub plants are more dependent on soil water, whereas the trees can access deeper water reservoirs (Ghimire et al., 2018). The number of plant species in TFE can exceed 50 species ha−1 (Eilu et al., 2004; Naidu and Kumar, 2016) with densities above 500 trees ha−1 (Crowther et al., 2015). Also, the heterogeneous spatial aggregation of tree species in TFEs (Volkov et al., 2005) increases the number of variables that influences the Et flux. This increases the number of Et sources, making it difficult to differentiate between other evaporation fluxes such as Es or Ei.
The introduction of stable water isotopes in hydrology allowed the refinement of evaporation partitioning (Miralles et al., 2011; Wang et al., 2014), thus complementing the hydrometric data and providing information about the source of water vapor as a descriptor of the evaporation process (Blyth and Harding, 2011; Dubbert et al., 2017; Silvertown et al., 2015). Stable isotope signatures (δ18O and δ2H) of different soil water reservoirs may differ due to isotope fractionation, as well as mixing and diffusion processes (Kendall and McDonell, 1998; Hsueh et al., 2016; Sprenger et al., 2016). These processes happen throughout the soil profile with differences in magnitude. Soil evaporation drives the isotopic fractionation of soil water at the superficial soil layers (Dawson and Simonin, 2011; Sutanto et al., 2012). The soil evaporation rate is affected by the presence of different vegetation types or ground layer types (Magliano et al., 2017; Sprenger et al., 2017; Raz-Yaseef et al., 2010). This will change the spatial distribution of isotope signatures with augmented differences because of the enriched isotope signature of throughfall water reaching the forest floor (Allen et al., 2016; Dawson and Simonin, 2011). Plant water uptake has been considered as a non-fractionation process (Ehleringer and Dawson, 1992; Guo et al., 2016) except for plant species growing in saline or xeric environments (Ellsworth and Williams, 2007). However, recent evidence has shown that tree species such as Pinus sylvestris L., Quercus subpyrenaica Villar, Persea americana Mill., Fagus sylvatica L. and Populus euphratica Oliv. are able to fractionate the isotope signatures of xylem water (Barbeta et al., 2019; Martín-Gómez et al., 2016; Vargas et al., 2017; Zhao et al., 2016). This raises the question of whether tropical trees modify the isotope signature of xylem water, as a response to their plasticity to seasonal changes despite their similar root distribution (Schwendenmann et al., 2015). Different vegetation types (e.g., trees, palm trees, lianas) partly determine the plant root system (Groff and Kaplan, 1988), and with it the capacity to access specific soil water reservoirs. The transpired water has heavier isotope signatures than xylem water as a consequence of the photosynthesis process (Dubbert et al., 2014; Yakir and Sternberg, 2000), differing from the water source used by the plant. This provides a tool to trace or compare the different sources of water vapor in the air.
The structural complexity of TFE is defined by environmental variables such as altitude, climate and geomorphology (Holdridge and Tosi, 1967; Gomez, 1986; Hartshorn, 2002; Guariguata and Ostertag, 2002). The forest canopy can be segmented into four layers according to vegetation height and light requirements. First, the overstory includes all the trees fully illuminated at the top of the canopy. It is followed by the understory which is composed of woody plants located in the shade beneath the overstory. Third, the ground layer includes all seedlings, herbaceous vegetation and small shrubs. Finally, the forest floor includes the uppermost layer of soil (O horizon) and the litter layer lying on it (Nadkarni et al., 2004; Parker, 1995). Tropical canopies have a wide number of epiphytes growing on the tree tops along the canopy that influence the effective precipitation, water uptake and E processes (Ah-Peng et al., 2017; Cavelier and Vargas, 2002; Gotsch et al., 2016; Porada et al., 2018; Zotz, 2016), thus allowing the tall canopies to create a microclimate below its shadow (Fitzjarrald and Moore, 1995; Frey et al., 2016; Nakamura et al., 2017). These differences are linked to the energy balance variation along the forest profile, resulting in changes in total evaporation (Ehleringer and Dawson, 1992). Most of the evaporation studies in the tropics focus on yearly patterns (Baldocchi and Ryu, 2011; Calder et al., 1986; da Rocha et al., 2009; Loescher et al., 2005; Schellekens et al., 2000), the wet season (Read, 1968; Wright et al., 2017) or time windows of less than one day to study specific processes such as aerodynamic conductance (Holwerda et al., 2012). But few attempts at deepening the knowledge of dry season evaporation have been made (Harper et al., 2014). Tropical forests are highly sensitive to water variability (Tan et al., 2013) and understory light availability (Brenes-Arguedas et al., 2011), which are the main factors defining the distribution of plant species. This because tree seedlings are prompted to use water dripping by short, low-intensity rain events and condensation of occasional fog immersion during the dry season (Fu et al., 2016; Liu et al., 2010; Obregon et al., 2011). Consequently, changes in the canopy conditions can modify the understory composition and with it the future forest evaporation. The aforementioned process underlines the need to provide more information about the evaporation process during the dry season in tropical forests, as well as the role played by understory vegetation during forest evaporation. This work aims (1) to estimate the total evaporation flux during the dry season in a tropical wet forest, (2) to differentiate the contribution among canopy layers depending on their location with the canopy, (3) to define the contribution of plant transpiration to the dry season evaporation at the forest level, and (4) to describe the temporal dynamics of the stable isotope signatures during the dry season. To study this, we made use of the energy balance to quantify the fluxes and stable water isotopes to trace the sources of water vapor.
2.1 Study site
La Selva Biological Station (LSBS) is located on the Caribbean lowlands of Costa Rica (10∘26′00′′ N–83∘59′00′′ W) (Fig. 1). This region has a mean annual precipitation of 4351 mm yr−1, with a monthly precipitation of more than 100 mm per month (Loescher et al., 2005). A short dry season is present in this region between February and April and it is characterized by a reduction of precipitation without experiencing a water deficit (Sanford et al., 1994; Lieberman and Lieberman, 1987). Monthly precipitation during the dry and wet season is 193.7 and 419.2 mm per month, respectively. The mean annual temperature is 26.3 ∘C, with a mean daily difference of 9.5 ∘C between the lowest and the highest temperature. The potential evaporation (Ep) accounts for 1585 mm yr−1 (Fig. 2). The research station is covered by a series of old-growth and secondary forests, as well as small forest plantations of different species and mixed plots (Fig. 1) (Putman et al., 2019).
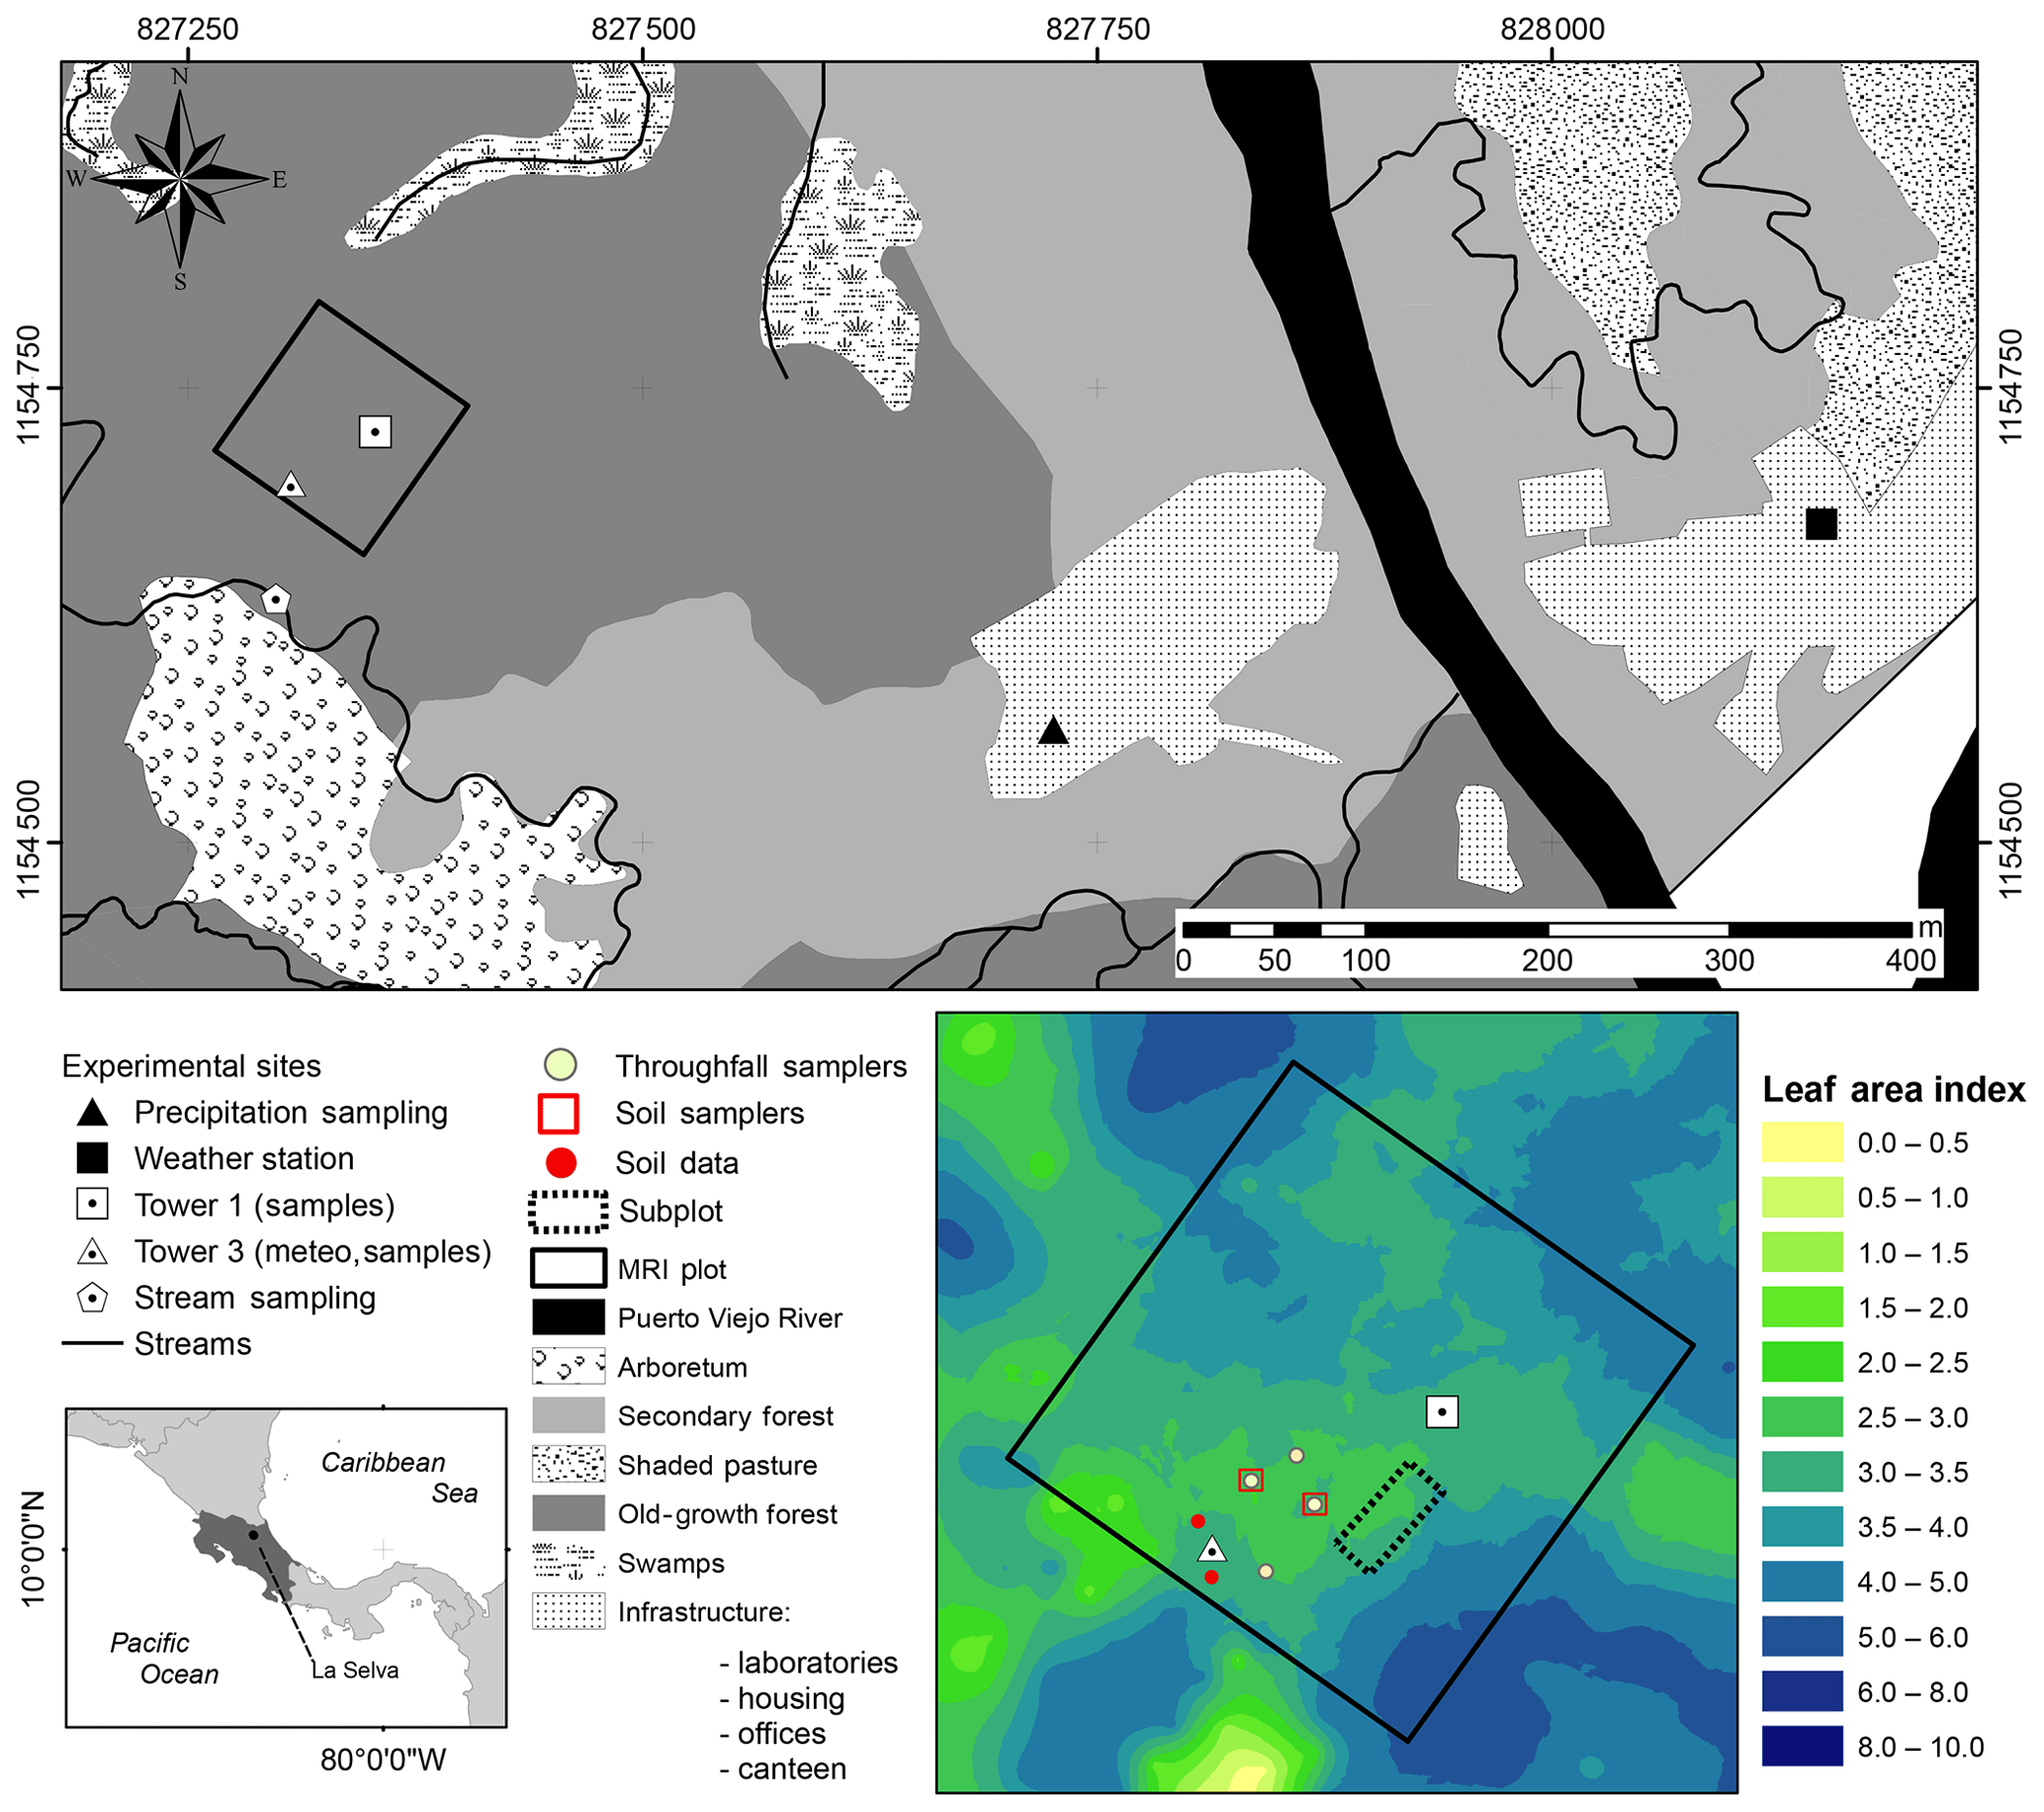
Figure 1Location of sampling points and the major research infrastructure (MRI plot) plot at La Selva Biological Station in Puerto Viejo de Sarapiquí, Costa Rica. The land cover map shows the location of the MRI plot in the old-growth forest and the bottom-left image depicts the leaf area index (LAI) distribution in the plot.
The monitoring period included the dry season of 2018 for 62 d between 25 January 2018 and 26 March 2018. During this period the meteorological data were collected continuously and the water sampling was done during three different periods: 30 January to 9 February 2018 (sampling period A), 19 to 26 February 2018 (sampling period B) and 19 to 25 March 2018 (sampling period C). This study was carried out at the major research infrastructure plot () which has an area of 1 ha of old-growth forest located on the middle terrace of the Puerto Viejo river (Sanford et al., 1994). The MRI plot is situated in the upper section of a small hill facing southwest towards an affluent of the Puerto Viejo river. The soil is classified as Inceptisol (Andic Humidotropept) under the USDA classification system (Sollins et al., 1994). This plot has 88 species among trees, lianas and palms with more than 10 cm of diameter (see Appendix A). Tree density was 371 trees ha−1 in 2017 with 60.6 % of the trees within 10–20 cm diameter. The most abundant species are the palm Welfia regia H.Wendl. and the tree Pentaclethra macroloba (Willd.) Kuntze, with 56 and 43 trees ha−1, respectively. Based on data from Tang et al. (2012), the average leaf area index (LAI) of the plot in 2005 was 3.56 m2 m−2 (Fig. 1). Also, this plot is located within an area of small changes of top canopy height and a neutral change of tree biomass fixation (Dubayah et al., 2010). Canopy structure on the MRI plot was split into three layers. The lower understory (lu) ranges from the ground surface up to 2 m height and includes the ground surface, the litter layer and small shrubs. The upper understory (uu) goes up to 10 m height, covering the crowns of medium palms, tall bushes and small trees. The overstory (ov) is the tallest canopy layer and it includes the crowns of the tallest trees of the plot (see Appendix A).
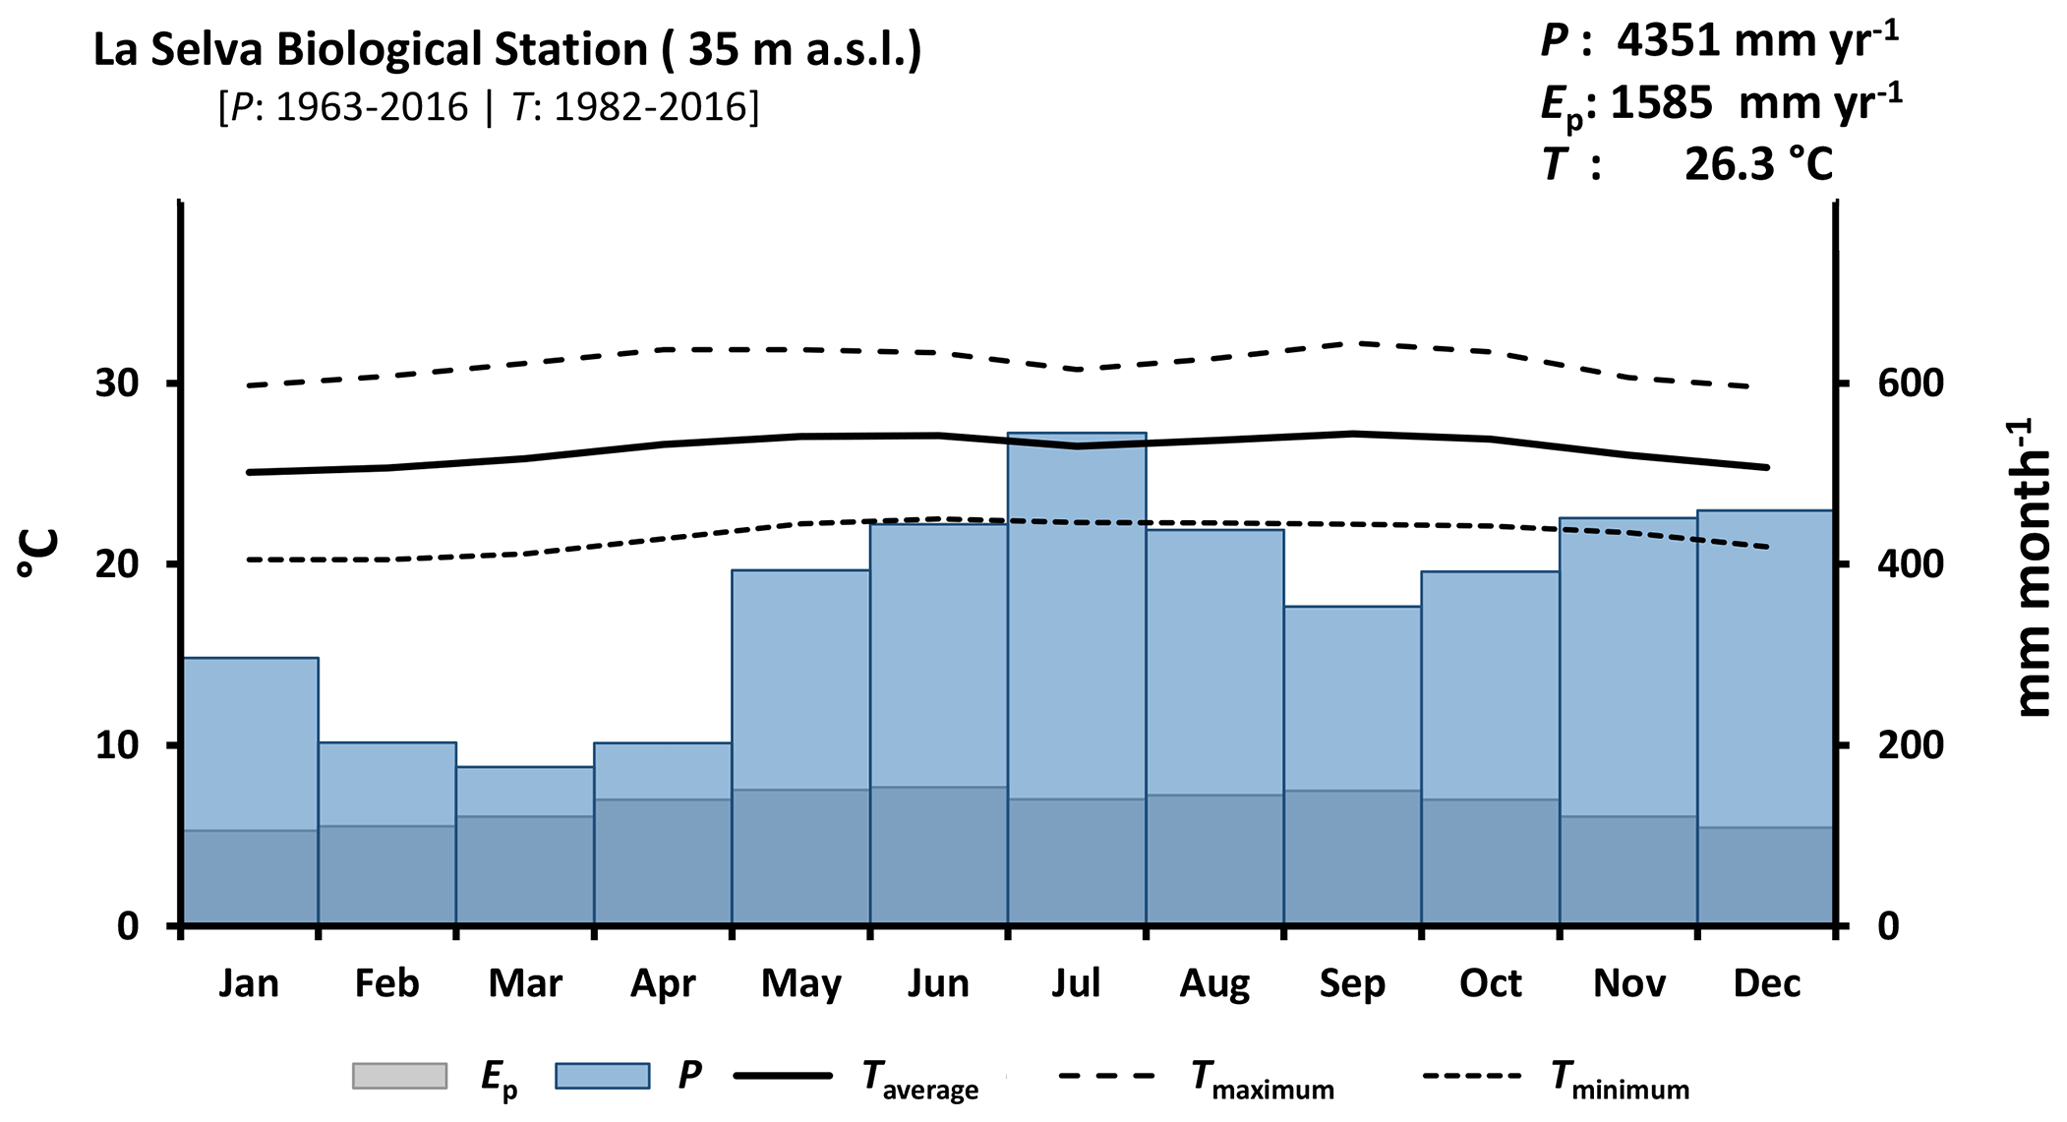
Figure 2Climate diagram of La Selva Biological Station based on records of 54 years of precipitation (P) and 35 years of temperature (T) (source: https://tropicalstudies.org/, last access: 6 April 2018). The potential evaporation (Ep) was estimated with the temperature data and Thornthwaite equation (Thornthwaite, 1948).
2.2 Instrumentation
A meteorological station is located 750 m east from the MRI plot (Fig. 1). This station monitors precipitation, air temperature, relative humidity, solar radiation, photosynthetic active radiation, atmospheric pressure, leaf wetness, wind speed and wind direction (Table B1). All sensors are controlled by a Campbell Scientific© data logger, averaging the data over 15 min time intervals and storing it automatically on an online server at the research station. The MRI plot has three research towers with different heights (Tower 1: 34 m, Tower 2: 25 m (under repair during the experiment) and Tower 3: 43 m). Tower 3 is located within a canopy depression of around 400 m2, and the other two towers allow the access to the forest canopy at the center of the plot (Fig. 1). a series of sensors were placed along Tower 3 to monitor different meteorological variables during the study period. Air temperature and relative humidity were installed 1.5 m away from the tower structure at 2, 10, 37 and 43 m height and protected with a radiation shield (ONSET®; RS3-B). Precipitation, solar radiation and photosynthetic active radiation were measured at the highest point of Tower 3 (Table B1). Soil temperature, soil moisture and solar radiation were measured at ground level near the base of the tower. The radiation data were recorded with a Campbell Scientific© data logger (model: CR10x) every 15 min; soil temperature was recorded with a HOBO 4-channel data logger (ONSET® part code: U12-008) and the other sensors with a HOBO USB Micro Station (ONSET® part code: H21-USB) every 5 min.
Throughfall measurements were carried out at ground level with 15 rain gauges, 12 of them distributed within a subplot of 200 m2 (Fig. 1) to estimate the bulk throughfall and 3 additional ones placed around Tower 3 to collect daily samples. The measurements were carried out every 24 h before 07:00 LT (local time). When isolated rain events happened during the day, the precipitation was measured right after the event. Throughfall was measured in milliliters with a measuring cylinder of 500 mL and a scale of 0.5 mL. All volumes were translated into millimeters of water according to the rain gauge surface area. Leaf area index (Γ, m2 m−2) was determined with hemispherical pictures collected at the rain gauge locations within the MRI plot at 50 cm height from the ground. These images were processed with the Gap Light Analyzer (GLA) software (Frazer et al., 1999). All dasometric data of the MRI plot were provided by the scientific team of LSBS. This data set includes the scientific names of all trees, palms and lianas with more than 10 cm diameter measured at 1.3 m height, as well as the branching heights (m) and tree diameters (cm).
2.3 Water sampling
Different sets of liquid samples were collected at the MRI plot, in a stream located 50 m downhill from the MRI plot, and at an open area located 400 m southeast from the MRI plot (Fig. 1). Samples of bulk precipitation were collected at the open area on an event basis to determine the isotope variation from individual rainfall events, while overnight precipitation was collected the next day before 06:00 LT. The samples were collected manually and the reservoir was replaced immediately after the measurement. The additional set of 4 rain gauges collecting bulk throughfall were placed around Tower 3 and sampled on a daily basis or shorter if it was possible. Soil water from the unsaturated zone was collected on a daily basis with soil moisture samplers (Eijkelkamp part number: 19.21.SA) of 10 cm length, with a porous polymer of 0.15 µm diameter. Soil water sampling was carried out at 2 locations around Tower 3, extracting the samples from 5 and 15 cm depth in each location. The first 0.5 mL of every sampling was discarded to reduce the contamination from previous soil water extractions. Stream samples were sampled daily during the low flows at the end of the sampling period as a proxy of the groundwater signature. This was a consequence of the absence of boreholes near the MRI plot. Water vapor samples were collected with a test tube of 30 mL of borosilicate immersed in an isolated container of 500 mL filled with dry ice (−70 ∘C). The collection was performed at least every 3 h depending on the meteorological conditions and dry ice availability during the sampling period. The samples were collected at Tower 3 at 43 m height. Transpired water was collected from the canopy of different plant species surrounding the towers. These samples were collected with polyethylene bags at least every 6 h and transferred immediately to 1.5 mL borosilicate vials. Xylem water was extracted daily from branches or exposed roots at midday for four types of plants: palms (17 samples from 5 species), trees (21 samples from 11 species), bushes (17 samples from 10 species) and lianas (12 samples from 5 species). Detailed information on the sampled species can be found in the supplemental material. The sampled plants were selected randomly according to the plant type from all the individuals within the MRI plot. The bark of each sample was removed before the water extraction. The xylem sample was placed within a 50 mL test tube with an insert of 30 mL and a DURAPORE® membrane filter (PES-45/25, 0.45 µm, HV). The water was extracted through centrifugation at 5000 rpm for 30 min, immediately transferring the extracted water to 1.5 mL vials. All liquid samples were stored at 6 ∘C, whilst xylem water was stored at −10 ∘C to prevent the decomposition of the dissolve organics in the sample and the formation of fungi until the water samples were analyzed.
2.4 Energy fluxes
The latent heat flux (ρλE, W m−2) was determined using the energy balance equation (Eq. 1) from the ground up to 2, 8 and 43 m (Fig. 3). This equation is based on the vertical transport of heat, neglecting the advected energy due to the lack of more detailed measurements (e.g., eddy covariance system). However, the tower location (away from treefall gaps and at a hilltop) minimizes major effects of understory canopy advection (Loescher et al., 2005). The net radiation (Rn, W m−2) was calculated with Eq. (2), applying an albedo (a) value of 0.12 according to Loescher et al. (2005) for this forest type and incoming shortwave radiation (R↓S). Incoming (R↓L) and outgoing (R↑L) longwave radiation (W m−2) were determined for every time step (see Appendix C). Ground heat flux (G, W m−2) was calculated with Eq. (3) using the temperature difference (dT) between the soil temperature at 5 cm depth and the superficial soil temperature (Ts0) (see Appendix D). A soil thermal conductivity (k) of 1.58 (Pielke, 2013) was used to determine G considering the soil clay content and soil moisture condition of more than 0.40 m3 m−3 during the study period. The sensible heat flux (H, W m−2) was determined using Eq. (4), where Ta is the air temperature (∘C) at the different heights, ρa is the air density (kg m−3), cp is the specific heat of the air ( ), and ra (s m−1) is the aerodynamic resistance to heat transfer (see Appendix E).
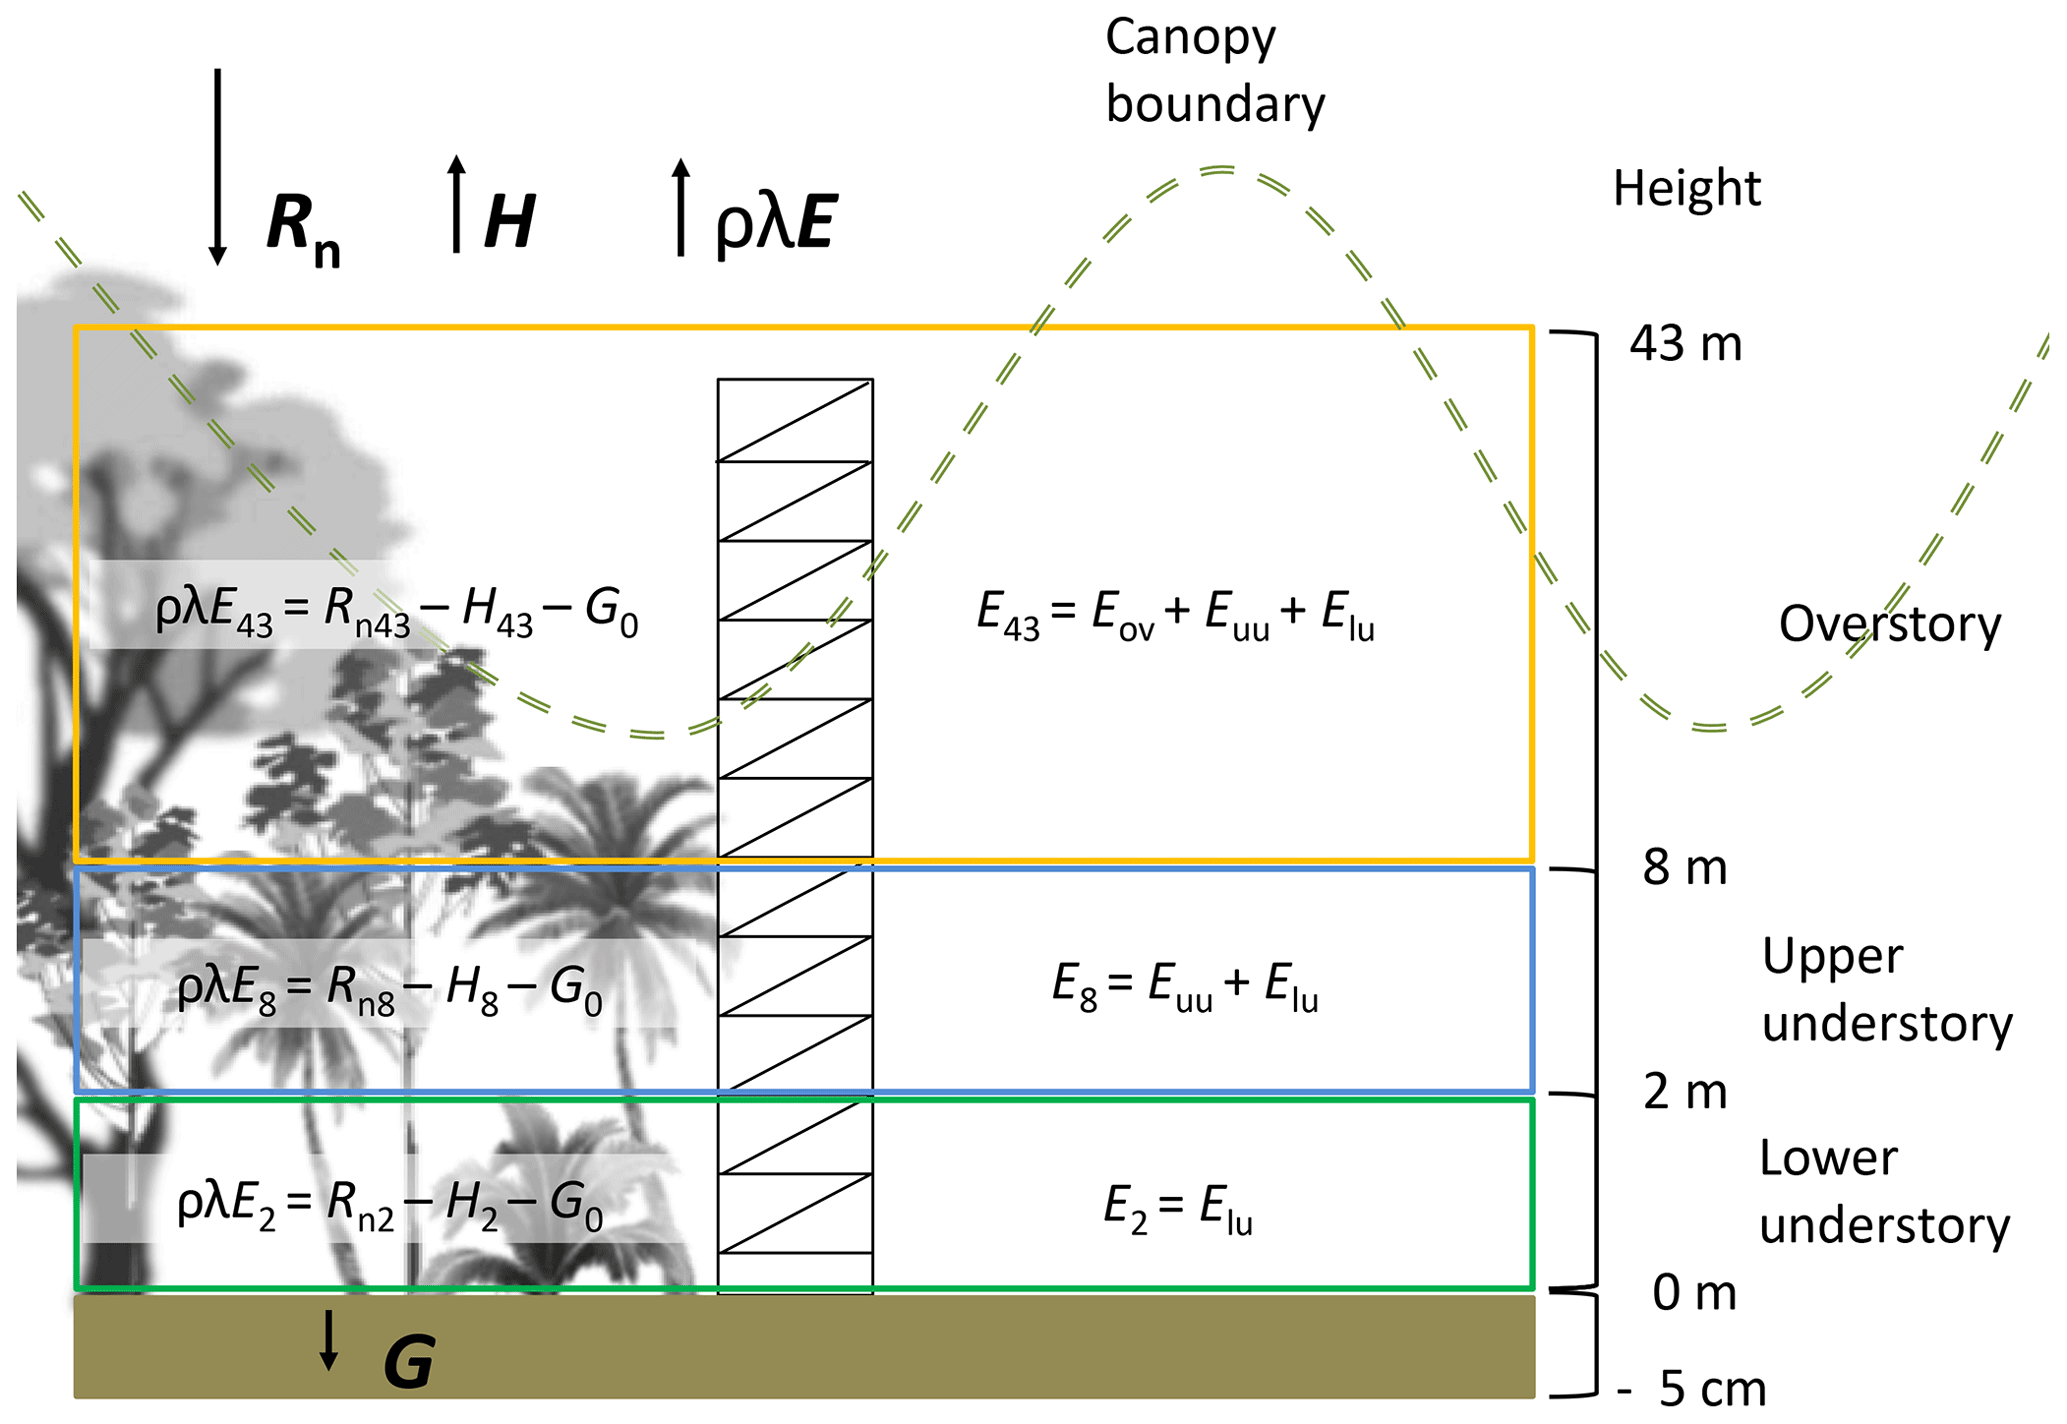
Figure 3Diagram showing the distribution of canopy layers applied for the partitioning of energy and evaporation fluxes. This diagram also shows the components used for the estimation of the energy balance and its relationship with the estimates of evaporation.
2.5 Isotopic analysis
Relative isotope concentrations of deuterium (δ2H) and oxygen–18 (δ18O) with respect to the Vienna Standard Mean Ocean Water (VSMOW) were measured with a Liquid Water Isotope Analyzer (LWIA; model 912-0008) from Los Gatos Research (LGR). We used the software LIMS 10.083 for lasers (Coplen, 2000) during the calibration, correction and determination of the stable isotope signatures of the analyzed samples. The relative concentrations were determined following Eq. (5) (Craig, 1961), where δ represents the relative concentration (‰) of the stable isotopes δ2H or δ18O, and R is defined as the stable isotope ratio (2H∕1H or 18O∕16O) of the standard water (Rstandard) and the sample (Rsample). Equation (6) determines the line-conditioned excess (lc-excess) based on the local meteoric water line (LMWL) defined for La Selva Biological Station by Sánchez-Murillo et al. (2013) as .
The “Keeling method” (Eq. 7) was used to determine the contribution of transpiration to the atmospheric water vapor signature of total evaporation (Keeling, 1958; Xiao et al., 2018; Yakir and Sternberg, 2000; Zhang et al., 2010). This method applies the mass balance equation, assuming that atmospheric water vapor concentration of the ecosystem (Ceco) has the stable isotope signature of δeco as a result of the mixture of a background atmospheric concentration (Ca) with stable isotope signature of δa and water vapor contributed by ecosystem transpiration with an isotope signature of δt. The intercept of this equation represents the net contribution of the ecosystem transpiration.
2.6 Data analysis
Data processing and analysis were performed with the software R (R Core Team, 2017). All data collected from the sensors were summarized in 15 min time intervals to be comparable with the data from the meteorological station of LSBS. The evaporation contribution of the overstory (ov), upper understory (uu) and lower understory (lu) layers was estimated with Eqs. (8–10). Also, the vapor pressure deficit (VPD) was calculated in kilopascals based on the difference between saturation vapor pressure (es)na and actual vapor pressure (ea) calculated based on the air temperature (Ta) and dew temperature (Tdew) of each height. The lc-excess of the samples was used to determine the presence of statistical differences among sample types and the temporal differences within each sample type. As the samples did not follow a normal distribution, a non-parametric analysis was applied. The presence of differences in lc-excess among and within sample types was determined with a Kruskal–Wallis test and the pairwise comparisons were carried out with a Wilcoxon rank sum test.
3.1 Meteorological and canopy conditions
Canopy openness and LAI at the MRI plot were 14.4±3.4 % and 2.6±0.3 m2 m−2, respectively. During the dry season some trees species experienced a partial loss of leaves (e.g., P. macroloba, Pterocarpus sp. or Virola koschnyi Warb.); this reduces the LAI locally at the end of the sampling period. Rain events during the monitoring period of 62 d had a random distribution, recording a total precipitation of 536.2 mm (see Appendix G). After 1 February 2018, the rain events' intensity experienced a diminution, while the frequency and length of dry periods increased after this date. The occurrence of precipitation affects the VPD, registering maximum values above 2.0 kPa during the hottest and driest days (Fig. G1). The wind was predominantly from the southeast, with an average magnitude of 0.97 m s−1 and a maximum of 4.34 m s−1. The low average is a consequence of the high frequency of wind speed lower than 2 m s−1 and the wide presence of calms. These calms () are present during 27.8 % of the monitoring period. Daily air temperature oscillates between 17.8 and 32.5 ∘C. The presence of rains reduces the VPD, which does not exceed 3 kPa.
Air temperature differs among canopy heights and between day- and nighttime (Fig. 4). At 43 and 8 m height the air temperature has a daily range of more than 10 ∘C, while at 2 m height the range is smaller (). However, nighttime conditions along the canopy profile keep the same pattern without strong differences. Superficial soil temperature does not have differences between day- and nighttime, showing the same range of temperatures. However, the differences during day- and nighttime are driven by the median temperature as a consequence of energy dynamics at ground level.

Figure 4Histograms of the data collected during 62 d of monitoring along the canopy profile of the forest. The variables vapor pressure deficit (VPD), soil moisture (θ), and air and soil temperature (T), as well as the energy fluxes (Rn, G, Ris, H, λρE) and evaporation (E) at 43, 8, 2 and 0 m height are compared during day- and nighttime. Daytime is defined as the period between 06:00 and 18:00 LT and nighttime between 18:00 and 06:00 LT. Negative values of λρE were considered as 0 mm h−1 of E.
The VPD at the forest canopy changes with respect to the height. VPD at 43 m height registered the largest values along the monitoring period during daytime, dropping below 1.0 kPa at night (Fig. 4). VPD daytime conditions at 8 m height are similar to those at 43 m. Beneath the canopy at 2 m height the VPD has a similar trend to night conditions at 43 m height, with values not larger than 1.0 kPa. This reflects the saturated air conditions close to the forest floor despite the high air temperatures at the site, as it is evidenced by the larger frequency of VPD with 0 kPa. Soil moisture conditions at the MRI plot oscillate between 0.42 and 0.48 m3 m−3, without differences between day- and nighttime conditions.
Daily variation of relative humidity along the canopy profile differs depending on the canopy height. During sunny days, the conditions at 43 m shows are the driest, reaching a lower point of 45.2 % and only reaching 100 % during rainfall events. The average relative humidity at 43 m height is 80.9±14.3 %. At 8 m height, the relative humidity has an average of 90.1±11.3 %, with the driest point of 52.3 %. Close to the forest floor, the relative humidity remains close to saturation even during sunny days. At 2 m height, the average relative humidity is 97.2±4.8 %, with the driest point of 71.0 % during the driest day.
3.2 Fluxes
Between 26 January 2018 and 25 March 2018 a total amount of 492.8 mm of precipitation was recorded, with 4 d of more than 20 mm d−1 (Fig. 5). Daily measurements of throughfall performed manually at the MRI plot show that the canopy is able to intercept 11.7 % of the accumulated precipitation (see Appendix H). This interception includes the effect of the three canopy layers, which remain wet 61.2 % of the time according to the leaf wetness sensor. Most of the events registered an interception fraction between 0.38 to 0.40. It is important to mention the lack of stem flow measurements at the MRI plot due to the diversity of plant types and species, as well as the high tree density. This can result in an overestimation of the interception of no more than 2.0 % of precipitation for tropical forests (Cavelier and Vargas, 2002; Tobón Marin et al., 2000; Sa et al., 2016). Soil moisture conditions during the study period remain stable, with only a few minor changes during the monitoring period (Fig. 4). The larger values observed in soil moisture are the result of the large amount of throughfall during rain events.
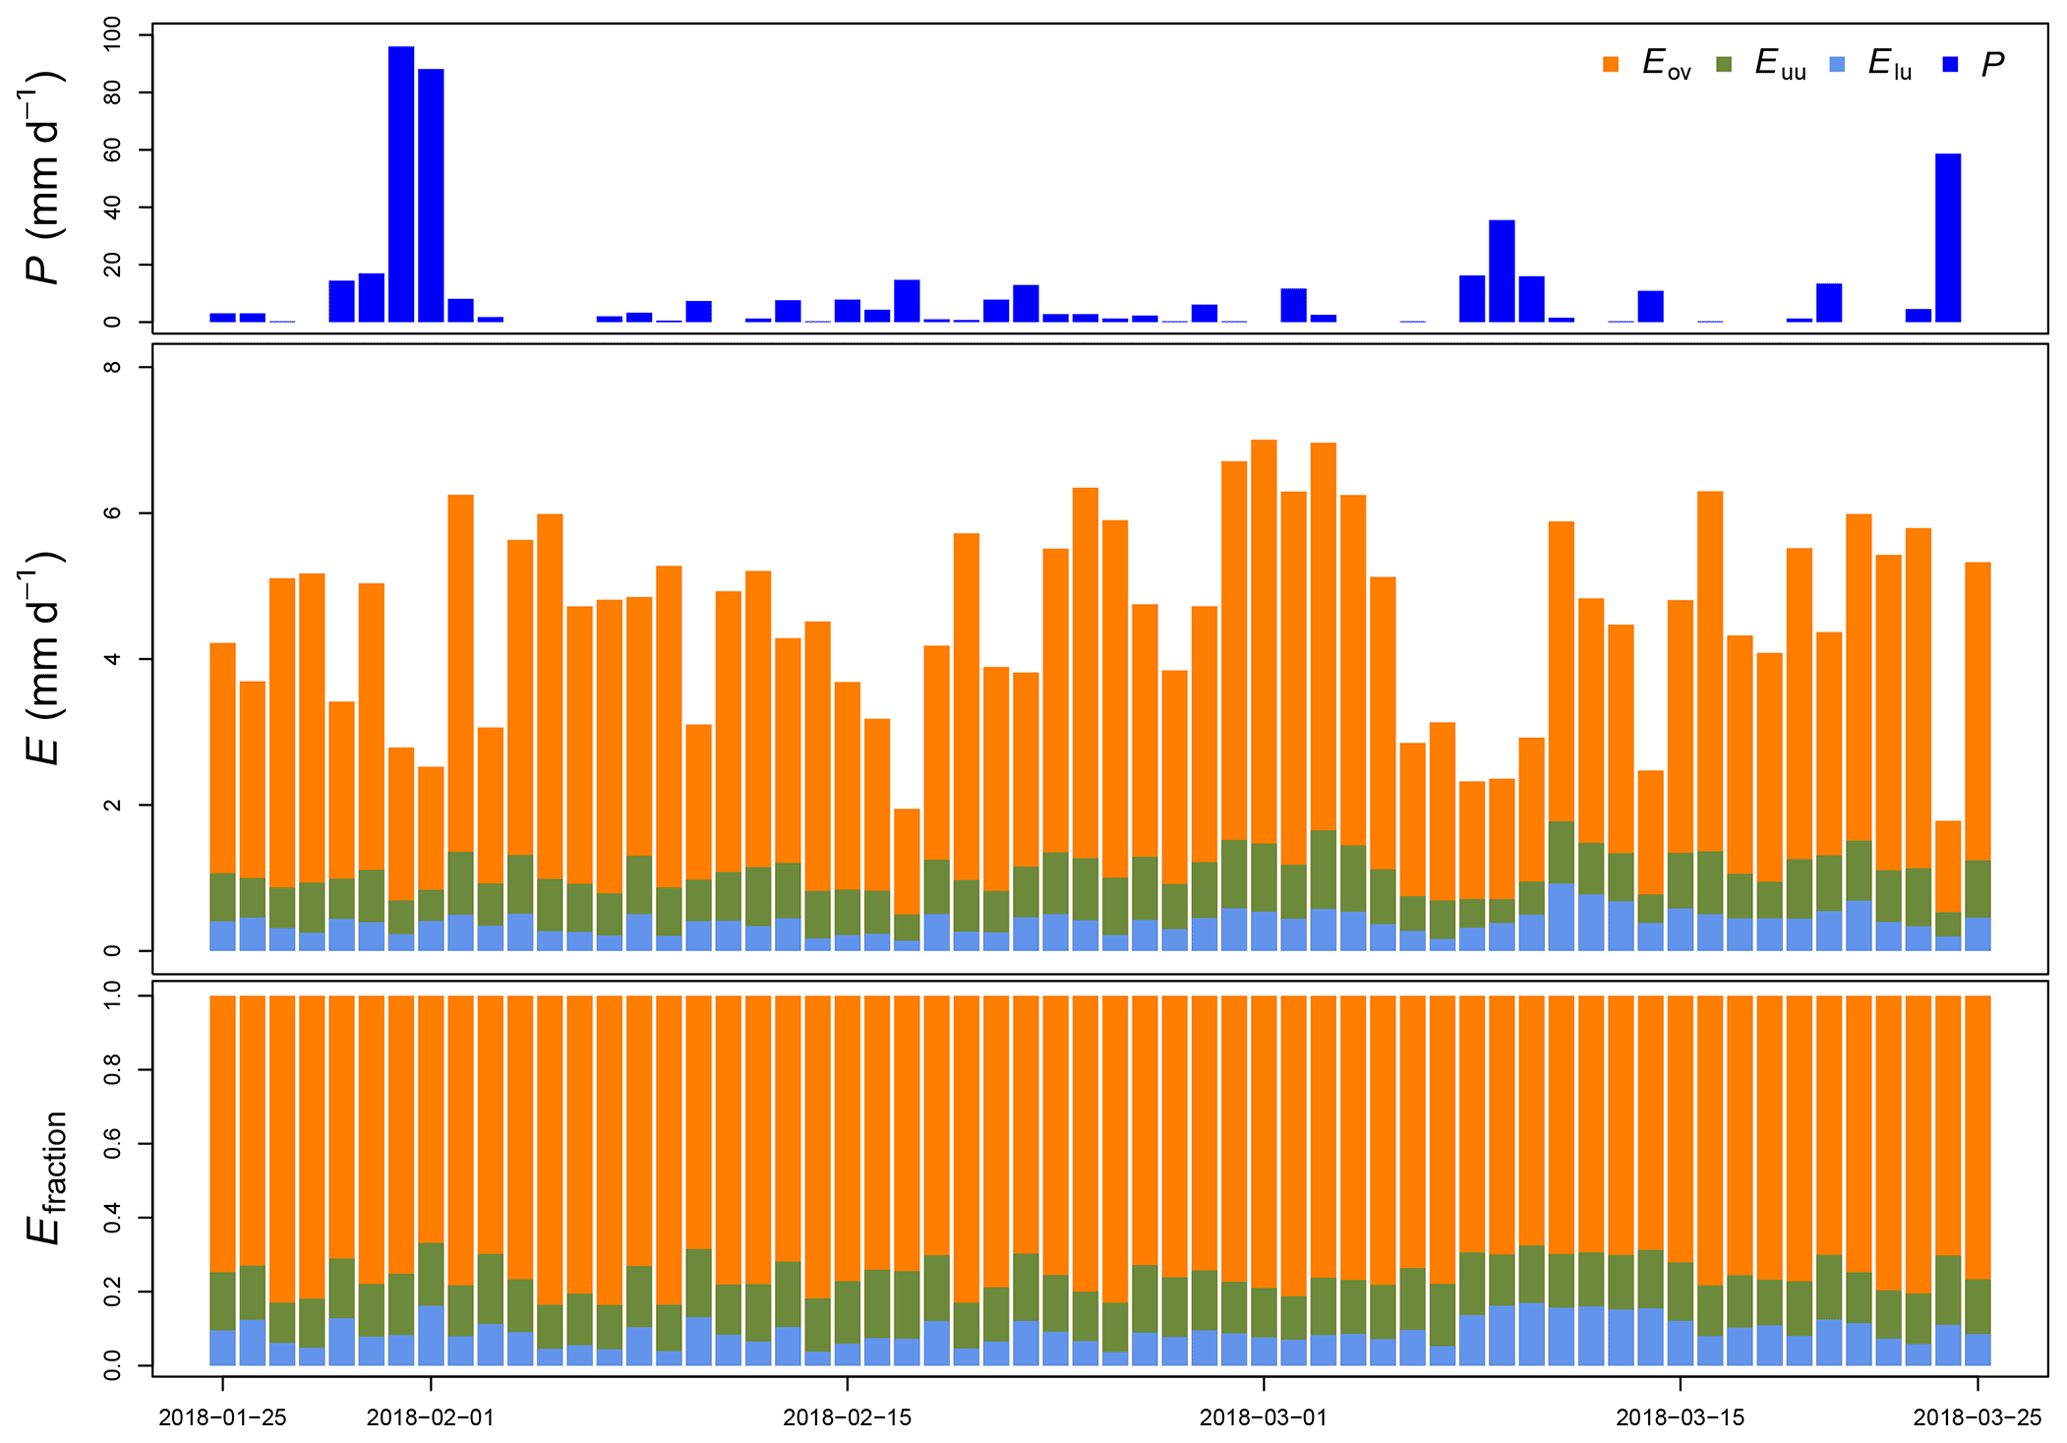
Figure 5Measured precipitation (P), estimated evaporation (E) and its fraction (Efraction) per canopy layer at La Selva Biological Station (LSBS) during the monitoring period from 25 January to 25 March 2018.
R↓S varies depending on the location along the canopy. At 43 m height the Rn has a homogeneous frequency during daytime, reaching a maximum value close to 1130 W m−2, while at 8 and 2 m the frequency of larger R↓S () is sporadic, reaching not more than 400 and 100 W m−2, respectively. The sporadic presence of R↓S is due to the presence of sunbeams filtering through the canopy openings. The reduction of R↓S is linked to the attenuation of the R↓S before reaching the forest floor due to the canopy layers. Forest canopy absorbs, reflects and diffuses more than 95 % of R↓S. This attenuation influences the energy availability on the understory and forest floor (Fig. 4). The effective energy reaching the forest floor drives the G daily variations, allowing the soil to store up to 32.3 W m−2 (Fig. 4). This energy is released at night, with fluxes up to 39.6 W m−2. This pattern makes G the most important energy flux during night periods at the MRI plot. Net radiation along the forest canopy profile decreases its magnitude from top to bottom. Rn 43 m had a maximum of 1000.8 W m−2, while the Rn 2 m is just a fraction of this flux. Net radiation at 43, 8 and 2 m during clear nights had similar fluxes, although this pattern differs when rainy conditions are present (see Appendix G). Those conditions allow Rn2 to transfer less energy to the atmosphere than Rn8 and Rn43.
At 2 m height H does not show strong changes, oscillating between −50 and 100 W m−2 during daytime, while nighttime shows 0 W m−2 most of the time (Fig. 4). This flux increases its magnitude on the upper forest layers during day- and nighttime. Most important differences between 8 and 43 m are based on the maximum H that can be reached. At 8 and 43 m H does not reach 300 W m−2. The frequency peak of H observed along the three heights during daytime are linked at the sporadic showers experienced during the monitoring period (see Appendix G). The residuals from the energy balance equations applied to the three canopy layers (Eq. 1) represents the ρλE. This flux has strong differences among the canopy heights (Fig. 4), where at 43 m the ρλE goes from −100 to 910 W m−2, while at 8 and 2 m height the minimum ρλE is almost the same (−67.5 and −66.5 W m−2, respectively).
Throughout this period, we estimated an evaporation of 275.5 mm, accounting for 55.9 % of the precipitation registered at the MRI plot. A portion of 24.3 mm originated from 2 m height and 40.7 mm from between 2 and 8 m height (Fig. 5). The contribution of individual canopy layers to evaporation varies among days. The presence of large precipitation events reduces the evaporation (e.g., from 31 January to 1 February 2018), while periods with continuous wet conditions but small rain events allow the evaporation to increase (e.g., from 17 February to 3 March 2018). The overstory layer contributes with an average of 66±8 %, while the upper understory and the lower understory layers contribute with 15±2 % and 9±4 %, respectively.
3.3 Isotope signatures
Figures 6 and 7 show the variability of all the water samples collected at the MRI plot. Precipitation samples are located on the LMWL defined for La Selva Biological Station by Sánchez-Murillo et al. (2013), with a slight fractionated signature with respect to the LMWL (Fig. 6). These differences in isotope signature are linked to the presence of more convective rain events during the dry season. Isotope signatures of precipitation and throughfall samples overlap, although the precipitation samples have a wider variability than throughfall samples for both isotopes. Throughfall samples have a more homogeneous isotope signature, with fewer outliers than precipitation. Soil water signature at 5 and 10 cm depth has exactly the same pattern as the LMWL, with only one sample with a fractionated signature at 10 cm depth. The lack of fractionation in soil water and the high values of soil moisture depict a low proportion of soil evaporation during the sampling period. The samples of stream water collected in the stream near the plot have an isotope signature that matches with the LMWL. However, the isotope signature differs widely from the precipitation, throughfall and soil water samples collected in the same period.
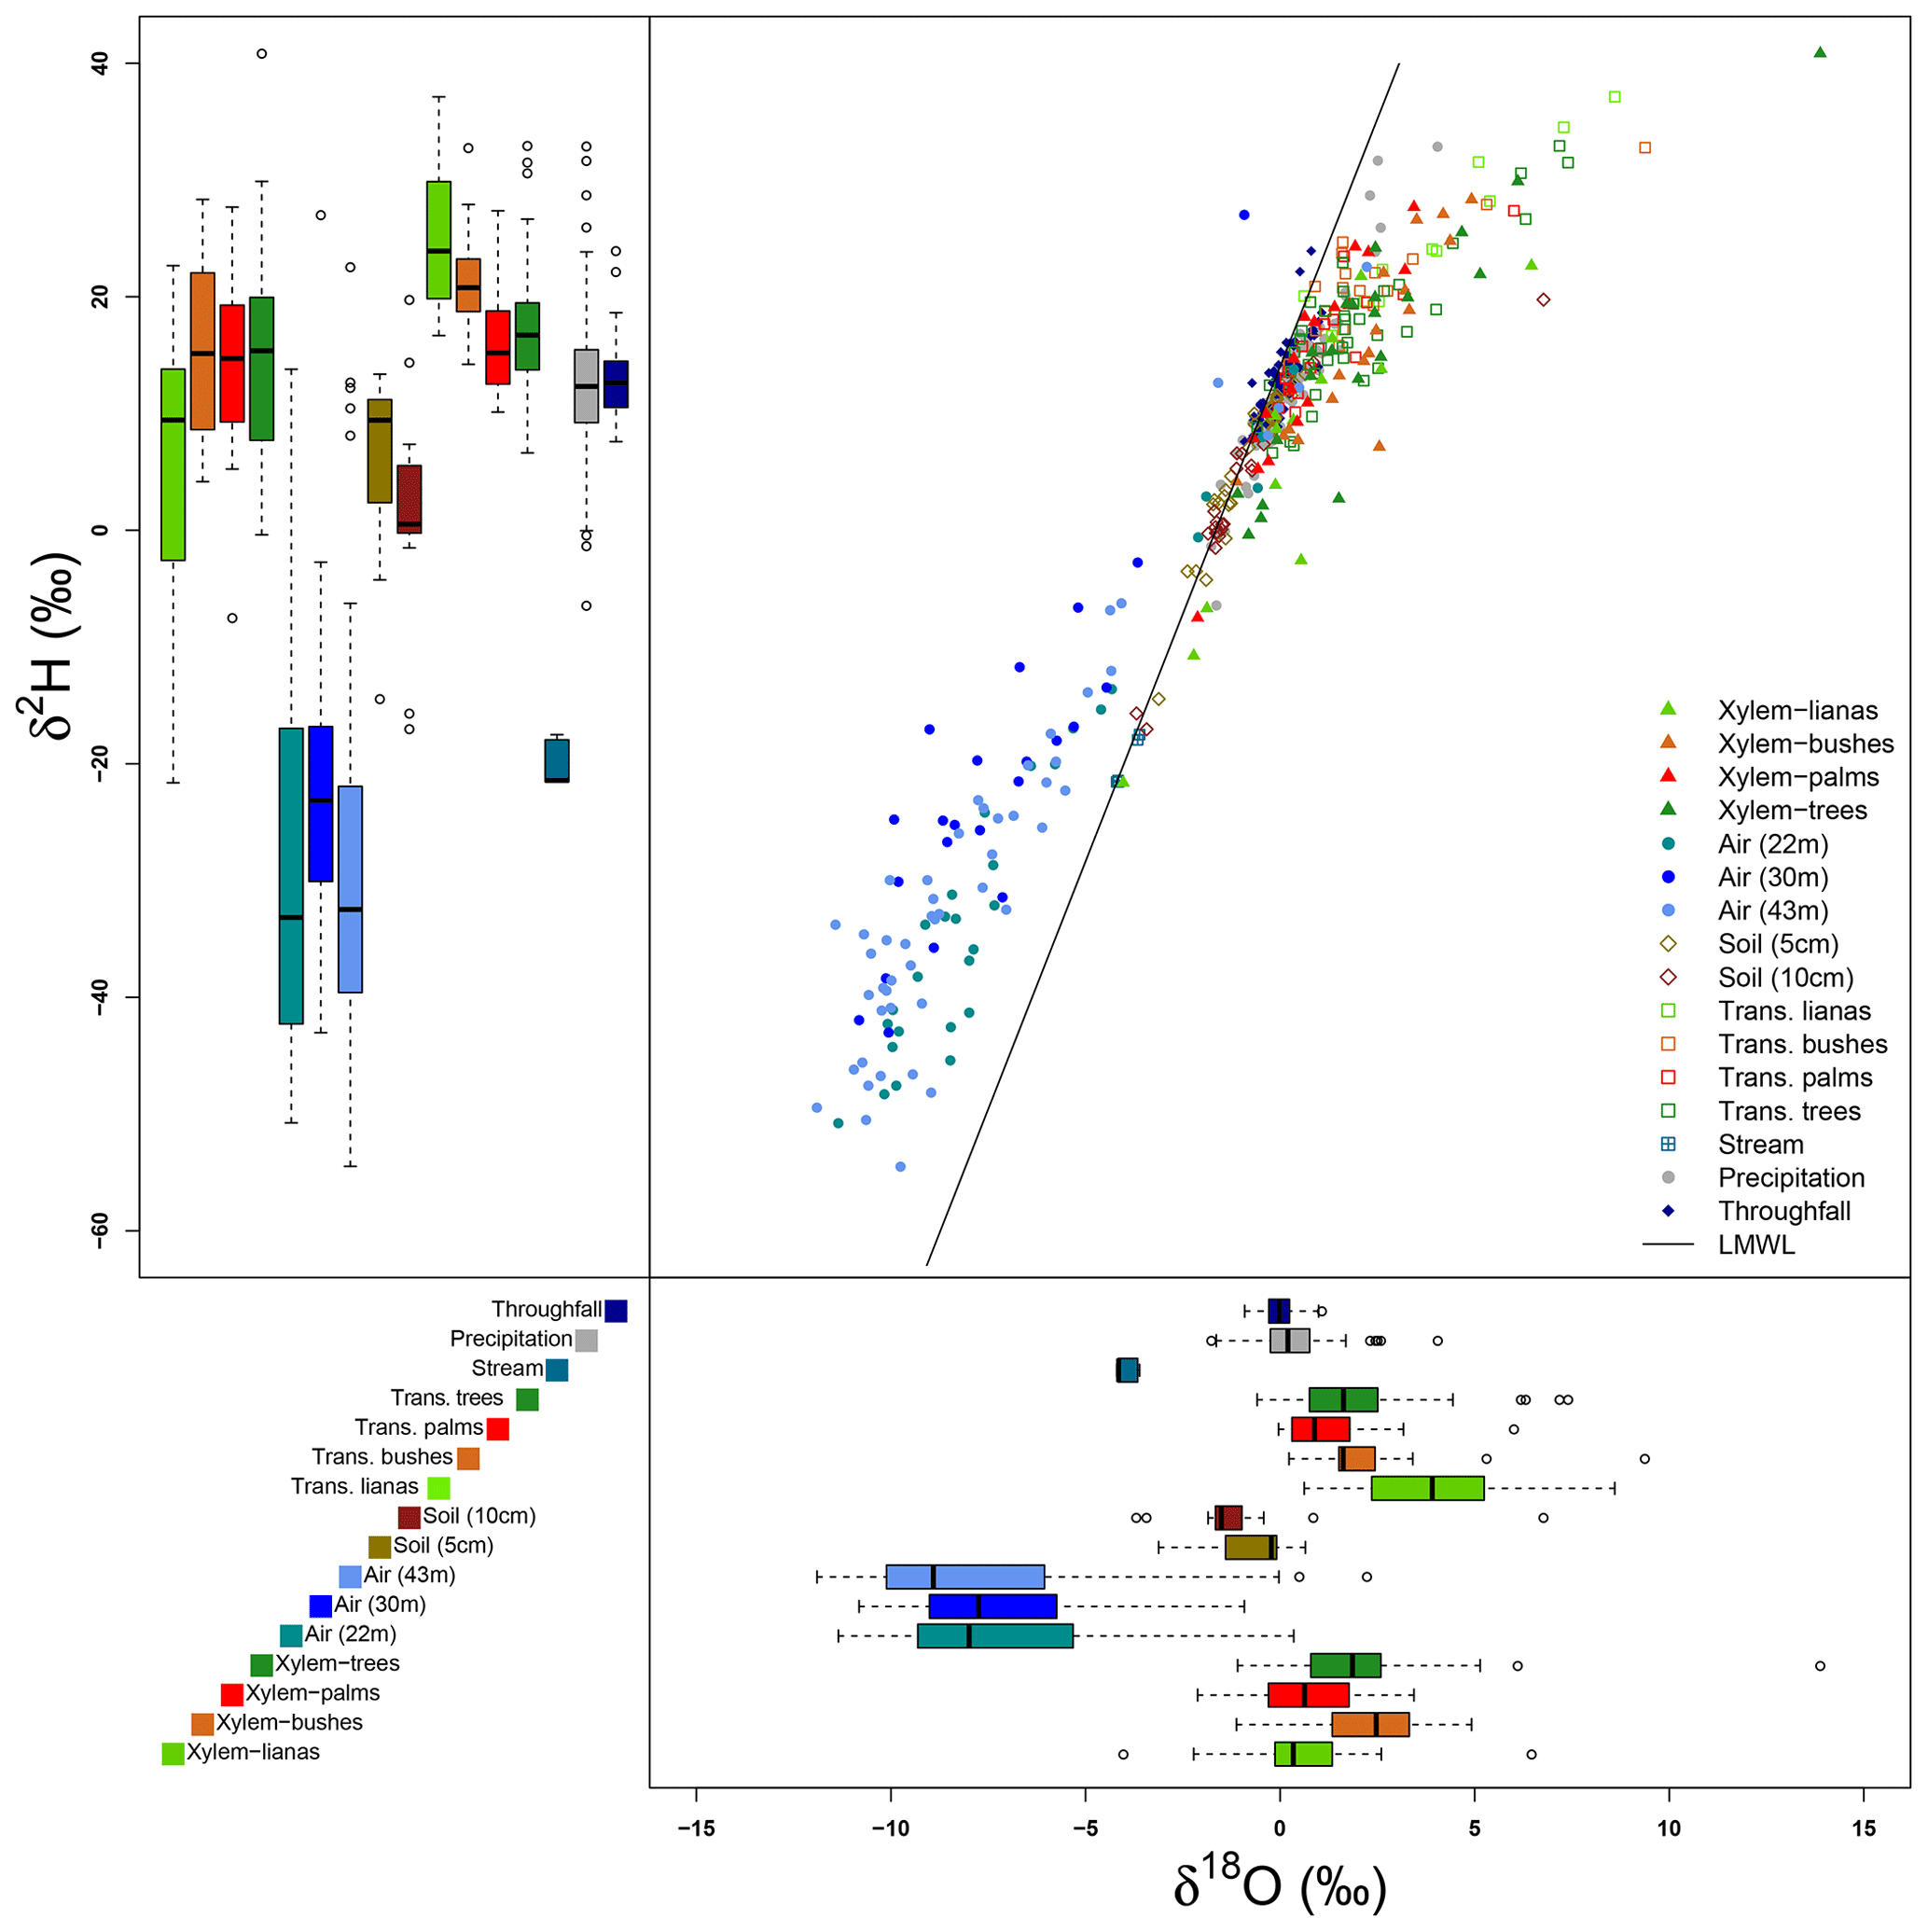
Figure 6Isotopic signatures of δ2H and δ18O of all the samples collected at the MRI plot. The dual isotope plot shows the relationship among the local meteoric water line (LMWL) and all the samples. The box plots of δ2H (upper–left) and δ18O (bottom–right) show the distribution of isotope signatures per sample type.
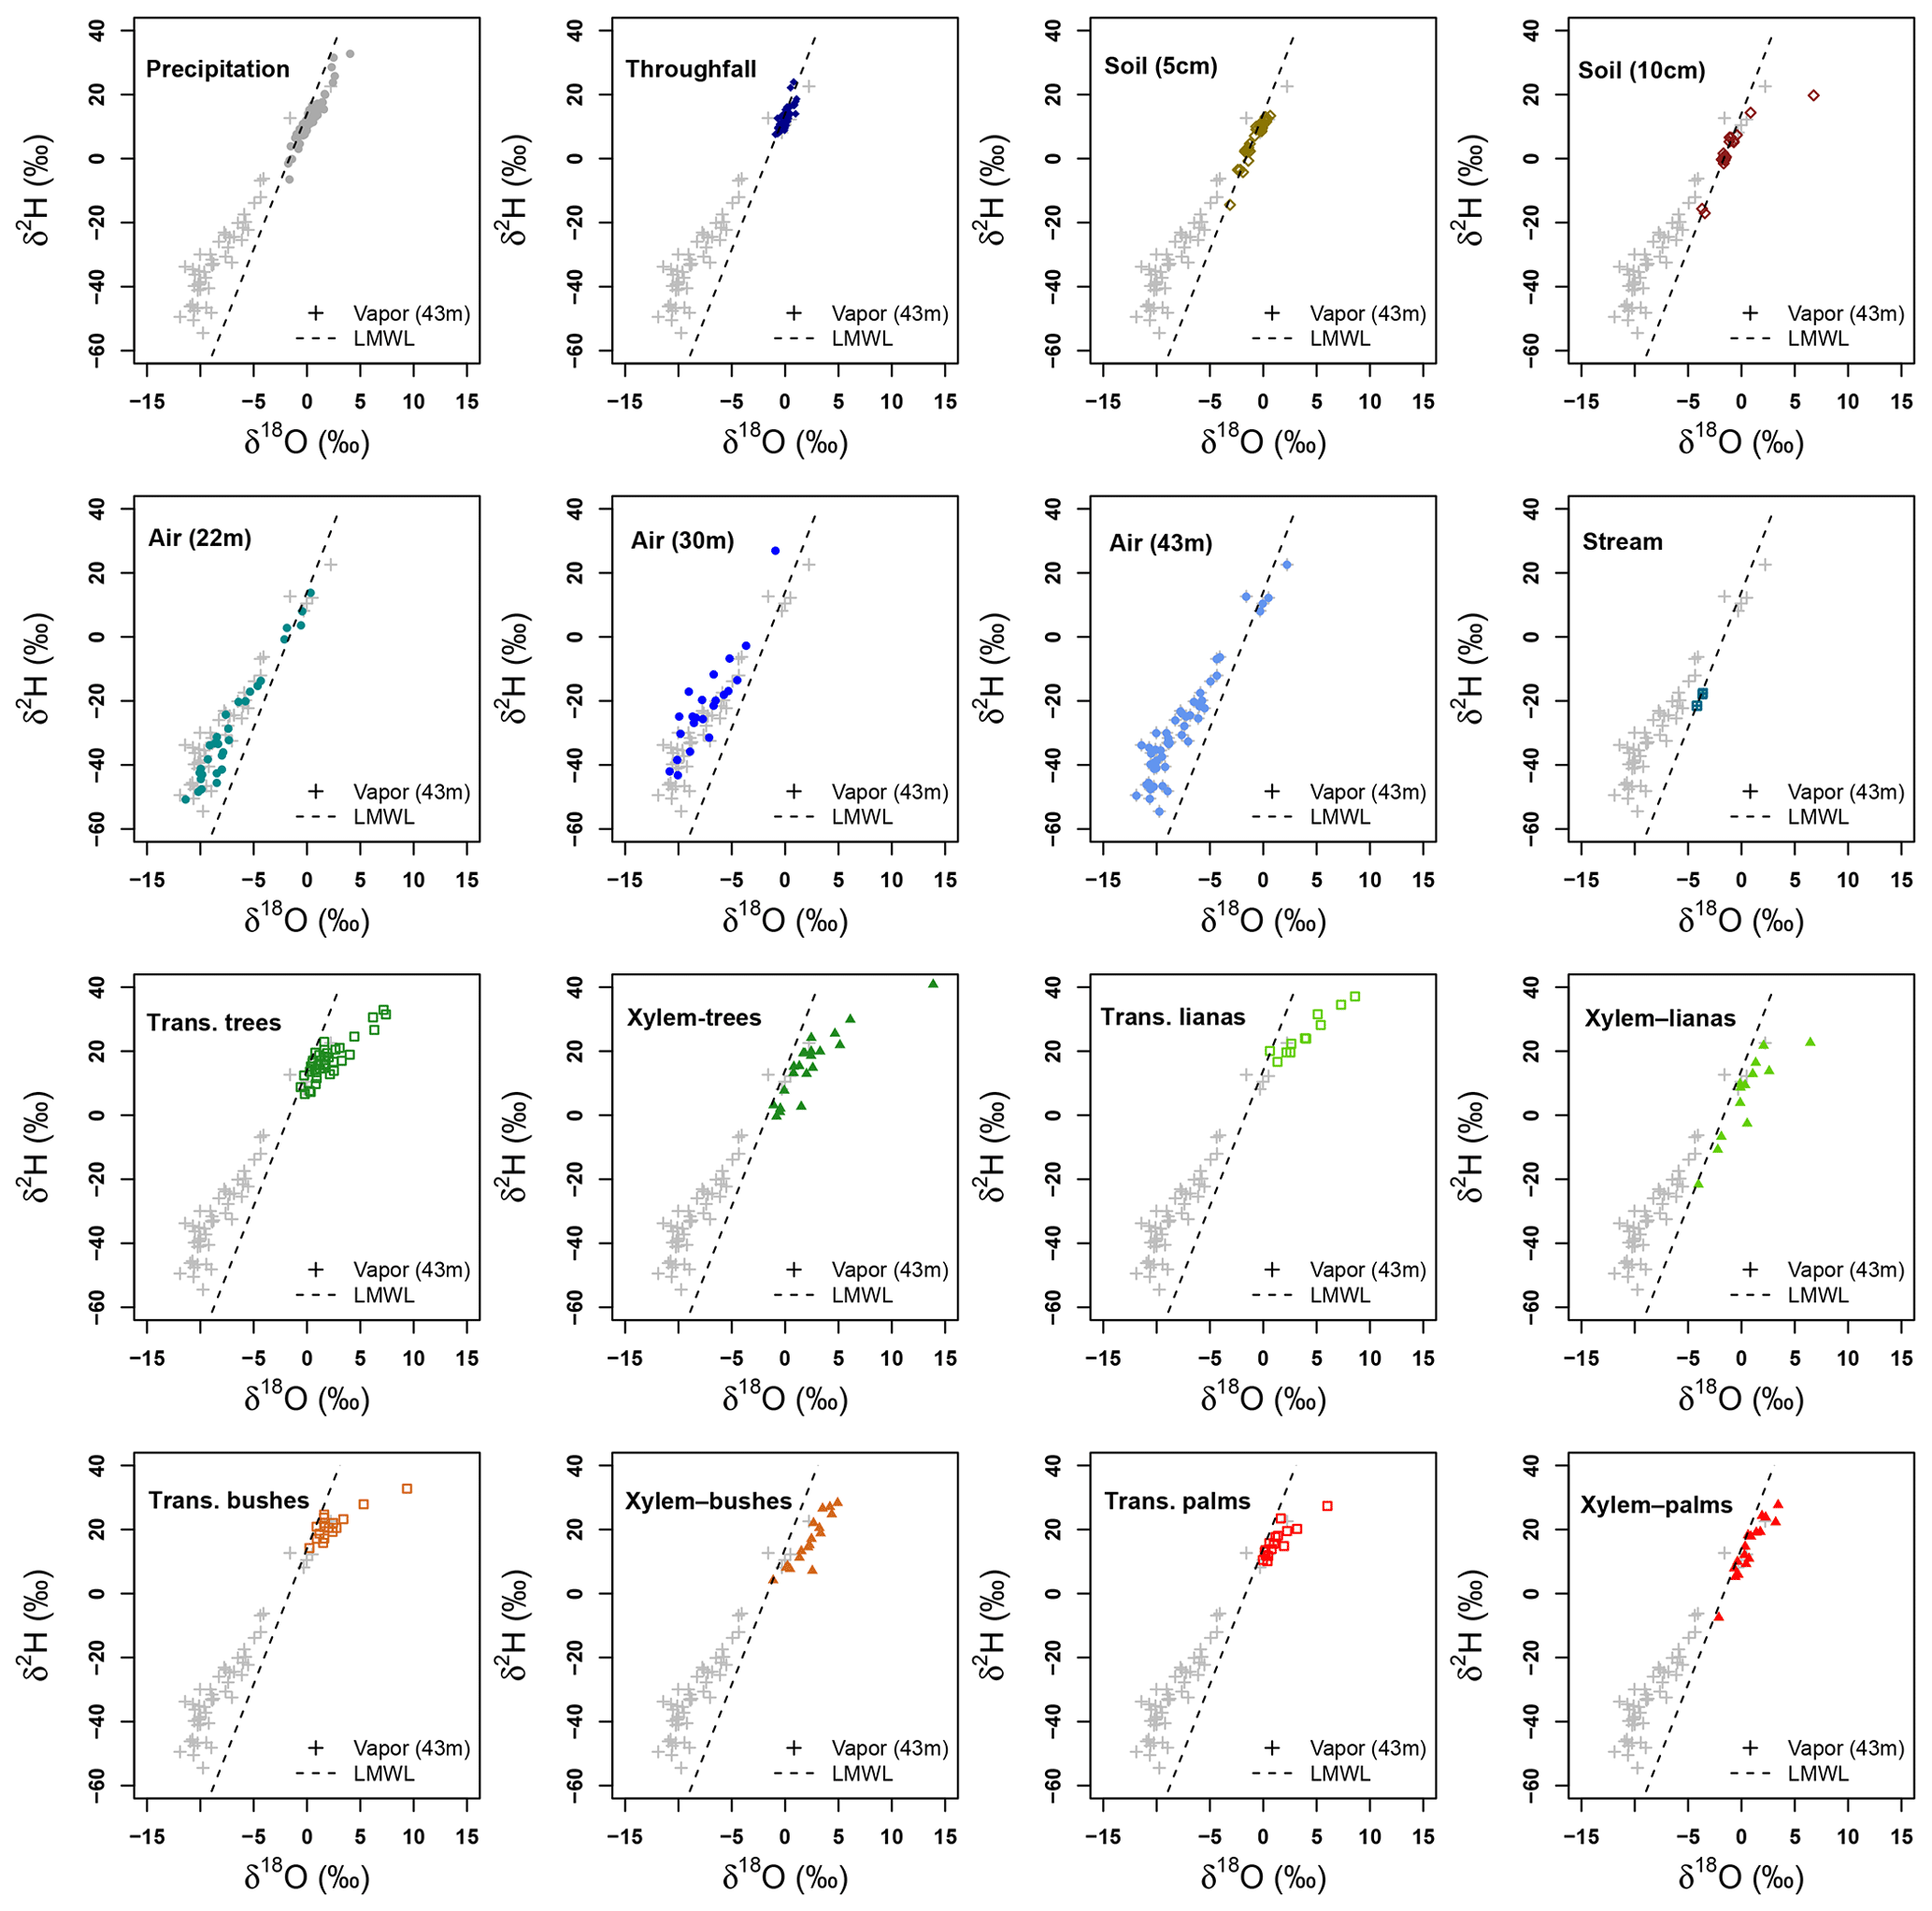
Figure 7Dual isotope plots of δ2H and δ18O per sample type collected at La Selva Biological Station. Vapor samples collected at 43 m height and local meteoric water line (LMWL) are used in each plot as references.
Transpired water samples have a more fractionated signature with respect to the xylem water (Fig. 7). Despite the presence of fractionated xylem water, it does not match with the soil water signature (χ2: 324.04, p value < 0.001). Samples of transpired water have a wide variation in their isotopic signatures (Fig. 6). Transpired water samples of trees, bushes and palms show a similar pattern. This pattern has a lumped group of samples with an isotope signature slightly fractionated with respect to the LMWL and some fractionated samples linked to the dryer days. The samples of transpired water collected in the lianas have a different pattern than the other plant types, with a clear fractionation linked to the dryer days.
Xylem water samples show clear differences among plant types. The xylem water from palms has an isotope signature close to the LMWL, reflecting quick access to rain water that can be stored in the palm trunks. The lianas have access to different water sources, differing in their isotope signatures (Fig. 6). These sources include water from precipitation, stream water and soil water affected by evaporation not present in the collected samples at the MRI plot (Fig. 7). The isotope signature of the xylem water in trees and bushes depict the use of rain water as well as fractionated water. The bushes show a more fractionated signature than trees. This signature could indicate the access to more superficial soil water (<5 cm) that can be affected by fractionation.
Temporal differences in lc-excess values were not significant (p=0.05) for most of the sample types excepting the soil water at 5 cm depth (χ2=25.297, p=0.000), throughfall (χ2=9.614, p=0.008) and tree transpiration (χ2=9.884, p=0.007). Figure 8 shows the tendency lc-excess for each sampling period per sample type. The main differences in throughfall samples are depicted between the beginning (A) and the end of the monitoring period (C). Samples from sampling period C showed a more fractionated signature, while sampling period B has an intermediate value between periods. Soil water at 5 cm shows a clear decreasing trend in lc-excess over time, increasing the fractionation of soil water signature considerably. Finally, trees transpiration differed between the mid sampling period (B) and the end of the sampling period (C).

Figure 8Box plots showing the temporal differences in lc-excess for throughfall, soil water at 5 cm depth and tree transpiration. The other sample types did not show significant differences (p=0.05). Sampling periods with the same lowercase character per sample type do not differ (p=0.05).
Isotope signatures of water vapor samples from the three sampling heights overlap with each other. These samples have a wide range for both isotopes (δ2H and δ18O), but only some outliers match with the xylem water samples. However, few vapor samples overlap with other sample types and only four samples at 43 m height and five samples from 22 m height overlap with the LMWL. Appendix I shows the Keeling plots applied to lc-excess and δ18O of the air samples collected at 43 and 22 m height. In both cases, the regression lines are not significant (pvalue>0.05 and R2≈0). The closeness of water samples exemplifying the source of water vapor (e.g., soil water, transpired water, xylem water) and high absolute humidity during the sampling period affected the goodness of fit.
Evaporation in wet forests is governed by the transpiration process, following a direct link between leaf area index and transpiration (Zhang et al., 2017). However, the role played by the forest canopy during evaporation is more complex and involves processes such as canopy interception (Carlyle-Moses and Gash, 2011; Gerrits et al., 2010) or splash droplet evaporation (Bassette and Bussière, 2008; Murakami, 2006). Broadleaf evergreen forests are able to intercept 13.0 % of the precipitation for subsequent evaporation (Miralles et al., 2010); this matches the observed interception on the MRI plot with 11.7 % of interception. This proportion accounts for one-third of the measured evaporation, leaving the remaining 44.2 % of the evaporated precipitation to canopy transpiration. The distribution of interception along the forest canopy will depend on the accumulated leaf biomass along the canopy, although is not possible to differentiate the proportion of the individual canopy layers. On the MRI plot, 29.4 % of LAI is allocated between 0 and 10 m height; hence the area intercepting precipitation on the understory increases as well as the potential sources of transpiration. Loescher et al. (2005) suggested that transpiration on the lower canopy can affect the lack of ecosystem response to the vapor pressure deficit variations in the upper part of La Selva Biological Station. This supports the contribution of 9 % and 15 % of the evaporation by the lower and upper understory recorded during this dry season. Soil evaporation is negligible in respect to transpiration and canopy interception. However, the presence of litter on the forest floor may contribute to the evaporation at 2 m height as part of the forest floor interception. The presence of larger ρλE at 2 and 8 m heights are linked to the sunbeams and to their low frequency of occurrence. Negative ρλE values are linked to the water condensation along the forest canopy. This condensation will trigger the release of latent heat similarly to how it occurs during the cloud formation processes (Goosse, 2015).
Allen et al. (2016) described the capacity to modify the isotope signature of precipitation when the water passes through the forest canopy. This pattern has been identified in different locations (Allen et al., 2015; Hsueh et al., 2016; Liu et al., 2008). Instead, the throughfall signature at the MRI plot is more homogeneous than the isotope signature of precipitation. This as a consequence of two factors: first, the small number of throughfall samplers used (n=4), and second, the fixed location of each of them. These two factors reduce the possibility to depict the spatial variability of the sampled forest despite the differences in sampling dates. However, the temporal differences among sampling periods show a clear effect of the evaporation process at the end of the dry season. The intercepted water is affected by evaporation during the rain events, modifying the isotope signature of the water that drips from the canopy. This water has a more fractionated signature than the precipitation. The higher temperatures experienced during daytime and larger VPD conditions at 43 and 8 m height drive this change in the fractionation of stable water isotopes. Soil water signatures have a larger variability than throughfall signatures, showing lighter signatures than precipitation and throughfall. Soil water does not show the expected fractionation of soil under evaporation processes, where the isotope signature is characterized by heavier fractionated soil water signatures with respect to throughfall or precipitation (Allison et al., 1984; Sprenger et al., 2017). This reflects the small contribution to evaporation from the mineral soil, which is supported by the high soil moisture recorded during the monitoring period. However, this does not include the effect of evaporation from litter interception on the forest floor. This effect modifies the soil water isotope signature at 5 cm depth with the development of the dry season. The decreasing trend of lc-excess values shows the effect of the evaporation process that is able to modify the water signature that reaches this depth. This process is cumulative since the evaporation process started modifying the isotope signature at the canopy level, before reaching the litter layer and before reaching the mineral soil. This evaporation is linked to the available energy at the lower understory that drives the evaporation process.
Water use by riparian forests in La Selva Biological Station has been linked to groundwater withdrawal (Cadol et al., 2012). The isotope signature of stream water during low flows reflects the isotope signature of groundwater (Blumstock et al., 2015), allowing its use as a proxy to describe the groundwater isotope signature. The collected stream water has a lighter isotope signature than precipitation, throughfall and soil water; however, its lc-excess depicts its meteoric origin, supporting its use as a reference to describe the groundwater. The stream water signature is lighter than the fractionated water used by trees and bushes, while some lianas have a similar signature to stream water. This can lead to a link to deepwater use by the lianas, which has been reported in some karstic and seasonal environments (Chen et al., 2015), though it differs from the findings of De Deurwaerder et al. (2018) in a similar tropical forest. However, xylem water and transpired water of lianas have fractionated signatures with respect to the LMWL, but do not match completely with soil neither throughfall samples. Temporal differences shown in water transpired by trees are linked to a variation in the strategies to access different water sources. During the second period of sampling, the rain events were smaller but more frequent than during the first and last sampling periods. This allowed the trees to use more recently precipitated water than in the other two periods. Palm and bush samples are the ones that cover the isotopic range of precipitation and throughfall samples, depicting the use of rain water. The canopy architecture of palm trees allows the concentration of water as stemflow (Germer et al., 2010; Germer, 2013), allowing the quick soil saturation near the root zone with precipitation water. Additionally, palm species have the capacity to store large amounts of water in their stem for their later use (Renninger and Phillips, 2016). This enables these species to have a stable isotope signature close to precipitation water.
Tropical bushes and treelets have most of their root system in the upper 20 cm of the soil (Becker and Castillo, 1990), allowing their access to superficial soil water and nutrients. However, it is important to underline that root allocation strategy depends on the species (Jackson et al., 1995). The water signature of xylem water and transpired water of trees and lianas showed a large variability. Differently to palms, tree species are able to develop extensive root systems depending on the nutrient availability more than water access in wet environments (Kerfoot, 1963), whilst the growth strategies of lianas allow them to have an extensive shallow root system due to their sprout capacity all over the forest floor (Campanello et al., 2016). This root system allows the lianas to have access to superficial soil water (De Deurwaerder et al., 2018), making use of the dripping water after convective fog during the dry season (Liu et al., 2010) and the dry season rains.
The overlapping isotope signatures of transpiration and xylem samples with the precipitation water do not allow the proportion of individual sources of water vapor to be identified. The highly variable water vapor concentrations during the gas sampling and signature closeness of possible water vapor sources did not allow individual sources such as transpiration or evaporation to be identified. Determining the source of water vapor with techniques such as the Keeling method did not work for this monitoring as a consequence of two factors: first, the similar isotope signatures of the possible sources of water vapor, and second, the high concentration of water molecules even in the dryer days. The Keeling method has been applied in conditions with clear differences between the sources of water vapor, such as in semiarid environments (Yepez et al., 2003, 2005) and homogeneous plantations (Sun et al., 2014), or to comparisons between inland and lake evaporation (Yamanaka and Shimizu, 2007). The presence of few plant species in those cases allowed a more homogeneous signature of transpiration, which is not the case at the MRI plot, which has 88 plant species. Secondly, the similar signature of sources of water vapor (transpired water, soil water of rain water) do not allow a clear differentiation. Finally, the high variability of the water vapor concentration during the different sampling methods did not allow a significant linear regression to be produced.
The structural complexity of a tropical wet forest requires the inclusion of different parameters to better understand the water fluxes such as evaporation. Tackling the structure in terms of canopy layers makes it possible to homogenize important differences like plant types or number of species. This is a consequence of the larger variability of water sources to which the plants have access or to specific characteristics of the plants that defines how much water can be transpired (Chen et al., 2015; Silvertown, 2004; Silvertown et al., 2015). Traditional evaporation partitioning defines the fluxes in terms of soil evaporation, plant transpiration and evaporation of intercepted water (Roberts, 1999; Savenije, 2004; Shuttleworth, 1993). However, in complex environments partitioning the evaporation in terms of canopy structure can trigger new insights into the hydrological processes involved within them.
Additionally, it is necessary to understand how individual plant species in tropical environments use different water sources. Water uptake by tropical trees is linked to leaf phenology and transpiration rates (Schwendenmann et al., 2015); however, the use of stable isotopes in xylem water could by affected due to evaporative fractionation during the transport within the plant tissues (Barbeta et al., 2019; Martín-Gómez et al., 2016; Zhao et al., 2016) or selective acquisition (Vargas et al., 2017). This evidence depicts the need to better understand the effect on stable water isotope signatures during the water transport within the plant. Despite the xylem being considered as a closed transport system within the plants, the presence of lenticels along the tree stem, twigs and branches allows the gas exchange by the plant growing tissues (Crang et al., 2018; Hopkins and Hüner, 2008). These organs are present in most of the sampled tree species of this study (e.g., P. macroloba, Sacoglottis trichogyna Cuatrec., V. koshnyi, Virola sebifera Aubl.). This can trigger additional fractionation processes along with the water transport in the xylem that can affect the isotope signatures of xylem water, making it difficult to point out the water sources for those plants, and can also provide different water vapor signatures to the tree surroundings. This sampling is representative of the riparian forests located within the tropical wet forest life zone according to Holdridge and Tosi (1967). This is because the location in a middle terrace of the Puerto Viejo river allows the formation of riparian forest structures with a high dominance of palm species such as W. regia and trees like P. macroloba. Also, the ample distribution of these two species in Mesoamerica (Borchsenius et al., 1998; Orwa et al., 2009) allows the application of this outcome to other latitudes within the tropics.
Forest evaporation during the monitoring period accounted for 55.9 % of the recorded precipitation. The evaporation did not experience an increment or diminution during the dry season, showing no water limitations for the evaporation process at the stand level. The evaporation includes 11.7 % originating from the intercepted water by plant surfaces, which modifies the isotope signature of the water before reaching the ground. The lower evaporation rates recorded (up to 2 mm d−1) were linked to rainy conditions, and despite this variability the contribution of the upper and lower understory layers remains constant throughout the monitoring period (23.6 %). The main differences between the lower and upper understory layers rely on the average contribution. The lower understory provides on average 9.0 % and the upper understory 15.0 % of the evaporation. Ample water availability did not affect the contribution of individual layers. The low variability of soil moisture during this dry season depicts a small contribution to evaporation from forest soil, a pattern that is supported by the lack of a fractionated signature of stable water isotopes. The use of Keeling plots to differentiate between transpiration and other sources of water vapor was affected by the highly similar signature of sources of water vapor, the larger number of plant species, and the high water concentration and variability. Evaporation processes during the dry season in tropical wet forests are not restricted by water availability. However, understory plants and palm species can be affected during drought periods due to the reduction of superficial water availability triggered by a diminution of rains and/or changes in water dripping after fog events.
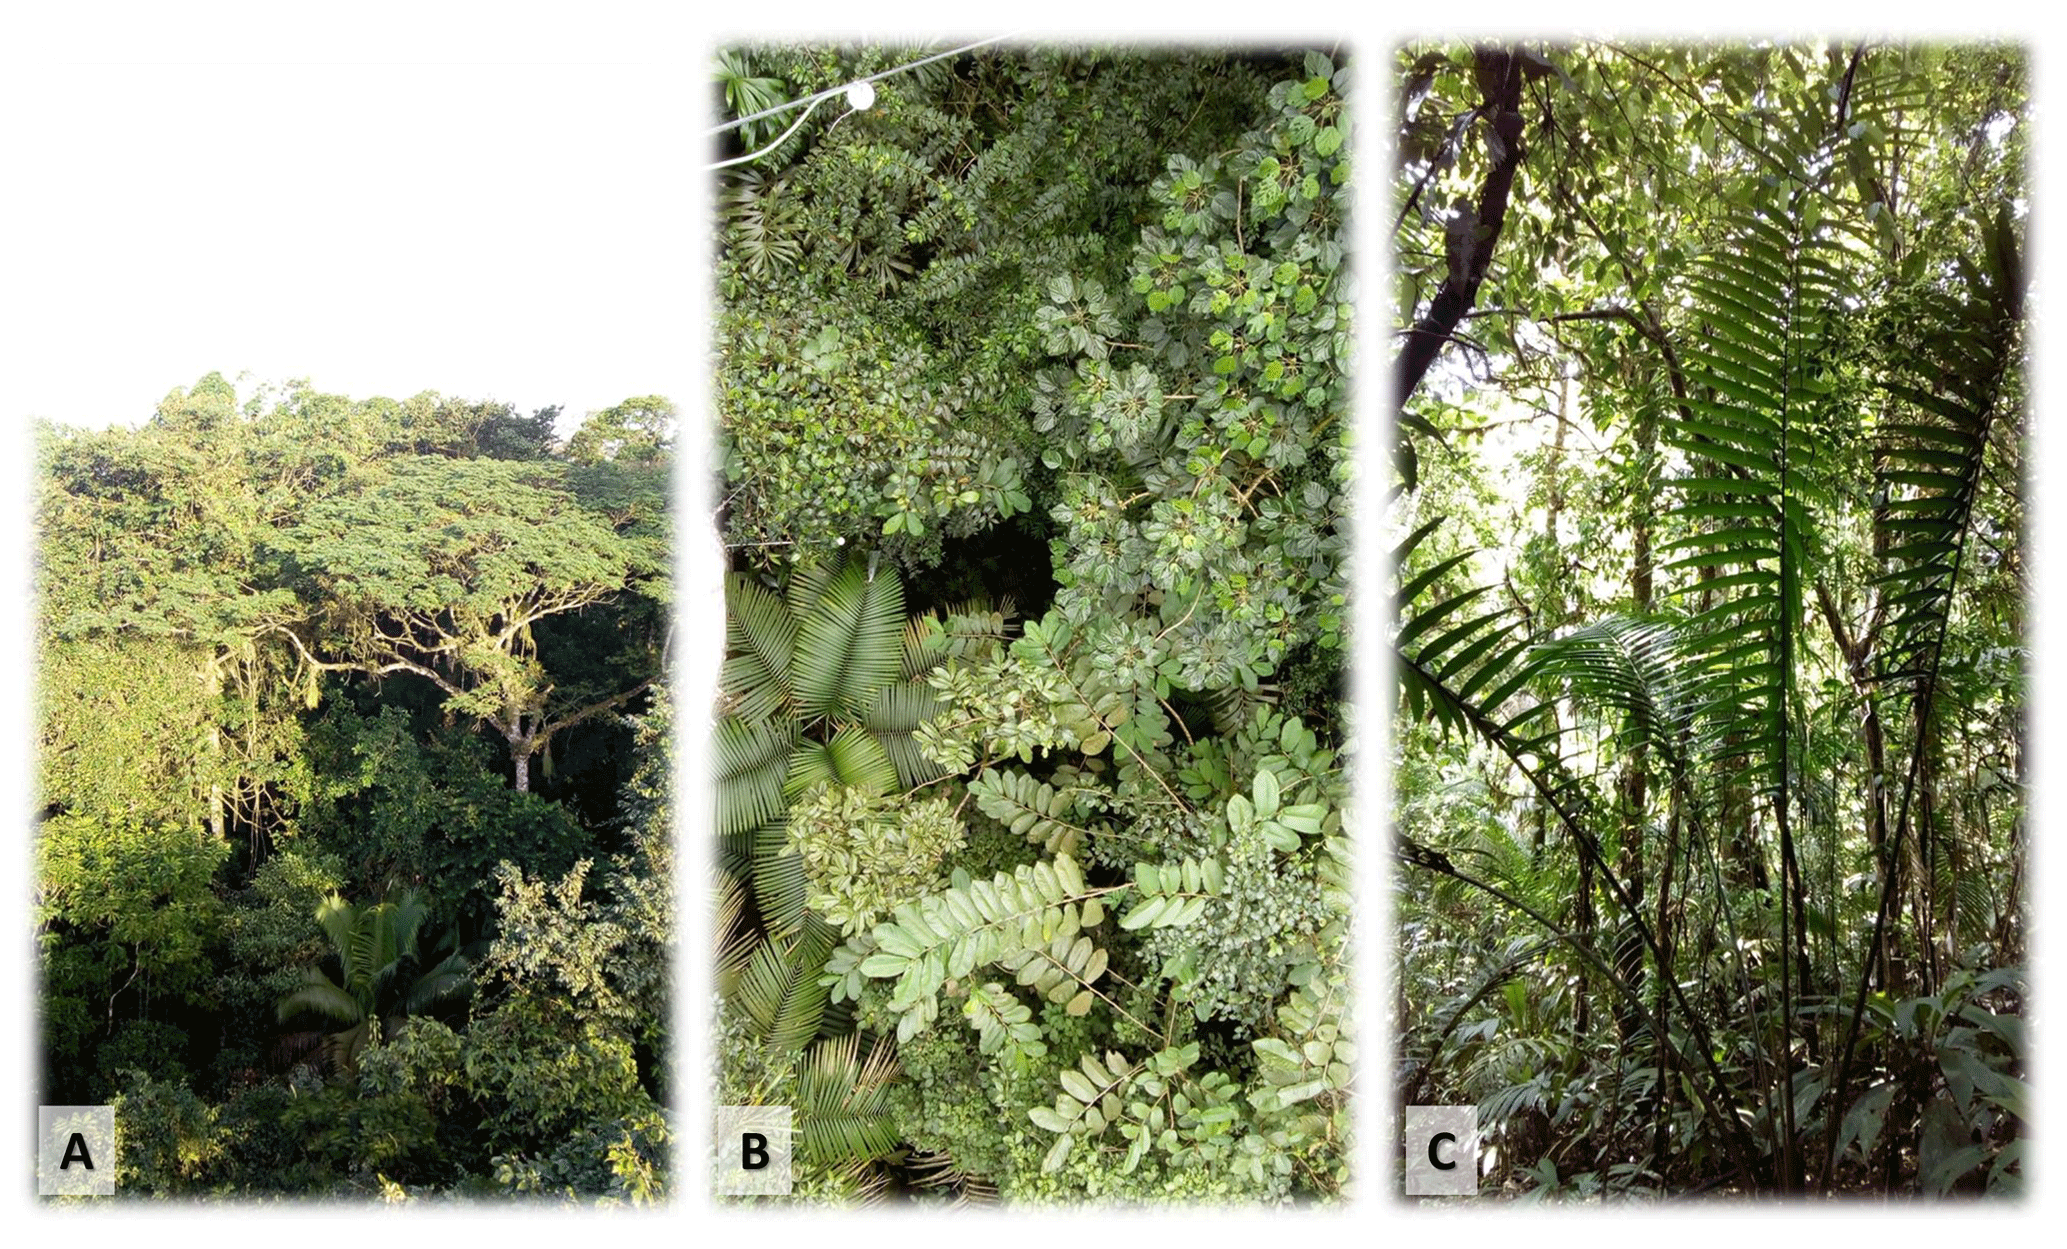
Figure A1Images of the three canopy layers defined in this study. A is the lateral view of the overstory layer (∼10–43 m) within the canopy gap. B is the vertical view of the upper understory layer (between 8 to 10 m). C is the lateral view of the lower understory (0–2 m).
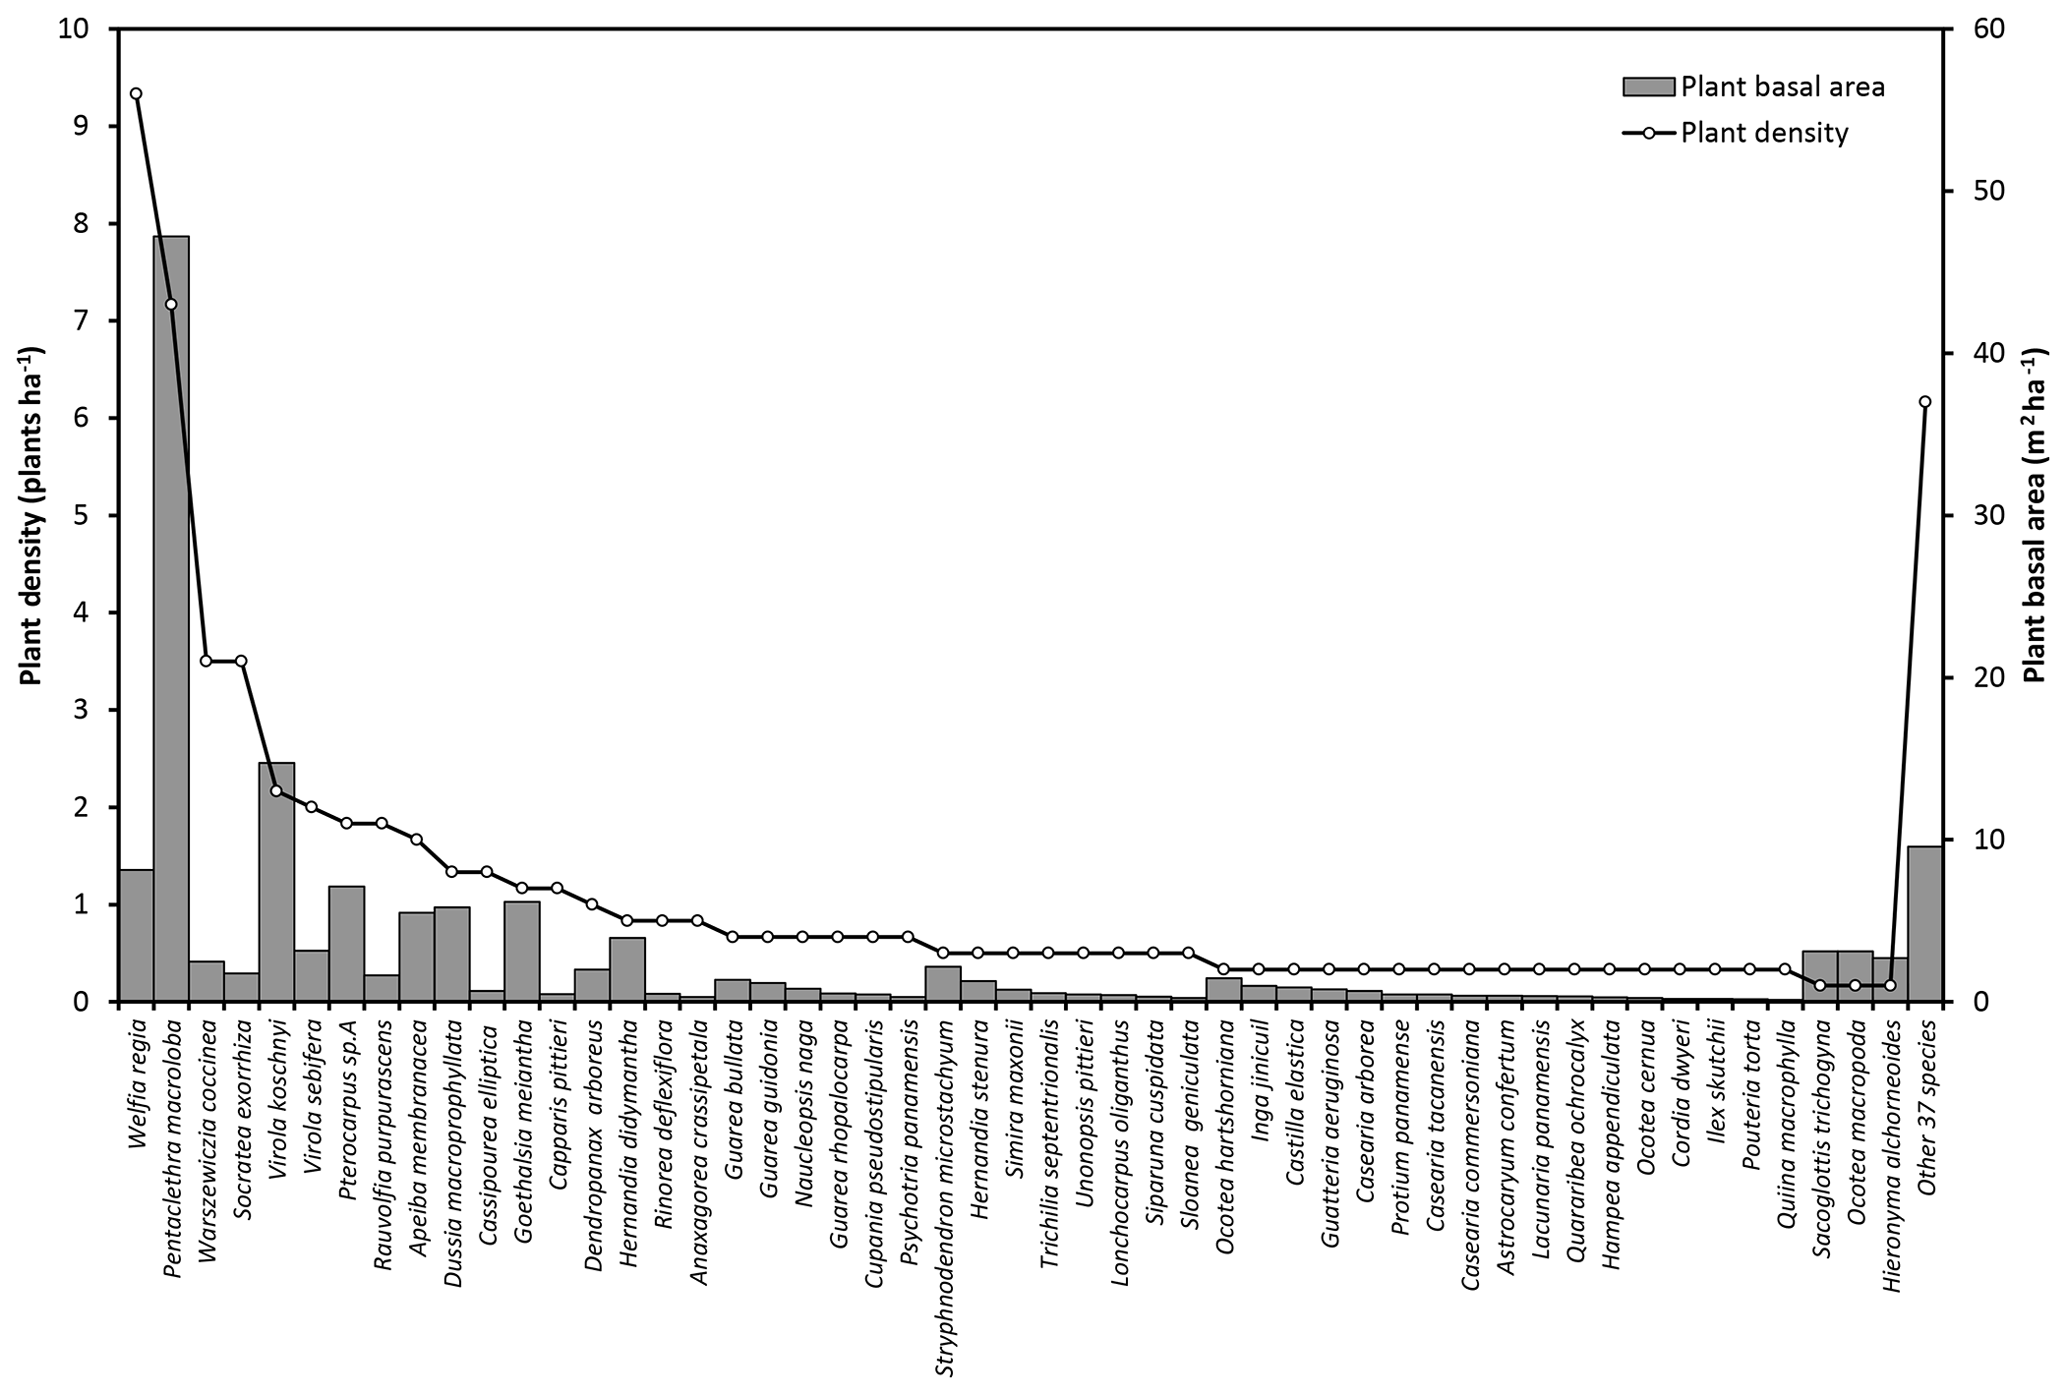
Figure A2Plant densities (plants ha−1) and basal area (m2 ha−1) of the species with more than 10 cm diameter measured at 1.3 m above the ground. Plant basal area corresponds to the cross section area covered by the stem of each plant. Some bush species are not included in this data set because the individuals do not have the minimum diameter required.
Table B1Measurement height of the instrumentation used during the experiment carried out in La Selva Biological Station.
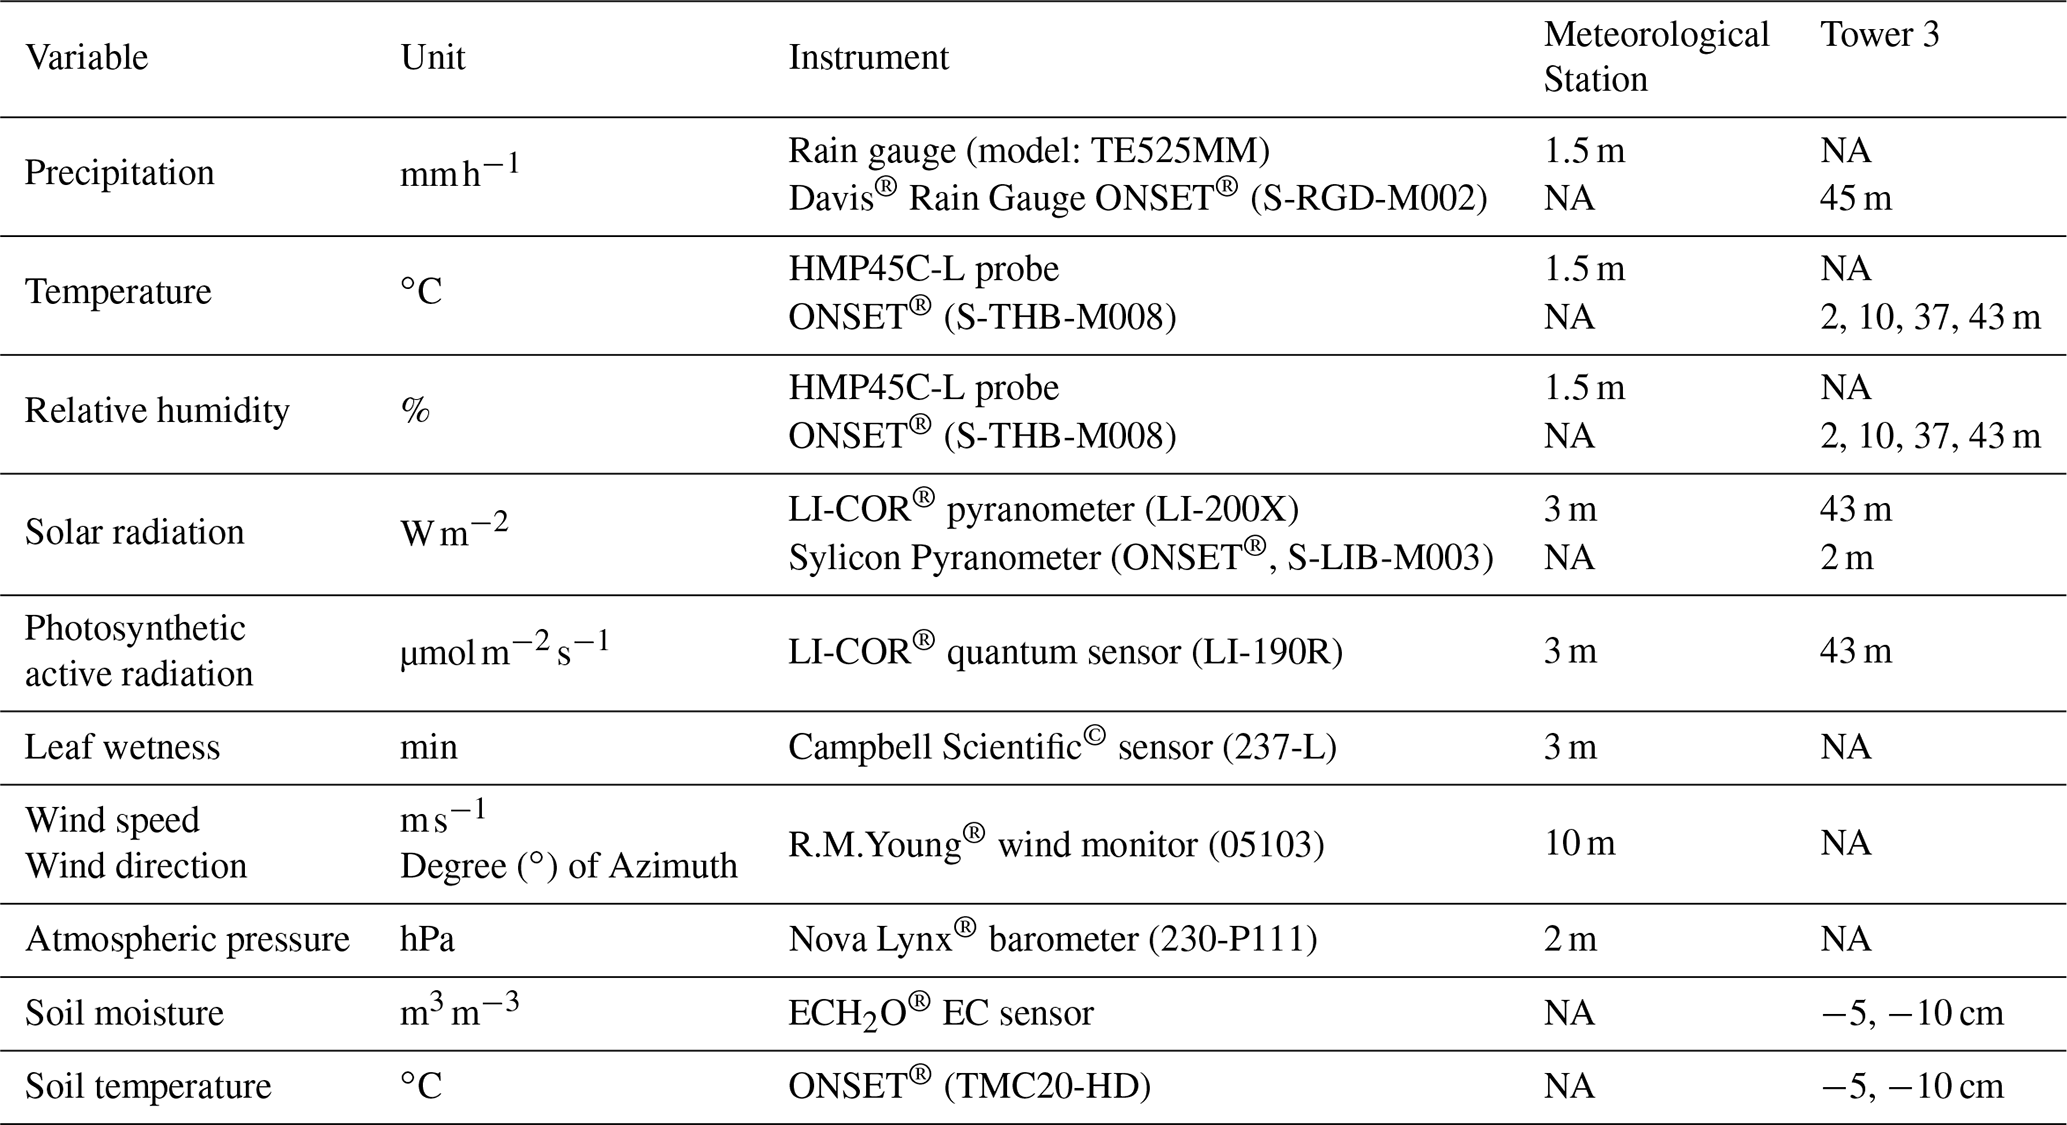
Note: NA indicates that this device is not available at the meteorological station or the MRI plot.
The incoming and outgoing longwave radiation were determined with Eqs. (C1) and (C2) (An et al., 2017), where σ is the Stefan–Boltzman constant () and ϵs and ϵa are the emissivity factors for soil and air, respectively. For ϵs a value of 0.97 (Van Wijk and Scholte Ubing, 1963) was used for wet clay soils. ϵa was determined with Eq. (C3) based on air temperature (Tair) and air vapor pressure (ea).
Superficial soil temperature (Ts0, ∘C) was estimated with Eq. (D1) (Holmes et al., 2008) and the available data of soil temperature at 5 cm depth (Ts5). This equation describes the diurnal variations of soil temperature as sine waves depending on the 24 h moving averages of soil temperature (Ta, ∘C). The daily amplitude (Ta, ∘C) is defined as the difference between Ts5 and Ta. The oscillations are determined by the damping depth (ν, m) which is calculated with Eq. (D3). z (m) is the depth difference between the target temperature (Ts0) and the source temperature (Ts5). The sine pattern depends on the angular frequency (ω, 1 s−1), time (t, s) and ϕ as a constant for phase change. Equation (D2) is used to determine ω with τ (s) as the wave period.
Equation (D3) calculates ν with the soil thermal diffusivity (η, m2 s−1) and ω. Equation (D5) (Nakshabandi and Kohnke, 1965) is used to determine η, where ρs is the soil bulk density of 0.76 g cm−3 (Sollins et al., 1994) for the experimental plot, cs is the specific heat for clay soils (837.36 ) and k is the soil thermal conductivity of 1.58 (Pielke, 2013).
The aerodynamic resistance (ra, s m−1) was calculated with Eq. (E1) (Eamus et al., 2016). In this equation, k is the von Kármán constant (0.41), zr is the reference height (m), d is the zero plane displacement, z0 is the roughness length and u as the wind speed (m s−1). Equation (E2) calculates d with h as the canopy height (m). Leaf area index is represented by Γ (m2 m−2).
The wind speed (u45 m) was estimated based on a previous data set collected at the MRI plot and the relationship with the meteorological variables collected at the research station during that period. The u45 m was estimated with a linear regression model, selecting the parameters with a stepwise forward fitting procedure. Equation (F1) determines u45 m (m s−1) based on the air temperature at 43 m (T43 m) collected in Tower 3, wind speed at 10 m (u10 m) and incoming shortwave radiation (R↓s) measured at the meteorological station. The linear regression has an multiple correlation coefficient (R2) of 0.786, with a residual error of 0.4084 m s−1. Table F1 shows the coefficients estimated with the linear regression analysis, where all of them have are statistically significant (p< 0.001). Considering the standard error from the estimation, all the estimated u45 m values lower than 0.41 m s−1 were considered as 0 m s−1.
Table F1Summary of the linear regression analysis to determine the wind speed above the canopy based on previous measured data from the MRI plot and the meteorological station in La Selva Biological Station, based on data collected at 30 min intervals in both locations from the year 2012.
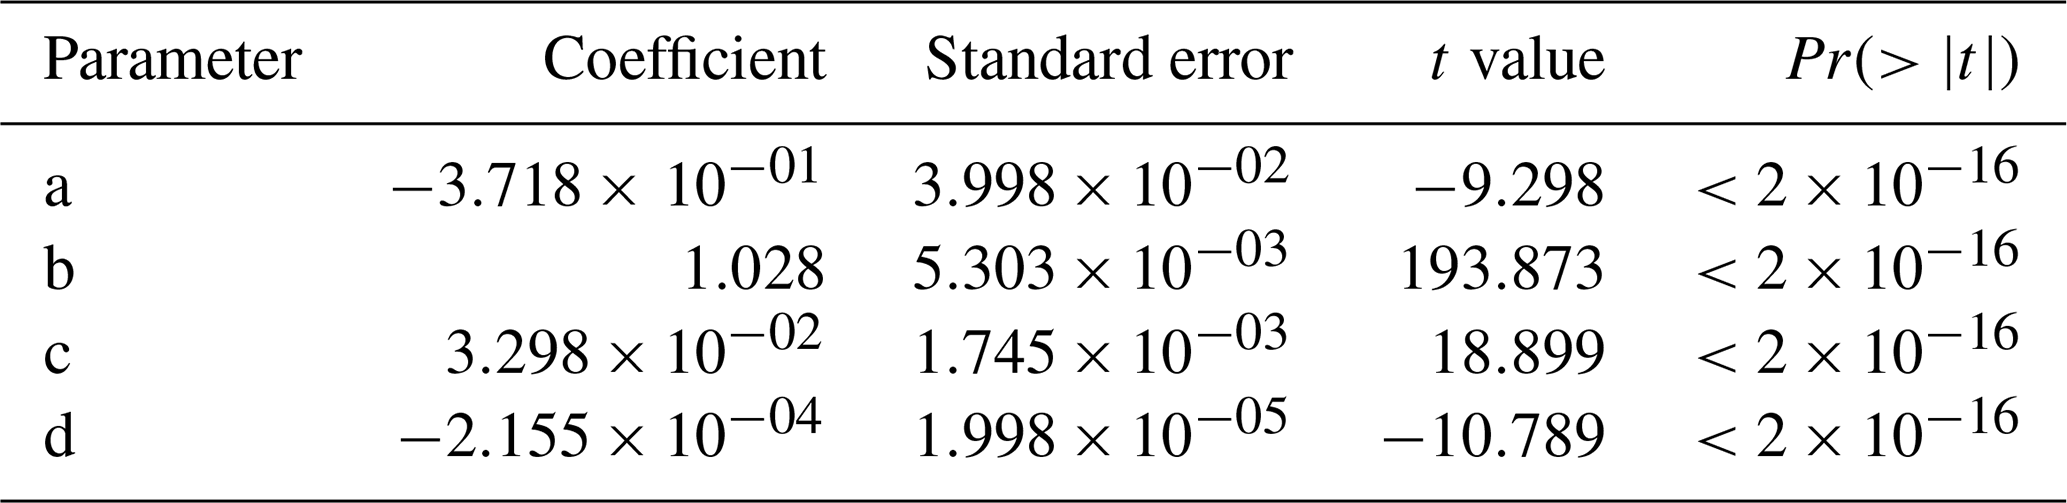
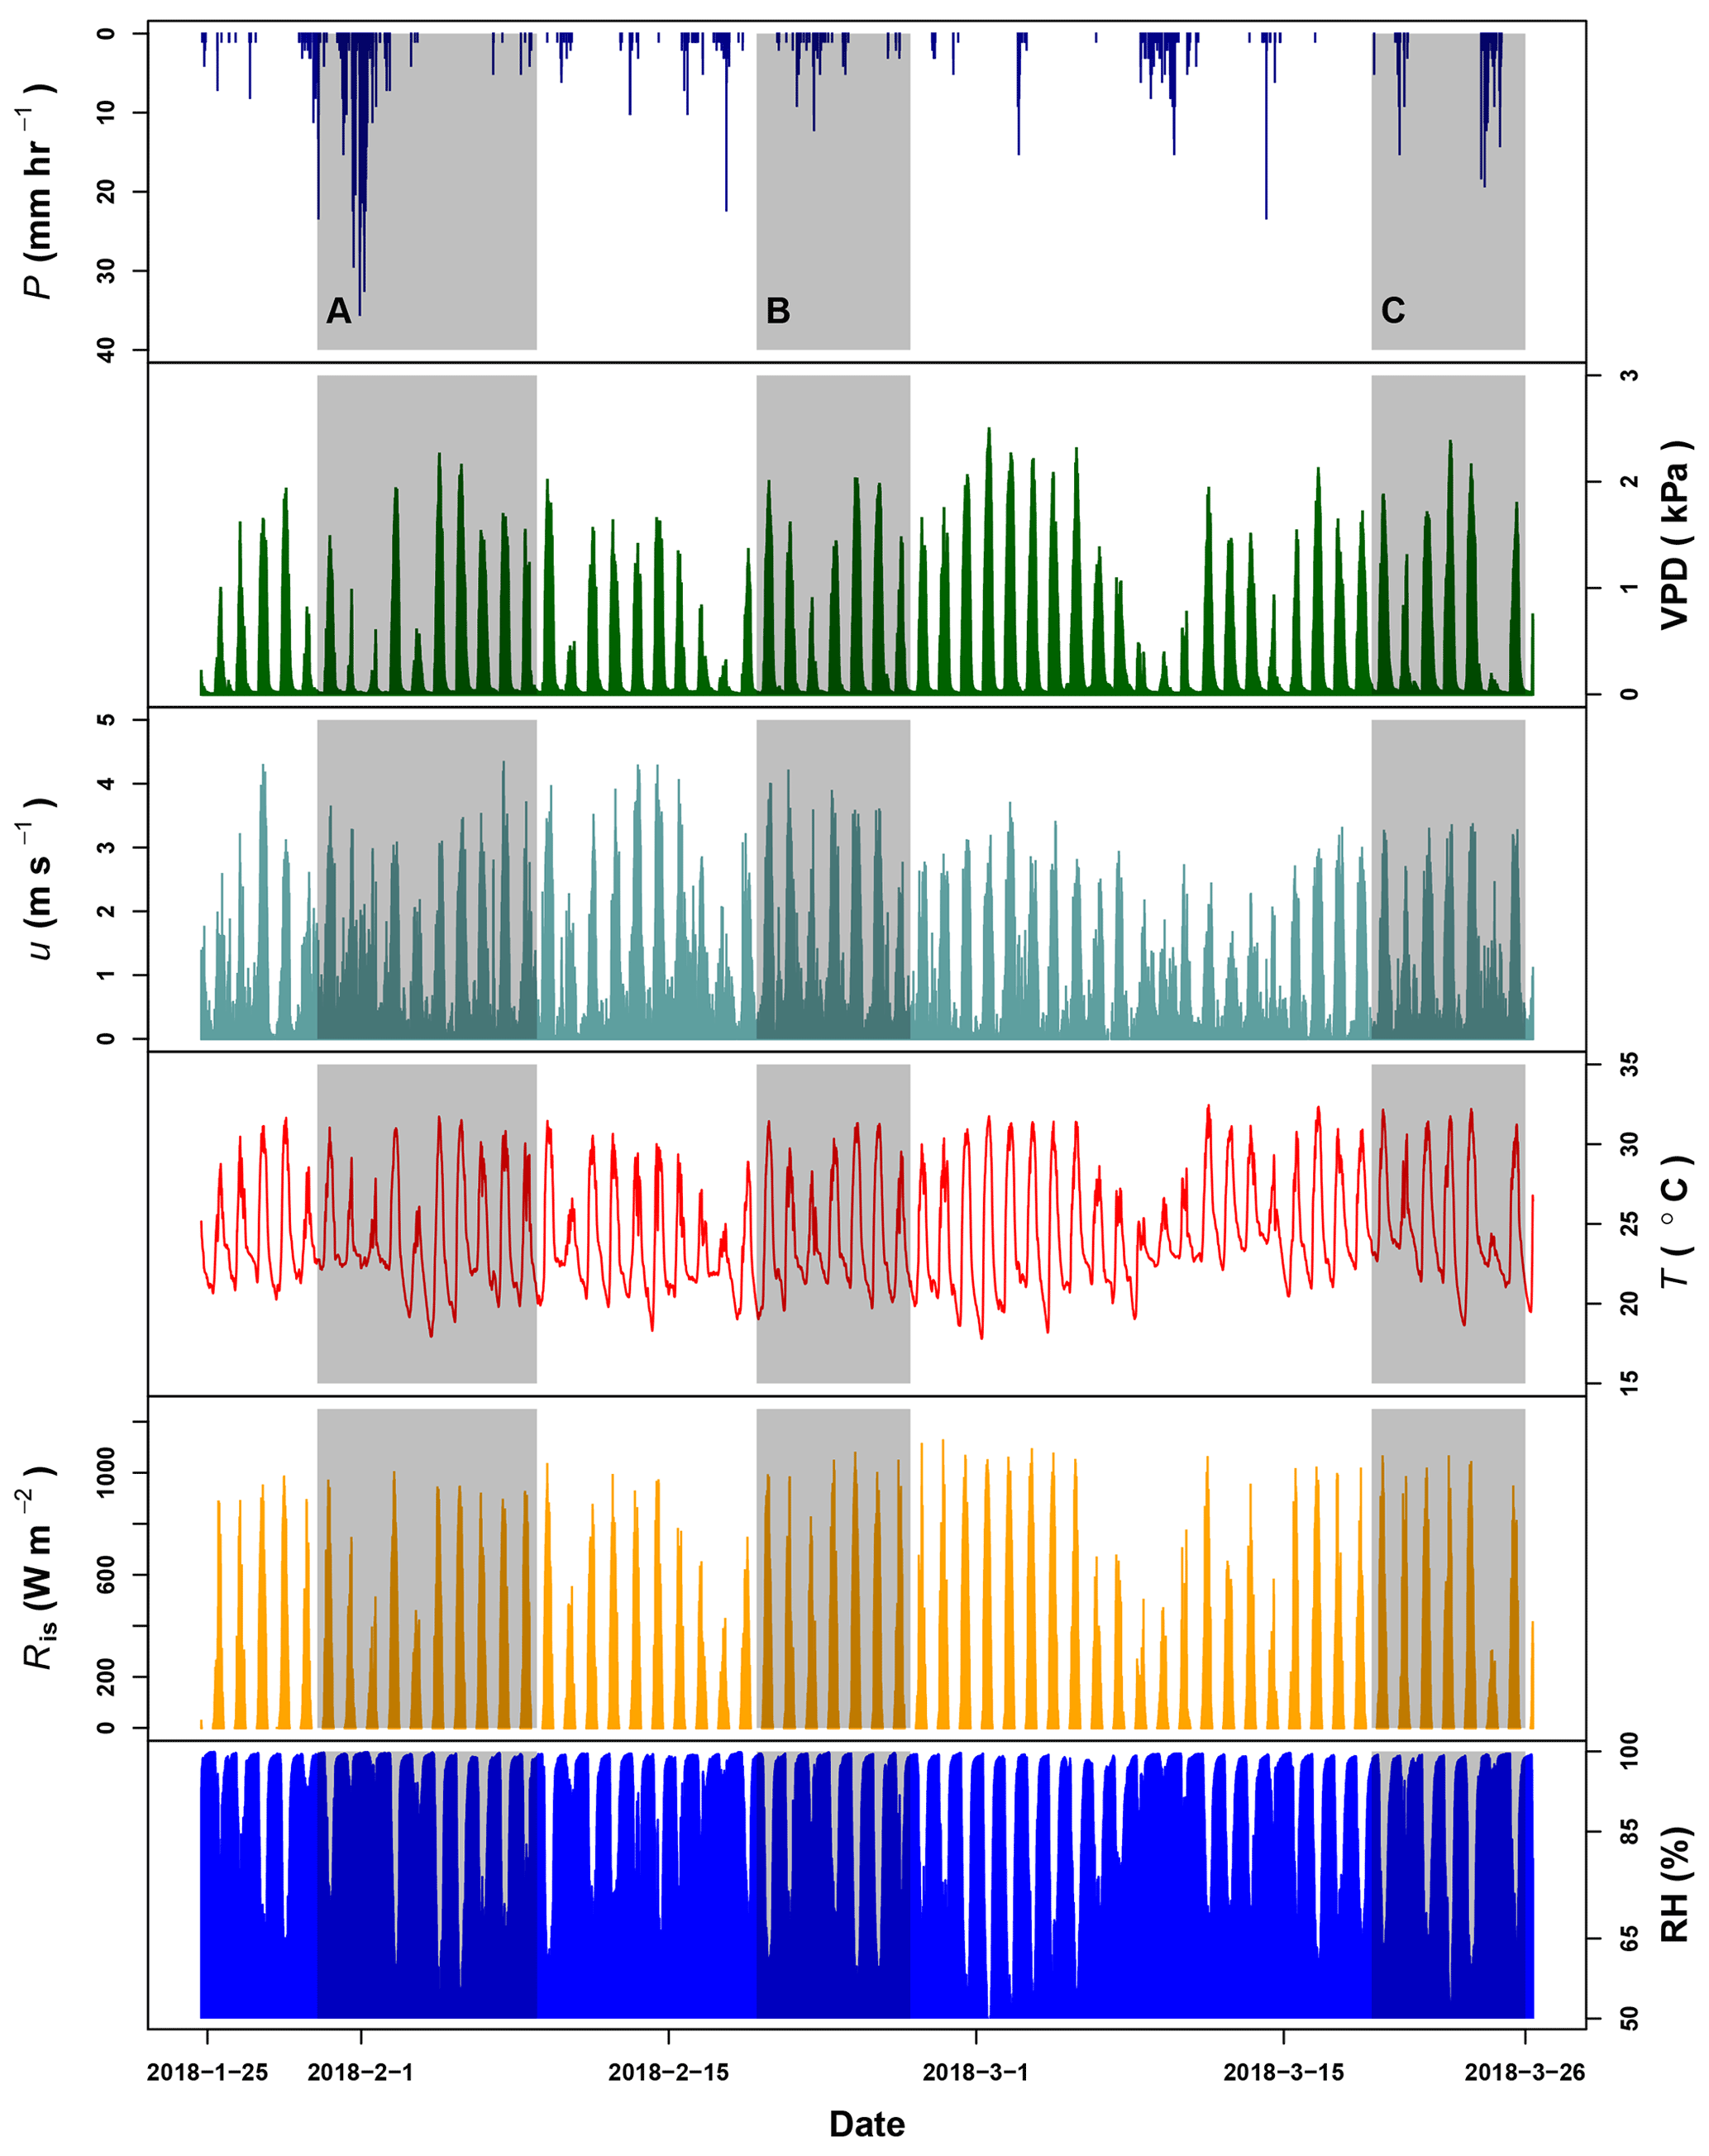
Figure G1Precipitation (P), vapor pressure deficit (VPD), wind speed (u) and temperature (T) registered by the meteorological station at La Selva Biological Station (LSBS). The monitoring period covered from 20 January to 25 March 2018. Shadowed areas represent the three periods when water samples were collected at the MRI plot.
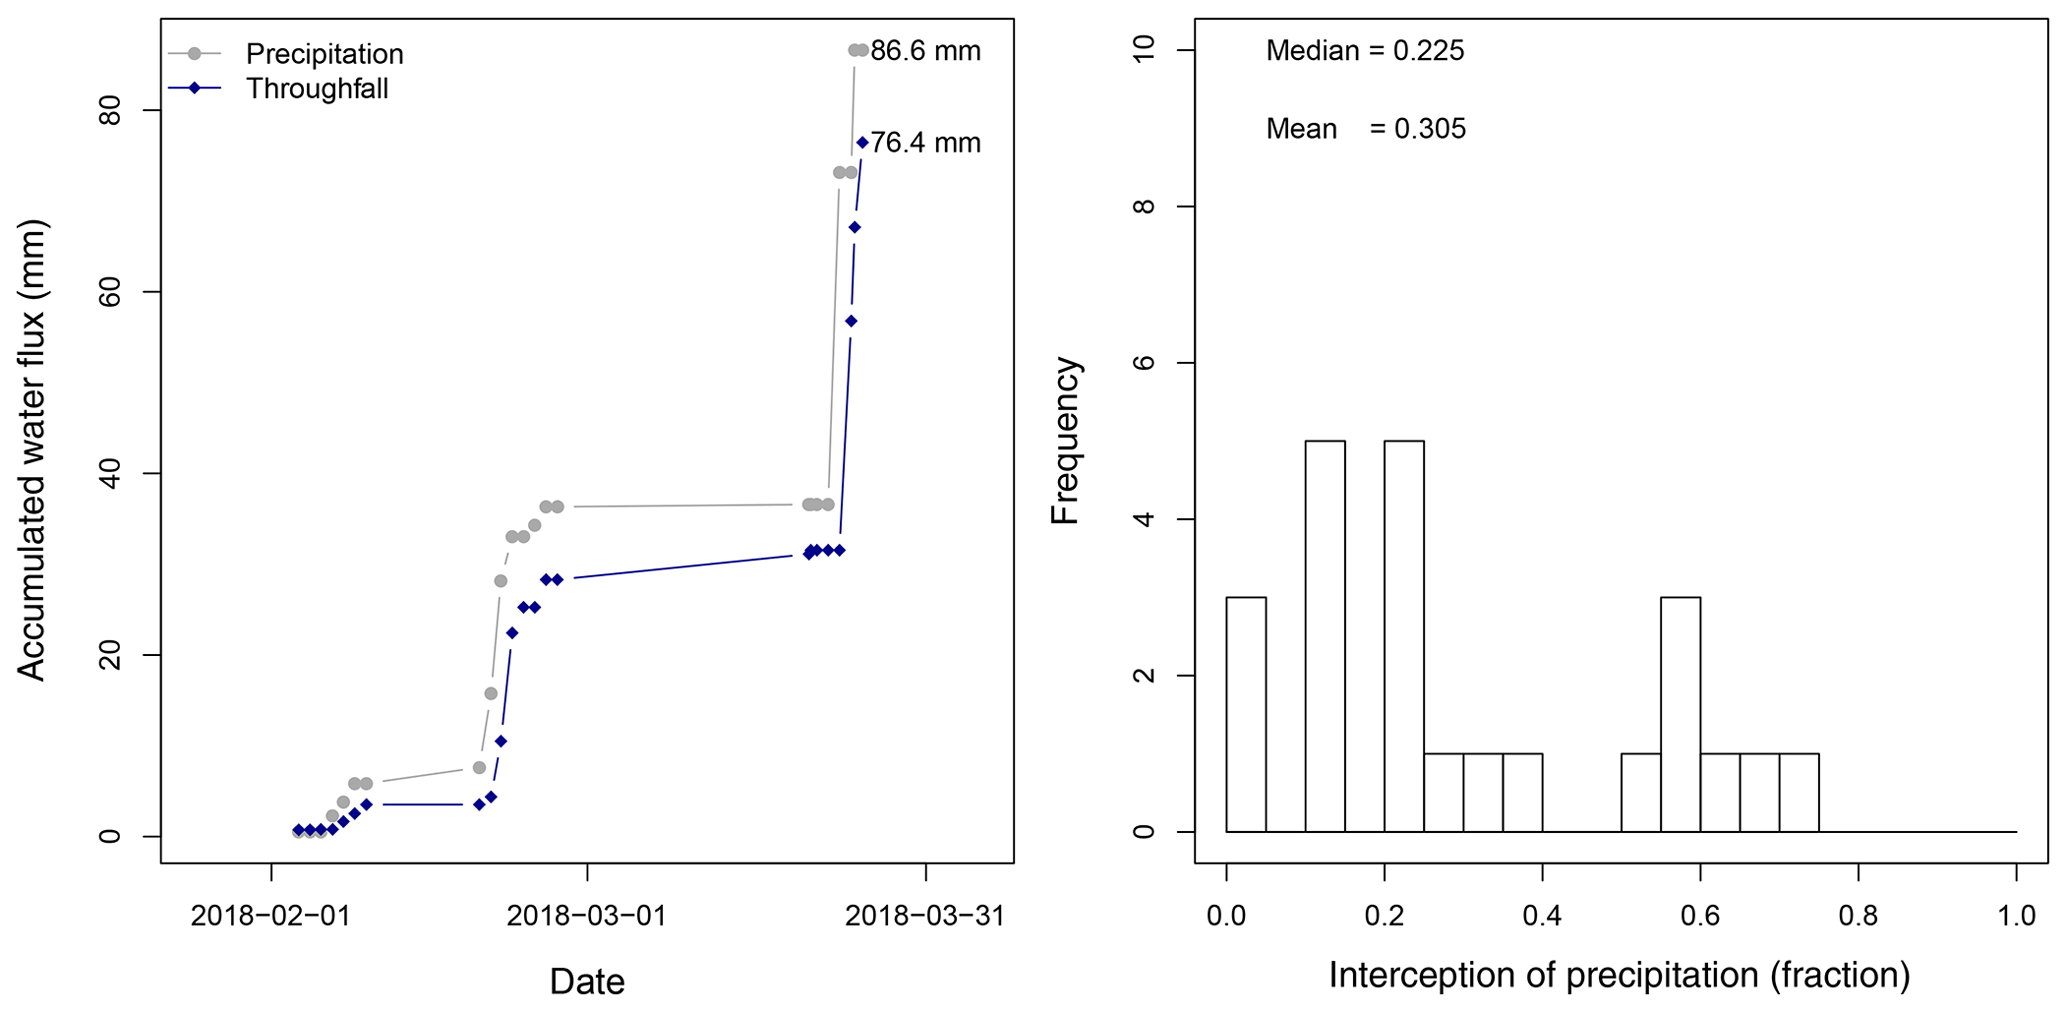
Figure H1Analysis of the interception of precipitation for the sampling carried out at La Selva Biological Station.
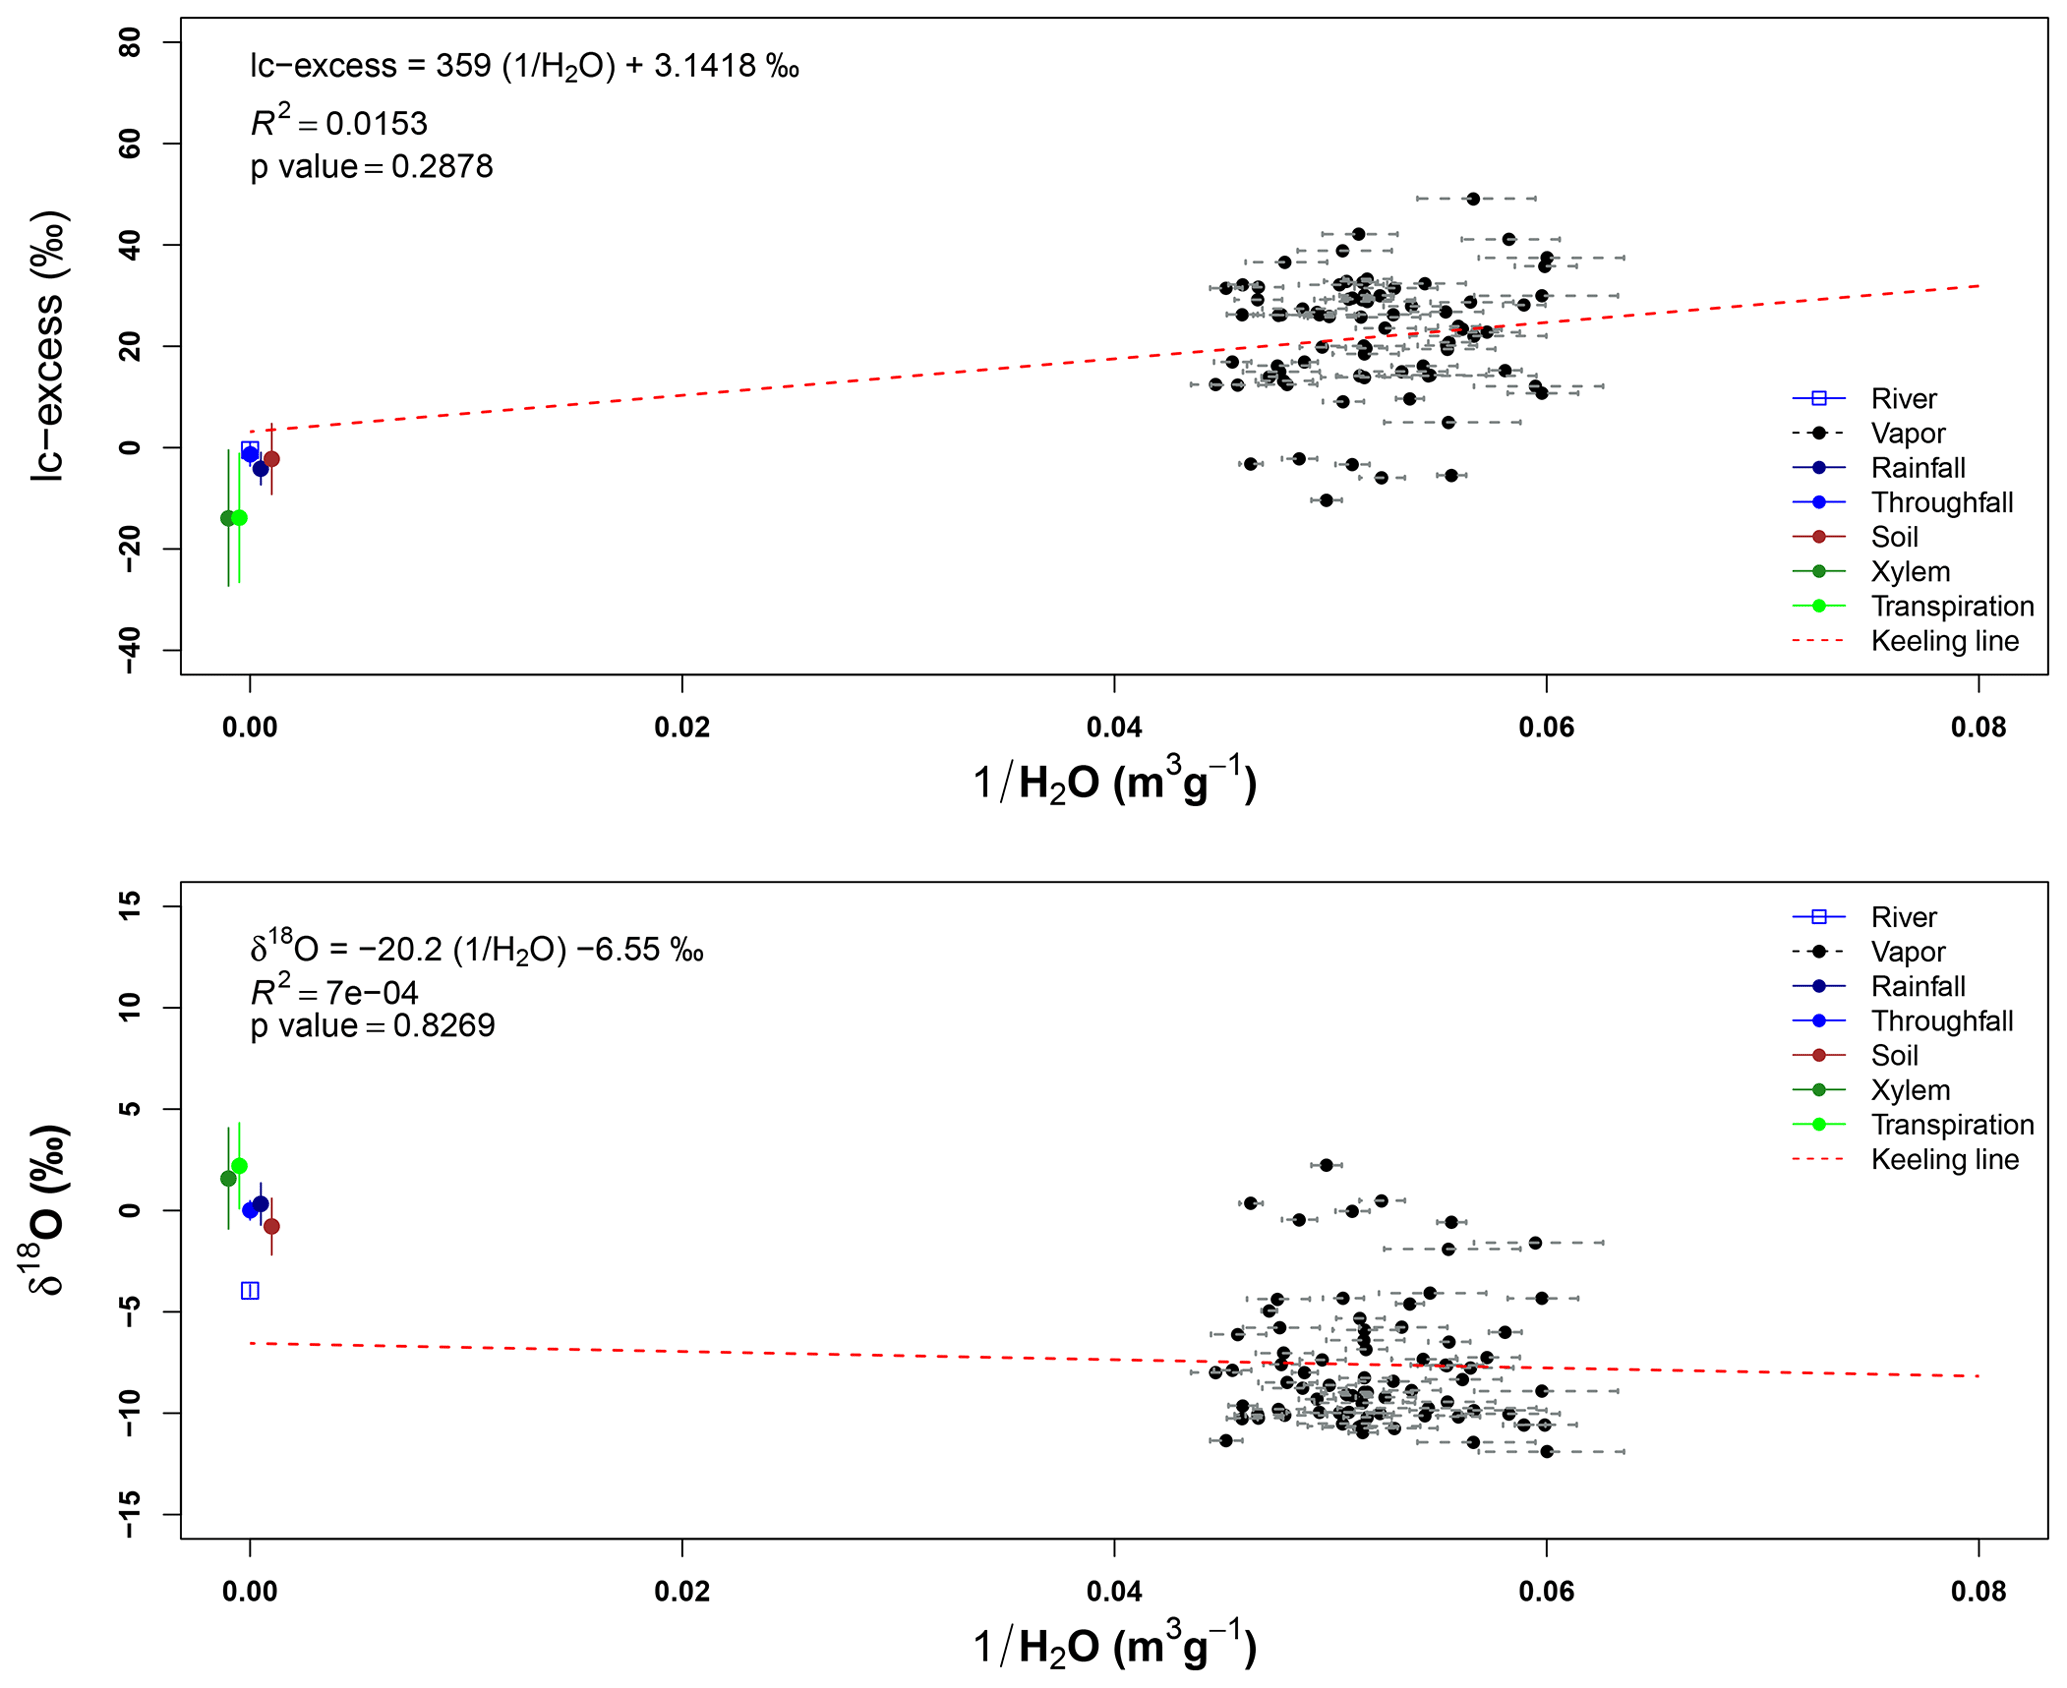
Figure I1Line-conditioned excess (lc-excess) and oxygen-18 (δ2O) mixing relationships (“Keeling plots”) for the monitoring period. Air samples collected at 43 and 22 m height. The standard deviation of each air sample shows the variation of the absolute humidity of the air (ρv) for each sampling.
Table J1Pairwise comparisons to determine differences in lc-excess values among the different sample types. The asterisks describe the significance level of the comparison at p=0.05 (), p=0.01 (), p=0.001 (*) and no differences (other).

P is precipitation. TF is throughfall. A- corresponds to air samples collected at 22, 30 and 43 m. X- and T- correspond to xylem and transpired water, respectively; both sample types collected in lianas (l), bushes (l), palms (p) and trees (t). SW- corresponds to the soil water samples collected at 5 and 10 cm depth.
The data used in this article are available online in the 4TU data repository (https://doi.org/10.4121/uuid:e70993d2-5852-4f63-9aff-39451fbd3fde; Jiménez-Rodríguez et al., 2019).
The project conceptualization and funding acquisition was carried out by César Dionisio Jiménez-Rodríguez (CJR) and Miriam Coenders-Gerrits (MCG). The investigation and data curation was carried out by Adriana Gonzalez-Angarita and CJR. Finally, the project administration, writing of the original manuscript and data visualization was carried out by CJR with inputs from all the co-authors.
The authors declare that they have no conflict of interest.
This article is part of the special issue “Water, isotope and solute fluxes in the soil–plant–atmosphere interface: investigations from the canopy to the root zone”. It is not associated with a conference.
This work was carried out with a fellowship from the Organization for Tropical Studies (Glaxo Centroamerica Fellowship–Fund 502), the aid of a scholarship from PINN-MICITT Costa Rica (contract: PED-032-2015-1) and the grant 863.15.022 from The Netherlands Organization for Scientific Research (NWO). Special thanks to Bernal Matarrita, Orlando Vargas, Wagner López, Danilo Brenes, Diego Dierick, Enrique Castro and Marisol Luna for their help and advice in the research station. Finally, thanks are due to all the staff of the OTS for its willingness to support our project and to Luiza Aparecido and one anonymous reviewer, who helped to improve the paper.
This research has been supported by the Ministerio de Ciencia Tecnología y Telecomunicaciones (grant no. PED-032-2015-1), the Nederlandse Organisatie voor Wetenschappelijk Onderzoek, Stichting voor de Technische Wetenschappen (grant no. 863.15.022), the Organization for Tropical Studies (Glaxo Centroamerica Fellowship (fund no. 502)), the NASA's Earth and Space Science Fellowship (grant no. NNX12AN43H), and NASA New Investigator Program (grant no. 80NSSC18K0708).
This paper was edited by Pilar Llorens and reviewed by Luiza Aparecido and one anonymous referee.
Adelman, J. D., Ewers, B. E., and MacKay, D. S.: Use of temporal patterns in vapor pressure deficit to explain spatial autocorrelation dynamics in tree transpiration, Tree Physiol., 28, 647–658, https://doi.org/10.1093/treephys/28.4.647, 2008. a
Ah-Peng, C., Cardoso, A. W., Flores, O., West, A., Wilding, N., Strasberg, D., and Hedderson, T. A.: The role of epiphytic bryophytes in interception, storage, and the regulated release of atmospheric moisture in a tropical montane cloud forest, J. Hydrol., 548, 665–673, https://doi.org/10.1016/j.jhydrol.2017.03.043, 2017. a
Allen, S. T., Keim, R. F., and McDonnell, J. J.: Spatial patterns of throughfall isotopic composition at the event and seasonal timescales, J. Hydrol., 522, 58–66, https://doi.org/10.1016/j.jhydrol.2014.12.029, 2015. a
Allen, S. T., Keim, R. F., Barnard, H. R., McDonnell, J. J., and Renée, B. J.: The role of stable isotopes in understanding rainfall interception processes: a review, WIREs Water, 4, e1187, https://doi.org/10.1002/wat2.1187, 2016. a, b
Allison, G., Barnes, C., Hughes, M., and Leaney, F.: Effect of climate and vegetation on oxygen-18 and deuterium profiles in soils, Isotopes Hydrology, IAEA, Vienna, 105–122, 1984. a
An, N., Hemmati, S., and Cui, Y.-J.: Assessment of the methods for determining net radiation at different time–scales of meteorological variables, J. Rock Mech. Geotech. Eng., 9, 239–246, https://doi.org/10.1016/j.jrmge.2016.10.004, 2017. a
Aparecido, L. M. T., Miller, G. R., Cahill, A. T., and Moore, G. W.: Comparison of tree transpiration under wet and dry canopy conditions in a Costa Rican premontane tropical forest, Hydrol. Process., 30, 5000–5011, https://doi.org/10.1002/hyp.10960, 2016. a, b
Baldocchi, D. D. and Ryu, Y.: A Synthesis of Forest Evaporation Fluxes – from Days to Years – as Measured with Eddy Covariance, Springer Netherlands, Dordrecht, 101–116, https://doi.org/10.1007/978-94-007-1363-5_5, 2011. a
Barbeta, A., Jones, S. P., Clavé, L., Wingate, L., Gimeno, T. E., Fréjaville, B., Wohl, S., and Ogée, J.: Unexplained hydrogen isotope offsets complicate the identification and quantification of tree water sources in a riparian forest, Hydrol. Earth Syst. Sci., 23, 2129–2146, https://doi.org/10.5194/hess-23-2129-2019, 2019. a, b
Bassette, C. and Bussière, F.: Partitioning of splash and storage during raindrop impacts on banana leaves, Agr. Forest Meteorol., 148, 991–1004, https://doi.org/10.1016/j.agrformet.2008.01.016, 2008. a
Becker, P. and Castillo, A.: Root Architecture of Shrubs and Saplings in the Understory of a Tropical Moist Forest in Lowland Panama, Biotropica, 22, 242–249, https://doi.org/10.2307/2388534, 1990. a
Blumstock, M., Tetzlaff, D., Malcolm, I., Nuetzmann, G., and Soulsby, C.: Baseflow dynamics: Multi-tracer surveys to assess variable groundwater contributions to montane streams under low flows, J. Hydrol., 527, 1021–1033, https://doi.org/10.1016/j.jhydrol.2015.05.019, 2015. a
Blyth, E. and Harding, R. J.: Methods to separate observed global evapotranspiration into the interception, transpiration and soil surface evaporation components, Hydrol. Process., 25, 4063–4068, https://doi.org/10.1002/hyp.8409, 2011. a
Borchsenius, F., Borgtoft-Pedersen, H., and Baslev, H.: Manual to the Palms of Ecuador. AAU Reports 37. Department of Systematic Botany, University of Aarhus, Denmark in collaboration with Pontificia Universidad Catolica del Ecuador World Checklist of Arecaceae, 1998. a
Brenes-Arguedas, T., Roddy, A. B., Coley, P. D., and Kursar, T. A.: Do differences in understory light contribute to species distributions along a tropical rainfall gradient?, Oecologia, 166, 443–456, https://doi.org/10.1007/s00442-010-1832-9, 2011. a
Cadol, D., Kampf, S., and Wohl, E.: Effects of evapotranspiration on baseflow in a tropical headwater catchment, J. Hydrol., 462–463, 4–14, https://doi.org/10.1016/j.jhydrol.2012.04.060, 2012. a
Calder, I., Wright, I., and Murdiyarso, D.: A study of evaporation from tropical rain forest – West Java, J. Hydrol., 89, 13–31, https://doi.org/10.1016/0022-1694(86)90139-3, 1986. a
Campanello, P. I., Manzané, E., Villagra, M., Zhang, Y.-J., Panizza, A. M., di Francescantonio, D., Rodriguez, S. A., Chen, Y.-J., Santiago, L. S., and Goldstein, G.: Carbon Allocation and Water Relations of Lianas Versus Trees, Springer International Publishing, Cham, 103–124, https://doi.org/10.1007/978-3-319-27422-5_5, 2016. a
Carlyle-Moses, D. E. and Gash, J. H. C.: Rainfall Interception Loss by Forest Canopies, Springer Netherlands, Dordrecht, 407–423, https://doi.org/10.1007/978-94-007-1363-5_20, 2011. a
Cavelier, J. and Vargas, G.: Procesos Hidrológicos, in: Ecología y conservación de bosques neotropicales, edited by: Guariguata, M. and Kattan, G., Libro Regional Universitario (LUR), Cartago-Costa Rica, 144–166, 2002. a, b
Chazdon, R. L.: The Costs of Leaf Support in Understory Palms: Economy Versus Safety, The American Naturalist, 127, 9–30, https://doi.org/10.1086/284464, 1986. a
Chazdon, R. L.: Photosynthetic plasticity of two rain forest shrubs across natural gap transects, Oecologia, 92, 586–595, https://doi.org/10.1007/BF00317853, 1992. a
Chen, Y.-J., Cao, K.-F., Schnitzer, S. A., Fan, Z.-X., Zhang, J.-L., and Bongers, F.: Water-use advantage for lianas over trees in tropical seasonal forests, New Phytol., 205, 128–136, https://doi.org/10.1111/nph.13036, 2015. a, b
Coplen, T.: A guide for the laboratory information management system (LIMS) for light stable isotopes–Versions 7 and 8: U.S. Geological Survey Open-File Report 00-345, 121 pp., available at: https://water.usgs.gov/software/code/geochemical/lims/doc/ofr00345.pdf (last access: 15 October 2019), 2000. a
Craig, H.: Standard for Reporting Concentrations of Deuterium and Oxygen-18 in Natural Waters, Science, 133, 1833–1834, https://doi.org/10.1126/science.133.3467.1833, 1961. a
Crang, R., Lyons-Sobaski, S., and Wise, R.: Plant Anatomy: A Concept-Based Approach to the Structure of Seed Plants, Springer, Switzerland, 2018. a
Crowther, T. W., Glick, H. B., Covey, K. R., Bettigole, C., Maynard, D. S., Thomas, S. M., Smith, J. R., Hintler, G., Duguid, M. C., Amatulli, G., Tuanmu, M.-N., Jetz, W. , Salas, C. , Stam, C., Piotto, D. , Tavani, R., Green, S., Bruce, G., Williams, S. J., Wiser, S. K., Huber, M. O., Hengeveld, G. M., Nabuurs, G.-J., Tikhonova, E., Borchardt, P., Li, C.-F., Powrie, L. W., Fischer, M. Hemp, A., Homeier, J., Cho, P., Vibrans, A. C., Umunay, P. M., Piao, S. L., Rowe, C. W., Ashton, M. S., Crane, P. R., and Bradford, M. A.: Mapping tree density at a global scale, Nature, 525, 201–205, 2015. a
da Rocha, H. R., Manzi, A. O., Cabral, O. M., Miller, S. D., Goulden, M. L., Saleska, S. R., R.-Coupe, N., Wofsy, S. C., Borma, L. S., Artaxo, P., Vourlitis, G., Nogueira, J. S., Cardoso, F. L., Nobre, A. D., Kruijt, B., Freitas, H. C., von Randow, C., Aguiar, R. G., and Maia, J. F.: Patterns of water and heat flux across a biome gradient from tropical forest to savanna in Brazil, J. Geophys. Res.-Biogeosci., 114, G00B12, https://doi.org/10.1029/2007JG000640, 2009. a
Dawson, T. E. and Simonin, K. A.: The Roles of Stable Isotopes in Forest Hydrology and Biogeochemistry, Springer Netherlands, Dordrecht, 137–161, 2011. a, b
De Deurwaerder, H., Hervé-Fernández, P., Stahl, C., Burban, B., Petronelli, P., Hoffman, B., Bonal, D., Boeckx, P., and Verbeeck, H.: Liana and tree below-ground water competition–evidence for water resource partitioning during the dry season, Tree Physiol., 38, 1071–1083, https://doi.org/10.1093/treephys/tpy002, 2018. a, b
Dubayah, R. O., Sheldon, S. L., Clark, D. B., Hofton, M. A., Blair, J. B., Hurtt, G. C., and Chazdon, R. L.: Estimation of tropical forest height and biomass dynamics using lidar remote sensing at La Selva, Costa Rica, J. Geophys. Res.-Biogeosci., 115, G00E09, https://doi.org/10.1029/2009JG000933, 2010. a
Dubbert, M., Cuntz, M., Piayda, A., and Werner, C.: Oxygen isotope signatures of transpired water vapor: the role of isotopic non-steady-state transpiration under natural conditions, New Phytol., 203, 1242–1252, https://doi.org/10.1111/nph.12878, 2014. a
Dubbert, M., Kübert, A., and Werner, C.: Impact of leaf traits on temporal dynamics of transpired oxygen isotope signatures and its impact on atmospheric vapor, Front. Plant Sci., 8, 5, https://doi.org/10.3389/fpls.2017.00005, 2017. a
Eamus, D., Huete, A., and Yu, Q.: Modelling Leaf and Canopy Transpiration and the Soil–Plant–Atmosphere Continuum, in: Vegetation Dynamics, edited by: Eamus, D., Huete, A., and Yu, Q., Cambridge University Press, New York, USA, chap. 12, 296–320, 2016. a
Ehleringer, J. and Dawson, T.: Water uptake by plants: perspectives from stable isotope composition, Plant Cell Environ., 15, 1073–1082, https://doi.org/10.1111/j.1365-3040.1992.tb01657.x, 1992. a, b
Eilu, G., Hafashimana, D. L. N., and Kasenene, J. M.: Density and species diversity of trees in four tropical forests of the Albertine rift, western Uganda, Divers. Distrib., 10, 303–312, https://doi.org/10.1111/j.1366-9516.2004.00089.x, 2004. a
Ellsworth, P. Z. and Williams, D. G.: Hydrogen isotope fractionation during water uptake by woody xerophytes, Plant Soil, 291, 93–107, https://doi.org/10.1007/s11104-006-9177-1, 2007. a
Fetcher, N., Oberbauer, S. F., and Strain, B. R.: Vegetation effects on microclimate in lowland tropical forest in Costa Rica, Int. J. Biometeorol., 29, 145–155, https://doi.org/10.1007/BF02189035, 1985. a
Fitzjarrald, D. and Moore, K.: Physical Mechanisms of heat and mass exchange between forests and the atmosphere, in: Forest Canopies, edited by: Lowman, M. and Nadkarni, N., Academic Press, San Diego, 45–72, 1995. a
Frazer, G. W., Canham, C., and Lertzman, K.: Gap Light Analyzer (GLA), Version 2.0: Imaging software to extract canopy structure and gap light transmission indices from true-colour fisheye photographs, users manual and program documentation, Simon Fraser University, Burnaby, British Columbia, and the Institute of Ecosystem Studies, Millbrook, New York, p. 36, 1999. a
Frey, S. J. K., Hadley, A. S., Johnson, S. L., Schulze, M., Jones, J. A., and Betts, M. G.: Spatial models reveal the microclimatic buffering capacity of old-growth forests, Sci. Adv., 2, e1501392, https://doi.org/10.1126/sciadv.1501392, 2016. a
Fu, P.-L., Liu, W.-J., Fan, Z.-X., and Cao, K.-F.: Is fog an important water source for woody plants in an Asian tropical karst forest during the dry season?, Ecohydrology, 9, 964–972, https://doi.org/10.1002/eco.1694, 2016. a
Germer, S.: Development of near-surface perched water tables during natural and artificial stemflow generation by babassu palms, J. Hydrol., 507, 262–272, https://doi.org/10.1016/j.jhydrol.2013.10.026, 2013. a
Germer, S., Werther, L., and Elsenbeer, H.: Have we underestimated stemflow? Lessons from an open tropical rainforest, J. Hydrol., 395, 169–179, https://doi.org/10.1016/j.jhydrol.2010.10.022, 2010. a
Gerrits, A. M. J., Pfister, L., and Savenije, H. H. G.: Spatial and temporal variability of canopy and forest floor interception in a beech forest, Hydrol. Process., 24, 3011–3025, https://doi.org/10.1002/hyp.7712, 2010. a
Ghimire, C. P., Lubczynski, M. W., Bruijnzeel, L. A., Zwartendijk, B. W., van Meerveld, H. J. I., Odongo, V. O., and Ravelona, M.: Transpiration and stomatal conductance in a young secondary tropical montane forest: contrasts between native trees and invasive understorey shrubs, Tree Physiol., 38, 1053–1070, https://doi.org/10.1093/treephys/tpy004, 2018. a
Gomez, L.: Vegetacion de Costa Rica: Apuntes para una biogeografia Costarricense: vegetacion y clima de Costa Rica, EUNED, San José, Costa Rica, 1986. a
Goosse, H.: The energy balance, hydrological and carbon cycles, in: Climate System Dynamics and Modelling, chap. 2, Cambridge University Press, Cambridge, England, 2015. a
Gotsch, S. G., Nadkarni, N., and Amici, A.: The functional roles of epiphytes and arboreal soils in tropical montane cloud forests, J. Trop. Ecol., 32, 455–468, https://doi.org/10.1017/S026646741600033X, 2016. a
Groff, P. A. and Kaplan, D. R.: The relation of root systems to shoot systems in vascular plants, Bot. Rev., 54, 387–422, https://doi.org/10.1007/BF02858417, 1988. a
Guariguata, M. and Ostertag, R.: Sucesión secundaria, in: Ecología y conservación de bosques neotropicales, edited by: Guariguata, M. and Kattan, G., Libro Regional Universitario (LUR), Cartago, Costa Rica, 591–624, 2002. a
Guo, F., Ma, J.-J., Zheng, L.-J., Sun, X.-H., Guo, X.-H., and Zhang, X.-L.: Estimating distribution of water uptake with depth of winter wheat by hydrogen and oxygen stable isotopes under different irrigation depths, J. Integr. Agric., 15, 891–906, https://doi.org/10.1016/S2095-3119(15)61258-8, 2016. a
Harper, A., Baker, I. T., Denning, A. S., Randall, D. A., Dazlich, D., and Branson, M.: Impact of Evapotranspiration on Dry Season Climate in the Amazon Forest, J. Climate, 27, 574–591, https://doi.org/10.1175/JCLI-D-13-00074.1, 2014. a
Hartshorn, G.: Biogeografía de los bosques neotropicales, in: Ecología y conservación de bosques neotropicales, edited by: Guariguata, M. and Kattan, G., Libro Regional Universitario (LUR), Cartago, Costa Rica, 59–82, 2002. a
Heijmans, M. M. P. D., Arp, W. J., and Chapin, F. S.: Controls on moss evaporation in a boreal black spruce forest, Global Biogeochem. Cy., 18, GB2004, https://doi.org/10.1029/2003GB002128, 2004. a
Hogan, K. and Kattan, J.: La luz solar: consecuencias biológicas y medición, in: Ecología y conservación de bosques neotropicales, edited by: Guariguata, M. and Kattan, G., Libro Regional Universitario (LUR), Cartago, Costa Rica, 119–143, 2002. a, b
Hogg, E. H. and Hurdle, P. A.: Sap flow in trembling aspen: implications for stomatal responses to vapor pressure deficit, Tree Physiol., 17, 501–509, https://doi.org/10.1093/treephys/17.8-9.501, 1997. a
Holdridge, L. R. and Tosi, J. A.: Life Zone Ecology, Tropical Science Center, San Jose, Costa Rica, 1967. a, b
Holmes, T. R. H., Owe, M., De Jeu, R. A. M., and Kooi, H.: Estimating the soil temperature profile from a single depth observation: A simple empirical heatflow solution, Water Resour. Res., 44, 1–11, https://doi.org/10.1029/2007WR005994, 2008. a
Holwerda, F., Bruijnzeel, L., Scatena, F., Vugts, H., and Meesters, A.: Wet canopy evaporation from a Puerto Rican lower montane rain forest: The importance of realistically estimated aerodynamic conductance, J. Hydrol., 414-415, 1–15, https://doi.org/10.1016/j.jhydrol.2011.07.033, 2012. a
Hopkins, W. G. and Hüner, N. P.: Introduction to Plant Physiology, Wiley, New Jersey, USA, 2008. a
Hsueh, Y.-H., Allen, S. T., and Keim, R. F.: Fine-scale spatial variability of throughfall amount and isotopic composition under a hardwood forest canopy, Hydrol. Process., 30, 1796–1803, https://doi.org/10.1002/hyp.10772, 2016. a, b
Iida, S., Ohta, T., Matsumoto, K., Nakai, T., Kuwada, T., Kononov, A. V., Maximov, T. C., van der Molen, M. K., Dolman, H., Tanaka, H., and Yabuki, H.: Evapotranspiration from understory vegetation in an eastern Siberian boreal larch forest, Agr. Forest Meteorol., 149, 1129–1139, https://doi.org/10.1016/j.agrformet.2009.02.003, 2009. a
Jackson, P. C., Cavelier, J., Goldstein, G., Meinzer, F. C., and Holbrook, N. M.: Partitioning of water resources among plants of a lowland tropical forest, Oecologia, 101, 197–203, https://doi.org/10.1007/BF00317284, 1995. a
Jiménez-Rodríguez, C., Gonzalez-Angarita, A., and Coenders-Gerrits, A.: Meteorological data and isotope signatures of water samples collected at La Selva, Dataset, 4TU.ResearchData, available at: https://doi.org/10.4121/uuid:e70993d2-5852-4f63-9aff-39451fbd3fde, 2019. a
Keeling, C. D.: The concentration and isotopic abundances of atmospheric carbon dioxide in rural areas, Geochim. Cosmochim. Ac., 13, 322–334, https://doi.org/10.1016/0016-7037(58)90033-4, 1958. a
Kendall, C. and McDonell, J. J., eds.: Chapter 5 – Isotopic Exchange in Soil Water, Elsevier, Amsterdam, 137–163, https://doi.org/10.1016/B978-0-444-81546-0.50012-4, 1998. a
Kerfoot, O.: The root systems of tropical forest trees, The Commonwealth Forestry Rev., 42, 19–26, 1963. a
Kool, D., Agam, N., Lazarovitch, N., Heitman, J., Sauer, T., and Ben-Gal, A.: A review of approaches for evapotranspiration partitioning, Agr. Forest Meteorol., 184, 56–70, https://doi.org/10.1016/j.agrformet.2013.09.003, 2014. a
Kunert, N., Aparecido, L. M. T., Wolff, S., Higuchi, N., dos Santos, J., de Araujo, A. C., and Trumbore, S.: A revised hydrological model for the Central Amazon: The importance of emergent canopy trees in the forest water budget, Agr. Forest Meteorol., 239, 47–57, https://doi.org/10.1016/j.agrformet.2017.03.002, 2017. a
Lieberman, D. and Lieberman, M.: Forest tree growth and dynamics at La Selva, Costa Rica (1969–1982), J. Trop. Ecol., 3, 347–358, https://doi.org/10.1017/S0266467400002327, 1987. a
Lion, M., Kosugi, Y., Takanashi, S., Noguchi, S., Itoh, M., Katsuyama, M., Matsuo, N., and Shamsuddin, S.-A.: Evapotranspiration and water source of a tropical rainforest in peninsular Malaysia, Hydrol. Process., 31, 4338–4353, https://doi.org/10.1002/hyp.11360, 2017. a
Liu, W. J., Liu, W. Y., Li, J. T., Wu, Z. W., and Li, H. M.: Isotope variations of throughfall, stemflow and soil water in a tropical rain forest and a rubber plantation in Xishuangbanna, SW China, Hydrol. Res., 39, 437–449, https://doi.org/10.2166/nh.2008.110, 2008. a
Liu, W., Liu, W., Li, P., Duan, W., and Li, H.: Dry season water uptake by two dominant canopy tree species in a tropical seasonal rainforest of Xishuangbanna, SW China, Agr. Forest Meteorol., 150, 380–388, https://doi.org/10.1016/j.agrformet.2009.12.006, 2010. a, b
Loescher, H., Gholz, H., Jacobs, J., and Oberbauer, S.: Energy dynamics and modeled evapotranspiration from a wet tropical forest in Costa Rica, J. Hydrol., 315, 274–294, https://doi.org/10.1016/j.jhydrol.2005.03.040, 2005. a, b, c, d, e, f, g, h, i
Magliano, P. N., Giménez, R., Houspanossian, J., Páez, R. A., Nosetto, M. D., Fernández, R. J., and Jobbágy, E. G.: Litter is more effective than forest canopy reducing soil evaporation in Dry Chaco rangelands, Ecohydrology, 10, e1879, https://doi.org/10.1002/eco.1879, 2017. a
Martín-Gómez, P., Serrano, L., and Ferrio, J. P.: Short-term dynamics of evaporative enrichment of xylem water in woody stems: implications for ecohydrology, Tree Physiol., 37, 511–522, https://doi.org/10.1093/treephys/tpw115, 2016. a, b
Miralles, D. G., Gash, J. H., Holmes, T. R. H., de Jeu, R. A. M., and Dolman, A. J.: Global canopy interception from satellite observations, J. Geophys. Res.-Atmos., 115, D16122, https://doi.org/10.1029/2009JD013530, 2010. a
Miralles, D. G., De Jeu, R. A. M., Gash, J. H., Holmes, T. R. H., and Dolman, A. J.: Magnitude and variability of land evaporation and its components at the global scale, Hydrol. Earth Syst. Sci., 15, 967–981, https://doi.org/10.5194/hess-15-967-2011, 2011. a
Moore, G. W., Orozco, G., Aparecido, L. M., and Miller, G. R.: Upscaling transpiration in diverse forests: Insights from a tropical premontane site, Ecohydrology, 11, e1920, https://doi.org/10.1002/eco.1920, 2018. a
Murakami, S.: A proposal for a new forest canopy interception mechanism: Splash droplet evaporation, J. Hydrol., 319, 72–82, https://doi.org/10.1016/j.jhydrol.2005.07.002, 2006. a
Nadkarni, N. M., Parker, G. G., Rinker, H. B., and Jarzen, D. M.: CHAPTER 1 – The Nature of Forest Canopies, in: Forest Canopies (Second Edition), edited by: Lowman, M. D. and Rinker, H. B., Physiological Ecology, Academic Press, San Diego, 2nd edn., 3–23, https://doi.org/10.1016/B978-012457553-0/50005-8, 2004. a
Naidu, M. T. and Kumar, O. A.: Tree diversity, stand structure, and community composition of tropical forests in Eastern Ghats of Andhra Pradesh, India, J. Asia-Pac. Biodivers., 9, 328–334, https://doi.org/10.1016/j.japb.2016.03.019, 2016. a
Nakamura, A., Kitching, R. L., Cao, M., Creedy, T. J., Fayle, T. M., Freiberg, M., Hewitt, C., Itioka, T., Koh, L. P., Ma, K., Malhi, Y., Mitchell, A., Novotny, V., Ozanne, C. M., Song, L., Wang, H., and Ashton, L. A.: Forests and Their Canopies: Achievements and Horizons in Canopy Science, Trends Ecol. Evol., 32, 438–451, https://doi.org/10.1016/j.tree.2017.02.020, 2017. a
Nakshabandi, G. A. and Kohnke, H.: Thermal conductivity and diffusivity of soils as related to moisture tension and other physical properties, Agric. Meteorol., 2, 271–279, https://doi.org/10.1016/0002-1571(65)90013-0, 1965. a
Obregon, A., Gehrig-Downie, C., Gradstein, S. R., Rollenbeck, R., and Bendix, J.: Canopy level fog occurrence in a tropical lowland forest of French Guiana as a prerequisite for high epiphyte diversity, Agr. Forest Meteorol., 151, 290–300, https://doi.org/10.1016/j.agrformet.2010.11.003, 2011. a
Orwa, C., Mutua, A., Kindt, R., Jamnadass, R., and Anthony, S.: AgroforestreeDatabase: a tree reference and selection guide version 4.0., available at: http://old.worldagroforestry.org/treedb/index.php (last access: 15 October 2019), 2009. a
Parker, G. G.: Structure and microclimate of forest Canopies, in: Forest Canopies, edited by: Lowman, M. and Nadkarni, N., Academic Press, San Diego, CA, 1st edn., 73–106, 1995. a
Peters, T.: Climatic Types of Water Balances in the Tropics, Tropical Forestry Handbook, Springer, New York, USA, 405–412, 2016. a
Pielke, R.: Mesoscale Meteorological Modeling, International Geophysics, Elsevier Science, Amsterdam, available at: https://books.google.nl/books?id=ExlFulltapcC (last access: 15 October 2019), 2013. a, b
Porada, P., Van Stan, J. T., and Kleidon, A.: Significant contribution of non-vascular vegetation to global rainfall interception, Nat. Geosci., 11, 563, https://doi.org/10.13031/2013.19812, 2018. a
Putman, A. L., Fiorella, R. P., Bowen, G. J., and Cai, Z.: A Global Perspective on Local Meteoric Water Lines: Meta-analytic Insight Into Fundamental Controls and Practical Constraints, Water Resour. Res., 55, 6896–6910, https://doi.org/10.1029/2019WR025181, 2019. a
Raich, J. W.: Temporal Variability of Soil Respiration in Experimental Tree Plantations in Lowland Costa Rica, Forests, 8, 40, https://doi.org/10.3390/f8020040, 2017. a
Raz-Yaseef, N., Rotenberg, E., and Yakir, D.: Effects of spatial variations in soil evaporation caused by tree shading on water flux partitioning in a semi-arid pine forest, Agr. Forest Meteorol., 150, 454–462, https://doi.org/10.1016/j.agrformet.2010.01.010, 2010. a
R Core Team: R: A Language and Environment for Statistical Computing, R Foundation for Statistical Computing, Vienna, Austria, available at: https://www.R-project.org/ (last access: 15 October 2019), 2017. a
Read, R. G.: Evaporative Power in the Tropical Forest of the Panama Canal Zone, J. Appl. Meteorol., 7, 417–424, https://doi.org/10.1175/1520-0450(1968)007<0417:EPITTF>2.0.CO;2, 1968. a, b
Renninger, H. J. and Phillips, N. G.: Palm Physiology and Distribution in Response to Global Environmental Change, Springer International Publishing, Cham, 67–101, https://doi.org/10.1007/978-3-319-27422-5_4, 2016. a
Roberts, J.: Plants and Water in Forests and Woodlands, Routledge, London, UK, 181–236, 1999. a, b
Sa, J. H. M., Chaffe, P. L. B., and Quillet, M. J. J.: The influence of the interception process on the precipitation quality in a catchment covered by subtropical Atlantic Forest, RBRH [online], 21, 742–751, https://doi.org/10.1590/2318-0331.011616045, 2016. a
Sánchez-Murillo, R., Esquivel-Hernández, G., Welsh, K., Brooks, E. S., Boll, J., Alfaro-Solís, R., and Valdés-González, J.: Spatial and Temporal Variation of Stable Isotopes in Precipitation across Costa Rica: An Analysis of Historic GNIP Records, Open J. Mod. Hydrol., https://doi.org/10.4236/ojmh.2013.34027, 2013. a, b
Sanford Jr., R. L., Paaby, P., Luvall, J. C., and Phillips, E.: Climate, geomorphology, and aquatic systems., in: La Selva. Ecology and natural history of a Neotropical Rainforest, edited by: McDade, L. A., Bawa, K. S., Hespenheide, H. A., and Hartshorn, G. S., The University of Chicago Press, Chicago, IL, chap. 3, 19–33, 1994. a, b
Savenije, H. H. G.: The importance of interception and why we should delete the term evapotranspiration from our vocabulary, Hydrol. Process., 18, 1507–1511, https://doi.org/10.1002/hyp.5563, 2004. a, b
Schellekens, J., Bruijnzeel, L. A., Scatena, F. N., Bink, N. J., and Holwerda, F.: Evaporation from a tropical rain forest, Luquillo Experimental Forest, eastern Puerto Rico, Water Resour. Res., 36, 2183–2196, https://doi.org/10.1029/2000WR900074, 2000. a
Schwendenmann, L., Pendall, E., Sanchez-Bragado, R., Kunert, N., and Hölscher, D.: Tree water uptake in a tropical plantation varying in tree diversity: interspecific differences, seasonal shifts and complementarity, Ecohydrology, 8, 1–12, https://doi.org/10.1002/eco.1479, 2015. a, b
Scott, R. L., Watts, C., Payan, J. G., Edwards, E., Goodrich, D. C., Williams, D., and Shuttleworth, W. J.: The understory and overstory partitioning of energy and water fluxes in an open canopy, semiarid woodland, Agr. Forest Meteorol., 114, 127–139, 2003. a
Shuttleworth, W.: Evaporation, in: Handbook of Hydrology, edited by: Maidment, D. R., Mc-Graw Hill, Inc., New York, chap. 4, 4.1–4.53, 1993. a, b
Silvertown, J.: Plant coexistence and the niche, Trends Ecol. Evol., 19, 605–611, https://doi.org/10.1016/j.tree.2004.09.003, 2004. a
Silvertown, J., Araya, Y., and Gowing, D.: Hydrological niches in terrestrial plant communities: a review, J. Ecol., 103, 93–108, https://doi.org/10.1111/1365-2745.12332, 2015. a, b
Sollins, P., Sancho M., F., Mata Ch., R., and Sanford Jr., R. L.: Soils and soil process research, in: La Selva. Ecology and natural history of a Neotropical Rainforest, edited by: McDade, L. A., Bawa, K. S., Hespenheide, H. A., and Hartshorn, G. S., The University of Chicago Press, Chicago, IL, chap. 4, 34–53, 1994. a, b
Sprenger, M., Leistert, H., Gimbel, K., and Weiler, M.: Illuminating hydrological processes at the soil–vegetation–atmosphere interface with water stable isotopes, Rev. Geophys., 54, 674–704, https://doi.org/10.1002/2015RG000515, 2016. a
Sprenger, M., Tetzlaff, D., and Soulsby, C.: Soil water stable isotopes reveal evaporation dynamics at the soil–plant–atmosphere interface of the critical zone, Hydrol. Earth Syst. Sci., 21, 3839–3858, https://doi.org/10.5194/hess-21-3839-2017, 2017. a, b
Sun, S., Meng, P., Zhang, J., Wan, X., Zheng, N., and He, C.: Partitioning oak woodland evapotranspiration in the rocky mountainous area of North China was disturbed by foreign vapor, as estimated based on non-steady-state 18O isotopic composition, Agr. Forest Meteorol., 184, 36–47, https://doi.org/10.1016/j.agrformet.2013.08.006, 2014. a
Sun, G., Domec, J., and Amatya, D.: Forest evapotranspiration: measurement and modelling at multiple scales., in: Forest Hydrology: Processes, Management and Assessment, edited by: Amatya, D., Williams, T., Bren, L., and Jong, C., CAB International, https://doi.org/10.1079/9781780646602.0032, 2016. a
Sutanto, S. J., Wenninger, J., Coenders-Gerrits, A. M. J., and Uhlenbrook, S.: Partitioning of evaporation into transpiration, soil evaporation and interception: a comparison between isotope measurements and a HYDRUS-1D model, Hydrol. Earth Syst. Sci., 16, 2605–2616, https://doi.org/10.5194/hess-16-2605-2012, 2012. a
Tan, Z.-H., Cao, M., Yu, G.-R., Tang, J.-W., Deng, X.-B., Song, Q.-H., Tang, Y., Zheng, Z., Liu, W.-J., Feng, Z.-L., Deng, Y., Zhang, J.-L., Liang, N., and Zhang, Y.-P.: High sensitivity of a tropical rainforest to water variability: Evidence from 10 years of inventory and eddy flux data, J. Geophys. Res.-Atmos., 118, 9393–9400, https://doi.org/10.1002/jgrd.50675, 2013. a
Tang, H., Dubayah, R., Swatantran, A., Hofton, M., Sheldon, S., Clark, D. B., and Blair, B.: Retrieval of vertical LAI profiles over tropical rain forests using waveform lidar at La Selva, Costa Rica, Remote Sensing Env., 124, 242–250, https://doi.org/https://doi.org/10.1016/j.rse.2012.05.005, 2012. a
Thornthwaite, C. W.: An approach toward a rational classification of climate, Geogr. Rev., 38, 55–94, https://doi.org/10.2307/210739, 1948. a
Tobón Marin, C., Bouten, W., and Sevink, J.: Gross rainfall and its partitioning into throughfall, stemflow and evaporation of intercepted water in four forest ecosystems in western Amazonia, J. Hydrol., 237, 40–57, https://doi.org/10.1016/S0022-1694(00)00301-2, 2000. a
Tymen, B., Vincent, G., Courtois, E. A., Heurtebize, J., Dauzat, J., Marechaux, I., and Chave, J.: Quantifying micro-environmental variation in tropical rainforest understory at landscape scale by combining airborne LiDAR scanning and a sensor network, Ann. For. Sci., 74, 32, https://doi.org/10.1007/s13595-017-0628-z, 2017. a
Van Wijk, W. and Scholte Ubing, D.: Radiation, in: Physics of plant environment, edited by: Van Wijk, W., North-Holland Publishing Company, Amsterdam, Netherlands, 62–101, 1963. a
Vargas, A. I., Schaffer, B., Yuhong, L., and Sternberg, L. d. S. L.: Testing plant use of mobile vs immobile soil water sources using stable isotope experiments, New Phytol., 215, 582–594, https://doi.org/10.1111/nph.14616, 2017. a, b
Volkov, I., Banavar, J. R., He, F., Hubbell, S. P., and Maritan, A.: Density dependence explains tree species abundance and diversity in tropical forests, Nature, 438, 658–661, 2005. a
Wang, L., Good, S. P., and Caylor, K. K.: Global synthesis of vegetation control on evapotranspiration partitioning, Geophys. Res. Lett., 41, 6753–6757, https://doi.org/10.1002/2014GL061439, 2014GL061439, 2014. a
Wright, J. S., Fu, R., Worden, J. R., Chakraborty, S., Clinton, N. E., Risi, C., Sun, Y., and Yin, L.: Rainforest-initiated wet season onset over the southern Amazon, P. Natl. Acad. Sci. USA, 114, 8481–8486, https://doi.org/10.1073/pnas.1621516114, 2017. a
Xiao, W., Wei, Z., and Wen, X.: Evapotranspiration partitioning at the ecosystem scale using the stable isotope method – A review, Agr. Forest Meteorol., 263, 346–361, https://doi.org/10.1016/j.agrformet.2018.09.005, 2018. a, b
Yakir, D. and Sternberg, L. d. S. L.: The use of stable isotopes to study ecosystem gas exchange, Oecologia, 123, 297–311, https://doi.org/10.1007/s004420051016, 2000. a, b
Yamanaka, T. and Shimizu, R.: Spatial distribution of deuterium in atmospheric water vapor: Diagnosing sources and the mixing of atmospheric moisture, Geochim. Cosmochim. Ac., 71, 3162–3169, https://doi.org/10.1016/j.gca.2007.04.014, 2007. a
Yepez, E. A., Williams, D. G., Scott, R. L., and Lin, G.: Partitioning overstory and understory evapotranspiration in a semiarid savanna woodland from the isotopic composition of water vapor, Agr. Forest Meteorol., 119, 53–68, https://doi.org/10.1016/S0168-1923(03)00116-3, 2003. a, b
Yepez, E. A., Huxman, T. E., Ignace, D. D., English, N. B., Weltzin, J. F., Castellanos, A. E., and Williams, D. G.: Dynamics of transpiration and evaporation following a moisture pulse in semiarid grassland: A chamber-based isotope method for partitioning flux components, Agr. Forest Meteorol., 132, 359–376, https://doi.org/10.1016/j.agrformet.2005.09.006, 2005. a
Zhang, S., Wen, X., Wang, J., Yu, G., and Sun, X.: The use of stable isotopes to partition evapotranspiration fluxes into evaporation and transpiration, Acta Ecol. Sin., 30, 201–209, https://doi.org/10.1016/j.chnaes.2010.06.003, 2010. a
Zhang, Y., Chiew, F. H. S., Peña Arancibia, J., Sun, F., Li, H., and Leuning, R.: Global variation of transpiration and soil evaporation and the role of their major climate drivers, J. Geophys. Res.-Atmos., 122, 6868–6881, https://doi.org/10.1002/2017JD027025, 2017. a
Zhao, L., Wang, L., Cernusak, L. A., Liu, X., Xiao, H., Zhou, M., and Zhang, S.: Significant Difference in Hydrogen Isotope Composition Between Xylem and Tissue Water in Populus Euphratica, Plant Cell Env., 39, 1848–1857, https://doi.org/10.1111/pce.12753, 2016. a, b
Zotz, G.: The Role of Vascular Epiphytes in the Ecosystem. In: Plants on Plants – The Biology of Vascular Epiphytes. Fascinating Life Sciences, Springer, Cham. a
- Abstract
- Introduction
- Methodology
- Results
- Discussion
- Conclusions
- Appendix A: Characterization of the canopy layers
- Appendix B: Instrumentation
- Appendix C: Longwave radiation
- Appendix D: Superficial soil temperature
- Appendix E: Canopy aerodynamic resistance
- Appendix F: Wind speed estimation
- Appendix G: Meteorological conditions at La Selva Biological Station
- Appendix H: Interception of precipitation
- Appendix I: Keeling plots
- Appendix J: Pairwise comparison
- Data availability
- Author contributions
- Competing interests
- Special issue statement
- Acknowledgements
- Financial support
- Review statement
- References