the Creative Commons Attribution 4.0 License.
the Creative Commons Attribution 4.0 License.
 | 19 Mar 2020
Groundwater mean residence times of a subtropical barrier sand island
Harald Hofmann
Dean Newborn
Ian Cartwright
Dioni I. Cendón
Matthias Raiber
Fresh groundwater on barrier islands is affected by changing sea levels and precipitation variability due to climate change and is also vulnerable to anthropogenic processes, such as contamination and groundwater over-abstraction. Constraining groundwater mean residence times (MRTs) and flow paths is essential for understanding and managing these resources.
This study uses tritium (3H) and carbon-14 (14C) to determine the MRTs of groundwater along a transect across subtropical North Stradbroke Island, south-east Queensland, Australia. Hydraulic properties, major ion geochemistry and stable isotopes are used to validate residence times and to identify the processes responsible for their variability. 3H activities range from less than 0.01 to 1 TU (tritium units), which are values lower than those of local average rainfall (1.6–2.0 TU). 14C concentrations range from 62.5 to 111 pMC (percent modern carbon). Estimated MRTs determined using lumped parameter models and 3H activities range from 37 to more than 50 years. Recharge occurs over the entire island, and groundwater MRTs generally increase vertically and laterally towards the coastal discharge areas, although no systematic pattern is observed. MRTs estimated from 14C concentrations display similar spatial relationships but have a much greater range (from modern to approximately 5000 years). Water diversion and retention by lower-permeability units in the unsaturated parts of the dune systems are the most likely course for relatively long MRTs to date. The results indicate that the internal structures within the dune systems increase MRTs in the groundwater system and potentially divert flow paths. The structures produce perched aquifer systems that are wide-spread and have a significant influence on regional recharge. The geochemical composition of groundwater remains relatively consistent throughout the island, with the only irregularities attributed to old groundwater stored within coastal peat.
The outcomes of this study enhance the understanding of groundwater flow, recharge diversion and inhibition for large coastal sand masses in general, especially for older sand masses that have developed structures from pedogenesis and dune movement. With respect to south-east Queensland, it allows the existing regional groundwater flow model to be refined by incorporating independent MRTs to test models' validity. The location of this large fresh groundwater reservoir, in dry and populous south-east Queensland, means that its potential to be used as a water source is always high. Background information on aquifer distribution and groundwater MRTs is crucial to better validate impact assessment for water abstraction.
- Article
(8225 KB) - Full-text XML
-
Supplement
(7448 KB) - BibTeX
- EndNote


Barrier islands are common landforms in coastal environments. They boast some of the world's highest biodiversity, provide fresh groundwater resources, and have economic value for tourism and mineral industries. The majority of barrier islands consist of large sand dunes that have high permeabilities. As a consequence, rainfall infiltrates quickly and recharges the aquifer system through a large unsaturated zone (Bryan et al., 2016). Freshwater lenses develop beneath these islands until they reach hydrodynamic equilibrium with the underlying saltwater (Röper et al., 2012). The dynamics of these lenses are similar to other coastal aquifers and are affected by changes in groundwater levels due to pumping, land use change, climate variations and sea level fluctuations (Austin et al., 2013; Masterson et al., 2014; Moore et al., 2010; White and Falkland, 2009). Studies on barrier islands from the North Sea (Europe) have indicated that the groundwater systems there are not stratified (Houben et al., 2014; Seibert et al., 2018; Holt et al., 2019). In comparison to those islands, many coastal sand masses, including the barrier islands in subtropical regions of Australia, have two aquifer systems: (1) regional groundwater that is present on the entire island and (2) small, localised perched aquifer systems and lakes (usually sealed by the build-up of organic matter or indurated sands) that develop above low-permeability layers in the unsaturated zone. Water table fluctuations in the regional aquifer system of the island are mostly caused by the temporal variability of local rainfall, while flow patterns depend on heterogeneity in the aquifer (Austin et al., 2013; Masterson et al., 2014; Moore et al., 2010; White and Falkland, 2009). Variability in the water table of the perched aquifer systems on the other hand results from spatially variable local rainfall and the extent or size of the perched aquifer systems. Although these perched systems are generally small, they are currently of paramount importance to regional ecology and groundwater-dependent ecosystems. They also have the potential to inhibit recharge to the regional groundwater system and to divert the flow pattern of local groundwater.
Many studies exist on the interface of fresh groundwater and seawater in coastal environments (Post et al., 2013a; Mahlknecht et al., 2018; Yechieli et al., 2019; Parizi et al., 2019). The majority of these studies concentrate on either seawater intrusion in coastal aquifers or submarine groundwater discharge (SGD) through the seafloor into the ocean (Stieglitz et al., 2010; Santos et al., 2009; Bryan et al., 2016; Mahmoodzadeh and Karamouz, 2019; Parizi et al., 2019). These studies commonly examine the groundwater–seawater interfaces using hydrodynamic models and hydrogeochemistry rather than estimating recharge rates and water residence times of the terrestrial groundwater on barrier islands.
Although barrier island hydrological systems are reasonable climate indicators, due to substantial variability in their short- and long-term climate patterns, the current understanding of these systems is generally poor, especially with respect to groundwater (Schneider and Kruse, 2003; Barr et al., 2013, 2019). In particular, due to recharge rates and residence times of water not being sufficiently investigated, the extent of connectivity between regional groundwater and perched aquifer systems is commonly not well understood. Hydraulic connectivity and groundwater flow can be estimated from groundwater bore hydrographs to some extent, but scarce information on unsaturated zone flow and heterogeneities in the aquifer limits the reliability of the outcomes. Flow paths, recharge rates and groundwater residence times can be better constrained by using environmental tracers in combination with aquifer hydraulics. Major ions, trace elements, and stable or radioactive isotope tracers, such as δ18O, δ2H, tritium (3H and 3H∕3He) and 14C are valuable tools (Voss and Wood, 1994; Han et al., 2012; Röper et al., 2012). CFCs and SF6 have also been used extensively in coastal aquifers (Santoni et al., 2016). In particular, 3H, 14C and CFCs allow connectivity, recharge rates and, most importantly, mean residence times (MRTs) to be assessed.
Increasing water demand from local communities, increased anthropogenic nutrient loading and sea level rises, as well as the increasing periodicity of storm surges due to climate change threaten to deplete and contaminate fresh groundwater bodies. A further consequence is potential damage to groundwater-dependent ecosystems and the destruction of a vital groundwater source for coastal regions (Rao and Charette, 2012; Post et al., 2013b; Parizi et al., 2019).
The purpose of this study is to determine groundwater flow paths and MRTs in a Quaternary dune sand aquifer on the world's second largest sand island, North Stradbroke Island, Queensland, Australia (Laycock, 1975; Ulm et al., 2009). The island is an important part of the coastal environment in south-east Queensland and provides a vital groundwater resource, recreational space for large urban areas and, most importantly, unique coastal ecosystems with many freshwater wetlands, lakes and marine coastal environments (Marshall et al., 2011). The island also plays a major role in the palaeoclimate reconstructions for the east coast of Australia, as some of the longest sediment records have been extracted from the North Stradbroke Island wetlands (Barr et al., 2013, 2019; Tibby et al., 2016, 2017). Apart from a small number of government reports (Leach, 2011), there are few studies on the groundwater resources of the island, and, to the best of our knowledge, there is no prior work on MRTs on large Early Quaternary subtropical islands. This study closes this knowledge gap using major ion, stable isotope and radioactive tracer data from 21 sites along an east–west transect across the main centre of North Stradbroke Island (Fig. 1). 3H and 14C are used in combination with major ion chemistry and stables isotopes to estimate MRTs, flow paths of groundwater and potential inter-aquifer mixing on the island. A more thorough understanding of the islands groundwater flow paths and residence times significantly improves the current understanding of the hydrogeology of North Stradbroke Island and barrier islands in general. This study is relevant to most barrier islands in terms of water resource management and the prediction of fresh water resources considering changing climate, sea level changes and increasing urbanisation in coastal environments.
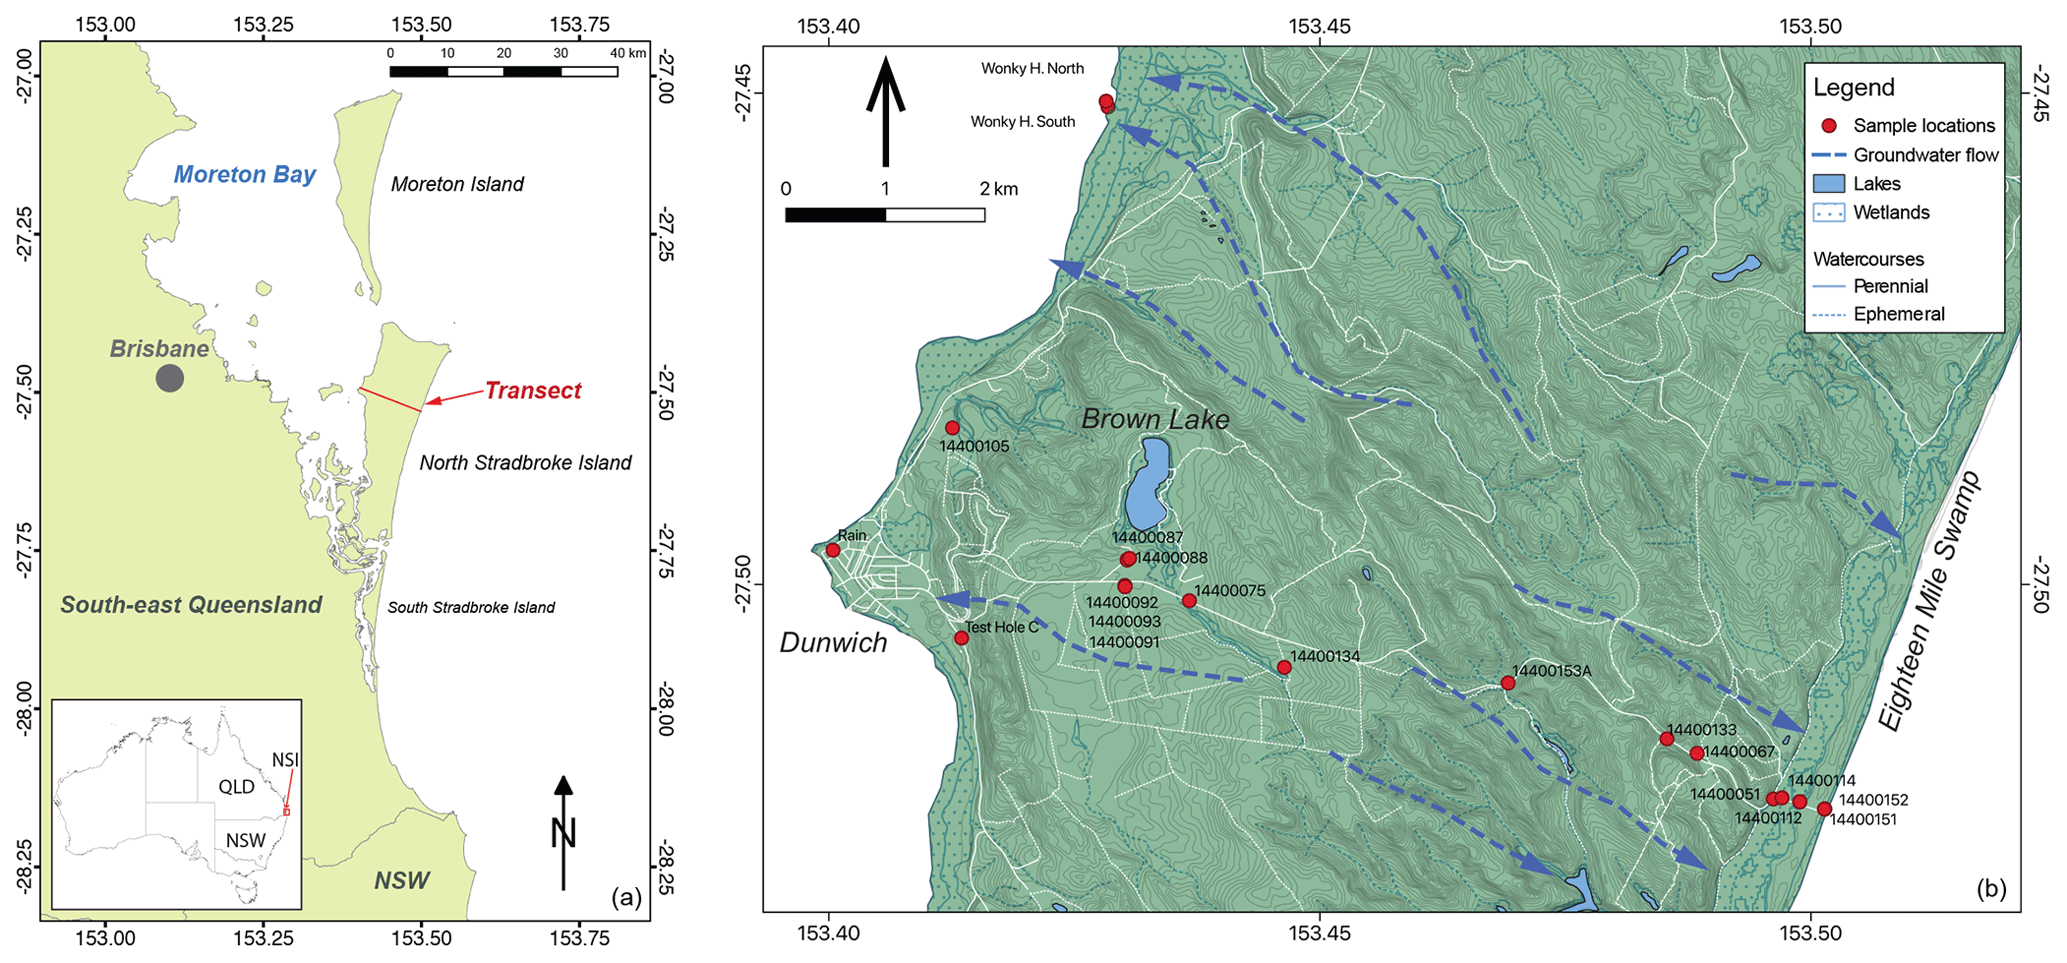
Figure 1(a) Location of North Stradbroke Island (NSI) in Moreton Bay, Queensland, Australia. (b) Bores sampled (by reference number – RN) along the transect across the island. Blue arrows indicate general flow directions. (Maps were generated using GIS files from the Queensland Government Spatial Catalogue, QSpatial, 2019.)
North Stradbroke Island is located approximately 40 km east of Brisbane in a group of sand dune islands that make up Moreton Bay (Fig. 1). The island has an area of approximately 275 km2 of which around 20 % is wetlands and beaches with important environmental and economic value. The abundance of fresh groundwater and its proximity to dry and populous south-east Queensland makes it significant as a water supply (Leach, 2011). More than 70 wetlands and 25 groundwater-dependent ecosystems (wetlands) have been identified on the island. The wetlands range in age with the oldest being over 200 000 years old, which makes North Stradbroke Island unique as a palaeoclimate archive (Tibby et al., 2017). It is estimated that 80 % of the island will be national park by 2026 (Cox et al., 2013). Most wetlands are internationally important Ramsar sites that host a large variety of migrating birds and have important cultural value for the indigenous community (Marshall et al., 2011).
The island consists predominately of large Quaternary onlapping transgressive parabolic sand dunes, which reach a maximum height of 219 m a.s.l. (above sea level), and large low-lying wetland areas around the coast (Cox et al., 2011). There are two principal land forms: the older and higher Pleistocene sand dunes and the fringing lower Holocene dunes. The dunes overlie Palaeozoic and Mesozoic bedrock units (Rocksberg Greenstone, Woogaroo Subgroup and Triassic rhyolite) (Kelley and Baker, 1984; Leach, 2011) that are almost completely covered by the dunes except for some small outcrops in the north of the island and around Dunwich (Fig. 1). The largest part of the island is composed of stabilised Pleistocene sand dunes with uniform mineralogy. The sand is well sorted and consists mostly of quartz (∼90 %–99 %) with minor heavy minerals, such as rutile, zircon, ilmenite, monazite, magnetite and garnet (Laycock, 1975); these minerals have been mined since the 1950s (Moore, 2011).
The climate is subtropical with mean daily temperatures of 15–29 ∘C in summer and 9–20 ∘C in winter (Australian Bureau of Meteorology, 2017). Average annual rainfall ranges across the island from 1645 to 1677 mm, with annual evapotranspiration ranging from 1095 to ∼1500 mm (Cox et al., 2011). There are slight differences in precipitation and evapotranspiration between winter and summer. In general, south-east Queensland has dry winters and most of the rainfall occurs during the summer months. The mainland variability is dampened on the coast with rainfall occurring throughout the year. Evapotranspiration is lowest in winter (June–July) and highest in summer (December–January). The vegetation cover is mostly continuous across the island apart from wetlands, lakes, tracks, mining operations and the settlements. It consists of native subtropical mixed-eucalypt communities. The forests and woodlands have an abundance of eucalypts and large Proteaceae as well as a generally sclerophyllous understory (Audet et al., 2013) (Figs. A1 and A2). The associated Podzols are acidic and relatively infertile due to the migration of clay and organic matter into the B horizons and the general lack of nutrients. Recharge estimates for the island are derived from water balance models that include climatic factors and groundwater level fluctuations. Long-term (1889–2011) average estimates are approximately 127×106 m3 yr−1. A total estimated water volume of the groundwater mound above sea level is approximately 930×106 m3 in the regional aquifer. Of the water that leaves the island approximately 16 % is through groundwater extraction by local communities and sand mining operations, 55 % is discharged to wetlands, 2 % is discharged to Blue Lake and 27 % is via submarine discharge at the coastline (Leach, 2011).
The island's groundwater system is predominately hosted in the highly permeable, well-sorted quartz Pleistocene and Holocene sand aquifer, constrained by the relatively impermeable underlying bedrock. Peat layers and indurated sands, cemented by iron oxides and hydroxides, are widely distributed along the wetlands and swamps. They are considered to control the regional groundwater flow from the elevated sand dunes in the predominantly unsaturated zone (Leach, 2011). The lower-permeability units of indurated sand, peat or sandrock/humicrete (locally known as coffee rock) as well as clay accumulations from the weathering of the small amounts of feldspar minerals form widely spread perched aquifer systems. The low-permeability layers of the perched systems are believed to originate from chemical leaching of older dune systems in the highlands as well as inclusions of marine muds and peats in the lowlands (Laycock, 1975; Thompson and Ward, 1975; Brooke et al., 2008). Some of the perched aquifers and wetland systems are disconnected from the regional aquifer and their locations; however, their extents and genesis are generally poorly understood, with only a few studies describing the governing processes (Leach, 2011; Barr et al., 2017; Cadd et al., 2018).
The regional groundwater system (which contains almost all of the island's freshwater) forms an elongated north–south mound with the height of the water table varying from a maximum of 42 m AHD (Australian Height Datum) near Mt Hargrave in the centre of the island to sea level in the coastal lowlands (Cox et al., 2011). Generally, groundwater flows east and west from the high central recharge area to the coasts, with a larger proportion flowing east due to the relatively elevated bedrock in the west (Fig. 1). Local groundwater discharge points (termed “wonky holes”) occur in the tidal areas on the island. They are round, approximately 2–10 m (in diameter) disruption features in the tidal muds where groundwater from the regional groundwater system discharges. It is believed that groundwater is semi-confined in palaeo-channels in the sand dune system that are covered by fine muds in around Moreton Bay (Stieglitz et al., 2010).
3.1 Field sampling and analytical techniques
Groundwater samples were collected from 18 Queensland State Government groundwater monitoring bores along an east–west transect across the central part of the island (Fig. 1). A number of the sample locations had nested monitoring bores, sampling both relatively shallow perched aquifer systems and the deeper regional groundwater. The screen depths of the sampled bores vary across the island from 4.6 m b.g.l. (below ground level) in the lowlands to 131 m b.g.l. in the high central dunes (Table A1). Screen lengths of the monitoring bores are 1.5 m at the bottom of the bore. A single surface water sample was collected from Eighteen Mile Swamp, and two groundwater samples were collected from two wonky holes in the tidal zone approximately 6 km north of Dunwich (Fig. 1). The wonky holes were approximately 120 m apart and 6 m in diameter.
The groundwater bores were sampled in November 2014, whereas the wonky holes were sampled in March 2015. The depth to the water table was determined using an electric water level tape, and hydraulic heads were calculated from the surveyed ground elevation of each bore taken from the Queensland Groundwater Database (Queensland – Government – Data, 2018). Groundwater was sampled using a Grundfos MT1 pump where the depth to the screen exceeded 20 m, while a smaller 12 V electrical impeller pump (Thermo Fisher Inc. Super Twister) was used for the shallower bores. The samples were collected after purging the bores for approximately five bore volumes. Bore RN14400075 was pumped dry and sampled using a bailer a day later. In nearly all cases, the high hydraulic conductivities of the sands resulted in no or only minor drawdown during purging. At each bore, six 1000 mL samples were collected in high-density polyethylene (HDPE) bottles, four of which were bottom filled and sealed for 3H and 14C analysis. In situ measurements of temperature, pH, ORP (oxidation–reduction potential), DO (dissolved oxygen) and electrical conductivity (EC) were taken using a GPS Aquaread with an AP-800 probe (Thermo Fisher Inc.). Samples from the wonky holes were taken in the middle of the holes by pushing an aluminium tube approximately 1 m into the sand to avoid sampling a mix of fresh water and ocean water. Water was then pumped from the tube using a Geopump peristaltic pump (Geotech Environmental Equipment, Inc.). At the end of each sampling day, water samples were titrated for CO2 and HCO3 concentrations using a Hach titration kit; the precision of these concentrations is 5 %. A total of 125 mL of filtered (0.45 µm, cellulose nitrate filters) sample was taken for stable isotope and major ion anion analysis. Next, a total of 125 mL of sample was separated, filtered and acidified with 70 % HNO3 for cation analysis. All samples were kept cool until analysis.
Cation concentrations were analysed using a Thermo Finnigan quadrupole inductively coupled plasma mass spectrometer (ICP-MS) at Monash University. Anion concentrations were determined using a Metrohm ion chromatograph (also at Monash University). The precision of major ion concentrations based on replicate analysis is 2 %–5 %. Stable isotopes were measured using Finnigan MAT 252 and DeltaPlus Advantage mass spectrometers at Monash University, as described by Hofmann and Cartwright (2013). Precision based on replicate analysis is 0.15 ‰ for δ18O and 1 ‰ for δ2H. Rainfall stable isotope ratios were taken from the Global Network of Isotopes in Precipitation (IAEA – Global Network of Isotopes in Pricipitation, 2017). Average rainfall-weighted isotope ratios for δ18O and δ2H were calculated using δ18O and δ2H ratios and the daily rainfall from the 1960s to 2002. δ13C values of dissolved inorganic carbon (DIC) were analysed with a Thermo Delta V continuous flow isotope ratio mass spectrometer, (CF-IRMS) coupled to a Gas Bench II at The University of Queensland. δ13C-DIC values were normalised to the V-PDB scale using international standards NBS19 and LSVEC via two-point normalisation; the precision of this measurement is 0.3 ‰.
The Australian Nuclear Science and Technology Organisation (ANSTO) conducted the analysis of the 14C and 3H samples at Lucas Heights, Sydney. 3H was analysed via vacuum distillation, enriched by electrolysis, distilled further to separate tritium and counted using three Quantulus ultra-low background liquid scintillation counters (LSC). This analysis had a combined standard uncertainty of 0.04 TU and a quantification limit of 0.05 TU; further analytical details are described in Neklapilova (2008). Following acid extraction and graphitisation of inorganic carbon, 14C concentrations were analysed using accelerator mass spectrometry (2MV STAR tandem accelerator). The concentrations for 14C are expressed as percent modern carbon (pMC), and the precision of 14C∕12C ratios is ±0.05 %.
3.2 Estimating MRT
Tritium is a suitable tracer for determining residence times of young groundwater. It is part of the water molecule and once isolated from the atmosphere its activities are only affected by radioactive decay. 3H has a half-life of 12.32 years and may be used to estimate residence times of water that are up to 100 years with a precision of a few years (Morgenstern and Taylor, 2009; Morgenstern et al., 2010). The activities of 3H in rainfall are known with sufficient precision over time in many areas of the world to derive a local 3H input function (Tadros et al., 2014). Brisbane is the closest 3H monitoring station to Stradbroke Island (approximately 35 km from the island) and has a continuous record of 3H data from the 1960s to 2012 (Tadros et al., 2014; IAEA – Global Network of Isotopes in Pricipitation, 2017).
The 3H activities peak between the 1950s and the 1960s due to the production of 3H by atmospheric nuclear tests (the “bomb pulse” 3H). Traditionally, the propagation of the bomb pulse has been utilised to trace the flow of water recharged during this period (Fritz et al., 1991; Clark and Fritz, 1997). Because the bomb pulse 3H peak was several orders of magnitude lower in the Southern Hemisphere than in the Northern Hemisphere, 3H concentrations of remnant bomb pulse water in the Southern Hemisphere have now decayed well below that of modern rainfall. This situation allows estimates of MRTs to be obtained from single 3H activities (Morgenstern et al., 2010; Morgenstern and Daughney, 2012).
14C concentrations may be used to estimate groundwater residence times in the range from 1000 to ∼30 000 years (Clark and Fritz, 1997). While it is not particularly well suited for estimating the residence times of young groundwater, it may be used to detect the input of groundwater from old water stores, such as low-permeability layers, within the aquifer system (Hofmann and Cartwright, 2013). The combined use of 3H and 14C may also be used to assess mixing of older groundwater with recent recharge (Cartwright et al., 2007). Groundwater MRTs were estimated using lumped parameter models (LPMs; Maloszewski and Zuber, 1982; Maloszewski, 2000). These models predict the distribution of ages and tracer concentrations in homogenous aquifers with simplified geometries under steady-state conditions. The mean residence time represents the average age of the individual water molecules in the sample. The concentration of a radioactive tracer in the sample, Cout(t), is related to the input over time, Cinp(t), via the convolution integral:
where λ is the decay constant of a radioactive tracer (Farlin and Maloszewski, 2013), and g(τ) is the transfer function that describes the distribution of ages within the flow system. The piston flow model (PFM), the dispersion model (DM), the partial exponential flow model (PEM), the exponential mixing model (EMM) and the exponential flow model (EPM) are commonly used LPMs. The piston flow model assumes that no hydrodynamic dispersion occurs between the recharge and discharge area, and the MRT calculation is similar to decay except that the initial rainfall activity can be varied over time (Howcroft et al., 2017). The dispersion model is derived from the one-dimensional advection–dispersion–transport equation and simulates the distribution of a wide variety of aquifer geometries (Jurgens et al., 2012). It allows for variable degrees of dispersion by adjusting the dispersion parameter (Dp), which describes the ratio of dispersion to advection. It approaches zero when advection becomes the dominant process controlling the tracer transport. The EMM is most suitable for homogeneous, unconfined aquifers of constant thickness with uniform recharge. The EPM applies to aquifers that have regions of confined and unconfined flow (Maloszewski and Zuber, 1982; Zuber et al., 2005; Jurgens et al., 2012; Atkinson et al., 2014; Cartwright et al., 2017). The PEM is applicable for the same type of aquifer as the EMM but is used when only the lower part of the aquifer is sampled by a well (Jurgens et al., 2012). The PEM ratio is defined as the ratio of the unsampled thickness of the aquifer to the sampled thickness. For bores screened across the total saturated thickness of the aquifer, the PEM ratio equals zero and the PEM is the same as the EMM.
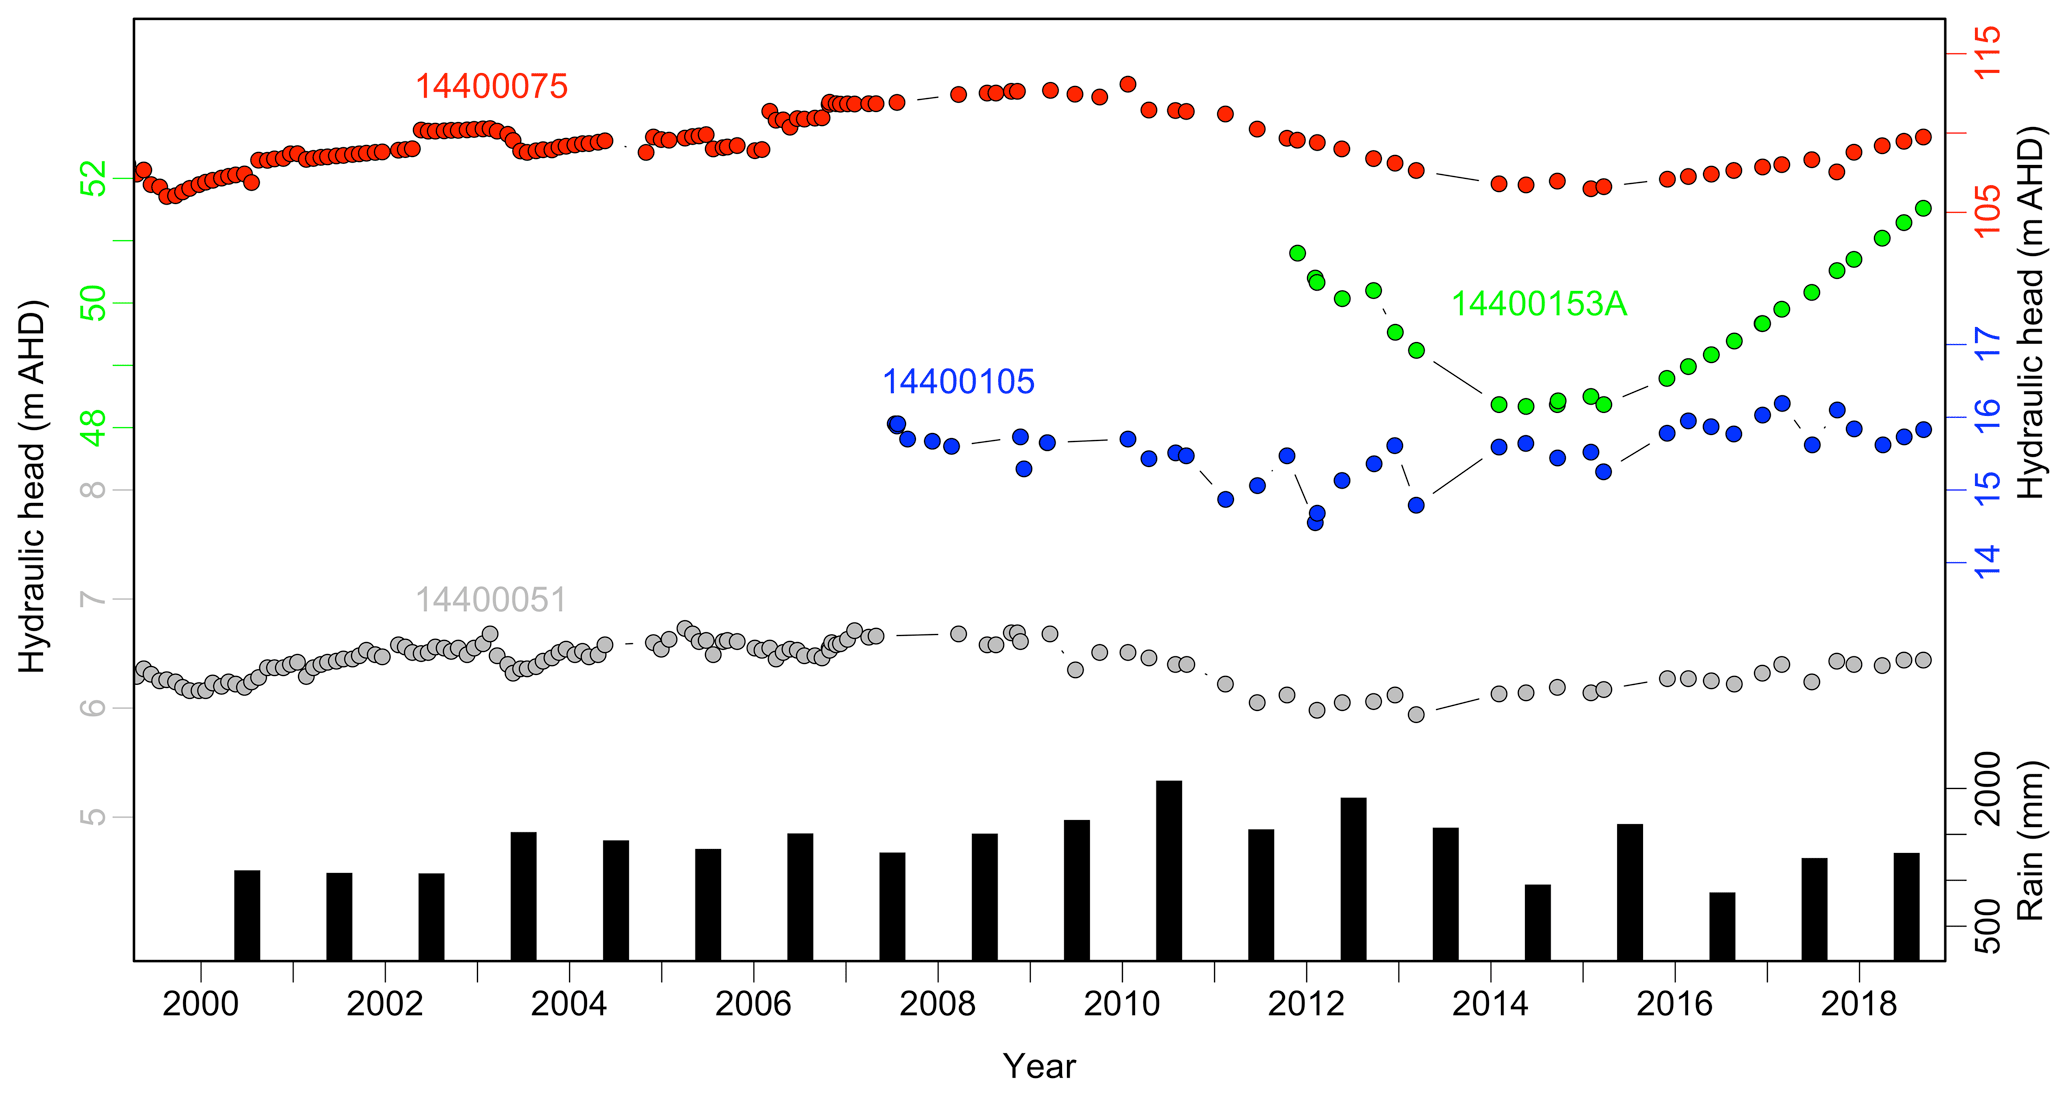
Figure 2Hydraulic heads (metres Australian Height Datum, m AHD) for four selected groundwater bores, 14400051, 14400075, 14400105 and 14400153A, and yearly rainfall for the period from 2000 to 2018.
For this study lumped parameter models contained within the programmable TracerLPM Excel spreadsheet (Jurgens et al., 2012) were used. 3H activities in rainfall between 1962 and 2012 from the International Atomic Energy Agency (IAEA – Global Network of Isotopes in Pricipitation, 2017) and Tadros et al. (2014) with data interpolated for missing years were used as the input function. The highest 3H activity in 1969 was 84 TU, and the 3H activity of post 2005 rainfall is 1.6–2.0 TU. It is assumed that pre-bomb pulse rainfall had similar 3H activities. The rainfall input function for 14C for the Southern Hemisphere provided by the TracerLPM spreadsheet was used as the local 14C activities of rainfall in this study. The function uses the Southern Hemisphere calibration curve SHcal04 and modern tropospheric 14C data (Jurgens et al., 2012). MRTs were estimated by matching the measured radioactive concentrations to those predicted from the lumped parameter models. Groundwater mean residence times in the aquifer systems are expected to be orders of magnitude larger than sub-yearly variability in tracer input. Therefore, tracer concentrations from accumulated yearly rainfall are the best representation of the tracer input concentration into the system (Hofmann et al., 2018). As the sand aquifer is unconfined across most of the island and bore screens sample only a part of the aquifer, the partial exponential model (PEM) with PEM ratios calculated individually for all bores is the best representation for the system. The PEM was compared with the DM and EPM to demonstrate the impact model selection on MRT estimations.
4.1 Groundwater hydraulic heads and flow
Groundwater bore 14400088 is probably screened in a perched aquifer system that surrounds Brown Lake (Fig. 1), whereas all other bores are screened within the regional groundwater system. The distinction between the perched and regional aquifer system is made on the basis of nested bores 14400088 and 14400087 in this study. On the day of sampling, the hydraulic head in bore 14400088 was 58 m whereas that in bore 14400087 was 35 m. This 20 m hydraulic head difference indicates the presence of a perching layer. Bores 14400151 and 14400152 are located in the coastal beach/shore dunes between the Eighteen Mile Swamp wetland and the ocean on the eastern side of the island.
Hydraulic heads in the regional aquifer are highest (∼35 m AHD) in the centre of the island, and the unsaturated zone is approximately 30 to 60 m thick. The hydraulic head values decline towards the coasts and reach sea level in Eighteen Mile Swamp in the east and close to sea level on the western side near Dunwich. Decadal fluctuations of regional groundwater heads are less than 0.5 m to approximately 5 m. These are not correlated with yearly rainfall and, therefore, represent longer timescale climate fluctuations (Fig. 2).
4.2 Major ion chemistry and stable isotopes
Electrical conductivity (EC) of the groundwater is generally low across the island, ranging from 57 to 257 µS cm−1 with an average of 123 µS cm−1; TDS (total dissolved solids) values range from 44 to 174 mg L−1 with an average of 91 mg L−1 (Table A1). These values are similar to the average TDS value (78.1 mg L−1) across the remaining parts of the island (Queensland – Government – Data, 2018). Higher salinities generally occur closer to the coast, whereas the freshest groundwater is found in the central parts of the island. The high hydraulic gradient from the centre of the island towards the coastal areas inhibits an extensive saltwater wedge developing underneath the island, and only shallow areas in beach dunes and intertidal areas have marine groundwater. Most of the groundwater is acidic due to the limited buffering capacity of the relatively clean quartz sands with pH values ranging from 3.6 to 7.5 with an average of 4.9. Most of the groundwater is oxygenated with dissolved oxygen concentrations ranging from 0.2 to 2.6 mg L−1.
In general, the geochemistry of the groundwater shows only minor variations. Most of the samples (74 %) are Na–Cl type groundwater, 21 % are Ca–Na–HCO3 groundwater and 5 % are Ca–HCO3 groundwater (Fig. A3). Na concentrations range from 9.5 to 29.8 mg L−1, Ca concentrations from 0.1 to 14.1 mg L−1, Mg concentrations range from 0.9 to 5.8 mg L−1 and K concentrations are generally below 1.2 mg L−1. Cl concentrations range from 15.8 to 46.3 mg L−1, HCO3 concentrations range from 0.4 to 47.7 mg L−1, SO4 concentrations range from 0.2 to 21.8 mg L−1 and NO3 concentrations are <0.5 mg L−1 in most groundwater (Table A1). Groundwater samples from the two wonky holes have a similar major ion composition to the inland groundwater. EC values are 98 and 121 µS cm−1, and pH values range from 6.8 to 7.0 (Table A1). Molar Na∕Cl ratios are close to those of seawater (0.86) with a maximum value of 1.2. Mean molar Cl∕Br ratios are close to the average Cl∕Br ratio of ocean water and coastal precipitation of ∼650 (Davis et al., 1998) (Fig. 3a). Ca∕HCO3 ratios range from 0.01 to 0.96 with higher ratios generally occurring towards the coasts.
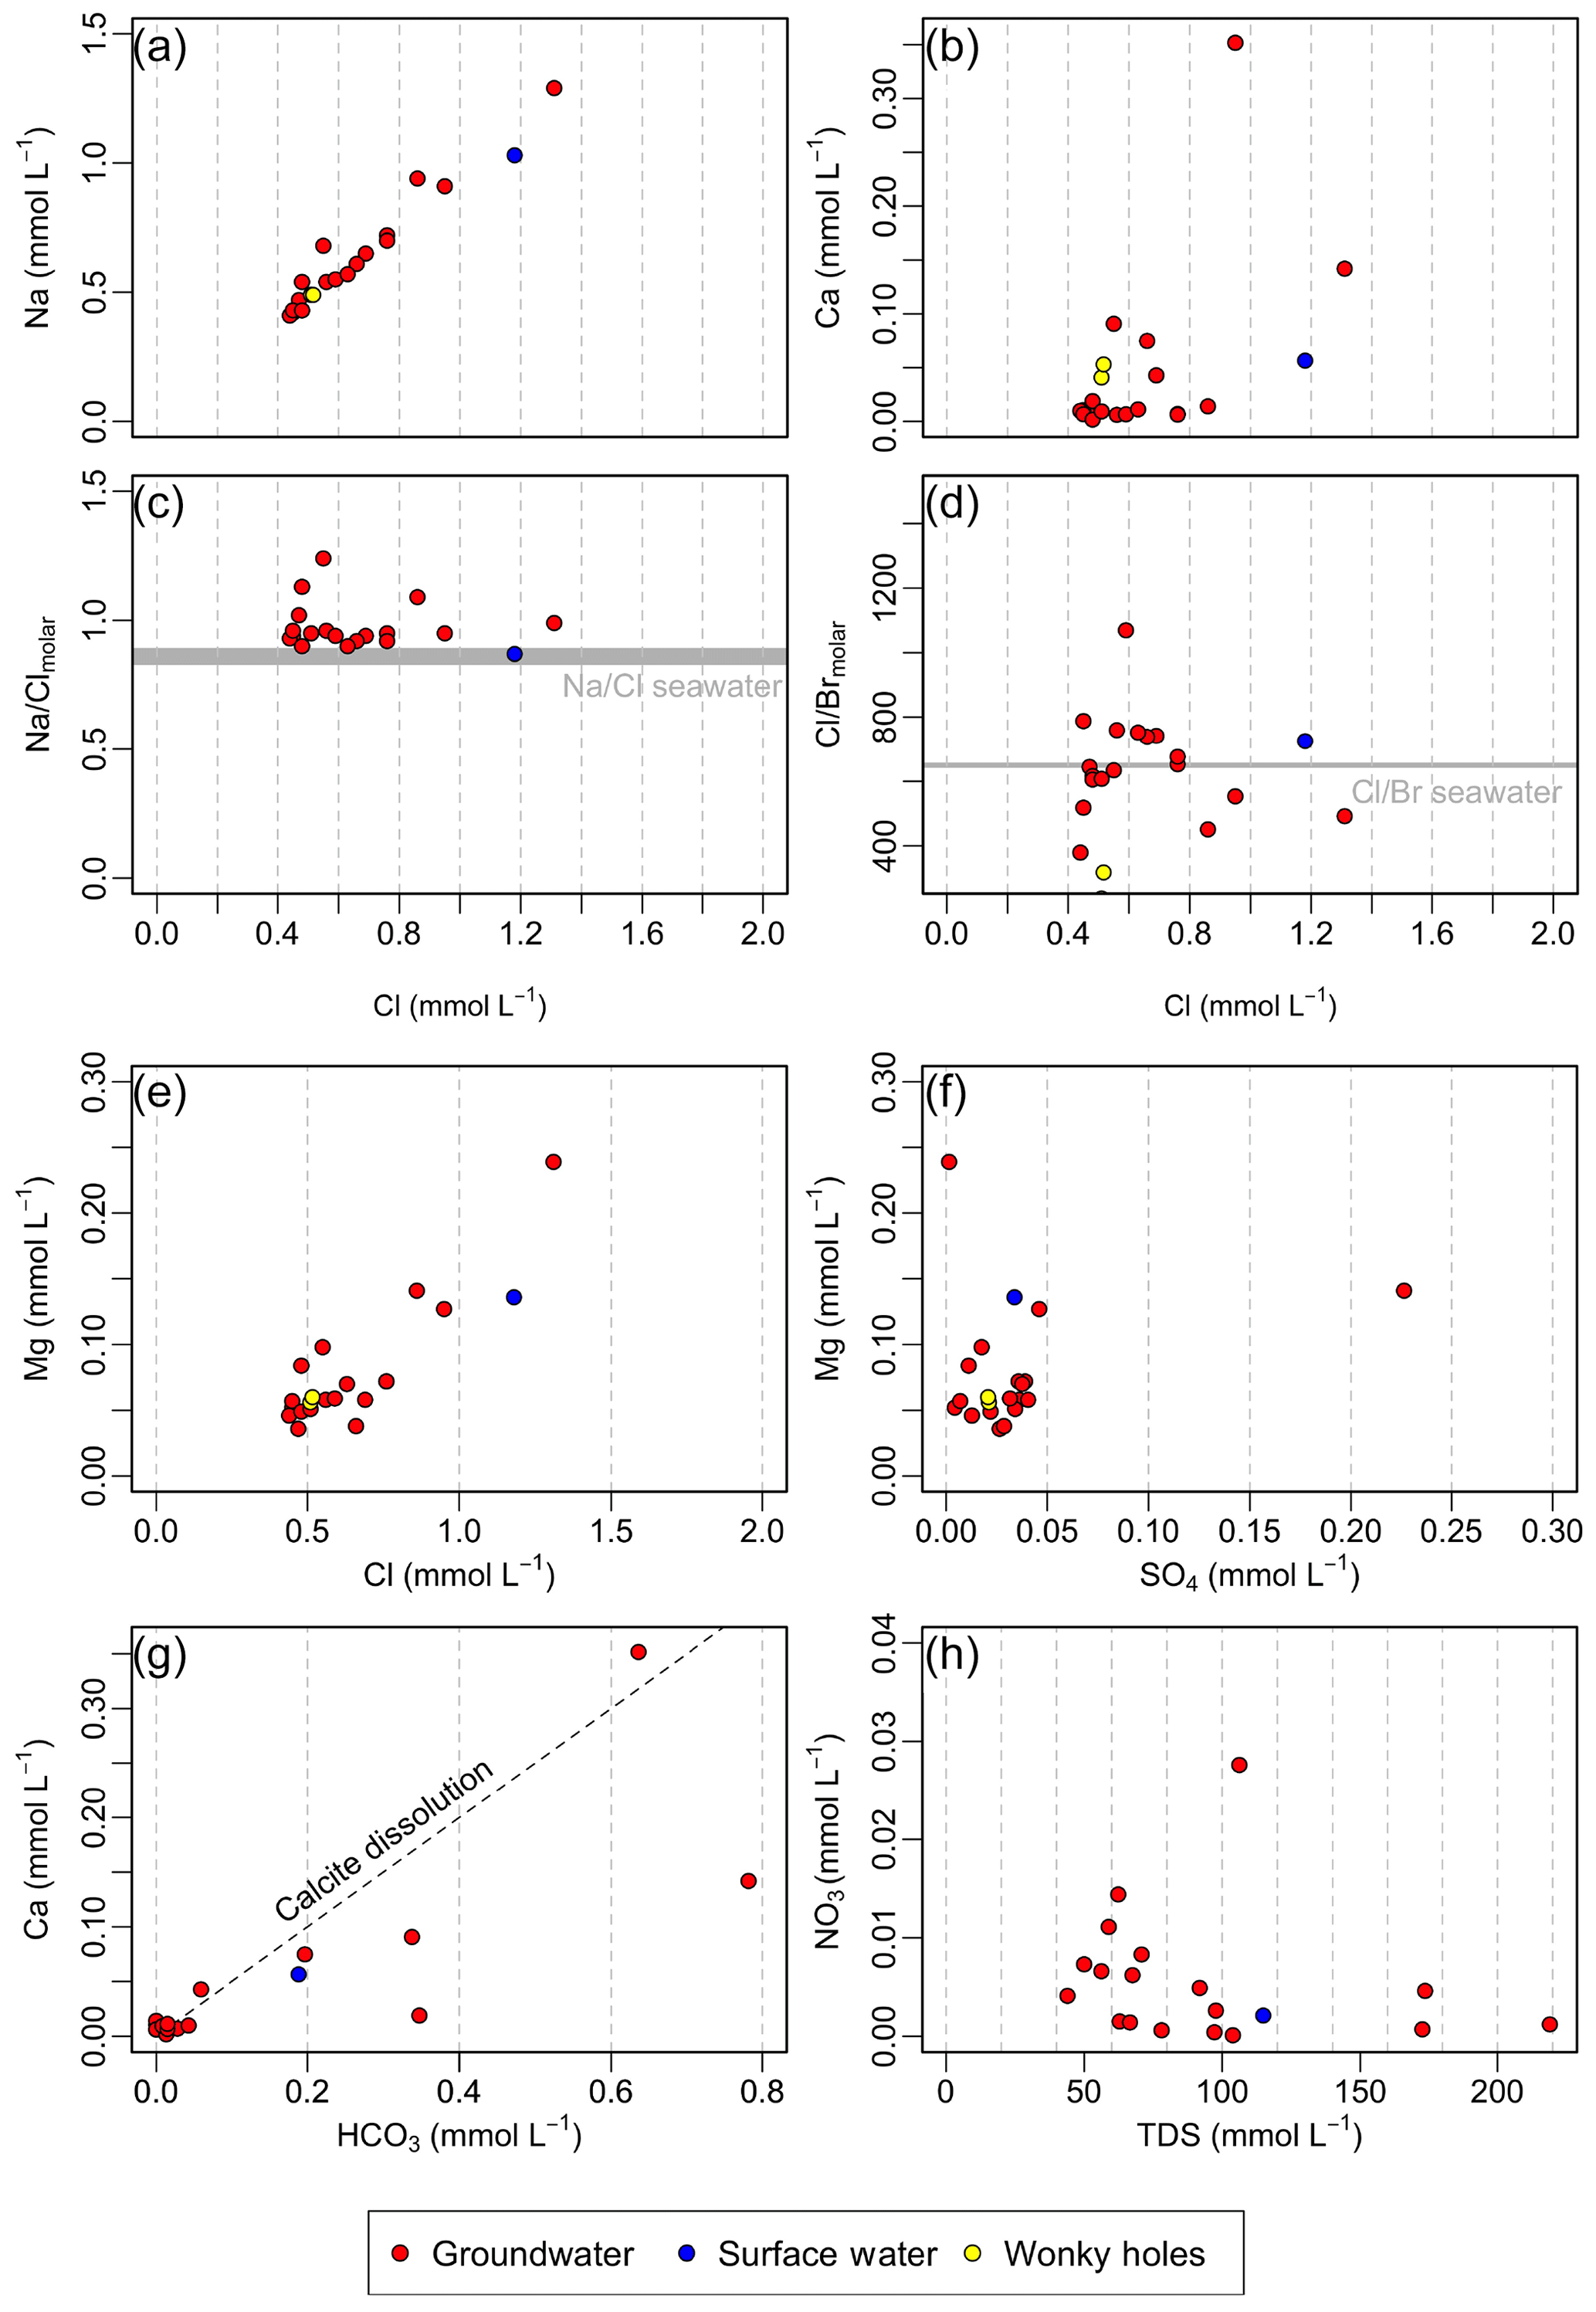
Figure 3Geochemistry of surface water and groundwater from the bores and wonky holes. (a) Na vs. Cl, (b) Ca vs. Cl, (c) Na/Cl vs. Cl, (d) Cl/Br vs. Cl, (e) Mg vs. Cl, (f) Mg vs. SO4, (g) Ca vs. HCO3 and (h) NO3 vs. TDS.
The δ18O and δ2H values of inland groundwater have a small range from −5.4 ‰ to −2.4 ‰ and −32.3 ‰ to −24.4 ‰, respectively (Table A1). The one rainfall sample has δ18O and δ2H values of −3.2 ‰ and −25 ‰, which are slightly higher than those of average rainfall for Brisbane (δ18O of −3.98 ‰ and δ2H of −18.4 ‰ (Hollins et al., 2018). The δ18O and δ2H values of both wonky hole samples are −4.6 ‰ and −23 ‰, which are within the range of the inland groundwater. All waters plot close to the Brisbane meteoric water line (Crosbie et al., 2012; IAEA – Global Network of Isotopes in Pricipitation, 2017; Hollins et al., 2018; Fig. 4 in this paper).
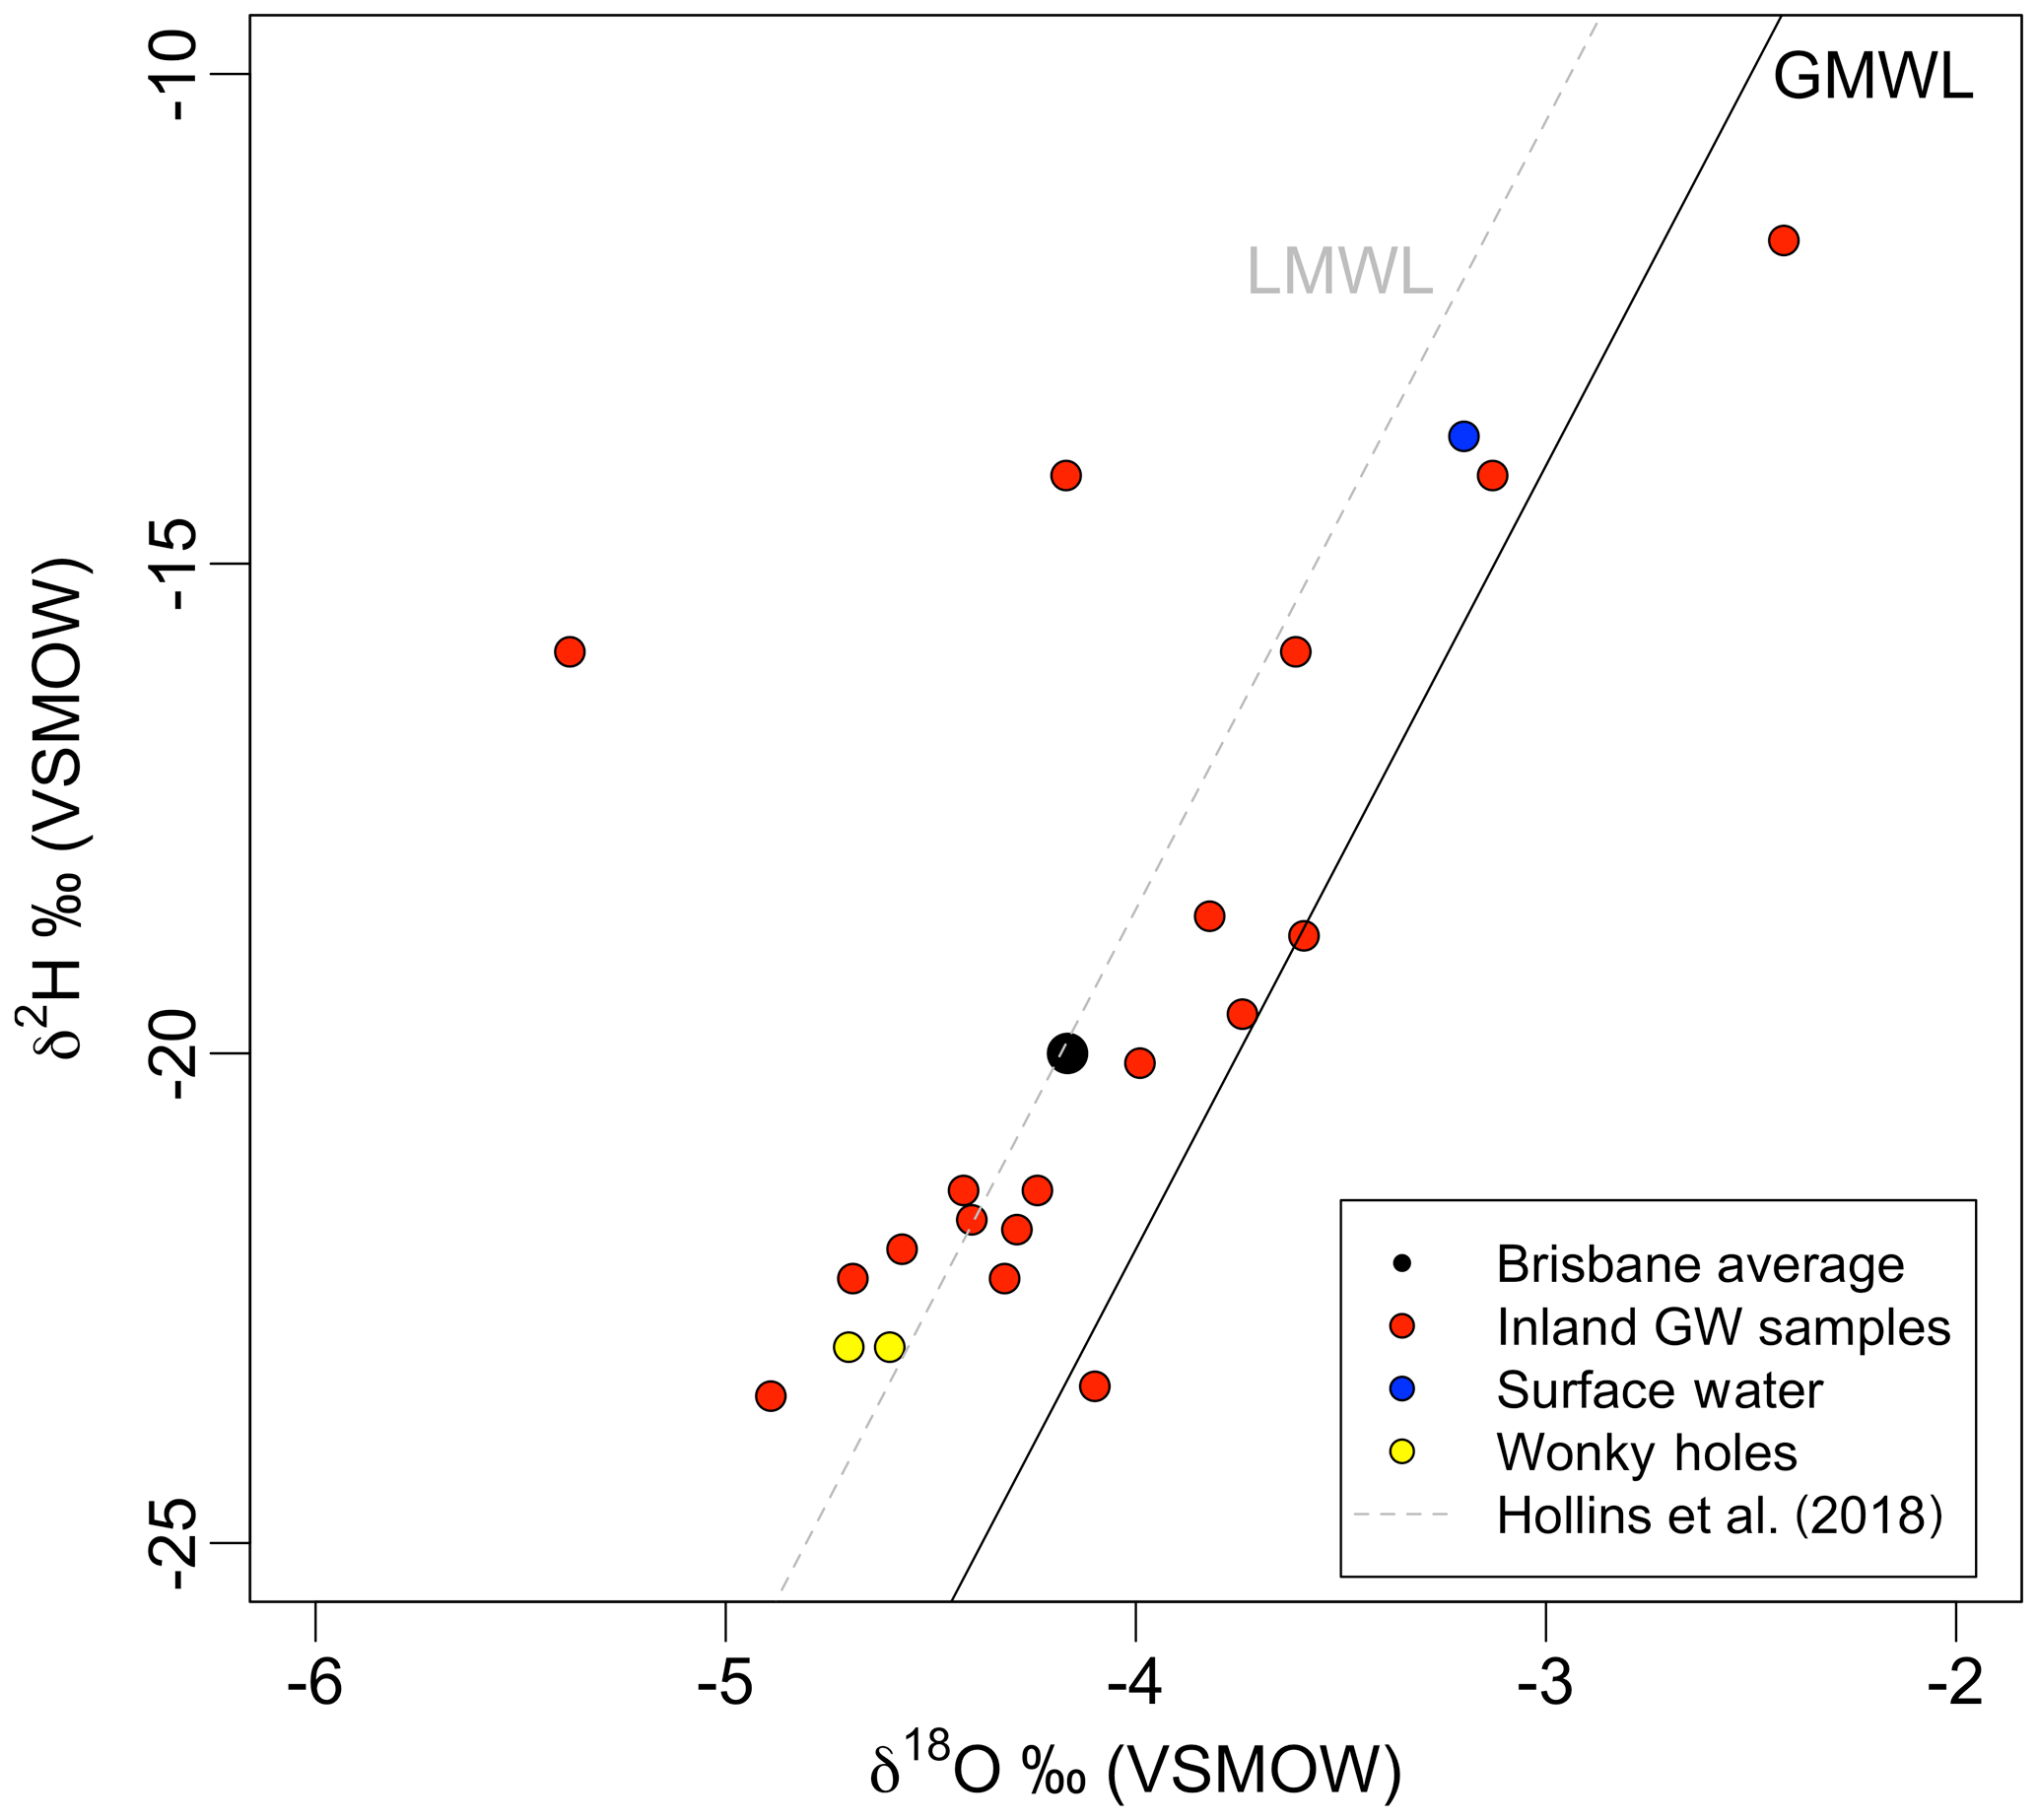
Figure 4δ18O and δ2H values of groundwater, surface water and water from the wonky holes on North Stradbroke Island. The black point represents the rainfall-weighted average composition of δ18O and δ2H for rainfall from the Global Network of Isotopes in Precipitation for Brisbane from 1962 to 2014 (Hollins et al., 2018). LMWL denotes the local meteoric water line for Brisbane, and GMWL refers to the global meteoric water line
4.3 3H, 14C and 13C
3H activities of groundwater range from below detection (<0.05 TU) to 1.0 TU (Table A1). They are much lower than the mean annual 3H activities in modern precipitation in Brisbane of approximately 1.6–2.0 TU (Tadros et al., 2014). 3H activities generally decrease with depth (Fig. 5a) and increase with distance from the centre of the island towards the coastlines (Fig. 5b). The decrease is more pronounced towards the east coast then towards the west coast. Groundwater from bore 14400134, which is the deepest bore at 131 m b.g.l. in the central part of the island, and the “Test Hole C” bore, which is located close to the west coast at a depth of 43 m b.g.l. (Fig. 1), have 3H activities that are below detection. The water discharging from the two wonky holes also has low 3H activities of 0.12 and 0.15 TU. The highest 3H activity of 1 TU is from groundwater in bore 14400088, which is the shallow bore (4.6 m) in the perched aquifer system close to Brown Lake that was discussed above.
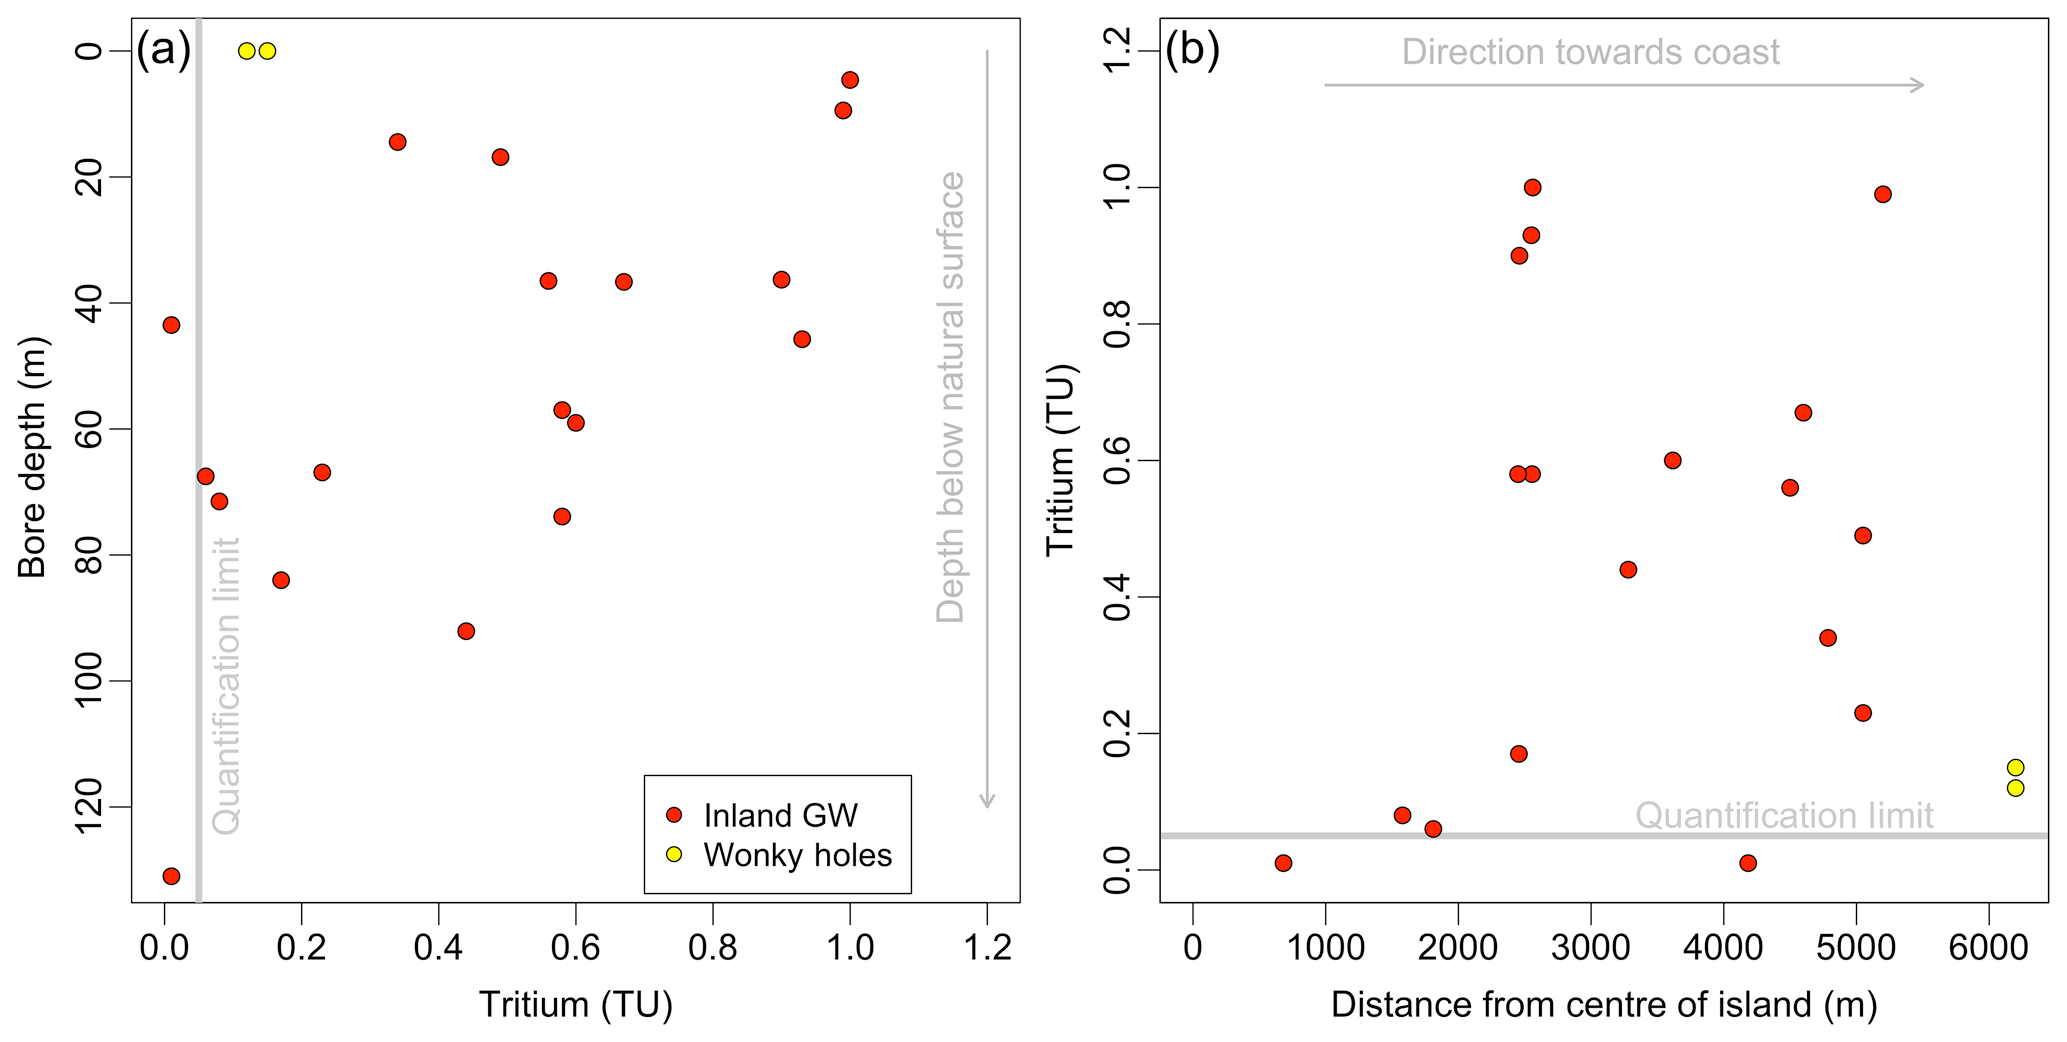
Figure 5(a) Variation in 3H activities with bore depth, (b) 3H (tritium) activities vs. distance from the centre of the island, which is approximately the groundwater flow divide between westward and eastward flow.
Most 14C concentrations range from 59 to 111 pMC with the majority of samples having 14C concentrations above 90 pMC. The lowest 14C concentrations are in groundwater from bore 14400134 (77 pMC) and Test Hole C (63 pMC) (Fig. 6a, b), which also have the lowest 3H activities. Groundwater from the wonky holes has 14C concentrations of 81 and 59 pMC. Generally, the high 3H activities and high 14C concentrations of most of the groundwater imply that it was recently recharged.
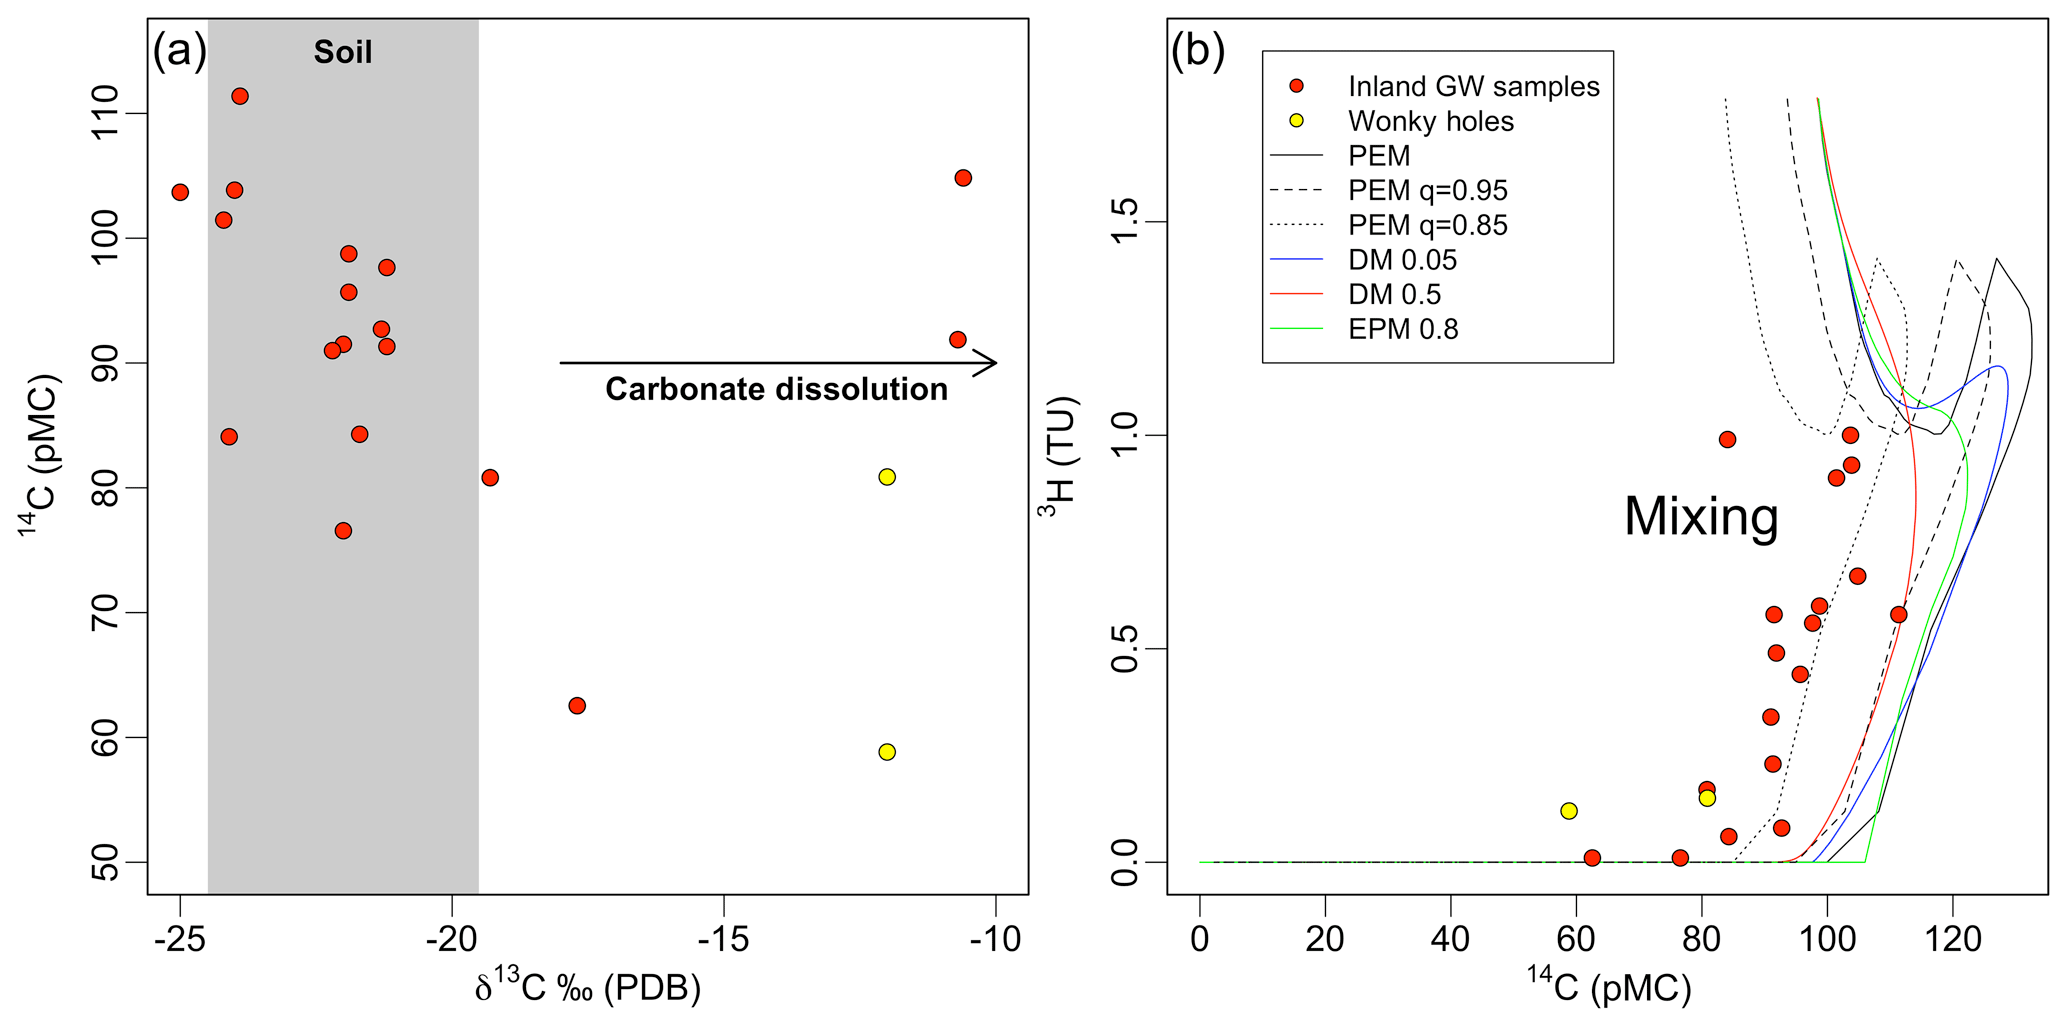
Figure 6(a) 14C concentration vs. δ13C values of groundwater and water from the wonky holes. The shaded grey area represents the predicted range of δ13C values of DIC in the soils. (b) 14C concentrations vs. 3H activities of groundwater and the water from the wonky holes. The curves show the predicted covariance from the lumped parameter models: PEM represents the partial exponential model with dilution factors of q=0.95 and q=0.85, DM represents the dispersion model (with dispersion parameters of 0.05 and 0.5), EPM represents the exponential piston flow model (with an EPM factor of 0.8).
δ13C values of DIC (Fig. 6) range from −25 ‰ to −10.7 ‰. Most of the waters have δ13C values in the range between −24 ‰ and −18 ‰, which are within the expected range of δ13C values of DIC derived from the dissolution of soil CO2 in an environment dominated by C3 vegetation (Clark and Fritz, 1997). The highest δ13C values are from groundwater from bores 14400112 (−10.6 ‰) and 14400152 (−10.7 ‰) on the eastern side of the island at Eighteen Mile Swamp and the beach dunes. Groundwater from the shallow bore in the perched aquifer system, bore 14400088, has the lowest δ13C value of −25 ‰. Water from both wonky holes has a δ13C value of −12 ‰ (Fig. 6a).
The combined hydraulic head and geochemistry data allow the conceptualisation of groundwater flow across North Stradbroke Island. Groundwater flows from the centre of the island towards the east and the west coasts driven by the large hydraulic gradient. There is groundwater discharge into freshwater wetlands (e.g. Eighteen Mile Swamp), some submarine groundwater discharge via the wonky holes into Moreton Bay and probably offshore on the eastern side of the island (Fig. 1). The sand dunes are thickest in the central dune field, and the thickness gradually declines towards both coastlines. The thinning of the aquifer and the unsaturated zone allows the mixing of groundwater from the centre of the island with more recent recharge closer to the coast towards the discharge zones.
Most of the groundwater has low TDS and low pH. This, on combination with the low Na∕Cl ratios (<1.2), suggests that only minor silicate weathering is occurring, which is limited by the availability of weatherable silicates. The linear relationship between Ca and HCO3 (Fig. 3g) suggests that some carbonate weathering has occurred. However, the observation that δ13C values are generally similar to those expected for DIC derived from the soil zone implies that this is limited. SO4 and Cl concentrations increase near the coastline, suggesting some marine influence (sea spray) in the coastal lowlands of the island. However, the salinity remains low, supporting the argument that the saltwater wedge underneath the island is relatively deep and close to the bedrock.
5.1 Mean groundwater residence times
The choice of the best fit lumped parameter model requires conceptualisation of the flow system. The exponential piston flow model is commonly used to calculate MRTs in flow systems that have near-vertical recharge through the unsaturated zone overlying a flow system with an approximately exponential distribution of flow paths (Jurgens et al., 2012; Morgenstern and Daughney, 2012). However, the exponential piston flow model assumes that the entire aquifer thickness is sampled, which is not the case. Here we use the partial exponential model and calculate the PEM ratio for each bore using the screen width and depth below the water table. This model assumes that the flow system is exponential and, therefore, ignores the likelihood of piston flow in the unsaturated zone. However, as the thickest unsaturated zone is approximately 60 m and the total flow path length is ∼5000 m, the proportion of the piston flow component is very small.
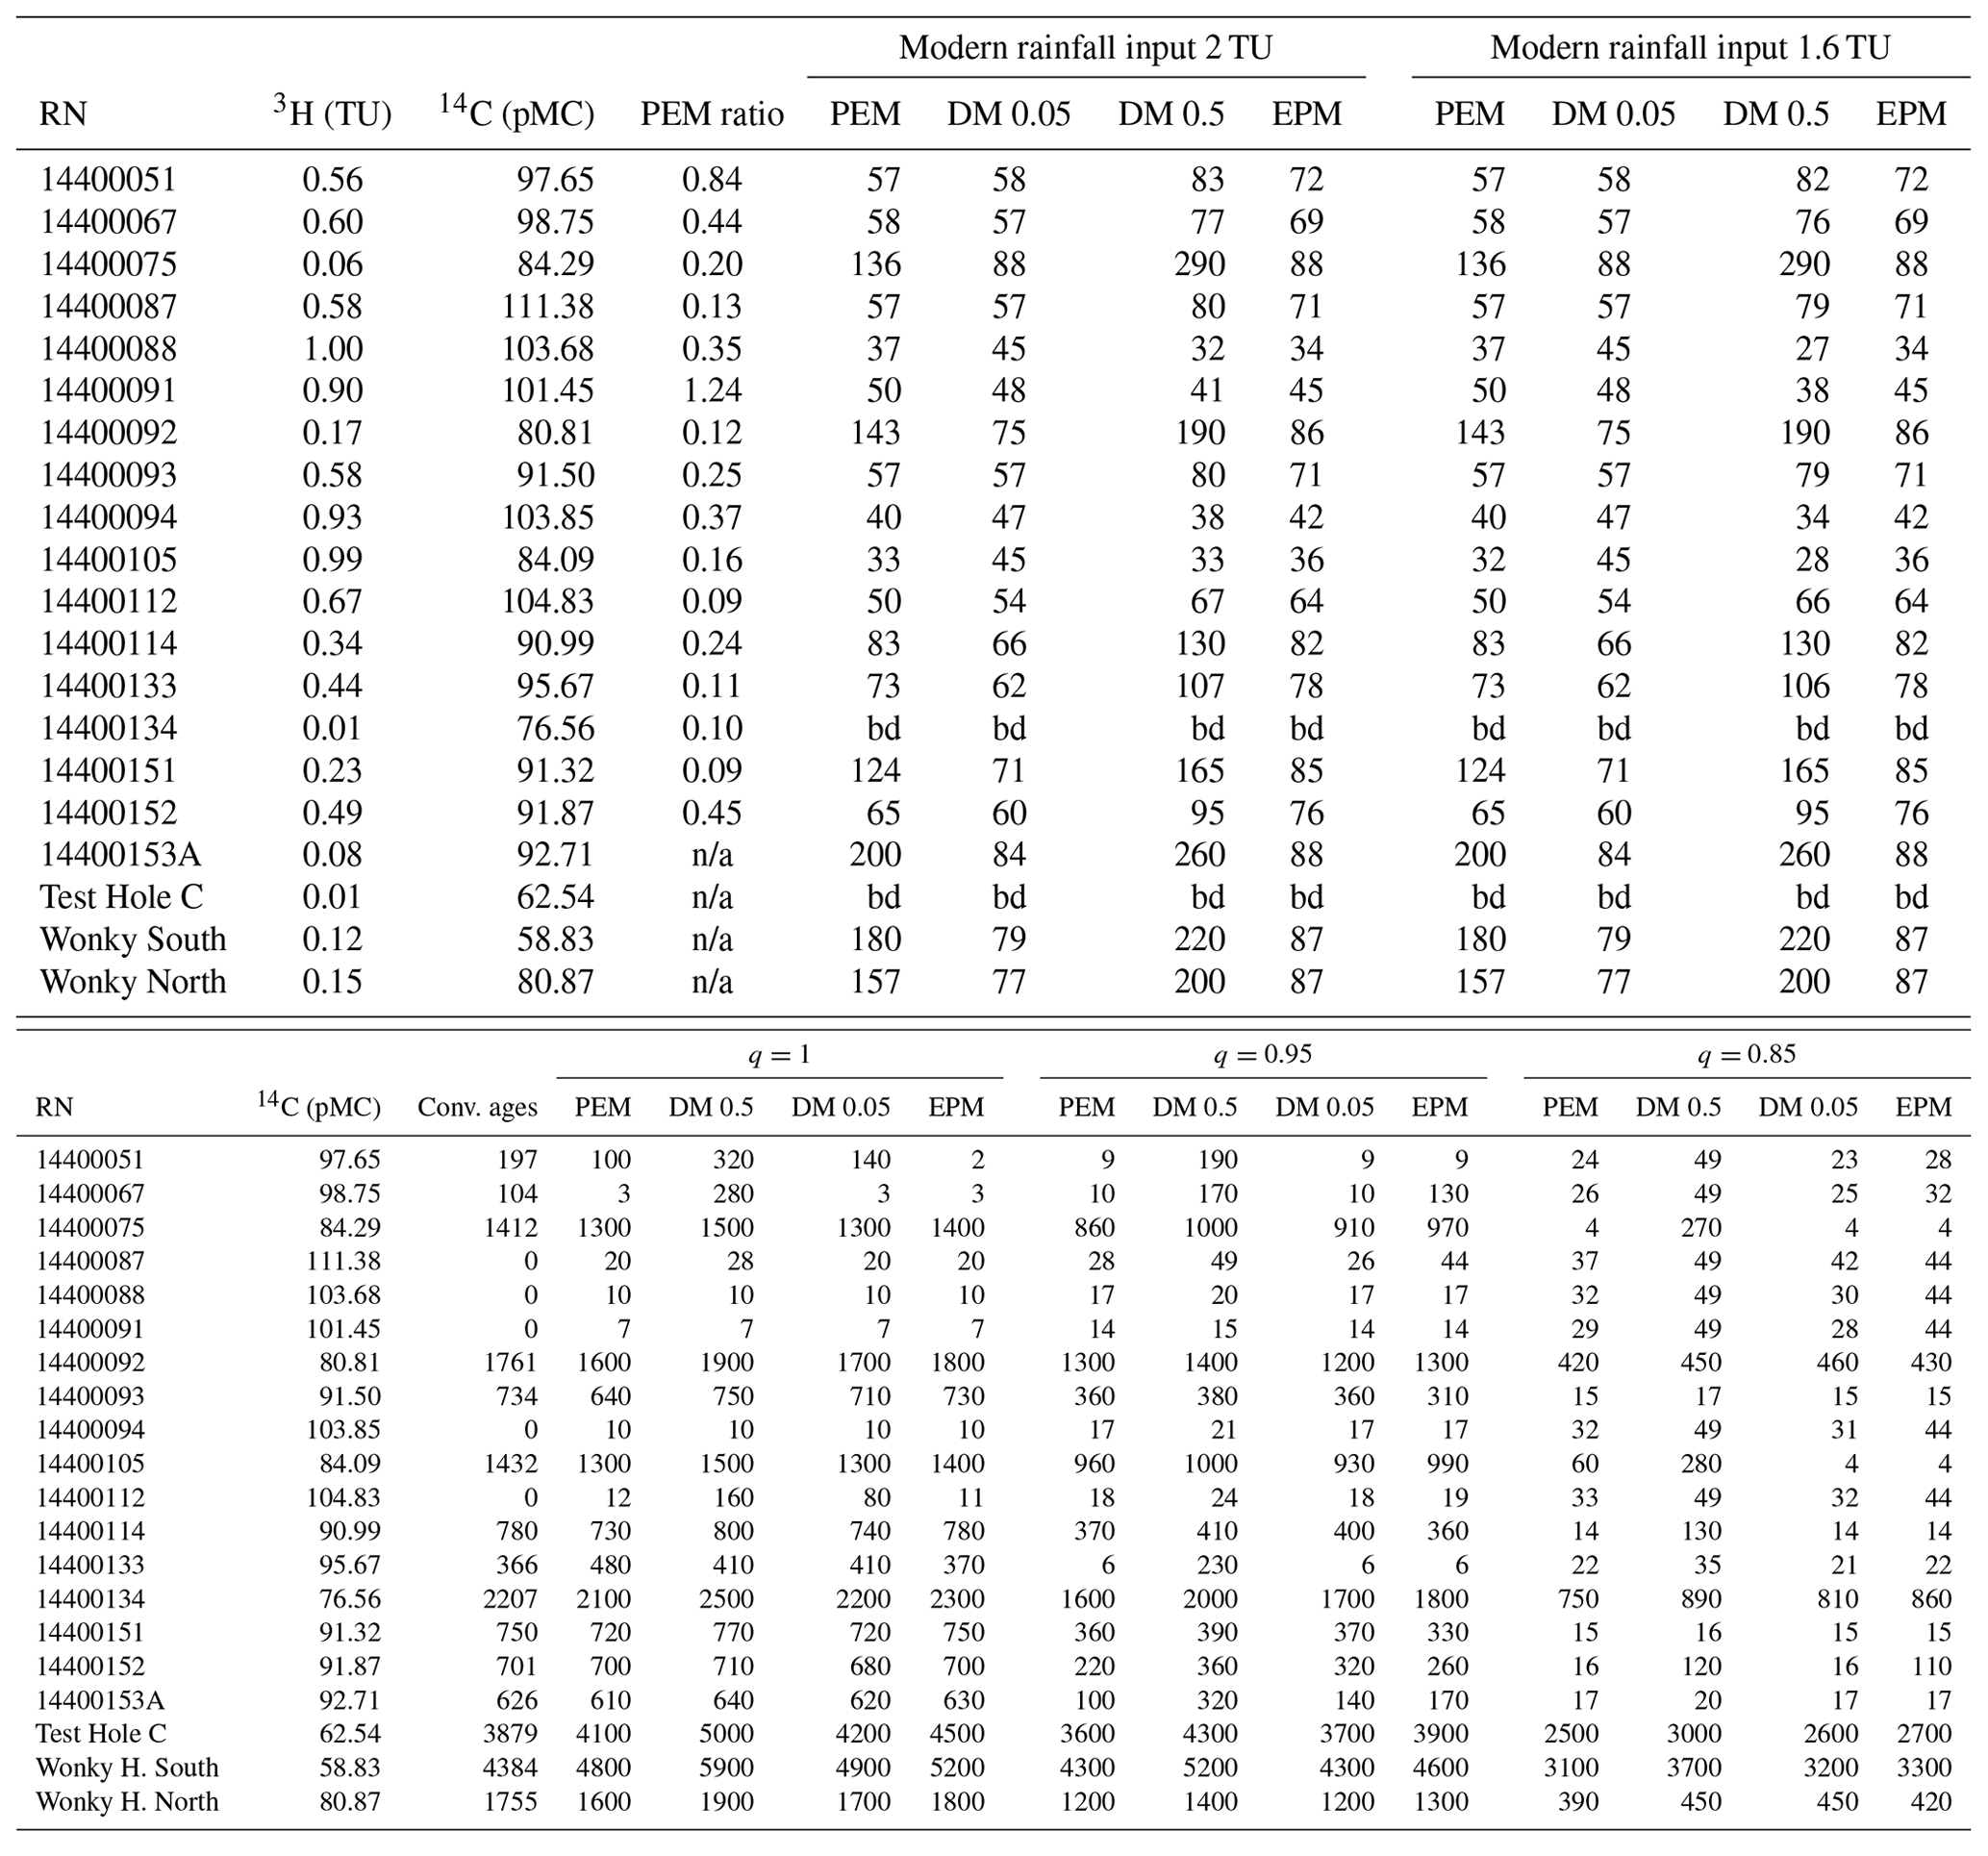
MRTs calculated using the partial exponential flow model range from 37 to more than 150 years. Below background 3H activities in groundwater samples from Test Hole C and bore 14400134 suggest MRTs outside of the age range of tritium (Table A2). Deep groundwater in the centre of the island where the sand dunes overlay the bedrock has MRTs of more than 150 years (Fig. 8b). The MRTs in the eastern part of the island are generally younger (50–124 years) than in the western part (37–>150 years). There are several uncertainties in estimating MRTs. Varying the 3H activity of modern rainfall between 1.6 and 2.0 TU has little effect on the MRT estimate with less than a 1 % difference in MRT. Macroscopic mixing within aquifers (aggregation) may affect MRTs (Stewart et al., 2017), but this mainly occurs where bimodal mixing of young and old waters occurs. The more complex mixing of water of different MRTs in aquifers reduces the error associated with aggregation, as this is similar to the flow simulated by lumped parameter models (Cartwright and Morgenstern, 2016). The main uncertainty in the MRT calculations, especially for older waters, is the choice of lumped parameter model (Cartwright et al., 2018). While the partial exponential model accords with the conceptualisation of the flow system, it will not represent it in detail. To demonstrate the effect of LPM choice, MRTs were also calculated using the dispersion model with dispersion parameters of 0.05 (mostly advection) and 0.5, as well as an exponential piston flow model with a piston flow to exponential flow ratio of 0.5. The difference in MRTs between the models is low when 3H activities are high (>1 TU) but increase markedly as 3H activities decrease. For 3H activities less than 0.2 TU, the range of MRTs is from 75 to 290 years, indicating that MRTs cannot be reliably calculated. Additionally, low-3H waters are more susceptible to contamination during sampling or analysis. While determining MRTs is subject to uncertainties, the relative distribution of older and younger water does not change according to which lumped parameter model is used (Fig. 7a).
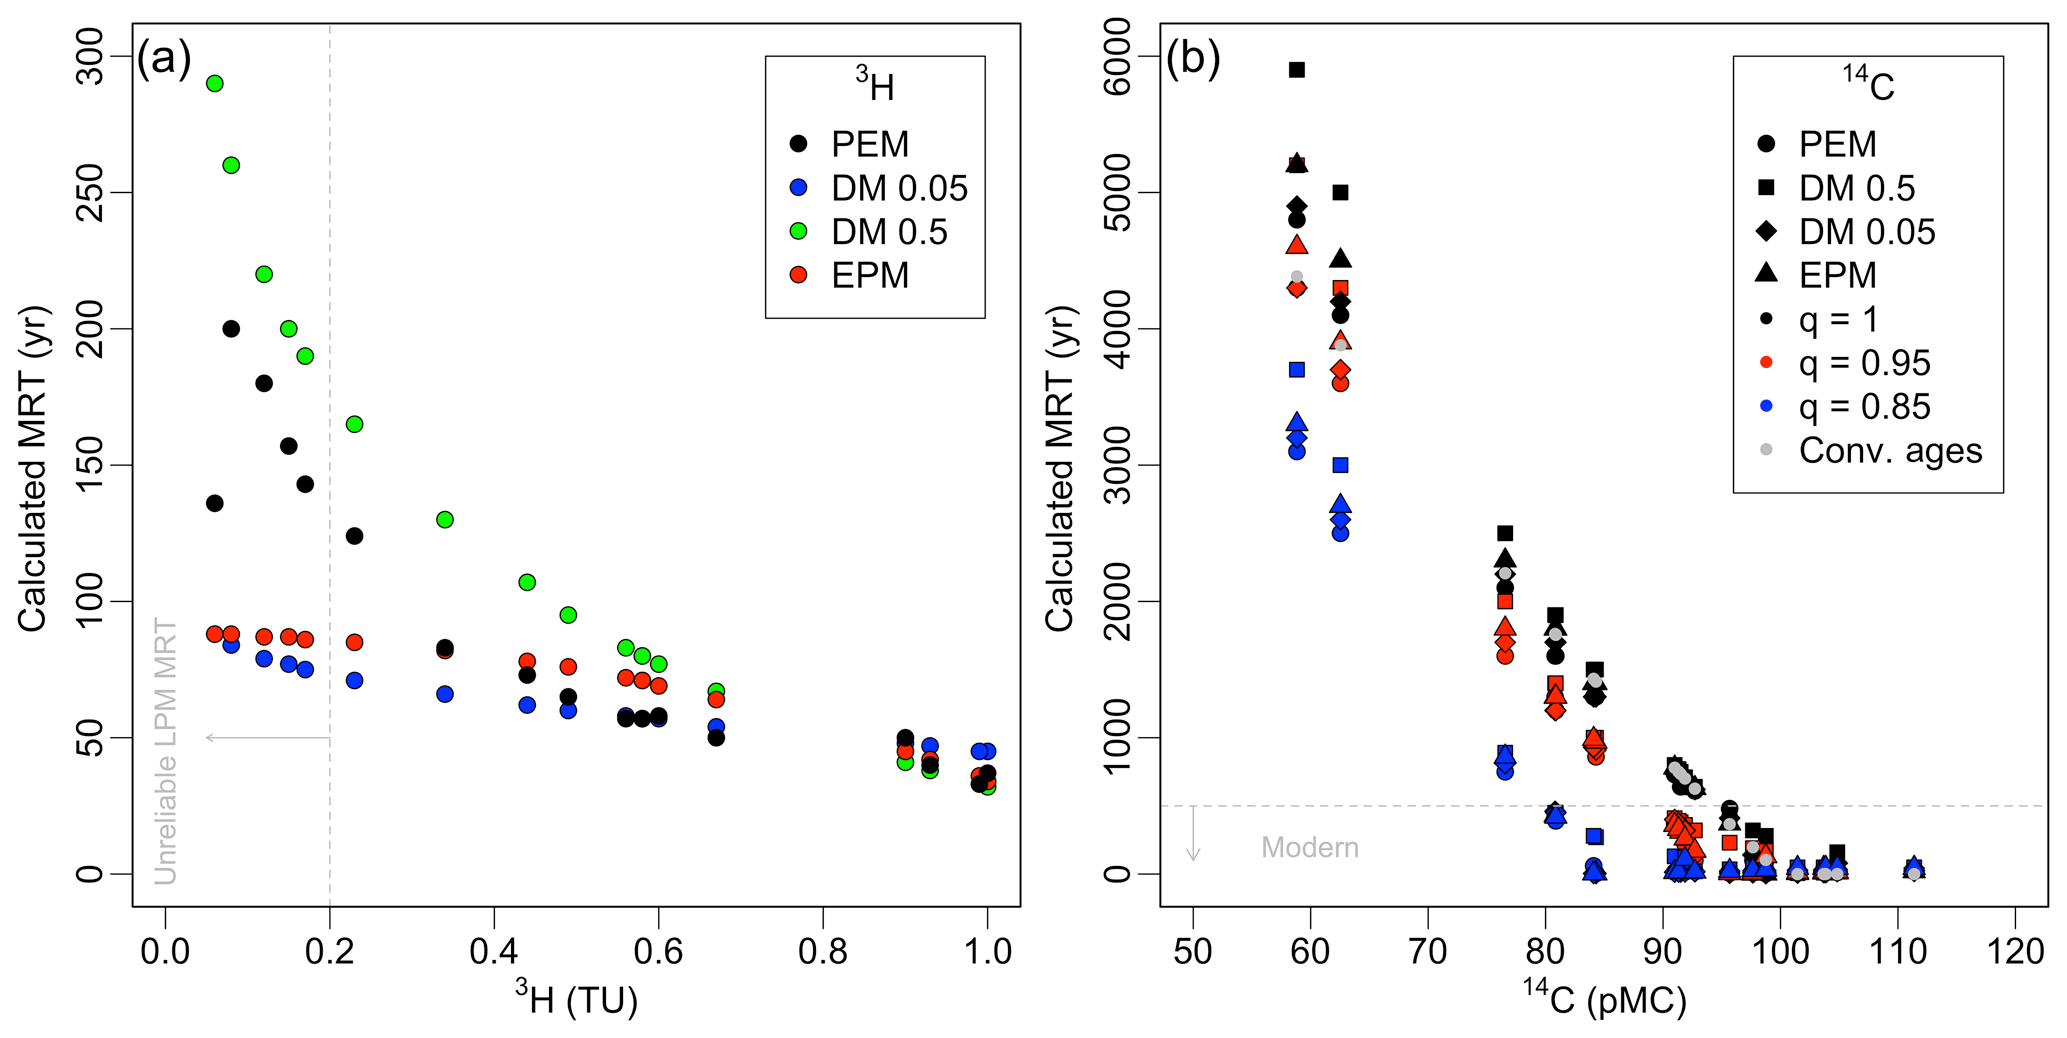
Figure 7(a) Comparison of calculated MRTs for the partial exponential model (PEM), the dispersion model (DM with dispersion parameters of 0.05 and 0.5) and the exponential piston flow model (EPM) using 3H. (b) Comparison of calculated MRTs for the partial exponential model (PEM), the dispersion model (DM with dispersion parameters of 0.5 and 0.05) and conventionally calculated carbon ages using the decay function. The model MRTs were also calculated using 14C dilution models with q factors of 0.95 and 0.85.
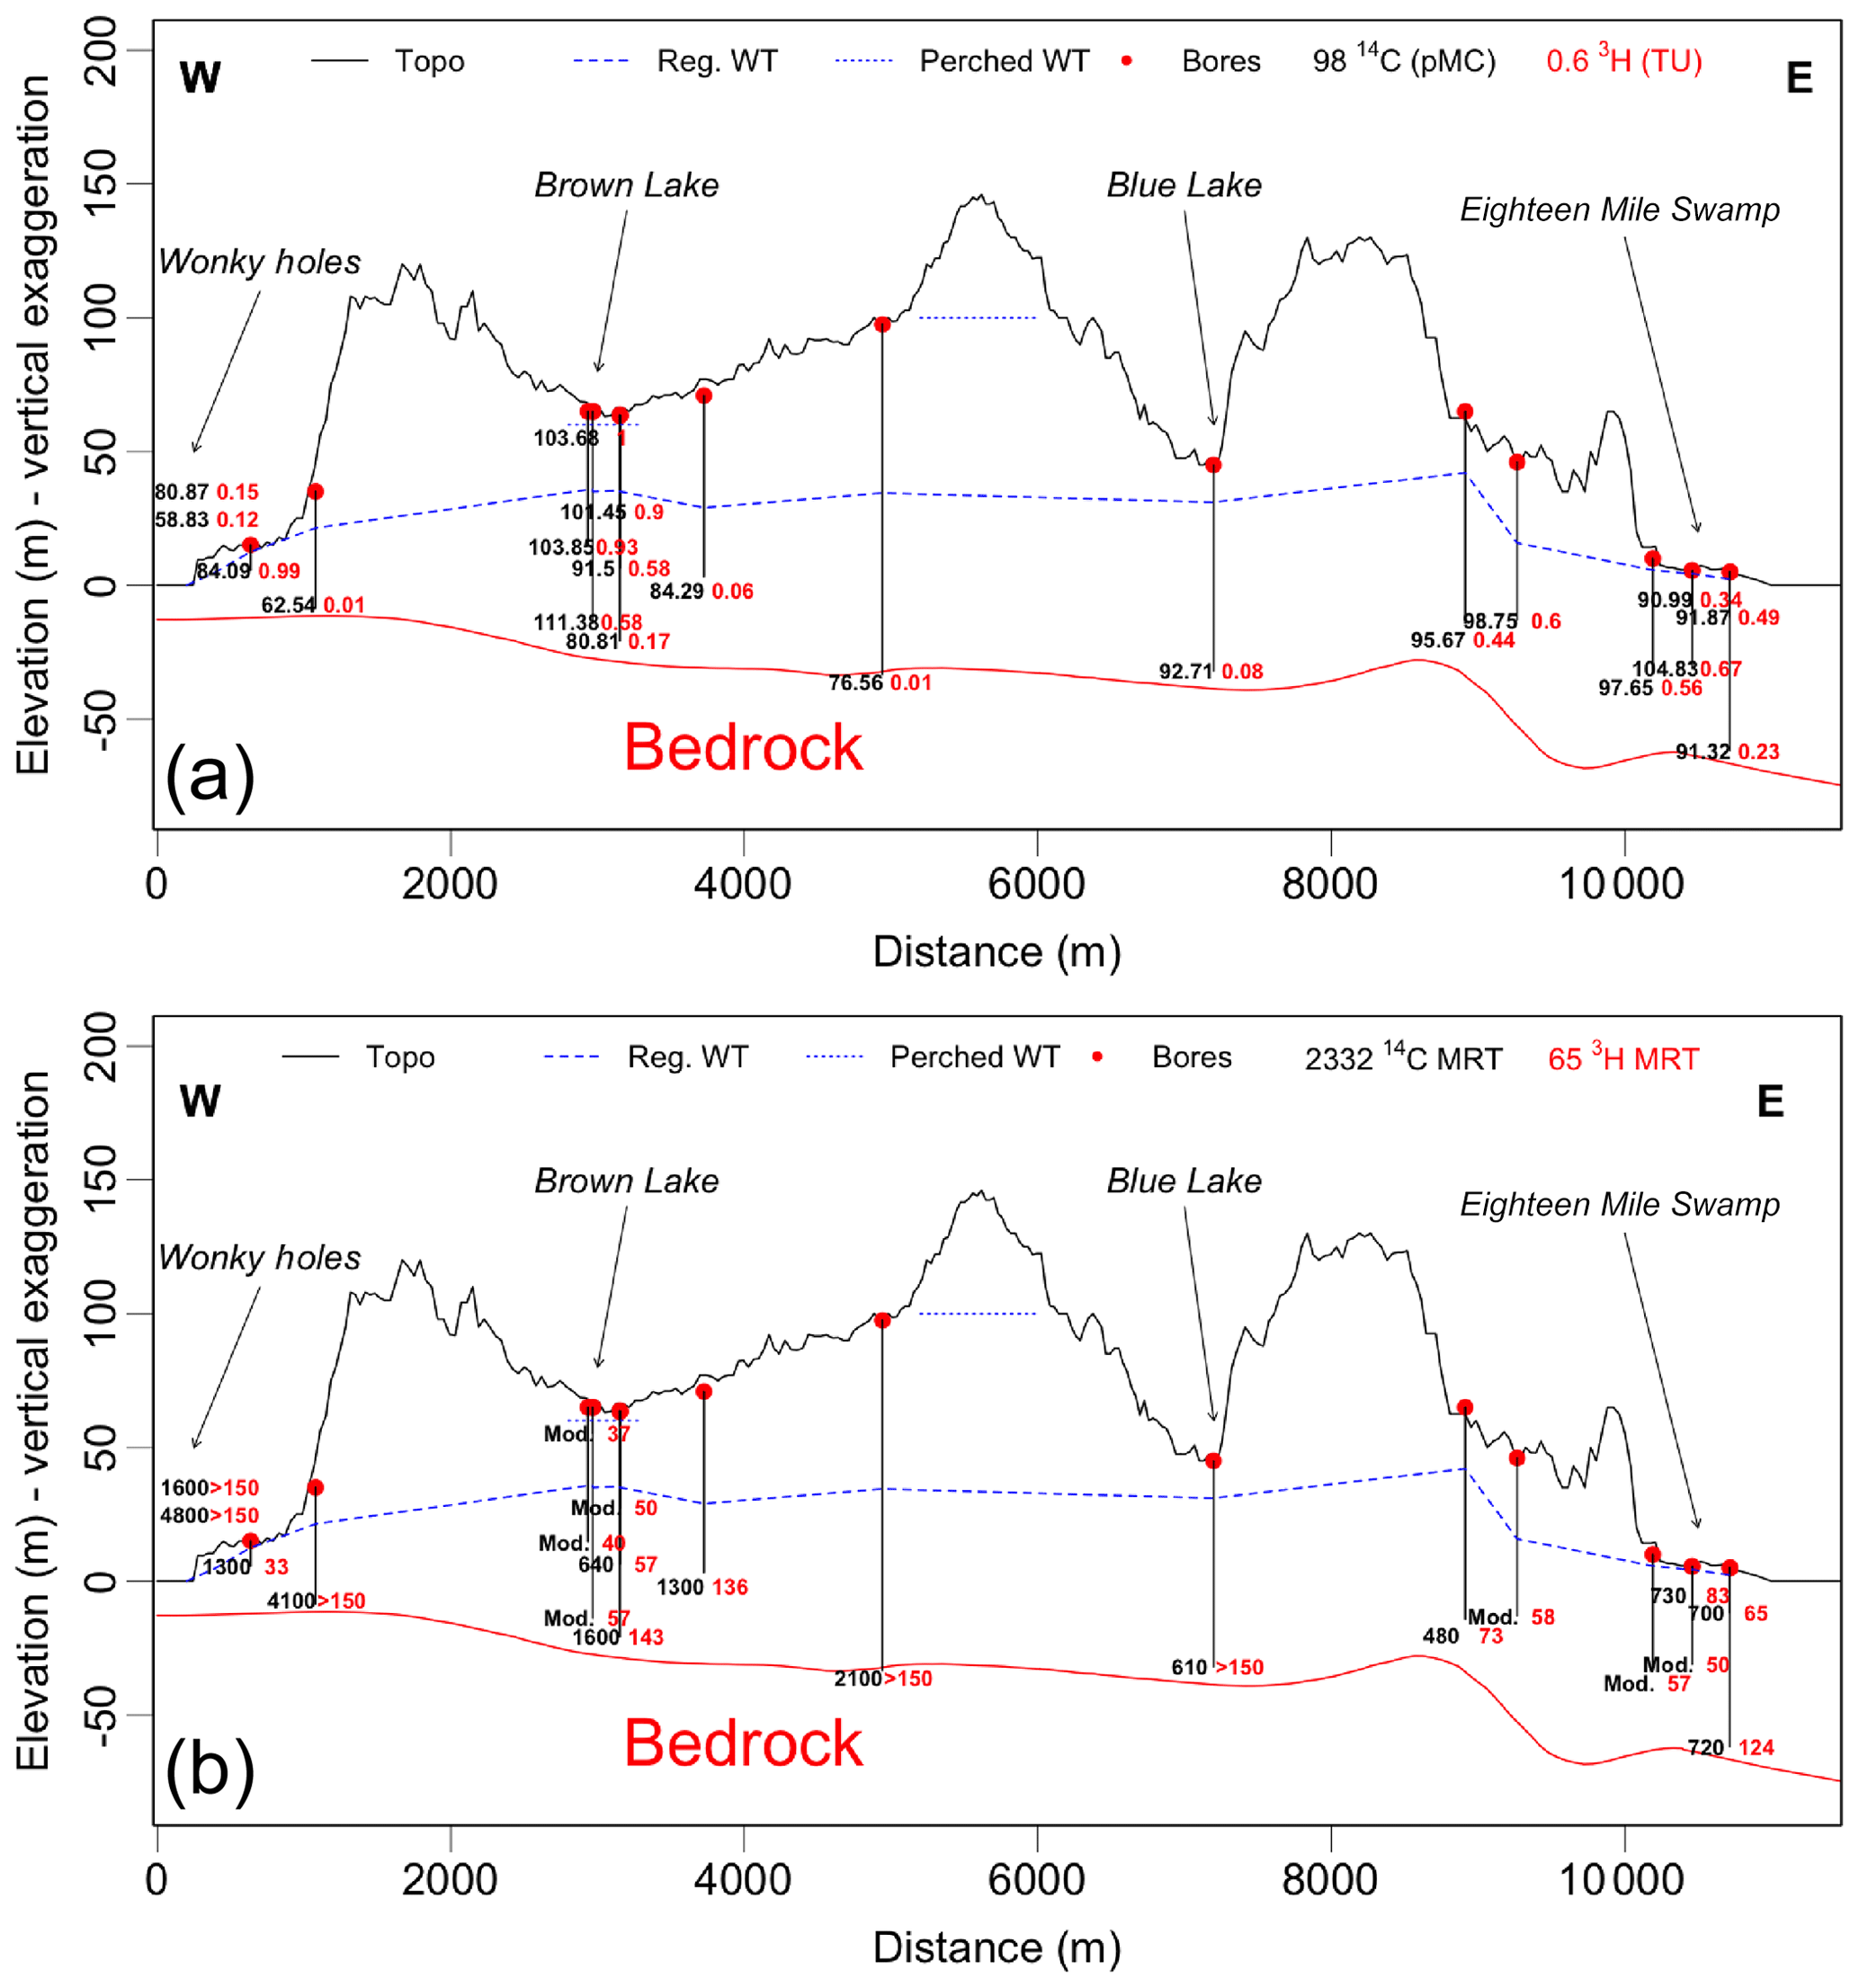
Figure 8(a) Vertically exaggerated cross section along the sample transect with bore locations, depth, pMC (black), and tritium activities (red). (b) Estimated MRTs calculated for tritium activities (rainfall 1.6 TU) with an exponential piston flow model, and 14C ages after correction (q=0.95).
While groundwater was expected to have young MRTs, some of the groundwater has relatively low 14C activities. Estimating MRTs using 14C activities requires that the addition of 14C-free carbon from the groundwater flow system be accounted for. Significant addition of 14C-free carbon may dilute the 14C activities, potentially resulting in MRTs being overestimated (Coetsiers and Walraevens, 2009). Major ion geochemistry and the δ13C values of DIC indicate minor calcite dissolution in some of the groundwater. The proportion of 14C derived from recharge (q) is calculated from a δ13C mass balance using the measured δ13C of the groundwater samples and estimated δ13C value for DIC in recharge and carbonates (Clark and Fritz, 1997; Cartwright et al., 2017; Hofmann and Cartwright, 2013). Most of the δ13C values of DIC are close to those expected from the dissolution of CO2 in soils dominated by C3 vegetation, and q values are close to 0.95 (with a range of 0.61–1.0 and a median of 0.95) (Clark and Fritz, 1997). These q values are higher than those generally proposed for sediments containing fine-grained carbonates (0.75–0.9) and more similar to those in silicate-dominated crystalline rocks (0.9–1.0) (Clark and Fritz, 1997). They are consistent, however, with silica-rich sands and the limited carbonate dissolution implied by the geochemistry. The Ca and HCO3 concentrations in groundwater are also similar to those in groundwater from crystalline rocks (Tweed et al., 2005; Le Gal La Salle et al., 2001; Coetsiers and Walraevens, 2009). Groundwater from bores 14400152 and 14400112, Test Hole C and the wonky holes has higher δ13C values, and Ca and HCO3 concentrations and may record a higher degree of calcite dissolution.
In addition to calcite dissolution, microbial degradation of organic matter in the aquifer or the very low-permeability sediments around the lakes and wetlands may contribute 14C-free carbon (Table A2). Most of the deeper groundwater has little dissolved organic carbon (DOC – which is assessed by the clarity of the water) but the groundwater recharged through the peat-rich wetlands often contains larger amounts of DOC. The breakdown of organic matter as an origin of 14C-free carbon is more likely, but it would not have occurred in situ where the samples were taken for a number of reasons: (1) most of the waters are slightly oxygenated; (2) while there is very little NO3, concentrations of SO4 are relatively high; and (3) the isotopic shift of δ13C values towards more enriched values would be more pronounced. It seems more likely that organic matter degradation processes occurred in the peat sediments around lakes and wetlands, and the seepage from those mixed with existing water in the sand aquifer. The maximum amount of dilution by 14C-free carbon derived from calcite dissolution organic matter may be estimated from the covariance of 3H and 14C (Fig. 6; Cartwright et al., 2013). Reducing q values displaces the covariance curves to lower 14C. While mixing with old groundwater can result in waters lying to the left of the covariance curves, it is not possible for waters to have higher 14C as that would require the initial 14C activity to be greater than that recorded in the atmosphere. In the case of Stradbroke Island groundwater, this implies that q values cannot be substantially lower than 0.8.
MRTs were calculated by adjusting the 14C input function using q values of between 0.85 and 0.95. Some of the adjusted groundwater 14C MRTs are younger than 200 years and are therefore considered to be modern (Fig. 7b). MRTs calculated using the partial exponential model range from modern to 4800 years. MRTs of groundwater are generally higher on the eastern side of the island. The MRTs in the wonky holes (Wonky Hole South 4800 years and Wonky Hole North 1600 years), Test Hole C (4100 years), and bores 14400134 (2100 years), 14400092 (1600 years), 14400105 (1300 years) and 1440075 (1300 years) are older than the majority of groundwater in the main aquifer system. The partial exponential flow model produces the youngest MRTs using 14C (Fig. 7b; Table A2). Differences are more pronounced in the older waters with a maximum of 1100 years difference (partial exponential model vs. dispersion model with a dispersion parameter of 0.5), but relative MRT distributions across the models remain the same. Applying the dilution factors of 0.85 and 0.95 to the calculations has a much stronger effect on the MRTs. The range of MRTs of groundwater using the partial exponential model with the dilution factor of 0.85, for example, is between modern and 3100 years, with Wonky Hole South, Test Hole C, and bores 14400134 and 14400092 still having the largest MRTs of 3100, 2500, 750 and 420 years, respectively.
5.2 Disparities in groundwater MRTs
The calculated groundwater MRTs from the radioisotope tracers are generally higher than what was initially hypothesised. Existing MRTs were based on flow rates estimated using the regional groundwater model (Leach and Gallagher, 2013). This assumed lateral hydraulic conductivities of 1 to 40 m d−1 based on Leach and Gallagher (2013). The large variance in hydraulic conductivities comes from the inclusions of isolated peat and clay layers (Leach and Gallagher, 2013). By contrast, hydraulic conductivities calculated via Darcy's law with velocities from the 14C MRTs, porosities from Leach (2011) and the measured hydraulic gradients are generally between 0.25 and 1 m d−1. There are two likely explanations for these lower hydraulic conductivities: (1) some groundwater discharge to the unconfined sand aquifer from the basement units underneath the sand dunes, and (2) a larger volume of geological units with lower permeability, such as peat, coffee rock and clay, which have more control on groundwater flow than prior studies have suggested.
5.3 Potential influence of the geological basement
The geological basement underneath the island is comprised of the Woogaroo Subgroup, Rocksberg Greenstone and rhyolitic intrusions. A regional evaluation of aquifer storage and retention for south-east Queensland identified aquifers within these units and summarised some of the general hydrogeological characteristics, such as permeabilities, transmissivities and general groundwater flow (Helm et al., 2009). In the case of the Rocksberg Greenstone, water is stored in fractures infilled with clay, and the typical yield is less than 0.2 L s−1. The Woogaroo Subgroup sandstone has a typical yield ranging from less than 1.5 to 6 L s−1 and has been identified to have a moderate groundwater storage potential (Neuman, 2005). There is a possibility that the underlying basement units on the island are connected to the lower sand dunes and groundwater enters the young dune water from these formations. The basement isopach, which was extrapolated from the regional geological model for south-east Queensland, indicates the proximity of each sampling location to the bedrock (Fig. 8b). The closer the groundwater samples are to the basement geology, the older their respective MRTs. This in itself is not a compelling argument, as it is also in line with the progression of MRTs from shallow to deeper sections of the aquifer; however, higher MRTs in the west of the island where the bedrock is shallow might indicate a small degree of discharge from the basement to the dune aquifer. To the best of our knowledge, there are no groundwater bores in the basement on the island, but general groundwater heads on the mainland suggest that this could be a possibility; however, the volumes would be minor, if existent, compared with the volume of the sand aquifer.
5.4 Potential influence of lower-permeability units on MRTs
Over the course of the Quaternary, the accumulation of sand along the coast of south-east Queensland formed the large sand masses in the area. The dune formation came with periods of dune migration and relatively stable periods where dunes were stagnant (Barr et al., 2013; Ellerton et al., 2018). During these periods, the decomposition of organic material, the weathering of minerals and fluctuations in the water table with subsequent redox reactions have led to the formation of lower-permeability units within the otherwise relatively permeable dune systems. The geomorphological, geochemical and environmental processes around the formation of these lower-permeability units are not entirely constrained, but they are often linked to pedogenic processes or the accumulation of fine materials in surface depressions. They led to the occurrence of the aforementioned iron crusts, coffee rocks and thick peat sections in the dune stratigraphy. The iron crusts in particular are believed to be linked to the soil B horizons and are expected to divert groundwater flow in some areas of the island, whereas the coffee rocks and peats are formed around wetland and lakes (Cendón et al., 2014). All of these formations most likely have intermediate water storages with much higher MRTs than the sand aquifer. Permeabilities for the iron crusts are not known, and thicknesses are variable; however, some peat formations are more than 10 m thick, and permeabilities in the peat decline rapidly once a certain thickness (below a depth of 2–3 m) is reached, resulting in the storage of water over long residence times (millennial). Slow leakage or seepage, particularly with hydraulic loading under increased recharge events may add water with a very long MRT to the general water pool in the sand aquifer system. While this is a potential cause of mixed groundwater from sources with very distinctly different residence times, it would most likely occur in the proximity of these peat units. There is proof of this type of scenario when comparing bores 14400114 and 14400112: two nested bores on the edge of Eighteen Mile Swamp, a large freshwater peatland on the eastern side of the island. Bore 14400114 is the shallower bore but has a much older MRT (pMC of 91) than the deeper bore 14400112 (pMC of 105). A comparison of major ion and trace element concentrations indicates that the groundwater sample from bore 14400114 has uncharacteristically high concentrations of Na, Mg, Sr, Si, Mn, Fe, Cl, Br and HCO3. Almendinger and Leete (1998) found elevations in the same major ions and trace elements when comparing wells above peat layers to wells below peat layers. The high enrichment of elements seen in this sample and its disparity to other MRTs suggests that this bore receives groundwater from the peat unit forming Eighteen Mile Swamp, where the hydraulic conductivities are relatively low and the concentrations of the aforementioned ions and elements are high.
5.5 Conceptualisation of groundwater flow
Variations in groundwater MRTs estimated from 3H and 14C throughout North Stradbroke Island support the current idea of groundwater flow from the centre of the island towards both coasts. There is also robust evidence that groundwater has a large vertical flow component (Fig. 9) with MRTs generally increasing with depth (Fig. 8a, b). While the MRT variation is not as strongly pronounced in the horizontal flow direction, the combination of known hydraulic gradients and known areas of discharge support the idea that lateral flow is consistent with MRT distributions. Modelling by Chen et al. (2003) and Leach and Gallagher (2013) suggests that groundwater on North Stradbroke island is discharged via (a) movement into coastal wetlands (55 %), (b) submarine discharge around the coastline (27 %), (c) groundwater extraction (16 %) and (d) discharge into Blue Lake (2 %) (Chen et al., 2003). The conceptual model of groundwater flow along the sampled transect is divided into two areas: an area where groundwater flows to the west and an area where it flows to the to the east (Fig. 9). There are minor flow diversions to the north and the south, resulting from the centre of the transect also being the highest elevation on the island – topography drops from there in all four directions. It is assumed that recharge occurs across the whole island and, as such, recent recharge is added to the lateral groundwater flow at all points along the cross section.

Figure 9Conceptual sketch of groundwater flow across the island from the centre of the island to the ocean in the east and to Moreton Bay in the west. Parts of the centrally recharged groundwater also flow to the north and the south (Leach and Gallagher, 2013). Lower-permeability units in the unsaturated zone can have longer residence times than direct recharge. There may also be groundwater contributions from the bedrock. On the western side, some of the groundwater is discharged directly into Moreton Bay, while some flows underneath the tidal mud flats in semi-confined conditions and is discharged partly through wonky holes into the bay.
The east coast of the island is comprised of a large freshwater wetland system at the foothills of the major dune system. This wetland, Eighteen Mile Swamp, separates the major Quaternary dunes from the foredunes. Groundwater from the main dunes discharges into the wetland and partially re-enters into the foredunes along the coastline (Fig. 9). However, it appears that there are at least two aquifer systems that are separated by a lower-permeability unit. This lower-permeability unit was identified as a marine clay underneath the peat sequences of Eighteen Mile Swamp by Mettam et al. (2011). Nested bores 14400151 (67 m) and 14400152 (17 m) indicate younger MRTs and higher salinity (173 mg L−1 TDS) in the shallow part of the foredune system and older, lower salinity in the deeper parts; this is also reflected in bore 14400051 in the main dune system (Fig. 1). Moreover, there is an upward gradient indicating a hydraulic connection of the deeper foredune to the regional groundwater system and potentially to Eighteen Mile Swamp (Fig. 9).
The west coast of the island generally has lower topographic gradients and extended salt marshes that continue into the mangrove tidal areas of Moreton Bay. Sequences of fine, organic-matter-rich muds overlay the dune sands and lead to semi-confined conditions in the sand aquifer in the direct proximity of the coast underneath the muds (Fig. 9). The wonky holes are circular disturbances in the mud sequences where fresh groundwater from the island's sand dunes discharges into the saltwater environment of the bay. The controls surrounding the formation of these discharge points is unknown, but an upward head gradient in the underlying confined system, bioturbation and heterogeneities in the mud sediments possibly created an opening to the surface. The long MRT of water discharging through the wonky holes suggest that most of the water derives from the deeper confined sand aquifer units that are linked to the centre of the island (Fig. 9).
The results of this study indicate that the perched groundwater systems have a significant effect on groundwater flow, recharge inhibition and intermediate water storage. While this study focuses on a transect of the island, similar stratigraphy and dune heterogeneity is widespread across North Stradbroke Island (Leon Leach, personal communication, 2018) and across all of the sand masses on the east coast of Australia (Ellerton et al., 2018), which highlights the transferability of this study. Many lake and wetland systems exist in this environment around perched aquifer system and are sometimes the cause of the perching layer formation. Depending on the age and location of the perched systems, the perching layer varies largely in thickness. Permeabilities decrease with thickness, and some of the systems may have very slow flow velocities through the perching layers, resulting in groundwater that potentially has a MRT of thousands to tens of thousands of years leaking into the main aquifers. Even small amounts of leakage from these systems have the ability to lower the overall groundwater MRT.
The groundwater MRTs observed in this study differ from those found in similar studies of barrier island groundwater systems, as the MRTs in the North Stradbroke Island aquifer systems are less consistently distributed from the centre of the island towards the coastal discharge areas (Röper et al., 2012; Houben et al., 2014; Seibert et al., 2018; Holt et al., 2019). The reason for this is probably the age of the dune systems. Older dunes systems have undergone stable periods with pedogenesis, especially in subtropical and tropical environments, and periods of dune migration, burying former soil horizons in the deeper units of the dune stratigraphy. This leads to a more heterogeneous dune stratigraphy with the inclusion of peat, clay and indurated sands compared with the relatively young, homogeneous Holocene islands mentioned in the studies above. Furthermore, the island is much larger with a more variable topography, geomorphology and denser vegetation than the islands described in Röper et al. (2012), Houben et al. (2014), Seibert et al. (2018) and Holt et al. (2019). The best comparison to this study is the study by Stuyfzand (1993) where MRTs were estimated using a simple analytical solution. However, this method revealed much shorter MRTs in a dune system with similar stratigraphic complexity and dune ages to North Stradbroke Island.
A combination of cosmogenic isotopes, major ion chemistry and stable isotope geochemistry was used to conceptualise groundwater flow on North Stradbroke Island, with varying groundwater MRTs in different parts of the island, and to determine groundwater flow paths through the aquifer systems.
MRTs estimated using 3H indicate a strong vertical stratification from 37 years to more than 150 years. 14C MRTs display similar temporal relationships with much greater ranges. This MRT discrepancy is attributed to different groundwater reservoirs. This study did not produce evidence for contributions from the fractured Woogaroo Subgroup sandstone aquifer, but the possibility remains. Water diversion and retention by low-permeability units in the dune systems are currently the most likely course for relatively long MRTs. The geochemical composition of groundwater remains relatively consistent throughout the island, with the only irregularities attributed to old groundwater stored within coastal peat. The stable isotope composition of North Stradbroke Island groundwater is similar to Brisbane precipitation without any indication of evaporative enrichment. The outcomes of this study can be incorporated in regional groundwater flow models to refine the potential inhibition and retardation of recharge to test models' validity. The position of the islands large fresh water reservoir in dry and populous south-east Queensland means its potential to be used as a water resource is always high; thus, background information on aquifer distribution and groundwater MRTs is crucial to better validate impact assessment for water abstraction.
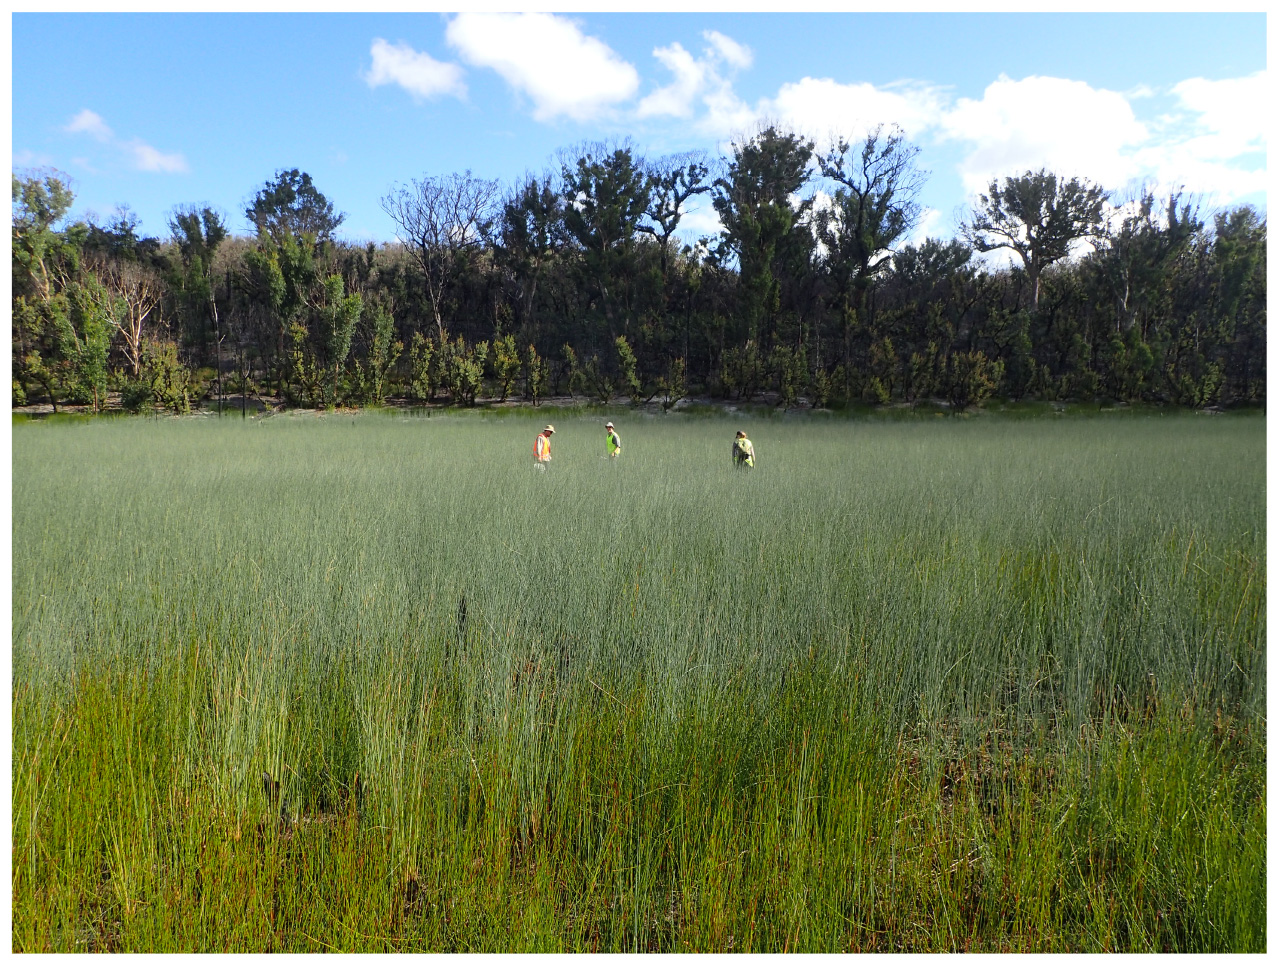
Figure A1North Stradbroke Island wetland with typical vegetation of eucalypt species on the surrounding dunes.
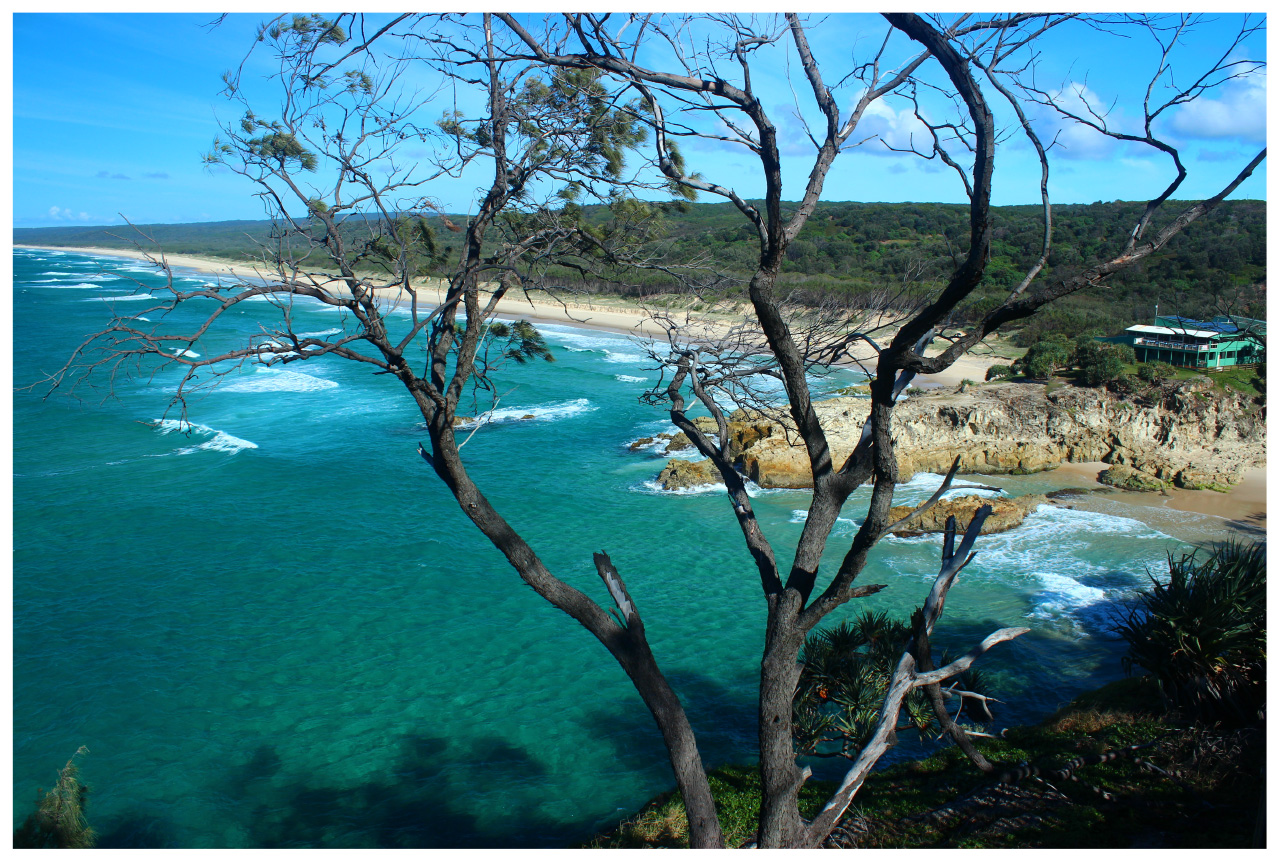
Figure A2The North Stradbroke Island east coast at Point Lockout at the northern tip of the island looking south-west. The dunes in the background are covered by typical native eucalypt forest.
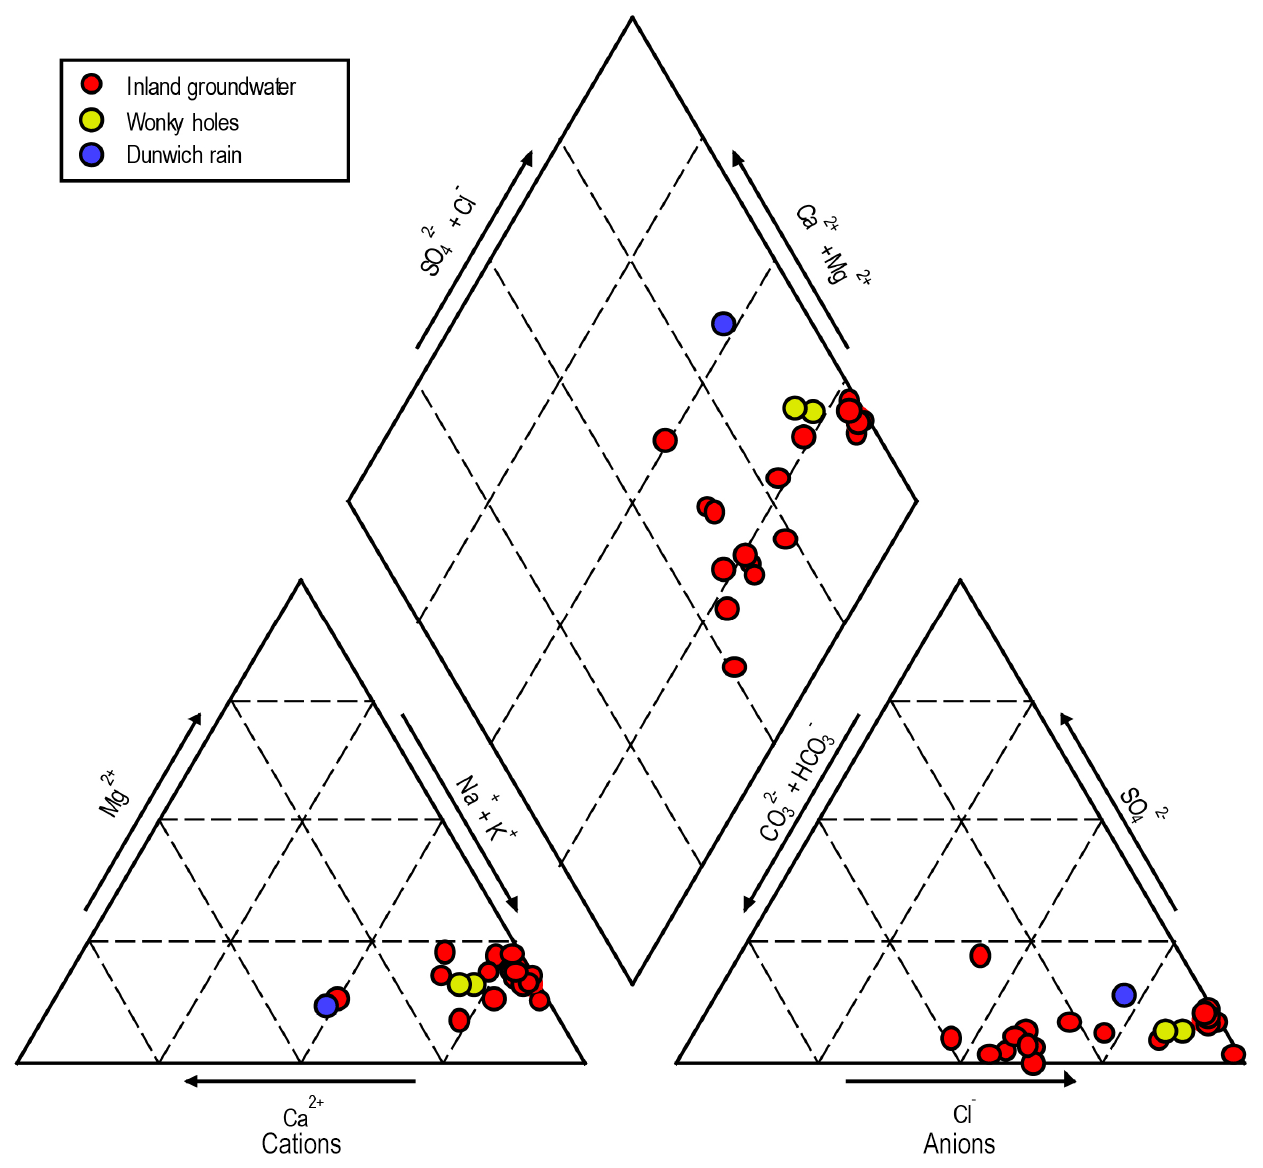
Figure A3Piper diagram showing inland groundwater samples (red), samples from the two wonky holes (yellow) and the rain water sample (blue).
Table A1Site information, chemistry data and major ion data. “Lat” stands for latitude, “Long” is longitude, “Water level” is the water level below the natural surface, “Hydr. head” is the hydraulic head, Cl∕Br and Na∕Cl are molar ratios, CBE is the charge balance error, “n/a” is not applicable, “nd” is not determined and “bd” is below detection.
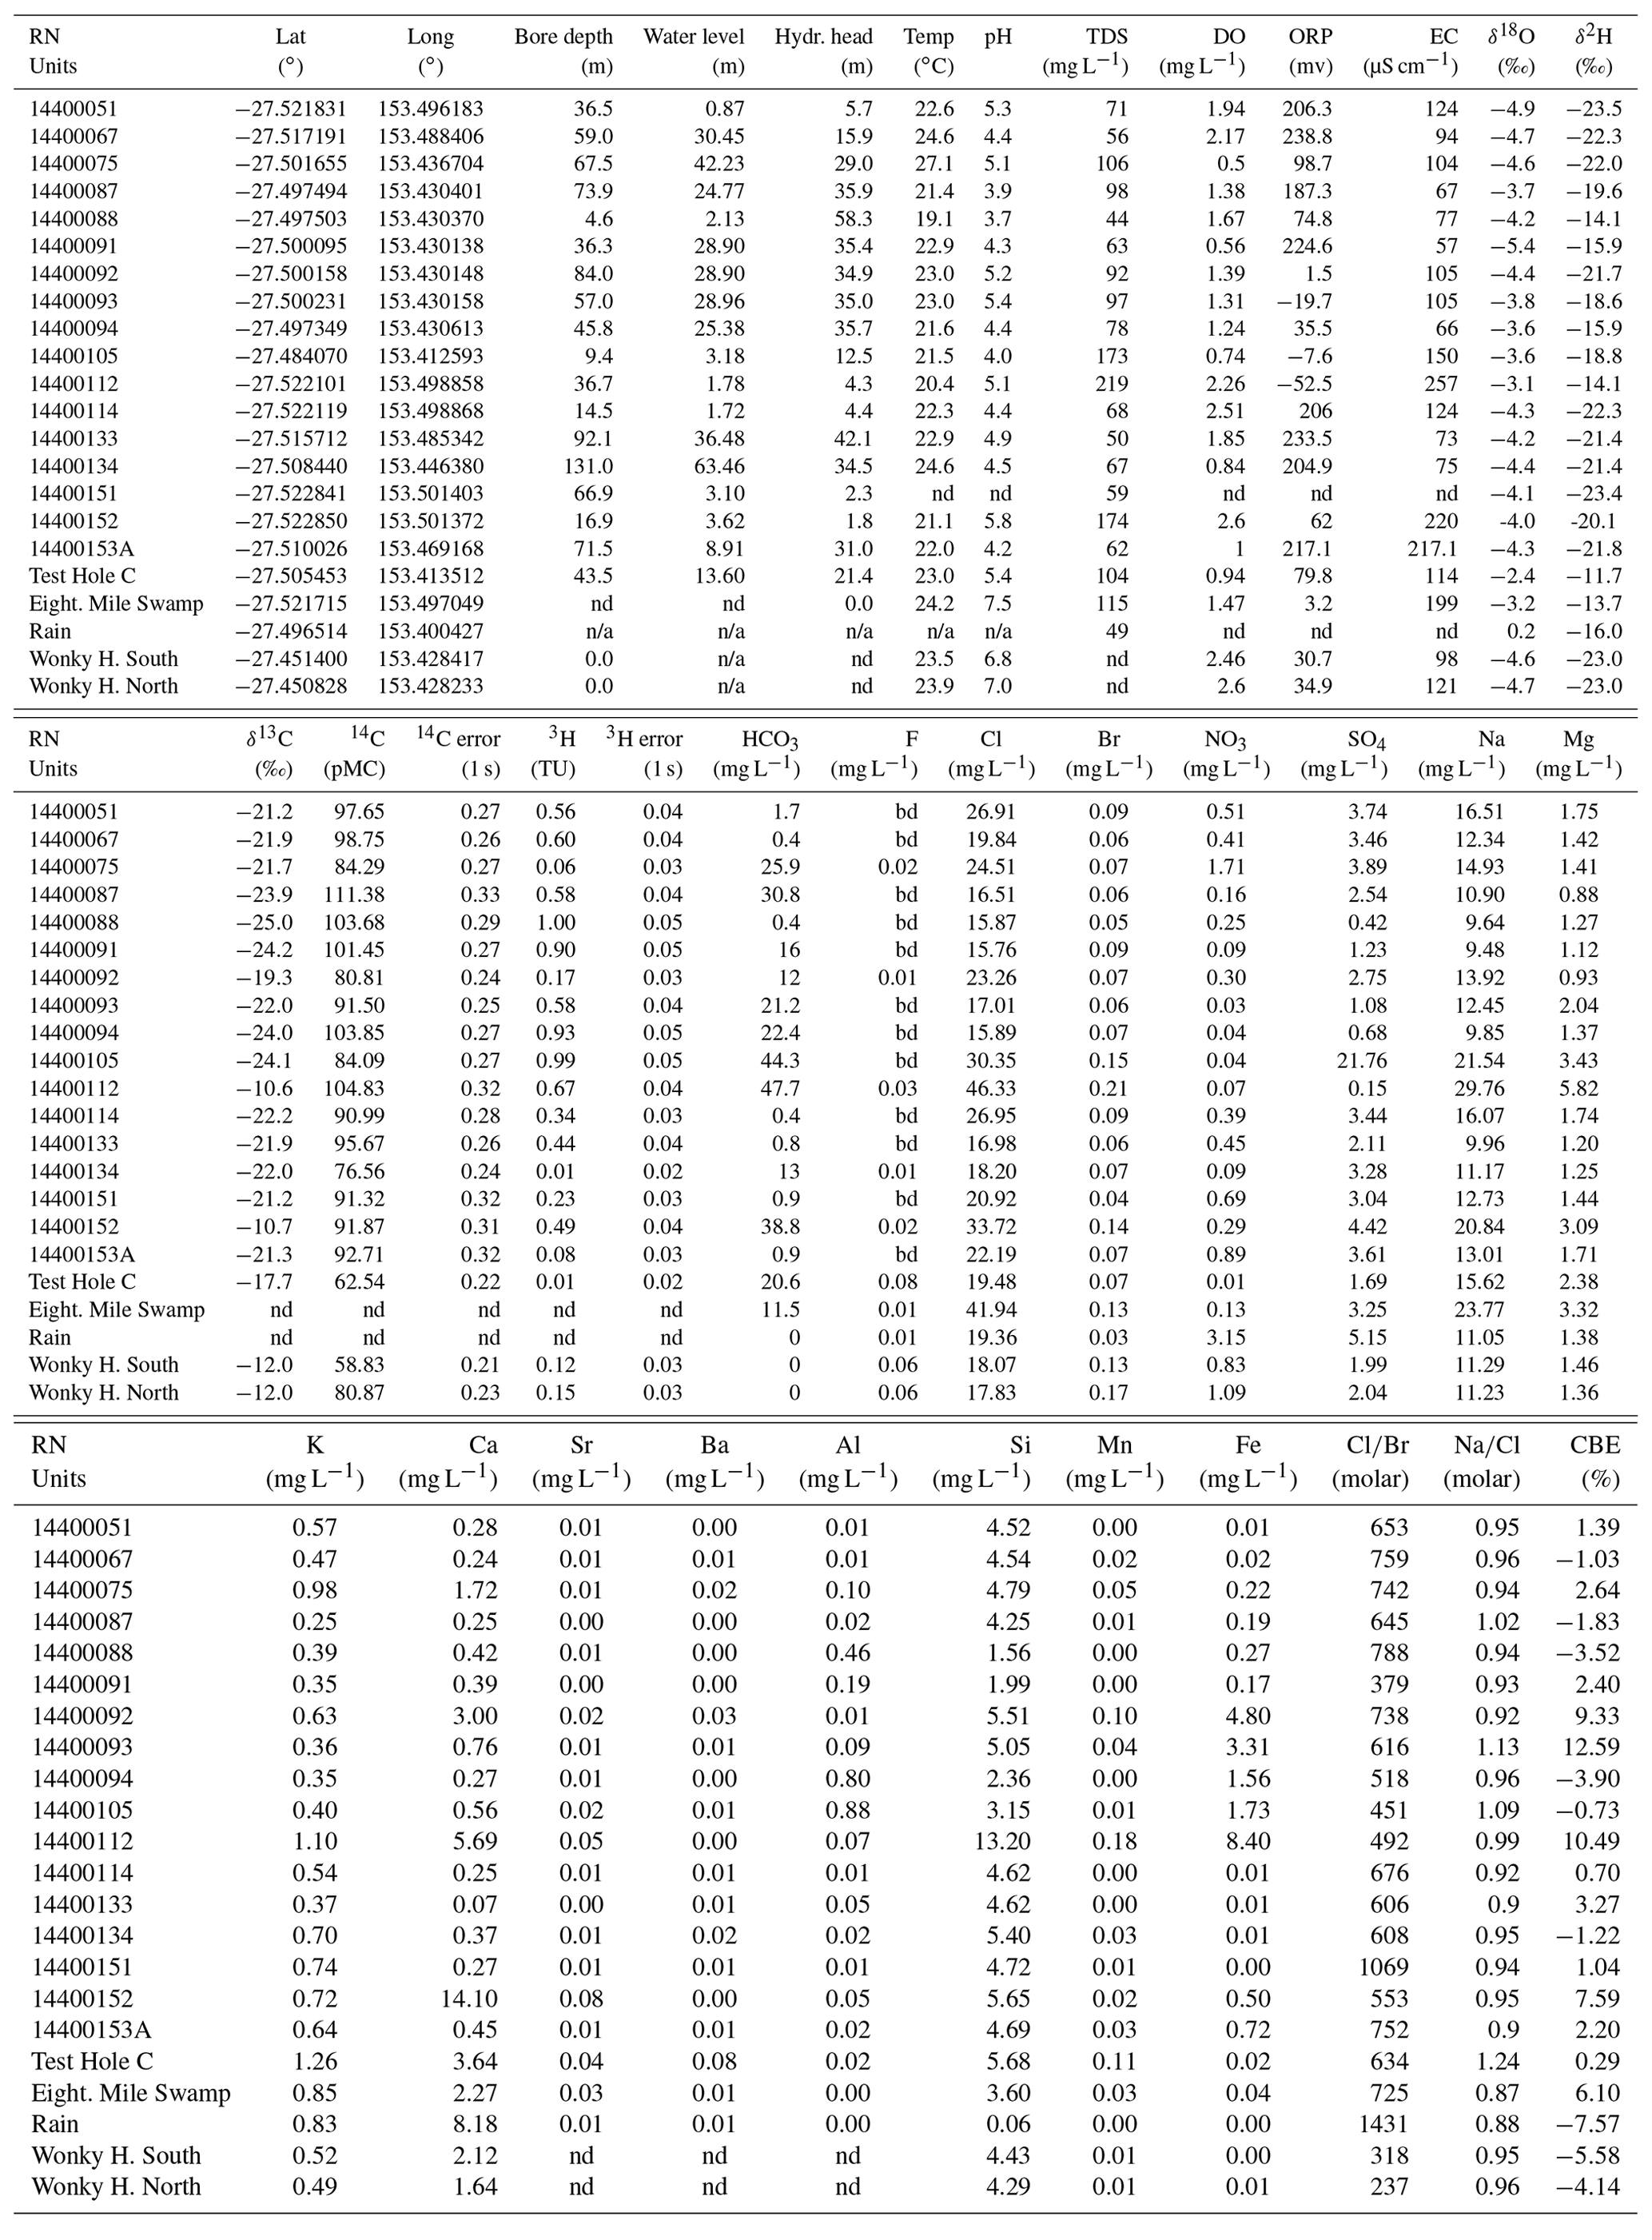
Table A23H residence times calculated with an input function with modern tritium rainfall activities of 1.6 and 2.0 TU as well as the average between the two results. 14C ages are reported as conventional ages from the laboratory, and further ages are calculated using a statistical q factor of 0.85 (Clark and Fritz, 1997) and a correction factor of q=0.95. “bd” denotes below detection, and “n/a” refers to not applicable.
The chemical data are made available in Tables A1 and A2 in the Appendix of this paper.
Harald Hofmann designed the project. HH, DN (honours student) and IC executed the field work and data analysis. HH and IC developed the model. DIC assisted with 3H and 14C analysis and interpretation. MR assisted with conceptualisation of the geology and the regional context. HH prepared the paper with contributions from all co-authors.
The authors declare that they have no conflict of interest.
We thank the traditional owners of the land and water around Moreton Bay and North Stradbroke Island (Minjerribah), represented by the Quandamooka Yoolooburrabee Aboriginal Corporation (QYAC), for their continuing support and collaboration on their land. We also want to thank the staff of The University of Queensland Moreton Bay Research Station in Dunwich for their continuous support and help in preparing and executing field work.
This paper was edited by Christine Stumpp and reviewed by two anonymous referees.
This research project was partially funded by the School of Earth Sciences at The University of Queensland and the School of Earth, Atmosphere and Environment at Monash University. 3H and 14C analyses were funded by the Australian Nuclear Science and Technology Organisation (ANSTO; award no. ALNGRA14530).
Almendinger, J. E. and Leete, J. H.: Regional and local hydrogeology of calcareous fens in the Minnesota River basin, USA, Wetlands, 18, 184–202, 1998. a
Atkinson, A. P., Cartwright, I., Gilfedder, B. S., Cendón, D. I., Unland, N. P., and Hofmann, H.: Using 14C and 3H to understand groundwater flow and recharge in an aquifer window, Hydrol. Earth System Sciences, 18, 4951–4964, https://doi.org/10.5194/hess-18-4951-2014, 2014. a
Audet, P., Gravina, A., Glenn, V., McKenna, P., Vickers, H., Gillespie, M., and Mulligan, D.: Structural development of vegetation on rehabilitated North Stradbroke Island: Above/belowground feedback may facilitate alternative ecological outcomes, Ecol. Process., 2, 2192–1709, 2013. a
Austin, M. J., Masselink, G., McCall, R. T., and Poate, T. G.: Groundwater dynamics in coastal gravel barriers backed by freshwater lagoons and the potential for saline intrusion: Two cases from the UK, J. Mar. Syst., 123–124, 19–32, 2013. a, b
Australian Bureau of Meteorology: Climate Data Online, available at: http://www.bom.gov.au/climate/data/ (last access: January 2019), 2017. a
Barr, C., Tibby, J., Marshall, J. C., McGregor, G. B., Moss, P. T., Halverson, G. P., and Fluin, J.: Combining monitoring, models and palaeolimnology to assess ecosystem response to environmental change at monthly to millennial timescales: The stability of Blue Lake, North Stradbroke Island, Australia, Freshwater Biol., 58, 1614–1630, 2013. a, b, c
Barr, C., Tibby, J., Moss, P. T., Halverson, G. P., Marshall, J. C., McGregor, G. B., and Stirling, E.: A 25,000-year record of environmental change from Welsby Lagoon, North Stradbroke Island, in the Australian subtropics, Quatern. Int., 449, 106–118, 2017. a
Barr, C., Tibby, J., Leng, M. J., Tyler, J. J., Henderson, A. C. G., Overpeck, J. T., Simpson, G. L., Cole, J. E., Phipps, S. J., Marshall, J. C., McGregor, G. B., Hua, Q., and McRobie, F. H.: Holocene El Niño-Southern Oscillation variability reflected in subtropical Australian precipitation, Scient. Rep., 9, 1627, https://doi.org/10.1038/s41598-019-38626-3, 2019. a, b
Brooke, B., Preda, M., Lee, R., Cox, M., Olley, J., Pietsch, T., and Price, D.: Development, composition and age of indurated sand layers in the Late Quaternary coastal deposits of northern Moreton Bay, Queensland, Aust. J. Earth Sci., 55, 141–157, 2008. a
Bryan, E., Meredith, K. T., Baker, A., Post, V. E., and Andersen, M. S.: Island groundwater resources, impacts of abstraction and a drying climate: Rottnest Island, Western Australia, J. Hydrol., 542, 704–718, 2016. a, b
Cadd, H. R., Tibby, J., Barr, C., Tyler, J., Unger, L., Leng, M. J., Marshall, J. C., McGregor, G., Lewis, R., Arnold, L. J., Lewis, T., and Baldock, J.: Development of a southern hemisphere subtropical wetland (Welsby Lagoon, south-east Queensland, Australia) through the last glacial cycle, Quaternary Sci. Rev., 202, 53–65, 2018. a
Cartwright, I. and Morgenstern, U.: Using tritium to document the mean transit time and sources of water contributing to a chain-of-ponds river system: Implications for resource protection, Appl. Geochem., 75, 9–19, 2016. a
Cartwright, I., Weaver, T. R., Stone, D., and Reid, M.: Constraining modern and historical recharge from bore hydrographs, 3H, 14C, and chloride concentrations: Applications to dual-porosity aquifers in dryland salinity areas, Murray Basin, Australia, J. Hydrol., 332, 69–92, 2007. a
Cartwright, I., Gilfedder, B., and Hofmann, H.: Chloride imbalance in a catchment undergoing hydrological change: upper Barwon River, southeast Australia, Appl. Geochem., 31, 187–198, 2013. a
Cartwright, I., Cendón, D., Currell, M., and Meredith, K.: A review of radioactive isotopes and other residence time tracers in understanding groundwater recharge: Possibilities, challenges, and limitations, J. Hydrol., 555, 797–811, 2017. a, b
Cartwright, I., Irvine, D., Burton, C., and Morgenstern, U.: Assessing the controls and uncertainties on mean transit times in contrasting headwater catchments, J. Hydrology, 557, 16–29, 2018. a
Cendón, D. I., Hankin, S. I., Williams, J. P., der Ley, M. V., Peterson, M., Hughes, C. E., Meredith, K., Graham, I. T., Hollins, S. E., Levchenko, V., and Chisari, R.: Groundwater residence time in a dissected and weathered sandstone plateau: Kulnura-Mangrove Mountain aquifer, NSW, Australia, Aust. J. Earth Sci., 61, 475–499, 2014. a
Chen, J., He, D., and Cui, S.: The response of river water quality and quantity to the development of irrigated agriculture in the last 4 decades in the Yellow River Basin, China, Water Resour. Res., 39, 1047, https://doi.org/10.1029/2001WR001234, 2003. a, b
Clark, I. D. and Fritz, P.: Environmental Isotopes in Hydrogeology, Lewis Publischers, New York, 1997. a, b, c, d, e, f, g
Coetsiers, M. and Walraevens, K.: A new correction model for 14C ages in aquifers with complex geochemistry – Application to the Neogene Aquifer, Belgium, Appl. Geochem., 24, 768–776, 2009. a, b
Cox, M. E., James, A., Hawke, A., Specht, A., Raiber, M., and Taulis, M.: North Stradbroke Island 3D hydrology: Surface water features, settings and groundwater links, in: Proceedings of the Royal society of Queensland, 47–63, 2011. a, b, c
Cox, M. E., James, A., Hawke, A., and Raiber, M.: Groundwater Visualisation System (GVS): A software framework for integrated display and interrogation of conceptual hydrogeological models, data and time-series animation, J. Hydrol., 491, 56–72, 2013. a
Crosbie, R., Morrow, D., Cresswell, R., Leaney, F., Lamontagne, S., and Lefournour, M.: New insights to the chemical and isotopic composition of rainfall across Australia, Tech. rep., CSIRO Land and Water, Australia, 2012. a
Davis, S. N., Whittemore, D. O., and Fabryka-Martin, J.: Use of chloride/bromide ratios in studies of portable water, Ground Water, 36, 338–350, 1998. a
Ellerton, D., Rittenour, T., da Silva, G. M., Gontz, A., Shulmeister, J., Hesp, P., Santini, T. C., and Welsh, K. J.: Late-Holocene cliff-top blowout activation and evolution in the Cooloola Sand Mass, south-east Queensland, Australia, Holocene, 28, 1697–1711, 2018. a, b
Farlin, J. and Maloszewski, P.: On the use of spring baseflow recession for a more accurate parameterization of aquifer transit time distribution functions, Hydrol. Earth Syst. Sci., 17, 1825–1831, https://doi.org/10.5194/hess-17-1825-2013, 2013. a
Fritz, S. J., Drimmie, R. J., and Fritz, P.: Characterizing shallow aquifers using tritium and 14C: periodic sampling based on Tritium half-life, Appl. Geochem., 6, 17–33, 1991. a
Han, D., Song, X., Currell, M., and Tsujimura, M.: Using chlorofluorocarbons (CFCs) and tritium to improve conceptual model of groundwater flow in the South Coast Aquifers of Laizhou Bay, China, Hydrol. Process., 26, 3614–3629, 2012. a
Helm, L., Molloy, R., Lennon, L., and Dillon, P.: South East Queensland Opportunity Assessment for Aquifer Storage and Recovery, Mileston Report 3.3.1, CSIRO Water for a Healthy Country Flagship Report – National Water Commission for Raising National Water Standards Project: Facilitating Recycling of Stormwater and Reclaimed Water via Aquifers in Australia, CSCIO Land and Water, Australia, 2009. a
Hofmann, H. and Cartwright, I.: Using hydrogeochemistry to understand inter-aquifer mixing in the on-shore part of the Gippsland Basin, southeast Australia, Appl. Geochem., 33, 84–103, 2013. a, b, c
Hofmann, H., Cartwright, I., and Morgenstern, U.: Estimating retention potential of headwater catchment using Tritium time series, J. Hydrol., 561, 557–572, 2018. a
Hollins, S. E., Hughes, C. E., Crawford, J., Cendón, D. I., and Meredith, K. T.: Rainfall isotope variations over the Australian continent – Implications for hydrology and isoscape applications, Sci. Total Environ., 645, 630–645, 2018. a, b, c
Holt, T., Greskowiak, J., Seibert, S. L., and Massmann, G.: Modeling the evolution of a freshwater lens under highly dynamic conditions on a currently developing barrier island, Geofluids, 15 pp., https://doi.org/10.1155/2019/9484657, 2019. a, b, c
Houben, G. J., Koeniger, P., and Sültenfuss, J.: Freshwater lenses as archive of climate, groundwater recharge, and hydrochemical evolution: Insights from depth-specific water isotope analysis and age determination on the island of Langeoog, Germany, Water Resour. Res., 20, 8227–8239, 2014. a, b, c
Howcroft, W., Cartwright, I., Fifield, L. K., and Cendón, D.: Differences in groundwater and chloride residence times in saline groundwater: The Barwon River Catchment of Southeast Australia, Chem. Geol., 451, 154–168, 2017. a
IAEA – Global Network of Isotopes in Pricipitation: Water Resources Program, available at: http://www-naweb.iaea.org/napc/ih/IHS_resources_gnip.html (last access: January 2019), 2017. a, b, c, d
Jurgens, B. C., Böhlke, J., and Eberts, S. M.: TracerLPM (Version 1): An Excel® Workbook for Interpreting Groundwater Age Distributions from Environmental Tracer Data, Tech. rep., US Geological Survey Water Resources Investigations, Reston, Virginia, USA, 2012. a, b, c, d, e, f
Kelley, R. and Baker, J.: Geological development of North and South Stradbroke Islands and surrounds, in: Focus on Stradbroke, Boorolong Publications, Brisbane, 156–166, 1984. a
Laycock, J. W.: North Stradbroke Island – Hydrogeological Report, in: Proceedings of the Royal Society of Queensland, Australia, 15–19, 1975. a, b, c
Leach, L. M.: Hydrology and physical setting of North Stradbroke Island, in: Proceedings of the Royal Society of Queensland, Australia, 21–46, 2011. a, b, c, d, e, f, g
Leach, L. M. and Gallagher, M.: North Stradbroke Island: 2008 Transient Groundwater Flow Model, Tech. rep., Queensland Department of Natural Resources and Mines, Brisbane, Australia, 2013. a, b, c, d, e
Le Gal La Salle, C., Marlin, C., Leduc, C., Taupin, J., Massault, M., and Favreau, G.: Renewal rate estimation of groundwater based on radioactive tracers (3H, 14C) in an unconfined aquifer in a semi-arid area, Iullemeden Basin, Niger, J. Hydrol., 254, 145–156, 2001. a
Mahlknecht, J., Sanford, W. E., Fichera, M., and Mora, A.: Freshwater-seawater transition in coastal Todos Santos aquifer, Baja California Sur, Energy Proced., 153, 191–195, 2018. a
Mahmoodzadeh, D. and Karamouz, M.: Seawater intrusion in heterogeneous coastal aquifers under flooding events, J. Hydrol., 568, 1118–1130, 2019. a
Maloszewski, P.: Lumped-parameter models as a tool for determining the hydrological parameters of some groundwater systems based on isotope data, in: Tracer and Modelling in Hydrogeology – Proceetings of the TraM'2000 Conference, IAHS Publ. no. 262, Liege, Belgium, 271–276, 2000. a
Maloszewski, P. and Zuber, A.: Determining the turnover time of groundwater systems with the aid of environmental tracers, J. Hydrology, 57, 207–231, 1982. a, b
Marshall, J. C., Negus, P., Steward, A. L., and McGregor, G. B.: Distributions of the freshwater fish and aquatic macroinvertebrates of North Stradbroke Island are differentially influenced by landscape history, marine connectivity and habitat preference, in: Proceedings of the Royal Society of Queensland, Australia, 239–260, 2011. a, b
Masterson, J. P., Fienen, M. N., Thieler, E. R., Gesch, D. B., Gutierrez, B. T., and Plant, N. G.: Effects of sea-level rise on barrier island groundwater system dynamics – Ecohydrological implications, Ecohydrology, 7, 1064–1071, 2014. a, b
Mettam, P., Tibby, J., Barr, C., and Marshall, J. C.: Development of Eighteen Mile Swamp, North Stradbroke Island: A palaeolimnological study, in: Proceedings of the Royal Society of Queensland, Australia, 119–131, 2011. a
Moore, G.: A history of beach mining on North Stradbroke Island, in: Proceedings of the Royal society of Queensland, Australia, 335–345, 2011. a
Moore, L. J., List, J. H., Williams, S. J., and Stolper, D.: Complexities in barrier island response to sea level rise: Insights from numerical model experiments, North Carolina Outer Banks, J. Geophys. Res.-Earth, 115, 1–27, 2010. a, b
Morgenstern, U. and Daughney, C. J.: Groundwater age for identification of baseline groundwater quality and impacts of land-use intensification – The National Groundwater Monitoring Programme of New Zealand, J. Hydrol., 456–457, 79–93, 2012. a, b
Morgenstern, U. and Taylor, C. B.: Ultra low-level tritium measurement using electrolytic enrichment and LSC, Isotop. Environ. Health Stud., 45, 96–117, 2009. a
Morgenstern, U., Stewart, M. K., and Stenger, R.: Dating of streamwater using tritium in a post nuclear bomb pulse world: continuous variation of mean transit time with streamflow, Hydrol. Earth Syst. Sci., 14, 2289–2301, https://doi.org/10.5194/hess-14-2289-2010, 2010. a, b
Neklapilova, B.: Electrolysis and small volume distillation of samples for tritium activity ANSTO internal guideline, Tech. Rep. ENV-I-070-003, ANSTO – Institute for Envrionmental Research, Lucas Heights, Australia, 2008. a
Neuman, S. P.: Trends, prospects and challenges in quantifying flow and transport through fractured rocks, Hydrogeol. J., 13, 124–147, 2005. a
Parizi, E., Hosseini, S. M., Ataie-Ashtiani, B., and Simmons, C. T.: Vulnerability mapping of coastal aquifers to seawater intrusion: Review, development and application, J. Hydrol., 570, 555–573, 2019. a, b, c
Post, V. E., Groen, J., Kooi, H., Person, M., Ge, S., and Edmunds, W. M.: Offshore fresh groundwater reserves as a global phenomenon, Nature, 504, 71–78, 2013a. a
Post, V. E., Vandenbohede, A., Werner, A. D., Maimun, and Teubner, M. D.: Groundwater ages in coastal aquifers, Adv. Water Resour., 57, 1–11, 2013b. a
QSpatial: Queensland – Government – Spatial – Catalogue: QSpatial, available at: http://qldspatial.information.qld.gov.au/catalogue/custom/index.page, last access: January, 2019. a
Queensland – Government – Data: Groundwater Database – Queensland, available at: https://www.data.qld.gov.au/dataset/groundwater-database-queensland (last access: January 2019), 2018. a, b
Rao, A. M. and Charette, M. A.: Benthic nitrogen fixation in an eutrophic estuary affected by groundwater discharge, J. Coast. Res., 28, 477–485, 2012. a
Röper, T., Kröger, K. F., Meyer, H., Sültenfuss, J., Greskowiak, J., and Massmann, G.: Groundwater ages, recharge conditions and hydrochemical evolution of a barrier island freshwater lens (Spiekeroog, Northern Germany), J. Hydrol., 454–455, 173–186, 2012. a, b, c, d
Santoni, S., Huneau, F., Garel, E., Vergnaud-Ayraud, V., Labasque, T., Aquilina, L., Jaunat, J., and Celle-Jeanton, H.: Residence time, mineralization processes and groundwater origin within a carbonate coastal aquifer with a thick unsaturated zone, J. Hydrol., 540, 50–63, 2016. a
Santos, I. R., Dimova, N., Peterson, R. N., Mwashote, B., Chanton, J., and Burnett, W. C.: Estended time series measurements of submarine groundwater discharge tracers (222Rn and CH4) at a coastal site in Florida, Mar. Chem., 113, 137–147, 2009. a
Schneider, J. and Kruse, S.: A comparison of controls on freshwater lens morphology of small carbonate and siliciclastic islands: examples from barrier islands in Florida, USA, J. Hydrol., 284, 253–269, 2003. a
Seibert, S. L., Holt, T., Reckhardt, A., Ahrens, J., Beck, M., Pollmann, T., Giani, L., Waska, H., Böttcher, M. E., Greskowiak, J., and Massmann, G.: Hydrochemical evolution of a freshwater lens below a barrier island (Spiekeroog, Germany): The role of carbonate mineral reactions, cation exchange and redox processes, Appl. Geochem., 92, 196–208, 2018. a, b, c
Stewart, M. K., Morgenstern, U., Gusyev, M. A., and Małoszewski, P.: Aggregation effects on tritium-based mean transit times and young water fractions in spatially heterogeneous catchments and groundwater systems, Hydrol. Earth Syst. Sci., 21, 4615–4627, https://doi.org/10.5194/hess-21-4615-2017, 2017. a
Stieglitz, C., Cook, P. G., and Burnett, W. C.: Inferring coastal processes from regional-scale mapping of 222Radon and salinity: examples from the Great Barrier Reef, Australia, Hydrogeol. J., 101, 544–552, 2010. a, b
Stuyfzand, P. J.: Hydrochemistry and hydrology of the coastal dune daea of the western Netherlands, Diss. Vrije Universiteit of Amsterdam, published by KIWA N.V., PhD thesis, Amsterdam, Netherlands, p. 366, ISBN 90-74741-01-0, 1993. a
Tadros, C. V., Hughes, C. E., Crawford, J., Hollins, S. E., and Chisari, R.: Tritium in Australian precipitation: a 50 year record, J. Hydrol., 513, 262–273, 2014. a, b, c, d
Thompson, C. and Ward, W.: Soil landscapes of North Stradbroke Island, in: Proceedings of the Royal Society of Queensland, Australia, 9–14, 1975. a
Tibby, J., Barr, C., McInerney, F. A., Henderson, A. C. G., Leng, M. J., Greenway, M., Marshall, J. C., McGregor, G. B., Tyler, J. J., and McNeil, V.: Carbon isotope discrimination in leaves of the broad-leaved paperbark tree, Melaleuca quinquenervia, as a tool for quantifying past tropical and subtropical rainfall, Global Change Biol., 22, 3474–3486, 2016. a
Tibby, J., Barr, C., Marshall, J. C., McGregor, G. B., Moss, P. T., Arnold, L. J., Page, T. J., Questiaux, D., Olley, J., Kemp, J., Spooner, N., Petherick, L., Penny, D., Mooney, S., and Moss, E.: Persistence of wetlands on North Stradbroke Island (south-east Queensland, Australia) during the last glacial cycle: implications for Quaternary science and biogeography, J. Quaternary Sci., 32, 770–781, 2017. a, b
Tweed, S. O., Weaver, T. R., and Cartwright, I.: Distinguishing groundwater flow paths in different fractured-rock aquifers using groundwater chemistry: Dandenong Ranges, Southeast Australia, Hydrogeol. J., 13, 771–786, 2005. a
Ulm, S., Petchey, F., and Ross, A.: Marine reservoir corrections for Moreton Bay, Australia, Archaeol. Ocean., 44, 160–166, 2009. a
Voss, C. and Wood, W.: Synthesis of geochemical, isotopic and groundwater modeling analysis to explain regional flow in a coastal aquifer of southern Oahu, Hawaii, in: Mathematical models and their applications to isotope studies in groundwater hydrology, IEAE-TECDOC-777, International atomic energy agency (IAEA), Vienna, Austria, 147–178, 1994. a
White, I. and Falkland, T.: Management of freshwater lenses on small Pacific islands, Hydrogeol. J., 18, 227–246, 2009. a, b
Yechieli, Y., Yokochi, R., Zilberbrand, M., Lu, Z. T., Purtschert, R., Sueltenfuss, J., Jiang, W., Zappala, J., Mueller, P., Bernier, R., Avrahamov, N., Adar, E., Talhami, F., Livshitz, Y., and Burg, A.: Recent seawater intrusion into deep aquifer determined by the radioactive noble-gas isotopes 81Kr and 39Ar, Earth Planet. Sc. Lett., 507, 21–29, 2019. a
Zuber, A., Witczak, S., Rózański, K., Śliwka, I., Opaka, M., Mochalski, P., Kuc, T., Karlikowska, J., Kania, J., Jackowicz-Korczyński, M., and Duliński, M.: Groundwater dating with 3H and SF6 in relation to mixing patterns, transport modelling and hydrochemistry, Hydrol. Process., 19, 2247–2275, 2005. a