the Creative Commons Attribution 4.0 License.
the Creative Commons Attribution 4.0 License.
 | 08 Jan 2019
Exploring the use of underground gravity monitoring to evaluate radar estimates of heavy rainfall
Laurent Delobbe
Arnaud Watlet
Svenja Wilfert
Michel Van Camp
The radar-based estimation of intense precipitation produced by convective storms is a challenging task and the verification through comparison with gauges is questionable due to the very high spatial variability of such types of precipitation. In this study, we explore the potential benefit of using a superconducting gravimeter as a new source of in situ observations for the evaluation of radar-based precipitation estimates. The superconducting gravimeter used in this study is installed in Membach (BE), 48 m underneath the surface, at 85 km distance from a C-band weather radar located in Wideumont (BE). The 15-year observation record 2003–2017 is available for both gravimeter and radar with 1 and 5 min time steps, respectively. Water mass increase at ground due to precipitation results in a decrease in underground measured gravity. The gravimeter integrates soil water in a radius of about 400 m around the instrument. This allows capture of rainfall at a larger spatial scale than traditional rain gauges. The precision of the gravimeter is a few tenths of nm s−2, 1 nm s−2 corresponding to 2.6 mm of water. The comparison of reflectivity and gravity time series shows that short-duration intense rainfall events produce a rapid decrease in the underground measured gravity. A remarkable correspondence between radar and gravimeter time series is found. The precipitation amounts derived from gravity measurements and from radar observations are further compared for 505 rainfall events. A correlation coefficient of 0.58, a mean bias (radar–gravimeter)/gravimeter of 0.24 and a mean absolute difference (MAD) of 3.19 mm are obtained. A better agreement is reached when applying a hail correction by truncating reflectivity values to a given threshold. No bias, a correlation coefficient of 0.64 and a MAD of 2.3 mm are reached using a 48 dBZ threshold. The added value of underground gravity measurements as a verification dataset is discussed. The two main benefits are the spatial scale at which precipitation is captured and the interesting property that gravity measurements are directly influenced by water mass at ground no matter the type of precipitation: hail or rain.
- Article
(3478 KB) - Full-text XML
-
Supplement
(5106 KB) - BibTeX
- EndNote


Weather radars are recognized as invaluable instruments for observing precipitation in the atmosphere. This is particularly true for precipitation fields exhibiting small-scale patterns that cannot be easily captured by rain gauge networks. Due to their high spatial and temporal resolutions, radar observations are crucial for the monitoring of such types of precipitation. However, radars only produce indirect rainfall estimates at ground derived from reflectivity measurements at several altitudes in the atmosphere. Rainfall intensities and amounts derived from radar observations are subject to numerous sources of uncertainties (e.g., Villarini and Krajewski, 2010; Berne and Krajewski, 2013). An evaluation of the quality of these estimations based on verification datasets is therefore required. The verification of radar-based rainfall estimates is traditionally performed using rain gauge measurements. At a given location gauge measurements are relatively accurate but, unfortunately, not representative of a very large area due the high spatial variability of precipitation. Due to the limited network density, precipitation is only poorly monitored by rain gauges (Kidd et al., 2017). This poor representation is particularly marked for short-duration and local precipitation produced by convective storms (e.g., Schroeer et al., 2018). The lack of appropriate in situ observations for verification purposes concerns not only ground-based radar-derived precipitation, but also satellite precipitation products (e.g., Sun et al., 2018). As mentioned in, e.g., Puca et al. (2014), representativeness errors are introduced when comparing areal instantaneous data from satellites with point-scale cumulated values from rain gauges. Similar challenges can be encountered for the validation of data from non-traditional sources like path-averaged precipitation from microwave links of cellular communication networks (Messer et al., 2006; Leijnse et al., 2007). A synthesis of future approaches for observing hydrological variables, including precipitation, is presented in McCabe et al. (2017). The next decades will undoubtedly bring major advances in the observation of precipitation. The authors stress the importance of in situ observations to support this progress by allowing the verification of rainfall inferred from new types of sensors and retrieval methods.
Some of the errors affecting radar precipitation estimates can be very large for heavy precipitation produced by convective storms. For example, the conversion between radar reflectivity (Z) and rainfall intensity (R) is very uncertain in convective storms since the drop size distribution is extremely variable (e.g., Battan, 1973; Lee and Zawadzki, 2005). Besides, convective storms can produce precipitation in the form of hail, inducing a strong overestimation of radar-derived rainfall using commonly used Z–R relationships (Austin, 1987). Attenuation effects can also be particularly marked when intense rainfall is present between the radar and the location of interest (e.g., Delrieu et al., 2000). This is mostly the case for C-band and X-band radars, S-band radars being less affected by attenuation effects. The temporal sampling, which is generally 5 min, is also a limiting factor in the case of fast-moving small-scale rainfall structures (Fabry et al., 1994).
While uncertainties are large, the traditional approach for the validation of radar-derived rainfall based on comparison with gauges is particularly questionable in the case of convective precipitation. The difference of spatial representativeness between radar and gauge observations is indeed particularly problematic due to the large spatial variability of such types of precipitation. A radar measurement is representative of a sample volume whose size increases with the distance to the radar. For a typical C-band weather radar with a 1 ∘ resolution in azimuth and a range bin of 250 m size, the projected area at ground lies between 0.04 km2 at 10 km distance and 1 km2 at 250 km. In contrast, a rain gauge collects precipitation over an interception area ranging from 100 to 500 cm2 (Kidd et al., 2017). The radar sampling area is at least 1 million times as large as a gauge sampling area.
As we have seen, the estimation and evaluation of extreme precipitation produced by convective storms is particularly challenging. In the context of a changing climate with an expected impact on the frequency of extreme rainfall (e.g., Ban et al., 2015; De Troch et al., 2013; Prein et al., 2016), an accurate long-term monitoring of such types of precipitation is essential. Unfortunately, appropriate datasets are only poorly available for the verification of heavy convective rainfall. Given the societal impact of heavy rainfall, it is necessary to explore alternative methods for evaluating radar-derived rainfall estimates based on new sources of independent rainfall observations.
In this study, we explore the use of underground gravity measurements for this purpose. At the Earth's surface, gravity (g) results from the attraction of the Earth, the Moon, the Sun and the centrifugal effects of the Earth's rotation. When measuring the temporal variations of the gravity field at a single location, three physical phenomena predominate in the signal: tides, atmospheric loading and polar motion of the Earth. Today, such tidal and polar motion effects can be easily removed from gravity measurements. State-of-the-art gravimeters are precise to better than the nm s−2 level (10−10g). At such a level, terrestrial gravimetric techniques allow monitoring of local changes in the gravitational field associated with the variation of water masses present at the Earth's surface. This results in the possibility of studying local hydrological effects (Creutzfeldt et al., 2010a; Naujoks et al., 2010), at a scale of up to 1 km2, for signal ranging less than 1 nm s−2 to a few thousands of nm s−2 (Van Camp et al., 2017a). In the last 2 decades, gravity monitoring has been increasingly used to study diverse kinds of hydrological processes such as soil moisture, rainfall, groundwater storage, hydrothermalism, or snow covering (Creutzfeldt et al., 2014; Hector et al., 2015; Hemmings et al., 2016; Imanishi et al., 2006; Jacob et al., 2008; Pool and Eychaner, 1995; Van Camp et al., 2006b, 2016; Wilson et al., 2012). Surface instruments housed in buildings are often poorly sensitive to rainfall as an umbrella effect limits the infiltration of rainwater into the ground in the area beneath the gravimeter (Creutzfeldt et al., 2010b; Deville et al., 2013). However, underground gravimeters are directly influenced by rainfall; in particular, intense rainfall events are clearly detected in gravity measurements (Meurers et al., 2007; Van Camp et al., 2006a). Indeed, the increase in water mass at ground caused by precipitation results in a decrease in the underground measured gravity. As long as rain or hail is in the atmosphere, its effect on gravity is corrected based on local air pressure measurement (see Sect. 2.1). In contrast, water mass on ground has a direct impact on the measured gravity. For short-duration rainfall events, we expect that hydro-meteorological processes like runoff, infiltration and evapotranspiration will play a minor role and that gravity variations during the event will be strongly related to rainfall amounts. Another major advantage of underground gravity measurement is the spatial scale which is much closer to the spatial scale of radar observations than gauges: 90 % of the gravity signal caused by hydrological processes take place in a conic volume of radius r and height z, where r=9.95z (Singh, 1977). An underground superconducting gravimeter was installed in 1995 at Membach, eastern Belgium (Van Camp et al., 2017b). This gravimeter lies 48 m below the surface, which means that 90 % of the gravity effect of rainfall is caused by water present within a radius of about 400 m around the gravimeter. This differs slightly from the r=9.95z relationship given the local topography (see supporting information in Van Camp et al., 2016). Another advantage of gravimeter observation of precipitation is that it is not affected by the type of precipitation: rain, hail or snow. Gravity effects of precipitation are directly related to water mass.
Since 2002, concomitant time series of superconducting gravimeter and weather radar measurements have been available in Membach, allowing us to explore the link between gravity and rainfall over 15 years. The goal of the present study is to use these time series (1) to identify and characterize the signature of intense rainfall events in gravity measurements and (2) to investigate the potential of gravimeters for evaluating the quality of radar-derived rainfall estimates. The radar and gravimeter data and the methods for deriving rainfall from these data are described in the next section. In Sect. 3, we show that a rainfall signal is clearly visible in gravity time series and we compare radar-derived and gravity-derived rainfall amounts for a large selection of short-duration intense rainfall events. Conclusions are presented in the last section.
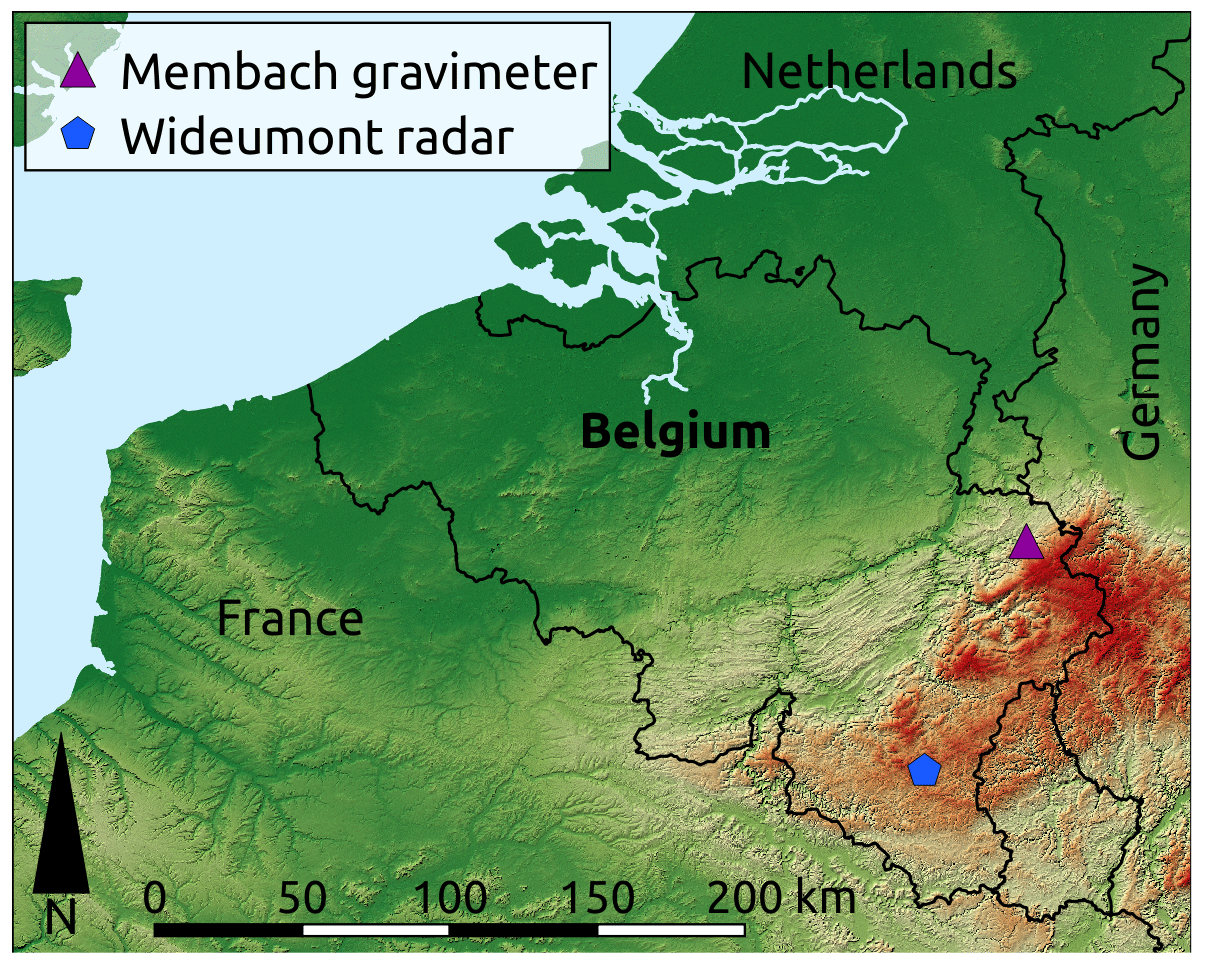
The data used in this study are produced by the Wideumont weather radar (49.9135∘ N, 5.5044∘ E) and the superconducting gravimeter (SG) GWR#C021 installed in 1995 at Membach (50.6085∘ N, 6.0095∘ E) (Van Camp et al., 2017b). The distance between Wideumont and Membach is 85.268 km (Fig. 1).
2.1 Gravimeter data
The fundamental component of a superconducting gravimeter, also called the cryogenic gravimeter, consists of a hollow superconducting sphere that levitates in a persistent magnetic field generated by currents in a pair of superconducting coils (Goodkind, 1999; Hinderer et al., 2015). The superconducting property of zero resistance allows the currents that produce the magnetic field to flow forever without any resistive loss. Superconductivity is obtained by immersing the sensing unit in a liquid helium bath at 4 K (269 ∘C).
A change in gravity induces a vertical force on the sphere. As in modern spring gravimeters, the mass is kept at a constant position by injecting a current in an auxiliary feedback coil. Current SGs have a power spectral density noise level ranging typically from 1 to 20 (nm s−2)2 Hz−1, which means that they are able to detect temporal gravity changes ranging from 0.1 to 0.4 nm s−2 (or from 10 to 30 nGal) within 1 min (Fores et al., 2017; Rosat and Hinderer, 2011; Van Camp et al., 2005). When averaged over 5 min, the precision is around 0.1–0.2 nm s−2. This corresponds to 0.25–0.5 mm of water and represents the lowest level resolved by SGs in quiet conditions (low macroseismic noise, no earthquakes, stable atmospheric conditions, and, of course, no rainfall). The weak instrumental drift of the SG, about 10 nm s−2 yr−1, is corrected using repeated absolute gravity measurements (Van Camp et al., 2017a). In this study, solid Earth and ocean loading effects were removed by computing tidal parameter sets using the ETERNA package (Wenzel, 1996) on the gravity time series extending from 1 June 2004 to 3 January 2015 (3825.75 record days). The tidal potential is the Hartmann–Wenzel (Hartmann and Wenzel, 1995) catalog with 7761 waves. The adjusted tidal parameters make it possible to compute a tidal signal, which includes both the solid Earth tide and ocean loading effects. The atmospheric mass also affects the gravity, by both the direct Newtonian attraction of air masses above the instrument and the loading of the crust. It is negative because the Newtonian effect dominates the process. Atmospheric effects were corrected by using a linear admittance factor also provided in the ETERNA package. It amounts to −3.3 nm s−2 hPa−1 (Merriam, 1992), which means that a change of 1 hPa induces the same gravity change as 8.5 mm of rainfall (see Sect. 2.3). The local air pressure recording and a single admittance factor allow correction for about 90 % of the atmospheric effects (Boy, 2005; Boy et al., 2002, 2009; Hinderer et al., 2014; Klügel and Wziontek, 2009; Merriam, 1992). However, this factor is frequency-dependent due to the spatial–temporal characteristics of pressure variations (Crossley et al., 2005; Wahr, 1985). Indeed, pressure fluctuations at short timescales are local, and the impact on the gravity differs from the impact resulting from slow pressure variations related to synoptic weather changes. At Membach, for the period ranging from 2005 to 2015, the coefficient decreases on average from −3.3 nm s−2 hPa−1 at one cycle per day (cpd) to −3.8 nm s−2 hPa−1 at 10 cpd, and then increases again to −3.3 nm s−2 hPa−1 at 36 cpd. Unfortunately, these values vary in time too, such that it is not possible to evaluate a frequency- and time-dependent admittance. Hence we use in this study the admittance factor of −3.3 nm s−2 hPa−1 classically used at the Membach site. The time variation of the admittance factor is much less than the variation with frequency. This implies that fluctuations in this factor are at the 15 % level at worst. Consequently, the error in the correction of a 1 hPa pressure change is limited to 0.5 nm s−2, or 1.3 mm of water.
The centrifugal effect associated with polar motion is also corrected (Wahr, 1985). The remaining gravity signal is usually called “residual”. The residuals are corrected for undesirable elements such as gaps, steps, or spikes, essentially caused by maintenance and earthquakes (Hinderer et al., 2015). In the end of the processing chain, gravity residuals mainly include the mixed effects of hydrological processes (both local and continental) and remaining tide and atmospheric pressure effects, which have not been perfectly corrected. Continental hydrological effects are at the seasonal scale and can be removed if needed using global hydrological models (e.g., Mikolaj et al., 2015). Conversely, local hydrological effects are at a much higher frequency, up to the rain event scale (Meurers et al., 2007). The seasonal variations in the gravity signal are not of any concern when studying gravity variations at such a high frequency, which is the purpose of our study. The sampling rate is 60 s, after decimating and applying an anti-aliasing filter to the original 10 s sampled data. In this study, precipitation amounts are derived from gravimeter data averaged over 5 min. The power spectral density of the SG at Membach station is at the level of 20 (nm s−2)2 Hz−1, which corresponds to a precision of 0.2 nm s−2 at a period of 300 s (Van Camp et al., 2005).
2.2 Radar data
The radar data used in this study have been produced by a C-band Doppler weather radar operated since 2002 by the Royal Meteorological Institute of Belgium and located in Wideumont in the southeast of Belgium. The radar is exploited for operational weather service, but the observations have also been used in numerous research studies in meteorology, hydrology and ornithology (e.g., Goudenhoofdt et al., 2017; Dokter et al., 2011; Foresti et al., 2016). The radar antenna is installed on top of a 50 m tower. The surroundings are lower than the antenna and the beam blockage in the direction of Membach is extremely limited. Until 2015, the radar scanning strategy included a 5-elevation reflectivity scan every 5 min and a 10-elevation reflectivity scan every 15 min. Rainfall estimates were derived from the 5 min scan and hail detection was based on the 15 min scan. The scanning strategy changed in December 2015. Ever since, rainfall and hail products have been inferred from a single full scan including 14 elevations every 5 min. The scanning was originally performed bottom–up, but it changed to top–down in 2015. It means that the lowest elevation rotation was first performed at the beginning of the 5 min cycle, while it is now at the end of the 5 min cycle. The exact timestamp is used when comparing the 5 or 15 min radar observations with the 1 min gravity measurements.
The radar beam width is 1∘ and the pulse length is 0.8 µs. The 5 min scan produces reflectivity data with a 1∘ resolution in azimuth and a 250 m resolution in range. At 85 km distance, the main lobe is 1.48 km wide and the sample volume is 0.43 km3. The projected area at ground is 0.37 km2 large, which is comparable to the 0.5 km2 gravimeter sensitivity area. A Doppler filtering is applied to remove ground echoes. In this study, the reflectivity data above Membach from the lowest radar beam at 0.3∘ elevation are used. The height of these measurements is 1465 m a.s.l., which means 1171 m above ground level. It must be kept in mind that the radar measures instantaneous reflectivity at 5 min time intervals. Reflectivity (Z) data are converted into instantaneous rain rates (R) and rainfall amounts are further estimated through temporal integration. A hail detection method based on the Waldvogel method (Waldvogel et al., 1979; Delobbe and Holleman, 2006) was used in this study to select severe convective events. The probability of hail is derived from the vertical profile of reflectivity and the freezing level.
2.3 Rainfall amounts from radar and gravimeter
Radar reflectivity values are converted into rain rates using the Marshall–Palmer (MP) relation, Z=200R1.6, which is the most commonly used Z–R relation (Marshall et al., 1955). The rainfall amount over 5 min (between −2.5 and +2.5 min) is evaluated assuming that the rain rate is constant within that period of time. The cumulative rainfall is evaluated by summing the 5 min amounts. Cumulative rainfall is estimated from gravity measurements using the admittance factor of −0.39 nm s−2 mm−1 computed using a 1 m resolution digital elevation model (Van Camp et al., 2016), based on lidar data of the Public Service of Wallonia. It means that a gravity change of 1 nm s−2 (10−10g) is produced by a 2.59 mm rainfall amount. Considering a precision of 0.2 nm s−2, the lowest measurable rainfall amount is 0.5 mm. Assuming that gravity changes are only due to precipitation, the amount of precipitation can be evaluated by the gravity difference between two timestamps. Precipitation at ground produces a decrease in underground gravity. Gravity variations are also produced by other processes like evapotranspiration, infiltration and runoff, but we assume that, during the rainfall event, these effects are small with respect to the direct impact of rainfall at ground. Intense rainfall events considered in this study occur over timescales of minutes, while evapotranspiration occurs typically at diurnal timescales, typically 2–3 mm day−1 during sunny summer days (Van Camp et al., 2016), and infiltration at timescales of hours. Characteristic timescales of runoff are more difficult to quantify and depend on the status of the soil saturation. Runoff is probably the predominant process affecting gravity at timescales close to those of precipitation. However, we find in most cases that gravity does not substantially and rapidly increase after the rainfall events analyzed here, which suggests that runoff is slower than the investigated precipitation process.
Small fluctuations at very short timescales (a few minutes) not related to precipitation are present in the gravity time series. This is due to uncorrected atmospheric pressure effects, permanent hum of the Earth (Nawa et al., 1998), and, to a much smaller extent, instrumental influences. In order to match radar data, a 5 min temporal averaging of the gravity measurements is applied for evaluating rainfall from gravity time series. This 5 min averaging allows reduction of the impact of the small gravity fluctuations not related to precipitation. The gravity change corresponding to a given radar reflectivity measurement at time t is taken as the difference between the mean gravity in the time intervals [t+2.5, t+7.5] and [t−7.5, t−2.5] expressed in minutes. For a full rainfall episode, which can last from a few minutes to a few hours, the associated gravity jump is calculated similarly based on the 5 min gravity means before and after the episode. Averaging the gravity over a longer time period, for example 1 h, would allow a better removal of the small fluctuations not induced by precipitation. However, this would incorporate various effects that are not directly related to precipitation, like groundwater processes.
The radar timestamp is taken not as the beginning or the end of the 5 min volume scan, but as the time when the lowest radar sweep is located above Membach station. The change in scanning strategy in December 2015, from bottom–up to top–down, is taken into account. A shift of the actual timestamp by 4 min is considered with respect to the nominal timestamp. Indeed, when the volume scanning of the atmosphere is performed starting from the highest elevation angle, 4 min are approximately necessary to reach the lowest elevation angle after 13 antenna rotations.
2.4 Data selection and rainfall events
The data selection is based on radar observations within the period 2003–2017. Less than 3 % of radar observations are missing within that period. A first explorative dataset was produced by selecting days with severe convective precipitation. Severe convective storms can produce hail and, therefore, the selection was based on the radar-based hail detection. All days where the maximum probability of hail along the day exceeded 50 % at Membach station were selected. This dataset includes 15 days for the whole time period. Such a small number of days is not surprising since, as shown in Lukach et al. (2017), the frequency of hail at a given location in Belgium is around one event per year. Among these 15 days, gravity data are available for 14 days as a power outage caused by a lightning discharge made the SG data unavailable during the 9 June 2007 event. For these 14 days, the 5 min radar reflectivity time series and the 1 min gravity measurements were extracted and compared. In a second stage, a more extended radar dataset was extracted based on radar reflectivity data only. All days where the maximum reflectivity along the day exceeds a given reflectivity threshold are extracted. For a reflectivity threshold of 40 dBZ (=11 mm h−1 using MP), 408 days are extracted. Each day includes 288 data files, which represents more than 117 000 reflectivity measurements above Membach station. No selection was performed based on attenuation effects between the radar and the location of interest. It means that rainfall underestimations are possible when heavy rain or hail is present in the corresponding radial.
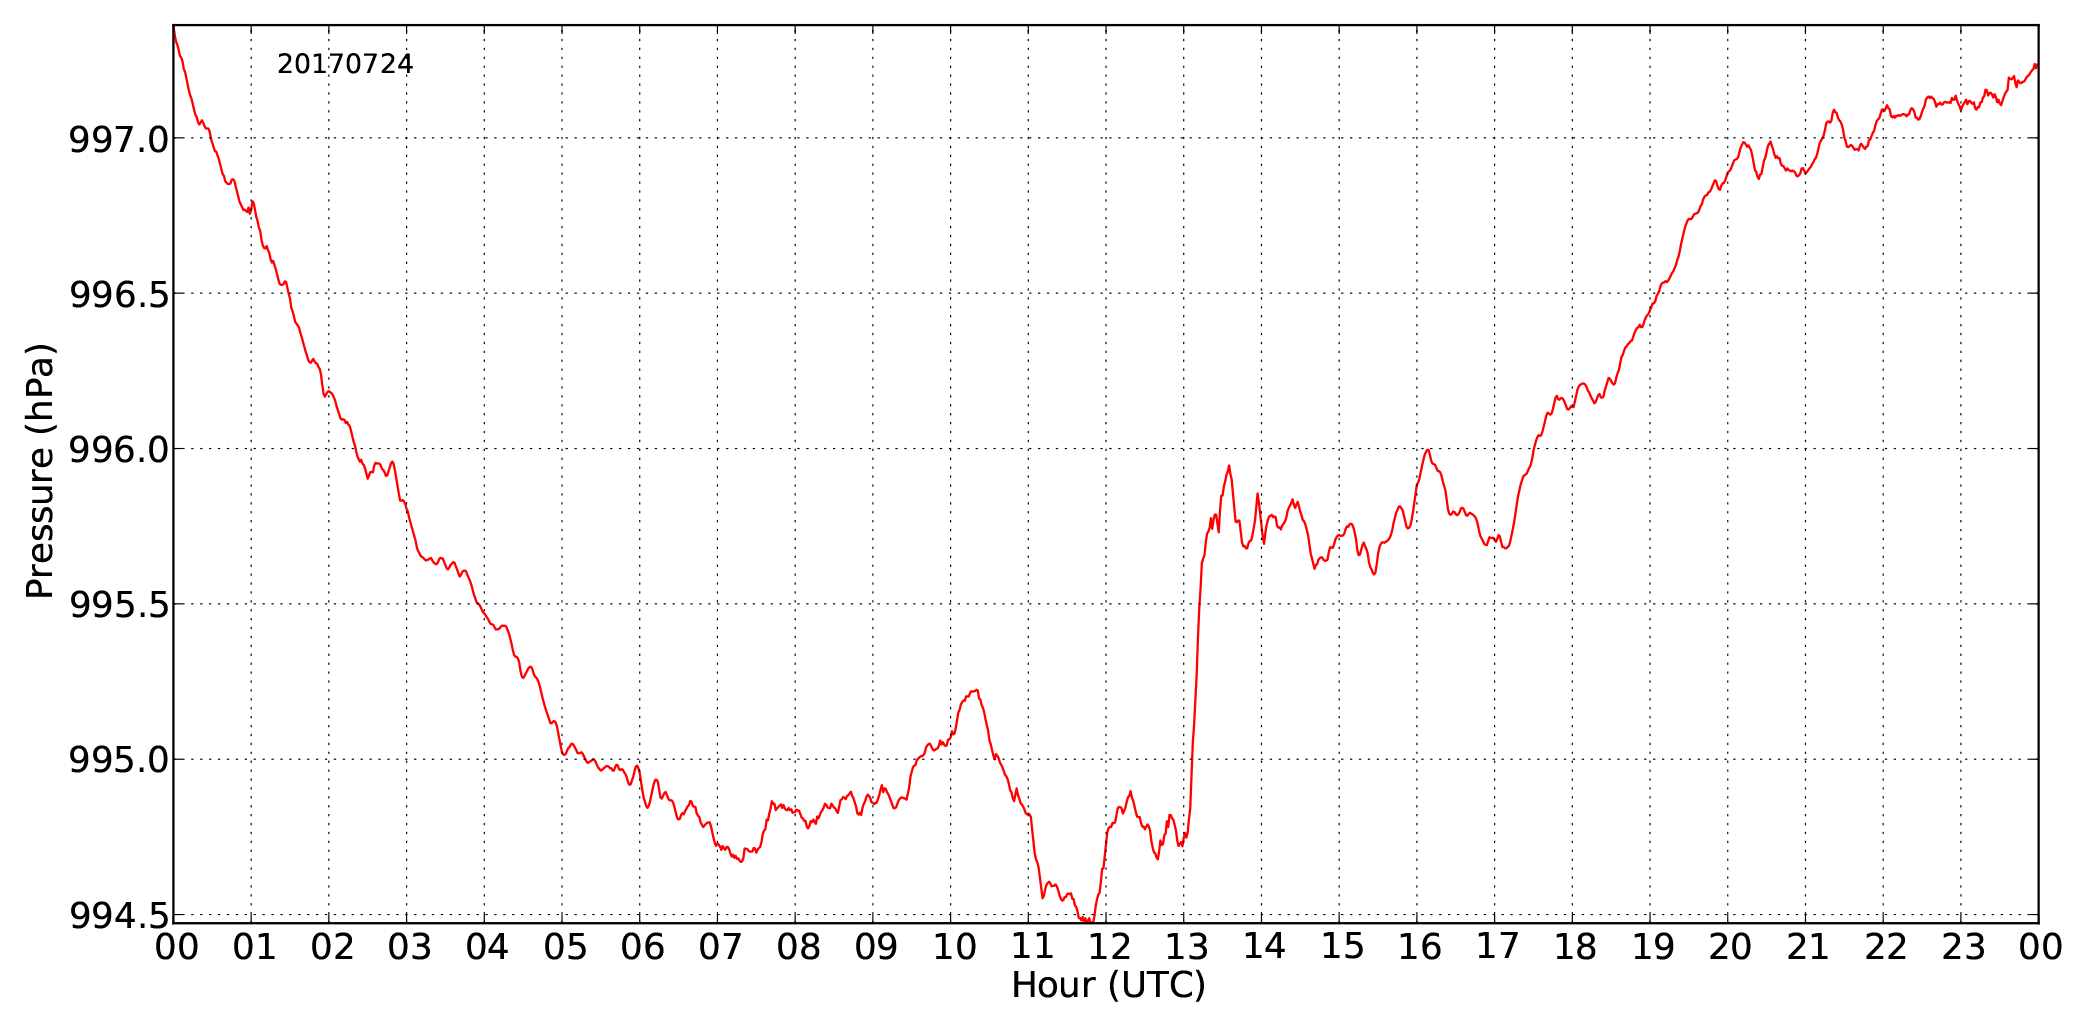
The 14 convective days from the reduced dataset were used to get a first insight into the correspondence between gravity and reflectivity time series in case of very intense convective precipitation. The gravity and reflectivity time series for one of these days (24 July 2017) are shown in Fig. 2. Several reflectivity peaks can be identified and the largest peaks are clearly associated with gravity changes. The two highest peaks are observed between 13:00 and 14:00 UTC and the corresponding 1 h gravity jump exceeds 4 nm s−2. The reflectivity values are further converted into rain rates and cumulative rainfall along the day. Cumulative rainfall is also estimated from gravity measurements using the admittance factor. The radar-derived rain rates and the radar- and gravimeter-derived cumulative rainfall are shown in Fig. 2 as well. A very good agreement is found between the time series. Similar figures for all days are gathered in a Supplement to this paper. Figure 2 shows that the relation between radar reflectivity expressed in dBZ and rain rate is highly nonlinear. Only very high reflectivity values correspond to heavy rainfall. A remarkable correspondence between the temporal evolution of radar and gravity measurements is generally found. The evolution of the atmospheric pressure at ground level along the day is shown in Fig. 3. The peaks in reflectivity and the corresponding gravity change between 13:00 and 14:00 UTC are associated with a 1 hPa pressure change. Considering an error of 15 % in the correction process, this means a maximum uncertainty of 0.5 nm s−2, equivalent to 1.3 mm of water. As shown later in this section, the pressure change during the events generally does not exceed 1 hPa. The error on the pressure correction for such variation is 0.5 nm s−2. The error resulting from the instrument and from the pressure correction can be estimated by adding in quadrature the 0.2 and 0.5 nm s−2 values. A typical error of 0.54 nm s−2 is obtained. This error is plotted in Fig. 2 as a grey area around the gravity time series. In the gravity-derived cumulative rainfall, an error of 1.4 mm is plotted, as obtained using the −0.39 nm s−2 mm−1 admittance factor.
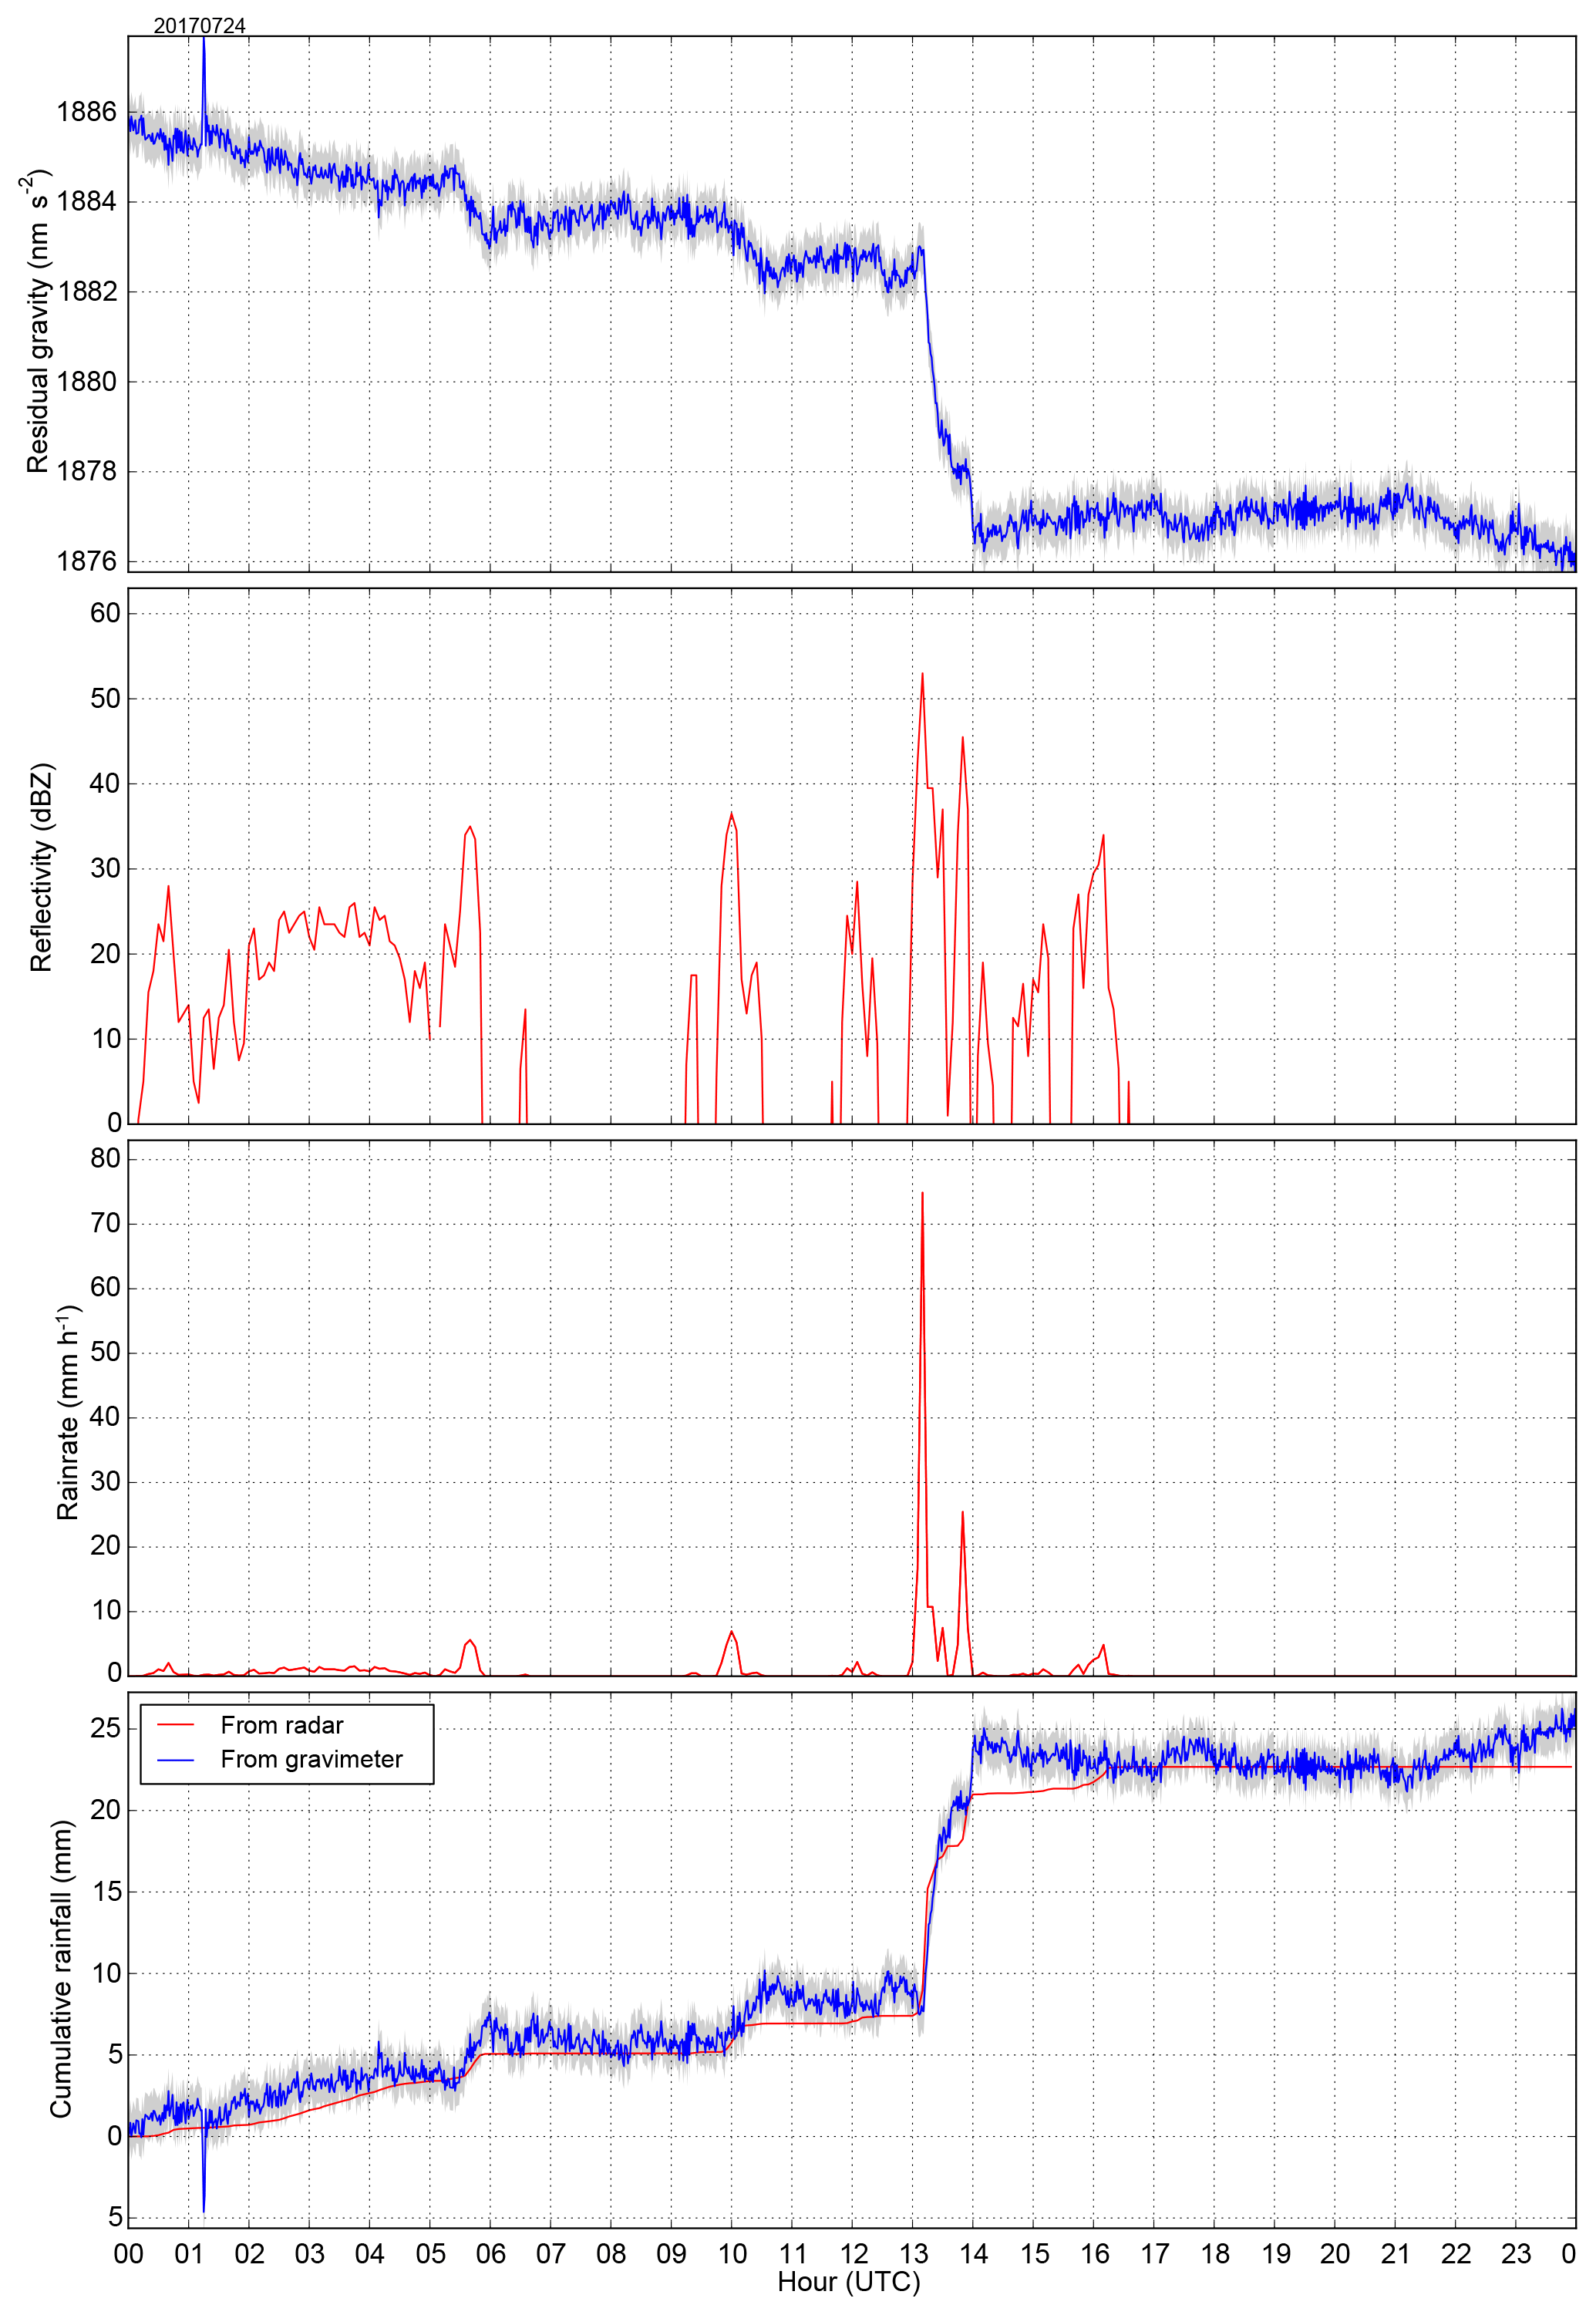
Figure 2Time series for 24 July 2017 00:00–24:00 UTC: residual gravity (nm s−2), radar reflectivity (dBZ), radar-derived rainfall rate (mm h−1) and cumulative rainfall (mm) derived from gravity and radar.
Figure 4 shows a scatter plot of the 5 min gravity change corresponding to all reflectivity data measured during the 14 selected days; 14×288 reflectivity measurements are included and, for each measurement, the gravity change is taken as the difference between the 5 min gravity mean before and after the measurement as described in the previous section. The measured 5 min pressure change is used to estimate the error on the pressure correction. It is combined with the instrumental error (0.2 nm s−2) and plotted as the error margin. Most of the observed reflectivity values are less than 30 dBZ and do not show any signature in the gravity data. The 5 min variability of gravity in dry periods or in very light precipitation (less than 10 dBZ) is around 1 nm s−2. Some signal is present for reflectivity larger than 30 dBZ and a clear effect of precipitation is observed when the reflectivity exceeds 40 dBZ, which corresponds to a rain rate of 11 mm h−1, a 5 min rainfall amount of 0.9 mm using the MP relation, and a theoretical gravity change of 0.35 nm s−2.
Even with very high reflectivity values, the 5 min rainfall amount remains relatively small. For example, a 55 dBZ value gives a 100 mm h−1 rain rate (using MP) and a resulting 5 min accumulation of 8.3 mm corresponding to a theoretical gravity change of 3.2 nm s−2. In order to better evaluate gravity changes produced by large rainfall amounts it is interesting to analyze a large number of rainfall events and to include events extending over several radar time steps. The extended dataset including 408 days with reflectivity larger than 40 dBZ above Membach is used for that purpose. Some of these days include more than one rainfall episode. In order to isolate intense rainfall events, consecutive measurements at least equal to 40 dBZ are grouped together to define one single rainfall event. When the time interval between successive events does not exceed 20 min, these events are regrouped as the same event. Using this procedure, we identify 563 intense rainfall events. Among these events, 31 were removed since the gravity data were affected by a power outage and 26 others removed since the data are perturbed by an earthquake. An example of an earthquake can be seen on 14 June 2006 around 05:00 UTC (magnitude = 6.0, Aleutian Islands; see Fig. 8 further in this section). In that particular case, the earthquake clearly occurs outside the rainy period and, therefore, the event is not eliminated.

Figure 4The 5 min gravity change as a function of radar reflectivity based on 14 days with heavy rainfall. The errors bars show the errors caused by instrumental errors and correction of pressure effects.
Frequency distributions of event duration, pressure change and rainfall amounts characterizing the collection of the 506 remaining events are shown in Fig. 5. For the rainfall amount, the frequency distribution is shown with two different frequency ranges. Almost all events have durations less than 1 h and the radar-based rainfall amount is less than 10 mm in most cases. The atmospheric pressure change is determined following the same method as the gravity change. It is the difference between the 5 min mean pressure after and before the rainfall event. Even if rapid pressure changes can be observed within an intense convective precipitation event, it appears that the atmospheric pressure before and after does not differ by more than 1 hPa in 95 % of the cases. The mean and standard deviation of the absolute pressure difference are 0.32 and 0.38 hPa, respectively. Considering an uncertainty of 15 % on the admittance, a 1 hPa pressure change represents a maximal error of 0.5 nm s−2 on the precipitation-induced gravity variation, which is equivalent to 1.3 mm of water.
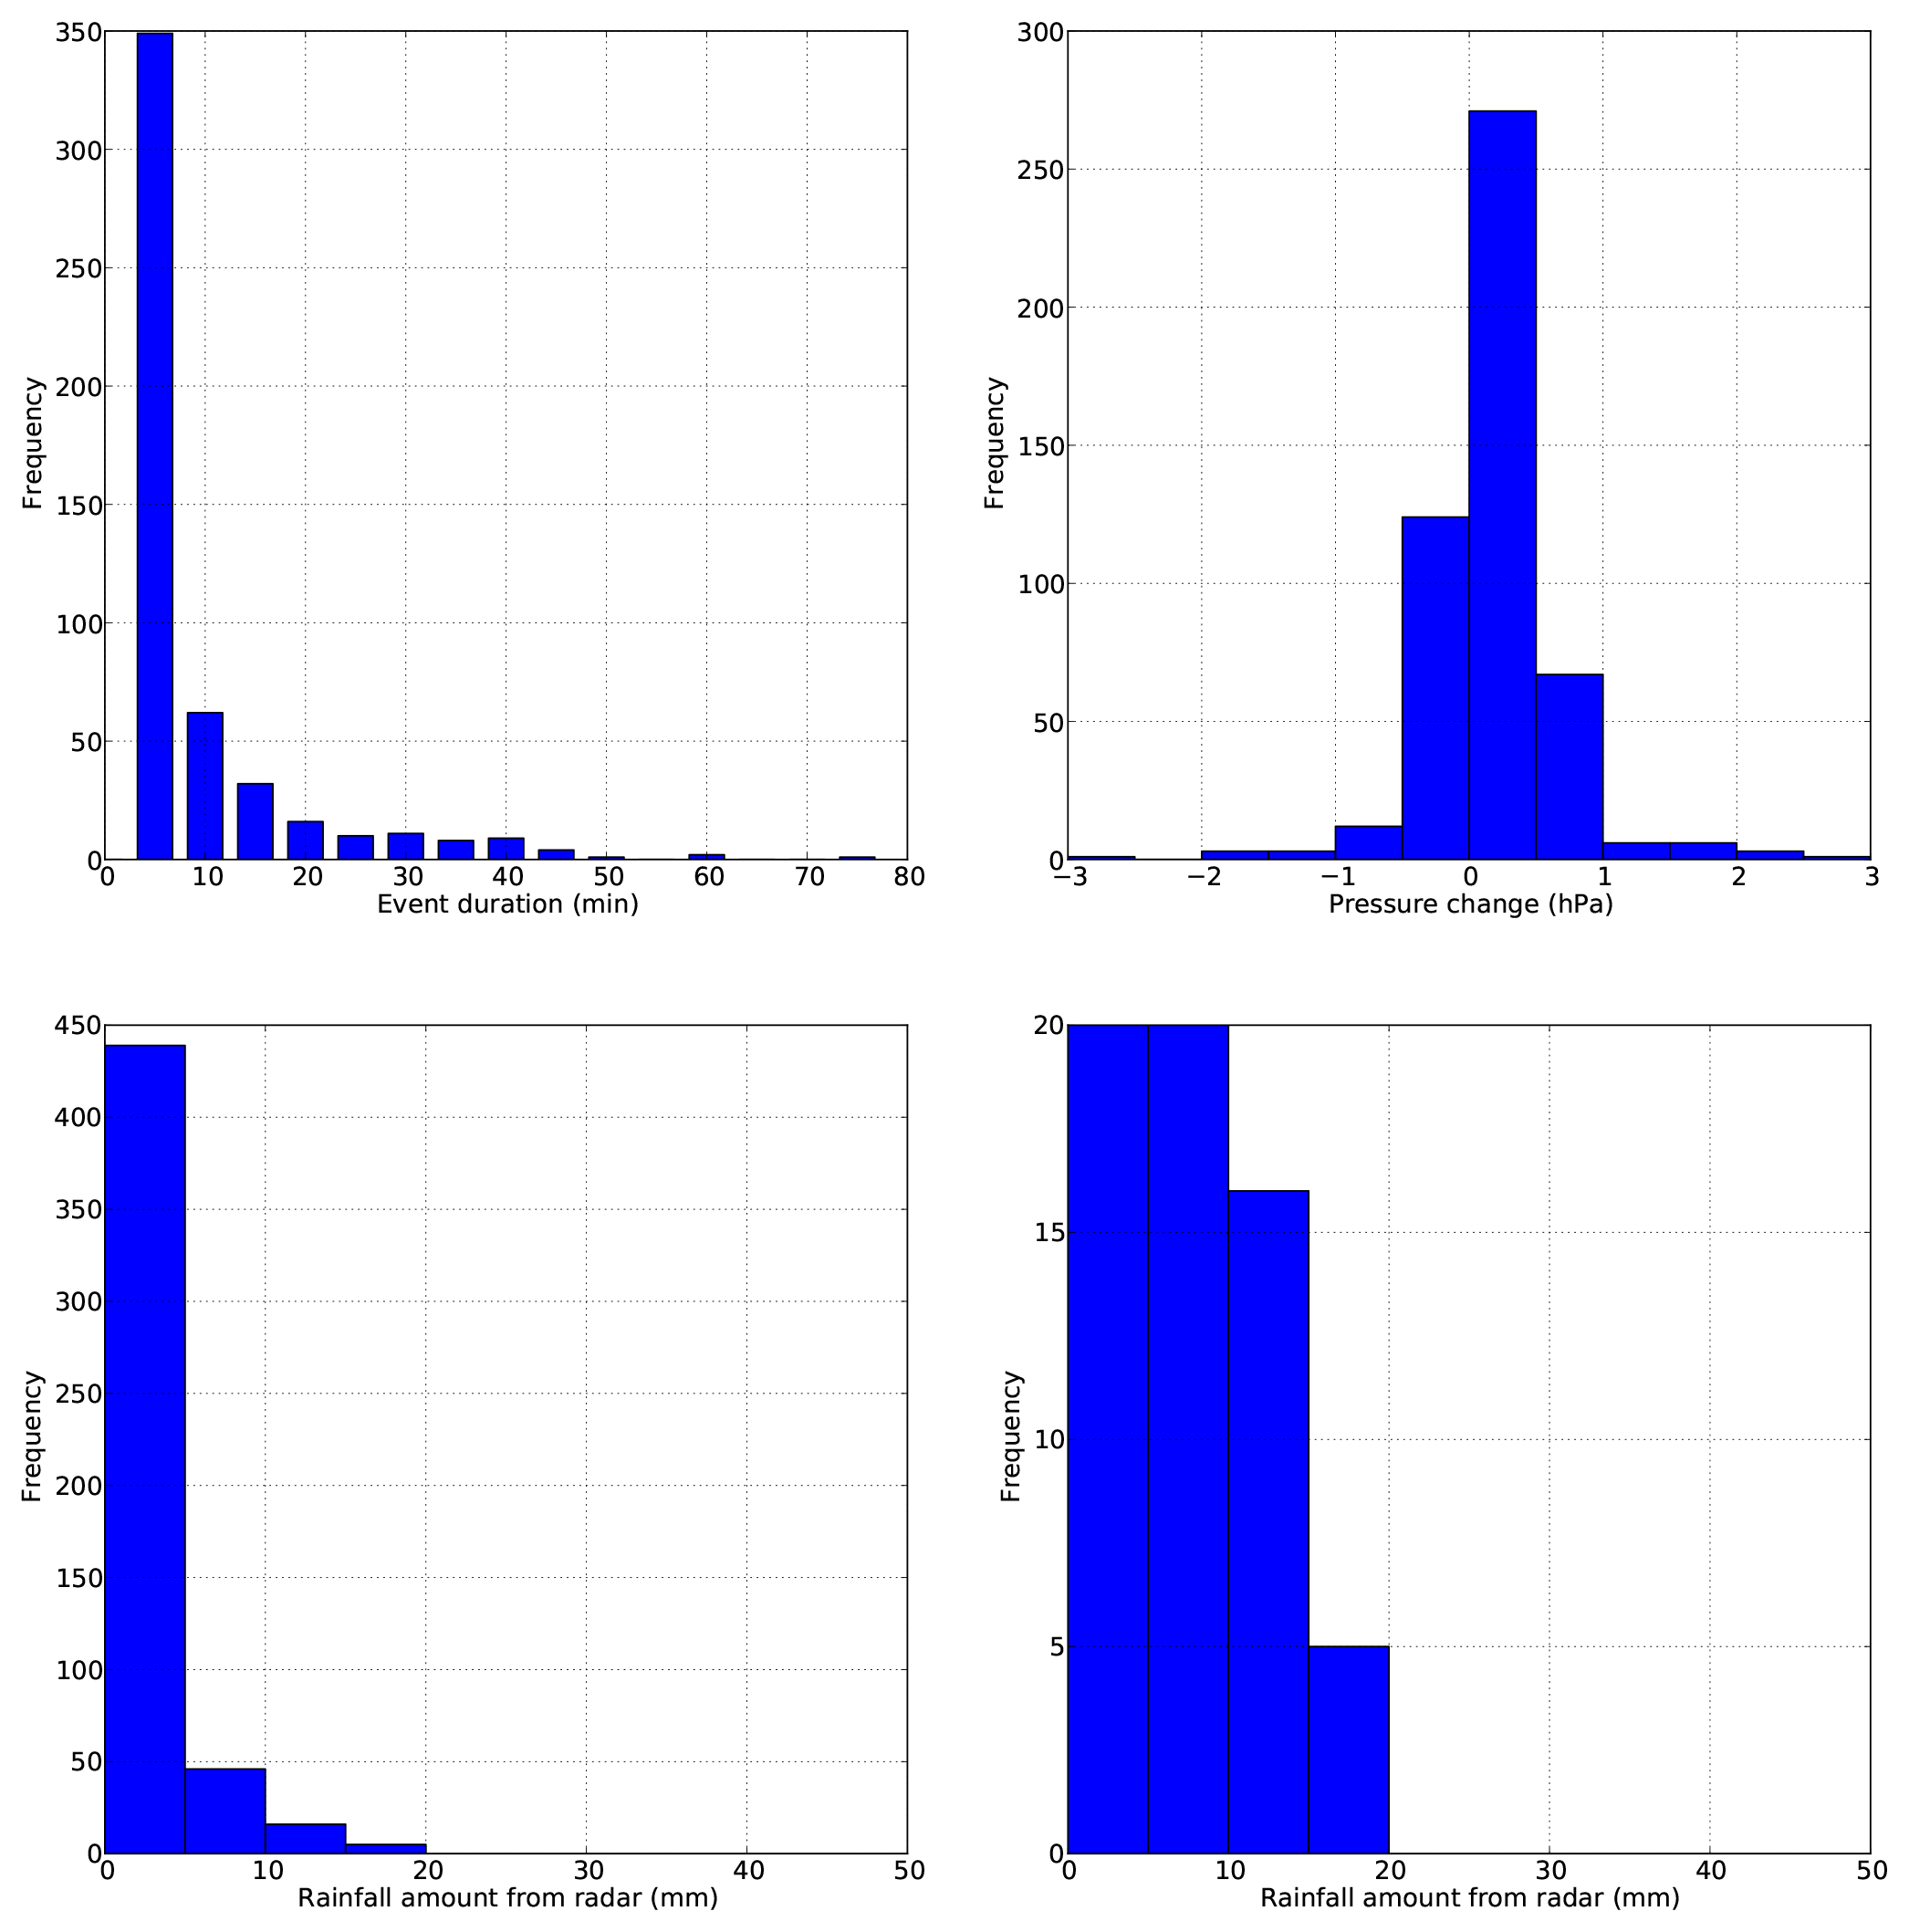
Figure 5Frequency distribution of duration, pressure change and radar rainfall amounts (with two different frequency maximum ranges) based on 506 intense rainfall events.
A scatter plot of the gravity-based versus radar-based rainfall amounts based on the 506 events is shown in Fig. 6. The error on the gravity-based amount is estimated for each event based on the measured pressure change for the whole event combined with the instrumental error. The scatter plot shows a relatively good agreement between rainfall amounts. Table 1 gathers some statistics based on the 145 radar–gravimeter pairs with both values exceeding 2 mm. A Pearson correlation coefficient of 0.58, a mean bias of 0.24 and a mean absolute difference of 3.2 mm are obtained. The mean bias is here defined as the ratio between the sum of the differences between radar and gravimeter amounts and the sum of the gravimeter amounts. For large rainfall amounts the radar tends to overestimate with respect to the gravimeter. Very high reflectivity values are generally observed during these events. These values might be produced by hail, and are known to produce substantially overestimated rainfall amounts when the classical MP Z–R conversion is used. The presence of hail stones in convective cells causes indeed a sharp increase in reflectivity with a relatively slight effect on the rainfall rate (Austin, 1987). In contrast, gravity measurements are not affected by the phase and the size of the hydrometeors. Only accumulated water mass determines the rainfall influence on the gravity.
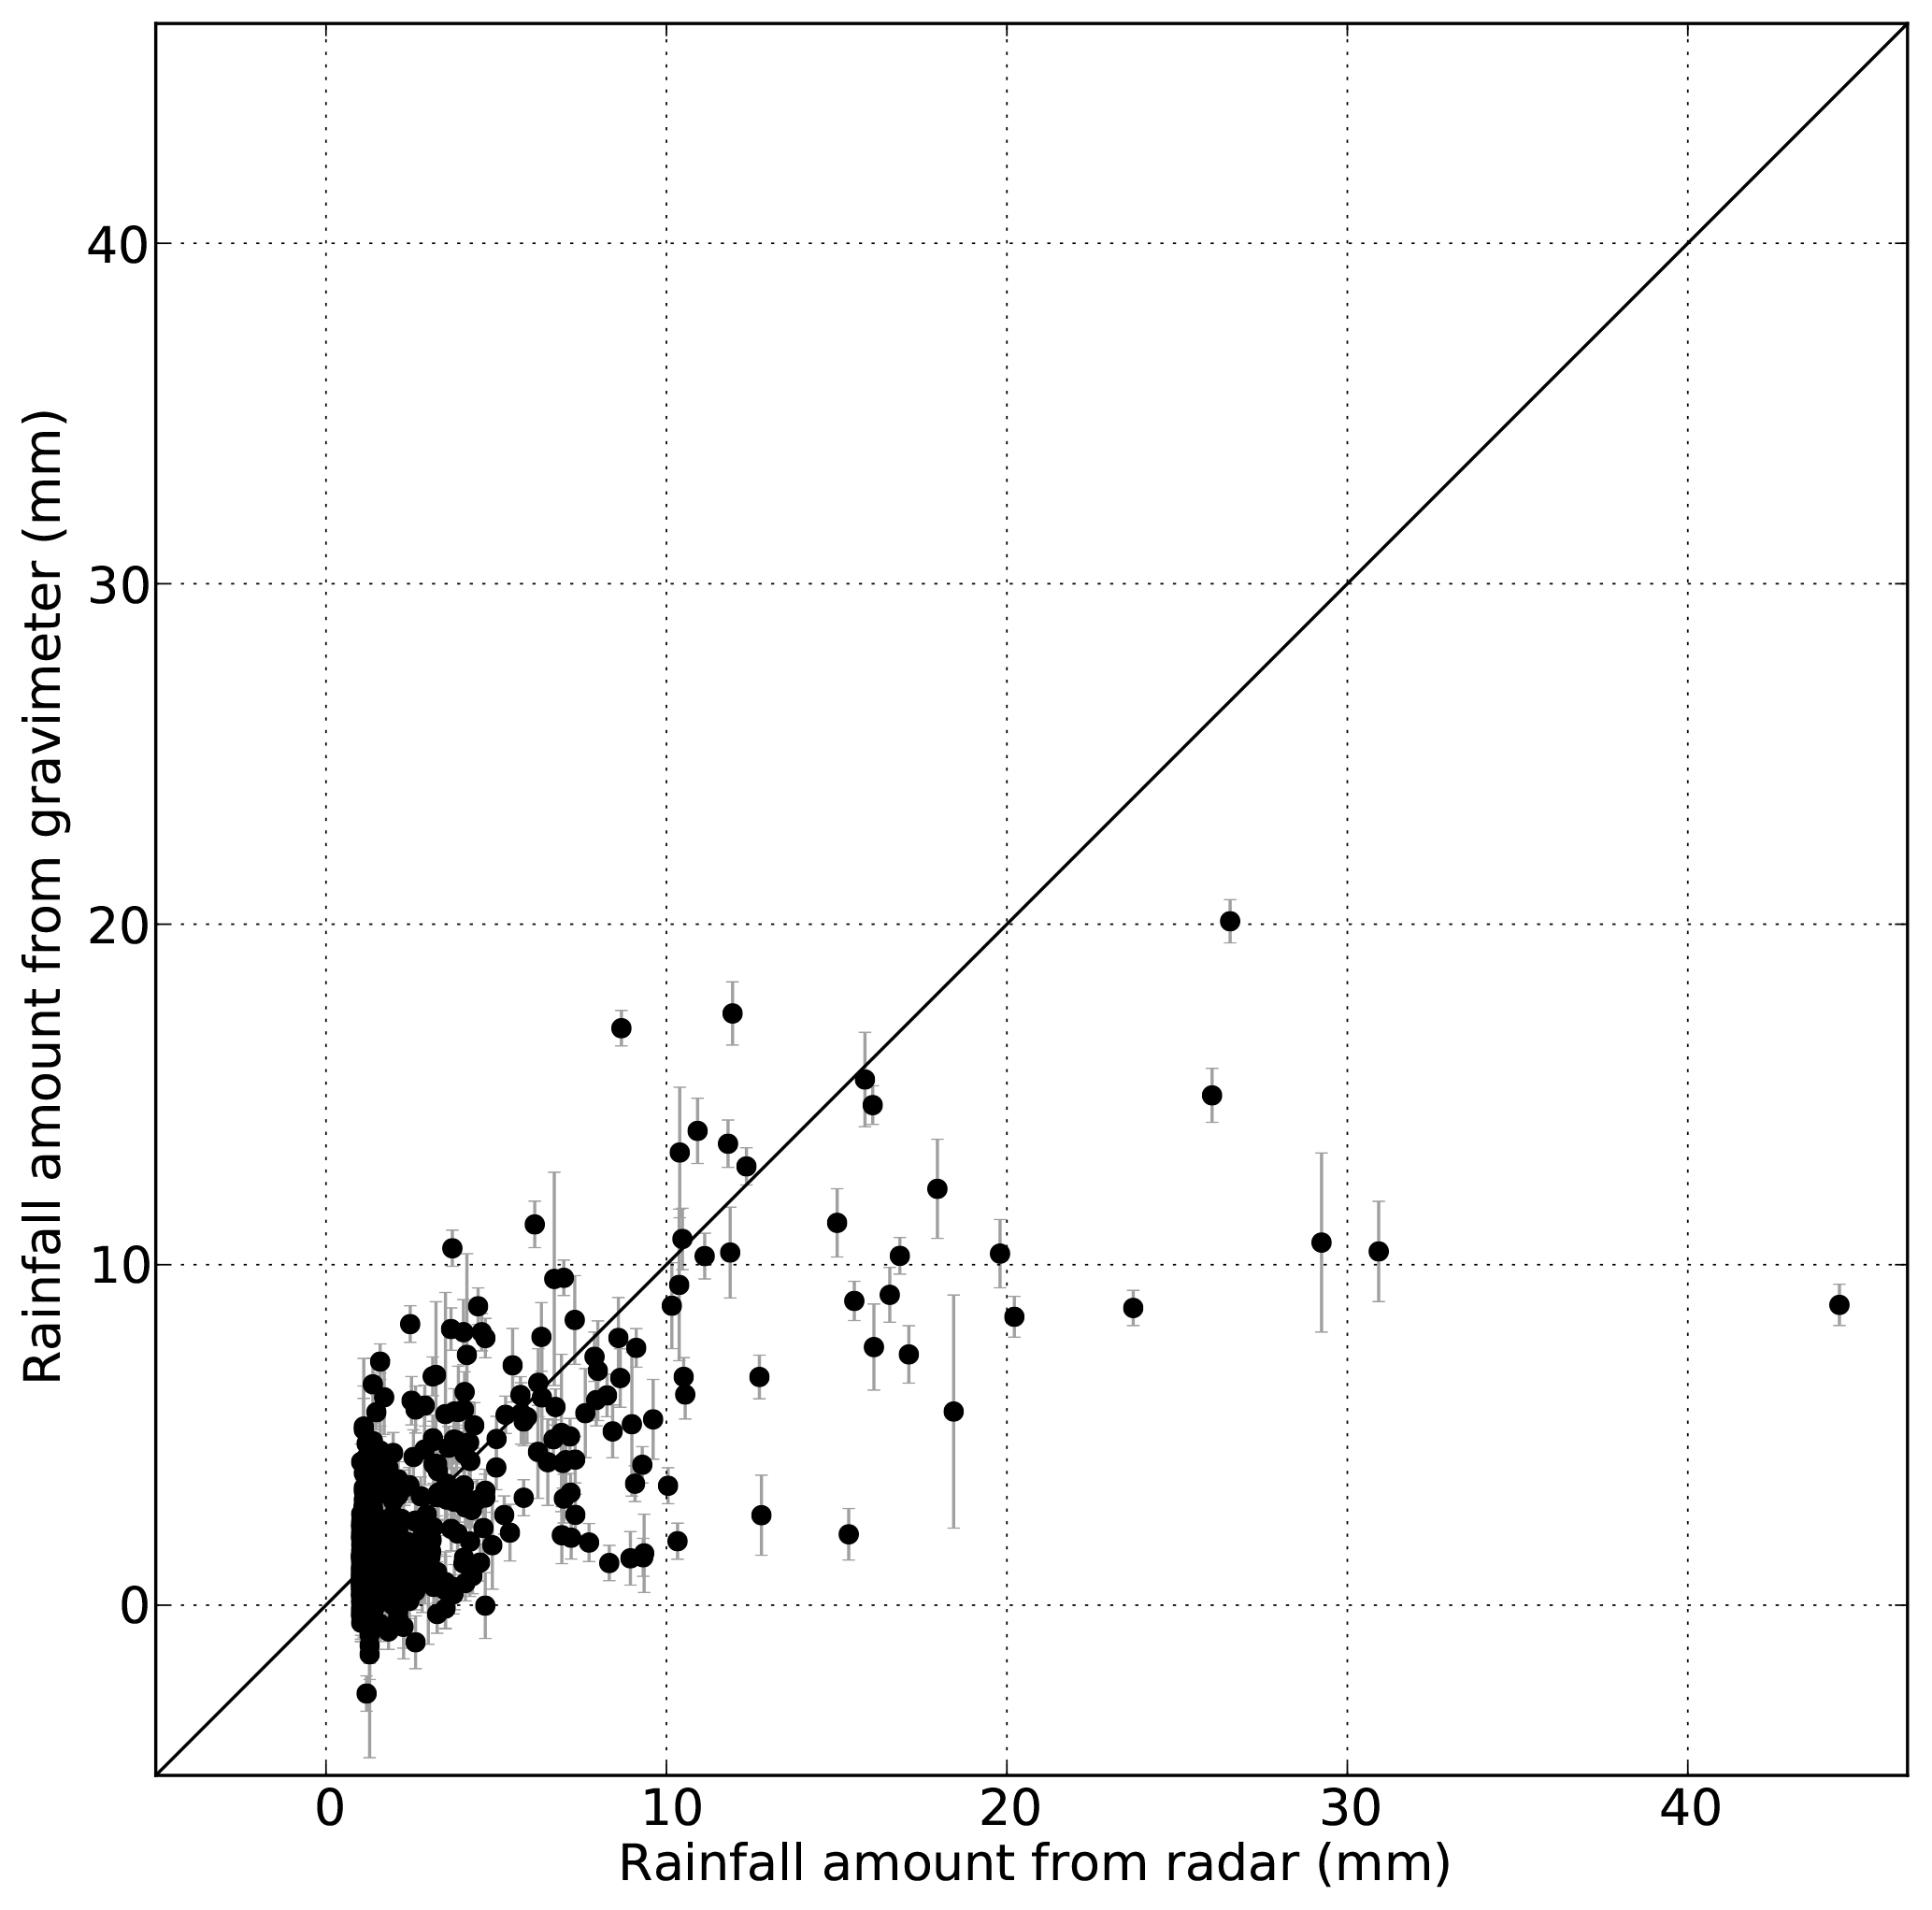
Figure 6Rainfall amounts derived from radar and gravimeter measurements for 506 precipitation events with max reflectivity exceeding 40 dBZ. The error bars show the errors caused by instrumental errors and correction of pressure effects.
Table 1Statistics based on 145 valid pairs with radar and gravimeter rainfall amounts both exceeding 2 mm. Mean bias = sum(Ri − Gi)/sum(Gi), where Ri and Gi are the radar and gravimeter rainfall amounts. MAD is the mean absolute difference and RMSE the root mean square error.
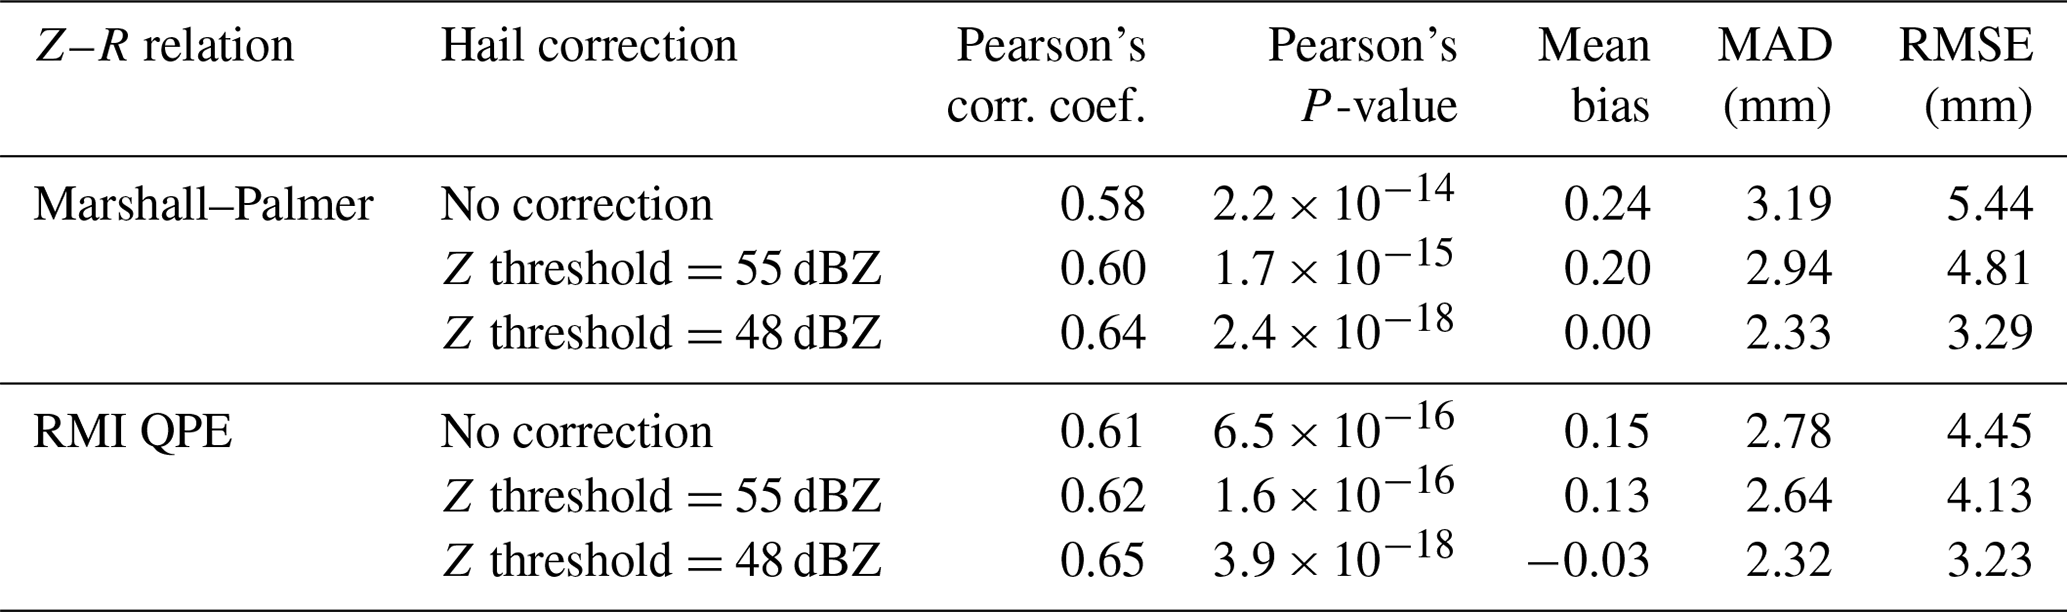
A proper treatment of hail is recommended when producing quantitative precipitation estimates (QPEs) from radar data. Conversion between reflectivity and equivalent rain rate in the case of hail or mixed rain–hail events is not straightforward and a simple correction is generally applied: all reflectivity values exceeding a given threshold are set to that threshold (e.g., Overeem et al., 2009). In the RMI QPE processing chain (Goudenhoofdt and Delobbe, 2016), a reflectivity threshold of 55 dBZ is used and presented as a rather conservative value. The radar rainfall amounts have been recalculated using this truncation and a slightly better agreement between radar and gravimeter rainfall amounts is obtained with correlation coefficient and mean bias values of 0.60 and 0.20, respectively. Various threshold values were tested and it comes out that no bias is found between radar and gravimeter when a threshold of 48 dBZ is selected. The correlation coefficient then reaches 0.64 and the mean absolute difference 2.33 mm. Figure 7 allows visualization of the effect of thresholding the reflectivity larger than 48 dBZ. The black points correspond to events where the maximum reflectivity does not exceed 48 dBZ and which are not affected by the hail correction. The radar–gravimeter pairs for the other events appear as red crosses and green squares, corresponding, respectively, to radar rainfall amounts without and with correction. The largest radar rainfall amount is obtained on 14 June 2006 with 44 mm produced in a 40 min event. The amount obtained from gravity data is 9 mm. The hail detection algorithm gives a probability of hail of 64 %. After correction, the radar amount drops to 22 mm. The temporal evolutions of gravity, reflectivity, rainfall rate and rainfall amount for this event are shown in Fig. 8. The results presented in Fig. 7 and Table 1 are consistent with the generally accepted view that the MP Z–R conversion tends to overestimate rainfall for very high reflectivity values and that some correction is required.
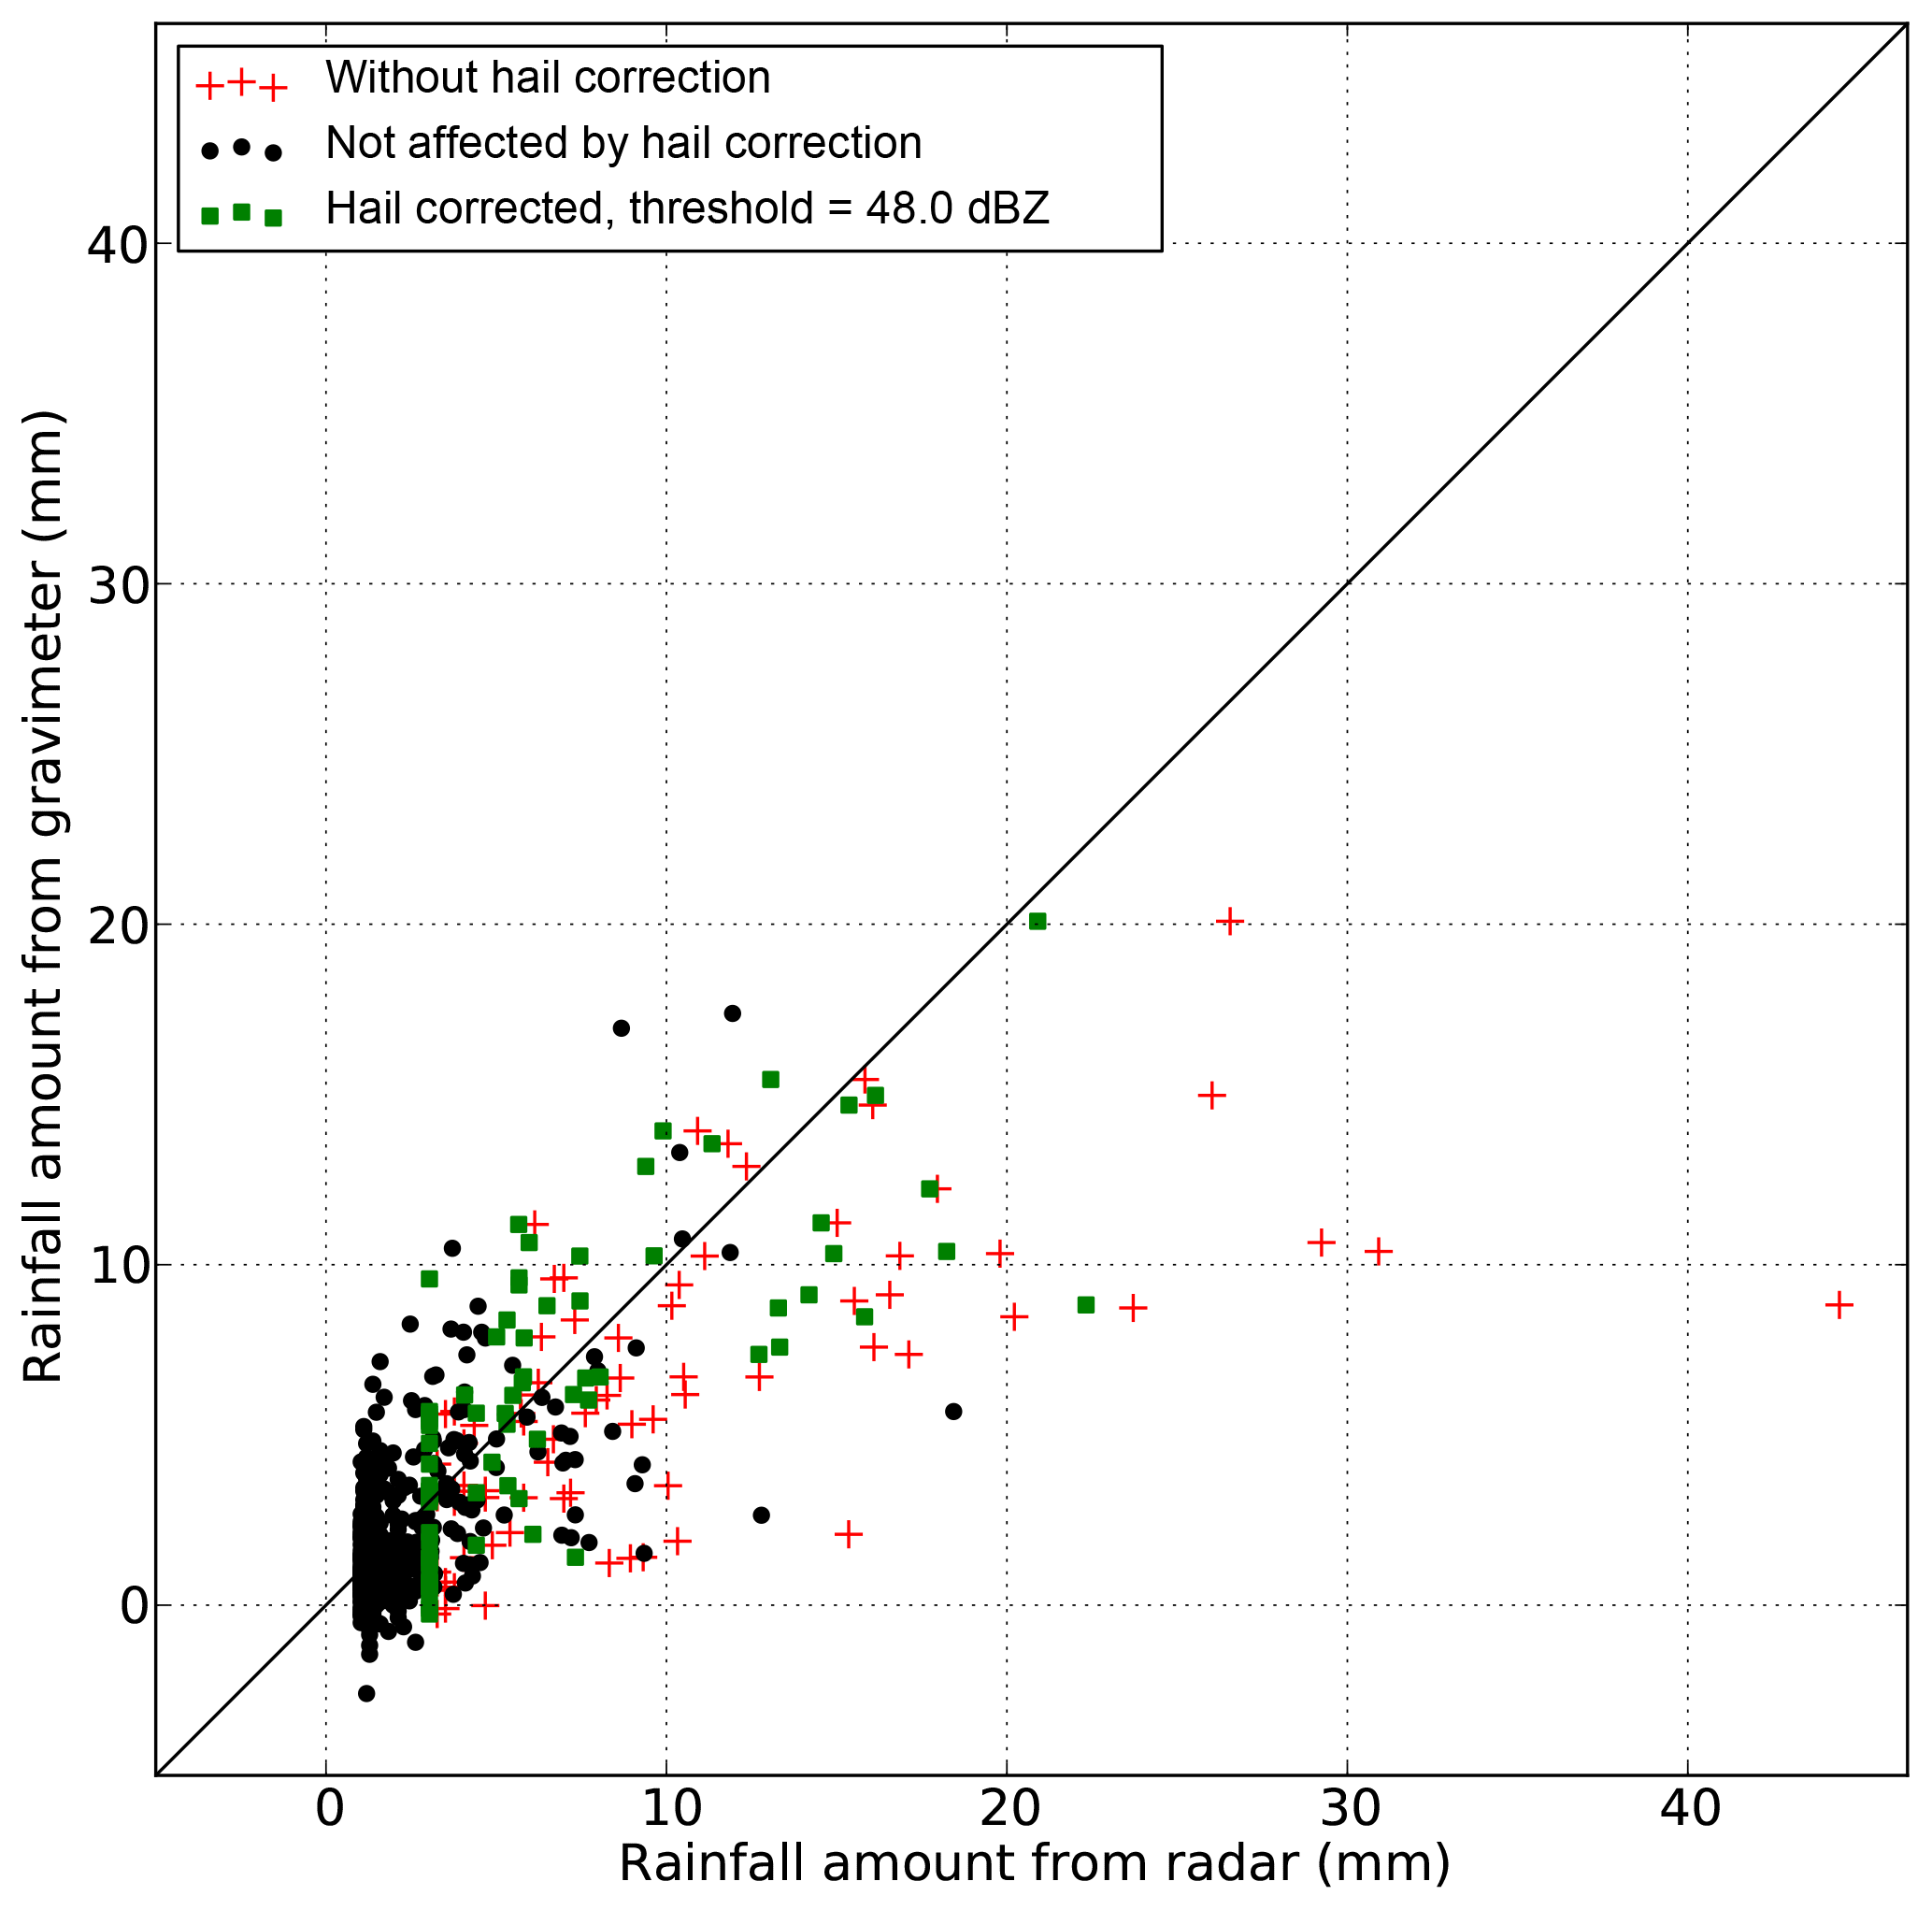
Figure 7Rainfall amounts derived from radar and gravimeter measurements for 506 precipitation events with max reflectivity exceeding 40 dBZ (black points). The MP relation is used and a hail correction using a 48 dBZ threshold is applied. The red crosses and the green squares correspond to radar rainfall amounts without and with hail correction, respectively. Black points correspond to the pairs that are not affected by hail correction.
A large variety of Z–R conversion schemes are proposed in the literature (e.g., Battan, 1973). In the RMI QPE processing scheme, the MP relation is used for reflectivity values below 44 dBZ, while Z=77R1.9 is used for larger reflectivity values following the DWD RADOLAN scheme (Wagner et al., 2012; Goudenhoofdt and Delobbe, 2016). Radar-based rainfall amounts were evaluated using this Z–R conversion and the statistics characterizing the agreement between radar and gravimeter estimates are given in Table 1. The scores indicate that a correction for hail with a threshold close to 48 dBZ allows a better agreement between radar and gravimeter. The corresponding scatter plot can be found in the Supplement. A bias very close to zero is found between radar and gravimeter and, with respect to a pure MP conversion, the ZR conversion used in RMI QPE allows a slight reduction of the MAD and the RMSE.
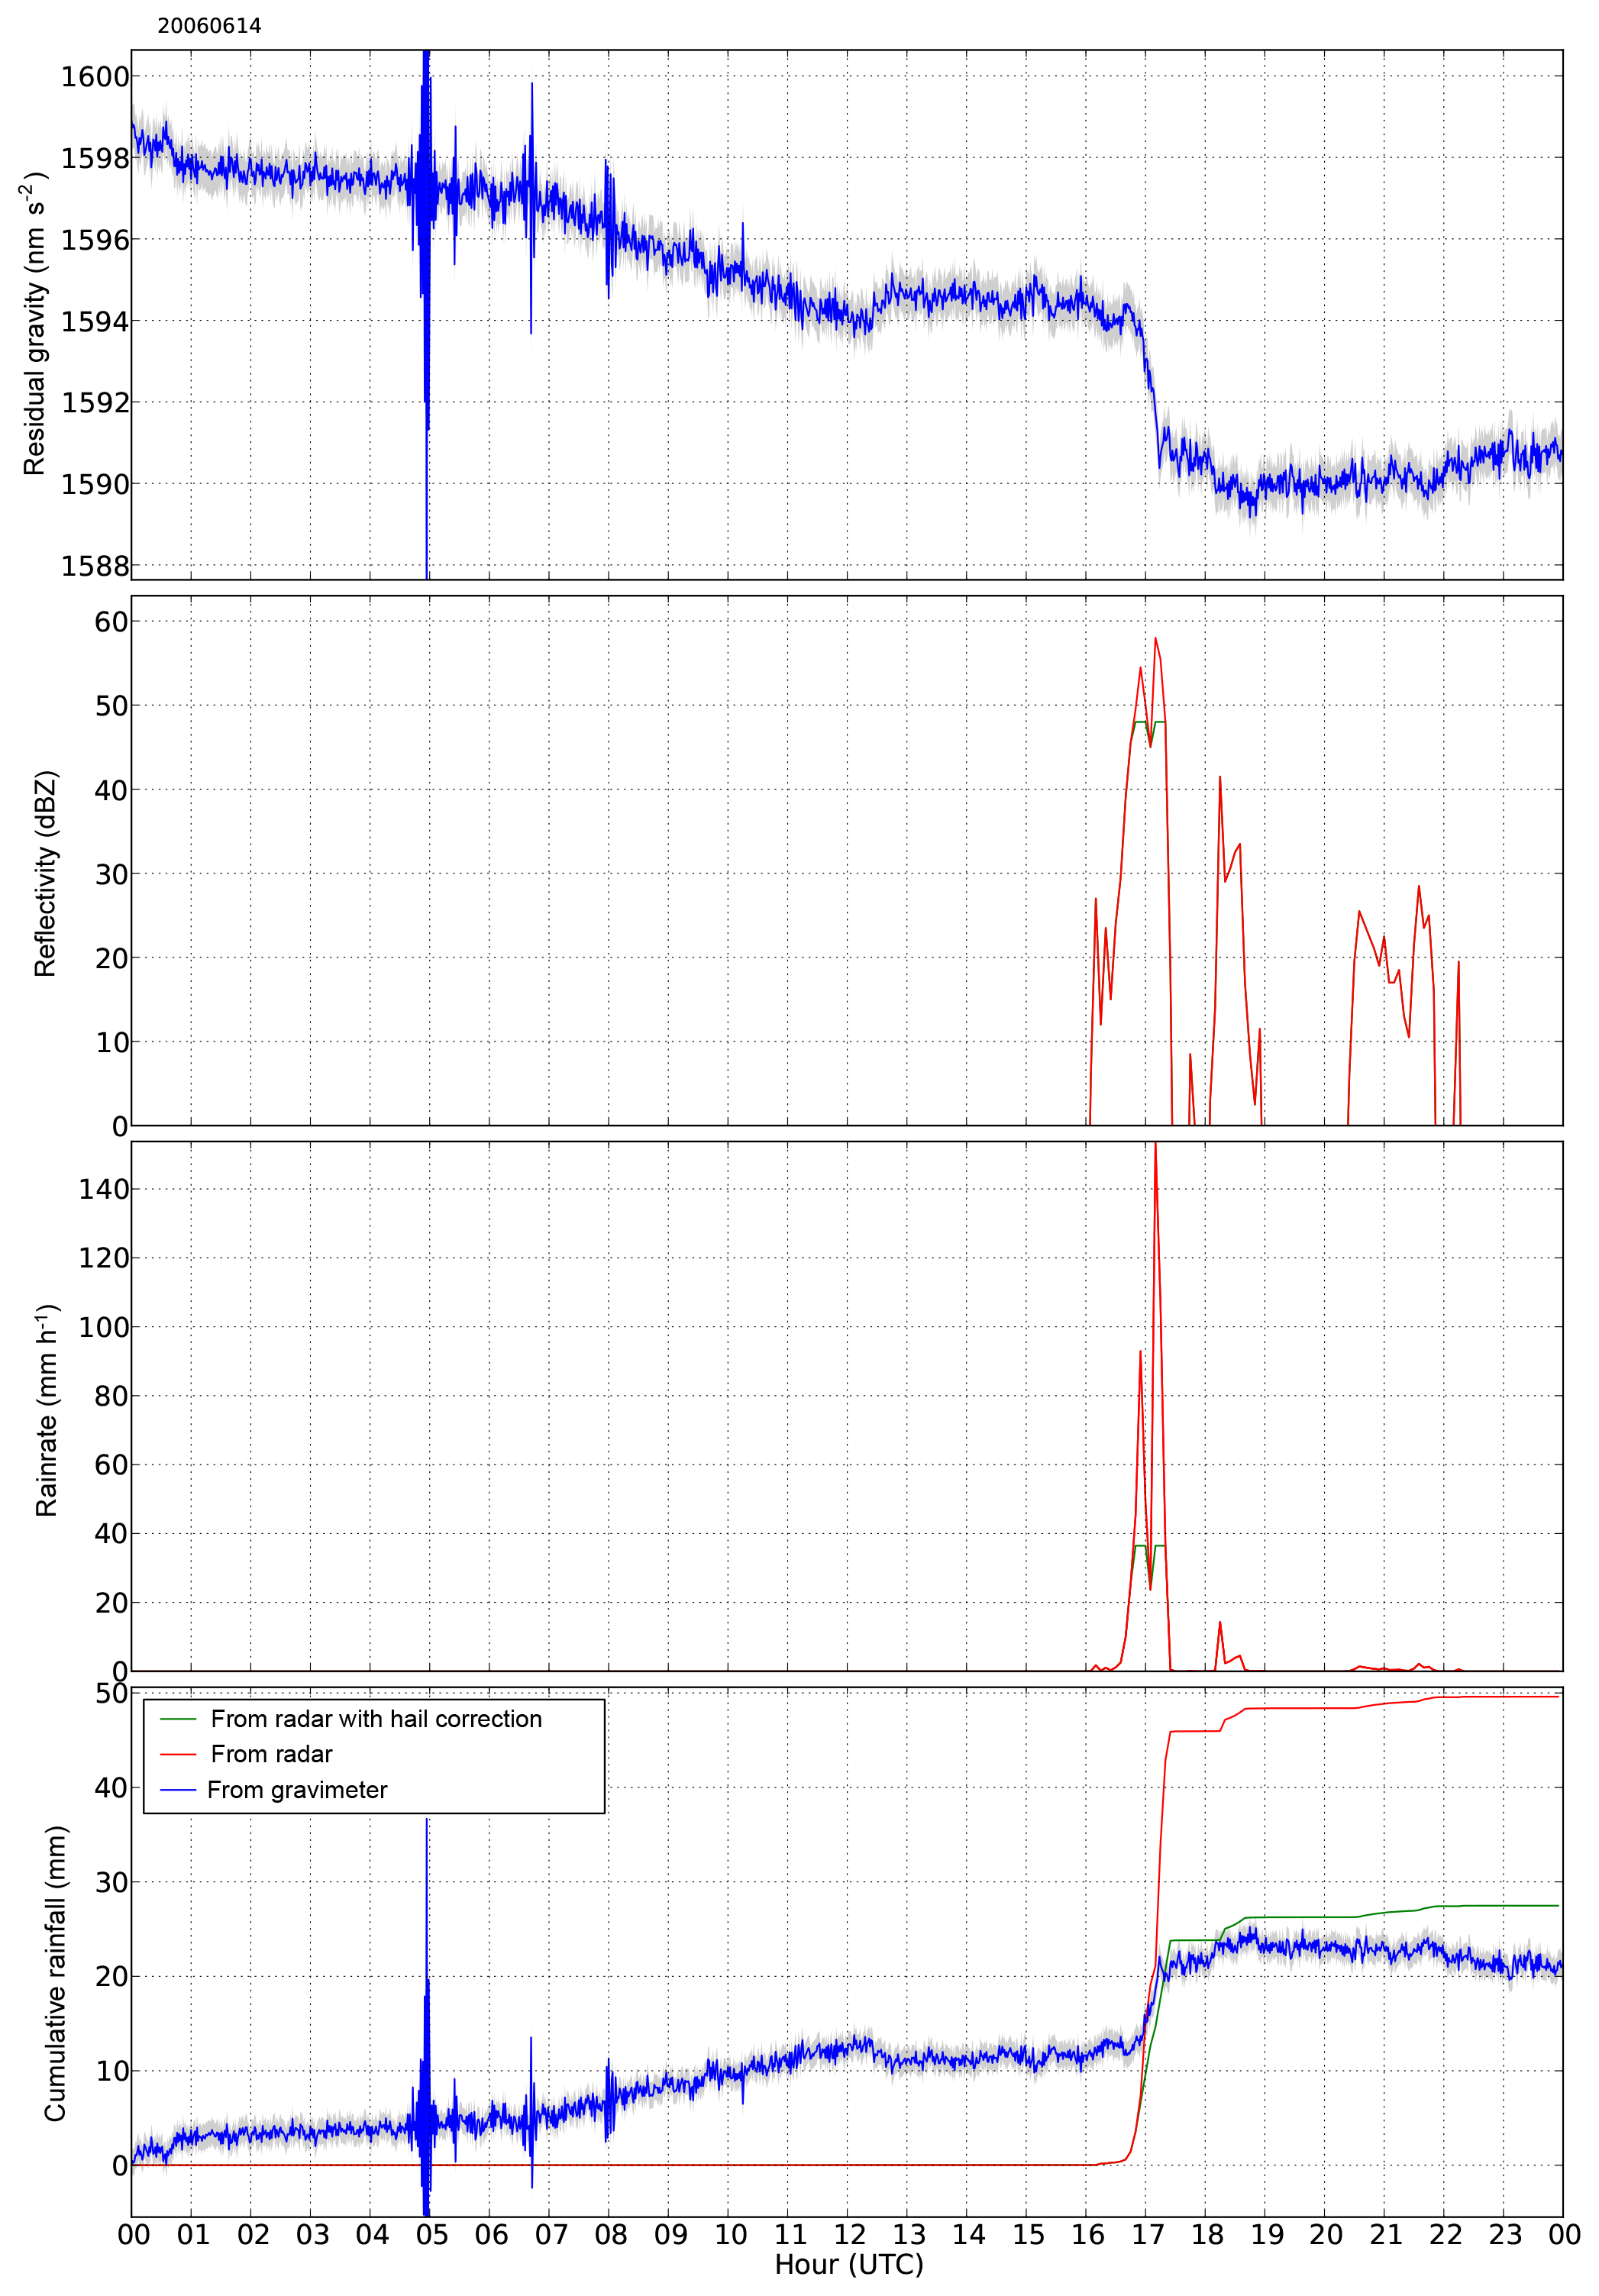
Figure 8Residual gravity, radar reflectivity, radar rainfall rate and cumulative rainfall time series for 14 June 2006, not corrected for hail (red) and corrected with a hail threshold of 48 dBZ (green).
The optimal 48 dBZ threshold found here is very close to the 49 dBZ value used for capping reflectivity in pixels classified as hail in the US National Mosaic and Multi-Sensor QPE system (Zhang et al., 2011). In this QPE system, a larger capping value of 55 dBZ is used in convective rain. A 48 dBZ hail cap corresponds to 36 and 34 mm h−1 with the MP and RADOLAN ZR conversions, respectively. These rain rates are relatively low, which indicates that a 48 dBZ cap might result in a substantial underestimation when rain produces reflectivity larger than 48 dBZ. It appears that a single capping value is not able to properly correct for errors caused by a Z–R relation not adapted to the real hydrometeor (raindrops or hailstones) size distribution. The optimal capping value is also influenced by other sources of uncertainties like radar electronic miscalibration, attenuation or partial evaporation of rainfall below the height of the measurement (VPR effect). The optimal 48 dBZ value is partially the result of error compensations and should not be considered a reference value that should be applied in any QPE processing. However, our results indicate that a 55 dBZ capping applied before a MP Z–R conversion is insufficient to mitigate the radar rainfall overestimation associated with high reflectivity values produced by hail storms.
For the first time, observations from an underground superconductivity gravimeter and a C-band weather radar are compared over 15 years for identifying and characterizing the signature of intense precipitation in gravity time series. Radar reflectivity data are converted into precipitation rates using the Marshall–Palmer relation and gravity data are converted using an admittance factor of 0.39 nm s−2 mm−1. The comparison of reflectivity and gravity time series shows that short-duration intense rainfall events produce a rapid decrease in the underground measured gravity. A good correspondence is found between radar-derived and gravity-derived cumulative precipitation, especially as far as the temporal evolution of precipitation is concerned. Based on radar observations, 506 rainfall events with reflectivity exceeding 40 dBZ were identified, among them 145 pairs where gravity- and radar-derived rainfall exceeds 2 mm. Radar and gravimeter rainfall amounts were compared and some statistics were produced based on these 145 radar–gravimeter pairs. A correlation coefficient of 0.58 and a mean bias of 0.24 are obtained. The precipitation overestimation of the radar with respect to the gravimeter is mainly due to very intense precipitation events characterized by very high radar reflectivity values. Hail is often produced by such storms and our results show that applying a hail correction by truncating reflectivity to a given threshold allows a substantial improvement of the agreement between radar and gravity precipitation amounts. Best results are obtained with a 48 dBZ threshold, which is lower than the commonly used 55 dBZ threshold. The atmospheric pressure near the gravimeter is measured in order to correct for the atmospheric effects on the gravity. It appears that for 95 % of the precipitation events, the pressure difference before and after the event does not exceed 1 hPa. This result is important since it means that errors in gravity-derived rainfall amounts caused by inadequate correction of pressure effects hardly exceed 1 mm.
In the present study, we have shown the benefit of using gravimeter observations for the verification of radar-derived precipitation amounts. The essential benefit of precipitation estimates derived from underground gravimeters with respect to traditional rain gauges is the spatial scale at which precipitation is captured. The gravimeter at Membach is sensitive to precipitation falling within a radius of 400 m around the station. Actually, a single gravimeter captures at least 50 000 times more precipitation than the 400 stations of the rain gauge networks in Belgium. The spatial representativeness is of course very different. The gravimeter can be seen as a spatial integrator of precipitation producing observations at ground, which much better match weather radar observations than rain gauges. The temporal sampling of precipitation by gravimeter, 1 min, is also fully appropriate for hydro-meteorological applications. Another advantage of gravimeter-derived precipitation observations stems from the measurement principle directly based on the mass of precipitation at ground. For a given mass per square meter, liquid water, snow or hail have the same influence on gravity. In contrast, weather radar observations are strongly affected by the microphysical properties of precipitation, in particular the phase and the size distribution of hydrometeors. Rain gauge measurements are also affected by various errors, which depend on the type of precipitation: rain, hail or snow. In case of very short and intense hail we can expect the best correspondence between gravity changes and precipitation amounts. Indeed, runoff and infiltration processes are generally slower, which limits their impact during such events. An accurate evaluation of precipitation amounts in case of extreme precipitation, possibly with hail, is essential since radar observations are increasingly used to derive extreme rainfall statistics. Gravimeter observations allow us to point out and to evaluate the overestimation of rainfall extremes by the radar due to hail. We conclude that gravimeters can help improve rainfall estimates in case of hail and very intense rain. On the other hand, as a complement to rain gauges, radar provides valuable information for routine detection of sudden changes in gravity time series. This is important for the analysis of geodynamical signals such as tides, Earth's free oscillations or slow tectonic deformations.
In the present study, we focused on rain and hail events producing large precipitation amounts over short durations. For longer events with moderate precipitation, evapotranspiration, runoff and infiltration are expected to produce a larger effect on gravity changes. The joint analysis or radar and gravity time series in such rainfall events can also bring valuable information for further studies in hydrology and hydrogeology.
Gravimeter and radar data used in this study are available upon request at ROB and RMIB, respectively.
The supplement related to this article is available online at: https://doi.org/10.5194/hess-23-93-2019-supplement.
The idea of this research came up during a very fruitful discussion between LD and MVC. LD, MVC and AW further designed the study. The gravimeter data were processed by MVC, AW and SW. The radar data were processed and compared with the gravity data by LD. The paper was written by LD with substantial contributions from MVC and AW.
The authors declare that they have no conflict of interest.
The authors would like to thank Hidde Leijnse and an anonymous reviewer for
the very constructive remarks and suggestions. Comments provided by Maarten Reyniers
(RMI) were also greatly appreciated. We are grateful to the
technical teams at ROB and RMIB for the careful maintenance of the Membach
gravimeter station and the Wideumont weather radar.
Edited by: Laurent Pfister
Reviewed by: Hidde Leijnse and one anonymous referee
Austin, P. M.: Relation between Measured Radar Reflectivity and Surface Rainfall, Mon. Weather Rev., 115, 1053–1070, https://doi.org/10.1175/1520-0493(1987)115<1053:RBMRRA>2.0.CO;2, 1987.
Ban, N., Schmidli, J., and Schär, C.: Heavy precipitation in a changing climate: Does short-term summer precipitation increase faster?, Geophys. Res. Lett., 42, 1165–1172, https://doi.org/10.1002/2014GL062588, 2015.
Battan, L. J.: Radar observation of the atmosphere, Rev. ed., University of Chicago Press, Chicago, 1973.
Berne, A. and Krajewski, W. F.: Radar for hydrology: Unfulfilled promise or unrecognized potential?, Adv. Water Resour., 51, 357–366, https://doi.org/10.1016/j.advwatres.2012.05.005, 2013.
Boy, J.-P., Gegout, P., and Hinderer, J.: Reduction of surface gravity data from global atmospheric pressure loading, Geophys. J. Int., 149, 534–545, https://doi.org/10.1046/j.1365-246X.2002.01667.x, 2002.
Boy, J.-P.: Precise evaluation of atmospheric loading effects on Earth's time-variable gravity field, J. Geophys. Res., 110, B08412, https://doi.org/10.1029/2002JB002333, 2005.
Boy, J.-P., Longuevergne, L., Boudin, F., Jacob, T., Lyard, F., Llubes, M., Florsch, N., and Esnoult, M.-F.: Modelling atmospheric and induced non-tidal oceanic loading contributions to surface gravity and tilt measurements, J. Geodyn., 48, 182–188, https://doi.org/10.1016/j.jog.2009.09.022, 2009.
Creutzfeldt, B., Güntner, A., Thoss, H., Merz, B., and Wziontek, H.: Measuring the effect of local water storage changes on in situ gravity observations: Case study of the Geodetic Observatory Wettzell, Germany, Water Resour. Res., 46, W08531, https://doi.org/10.1029/2009WR008359, 2010a.
Creutzfeldt, B., Güntner, A., Thoss, H., Merz, B., and Wziontek, H.: Measuring the effect of local water storage changes on in situ gravity observations: Case study of the Geodetic Observatory Wettzell, Germany, Water Resour. Res., 46, W08531, https://doi.org/10.1029/2009WR008359, 2010b.
Creutzfeldt, B., Troch, P. A., Güntner, A., Ferré, T. P. A., Graeff, T., and Merz, B.: Storage-discharge relationships at different catchment scales based on local high-precision gravimetry, Hydrol. Process., 28, 1465–1475, https://doi.org/10.1002/hyp.9689, 2014.
Crossley, D., Hinderer, J., and Boy, J.-P.: Time variation of the European gravity field from superconducting gravimeters, Geophys. J. Int., 161, 257–264, https://doi.org/10.1111/j.1365-246X.2005.02586.x, 2005.
Delobbe, L. and Holleman, I.: Uncertainties in radar echo top heights used for hail detection, Meteorol. Appl., 13, 361–374, https://doi.org/10.1017/S1350482706002374, 2006.
Delrieu, G., Andrieu, H., and Creutin, J. D.: Quantification of Path-Integrated Attenuation for X- and C-Band Weather Radar Systems Operating in Mediterranean Heavy Razinfall, J. Appl. Meteorol., 39, 840–850, https://doi.org/10.1175/1520-0450(2000)039<0840:QOPIAF>2.0.CO;2, 2000.
De Troch, R., Hamdi, R., Van de Vyver, H., Geleyn, J.-F., and Termonia, P.: Multiscale Performance of the ALARO-0 Model for Simulating Extreme Summer Precipitation Climatology in Belgium, J. Climate, 26, 8895–8915, https://doi.org/10.1175/JCLI-D-12-00844.1, 2013.
Deville, S., Jacob, T., Chery, J., and Champollion, C.: On the impact of topography and building mask on time varying gravity due to local hydrology, Geophys. J. Int., 192, 82–93, https://doi.org/10.1093/gji/ggs007, 2013.
Dokter, A. M., Liechti, F., Stark, H., Delobbe, L., Tabary, P., and Holleman, I.: Bird migration flight altitudes studied by a network of operational weather radars, J. R. Soc. Interface, 8, 30–43, https://doi.org/10.1098/rsif.2010.0116, 2011.
Fabry, F., Bellon, A., Duncan, M. R., and Austin, G. L.: High resolution rainfall measurements by radar for very small basins: the sampling problem reexamined, J. Hydrol. 161, 415–428, https://doi.org/10.1016/0022-1694(94)90138-4, 1994.
Fores, B., Champollion, C., Le Moigne, N., Bayer, R., and Chéry, J.: Assessing the precision of the iGrav superconducting gravimeter for hydrological models and karstic hydrological process identification, Geophys. J. Int., 208, 269–280, https://doi.org/10.1093/gji/ggw396, 2017.
Foresti, L., Reyniers, M., Seed, A., and Delobbe, L.: Development and verification of a real-time stochastic precipitation nowcasting system for urban hydrology in Belgium, Hydrol. Earth Syst. Sci., 20, 505–527, https://doi.org/10.5194/hess-20-505-2016, 2016.
Goodkind, J. M.: The superconducting gravimeter, Rev. Sci. Instrum., 70, 4131–4152, 1999.
Goudenhoofdt, E. and Delobbe, L.: Generation and Verification of Rainfall Estimates from 10-Yr Volumetric Weather Radar Measurements, J. Hydrometeorol., 17, 1223–1242, https://doi.org/10.1175/JHM-D-15-0166.1, 2016.
Goudenhoofdt, E., Delobbe, L., and Willems, P.: Regional frequency analysis of extreme rainfall in Belgium based on radar estimates, Hydrol. Earth Syst. Sci., 21, 5385–5399, https://doi.org/10.5194/hess-21-5385-2017, 2017.
Hartmann, T. and Wenzel, H.-G.: The HW95 tidal potential catalogue, Geophys. Res. Lett., 22, 3553–3556, https://doi.org/10.1029/95GL03324, 1995.
Hector, B., Séguis, L., Hinderer, J., Cohard, J.-M., Wubda, M., Descloitres, M., Benarrosh, N., and Boy, J.-P.: Water storage changes as a marker for base flow generation processes in a tropical humid basement catchment (Benin): Insights from hybrid gravimetry, Water Resour. Res., 51, 8331–8361, https://doi.org/10.1002/2014WR015773, 2015.
Hemmings, B., Gottsmann, J., Whitaker, F., and Coco, A.: Investigating hydrological contributions to volcano monitoring signals: a time-lapse gravity example, Geophys. J. Int., 207, 259–273, 2016.
Hinderer, J., Hector, B., Boy, J.-P., Riccardi, U., Rosat, S., Calvo, M., and Littel, F.: A search for atmospheric effects on gravity at different time and space scales, J. Geodyn., 80, 50–57, https://doi.org/10.1016/j.jog.2014.02.001, 2014.
Hinderer, J., Crossley, D., and Warburton, R. J.: Superconducting Gravimetry, in: Treatise on Geophysics, Elsevier, 59–115, 2015.
Imanishi, Y., Kokubo, K., and Tatehata, H.: Effect of underground water on gravity observation at Matsushiro, Japan, J. Geodyn., 41, 221–226, https://doi.org/10.1016/j.jog.2005.08.031, 2006.
Jacob, T., Bayer, R., Chery, J., Jourde, H., Moigne, N. L., Boy, J.-P., Hinderer, J., Luck, B., and Brunet, P.: Absolute gravity monitoring of water storage variation in a karst aquifer on the larzac plateau (Southern France), J. Hydrol., 359, 105–117, https://doi.org/10.1016/j.jhydrol.2008.06.020, 2008.
Kidd, C., Becker, A., Huffman, G. J., Muller, C. L., Joe, P., Skofronick-Jackson, G., and Kirschbaum, D. B.: So, How Much of the Earth's Surface Is Covered by Rain Gauges?, B. Am. Meteorol. Soc., 98, 69–78, https://doi.org/10.1175/BAMS-D-14-00283.1, 2017.
Klügel, T. and Wziontek, H.: Correcting gravimeters and tiltmeters for atmospheric mass attraction using operational weather models, J. Geodyn., 48, 204–210, 2009.
Lee, G. W. and Zawadzki, I.: Variability of Drop Size Distributions: Noise and Noise Filtering in Disdrometric Data, J. Appl. Meteorol., 44, 634–652, https://doi.org/10.1175/JAM2222.1, 2005.
Leijnse, H., Uijlenhoet, R., and Stricker, J. N. M.: Rainfall measurement using radio links from cellular communication networks: RAPID COMMUNICATION, Water Resour. Res., 43, W03201, https://doi.org/10.1029/2006WR005631, 2007.
Lukach, M., Foresti, L., Giot, O., and Delobbe, L.: Estimating the occurrence and severity of hail based on 10 years of observations from weather radar in Belgium: Estimating radar-based occurrence and severity of hail in Belgium, Meteorol. Appl., 24, 250–259, https://doi.org/10.1002/met.1623, 2017.
Marshall, J. S., Hitschfeld, W., and Gunn, K. L. S.: Advances in Radar Weather, in: Advances in Geophysics, 2, Elsevier, 1–56, 1955.
McCabe, M. F., Rodell, M., Alsdorf, D. E., Miralles, D. G., Uijlenhoet, R., Wagner, W., Lucieer, A., Houborg, R., Verhoest, N. E. C., Franz, T. E., Shi, J., Gao, H., and Wood, E. F.: The future of Earth observation in hydrology, Hydrol. Earth Syst. Sci., 21, 3879–3914, https://doi.org/10.5194/hess-21-3879-2017, 2017.
Merriam, J. B.: Atmospheric pressure and gravity, Geophys. J. Int., 109, 488–500, https://doi.org/10.1111/j.1365-246X.1992.tb00112.x, 1992.
Messer, H., Zinevich, A., and Alpert, P.: Environmental Monitoring by Wireless Communication Networks, Science, 312, 713–713, https://doi.org/10.1126/science.1120034, 2006.
Meurers, B., Van Camp, M., and Petermans, T.: Correcting superconducting gravity time-series using rainfall modelling at the Vienna and Membach stations and application to Earth tide analysis, J. Geodesy, 81, 703–712, https://doi.org/10.1007/s00190-007-0137-1, 2007.
Mikolaj, M., Meurers, B., and Mojzeš, M.: The reduction of hydrology-induced gravity variations at sites with insufficient hydrological instrumentation, Stud. Geophys. Geod., 59, 424–437, https://doi.org/10.1007/s11200-014-0232-8, 2015.
Naujoks, M., Kroner, C., Weise, A., Jahr, T., Krause, P., and Eisner, S.: Evaluating local hydrological modelling by temporal gravity observations and a gravimetric three-dimensional model: Gravity and hydrology: local 3-D modelling, Geophys. J. Int., 182, 233–249, https://doi.org/10.1111/j.1365-246X.2010.04615.x, 2010.
Nawa, K., Suda, N., Fukao, Y., Sato, T., Aoyama, Y., and Shibuya, K.: Incessant excitation of the Earth's free oscillations, Earth Planets Space, 50, 3–8, https://doi.org/10.1186/BF03352080, 1998.
Overeem, A., Buishand, T. A., and Holleman, I.: Extreme rainfall analysis and estimation of depth-duration-frequency curves using weather radar, Water Resour. Res., 45, W10424, https://doi.org/10.1029/2009WR007869, 2009.
Pool, D. R. and Eychaner, J. H.: Measurements of Aquifer-Storage Change and Specific Yield Using Gravity Surveys, Ground Water, 33, 425–432, https://doi.org/10.1111/j.1745-6584.1995.tb00299.x, 1995.
Prein, A. F., Gobiet, A., Truhetz, H., Keuler, K., Goergen, K., Teichmann, C., Fox Maule, C., van Meijgaard, E., Déqué, M., Nikulin, G., Vautard, R., Colette, A., Kjellström, E., and Jacob, D.: Precipitation in the EURO-CORDEX 0 . 11 and 0 . 44 simulations: high resolution, high benefits?, Climate Dynam., 46, 383–412, https://doi.org/10.1007/s00382-015-2589-y, 2016.
Puca, S., Porcu, F., Rinollo, A., Vulpiani, G., Baguis, P., Balabanova, S., Campione, E., Ertürk, A., Gabellani, S., Iwanski, R., Jurašek, M., Kanák, J., Kerényi, J., Koshinchanov, G., Kozinarova, G., Krahe, P., Lapeta, B., Lábó, E., Milani, L., Okon, L'., Öztopal, A., Pagliara, P., Pignone, F., Rachimow, C., Rebora, N., Roulin, E., Sönmez, I., Toniazzo, A., Biron, D., Casella, D., Cattani, E., Dietrich, S., Di Paola, F., Laviola, S., Levizzani, V., Melfi, D., Mugnai, A., Panegrossi, G., Petracca, M., Sanò, P., Zauli, F., Rosci, P., De Leonibus, L., Agosta, E., and Gattari, F.: The validation service of the hydrological SAF geostationary and polar satellite precipitation products, Nat. Hazards Earth Syst. Sci., 14, 871–889, https://doi.org/10.5194/nhess-14-871-2014, 2014.
Rosat, S. and Hinderer, J.: Noise Levels of Superconducting Gravimeters: Updated Comparison and Time Stability, B. Seismol. Soc. Am., 101, 1233–1241, https://doi.org/10.1785/0120100217, 2011.
Schroeer, K., Kirchengast, G., and O, S.: Strong Dependence of Extreme Convective Precipitation Intensities on Gauge Network Density, Geophys. Res. Lett., 45, 8253–8263, https://doi.org/10.1029/2018GL077994, 2018.
Singh, S. K.: Gravitational attraction of a circular disc, Geophysics, 42, 111–113, https://doi.org/10.1190/1.1440704, 1977.
Sun, Q., Miao, C., Duan, Q., Ashouri, H., Sorooshian, S., and Hsu, K.-L.: A Review of Global Precipitation Data Sets: Data Sources, Estimation, and Intercomparisons, Rev. Geophys., 56, 79–107, https://doi.org/10.1002/2017RG000574, 2018.
Van Camp, M., Williams, S. D. P., and Francis, O.: Uncertainty of absolute gravity measurements, J. Geophys. Res., 110, B05406, https://doi.org/10.1029/2004JB003497, 2005.
Van Camp, M., Vanclooster, M., Crommen, O., Petermans, T., Verbeeck, K., Meurers, B., van Dam, T., and Dassargues, A.: Hydrogeological investigations at the Membach station, Belgium, and application to correct long periodic gravity variations, J. Geophys. Res., 111, B10403, https://doi.org/10.1029/2006JB004405, 2006a.
Van Camp, M., Meus, P., Quinif, Y., Kaufmann, O., van Ruymbeke, M., Vandiepenbeck, M., and Camelbeeck, T.: Karst aquifer investigation using absolute gravity, EOS T. Am. Geophys. Un., 87, 298–298, 2006b.
Van Camp, M., de Viron, O., Pajot-Métivier, G., Casenave, F., Watlet, A., Dassargues, A., and Vanclooster, M.: Direct measurement of evapotranspiration from a forest using a superconducting gravimeter, Geophys. Res. Lett., 43, 10225–10231, https://doi.org/10.1002/2016GL070534, 2016.
Van Camp, M., de Viron, O., Watlet, A., Meurers, B., Francis, O., and Caudron, C.: Geophysics from terrestrial time-variable gravity measurements, Rev. Geophys., 55, 938–992, https://doi.org/10.1002/2017RG000566, 2017a.
Van Camp, M., Francis, O., and Lecocq, T.: Recording Belgium's Gravitational History, EOS, 98, https://doi.org/10.1029/2017EO089743, 2017b.
Villarini, G. and Krajewski, W. F.: Review of the Different Sources of Uncertainty in Single Polarization Radar-Based Estimates of Rainfall, Surv. Geophys., 31, 107–129, https://doi.org/10.1007/s10712-009-9079-x, 2010.
Wagner, A., Seltmann, J., and Kunstmann, H.: Joint statistical correction of clutters, spokes and beam height for a radar derived precipitation climatology in southern Germany, Hydrol. Earth Syst. Sci., 16, 4101–4117, https://doi.org/10.5194/hess-16-4101-2012, 2012.
Wahr, J.: Deformation induced by polar motion, J. Geophys. Res., 90, 9363, https://doi.org/10.1029/JB090iB11p09363, 1985.
Waldvogel, A., Federer, B., and Grimm, P.: Criteria for the Detection of Hail Cells, J. Appl. Meteorol., 18, 1521–1525, 1979.
Wenzel, H.-G.: The nanogal software: Earth tide data processing package ETERNA, Bull. Inf. Marées Terrestres, 124, 9425–9439, 1996.
Wilson, C. R., Scanlon, B., Sharp, J., Longuevergne, L., and Wu, H.: Field Test of the Superconducting Gravimeter as a Hydrologic Sensor, Ground Water, 50, 442–449, https://doi.org/10.1111/j.1745-6584.2011.00864.x, 2012.
Zhang, J., Howard, K., Langston, C., Vasiloff, S., Kaney, B., Arthur, A., Van Cooten, S., Kelleher, K., Kitzmiller, D., Ding, F., Seo, D.-J., Wells, E., and Dempsey, C.: National Mosaic and Multi-Sensor QPE (NMQ) System: Description, Results, and Future Plans, B. Am. Meteorol. Soc., 92, 1321–1338, https://doi.org/10.1175/2011BAMS-D-11-00047.1, 2011.